Embed Size (px)
Citation preview
Transas MIP Ltd. October 2014
FleetViewOnlineUser ManualVersion 4.2

Copyright: © Transas MIP Ltd. 1991–2014. All rights reserved.
The information contained herein is proprietary to Transas MIP Ltd. and shall not be duplicated in whole or in part. The technical details contained in this manual are accurate at the date of issue but are subject to change without notice.
Transas MIP Ltd. pursues a policy of continuous development. This may mean that the product delivered has additional enhancements not yet covered by the latest version of this manual.
The names of actual companies and products mentioned herein may be the trademarks of their respective owners.
3 FleetViewOnline ver. 4.2 User ManualContents
1. . . . . . Introduction . . . . . . . . . . . . . . . . . . . . . . . . . . . . . . . . . . . . . . . . . . . . . . . . . . . . . . . . 9
1.1 Definitions. . . . . . . . . . . . . . . . . . . . . . . . . . . . . . . . . . . . . . . . . . . . . . . . . . . . . . . . . . . . . . . . . . 9
1.2 Configuration Requirements . . . . . . . . . . . . . . . . . . . . . . . . . . . . . . . . . . . . . . . . . . . . . . .10
1.3 Access Levels . . . . . . . . . . . . . . . . . . . . . . . . . . . . . . . . . . . . . . . . . . . . . . . . . . . . . . . . . . . . . . 11
2.. . . . . Using FleetViewOnline . . . . . . . . . . . . . . . . . . . . . . . . . . . . . . . . . . . . . . . . . . . . . 12
2.1 Your Account Access . . . . . . . . . . . . . . . . . . . . . . . . . . . . . . . . . . . . . . . . . . . . . . . . . . . . . . . 12
2.1.1 Default Opening Service. . . . . . . . . . . . . . . . . . . . . . . . . . . . . . . . . . . . . . . . . . . . . . . . . . . . . . . 12
2.2 User Interface . . . . . . . . . . . . . . . . . . . . . . . . . . . . . . . . . . . . . . . . . . . . . . . . . . . . . . . . . . . . . 13
2.2.1 Chart Display Area . . . . . . . . . . . . . . . . . . . . . . . . . . . . . . . . . . . . . . . . . . . . . . . . . . . . . . . . . . . . 13
2.2.1.1 Chart Toolbar . . . . . . . . . . . . . . . . . . . . . . . . . . . . . . . . . . . . . . . . . . . . . . . . . . . . . . . . . . . . . 14
2.2.1.2 Scaling and Zooming Chart . . . . . . . . . . . . . . . . . . . . . . . . . . . . . . . . . . . . . . . . . . . . . . . 14
2.2.1.3 Centring chart . . . . . . . . . . . . . . . . . . . . . . . . . . . . . . . . . . . . . . . . . . . . . . . . . . . . . . . . . . . . 15
2.2.1.4 Chart types . . . . . . . . . . . . . . . . . . . . . . . . . . . . . . . . . . . . . . . . . . . . . . . . . . . . . . . . . . . . . . . 16
2.2.1.5 Chart Layers . . . . . . . . . . . . . . . . . . . . . . . . . . . . . . . . . . . . . . . . . . . . . . . . . . . . . . . . . . . . . . 16
2.2.1.6 ERBL Functions. . . . . . . . . . . . . . . . . . . . . . . . . . . . . . . . . . . . . . . . . . . . . . . . . . . . . . . . . . . . 17
2.2.1.7 Distance to Shore . . . . . . . . . . . . . . . . . . . . . . . . . . . . . . . . . . . . . . . . . . . . . . . . . . . . . . . . . 17
2.2.1.8 Magnetic Declination . . . . . . . . . . . . . . . . . . . . . . . . . . . . . . . . . . . . . . . . . . . . . . . . . . . . . 17
2.2.1.9 Selecting Vessel . . . . . . . . . . . . . . . . . . . . . . . . . . . . . . . . . . . . . . . . . . . . . . . . . . . . . . . . . . . 18
2.2.1.10 Printing Current Chart . . . . . . . . . . . . . . . . . . . . . . . . . . . . . . . . . . . . . . . . . . . . . . . . . . . . 18
2.3 Vessel Monitoring . . . . . . . . . . . . . . . . . . . . . . . . . . . . . . . . . . . . . . . . . . . . . . . . . . . . . . . . . 19
2.3.1 Displaying Vessel. . . . . . . . . . . . . . . . . . . . . . . . . . . . . . . . . . . . . . . . . . . . . . . . . . . . . . . . . . . . . . 19
2.3.1.1 Vessel Menu. . . . . . . . . . . . . . . . . . . . . . . . . . . . . . . . . . . . . . . . . . . . . . . . . . . . . . . . . . . . . . . 20
2.3.1.2 Terminal Menu . . . . . . . . . . . . . . . . . . . . . . . . . . . . . . . . . . . . . . . . . . . . . . . . . . . . . . . . . . . . 26
2.3.2 Ports. . . . . . . . . . . . . . . . . . . . . . . . . . . . . . . . . . . . . . . . . . . . . . . . . . . . . . . . . . . . . . . . . . . . . . . . . . 27
2.3.3 Routes . . . . . . . . . . . . . . . . . . . . . . . . . . . . . . . . . . . . . . . . . . . . . . . . . . . . . . . . . . . . . . . . . . . . . . . . 28
2.3.3.1 Adding New Route . . . . . . . . . . . . . . . . . . . . . . . . . . . . . . . . . . . . . . . . . . . . . . . . . . . . . . . . 28
2.3.3.2 Removing Route . . . . . . . . . . . . . . . . . . . . . . . . . . . . . . . . . . . . . . . . . . . . . . . . . . . . . . . . . . 31
2.3.3.3 Uploading Route from existing RT3 File . . . . . . . . . . . . . . . . . . . . . . . . . . . . . . . . . . . 31
2.3.3.4 Calculating and Monitoring Route . . . . . . . . . . . . . . . . . . . . . . . . . . . . . . . . . . . . . . . . . 31
2.3.3.5 Saving Route in RT3 File Format . . . . . . . . . . . . . . . . . . . . . . . . . . . . . . . . . . . . . . . . . . . 34
Contents
TRANSAS RESERVE THE RIGHT TO CHANGE THE SPECIFICATION WITHOUT PRIOR NOTICE
TRANSAS IS REGISTERED TRADEMARK
COPYRIGHT: © TRANSAS MIP LTD 1991–2014
4 FleetViewOnline ver. 4.2 User ManualContents
2.3.4 Weather . . . . . . . . . . . . . . . . . . . . . . . . . . . . . . . . . . . . . . . . . . . . . . . . . . . . . . . . . . . . . . . . . . . . . . 35
2.3.4.1 Weather display settings . . . . . . . . . . . . . . . . . . . . . . . . . . . . . . . . . . . . . . . . . . . . . . . . . . 35
2.3.4.2 Weather symbols . . . . . . . . . . . . . . . . . . . . . . . . . . . . . . . . . . . . . . . . . . . . . . . . . . . . . . . . . 37
2.3.5 Areas . . . . . . . . . . . . . . . . . . . . . . . . . . . . . . . . . . . . . . . . . . . . . . . . . . . . . . . . . . . . . . . . . . . . . . . . . 38
2.3.6 Zones . . . . . . . . . . . . . . . . . . . . . . . . . . . . . . . . . . . . . . . . . . . . . . . . . . . . . . . . . . . . . . . . . . . . . . . . . 39
2.3.6.1 Creating Point Zone. . . . . . . . . . . . . . . . . . . . . . . . . . . . . . . . . . . . . . . . . . . . . . . . . . . . . . . 39
2.3.6.2 Moving Point Zone . . . . . . . . . . . . . . . . . . . . . . . . . . . . . . . . . . . . . . . . . . . . . . . . . . . . . . . 40
2.3.6.3 Creating Line Zone. . . . . . . . . . . . . . . . . . . . . . . . . . . . . . . . . . . . . . . . . . . . . . . . . . . . . . . . 40
2.3.6.4 Creating Polygon Zone. . . . . . . . . . . . . . . . . . . . . . . . . . . . . . . . . . . . . . . . . . . . . . . . . . . . 41
2.3.6.5 Editing Line and Polygon Zones . . . . . . . . . . . . . . . . . . . . . . . . . . . . . . . . . . . . . . . . . . . 41
2.3.6.6 Creating Alarm and Receiving Notifications. . . . . . . . . . . . . . . . . . . . . . . . . . . . . . . . 42
2.3.7 Piracy . . . . . . . . . . . . . . . . . . . . . . . . . . . . . . . . . . . . . . . . . . . . . . . . . . . . . . . . . . . . . . . . . . . . . . . . . 45
2.3.7.1 Set-up Piracy Information Overlay . . . . . . . . . . . . . . . . . . . . . . . . . . . . . . . . . . . . . . . . . 45
2.3.7.2 Displaying Piracy Information . . . . . . . . . . . . . . . . . . . . . . . . . . . . . . . . . . . . . . . . . . . . . 46
2.3.8 UAIS Targets . . . . . . . . . . . . . . . . . . . . . . . . . . . . . . . . . . . . . . . . . . . . . . . . . . . . . . . . . . . . . . . . . . 46
2.3.8.1 AIS Data Sources . . . . . . . . . . . . . . . . . . . . . . . . . . . . . . . . . . . . . . . . . . . . . . . . . . . . . . . . . . 46
2.3.8.2 Viewing UAIS Targets . . . . . . . . . . . . . . . . . . . . . . . . . . . . . . . . . . . . . . . . . . . . . . . . . . . . . 46
2.3.8.3 Selecting UAIS Target on Chart . . . . . . . . . . . . . . . . . . . . . . . . . . . . . . . . . . . . . . . . . . . . 47
2.3.8.4 Setting Vessel Symbol Color. . . . . . . . . . . . . . . . . . . . . . . . . . . . . . . . . . . . . . . . . . . . . . . 48
2.3.8.5 Viewing UAIS Targets Fleet Report . . . . . . . . . . . . . . . . . . . . . . . . . . . . . . . . . . . . . . . . 48
2.3.8.6 Search Vessel Photos. . . . . . . . . . . . . . . . . . . . . . . . . . . . . . . . . . . . . . . . . . . . . . . . . . . . . . 49
2.3.8.7 Search Vessel Data on eagle.org . . . . . . . . . . . . . . . . . . . . . . . . . . . . . . . . . . . . . . . . . . . 49
2.3.8.8 AIS data clustering . . . . . . . . . . . . . . . . . . . . . . . . . . . . . . . . . . . . . . . . . . . . . . . . . . . . . . . . 49
2.3.8.9 Precise Tracks of Vessels Using AIS Data . . . . . . . . . . . . . . . . . . . . . . . . . . . . . . . . . . . 50
2.4 Users and Vessel Groups . . . . . . . . . . . . . . . . . . . . . . . . . . . . . . . . . . . . . . . . . . . . . . . . . . .51
2.4.1 Setting up Users. . . . . . . . . . . . . . . . . . . . . . . . . . . . . . . . . . . . . . . . . . . . . . . . . . . . . . . . . . . . . . . 51
2.4.1.1 Creating a User . . . . . . . . . . . . . . . . . . . . . . . . . . . . . . . . . . . . . . . . . . . . . . . . . . . . . . . . . . . . 51
2.4.1.2 Exporting User Configuration . . . . . . . . . . . . . . . . . . . . . . . . . . . . . . . . . . . . . . . . . . . . . 52
2.4.1.3 Allocating Vessels To Users . . . . . . . . . . . . . . . . . . . . . . . . . . . . . . . . . . . . . . . . . . . . . . . . 52
2.4.2 .Setting up Vessel Groups . . . . . . . . . . . . . . . . . . . . . . . . . . . . . . . . . . . . . . . . . . . . . . . . . . . . . 54
2.4.2.1 Creating Vessel Group . . . . . . . . . . . . . . . . . . . . . . . . . . . . . . . . . . . . . . . . . . . . . . . . . . . . . 54
2.4.2.2 Adding a Vessel to a Group. . . . . . . . . . . . . . . . . . . . . . . . . . . . . . . . . . . . . . . . . . . . . . . . 55
2.4.3 Setting up Vessel Page for Delivery of SSAS Messages. . . . . . . . . . . . . . . . . . . . . . . . . . 55
2.4.3.1 Mini – C/Sat C . . . . . . . . . . . . . . . . . . . . . . . . . . . . . . . . . . . . . . . . . . . . . . . . . . . . . . . . . . . . . 55
2.4.3.2 Entering Delivery Data . . . . . . . . . . . . . . . . . . . . . . . . . . . . . . . . . . . . . . . . . . . . . . . . . . . . 56
2.4.3.3 Data Entry Rules . . . . . . . . . . . . . . . . . . . . . . . . . . . . . . . . . . . . . . . . . . . . . . . . . . . . . . . . . . 56
2.4.3.4 Vessel Data . . . . . . . . . . . . . . . . . . . . . . . . . . . . . . . . . . . . . . . . . . . . . . . . . . . . . . . . . . . . . . . 56
2.4.3.5 SSAS Message Delivery . . . . . . . . . . . . . . . . . . . . . . . . . . . . . . . . . . . . . . . . . . . . . . . . . . . 57
5 FleetViewOnline ver. 4.2 User ManualContents
2.4.3.6 Enabling SSAS Test Function . . . . . . . . . . . . . . . . . . . . . . . . . . . . . . . . . . . . . . . . . . . . . . 57
2.4.3.7 CSO Data . . . . . . . . . . . . . . . . . . . . . . . . . . . . . . . . . . . . . . . . . . . . . . . . . . . . . . . . . . . . . . . . . 58
2.4.3.8 Position reports sending to defined E-mail . . . . . . . . . . . . . . . . . . . . . . . . . . . . . . . . 58
2.4.3.9 Route alarms. . . . . . . . . . . . . . . . . . . . . . . . . . . . . . . . . . . . . . . . . . . . . . . . . . . . . . . . . . . . . . 58
2.4.3.10 Flag State Access to FVO . . . . . . . . . . . . . . . . . . . . . . . . . . . . . . . . . . . . . . . . . . . . . . . . . 58
2.4.3.11 Adding Extra Information to Vessel Tool tip . . . . . . . . . . . . . . . . . . . . . . . . . . . . . . . 58
2.5 Ship Security Alert Message Log . . . . . . . . . . . . . . . . . . . . . . . . . . . . . . . . . . . . . . . . . . .59
2.5.1 Alert notifications by E-mail and SMS . . . . . . . . . . . . . . . . . . . . . . . . . . . . . . . . . . . . . . . . . . 59
2.5.1.1 Status Message. . . . . . . . . . . . . . . . . . . . . . . . . . . . . . . . . . . . . . . . . . . . . . . . . . . . . . . . . . . . 59
2.5.2 SSAS Log. . . . . . . . . . . . . . . . . . . . . . . . . . . . . . . . . . . . . . . . . . . . . . . . . . . . . . . . . . . . . . . . . . . . . . 61
2.5.2.1 Explanation of SSAS Log columns . . . . . . . . . . . . . . . . . . . . . . . . . . . . . . . . . . . . . . . . . 61
2.6 Forwarding Data to AMVER and UKMTO/ MSCHOA . . . . . . . . . . . . . . . . . . . . . . . . .62
2.6.1 Forwarding Position Reports to AMVER . . . . . . . . . . . . . . . . . . . . . . . . . . . . . . . . . . . . . . . . 62
2.6.2 Forwarding SSAS Alerts to UKMTO/MSCHOA . . . . . . . . . . . . . . . . . . . . . . . . . . . . . . . . . . 62
2.6.3 Activating of Forwarding Data to AMVER and UKMTO for Vessel. . . . . . . . . . . . . . . . 63
2.6.4 Activating of Forwarding Data to AMVER and UKMTO for Vessels Group. . . . . . . . 63
2.7 SSAS Management . . . . . . . . . . . . . . . . . . . . . . . . . . . . . . . . . . . . . . . . . . . . . . . . . . . . . . . .64
2.7.1 SSAS Management Compatibility . . . . . . . . . . . . . . . . . . . . . . . . . . . . . . . . . . . . . . . . . . . . . . 64
2.7.2 Access to SSAS Management Page . . . . . . . . . . . . . . . . . . . . . . . . . . . . . . . . . . . . . . . . . . . . . 65
2.7.2.1 Action Tab . . . . . . . . . . . . . . . . . . . . . . . . . . . . . . . . . . . . . . . . . . . . . . . . . . . . . . . . . . . . . . . . 65
2.7.2.2 Report Tab . . . . . . . . . . . . . . . . . . . . . . . . . . . . . . . . . . . . . . . . . . . . . . . . . . . . . . . . . . . . . . . . 66
2.7.2.3 Configuration Tab . . . . . . . . . . . . . . . . . . . . . . . . . . . . . . . . . . . . . . . . . . . . . . . . . . . . . . . . . 66
2.7.3 SSAS Testing . . . . . . . . . . . . . . . . . . . . . . . . . . . . . . . . . . . . . . . . . . . . . . . . . . . . . . . . . . . . . . . . . . 67
2.7.3.1 Starting Test. . . . . . . . . . . . . . . . . . . . . . . . . . . . . . . . . . . . . . . . . . . . . . . . . . . . . . . . . . . . . . . 67
2.7.3.2 Test Alert . . . . . . . . . . . . . . . . . . . . . . . . . . . . . . . . . . . . . . . . . . . . . . . . . . . . . . . . . . . . . . . . . 67
2.7.3.3 Reset Test Alert . . . . . . . . . . . . . . . . . . . . . . . . . . . . . . . . . . . . . . . . . . . . . . . . . . . . . . . . . . . 68
2.7.3.4 Test Conflict. . . . . . . . . . . . . . . . . . . . . . . . . . . . . . . . . . . . . . . . . . . . . . . . . . . . . . . . . . . . . . . 69
2.7.3.5 SSAS Log Display, SSAS Management. . . . . . . . . . . . . . . . . . . . . . . . . . . . . . . . . . . . . . 69
2.8 Chart Data. . . . . . . . . . . . . . . . . . . . . . . . . . . . . . . . . . . . . . . . . . . . . . . . . . . . . . . . . . . . . . . . .70
2.8.1 Ordering charts . . . . . . . . . . . . . . . . . . . . . . . . . . . . . . . . . . . . . . . . . . . . . . . . . . . . . . . . . . . . . . . 70
2.8.2 Charts Catalogue . . . . . . . . . . . . . . . . . . . . . . . . . . . . . . . . . . . . . . . . . . . . . . . . . . . . . . . . . . . . . 73
2.9 WAVE. . . . . . . . . . . . . . . . . . . . . . . . . . . . . . . . . . . . . . . . . . . . . . . . . . . . . . . . . . . . . . . . . . . . . .75
2.9.1 Wave Trip Configuration . . . . . . . . . . . . . . . . . . . . . . . . . . . . . . . . . . . . . . . . . . . . . . . . . . . . . . . 76
2.9.2 Wave Dashboard . . . . . . . . . . . . . . . . . . . . . . . . . . . . . . . . . . . . . . . . . . . . . . . . . . . . . . . . . . . . . . 77
2.9.3 Wave Analytics . . . . . . . . . . . . . . . . . . . . . . . . . . . . . . . . . . . . . . . . . . . . . . . . . . . . . . . . . . . . . . . . 78
2.10 Working without Browser using Java Application . . . . . . . . . . . . . . . . . . . . . . . . . .79
3. . . . . . Integration with ECDIS. . . . . . . . . . . . . . . . . . . . . . . . . . . . . . . . . . . . . . . . . . . . . .80
4.. . . . . FVO Mobile Version. . . . . . . . . . . . . . . . . . . . . . . . . . . . . . . . . . . . . . . . . . . . . . . . .84
TRANSAS RESERVE THE RIGHT TO CHANGE THE SPECIFICATION WITHOUT PRIOR NOTICE
TRANSAS IS REGISTERED TRADEMARK
COPYRIGHT: © TRANSAS MIP LTD 1991–2014
6 FleetViewOnline ver. 4.2 User ManualContents
5. . . . . . FVO Android Application . . . . . . . . . . . . . . . . . . . . . . . . . . . . . . . . . . . . . . . . . . .85
5.1 User interface. . . . . . . . . . . . . . . . . . . . . . . . . . . . . . . . . . . . . . . . . . . . . . . . . . . . . . . . . . . . . .85
5.2 Services . . . . . . . . . . . . . . . . . . . . . . . . . . . . . . . . . . . . . . . . . . . . . . . . . . . . . . . . . . . . . . . . . . .85
5.2.1 Vessel service . . . . . . . . . . . . . . . . . . . . . . . . . . . . . . . . . . . . . . . . . . . . . . . . . . . . . . . . . . . . . . . . . 86
5.2.2 My Location Service . . . . . . . . . . . . . . . . . . . . . . . . . . . . . . . . . . . . . . . . . . . . . . . . . . . . . . . . . . 87
5.2.3 User Zone Service . . . . . . . . . . . . . . . . . . . . . . . . . . . . . . . . . . . . . . . . . . . . . . . . . . . . . . . . . . . . 87
5.2.4 Weather service . . . . . . . . . . . . . . . . . . . . . . . . . . . . . . . . . . . . . . . . . . . . . . . . . . . . . . . . . . . . . . 87
7 FleetViewOnline ver. 4.2 User ManualTRANSAS Contact Information
TRANSAS Contact InformationSales
http://www.transas.com/products/onboard/monitoring/fvo/contactus/
Technical Support
E-mail: [email protected]
Tel: +46(0) 31 769 56 00 (During Office Hours 07:00 to 15:30 utc)
Tel: +46(0) 771 460 100 (24/7 Service and Support)
TRANSAS RESERVE THE RIGHT TO CHANGE THE SPECIFICATION WITHOUT PRIOR NOTICE
TRANSAS IS REGISTERED TRADEMARK
COPYRIGHT: © TRANSAS MIP LTD 1991–2014
8 FleetViewOnline ver. 4.2 User ManualPrinting House Conventions
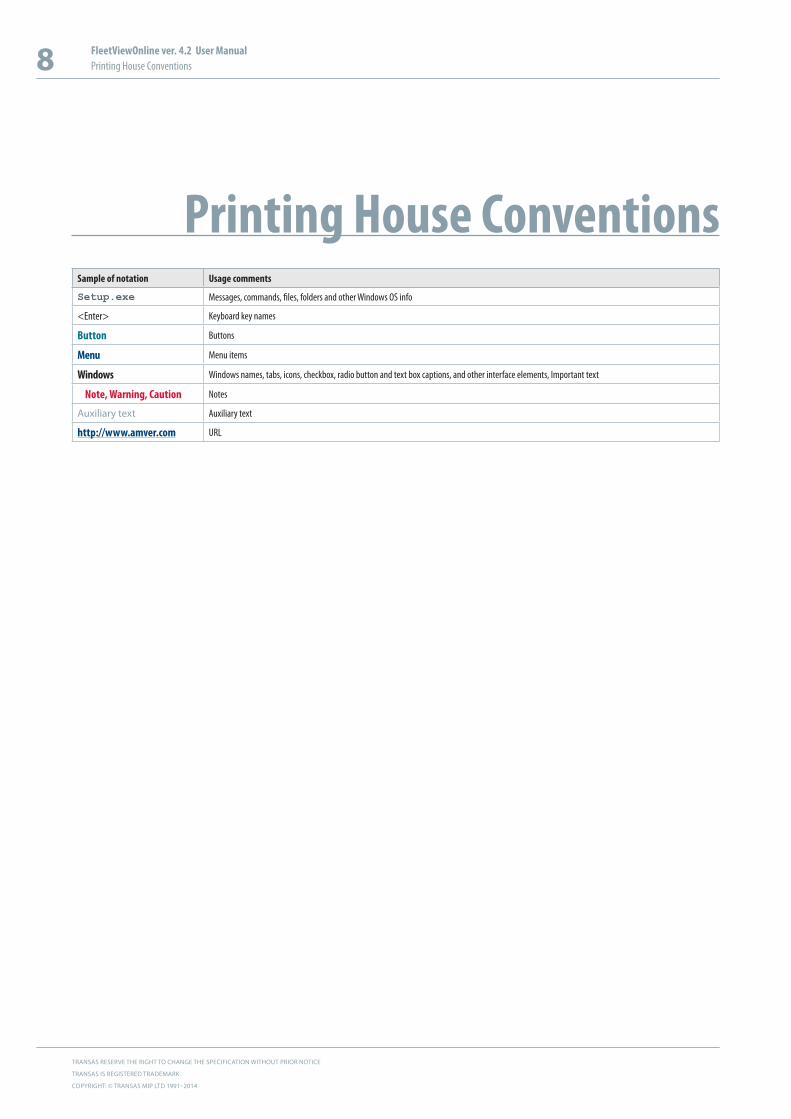
Printing House ConventionsSample of notation Usage comments
Setup.exe Messages, commands, files, folders and other Windows OS info
<Enter> Keyboard key names
Button Buttons
Menu Menu items
Windows Windows names, tabs, icons, checkbox, radio button and text box captions, and other interface elements, Important text
Note, Warning, Caution Notes
Auxiliary text Auxiliary text
http://www.amver.com URL
9 FleetViewOnline ver. 4.2 User ManualAbbreviation
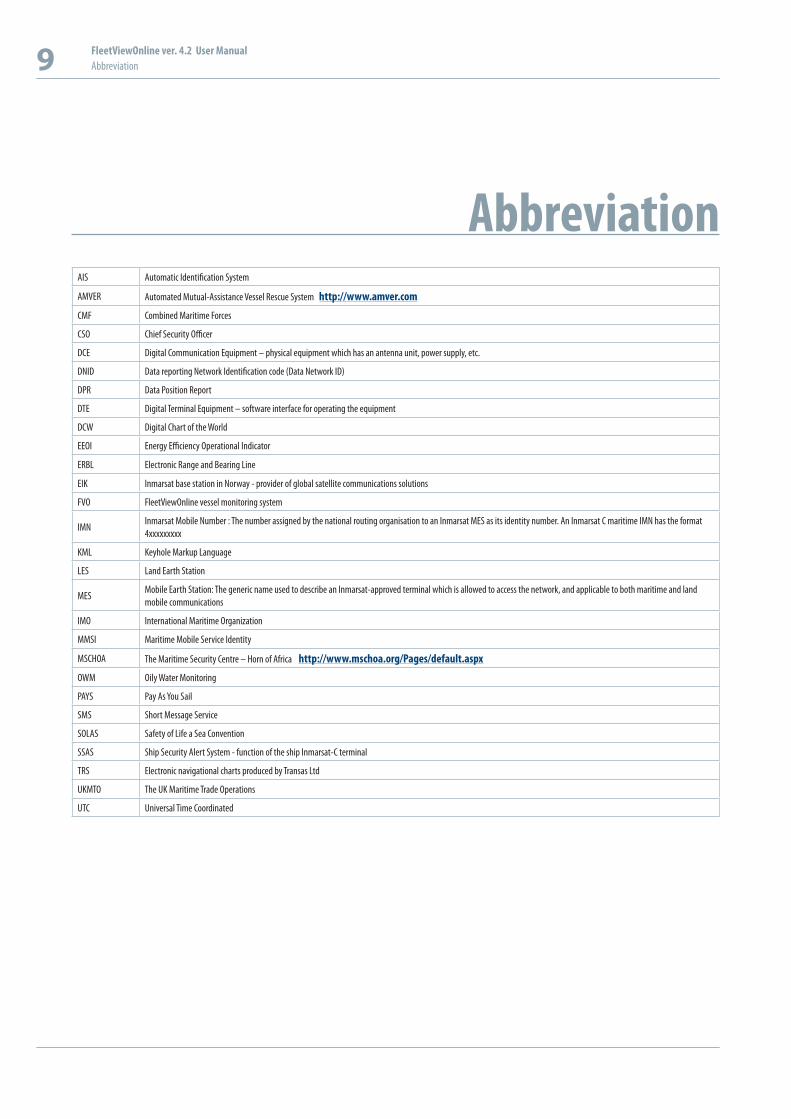
AbbreviationAIS Automatic Identification System
AMVER Automated Mutual-Assistance Vessel Rescue System http://www.amver.com
CMF Combined Maritime Forces
CSO Chief Security Officer
DCE Digital Communication Equipment – physical equipment which has an antenna unit, power supply, etc.
DNID Data reporting Network Identification code (Data Network ID)
DPR Data Position Report
DTE Digital Terminal Equipment – software interface for operating the equipment
DCW Digital Chart of the World
EEOI Energy Efficiency Operational Indicator
ERBL Electronic Range and Bearing Line
EIK Inmarsat base station in Norway - provider of global satellite communications solutions
FVO FleetViewOnline vessel monitoring system
IMNInmarsat Mobile Number : The number assigned by the national routing organisation to an Inmarsat MES as its identity number. An Inmarsat C maritime IMN has the format 4xxxxxxxxx
KML Keyhole Markup Language
LES Land Earth Station
MESMobile Earth Station: The generic name used to describe an Inmarsat-approved terminal which is allowed to access the network, and applicable to both maritime and land mobile communications
IMO International Maritime Organization
MMSI Maritime Mobile Service Identity
MSCHOA The Maritime Security Centre – Horn of Africa http://www.mschoa.org/Pages/default.aspx
OWM Oily Water Monitoring
PAYS Pay As You Sail
SMS Short Message Service
SOLAS Safety of Life a Sea Convention
SSAS Ship Security Alert System - function of the ship Inmarsat-C terminal
TRS Electronic navigational charts produced by Transas Ltd
UKMTO The UK Maritime Trade Operations
UTC Universal Time Coordinated
TRANSAS RESERVE THE RIGHT TO CHANGE THE SPECIFICATION WITHOUT PRIOR NOTICE
TRANSAS IS REGISTERED TRADEMARK
COPYRIGHT: © TRANSAS MIP LTD 1991–2014
10 FleetViewOnline ver. 4.2 User ManualIntroduction Definitions
1. IntroductionThe objective of the manual is to enable office/shore-based users of FleetViewOnline (FVO) and the Ship Security Alert System (SSAS), Ship Guard, to use and move around the internet based service with an acceptable level of competency in relation to their duties within the shipping company.
After working through the manual users will be able to:
• Be familiar with and control password access
• Understand various user functions and operations available from web site
• Know the difference between administrator, power user and standard user
• Appreciate the need to preplan and set up the web site to suit the company structure
• Create and delete vessel groups
• Create and delete user groups
• Set SSAS messaging for vessels
• Understand ship security alert messages
• Manipulate weather features
• Understand user defined areas
• Use the Port menu
• Work with user zones
• View AIS data using the UAIS menu
• View information about piracy attacks using the Piracy menu
• Use the WAVE and CDMO services
• Use FVO mobile version and Android application.
1.1 DefinitionsFleetViewOnline
An internet based application that supports the viewing/monitoring of vessels via Inmarsat system subscribing to the service.
FVO is used to monitor:
• SSAS reports/alerts
• Vessel tracking reports
• Combined SSAS and tracking reports.
FVO supports tracking via Standard Sat-C, mini-C, Sat-D+, Iridium and AIS and also the Ship Security Alert functions as required by SOLAS X1-2.
Supported models of SSAS/Tracking hardware are:
• TRANSAS ‘SHIPGUARD’ Version 2
• TRANSAS ‘SHIPGUARD’ Version 3
• TRANSAS ‘SHIPGUARD’ Version 4
• POLESTAR ‘DSAS’ and POLESTAR ‘DSAS Mk2’
11 FleetViewOnline ver. 4.2 User ManualIntroduction Configuration Requirements
• SATAMATICS ‘OCEAN ALERT’
• THRANE & THRANE (all models)
• FURUNO (all models)
• JRC (all models)
• BlueTraker 2100
• SAILOR H4122 Iridium SSAS
• T&T Fleetbroadband 250/500.
Tracking
Refers to a Data Position Report (DPR) – usually an automated position report sent from the vessel without any operator intervention.
Polling
Is where a user ashore, via the FVO website, manually demands a position report from the vessels onboard system using poll command.
Poll is a command sent via the LES to the ship terminal, which initiates return transmission of a position report from the terminal to the LES or runs the programmed position reporting.
The poll commands can be used for performing the following operations:
• Terminal polling for the reception of a single vessel Position Report
• Terminal programming for the automatic transmission of reports at a set interval. This operation is performed by the successive sending of three commands:
ű To stop the previous program
ű To load the data report sending program
ű To run the data report sending program.
Note: The set of available commands depends on the model of the terminal.
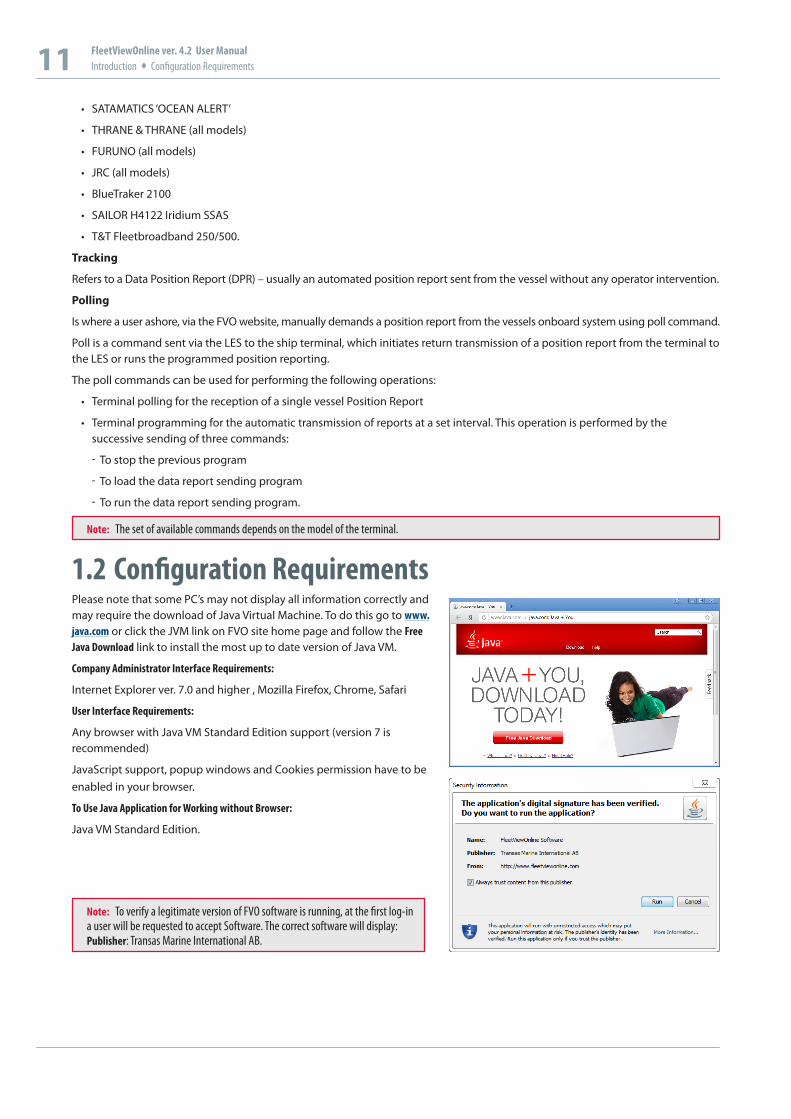
1.2 Configuration RequirementsPlease note that some PC’s may not display all information correctly and may require the download of Java Virtual Machine. To do this go to www.java.com or click the JVM link on FVO site home page and follow the Free Java Download link to install the most up to date version of Java VM.
Company Administrator Interface Requirements:
Internet Explorer ver. 7.0 and higher , Mozilla Firefox, Chrome, Safari
User Interface Requirements:
Any browser with Java VM Standard Edition support (version 7 is recommended)
JavaScript support, popup windows and Cookies permission have to be enabled in your browser.
To Use Java Application for Working without Browser:
Java VM Standard Edition.
Note: To verify a legitimate version of FVO software is running, at the first log-in a user will be requested to accept Software. The correct software will display: Publisher: Transas Marine International AB.
TRANSAS RESERVE THE RIGHT TO CHANGE THE SPECIFICATION WITHOUT PRIOR NOTICE
TRANSAS IS REGISTERED TRADEMARK
COPYRIGHT: © TRANSAS MIP LTD 1991–2014
12 FleetViewOnline ver. 4.2 User ManualIntroduction Access Levels
1.3 Access LevelsTo access the Transas Internet based tracking and security alert service use your Internet browser and log onto www.fleetviewonline.com.
During the registration process, Transas operations team will create your company’s account and issue secure Login and Password, this password provides access at Company Administrator level and it is strongly suggested that this user is a member of the IT department or a senior manager in the marine/technical department.
It is at this point some thought as to how and what your company wants to get from the service needs to be given. To help with this a fictitious company has been created to show how FleetViewOnline can be manipulated to suit individual company needs.
In order to control and manage FVO three levels of access are available to companies.
Company Administrator
Ideally this should be a member of the IT department or someone who is computer literate and confident in the manipulation and management of web sites. By default they have access to all features and functions.
This level of access has the authority to make major changes to the company structure within the web site as well as access to all functions. There is also the authority to create user and allocate various rights to all levels of users.
This user will therefore issue login and passwords to all other users.
Power User
Normally has the same level of access to user features as the Company Administrator but does not have the authority to create/delete user groups or assign powers to other users.
If the Power User has the “View Vessel Page” access right, then he can edit the vessel data and create/delete vessel groups.
Users at this level will typically be senior managers within the company and as such will often have the authority to poll vessels.
User
Have view only rights – they are unable to poll a vessel and may have other restrictions and limitations as decided by the Company Administrator when setting up the various user accounts.
The ability to limit and control access to features at Slave user level makes it ideal to issue login and passwords to trusted users outside the company such as vessel charterers or ships agents.
13 FleetViewOnline ver. 4.2 User ManualUsing FleetViewOnline Your Account Access
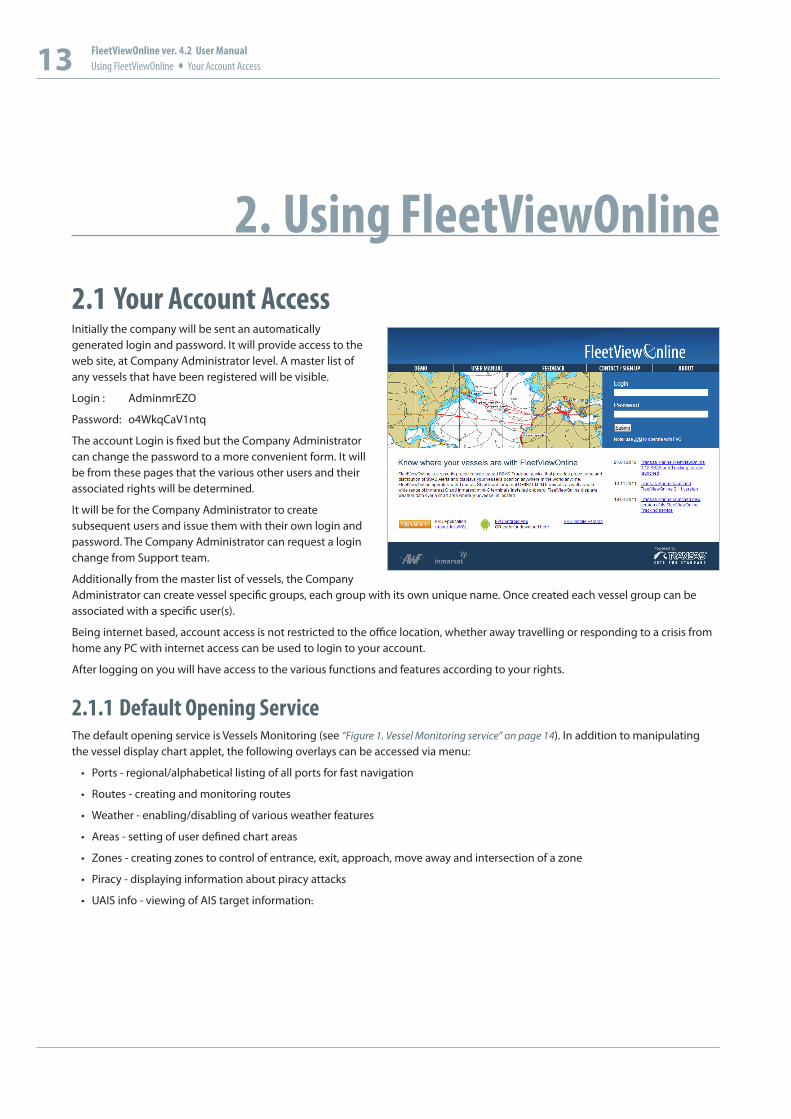
2. Using FleetViewOnline2.1 Your Account AccessInitially the company will be sent an automatically generated login and password. It will provide access to the web site, at Company Administrator level. A master list of any vessels that have been registered will be visible.
Login : AdminmrEZO
Password: o4WkqCaV1ntq
The account Login is fixed but the Company Administrator can change the password to a more convenient form. It will be from these pages that the various other users and their associated rights will be determined.
It will be for the Company Administrator to create subsequent users and issue them with their own login and password. The Company Administrator can request a login change from Support team.
Additionally from the master list of vessels, the Company Administrator can create vessel specific groups, each group with its own unique name. Once created each vessel group can be associated with a specific user(s).
Being internet based, account access is not restricted to the office location, whether away travelling or responding to a crisis from home any PC with internet access can be used to login to your account.
After logging on you will have access to the various functions and features according to your rights.
2.1.1 Default Opening ServiceThe default opening service is Vessels Monitoring (see “Figure 1. Vessel Monitoring service” on page 14). In addition to manipulating the vessel display chart applet, the following overlays can be accessed via menu:
• Ports - regional/alphabetical listing of all ports for fast navigation
• Routes - creating and monitoring routes
• Weather - enabling/disabling of various weather features
• Areas - setting of user defined chart areas
• Zones - creating zones to control of entrance, exit, approach, move away and intersection of a zone
• Piracy - displaying information about piracy attacks
• UAIS info - viewing of AIS target information.
TRANSAS RESERVE THE RIGHT TO CHANGE THE SPECIFICATION WITHOUT PRIOR NOTICE
TRANSAS IS REGISTERED TRADEMARK
COPYRIGHT: © TRANSAS MIP LTD 1991–2014
14 FleetViewOnline ver. 4.2 User ManualUsing FleetViewOnline User Interface
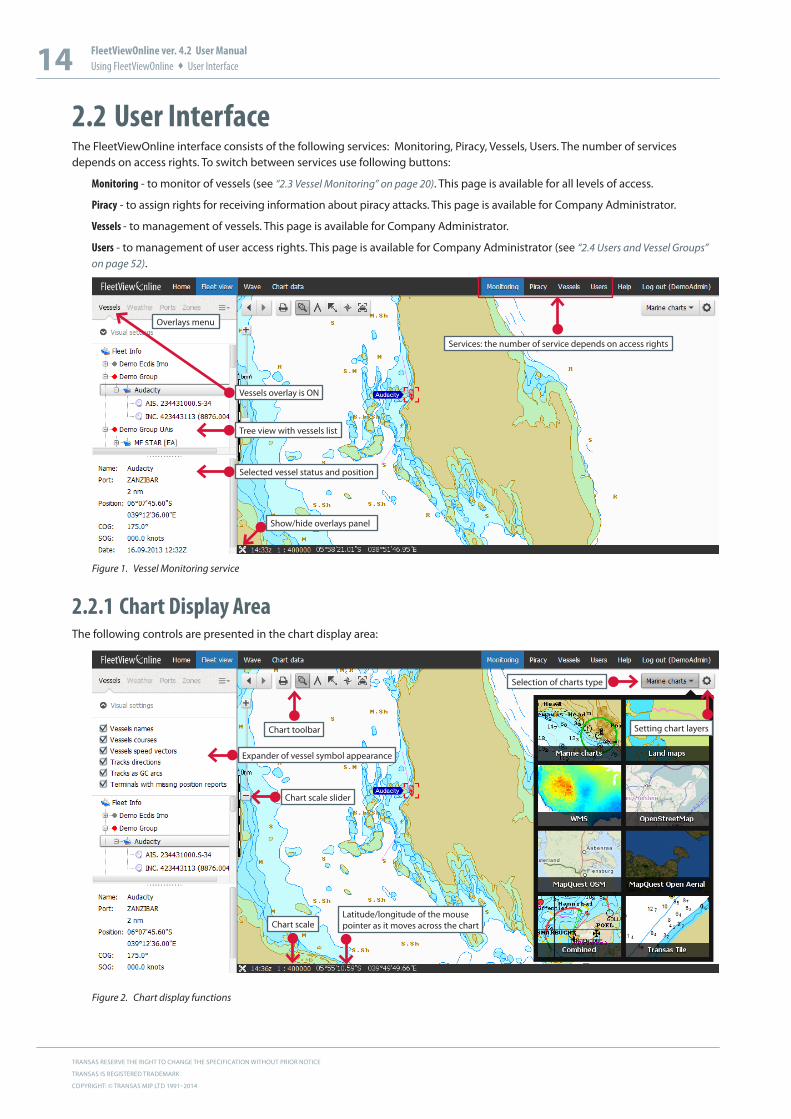
2.2 User InterfaceThe FleetViewOnline interface consists of the following services: Monitoring, Piracy, Vessels, Users. The number of services depends on access rights. To switch between services use following buttons:
Monitoring - to monitor of vessels (see “2.3 Vessel Monitoring” on page 20). This page is available for all levels of access.
Piracy - to assign rights for receiving information about piracy attacks. This page is available for Company Administrator.
Vessels - to management of vessels. This page is available for Company Administrator.
Users - to management of user access rights. This page is available for Company Administrator (see “2.4 Users and Vessel Groups” on page 52).
Vessels overlay is ON
Services: the number of service depends on access rights
Tree view with vessels list
Selected vessel status and position
Show/hide overlays panel
Overlays menu
Figure 1. Vessel Monitoring service
2.2.1 Chart Display AreaThe following controls are presented in the chart display area:
Latitude/longitude of the mouse pointer as it moves across the chart
Selection of charts type
Chart toolbar
Chart scale
Setting chart layers
Chart scale slider
Expander of vessel symbol appearance
Figure 2. Chart display functions
15 FleetViewOnline ver. 4.2 User ManualUsing FleetViewOnline User Interface
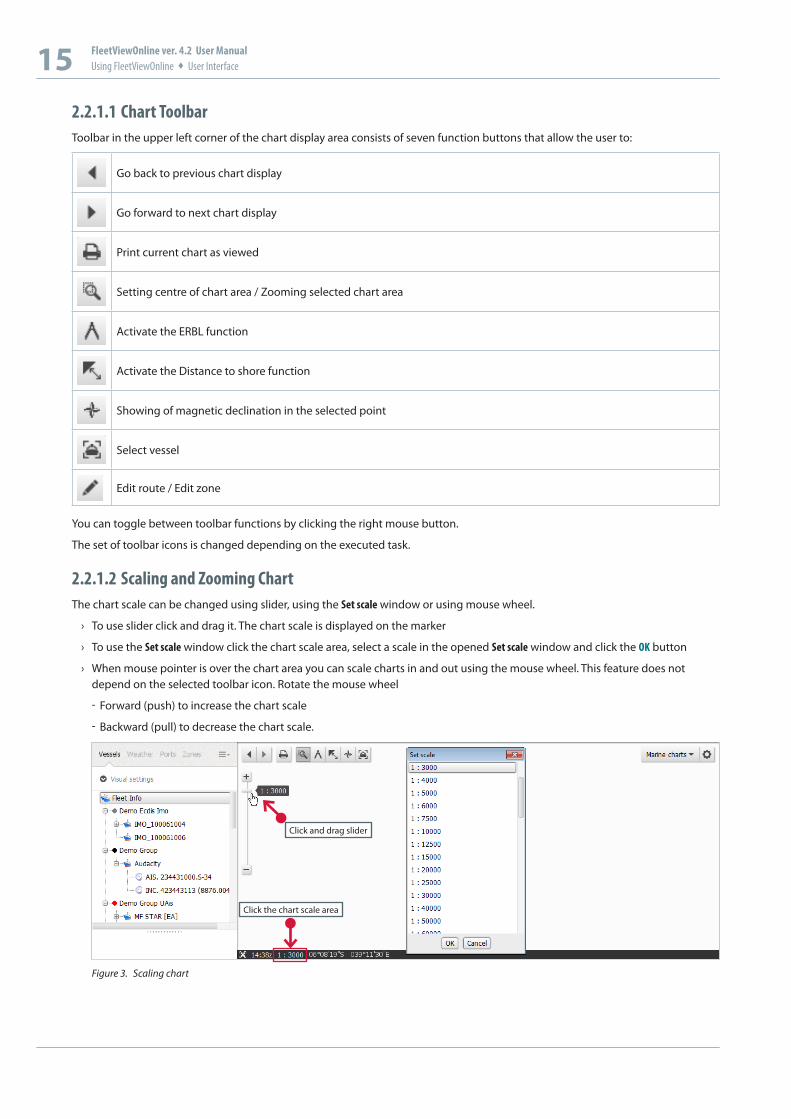
2.2.1.1 Chart ToolbarToolbar in the upper left corner of the chart display area consists of seven function buttons that allow the user to:
Go back to previous chart display
Go forward to next chart display
Print current chart as viewed
Setting centre of chart area / Zooming selected chart area
Activate the ERBL function
Activate the Distance to shore function
Showing of magnetic declination in the selected point
Select vessel
Edit route / Edit zone
You can toggle between toolbar functions by clicking the right mouse button.
The set of toolbar icons is changed depending on the executed task.
2.2.1.2 Scaling and Zooming ChartThe chart scale can be changed using slider, using the Set scale window or using mouse wheel.
› To use slider click and drag it. The chart scale is displayed on the marker
› To use the Set scale window click the chart scale area, select a scale in the opened Set scale window and click the OK button
› When mouse pointer is over the chart area you can scale charts in and out using the mouse wheel. This feature does not depend on the selected toolbar icon. Rotate the mouse wheel
ű Forward (push) to increase the chart scale
ű Backward (pull) to decrease the chart scale.
Click the chart scale area
Click and drag slider
Figure 3. Scaling chart
TRANSAS RESERVE THE RIGHT TO CHANGE THE SPECIFICATION WITHOUT PRIOR NOTICE
TRANSAS IS REGISTERED TRADEMARK
COPYRIGHT: © TRANSAS MIP LTD 1991–2014
16 FleetViewOnline ver. 4.2 User ManualUsing FleetViewOnline User Interface
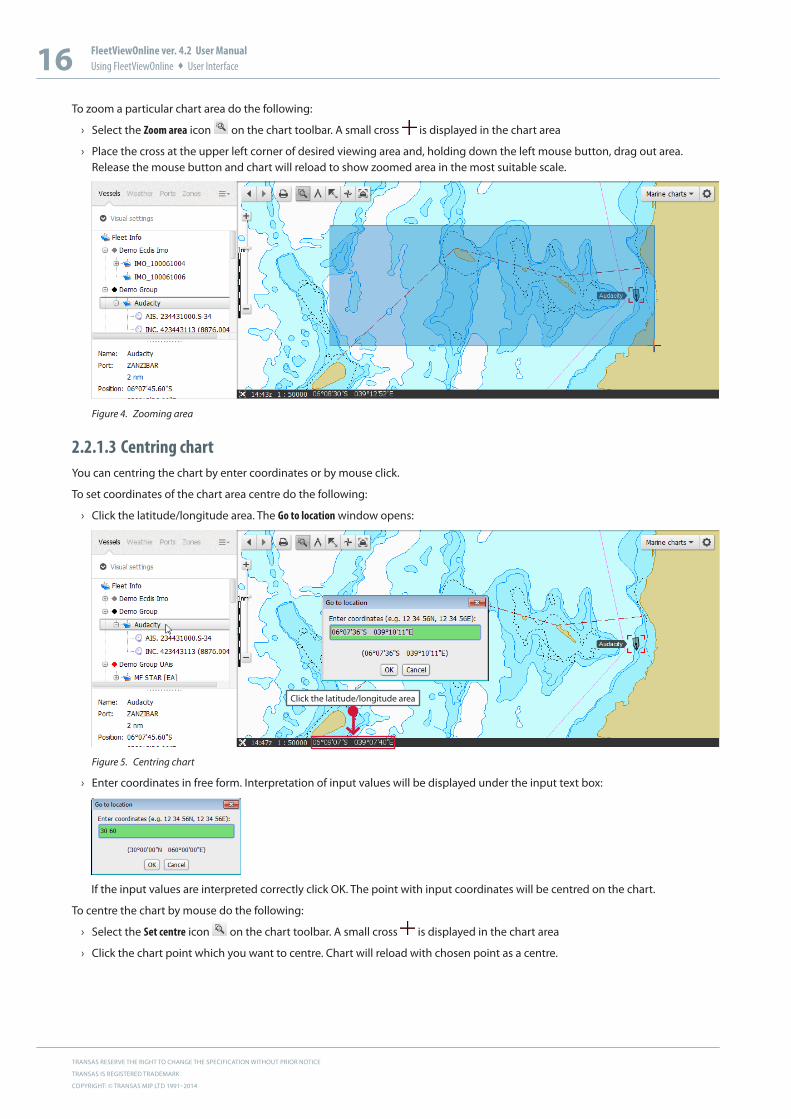
To zoom a particular chart area do the following:
› Select the Zoom area icon on the chart toolbar. A small cross is displayed in the chart area
› Place the cross at the upper left corner of desired viewing area and, holding down the left mouse button, drag out area. Release the mouse button and chart will reload to show zoomed area in the most suitable scale.
Figure 4. Zooming area
2.2.1.3 Centring chartYou can centring the chart by enter coordinates or by mouse click.
To set coordinates of the chart area centre do the following:
› Click the latitude/longitude area. The Go to location window opens:
Click the latitude/longitude area
Figure 5. Centring chart
› Enter coordinates in free form. Interpretation of input values will be displayed under the input text box:
If the input values are interpreted correctly click OK. The point with input coordinates will be centred on the chart.
To centre the chart by mouse do the following:
› Select the Set centre icon on the chart toolbar. A small cross is displayed in the chart area
› Click the chart point which you want to centre. Chart will reload with chosen point as a centre.

17 FleetViewOnline ver. 4.2 User ManualUsing FleetViewOnline User Interface
2.2.1.4 Chart typesThe following kinds of electronic charts can be displayed in FVO chart area:
• Marine charts
• Land maps
• WMS
• OpenStreetMap
If any nautical chart is selected, then all measurements are in nautical miles. If any other chart is selected, then all measurements are in kilometres.
The following map projection are supported:
• EPSG:4326 (CRS:84) • EPSG:900913
• EPSG:102113• EPSG:3857
• EPSG:3785
2.2.1.5 Chart LayersFor Marine charts and Land maps the displaying of chart layers can be set using the Chart setting applet.
› To open the Chart setting applet click the icon in the upper right corner. Chart setting applet will appear. By default, all layers are selected.
Figure 6. Chart setting applet
When you select WMS chart you can set the WMS chart provider and select layers of WMS chart. To do this:
› Select WMS chart type from the Chart drop-down list. The Chart setting window opens.
› Select one of preset WMS charts from WMS name drop-down list or enter URI of WMS chart provider in the WMS URI text box and click the button. The list of downloaded layers are displayed in the window
› Select necessary layers and click . The selected layers will be loaded in FVO chart display area.
› To change URI of WMS chart provider or to select another layers click the icon.
URI of WMS chart provider
WMS chart layers
Figure 7. Setting of WMS chart provider
› To hide the map layer clear the checkbox at the right of layer name
› To hide all layers click the button
› To show all layers click the button
› To display chart borders select the Show chart borders checkbox
› To display the coordinate grid select the Show graticule checkbox
› To display the drawing scale select the Show gauge checkbox
› Click to save settings. The chart applet will reload showing of the selected layers.
• MapQuest OSM
• MapQuest Open Aerial
• Combined (Marine chart + Open StreetMap)
• Transas Tile
TRANSAS RESERVE THE RIGHT TO CHANGE THE SPECIFICATION WITHOUT PRIOR NOTICE
TRANSAS IS REGISTERED TRADEMARK
COPYRIGHT: © TRANSAS MIP LTD 1991–2014
18 FleetViewOnline ver. 4.2 User ManualUsing FleetViewOnline User Interface
The OpenStreetMap, MapQuest OSM and MapQuest Open Aerial charts have no adjustments.
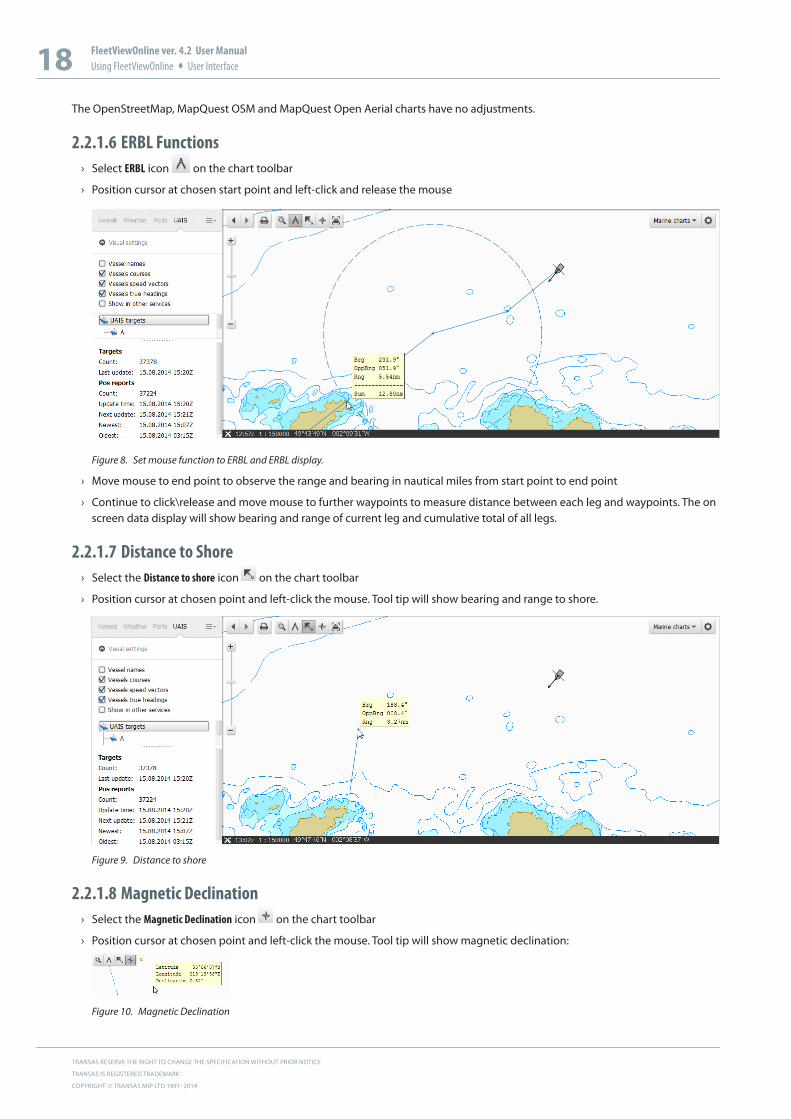
2.2.1.6 ERBL Functions › Select ERBL icon on the chart toolbar
› Position cursor at chosen start point and left-click and release the mouse
Figure 8. Set mouse function to ERBL and ERBL display.
› Move mouse to end point to observe the range and bearing in nautical miles from start point to end point
› Continue to click\release and move mouse to further waypoints to measure distance between each leg and waypoints. The on screen data display will show bearing and range of current leg and cumulative total of all legs.
2.2.1.7 Distance to Shore › Select the Distance to shore icon on the chart toolbar
› Position cursor at chosen point and left-click the mouse. Tool tip will show bearing and range to shore.
Figure 9. Distance to shore
2.2.1.8 Magnetic Declination › Select the Magnetic Declination icon on the chart toolbar
› Position cursor at chosen point and left-click the mouse. Tool tip will show magnetic declination:
Figure 10. Magnetic Declination
19 FleetViewOnline ver. 4.2 User ManualUsing FleetViewOnline User Interface
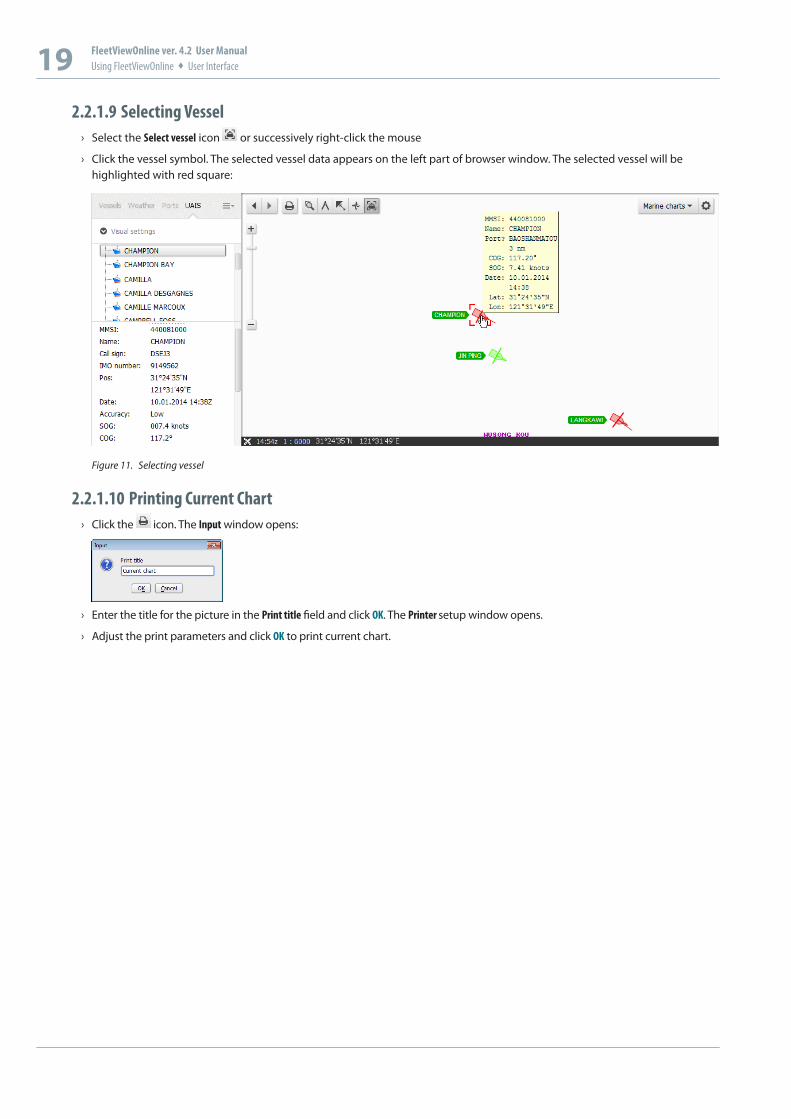
2.2.1.9 Selecting Vessel › Select the Select vessel icon or successively right-click the mouse
› Click the vessel symbol. The selected vessel data appears on the left part of browser window. The selected vessel will be highlighted with red square:
Figure 11. Selecting vessel
2.2.1.10 Printing Current Chart › Click the icon. The Input window opens:
› Enter the title for the picture in the Print title field and click OK. The Printer setup window opens.
› Adjust the print parameters and click OK to print current chart.
TRANSAS RESERVE THE RIGHT TO CHANGE THE SPECIFICATION WITHOUT PRIOR NOTICE
TRANSAS IS REGISTERED TRADEMARK
COPYRIGHT: © TRANSAS MIP LTD 1991–2014
20 FleetViewOnline ver. 4.2 User ManualUsing FleetViewOnline Vessel Monitoring
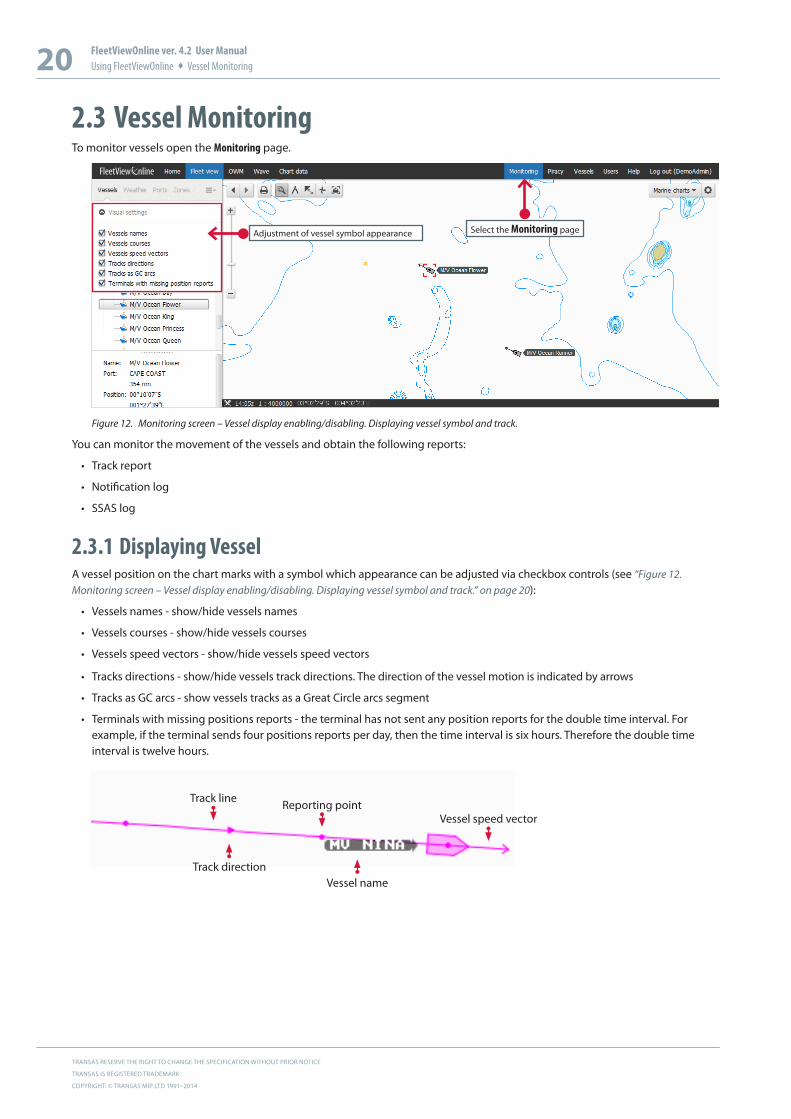
2.3 Vessel MonitoringTo monitor vessels open the Monitoring page.
Select the Monitoring pageAdjustment of vessel symbol appearance
Figure 12. Monitoring screen – Vessel display enabling/disabling. Displaying vessel symbol and track.
You can monitor the movement of the vessels and obtain the following reports:
• Track report
• Notification log
• SSAS log
2.3.1 Displaying VesselA vessel position on the chart marks with a symbol which appearance can be adjusted via checkbox controls (see “Figure 12. Monitoring screen – Vessel display enabling/disabling. Displaying vessel symbol and track.” on page 20):
• Vessels names - show/hide vessels names
• Vessels courses - show/hide vessels courses
• Vessels speed vectors - show/hide vessels speed vectors
• Tracks directions - show/hide vessels track directions. The direction of the vessel motion is indicated by arrows
• Tracks as GC arcs - show vessels tracks as a Great Circle arcs segment
• Terminals with missing positions reports - the terminal has not sent any position reports for the double time interval. For example, if the terminal sends four positions reports per day, then the time interval is six hours. Therefore the double time interval is twelve hours.
Track directionVessel name
Vessel speed vectorReporting pointTrack line
21 FleetViewOnline ver. 4.2 User ManualUsing FleetViewOnline Vessel Monitoring
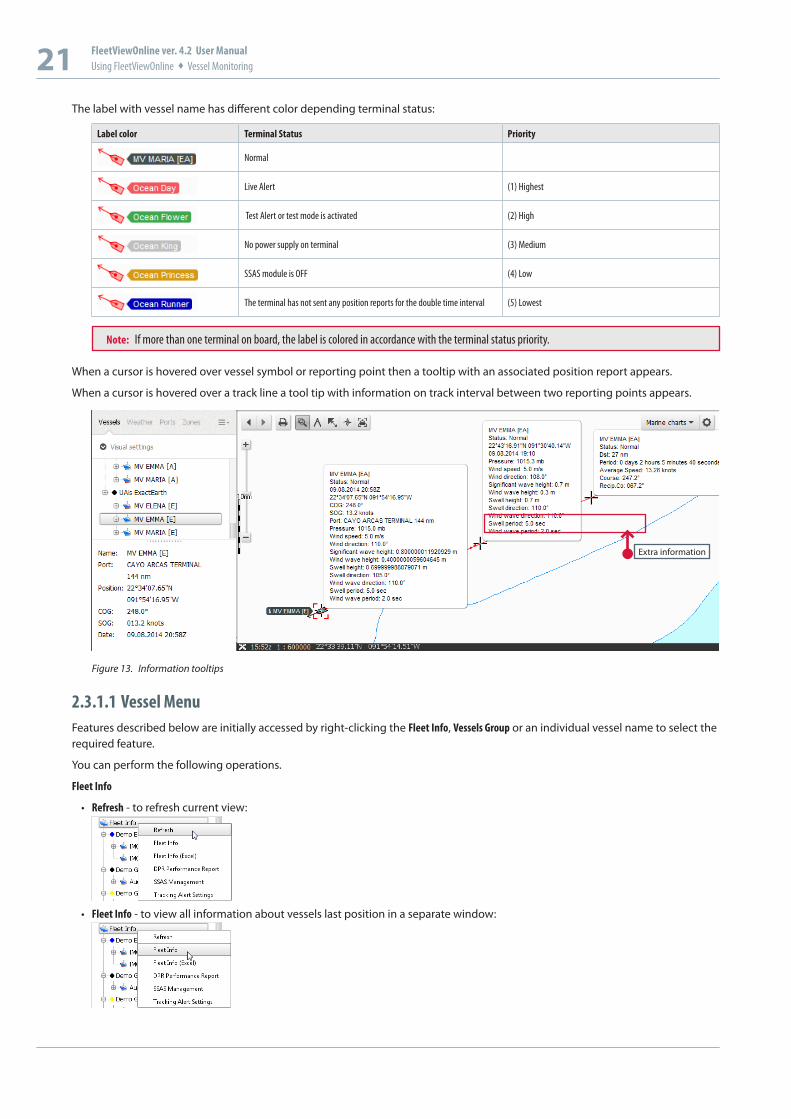
The label with vessel name has different color depending terminal status:
Label color Terminal Status Priority
Normal
Live Alert (1) Highest
Test Alert or test mode is activated (2) High
No power supply on terminal (3) Medium
SSAS module is OFF (4) Low
The terminal has not sent any position reports for the double time interval (5) Lowest
Note: If more than one terminal on board, the label is colored in accordance with the terminal status priority.
When a cursor is hovered over vessel symbol or reporting point then a tooltip with an associated position report appears.
When a cursor is hovered over a track line a tool tip with information on track interval between two reporting points appears.
Extra information
Figure 13. Information tooltips
2.3.1.1 Vessel MenuFeatures described below are initially accessed by right-clicking the Fleet Info, Vessels Group or an individual vessel name to select the required feature.
You can perform the following operations.
Fleet Info
• Refresh - to refresh current view:
• Fleet Info - to view all information about vessels last position in a separate window:

TRANSAS RESERVE THE RIGHT TO CHANGE THE SPECIFICATION WITHOUT PRIOR NOTICE
TRANSAS IS REGISTERED TRADEMARK
COPYRIGHT: © TRANSAS MIP LTD 1991–2014
22 FleetViewOnline ver. 4.2 User ManualUsing FleetViewOnline Vessel Monitoring
• Fleet Info (Excel) - to export all information about vessels last position in Excel file format:
• DPR Performance Report - to load the .xlsx file (Excel file format) with DPR Performance Report. The report helps owner to monitor terminal DPR rate to indicate in due time cases of under or over reporting:
• SSAS Management - to open the SSAS Management page (see chapter “2.7 SSAS Management” on page 65)
• Tracking Alert Setting - to set the schedule for sending E-mail alert messages about all terminals that have not been sent position reports within time interval specified by the Delay Limit parameter.
Schedule - Never, Daily or Weekly
Time - 8:00 UTS or 16:00 UTS
Day of Week - active when the Weekly option is selected in the Schedule drop-down menu
Delay Limit - maximum timeout of position report
EMail(s) - list of emails to send messages.
Vessels Group
• Color - to change color of symbol and track for all vessels in group
• SSAS Log - to view SSAS (message) log for all vessels in a separate window
23 FleetViewOnline ver. 4.2 User ManualUsing FleetViewOnline Vessel Monitoring
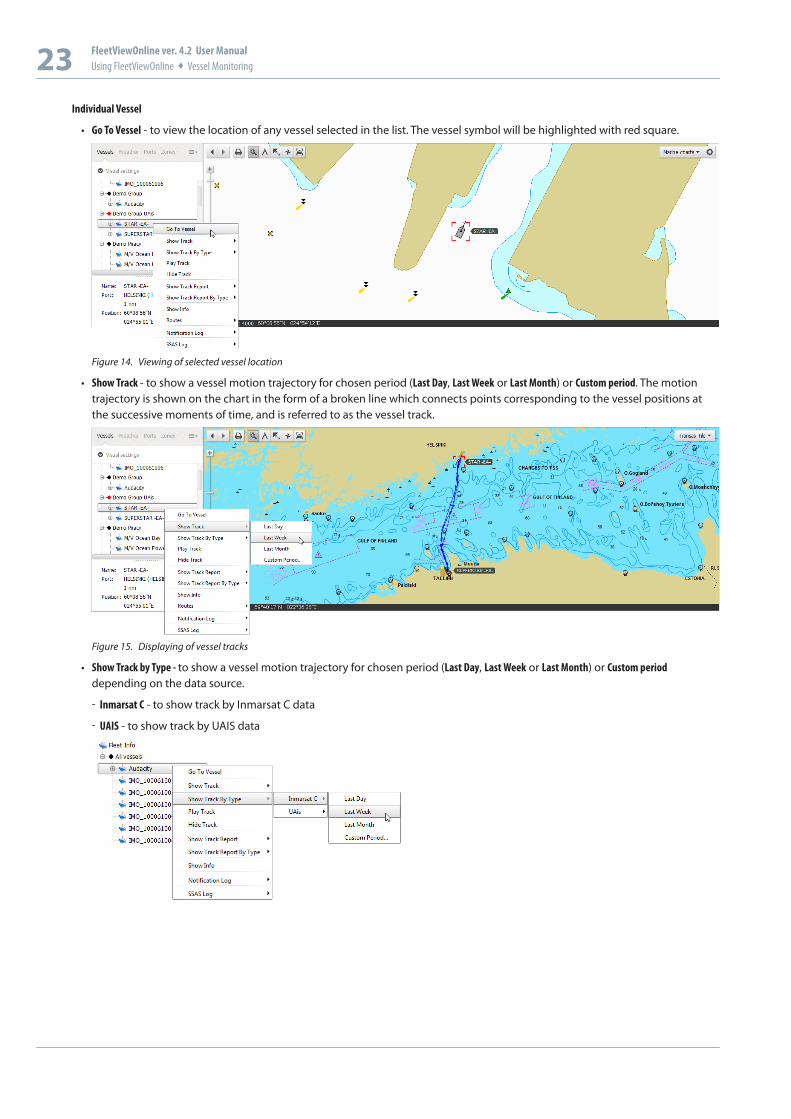
Individual Vessel
• Go To Vessel - to view the location of any vessel selected in the list. The vessel symbol will be highlighted with red square.
Figure 14. Viewing of selected vessel location
• Show Track - to show a vessel motion trajectory for chosen period (Last Day, Last Week or Last Month) or Custom period. The motion trajectory is shown on the chart in the form of a broken line which connects points corresponding to the vessel positions at the successive moments of time, and is referred to as the vessel track.
Figure 15. Displaying of vessel tracks
• Show Track by Type - to show a vessel motion trajectory for chosen period (Last Day, Last Week or Last Month) or Custom period depending on the data source.
ű Inmarsat C - to show track by Inmarsat C data
ű UAIS - to show track by UAIS data
TRANSAS RESERVE THE RIGHT TO CHANGE THE SPECIFICATION WITHOUT PRIOR NOTICE
TRANSAS IS REGISTERED TRADEMARK
COPYRIGHT: © TRANSAS MIP LTD 1991–2014
24 FleetViewOnline ver. 4.2 User ManualUsing FleetViewOnline Vessel Monitoring
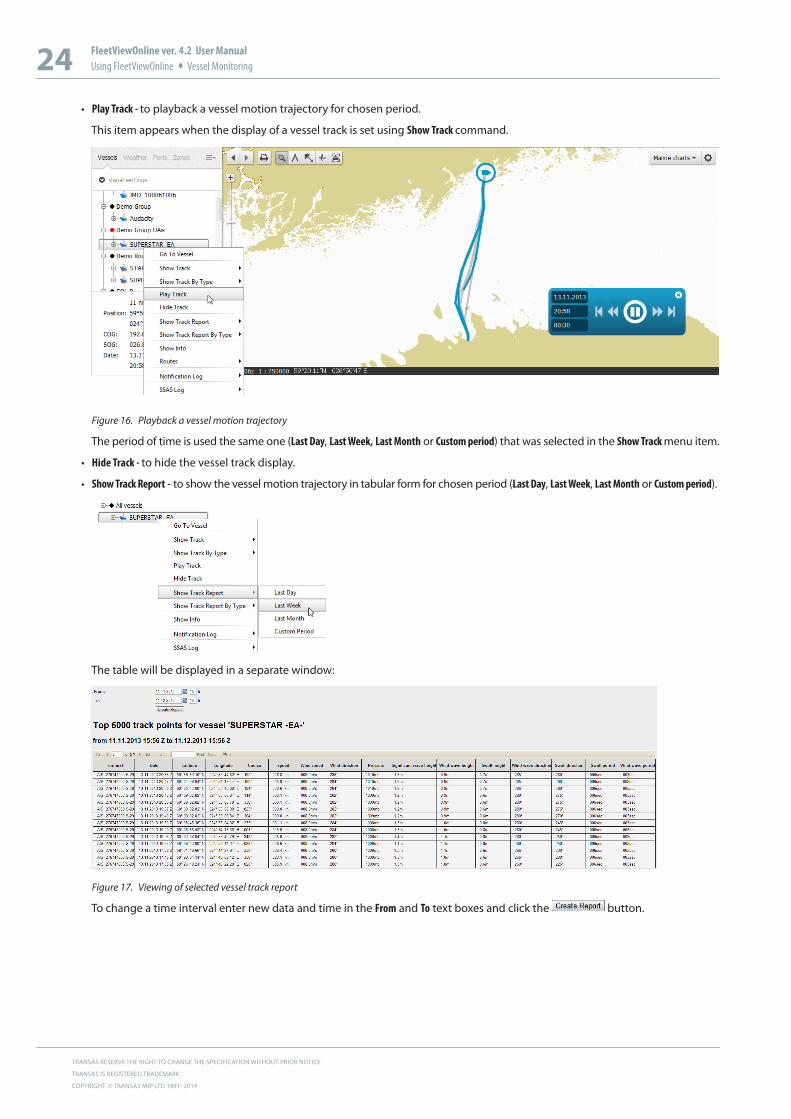
• Play Track - to playback a vessel motion trajectory for chosen period.
This item appears when the display of a vessel track is set using Show Track command.
Figure 16. Playback a vessel motion trajectory
The period of time is used the same one (Last Day, Last Week, Last Month or Custom period) that was selected in the Show Track menu item.
• Hide Track - to hide the vessel track display.
• Show Track Report - to show the vessel motion trajectory in tabular form for chosen period (Last Day, Last Week, Last Month or Custom period).
The table will be displayed in a separate window:
Figure 17. Viewing of selected vessel track report
To change a time interval enter new data and time in the From and To text boxes and click the button.
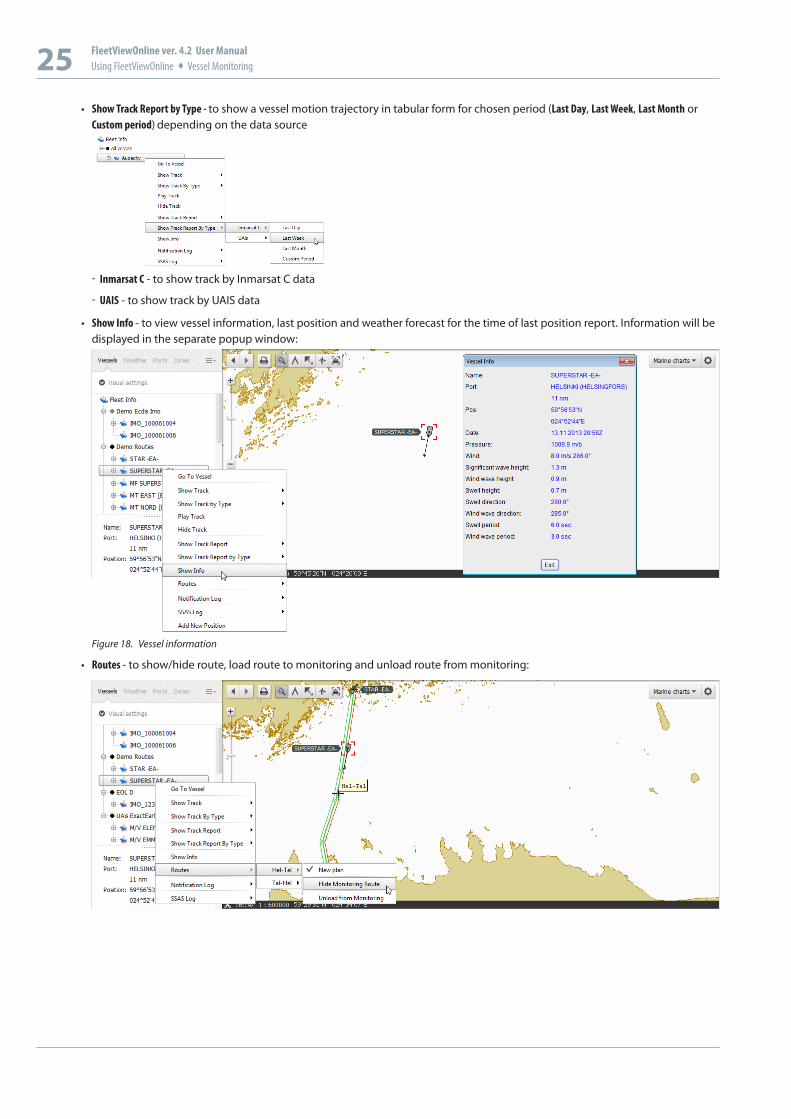
25 FleetViewOnline ver. 4.2 User ManualUsing FleetViewOnline Vessel Monitoring
• Show Track Report by Type - to show a vessel motion trajectory in tabular form for chosen period (Last Day, Last Week, Last Month or Custom period) depending on the data source
ű Inmarsat C - to show track by Inmarsat C data
ű UAIS - to show track by UAIS data
• Show Info - to view vessel information, last position and weather forecast for the time of last position report. Information will be displayed in the separate popup window:
Figure 18. Vessel information
• Routes - to show/hide route, load route to monitoring and unload route from monitoring:
TRANSAS RESERVE THE RIGHT TO CHANGE THE SPECIFICATION WITHOUT PRIOR NOTICE
TRANSAS IS REGISTERED TRADEMARK
COPYRIGHT: © TRANSAS MIP LTD 1991–2014
26 FleetViewOnline ver. 4.2 User ManualUsing FleetViewOnline Vessel Monitoring
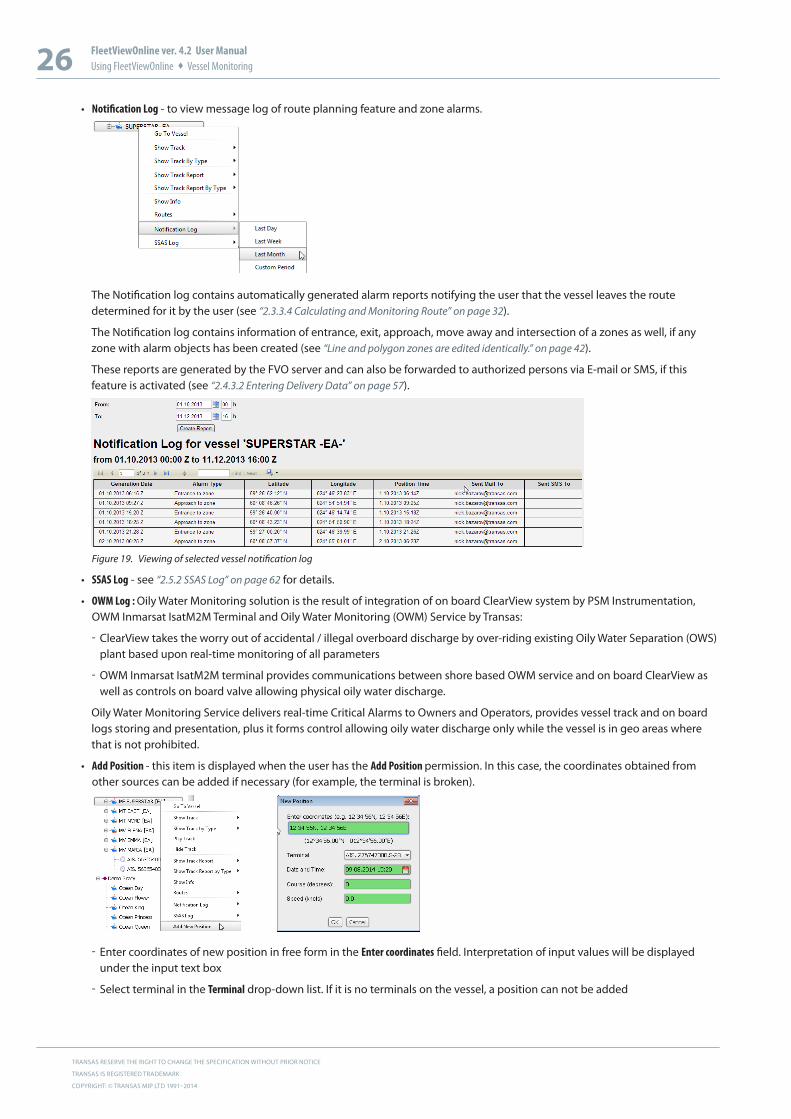
• Notification Log - to view message log of route planning feature and zone alarms.
The Notification log contains automatically generated alarm reports notifying the user that the vessel leaves the route determined for it by the user (see “2.3.3.4 Calculating and Monitoring Route” on page 32).
The Notification log contains information of entrance, exit, approach, move away and intersection of a zones as well, if any zone with alarm objects has been created (see “Line and polygon zones are edited identically.” on page 42).
These reports are generated by the FVO server and can also be forwarded to authorized persons via E-mail or SMS, if this feature is activated (see “2.4.3.2 Entering Delivery Data” on page 57).
Figure 19. Viewing of selected vessel notification log
• SSAS Log - see “2.5.2 SSAS Log” on page 62 for details.
• OWM Log : Oily Water Monitoring solution is the result of integration of on board ClearView system by PSM Instrumentation, OWM Inmarsat IsatM2M Terminal and Oily Water Monitoring (OWM) Service by Transas:
ű ClearView takes the worry out of accidental / illegal overboard discharge by over-riding existing Oily Water Separation (OWS) plant based upon real-time monitoring of all parameters
ű OWM Inmarsat IsatM2M terminal provides communications between shore based OWM service and on board ClearView as well as controls on board valve allowing physical oily water discharge.
Oily Water Monitoring Service delivers real-time Critical Alarms to Owners and Operators, provides vessel track and on board logs storing and presentation, plus it forms control allowing oily water discharge only while the vessel is in geo areas where that is not prohibited.
• Add Position - this item is displayed when the user has the Add Position permission. In this case, the coordinates obtained from other sources can be added if necessary (for example, the terminal is broken).
ű Enter coordinates of new position in free form in the Enter coordinates field. Interpretation of input values will be displayed under the input text box
ű Select terminal in the Terminal drop-down list. If it is no terminals on the vessel, a position can not be added
27 FleetViewOnline ver. 4.2 User ManualUsing FleetViewOnline Vessel Monitoring
ű Enter date and time of new position, vessel’s course and speed and click OK. The new position will be added to terminal and will be display on the vessel track.
Warning! Be careful when adding positions. Incorrect data can only be deleted by the FVO support team
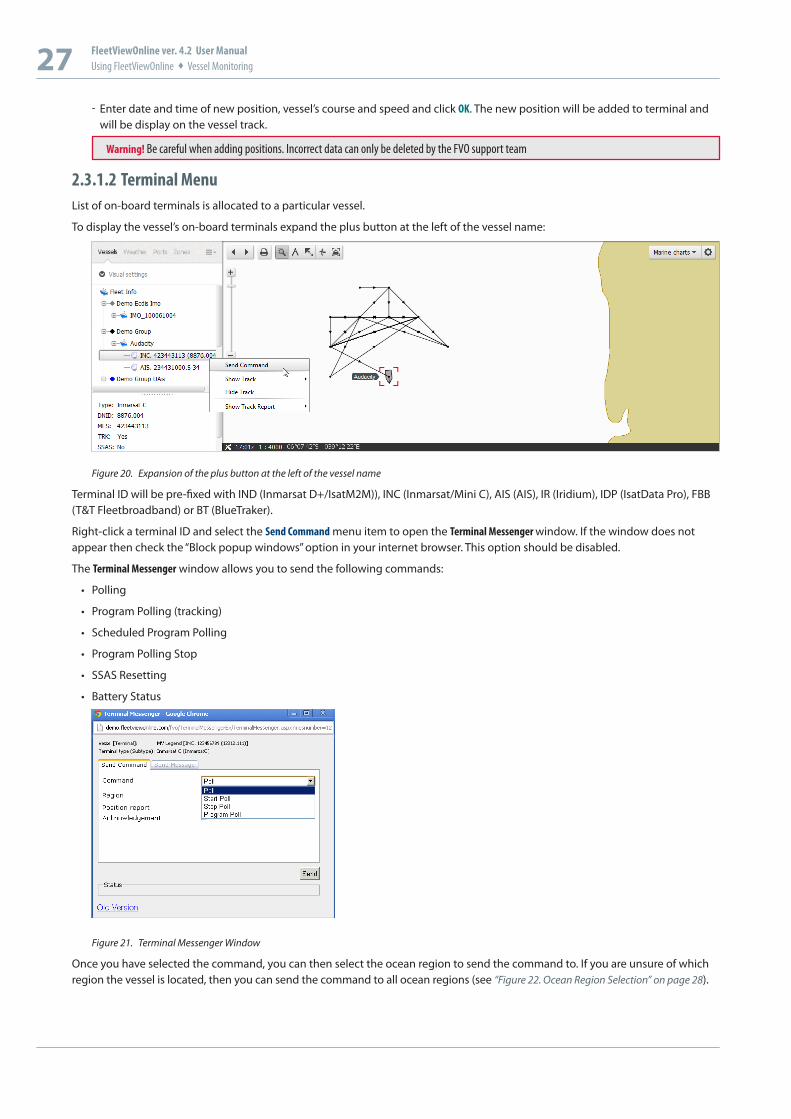
2.3.1.2 Terminal MenuList of on-board terminals is allocated to a particular vessel.
To display the vessel’s on-board terminals expand the plus button at the left of the vessel name:
Figure 20. Expansion of the plus button at the left of the vessel name
Terminal ID will be pre-fixed with IND (Inmarsat D+/IsatM2M)), INC (Inmarsat/Mini C), AIS (AIS), IR (Iridium), IDP (IsatData Pro), FBB (T&T Fleetbroadband) or BT (BlueTraker).
Right-click a terminal ID and select the Send Command menu item to open the Terminal Messenger window. If the window does not appear then check the “Block popup windows” option in your internet browser. This option should be disabled.
The Terminal Messenger window allows you to send the following commands:
• Polling
• Program Polling (tracking)
• Scheduled Program Polling
• Program Polling Stop
• SSAS Resetting
• Battery Status
Figure 21. Terminal Messenger Window
Once you have selected the command, you can then select the ocean region to send the command to. If you are unsure of which region the vessel is located, then you can send the command to all ocean regions (see “Figure 22. Ocean Region Selection” on page 28).
TRANSAS RESERVE THE RIGHT TO CHANGE THE SPECIFICATION WITHOUT PRIOR NOTICE
TRANSAS IS REGISTERED TRADEMARK
COPYRIGHT: © TRANSAS MIP LTD 1991–2014
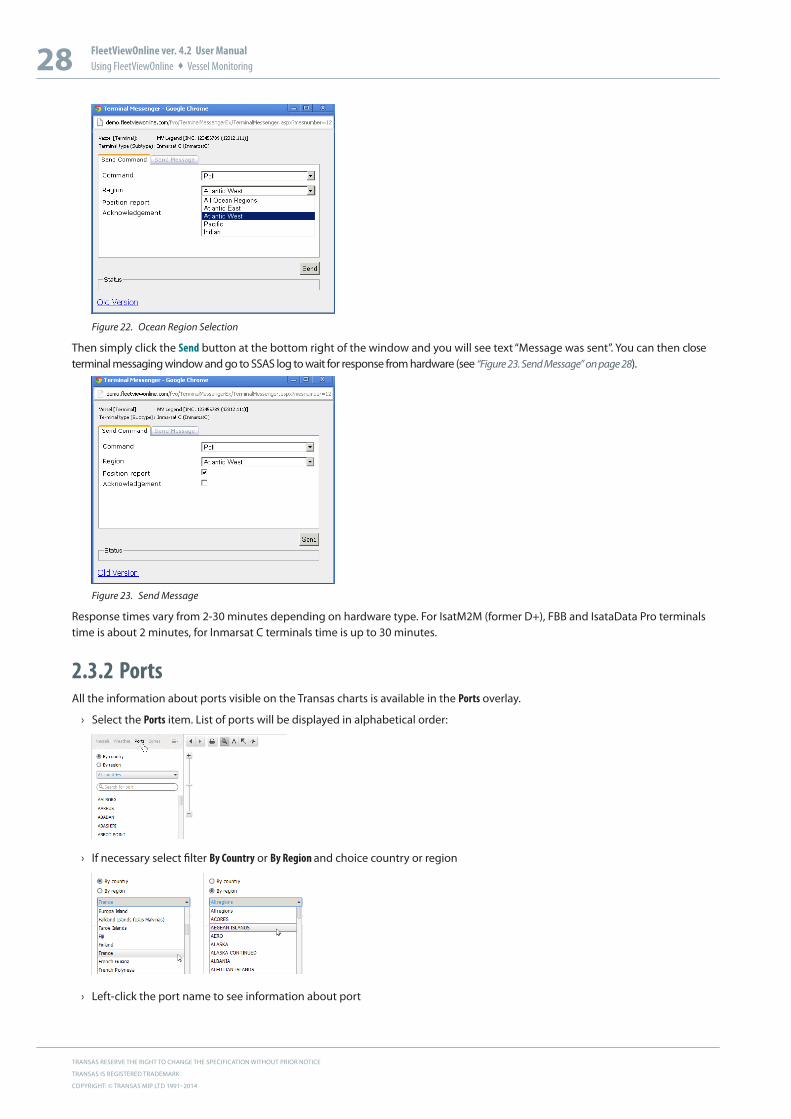
28 FleetViewOnline ver. 4.2 User ManualUsing FleetViewOnline Vessel Monitoring
Figure 22. Ocean Region Selection
Then simply click the Send button at the bottom right of the window and you will see text “Message was sent”. You can then close terminal messaging window and go to SSAS log to wait for response from hardware (see “Figure 23. Send Message” on page 28).
Figure 23. Send Message
Response times vary from 2-30 minutes depending on hardware type. For IsatM2M (former D+), FBB and IsataData Pro terminals time is about 2 minutes, for Inmarsat C terminals time is up to 30 minutes.
2.3.2 PortsAll the information about ports visible on the Transas charts is available in the Ports overlay.
› Select the Ports item. List of ports will be displayed in alphabetical order:
› If necessary select filter By Country or By Region and choice country or region
› Left-click the port name to see information about port
29 FleetViewOnline ver. 4.2 User ManualUsing FleetViewOnline Vessel Monitoring
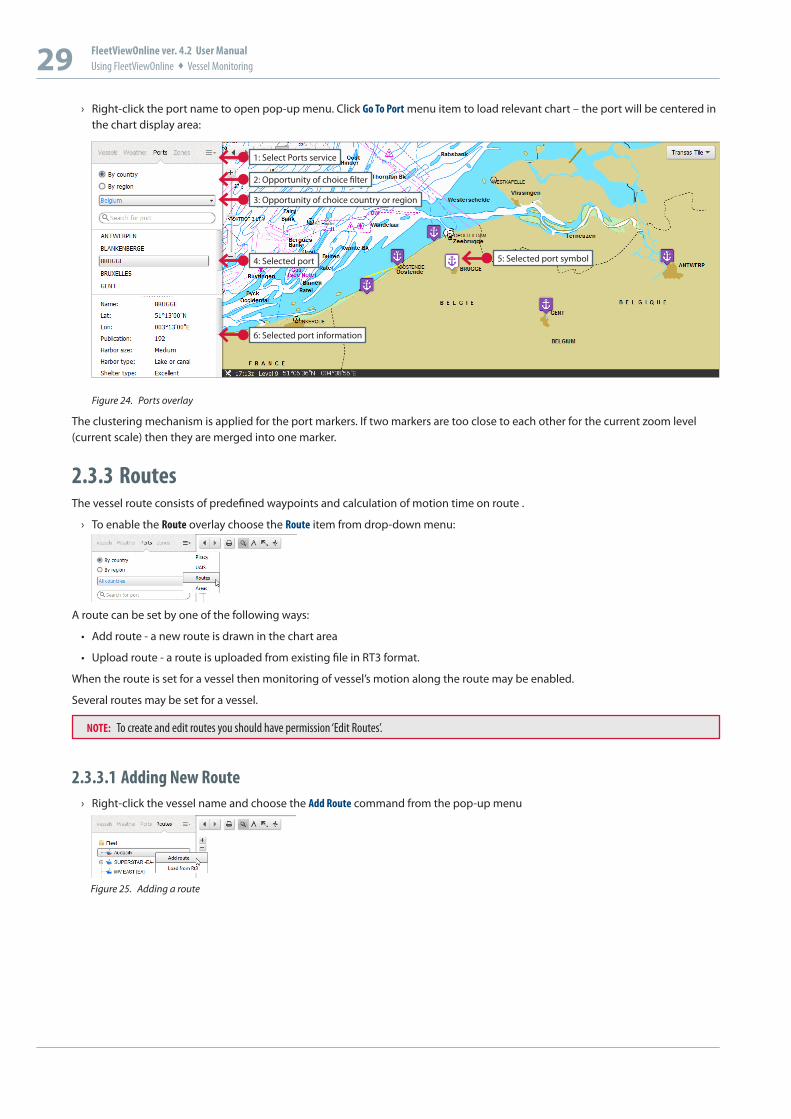
› Right-click the port name to open pop-up menu. Click Go To Port menu item to load relevant chart – the port will be centered in the chart display area:
6: Selected port information
1: Select Ports service
2: Opportunity of choice filter
3: Opportunity of choice country or region
5: Selected port symbol4: Selected port
Figure 24. Ports overlay
The clustering mechanism is applied for the port markers. If two markers are too close to each other for the current zoom level (current scale) then they are merged into one marker.
2.3.3 RoutesThe vessel route consists of predefined waypoints and calculation of motion time on route .
› To enable the Route overlay choose the Route item from drop-down menu:
A route can be set by one of the following ways:
• Add route - a new route is drawn in the chart area
• Upload route - a route is uploaded from existing file in RT3 format.
When the route is set for a vessel then monitoring of vessel’s motion along the route may be enabled.
Several routes may be set for a vessel.
NOTE: To create and edit routes you should have permission ‘Edit Routes’.
2.3.3.1 Adding New Route › Right-click the vessel name and choose the Add Route command from the pop-up menu
Figure 25. Adding a route
TRANSAS RESERVE THE RIGHT TO CHANGE THE SPECIFICATION WITHOUT PRIOR NOTICE
TRANSAS IS REGISTERED TRADEMARK
COPYRIGHT: © TRANSAS MIP LTD 1991–2014
30 FleetViewOnline ver. 4.2 User ManualUsing FleetViewOnline Vessel Monitoring
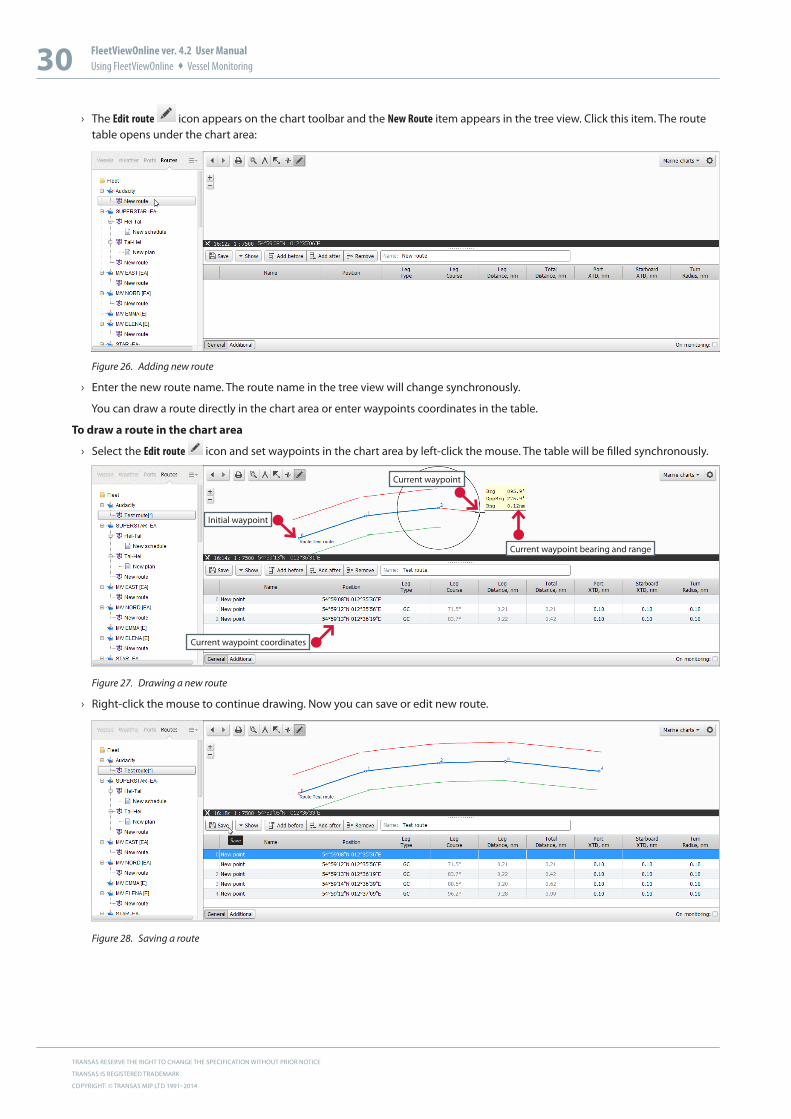
› The Edit route icon appears on the chart toolbar and the New Route item appears in the tree view. Click this item. The route table opens under the chart area:
Figure 26. Adding new route
› Enter the new route name. The route name in the tree view will change synchronously.
You can draw a route directly in the chart area or enter waypoints coordinates in the table.
To draw a route in the chart area
› Select the Edit route icon and set waypoints in the chart area by left-click the mouse. The table will be filled synchronously.
Current waypoint coordinates
Current waypoint bearing and range
Current waypoint
Initial waypoint
Figure 27. Drawing a new route
› Right-click the mouse to continue drawing. Now you can save or edit new route.
Figure 28. Saving a route
31 FleetViewOnline ver. 4.2 User ManualUsing FleetViewOnline Vessel Monitoring
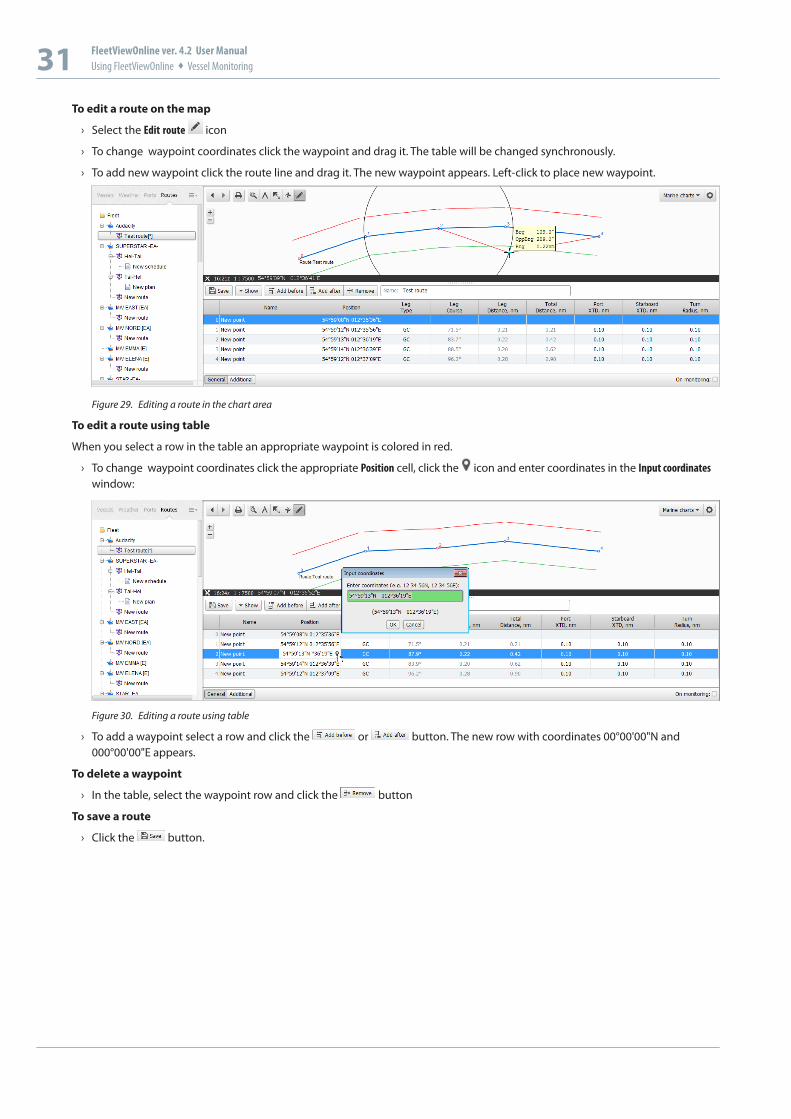
To edit a route on the map
› Select the Edit route icon
› To change waypoint coordinates click the waypoint and drag it. The table will be changed synchronously.
› To add new waypoint click the route line and drag it. The new waypoint appears. Left-click to place new waypoint.
Figure 29. Editing a route in the chart area
To edit a route using table
When you select a row in the table an appropriate waypoint is colored in red.
› To change waypoint coordinates click the appropriate Position cell, click the icon and enter coordinates in the Input coordinates window:
Figure 30. Editing a route using table
› To add a waypoint select a row and click the or button. The new row with coordinates 00°00'00"N and 000°00'00"E appears.
To delete a waypoint
› In the table, select the waypoint row and click the button
To save a route
› Click the button.
TRANSAS RESERVE THE RIGHT TO CHANGE THE SPECIFICATION WITHOUT PRIOR NOTICE
TRANSAS IS REGISTERED TRADEMARK
COPYRIGHT: © TRANSAS MIP LTD 1991–2014
32 FleetViewOnline ver. 4.2 User ManualUsing FleetViewOnline Vessel Monitoring
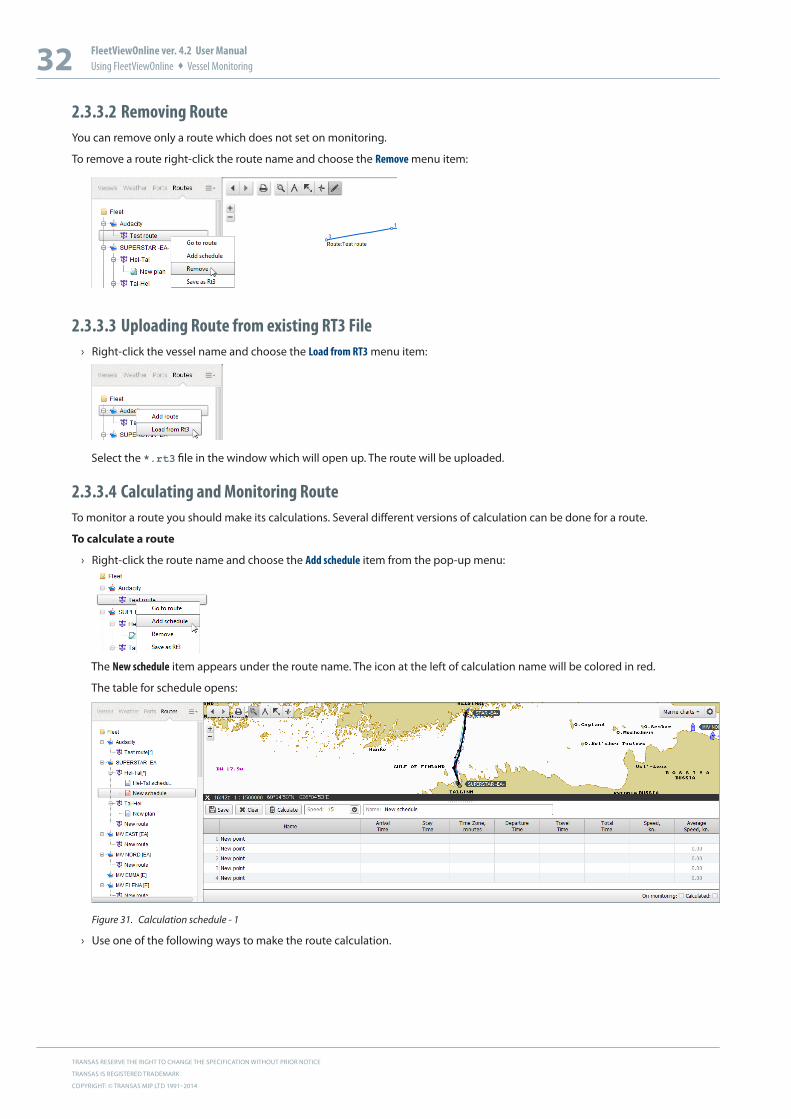
2.3.3.2 Removing RouteYou can remove only a route which does not set on monitoring.
To remove a route right-click the route name and choose the Remove menu item:
2.3.3.3 Uploading Route from existing RT3 File › Right-click the vessel name and choose the Load from RT3 menu item:
Select the *.rt3 file in the window which will open up. The route will be uploaded.
2.3.3.4 Calculating and Monitoring RouteTo monitor a route you should make its calculations. Several different versions of calculation can be done for a route.
To calculate a route
› Right-click the route name and choose the Add schedule item from the pop-up menu:
The New schedule item appears under the route name. The icon at the left of calculation name will be colored in red.
The table for schedule opens:
Figure 31. Calculation schedule - 1
› Use one of the following ways to make the route calculation.

33 FleetViewOnline ver. 4.2 User ManualUsing FleetViewOnline Vessel Monitoring
The first way:
ű For the start waypoint enter the Departure Time
ű Set the average Speed (in knots) on route
ű Moreover, you can enter Arrival Time, Stay Time, Departure Time and Speed for any other waypoints if it is necessary
Figure 32. Calculation schedule -2
ű Click the button.
The second way:
ű For the start waypoint enter the Departure Time
ű For the end way point enter the Arrival time
Figure 33. Calculation schedule -3
ű Click the button.
How to enter Departure Time and Arrival Time in the table
Double-click the cell to be entered date and time. It activates.
Click the icon to select the departure or arrival date in the calendar.
The selected date and current time appears in the cell.
To change time double-click the time group and enter new value.
The route schedule will be calculated in the table where each waypoint is provided with the following information:
ű Arrival Time
ű Stay Time
ű Departure Time
ű Travel Time
ű Total Time
ű Average vessel speed in knots.
TRANSAS RESERVE THE RIGHT TO CHANGE THE SPECIFICATION WITHOUT PRIOR NOTICE
TRANSAS IS REGISTERED TRADEMARK
COPYRIGHT: © TRANSAS MIP LTD 1991–2014
34 FleetViewOnline ver. 4.2 User ManualUsing FleetViewOnline Vessel Monitoring
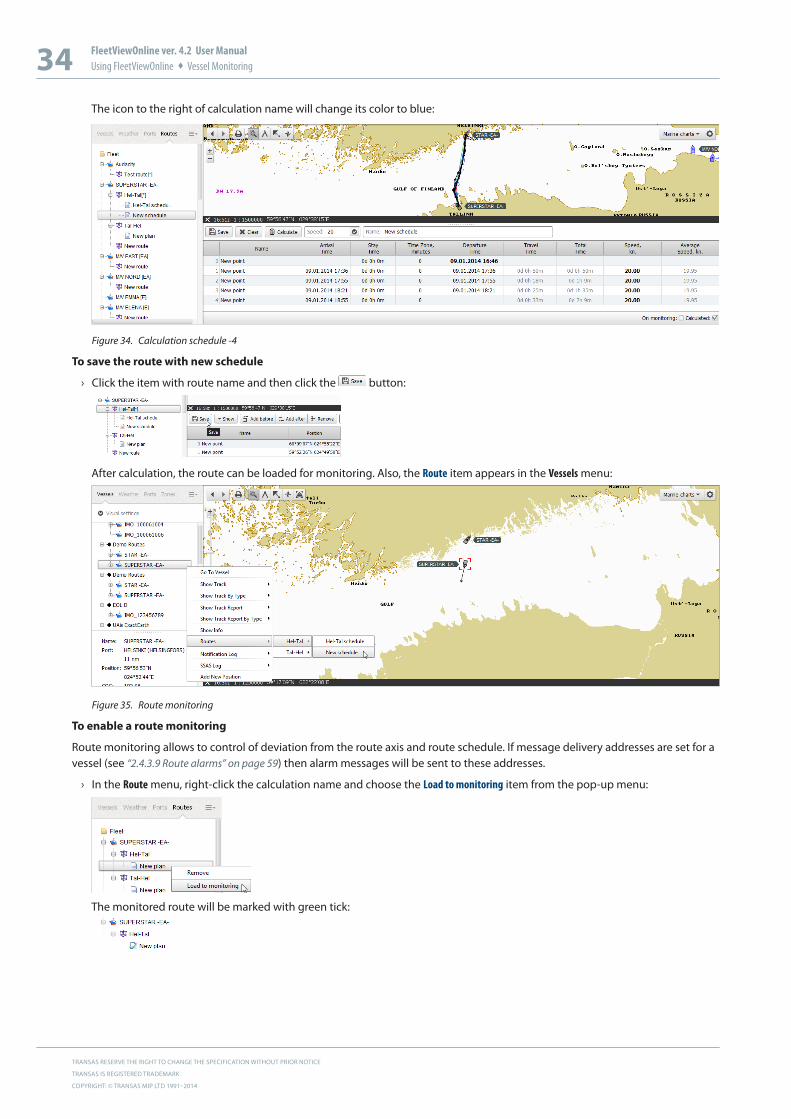
The icon to the right of calculation name will change its color to blue:
Figure 34. Calculation schedule -4
To save the route with new schedule
› Click the item with route name and then click the button:
After calculation, the route can be loaded for monitoring. Also, the Route item appears in the Vessels menu:
Figure 35. Route monitoring
To enable a route monitoring
Route monitoring allows to control of deviation from the route axis and route schedule. If message delivery addresses are set for a vessel (see “2.4.3.9 Route alarms” on page 59) then alarm messages will be sent to these addresses.
› In the Route menu, right-click the calculation name and choose the Load to monitoring item from the pop-up menu:
The monitored route will be marked with green tick:
35 FleetViewOnline ver. 4.2 User ManualUsing FleetViewOnline Vessel Monitoring
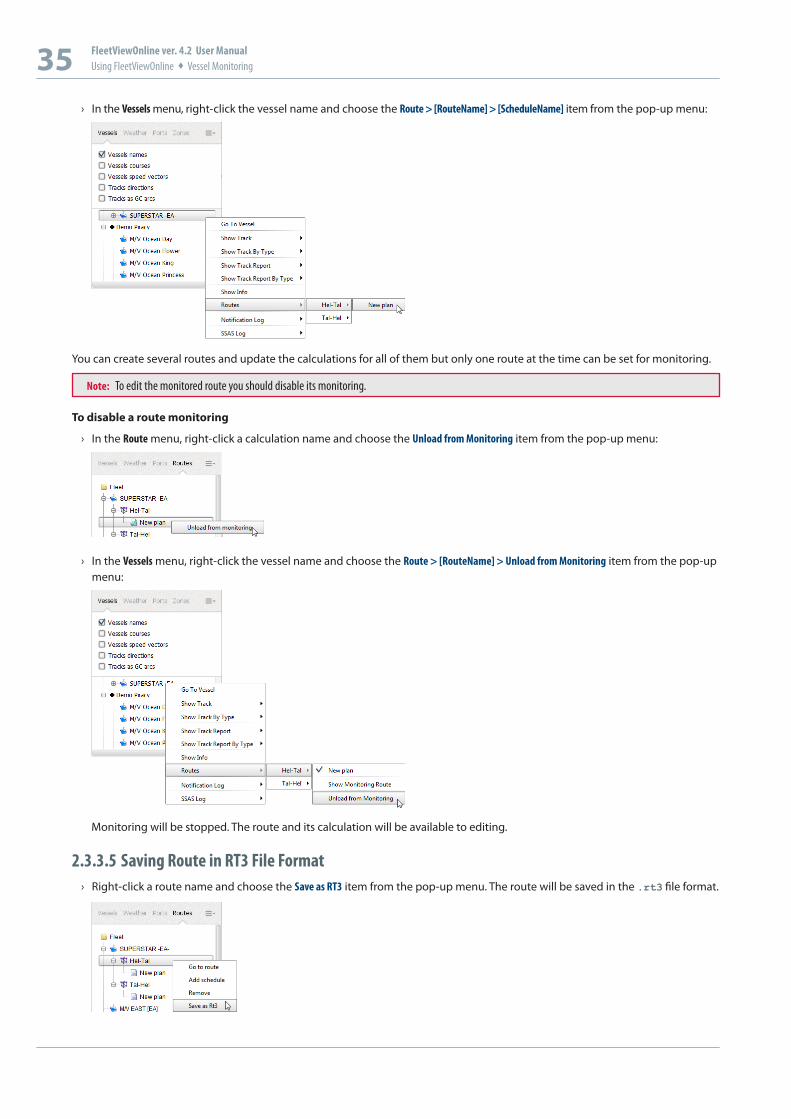
› In the Vessels menu, right-click the vessel name and choose the Route > [RouteName] > [ScheduleName] item from the pop-up menu:
You can create several routes and update the calculations for all of them but only one route at the time can be set for monitoring.
Note: To edit the monitored route you should disable its monitoring.
To disable a route monitoring
› In the Route menu, right-click a calculation name and choose the Unload from Monitoring item from the pop-up menu:
› In the Vessels menu, right-click the vessel name and choose the Route > [RouteName] > Unload from Monitoring item from the pop-up menu:
Monitoring will be stopped. The route and its calculation will be available to editing.
2.3.3.5 Saving Route in RT3 File Format › Right-click a route name and choose the Save as RT3 item from the pop-up menu. The route will be saved in the .rt3 file format.
TRANSAS RESERVE THE RIGHT TO CHANGE THE SPECIFICATION WITHOUT PRIOR NOTICE
TRANSAS IS REGISTERED TRADEMARK
COPYRIGHT: © TRANSAS MIP LTD 1991–2014
36 FleetViewOnline ver. 4.2 User ManualUsing FleetViewOnline Vessel Monitoring
2.3.4 Weather Weather data is provided by Applied Weather Technology. The weather forecast is issued:
• For five days into the future
• Four times a day about 0.0 Z, 6.0 Z, 12.0 Z and 18.0 Z
• At nodes of the uniform grid with cell size of 2.5°х2.5° from 77.5°S to 77.5°N latitude.
Only last forecast issue can be displayed.
To adjust the Weather overlay choose the Weather tab:
Figure 36. Selecting Weather overlay
Weather overlay allows you to:
• Display/hide weather overlay on chart
• Select weather advance period for forecasting purposes
• Show weather animation
• Advance manually weather display according to time interval selected
• Control displaying of isobars, wind information, significant wave height, wind and swell waves, currents, tides and ice
• Display tropical storm data graphically or in tabular format.
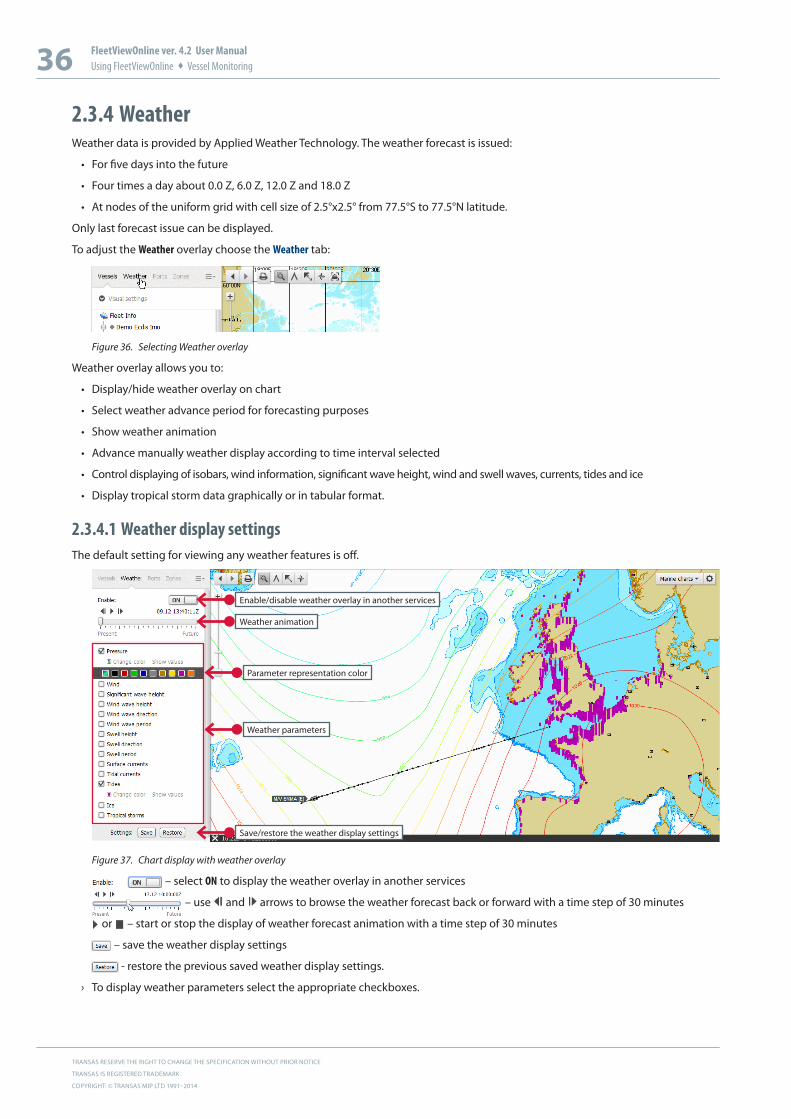
2.3.4.1 Weather display settingsThe default setting for viewing any weather features is off.
Weather parameters
Enable/disable weather overlay in another services
Save/restore the weather display settings
Weather animation
Parameter representation color
Figure 37. Chart display with weather overlay
– select ON to display the weather overlay in another services
– use and arrows to browse the weather forecast back or forward with a time step of 30 minutes
or – start or stop the display of weather forecast animation with a time step of 30 minutes
– save the weather display settings
- restore the previous saved weather display settings.
› To display weather parameters select the appropriate checkboxes.
37 FleetViewOnline ver. 4.2 User ManualUsing FleetViewOnline Vessel Monitoring
The following settings can be done for the displaying of the weather parameters:
• To specify the parameter representation color click the link and select a color from available colors
• To display parameters in gradient color select . In this case, the colour for displaying of parameter value will be selected depending on its value from 280° to 0° on a Hue scale in the HLV colour model:
Minimum value Maximum value
• Most of weather parameters are displayed by default in the form of isoline. To display the parameter value in the nodes of the uniform grid click the link.
The following weather parameters can be display:
ű Pressure - atmospheric pressure value in hectopascal (hPa.)
ű Wind - wind direction displaying using weather symbols (see “2.3.4.2 Weather symbols” on page 38) or wind speed in meter per second (m/s)
ű Significant wave height – significant wave height in meters
ű Wind wave height – height of wind-generated waves in meters
ű Wind wave direction – direction of wind-generated waves in degrees
ű Wind wave period – period of wind-generated waves in seconds
ű Swell height – swell height in meters
ű Swell direction – swell direction in degrees
ű Swell period – swell period in seconds
ű Surface currents – surface current in knots. By default, the surface currents are shown as a vector. Information on the surface currents was created after the processing of the primary data of the American National Ocean Data Centre (NODC and NOAA). Representation of the surface currents are changed once a month for the year. This data can not be used for navigation.
ű Tides - the calculated tidal height in meters. By default, the tide values are shown as a column chart. The calculation process is based on Simplified Harmonic Method of Tidal Predictions using of four Main harmonics from Admiralty Tide Tables. Results of the used method may have minor difference with published Admiralty Tide Tables or other prediction software, which use more harmonic constituents.
ű Tidal currents - the calculated value of tidal currents in knots. By default, the tidal currents are shown as a vector. Tidal current values are calculated for every hour relatively the high water (HW) in the nearest position of tabulated tidal stream data with designation which are provided on paper nautical charts, in the official editions of atlases and tables. The tidal currents are calculated and displayed separate from surface currents.
Disclaimer! All surface current data, tide and tidal current predictions are not for navigation but for information only. Do not rely solely on these tidal predictions especially if life or property are at stake. You should not use these tidal predictions if anyone or anything could come to harm as a result of an incorrect tide prediction. The entire risk as to the using of aforementioned data is with you.
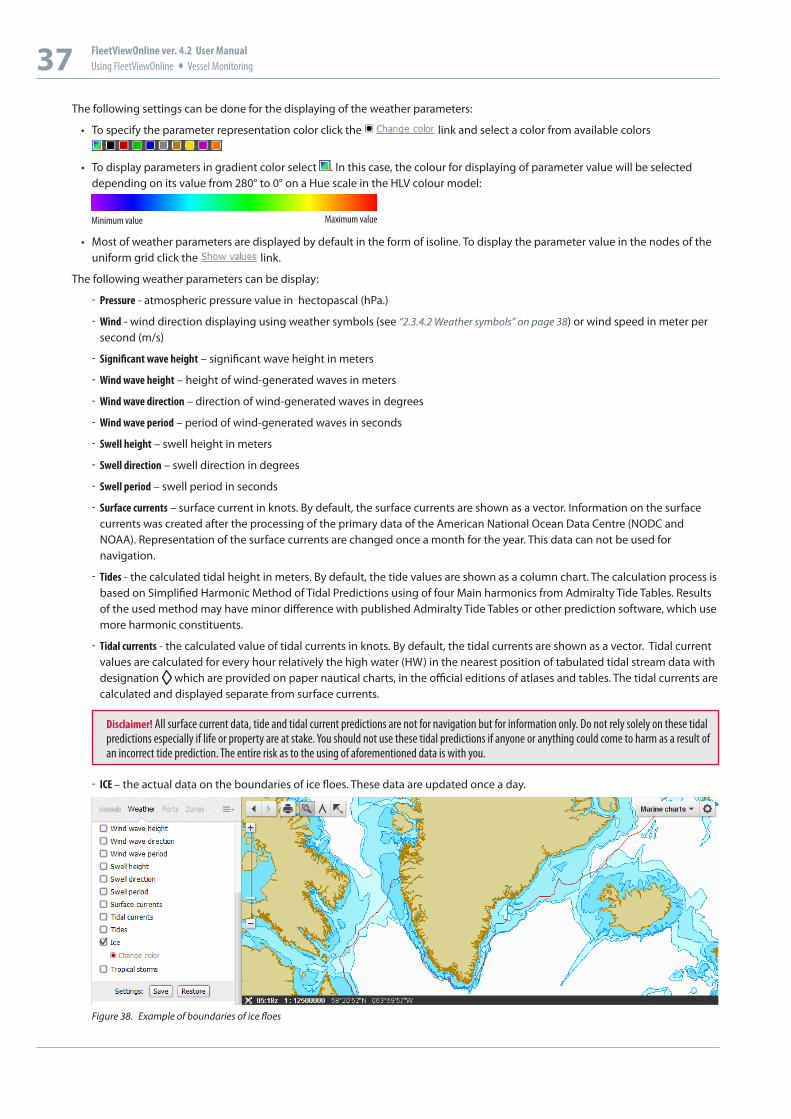
ű ICE – the actual data on the boundaries of ice floes. These data are updated once a day.
Figure 38. Example of boundaries of ice floes

TRANSAS RESERVE THE RIGHT TO CHANGE THE SPECIFICATION WITHOUT PRIOR NOTICE
TRANSAS IS REGISTERED TRADEMARK
COPYRIGHT: © TRANSAS MIP LTD 1991–2014
38 FleetViewOnline ver. 4.2 User ManualUsing FleetViewOnline Vessel Monitoring
ű Tropical storm – tropical storms are displayed if they exist or are forecasted for the nearest five days.
Figure 39. Example of tropical storm
ű Tropical Storm Data button– tropical storms data in tabular format in separate window.
Figure 40. Example of tropical storm data
2.3.4.2 Weather symbolsWind speed symbols.
A combination of long/short barbs and pennants indicate the speed of the wind in station weather plots rounded to the nearest 5 knots. Calm wind is indicated by a circle.
One long barb is used to indicate each 10 knots with the short barb representing 5 knots. At 50 knots, the barbs changes to a pennant. For wind speeds higher than 50 knots, long and short barbs are used again in combination with the pennant(s).w
The wind direction is indicated by the long shaft. The shaft will point to the direction FROM which the wind is blowing. The direction is based upon a 36th point compass.
Observed wind speed
0 kts(Calm)
1-2 kts(3-8 mph)
3-7 kts(3-8 mph)
8-12 kts(9-14 mph)
13-17 kts(15-20 mph)
18-22 kts(21-25 mph)
23-27 kts(26-31 mph)
28-32 kts(32-37 mph)
Rounded to the nearest 5
0 kts 0 kts 5 kts 10 kts 15 kts 20 kts 25 kts 30 kts
Plotted as
Observed wind speed
33-37 kts(38-43 mph)
48-52 kts(55-60 mph)
53-57 kts(61-66 mph)
58-62 kts(67-71 mph)
63-67 kts(73-77 mph)
68-72 kts(78-83 mph)
98-102 kts(113-117 mph)
103-107 kts(119-123 mph)
Rounded to the nearest 5
35 kts 50 kts 55 kts 60 kts 65 kts 70 kts 100 kts 105 kts
Plotted as
Table 1. Wind speed symbols
39 FleetViewOnline ver. 4.2 User ManualUsing FleetViewOnline Vessel Monitoring
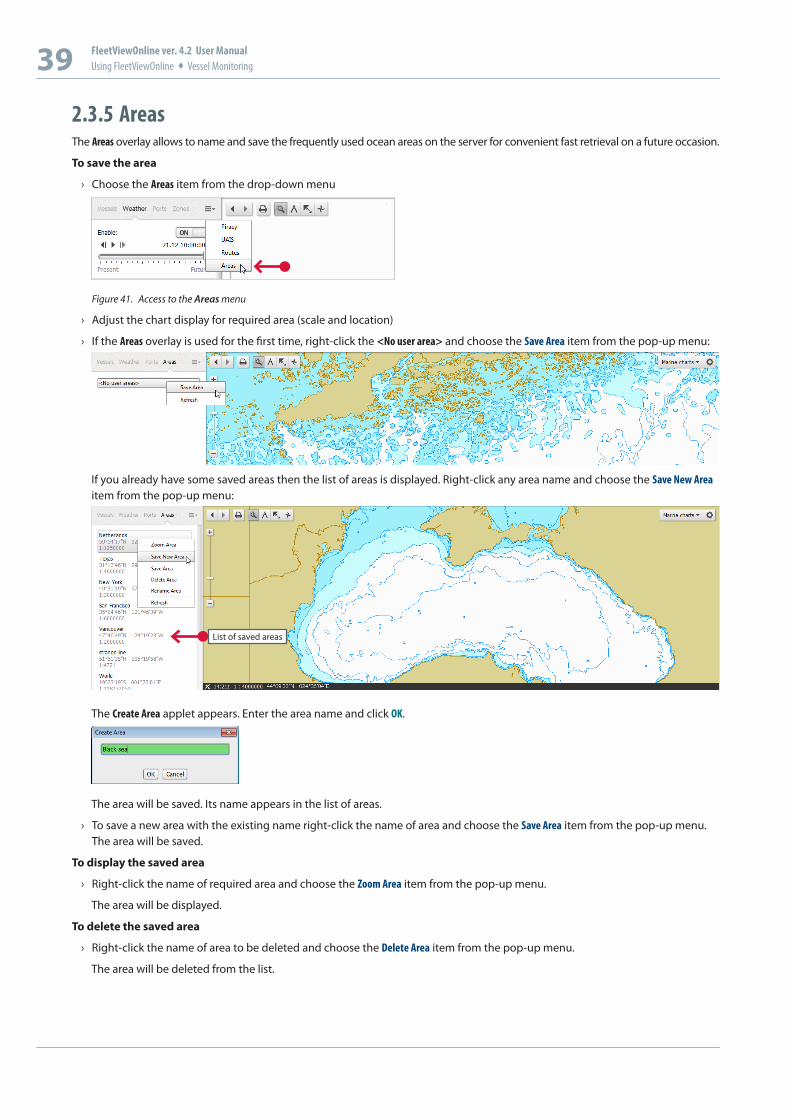
2.3.5 AreasThe Areas overlay allows to name and save the frequently used ocean areas on the server for convenient fast retrieval on a future occasion.
To save the area
› Choose the Areas item from the drop-down menu
Figure 41. Access to the Areas menu
› Adjust the chart display for required area (scale and location)
› If the Areas overlay is used for the first time, right-click the <No user area> and choose the Save Area item from the pop-up menu:
If you already have some saved areas then the list of areas is displayed. Right-click any area name and choose the Save New Area item from the pop-up menu:
List of saved areas
The Create Area applet appears. Enter the area name and click OK.
The area will be saved. Its name appears in the list of areas.
› To save a new area with the existing name right-click the name of area and choose the Save Area item from the pop-up menu. The area will be saved.
To display the saved area
› Right-click the name of required area and choose the Zoom Area item from the pop-up menu.
The area will be displayed.
To delete the saved area
› Right-click the name of area to be deleted and choose the Delete Area item from the pop-up menu.
The area will be deleted from the list.
TRANSAS RESERVE THE RIGHT TO CHANGE THE SPECIFICATION WITHOUT PRIOR NOTICE
TRANSAS IS REGISTERED TRADEMARK
COPYRIGHT: © TRANSAS MIP LTD 1991–2014
40 FleetViewOnline ver. 4.2 User ManualUsing FleetViewOnline Vessel Monitoring
To rename the saved area
› Right-click the name of area to be renamed and choose the Rename Area item from the pop-up menu.
The Rename Area applet appears. Enter the area name and click OK.
The area will be renamed.
To refresh the list of saved area
› Right-click any area name and choose the Refresh item from the pop-up menu to synchronize with the server data.
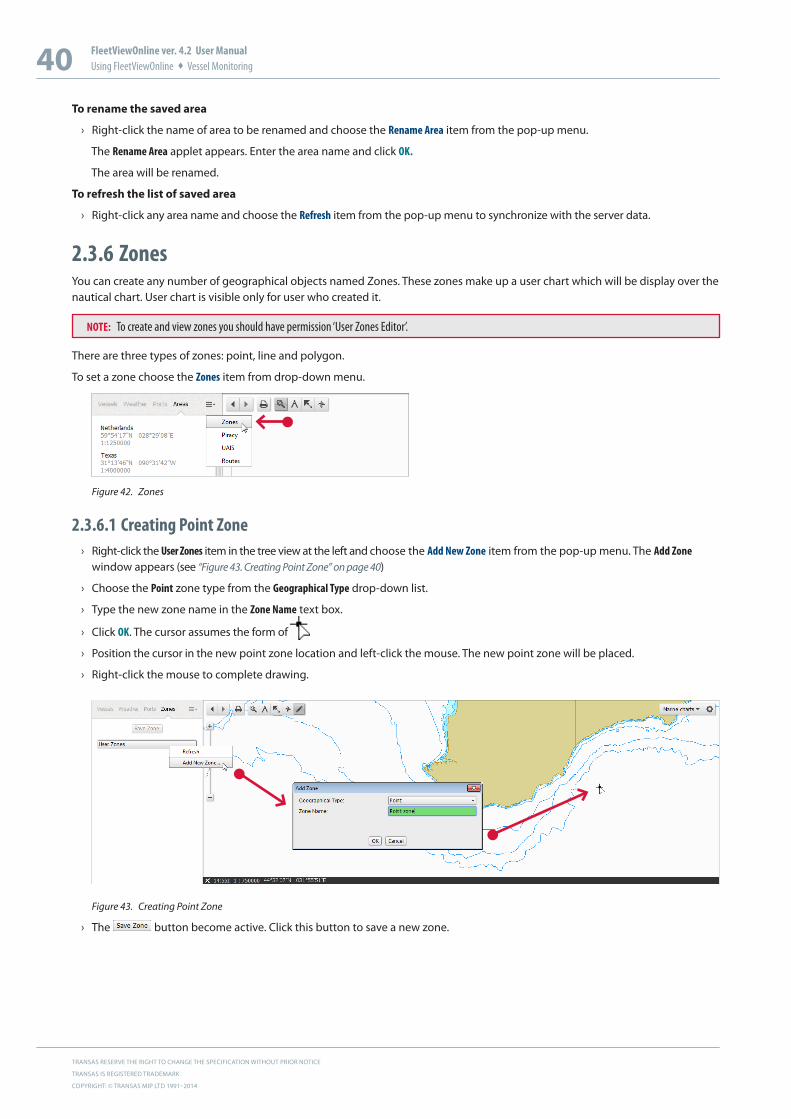
2.3.6 ZonesYou can create any number of geographical objects named Zones. These zones make up a user chart which will be display over the nautical chart. User chart is visible only for user who created it.
NOTE: To create and view zones you should have permission ‘User Zones Editor’.
There are three types of zones: point, line and polygon.
To set a zone choose the Zones item from drop-down menu.
Figure 42. Zones
2.3.6.1 Creating Point Zone › Right-click the User Zones item in the tree view at the left and choose the Add New Zone item from the pop-up menu. The Add Zone
window appears (see “Figure 43. Creating Point Zone” on page 40)
› Choose the Point zone type from the Geographical Type drop-down list.
› Type the new zone name in the Zone Name text box.
› Click OK. The cursor assumes the form of
› Position the cursor in the new point zone location and left-click the mouse. The new point zone will be placed.
› Right-click the mouse to complete drawing.
Figure 43. Creating Point Zone
› The button become active. Click this button to save a new zone.
41 FleetViewOnline ver. 4.2 User ManualUsing FleetViewOnline Vessel Monitoring
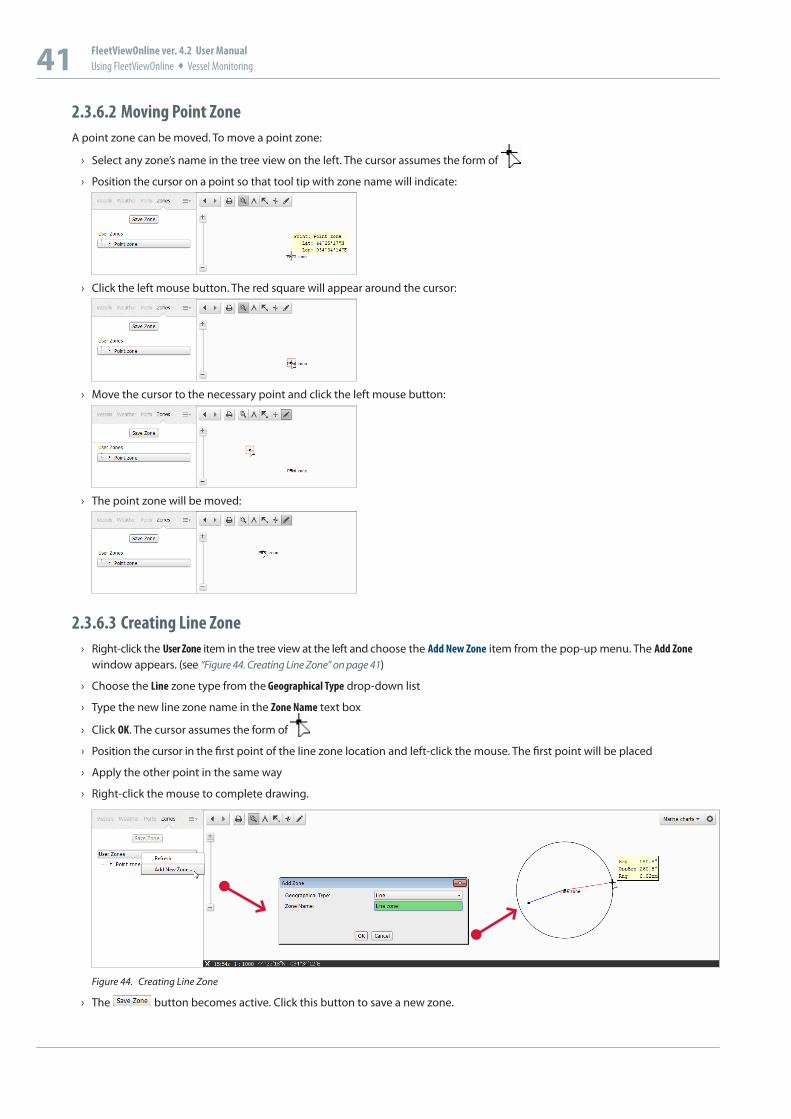
2.3.6.2 Moving Point ZoneA point zone can be moved. To move a point zone:
› Select any zone’s name in the tree view on the left. The cursor assumes the form of
› Position the cursor on a point so that tool tip with zone name will indicate:
› Click the left mouse button. The red square will appear around the cursor:
› Move the cursor to the necessary point and click the left mouse button:
› The point zone will be moved:
2.3.6.3 Creating Line Zone › Right-click the User Zone item in the tree view at the left and choose the Add New Zone item from the pop-up menu. The Add Zone
window appears. (see “Figure 44. Creating Line Zone” on page 41)
› Choose the Line zone type from the Geographical Type drop-down list
› Type the new line zone name in the Zone Name text box
› Click OK. The cursor assumes the form of
› Position the cursor in the first point of the line zone location and left-click the mouse. The first point will be placed
› Apply the other point in the same way
› Right-click the mouse to complete drawing.
Figure 44. Creating Line Zone
› The button becomes active. Click this button to save a new zone.
TRANSAS RESERVE THE RIGHT TO CHANGE THE SPECIFICATION WITHOUT PRIOR NOTICE
TRANSAS IS REGISTERED TRADEMARK
COPYRIGHT: © TRANSAS MIP LTD 1991–2014
42 FleetViewOnline ver. 4.2 User ManualUsing FleetViewOnline Vessel Monitoring
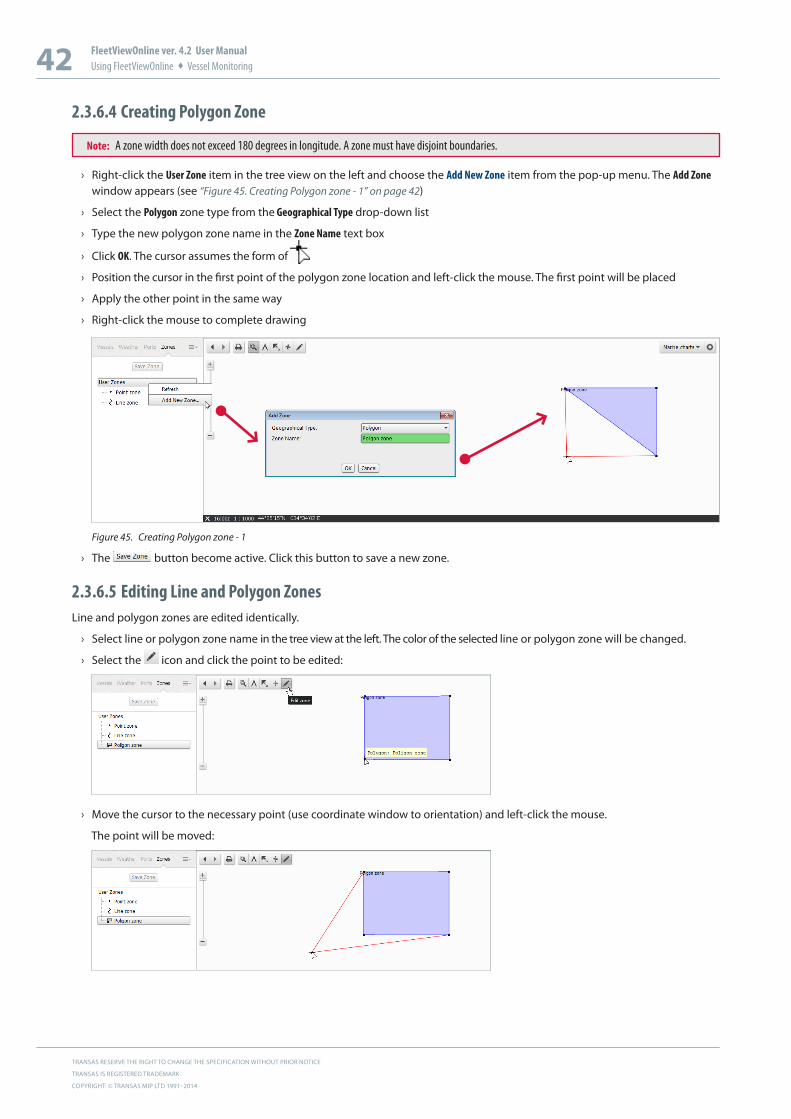
2.3.6.4 Creating Polygon Zone
Note: A zone width does not exceed 180 degrees in longitude. A zone must have disjoint boundaries.
› Right-click the User Zone item in the tree view on the left and choose the Add New Zone item from the pop-up menu. The Add Zone window appears (see “Figure 45. Creating Polygon zone - 1” on page 42)
› Select the Polygon zone type from the Geographical Type drop-down list
› Type the new polygon zone name in the Zone Name text box
› Click OK. The cursor assumes the form of
› Position the cursor in the first point of the polygon zone location and left-click the mouse. The first point will be placed
› Apply the other point in the same way
› Right-click the mouse to complete drawing
Figure 45. Creating Polygon zone - 1
› The button become active. Click this button to save a new zone.
2.3.6.5 Editing Line and Polygon ZonesLine and polygon zones are edited identically.
› Select line or polygon zone name in the tree view at the left. The color of the selected line or polygon zone will be changed.
› Select the icon and click the point to be edited:
› Move the cursor to the necessary point (use coordinate window to orientation) and left-click the mouse.
The point will be moved:

43 FleetViewOnline ver. 4.2 User ManualUsing FleetViewOnline Vessel Monitoring
2.3.6.6 Creating Alarm and Receiving Notifications You can assign to each zone a number of alarm objects to allow E-mail notification to be delivered to inform of entrance, exit, approach, move away and intersection of a zone. The following alarms are available for user zones:
Alarm Point zone Line zone Polygon zone
Away
Approach
Intersection
Entrance
Exit
Table 2. Alarms types
Alarms will be generated
• For vessels, which the user can monitor
• For user zones, which are created by this user.
2.3.6.6.1 Creating Alarm Object › Right-click the zone name in the tree view and choose the Add New Alarm item. The pop-up menu with alarms list opens:
› Select an alarm. The New Alarm Object window appears. In this window:
ű Name - alarm object name
ű E-mail - address for message delivery
ű Phone - phone for message delivery
ű Text - message text
ű Distance - distance for Away and Approach alarms
› Type E-mail, phone, message text and distance in the text boxes.
› Click OK.
Figure 46. Creating Alarm objects
TRANSAS RESERVE THE RIGHT TO CHANGE THE SPECIFICATION WITHOUT PRIOR NOTICE
TRANSAS IS REGISTERED TRADEMARK
COPYRIGHT: © TRANSAS MIP LTD 1991–2014
44 FleetViewOnline ver. 4.2 User ManualUsing FleetViewOnline Vessel Monitoring
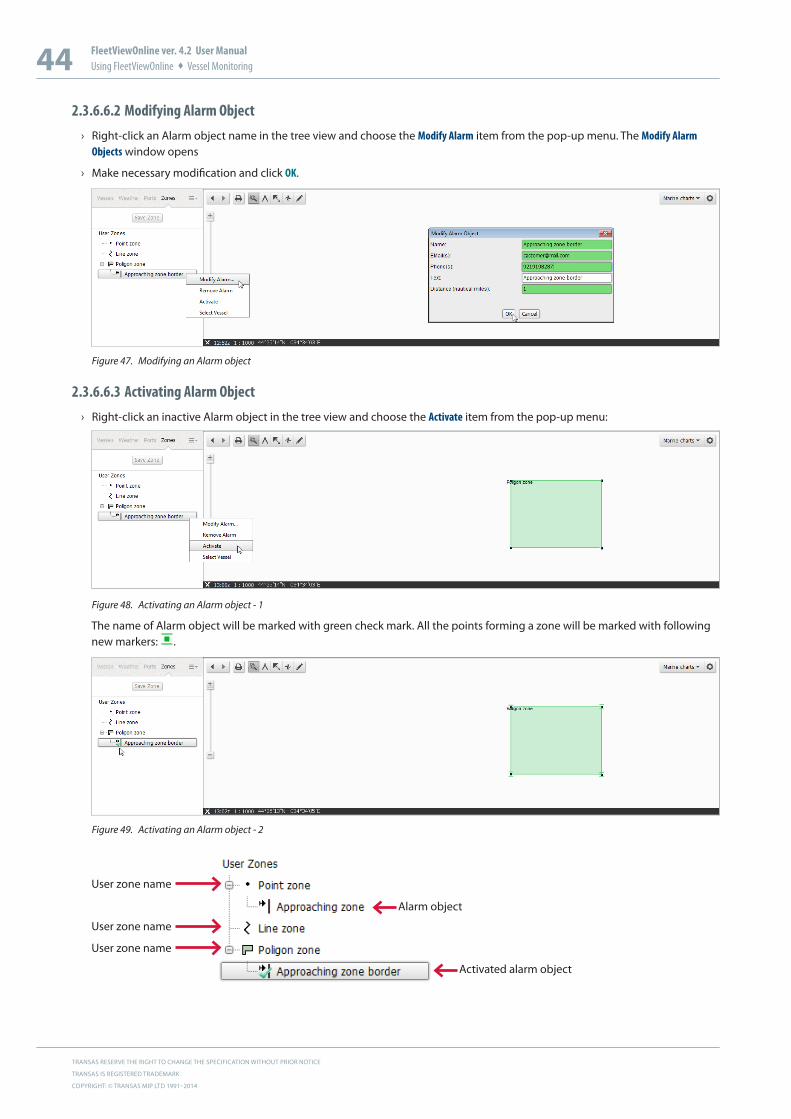
2.3.6.6.2 Modifying Alarm Object › Right-click an Alarm object name in the tree view and choose the Modify Alarm item from the pop-up menu. The Modify Alarm
Objects window opens
› Make necessary modification and click OK.
Figure 47. Modifying an Alarm object
2.3.6.6.3 Activating Alarm Object › Right-click an inactive Alarm object in the tree view and choose the Activate item from the pop-up menu:
Figure 48. Activating an Alarm object - 1
The name of Alarm object will be marked with green check mark. All the points forming a zone will be marked with following new markers: .
Figure 49. Activating an Alarm object - 2
User zone name
Activated alarm object
Alarm object
User zone name
User zone name
45 FleetViewOnline ver. 4.2 User ManualUsing FleetViewOnline Vessel Monitoring
When alarm object is activated the user can receive notifications in following forms:
Example 1:
Text:
Alarm Type: EntranceToZone
Zone Name: UK Entry
Vessel name: TEST VESSEL
Latitude: 050 49.32’N , Longitude: 001 2.8’W
DateTime: 01/06/2010 15:15:27
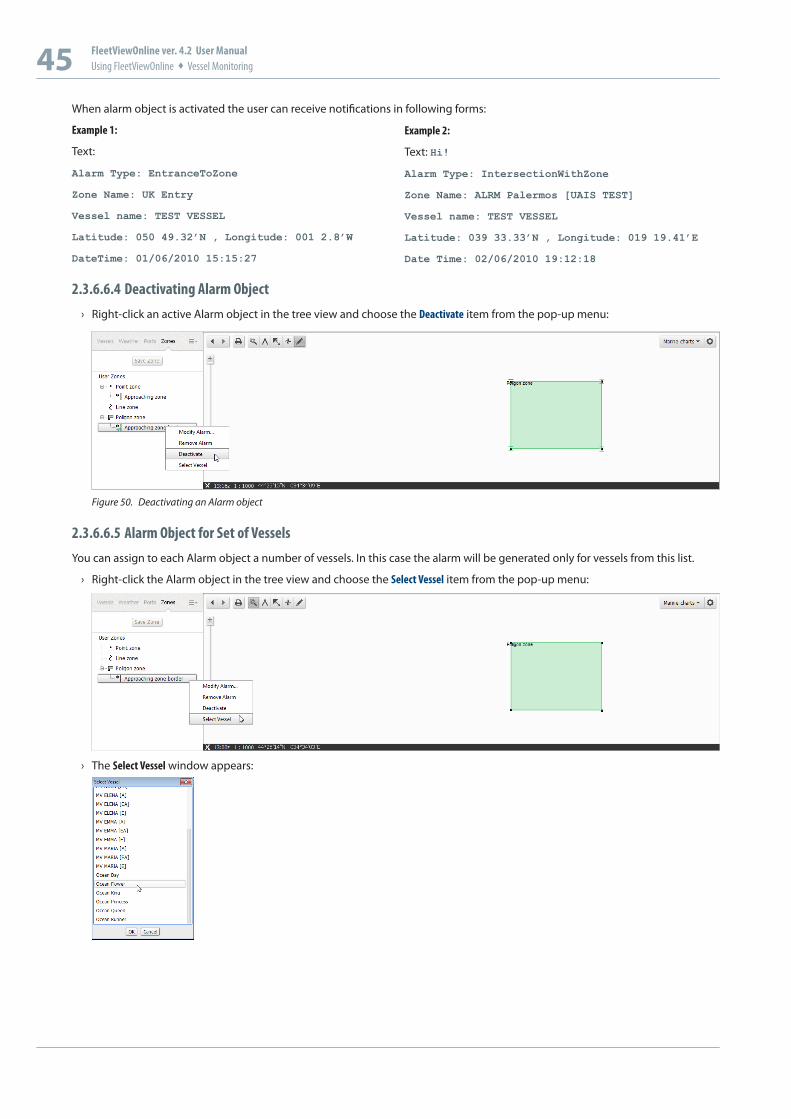
2.3.6.6.4 Deactivating Alarm Object › Right-click an active Alarm object in the tree view and choose the Deactivate item from the pop-up menu:
Figure 50. Deactivating an Alarm object
2.3.6.6.5 Alarm Object for Set of Vessels You can assign to each Alarm object a number of vessels. In this case the alarm will be generated only for vessels from this list.
› Right-click the Alarm object in the tree view and choose the Select Vessel item from the pop-up menu:
› The Select Vessel window appears:
Example 2:
Text: Hi!
Alarm Type: IntersectionWithZone
Zone Name: ALRM Palermos [UAIS TEST]
Vessel name: TEST VESSEL
Latitude: 039 33.33’N , Longitude: 019 19.41’E
Date Time: 02/06/2010 19:12:18
TRANSAS RESERVE THE RIGHT TO CHANGE THE SPECIFICATION WITHOUT PRIOR NOTICE
TRANSAS IS REGISTERED TRADEMARK
COPYRIGHT: © TRANSAS MIP LTD 1991–2014
46 FleetViewOnline ver. 4.2 User ManualUsing FleetViewOnline Vessel Monitoring
› Select a vessel name and click OK. The selected vessel name appears under Alarm object name in tree view:
› To remove a vessel from list right-click the vessel name and choose the Remove Vessel item from the pop-up menu.
2.3.7 Piracy
2.3.7.1 Set-up Piracy Information OverlayIf you want to have information about piracy attacks please contact the FVO support team to create subscription.
After subscribing, do the following:
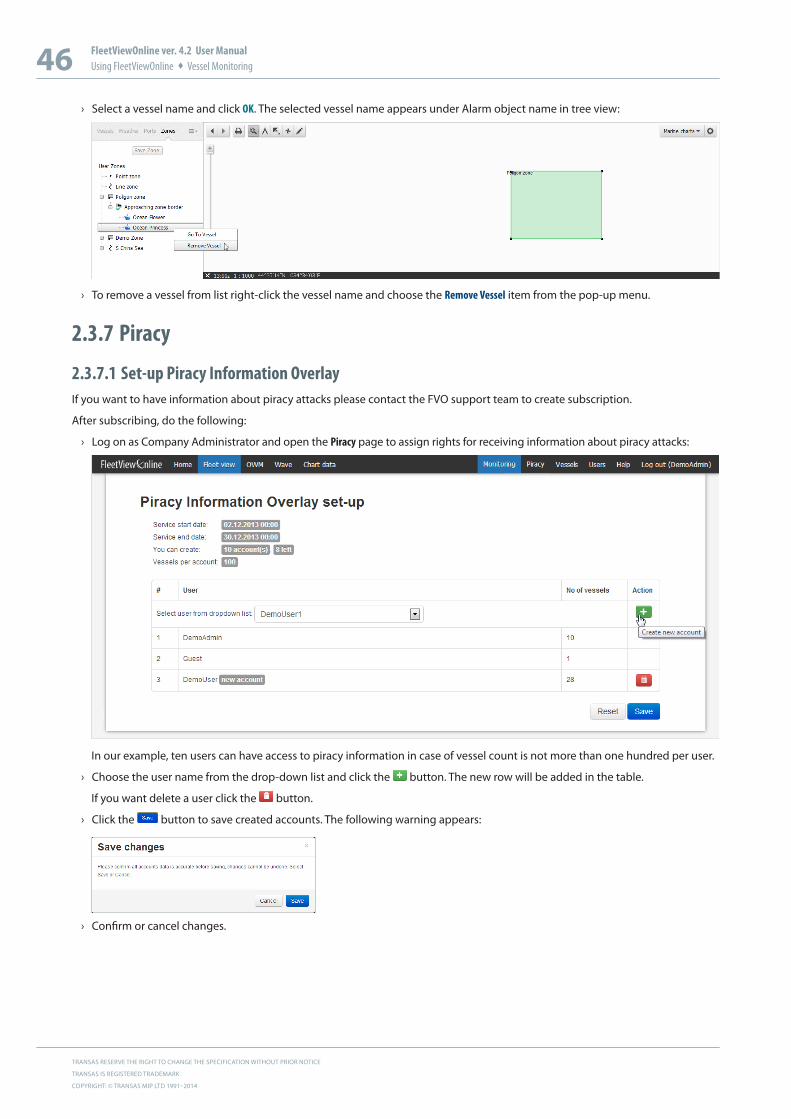
› Log on as Company Administrator and open the Piracy page to assign rights for receiving information about piracy attacks:
In our example, ten users can have access to piracy information in case of vessel count is not more than one hundred per user.
› Choose the user name from the drop-down list and click the button. The new row will be added in the table.
If you want delete a user click the button.
› Click the button to save created accounts. The following warning appears:
› Confirm or cancel changes.
47 FleetViewOnline ver. 4.2 User ManualUsing FleetViewOnline Vessel Monitoring
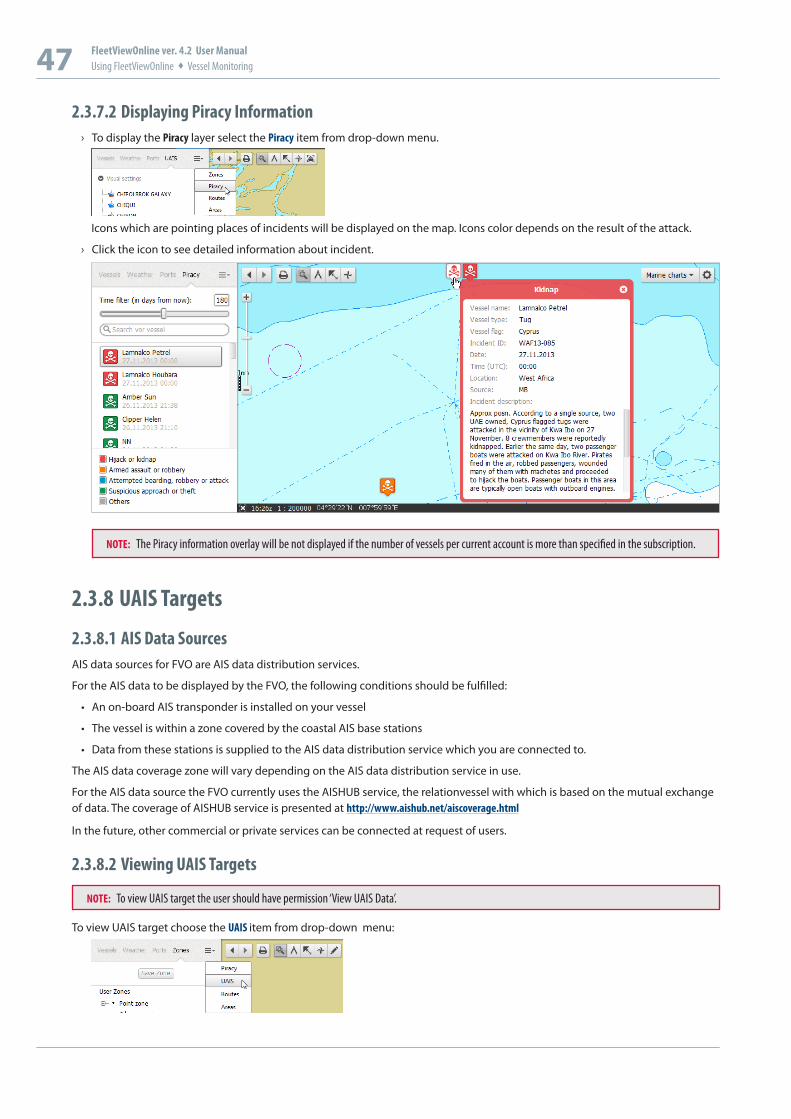
2.3.7.2 Displaying Piracy Information › To display the Piracy layer select the Piracy item from drop-down menu.
Icons which are pointing places of incidents will be displayed on the map. Icons color depends on the result of the attack.
› Click the icon to see detailed information about incident.
NOTE: The Piracy information overlay will be not displayed if the number of vessels per current account is more than specified in the subscription.
2.3.8 UAIS Targets
2.3.8.1 AIS Data SourcesAIS data sources for FVO are AIS data distribution services.
For the AIS data to be displayed by the FVO, the following conditions should be fulfilled:
• An on-board AIS transponder is installed on your vessel
• The vessel is within a zone covered by the coastal AIS base stations
• Data from these stations is supplied to the AIS data distribution service which you are connected to.
The AIS data coverage zone will vary depending on the AIS data distribution service in use.
For the AIS data source the FVO currently uses the AISHUB service, the relationvessel with which is based on the mutual exchange of data. The coverage of AISHUB service is presented at http://www.aishub.net/aiscoverage.html
In the future, other commercial or private services can be connected at request of users.
2.3.8.2 Viewing UAIS Targets
NOTE: To view UAIS target the user should have permission ‘View UAIS Data’.
To view UAIS target choose the UAIS item from drop-down menu:
TRANSAS RESERVE THE RIGHT TO CHANGE THE SPECIFICATION WITHOUT PRIOR NOTICE
TRANSAS IS REGISTERED TRADEMARK
COPYRIGHT: © TRANSAS MIP LTD 1991–2014
48 FleetViewOnline ver. 4.2 User ManualUsing FleetViewOnline Vessel Monitoring
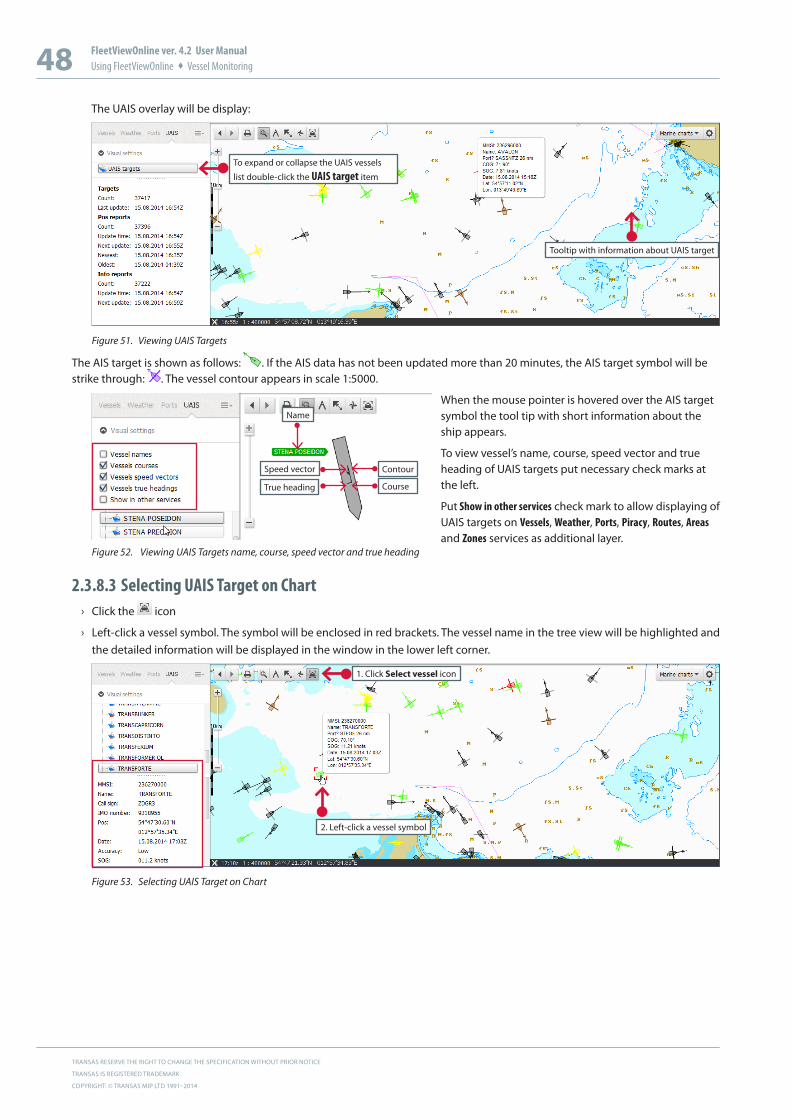
The UAIS overlay will be display:
Tooltip with information about UAIS target
To expand or collapse the UAIS vessels
list double-click the UAIS target item
Figure 51. Viewing UAIS Targets
The AIS target is shown as follows: . If the AIS data has not been updated more than 20 minutes, the AIS target symbol will be strike through: . The vessel contour appears in scale 1:5000.
True heading Course
Name
Speed vector Contour
Figure 52. Viewing UAIS Targets name, course, speed vector and true heading
2.3.8.3 Selecting UAIS Target on Chart › Click the icon
› Left-click a vessel symbol. The symbol will be enclosed in red brackets. The vessel name in the tree view will be highlighted and the detailed information will be displayed in the window in the lower left corner.
1. Click Select vessel icon
2. Left-click a vessel symbol
Figure 53. Selecting UAIS Target on Chart
When the mouse pointer is hovered over the AIS target symbol the tool tip with short information about the ship appears.
To view vessel’s name, course, speed vector and true heading of UAIS targets put necessary check marks at the left.
Put Show in other services check mark to allow displaying of UAIS targets on Vessels, Weather, Ports, Piracy, Routes, Areas and Zones services as additional layer.
49 FleetViewOnline ver. 4.2 User ManualUsing FleetViewOnline Vessel Monitoring
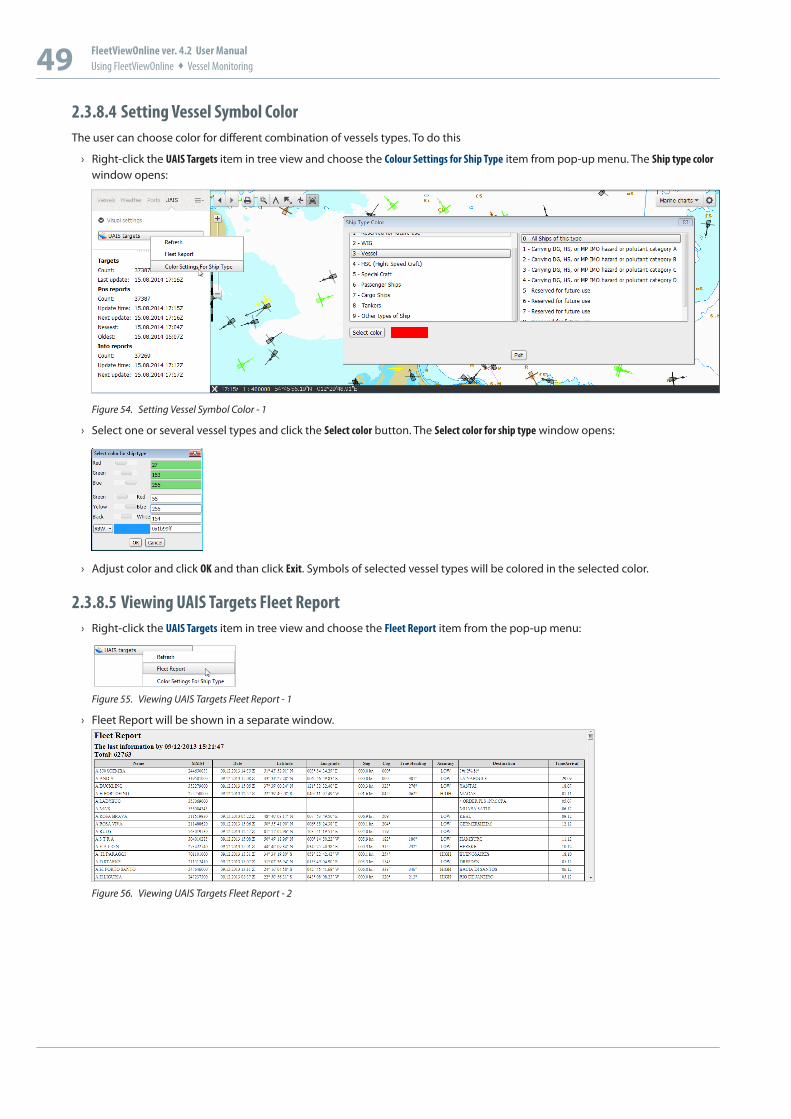
2.3.8.4 Setting Vessel Symbol ColorThe user can choose color for different combination of vessels types. To do this
› Right-click the UAIS Targets item in tree view and choose the Colour Settings for Ship Type item from pop-up menu. The Ship type color window opens:
Figure 54. Setting Vessel Symbol Color - 1
› Select one or several vessel types and click the Select color button. The Select color for ship type window opens:
› Adjust color and click OK and than click Exit. Symbols of selected vessel types will be colored in the selected color.
2.3.8.5 Viewing UAIS Targets Fleet Report › Right-click the UAIS Targets item in tree view and choose the Fleet Report item from the pop-up menu:
Figure 55. Viewing UAIS Targets Fleet Report - 1
› Fleet Report will be shown in a separate window.
Figure 56. Viewing UAIS Targets Fleet Report - 2

TRANSAS RESERVE THE RIGHT TO CHANGE THE SPECIFICATION WITHOUT PRIOR NOTICE
TRANSAS IS REGISTERED TRADEMARK
COPYRIGHT: © TRANSAS MIP LTD 1991–2014
50 FleetViewOnline ver. 4.2 User ManualUsing FleetViewOnline Vessel Monitoring
2.3.8.6 Search Vessel Photos › Right-click a vessel name and choose the Search Photos item from the pop-up menu. The search result will be shown in a
separate window.
Figure 57. Search Vessel Photos
2.3.8.7 Search Vessel Data on eagle.org › Right-click a vessel name and choose the Search on Eagle.org item from the pop-up menu. The search result will be shown in a
separate window.
Figure 58. Search Vessel Data on eagle.org
2.3.8.8 AIS data clusteringAIS data are required to display a large number of vessel symbols. If the symbols are too close to each other for the current zoom level (current scale) then they are clustered into black rings with numbers in the middle.
Figure 59. AIS data clustering
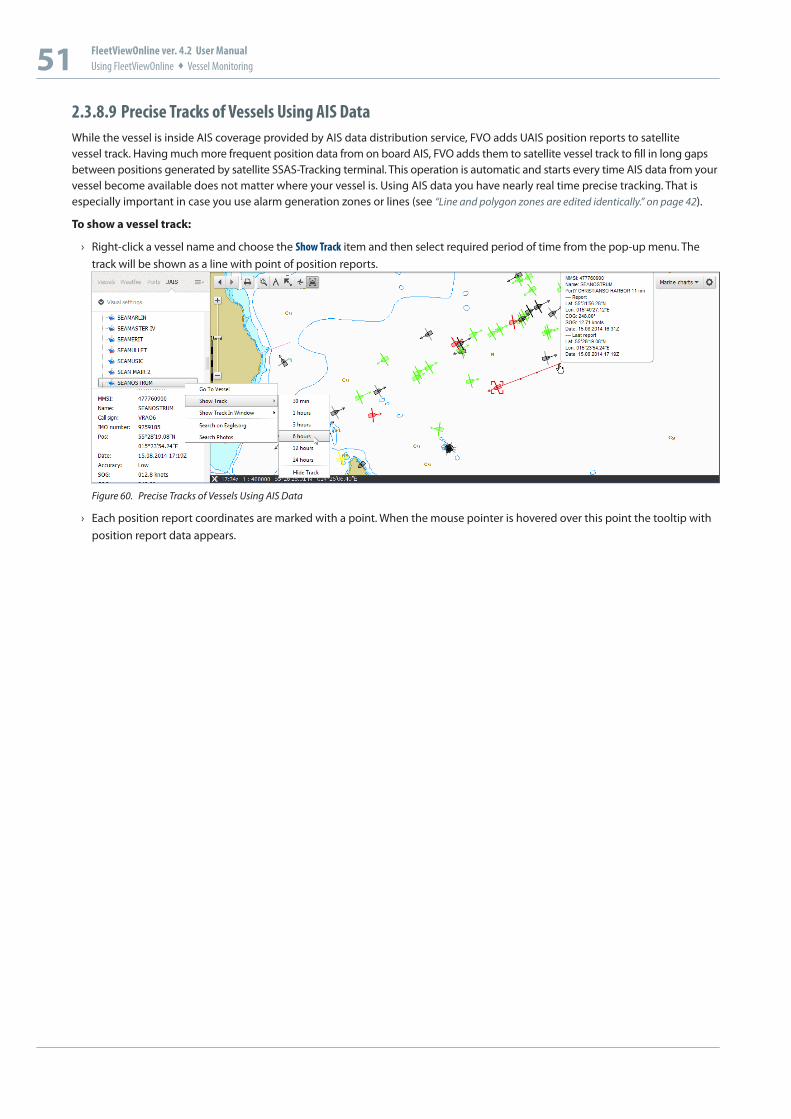
51 FleetViewOnline ver. 4.2 User ManualUsing FleetViewOnline Vessel Monitoring
2.3.8.9 Precise Tracks of Vessels Using AIS DataWhile the vessel is inside AIS coverage provided by AIS data distribution service, FVO adds UAIS position reports to satellite vessel track. Having much more frequent position data from on board AIS, FVO adds them to satellite vessel track to fill in long gaps between positions generated by satellite SSAS-Tracking terminal. This operation is automatic and starts every time AIS data from your vessel become available does not matter where your vessel is. Using AIS data you have nearly real time precise tracking. That is especially important in case you use alarm generation zones or lines (see “Line and polygon zones are edited identically.” on page 42).
To show a vessel track:
› Right-click a vessel name and choose the Show Track item and then select required period of time from the pop-up menu. The track will be shown as a line with point of position reports.
Figure 60. Precise Tracks of Vessels Using AIS Data
› Each position report coordinates are marked with a point. When the mouse pointer is hovered over this point the tooltip with position report data appears.
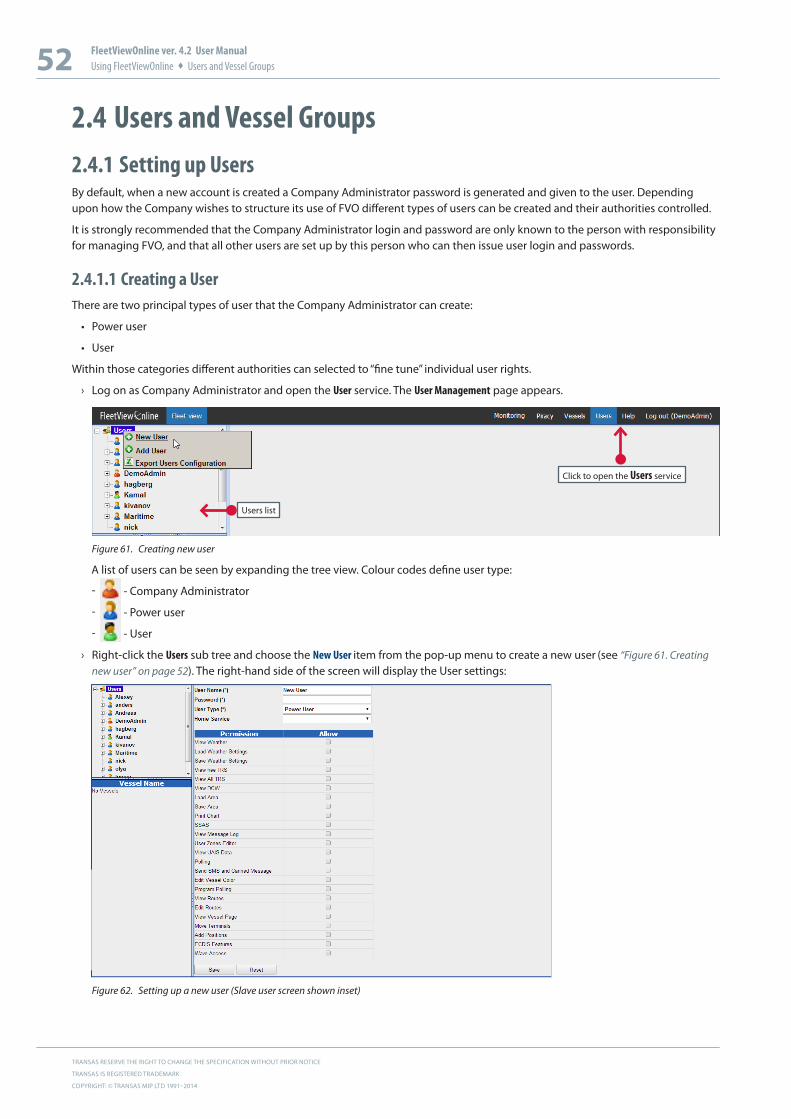
TRANSAS RESERVE THE RIGHT TO CHANGE THE SPECIFICATION WITHOUT PRIOR NOTICE
TRANSAS IS REGISTERED TRADEMARK
COPYRIGHT: © TRANSAS MIP LTD 1991–2014
52 FleetViewOnline ver. 4.2 User ManualUsing FleetViewOnline Users and Vessel Groups
2.4 Users and Vessel Groups2.4.1 Setting up UsersBy default, when a new account is created a Company Administrator password is generated and given to the user. Depending upon how the Company wishes to structure its use of FVO different types of users can be created and their authorities controlled.
It is strongly recommended that the Company Administrator login and password are only known to the person with responsibility for managing FVO, and that all other users are set up by this person who can then issue user login and passwords.
2.4.1.1 Creating a UserThere are two principal types of user that the Company Administrator can create:
• Power user
• User
Within those categories different authorities can selected to “fine tune” individual user rights.
› Log on as Company Administrator and open the User service. The User Management page appears.
Click to open the Users service
Users list
Figure 61. Creating new user
A list of users can be seen by expanding the tree view. Colour codes define user type:
ű - Company Administrator
ű - Power user
ű - User
› Right-click the Users sub tree and choose the New User item from the pop-up menu to create a new user (see “Figure 61. Creating new user” on page 52). The right-hand side of the screen will display the User settings:
Figure 62. Setting up a new user (Slave user screen shown inset)
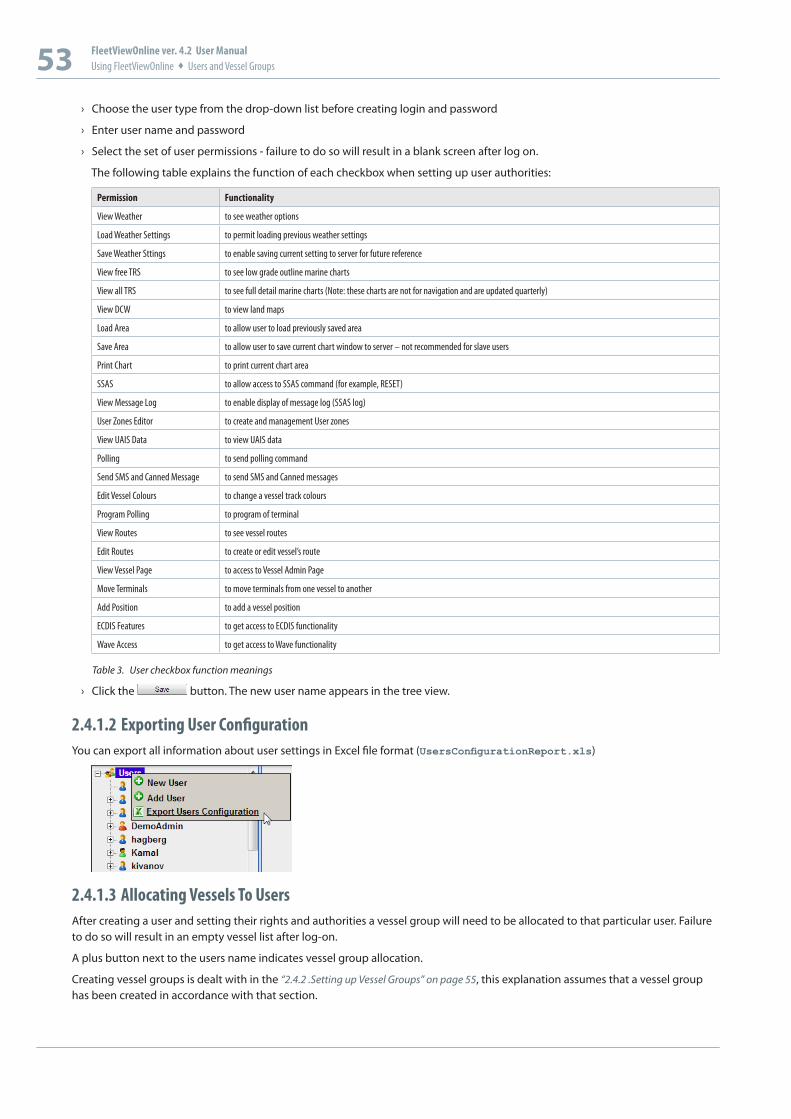
53 FleetViewOnline ver. 4.2 User ManualUsing FleetViewOnline Users and Vessel Groups
› Choose the user type from the drop-down list before creating login and password
› Enter user name and password
› Select the set of user permissions - failure to do so will result in a blank screen after log on.
The following table explains the function of each checkbox when setting up user authorities:
Permission Functionality
View Weather to see weather options
Load Weather Settings to permit loading previous weather settings
Save Weather Sttings to enable saving current setting to server for future reference
View free TRS to see low grade outline marine charts
View all TRS to see full detail marine charts (Note: these charts are not for navigation and are updated quarterly)
View DCW to view land maps
Load Area to allow user to load previously saved area
Save Area to allow user to save current chart window to server – not recommended for slave users
Print Chart to print current chart area
SSAS to allow access to SSAS command (for example, RESET)
View Message Log to enable display of message log (SSAS log)
User Zones Editor to create and management User zones
View UAIS Data to view UAIS data
Polling to send polling command
Send SMS and Canned Message to send SMS and Canned messages
Edit Vessel Colours to change a vessel track colours
Program Polling to program of terminal
View Routes to see vessel routes
Edit Routes to create or edit vessel’s route
View Vessel Page to access to Vessel Admin Page
Move Terminals to move terminals from one vessel to another
Add Position to add a vessel position
ECDIS Features to get access to ECDIS functionality
Wave Access to get access to Wave functionality
Table 3. User checkbox function meanings
› Click the button. The new user name appears in the tree view.
2.4.1.2 Exporting User ConfigurationYou can export all information about user settings in Excel file format (UsersConfigurationReport.xls)
2.4.1.3 Allocating Vessels To UsersAfter creating a user and setting their rights and authorities a vessel group will need to be allocated to that particular user. Failure to do so will result in an empty vessel list after log-on.
A plus button next to the users name indicates vessel group allocation.
Creating vessel groups is dealt with in the “2.4.2 .Setting up Vessel Groups” on page 55, this explanation assumes that a vessel group has been created in accordance with that section.
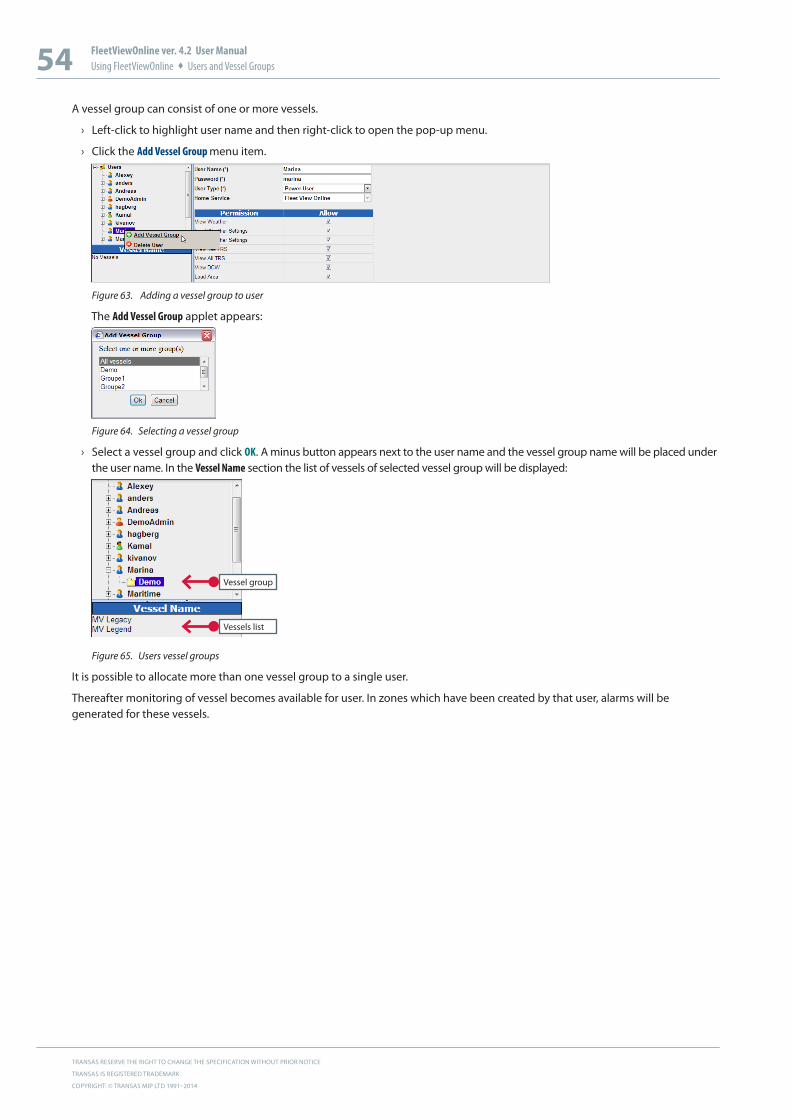
TRANSAS RESERVE THE RIGHT TO CHANGE THE SPECIFICATION WITHOUT PRIOR NOTICE
TRANSAS IS REGISTERED TRADEMARK
COPYRIGHT: © TRANSAS MIP LTD 1991–2014
54 FleetViewOnline ver. 4.2 User ManualUsing FleetViewOnline Users and Vessel Groups
A vessel group can consist of one or more vessels.
› Left-click to highlight user name and then right-click to open the pop-up menu.
› Click the Add Vessel Group menu item.
Figure 63. Adding a vessel group to user
The Add Vessel Group applet appears:
Figure 64. Selecting a vessel group
› Select a vessel group and click OK. A minus button appears next to the user name and the vessel group name will be placed under the user name. In the Vessel Name section the list of vessels of selected vessel group will be displayed:
Vessel group
Vessels list
Figure 65. Users vessel groups
It is possible to allocate more than one vessel group to a single user.
Thereafter monitoring of vessel becomes available for user. In zones which have been created by that user, alarms will be generated for these vessels.
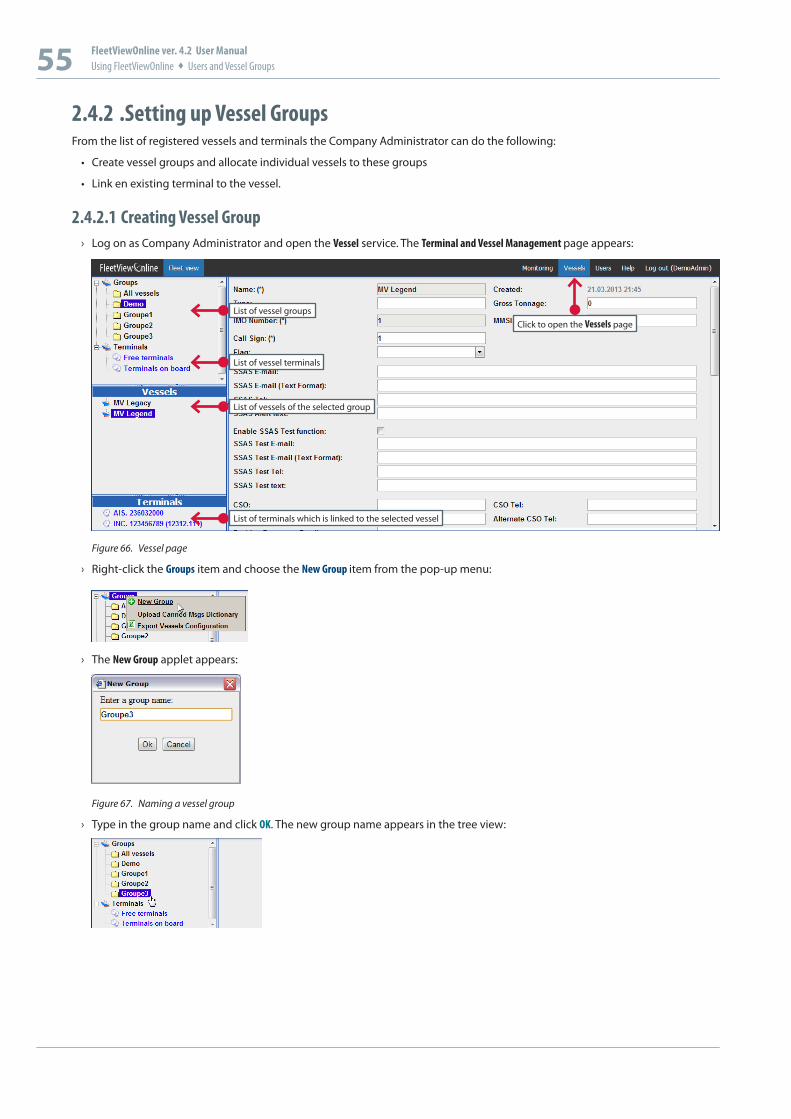
55 FleetViewOnline ver. 4.2 User ManualUsing FleetViewOnline Users and Vessel Groups
2.4.2 .Setting up Vessel GroupsFrom the list of registered vessels and terminals the Company Administrator can do the following:
• Create vessel groups and allocate individual vessels to these groups
• Link en existing terminal to the vessel.
2.4.2.1 Creating Vessel Group › Log on as Company Administrator and open the Vessel service. The Terminal and Vessel Management page appears:
Click to open the Vessels pageList of vessel groups
List of vessels of the selected group
List of terminals which is linked to the selected vessel
List of vessel terminals
Figure 66. Vessel page
› Right-click the Groups item and choose the New Group item from the pop-up menu:
› The New Group applet appears:
Figure 67. Naming a vessel group
› Type in the group name and click OK. The new group name appears in the tree view:
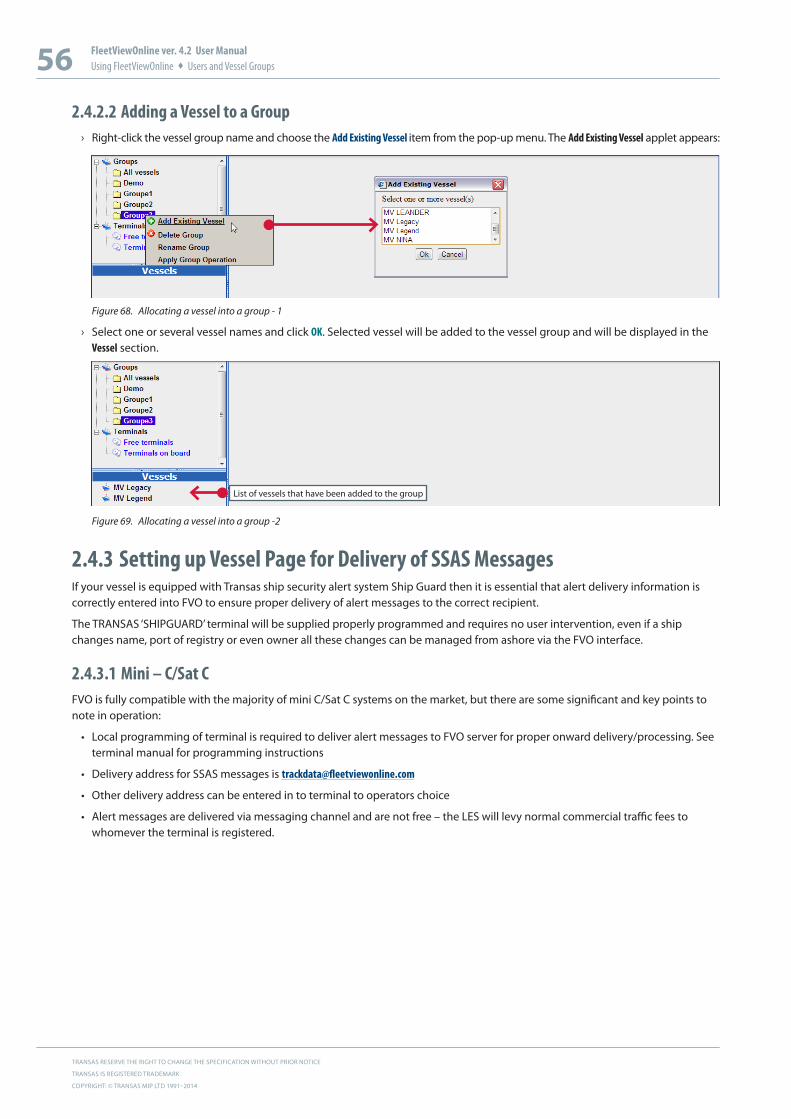
TRANSAS RESERVE THE RIGHT TO CHANGE THE SPECIFICATION WITHOUT PRIOR NOTICE
TRANSAS IS REGISTERED TRADEMARK
COPYRIGHT: © TRANSAS MIP LTD 1991–2014
56 FleetViewOnline ver. 4.2 User ManualUsing FleetViewOnline Users and Vessel Groups
2.4.2.2 Adding a Vessel to a Group › Right-click the vessel group name and choose the Add Existing Vessel item from the pop-up menu. The Add Existing Vessel applet appears:
Figure 68. Allocating a vessel into a group - 1
› Select one or several vessel names and click OK. Selected vessel will be added to the vessel group and will be displayed in the Vessel section.
List of vessels that have been added to the group
Figure 69. Allocating a vessel into a group -2
2.4.3 Setting up Vessel Page for Delivery of SSAS MessagesIf your vessel is equipped with Transas ship security alert system Ship Guard then it is essential that alert delivery information is correctly entered into FVO to ensure proper delivery of alert messages to the correct recipient.
The TRANSAS ‘SHIPGUARD’ terminal will be supplied properly programmed and requires no user intervention, even if a ship changes name, port of registry or even owner all these changes can be managed from ashore via the FVO interface.
2.4.3.1 Mini – C/Sat CFVO is fully compatible with the majority of mini C/Sat C systems on the market, but there are some significant and key points to note in operation:
• Local programming of terminal is required to deliver alert messages to FVO server for proper onward delivery/processing. See terminal manual for programming instructions
• Delivery address for SSAS messages is [email protected]
• Other delivery address can be entered in to terminal to operators choice
• Alert messages are delivered via messaging channel and are not free – the LES will levy normal commercial traffic fees to whomever the terminal is registered.

57 FleetViewOnline ver. 4.2 User ManualUsing FleetViewOnline Users and Vessel Groups
2.4.3.2 Entering Delivery Data
Click the vessel name to open data entry fields
Select All Vessels from the groups menu
Data entry fields
Figure 70. Entering data for SSAS message delivery
› Log in and select Vessels tab, then select All Vessels from the Groups menu.
› Highlight the required vessel from the Vessel menu to open data entry fields.
The screen divider bar can be adjusted to expand view of data entry fields.
2.4.3.3 Data Entry Rules• No spaces are permitted in data fields after separator
• Use semi-colon “;” as data separator
• Drop 00 for country code of GSM phones
• Delivery of alert repeater message to GSM phone is dependent on network compatibility and coverage and cannot be guaranteed.
Certain mobile phone networks support E-mail to phone delivery as an alternative to standard text messages
2.4.3.4 Vessel DataThis information will be entered by Transas as part of the registration process, however its accuracy should be determined after receiving your user log in and password.
Users are free to edit data as they wish but must save all changes for them to become permanent. Vessel Name & IMO Number can only be edited by Transas Operations team.
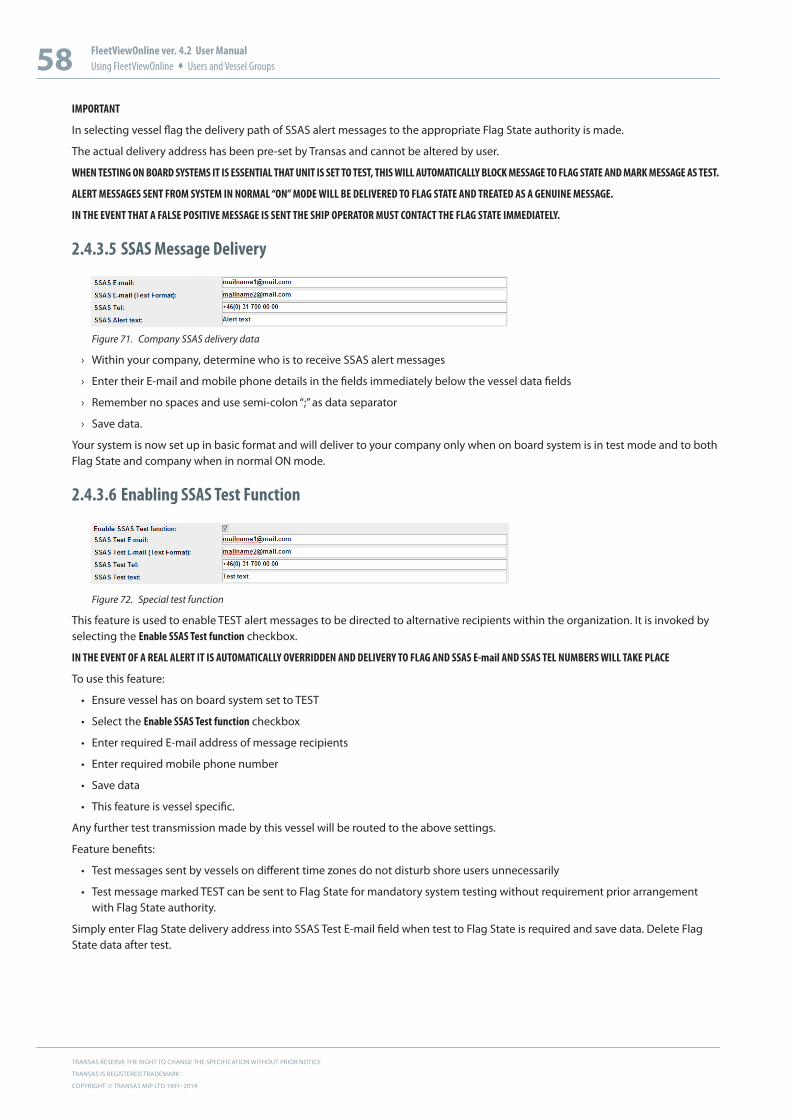
TRANSAS RESERVE THE RIGHT TO CHANGE THE SPECIFICATION WITHOUT PRIOR NOTICE
TRANSAS IS REGISTERED TRADEMARK
COPYRIGHT: © TRANSAS MIP LTD 1991–2014
58 FleetViewOnline ver. 4.2 User ManualUsing FleetViewOnline Users and Vessel Groups
IMPORTANT
In selecting vessel flag the delivery path of SSAS alert messages to the appropriate Flag State authority is made.
The actual delivery address has been pre-set by Transas and cannot be altered by user.
WHEN TESTING ON BOARD SYSTEMS IT IS ESSENTIAL THAT UNIT IS SET TO TEST, THIS WILL AUTOMATICALLY BLOCK MESSAGE TO FLAG STATE AND MARK MESSAGE AS TEST.
ALERT MESSAGES SENT FROM SYSTEM IN NORMAL “ON” MODE WILL BE DELIVERED TO FLAG STATE AND TREATED AS A GENUINE MESSAGE.
IN THE EVENT THAT A FALSE POSITIVE MESSAGE IS SENT THE SHIP OPERATOR MUST CONTACT THE FLAG STATE IMMEDIATELY.
2.4.3.5 SSAS Message Delivery
Figure 71. Company SSAS delivery data
› Within your company, determine who is to receive SSAS alert messages
› Enter their E-mail and mobile phone details in the fields immediately below the vessel data fields
› Remember no spaces and use semi-colon “;” as data separator
› Save data.
Your system is now set up in basic format and will deliver to your company only when on board system is in test mode and to both Flag State and company when in normal ON mode.
2.4.3.6 Enabling SSAS Test Function
Figure 72. Special test function
This feature is used to enable TEST alert messages to be directed to alternative recipients within the organization. It is invoked by selecting the Enable SSAS Test function checkbox.
IN THE EVENT OF A REAL ALERT IT IS AUTOMATICALLY OVERRIDDEN AND DELIVERY TO FLAG AND SSAS E-mail AND SSAS TEL NUMBERS WILL TAKE PLACE
To use this feature:
• Ensure vessel has on board system set to TEST
• Select the Enable SSAS Test function checkbox
• Enter required E-mail address of message recipients
• Enter required mobile phone number
• Save data
• This feature is vessel specific.
Any further test transmission made by this vessel will be routed to the above settings.
Feature benefits:
• Test messages sent by vessels on different time zones do not disturb shore users unnecessarily
• Test message marked TEST can be sent to Flag State for mandatory system testing without requirement prior arrangement with Flag State authority.
Simply enter Flag State delivery address into SSAS Test E-mail field when test to Flag State is required and save data. Delete Flag State data after test.
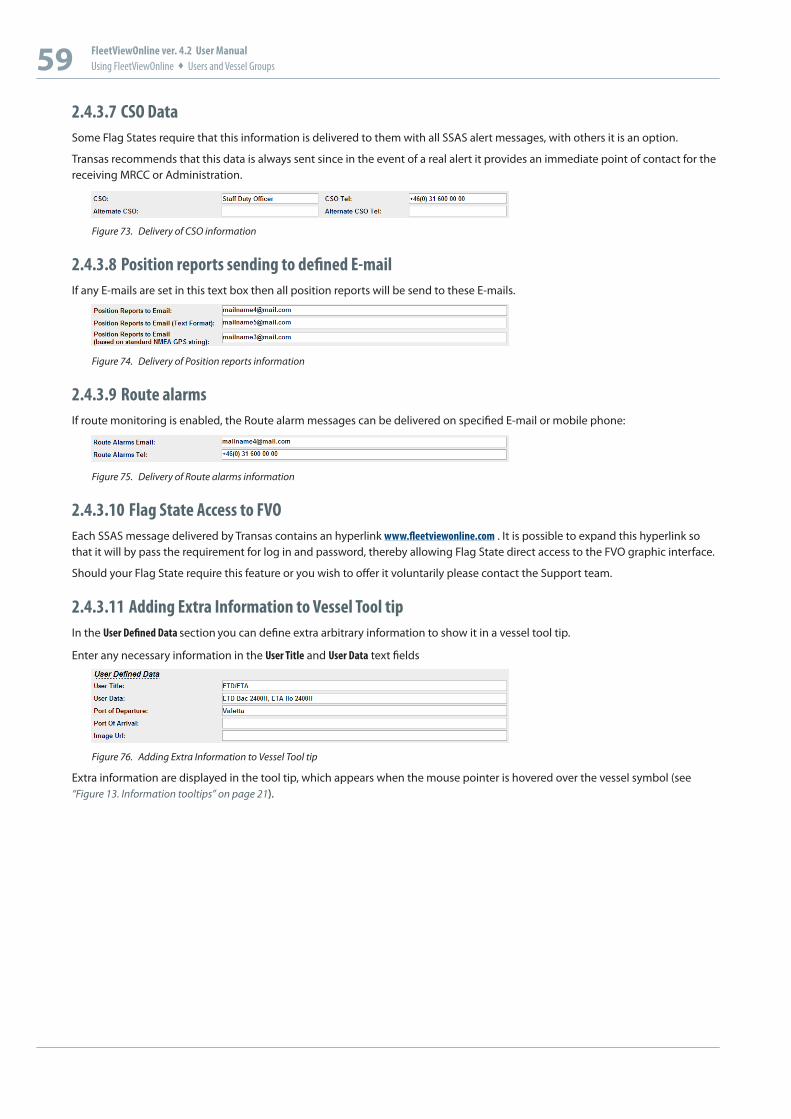
59 FleetViewOnline ver. 4.2 User ManualUsing FleetViewOnline Users and Vessel Groups
2.4.3.7 CSO DataSome Flag States require that this information is delivered to them with all SSAS alert messages, with others it is an option.
Transas recommends that this data is always sent since in the event of a real alert it provides an immediate point of contact for the receiving MRCC or Administration.
Figure 73. Delivery of CSO information
2.4.3.8 Position reports sending to defined E-mailIf any E-mails are set in this text box then all position reports will be send to these E-mails.
Figure 74. Delivery of Position reports information
2.4.3.9 Route alarmsIf route monitoring is enabled, the Route alarm messages can be delivered on specified E-mail or mobile phone:
Figure 75. Delivery of Route alarms information
2.4.3.10 Flag State Access to FVOEach SSAS message delivered by Transas contains an hyperlink www.fleetviewonline.com . It is possible to expand this hyperlink so that it will by pass the requirement for log in and password, thereby allowing Flag State direct access to the FVO graphic interface.
Should your Flag State require this feature or you wish to offer it voluntarily please contact the Support team.
2.4.3.11 Adding Extra Information to Vessel Tool tipIn the User Defined Data section you can define extra arbitrary information to show it in a vessel tool tip.
Enter any necessary information in the User Title and User Data text fields
Figure 76. Adding Extra Information to Vessel Tool tip
Extra information are displayed in the tool tip, which appears when the mouse pointer is hovered over the vessel symbol (see “Figure 13. Information tooltips” on page 21).
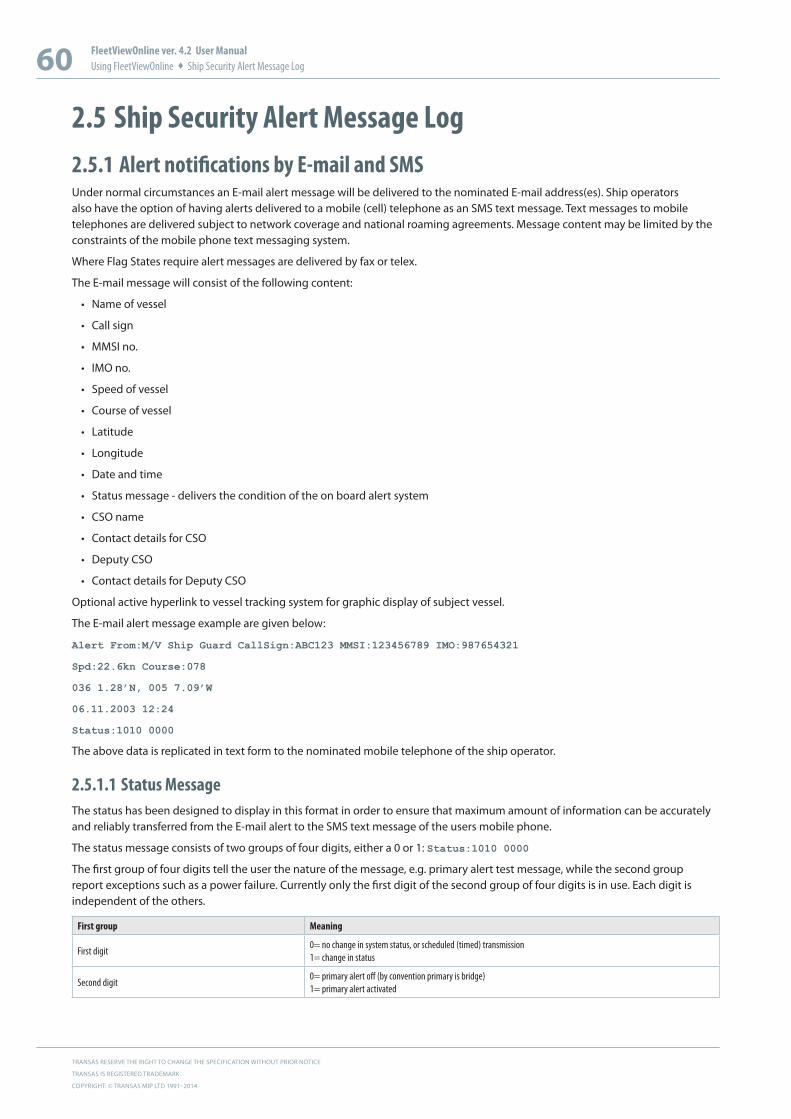
TRANSAS RESERVE THE RIGHT TO CHANGE THE SPECIFICATION WITHOUT PRIOR NOTICE
TRANSAS IS REGISTERED TRADEMARK
COPYRIGHT: © TRANSAS MIP LTD 1991–2014
60 FleetViewOnline ver. 4.2 User ManualUsing FleetViewOnline Ship Security Alert Message Log
2.5 Ship Security Alert Message Log2.5.1 Alert notifications by E-mail and SMSUnder normal circumstances an E-mail alert message will be delivered to the nominated E-mail address(es). Ship operators also have the option of having alerts delivered to a mobile (cell) telephone as an SMS text message. Text messages to mobile telephones are delivered subject to network coverage and national roaming agreements. Message content may be limited by the constraints of the mobile phone text messaging system.
Where Flag States require alert messages are delivered by fax or telex.
The E-mail message will consist of the following content:
• Name of vessel
• Call sign
• MMSI no.
• IMO no.
• Speed of vessel
• Course of vessel
• Latitude
• Longitude
• Date and time
• Status message - delivers the condition of the on board alert system
• CSO name
• Contact details for CSO
• Deputy CSO
• Contact details for Deputy CSO
Optional active hyperlink to vessel tracking system for graphic display of subject vessel.
The E-mail alert message example are given below:
Alert From:M/V Ship Guard CallSign:ABC123 MMSI:123456789 IMO:987654321
Spd:22.6kn Course:078
036 1.28’N, 005 7.09’W
06.11.2003 12:24
Status:1010 0000
The above data is replicated in text form to the nominated mobile telephone of the ship operator.
2.5.1.1 Status MessageThe status has been designed to display in this format in order to ensure that maximum amount of information can be accurately and reliably transferred from the E-mail alert to the SMS text message of the users mobile phone.
The status message consists of two groups of four digits, either a 0 or 1: Status:1010 0000
The first group of four digits tell the user the nature of the message, e.g. primary alert test message, while the second group report exceptions such as a power failure. Currently only the first digit of the second group of four digits is in use. Each digit is independent of the others.
First group Meaning
First digit0= no change in system status, or scheduled (timed) transmission1= change in status
Second digit0= primary alert off (by convention primary is bridge)1= primary alert activated
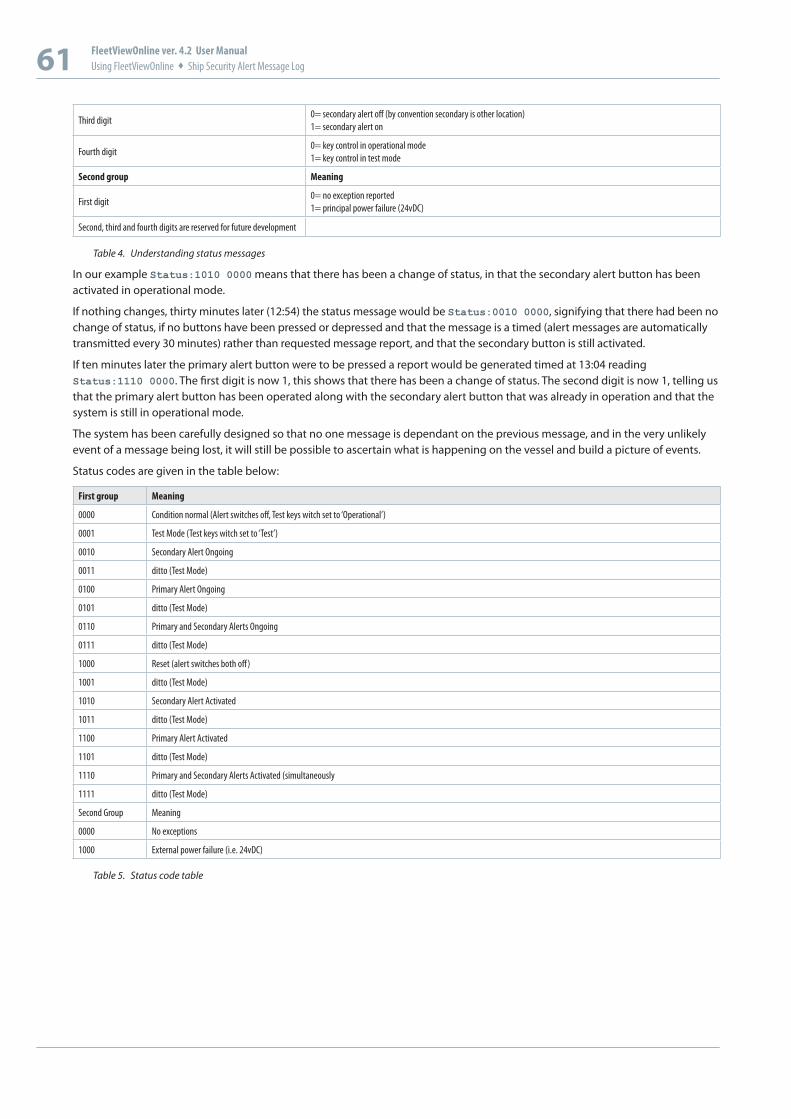
61 FleetViewOnline ver. 4.2 User ManualUsing FleetViewOnline Ship Security Alert Message Log
Third digit0= secondary alert off (by convention secondary is other location)1= secondary alert on
Fourth digit0= key control in operational mode 1= key control in test mode
Second group Meaning
First digit0= no exception reported1= principal power failure (24vDC)
Second, third and fourth digits are reserved for future development
Table 4. Understanding status messages
In our example Status:1010 0000 means that there has been a change of status, in that the secondary alert button has been activated in operational mode.
If nothing changes, thirty minutes later (12:54) the status message would be Status:0010 0000, signifying that there had been no change of status, if no buttons have been pressed or depressed and that the message is a timed (alert messages are automatically transmitted every 30 minutes) rather than requested message report, and that the secondary button is still activated.
If ten minutes later the primary alert button were to be pressed a report would be generated timed at 13:04 reading Status:1110 0000. The first digit is now 1, this shows that there has been a change of status. The second digit is now 1, telling us that the primary alert button has been operated along with the secondary alert button that was already in operation and that the system is still in operational mode.
The system has been carefully designed so that no one message is dependant on the previous message, and in the very unlikely event of a message being lost, it will still be possible to ascertain what is happening on the vessel and build a picture of events.
Status codes are given in the table below:
First group Meaning
0000 Condition normal (Alert switches off, Test keys witch set to ‘Operational’)
0001 Test Mode (Test keys witch set to ‘Test’)
0010 Secondary Alert Ongoing
0011 ditto (Test Mode)
0100 Primary Alert Ongoing
0101 ditto (Test Mode)
0110 Primary and Secondary Alerts Ongoing
0111 ditto (Test Mode)
1000 Reset (alert switches both off)
1001 ditto (Test Mode)
1010 Secondary Alert Activated
1011 ditto (Test Mode)
1100 Primary Alert Activated
1101 ditto (Test Mode)
1110 Primary and Secondary Alerts Activated (simultaneously
1111 ditto (Test Mode)
Second Group Meaning
0000 No exceptions
1000 External power failure (i.e. 24vDC)
Table 5. Status code table
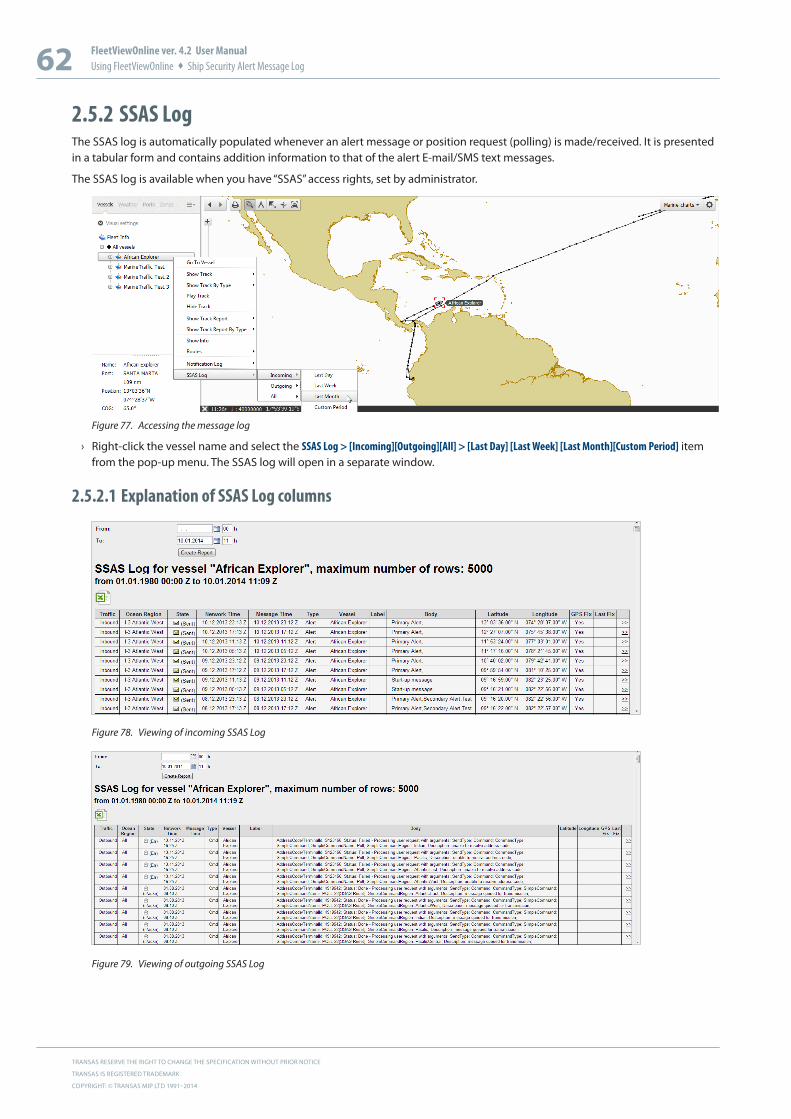
TRANSAS RESERVE THE RIGHT TO CHANGE THE SPECIFICATION WITHOUT PRIOR NOTICE
TRANSAS IS REGISTERED TRADEMARK
COPYRIGHT: © TRANSAS MIP LTD 1991–2014
62 FleetViewOnline ver. 4.2 User ManualUsing FleetViewOnline Ship Security Alert Message Log
2.5.2 SSAS LogThe SSAS log is automatically populated whenever an alert message or position request (polling) is made/received. It is presented in a tabular form and contains addition information to that of the alert E-mail/SMS text messages.
The SSAS log is available when you have “SSAS” access rights, set by administrator.
Figure 77. Accessing the message log
› Right-click the vessel name and select the SSAS Log > [Incoming][Outgoing][All] > [Last Day] [Last Week] [Last Month][Custom Period] item from the pop-up menu. The SSAS log will open in a separate window.
2.5.2.1 Explanation of SSAS Log columns
Figure 78. Viewing of incoming SSAS Log
Figure 79. Viewing of outgoing SSAS Log
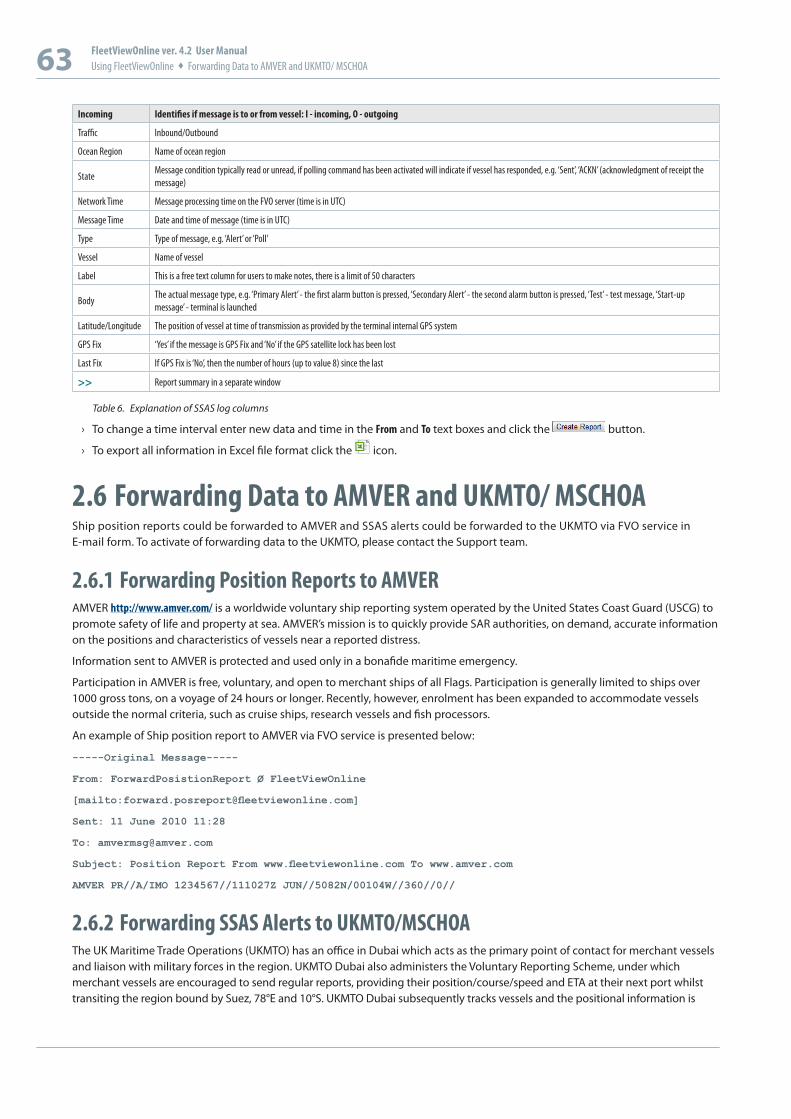
63 FleetViewOnline ver. 4.2 User ManualUsing FleetViewOnline Forwarding Data to AMVER and UKMTO/ MSCHOA
Incoming Identifies if message is to or from vessel: I - incoming, O - outgoing
Traffic Inbound/Outbound
Ocean Region Name of ocean region
StateMessage condition typically read or unread, if polling command has been activated will indicate if vessel has responded, e.g. ‘Sent’, ‘ACKN’ (acknowledgment of receipt the message)
Network Time Message processing time on the FVO server (time is in UTC)
Message Time Date and time of message (time is in UTC)
Type Type of message, e.g. ‘Alert’ or ‘Poll’
Vessel Name of vessel
Label This is a free text column for users to make notes, there is a limit of 50 characters
BodyThe actual message type, e.g. ‘Primary Alert’ - the first alarm button is pressed, ‘Secondary Alert’ - the second alarm button is pressed, ‘Test’ - test message, ‘Start-up message’ - terminal is launched
Latitude/Longitude The position of vessel at time of transmission as provided by the terminal internal GPS system
GPS Fix ‘Yes’ if the message is GPS Fix and ‘No’ if the GPS satellite lock has been lost
Last Fix If GPS Fix is ‘No’, then the number of hours (up to value 8) since the last
>> Report summary in a separate window
Table 6. Explanation of SSAS log columns
› To change a time interval enter new data and time in the From and To text boxes and click the button.
› To export all information in Excel file format click the icon.
2.6 Forwarding Data to AMVER and UKMTO/ MSCHOAShip position reports could be forwarded to AMVER and SSAS alerts could be forwarded to the UKMTO via FVO service in E-mail form. To activate of forwarding data to the UKMTO, please contact the Support team.
2.6.1 Forwarding Position Reports to AMVERAMVER http://www.amver.com/ is a worldwide voluntary ship reporting system operated by the United States Coast Guard (USCG) to promote safety of life and property at sea. AMVER’s mission is to quickly provide SAR authorities, on demand, accurate information on the positions and characteristics of vessels near a reported distress.
Information sent to AMVER is protected and used only in a bonafide maritime emergency.
Participation in AMVER is free, voluntary, and open to merchant ships of all Flags. Participation is generally limited to ships over 1000 gross tons, on a voyage of 24 hours or longer. Recently, however, enrolment has been expanded to accommodate vessels outside the normal criteria, such as cruise ships, research vessels and fish processors.
An example of Ship position report to AMVER via FVO service is presented below:
-----Original Message-----
From: ForwardPosistionReport Ø FleetViewOnline
[mailto:[email protected]]
Sent: 11 June 2010 11:28
Subject: Position Report From www.fleetviewonline.com To www.amver.com
AMVER PR//A/IMO 1234567//111027Z JUN//5082N/00104W//360//0//
2.6.2 Forwarding SSAS Alerts to UKMTO/MSCHOAThe UK Maritime Trade Operations (UKMTO) has an office in Dubai which acts as the primary point of contact for merchant vessels and liaison with military forces in the region. UKMTO Dubai also administers the Voluntary Reporting Scheme, under which merchant vessels are encouraged to send regular reports, providing their position/course/speed and ETA at their next port whilst transiting the region bound by Suez, 78°E and 10°S. UKMTO Dubai subsequently tracks vessels and the positional information is
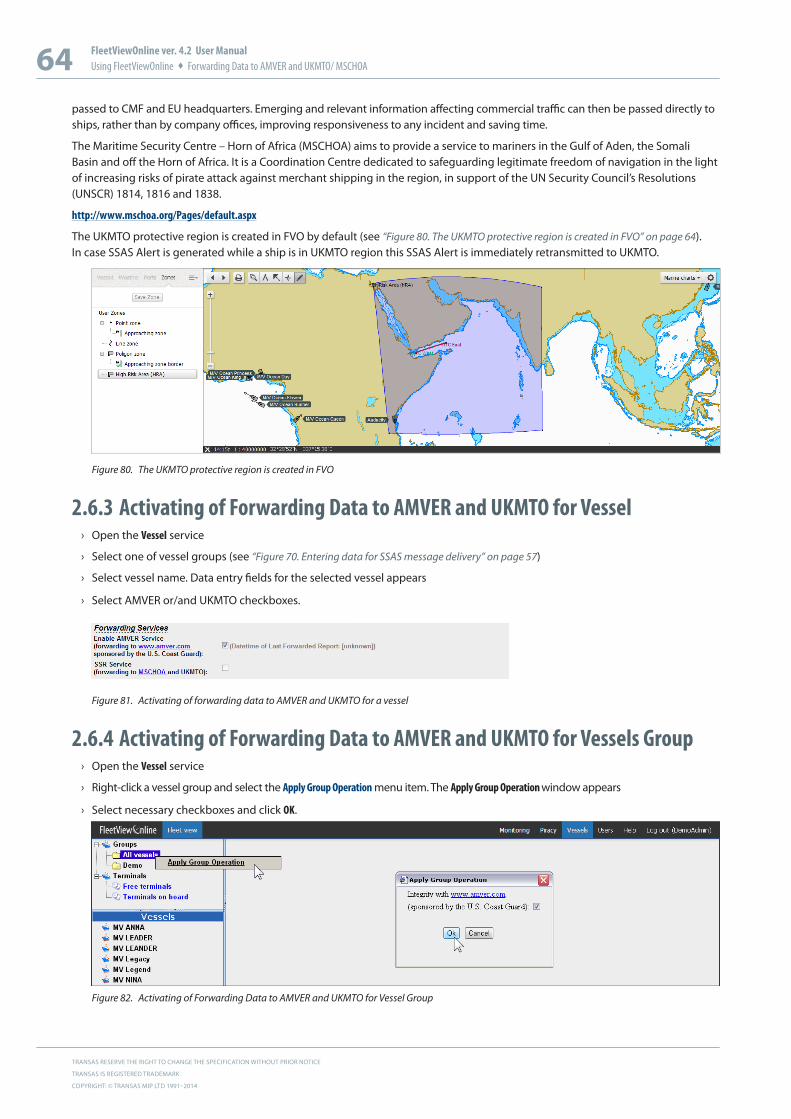
TRANSAS RESERVE THE RIGHT TO CHANGE THE SPECIFICATION WITHOUT PRIOR NOTICE
TRANSAS IS REGISTERED TRADEMARK
COPYRIGHT: © TRANSAS MIP LTD 1991–2014
64 FleetViewOnline ver. 4.2 User ManualUsing FleetViewOnline Forwarding Data to AMVER and UKMTO/ MSCHOA
passed to CMF and EU headquarters. Emerging and relevant information affecting commercial traffic can then be passed directly to ships, rather than by company offices, improving responsiveness to any incident and saving time.
The Maritime Security Centre – Horn of Africa (MSCHOA) aims to provide a service to mariners in the Gulf of Aden, the Somali Basin and off the Horn of Africa. It is a Coordination Centre dedicated to safeguarding legitimate freedom of navigation in the light of increasing risks of pirate attack against merchant shipping in the region, in support of the UN Security Council’s Resolutions (UNSCR) 1814, 1816 and 1838.
http://www.mschoa.org/Pages/default.aspx
The UKMTO protective region is created in FVO by default (see “Figure 80. The UKMTO protective region is created in FVO” on page 64). In case SSAS Alert is generated while a ship is in UKMTO region this SSAS Alert is immediately retransmitted to UKMTO.
Figure 80. The UKMTO protective region is created in FVO
2.6.3 Activating of Forwarding Data to AMVER and UKMTO for Vessel › Open the Vessel service
› Select one of vessel groups (see “Figure 70. Entering data for SSAS message delivery” on page 57)
› Select vessel name. Data entry fields for the selected vessel appears
› Select AMVER or/and UKMTO checkboxes.
Figure 81. Activating of forwarding data to AMVER and UKMTO for a vessel
2.6.4 Activating of Forwarding Data to AMVER and UKMTO for Vessels Group › Open the Vessel service
› Right-click a vessel group and select the Apply Group Operation menu item. The Apply Group Operation window appears
› Select necessary checkboxes and click OK.
Figure 82. Activating of Forwarding Data to AMVER and UKMTO for Vessel Group
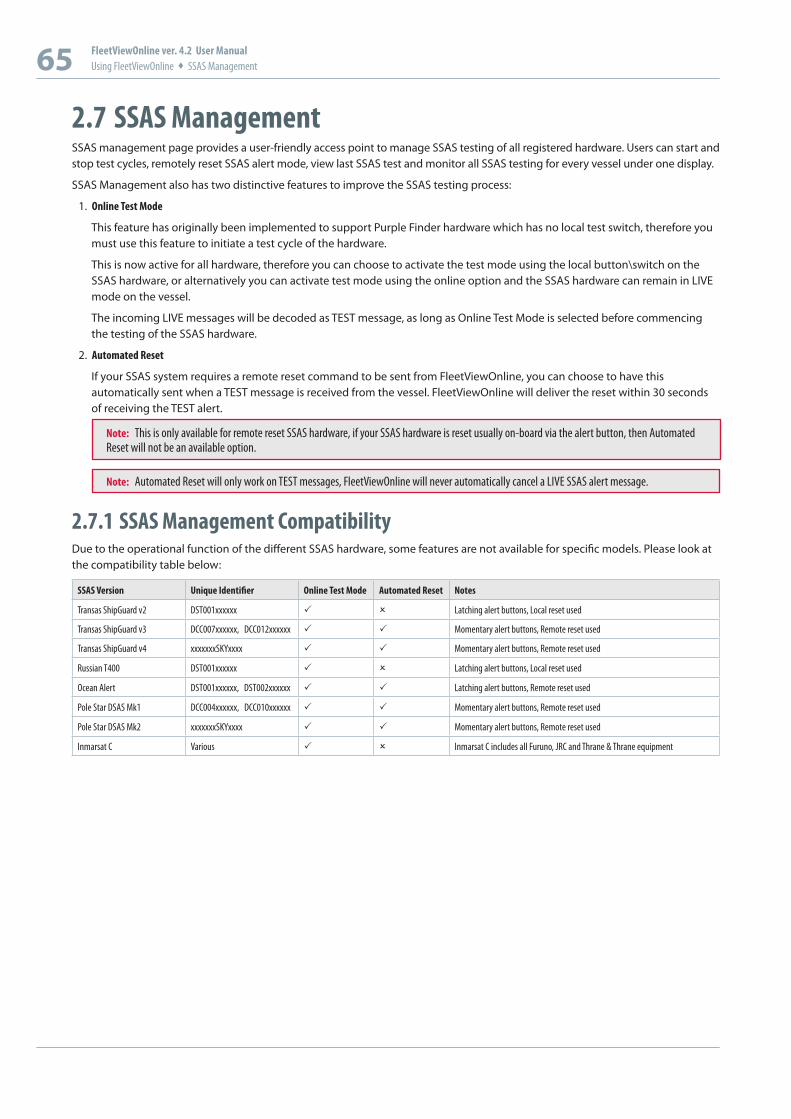
65 FleetViewOnline ver. 4.2 User ManualUsing FleetViewOnline SSAS Management
2.7 SSAS ManagementSSAS management page provides a user-friendly access point to manage SSAS testing of all registered hardware. Users can start and stop test cycles, remotely reset SSAS alert mode, view last SSAS test and monitor all SSAS testing for every vessel under one display.
SSAS Management also has two distinctive features to improve the SSAS testing process:
1. Online Test Mode
This feature has originally been implemented to support Purple Finder hardware which has no local test switch, therefore you must use this feature to initiate a test cycle of the hardware.
This is now active for all hardware, therefore you can choose to activate the test mode using the local button\switch on the SSAS hardware, or alternatively you can activate test mode using the online option and the SSAS hardware can remain in LIVE mode on the vessel.
The incoming LIVE messages will be decoded as TEST message, as long as Online Test Mode is selected before commencing the testing of the SSAS hardware.
2. Automated Reset
If your SSAS system requires a remote reset command to be sent from FleetViewOnline, you can choose to have this automatically sent when a TEST message is received from the vessel. FleetViewOnline will deliver the reset within 30 seconds of receiving the TEST alert.
Note: This is only available for remote reset SSAS hardware, if your SSAS hardware is reset usually on-board via the alert button, then Automated Reset will not be an available option.
Note: Automated Reset will only work on TEST messages, FleetViewOnline will never automatically cancel a LIVE SSAS alert message.
2.7.1 SSAS Management CompatibilityDue to the operational function of the different SSAS hardware, some features are not available for specific models. Please look at the compatibility table below:
SSAS Version Unique Identifier Online Test Mode Automated Reset Notes
Transas ShipGuard v2 DST001xxxxxx Latching alert buttons, Local reset used
Transas ShipGuard v3 DCC007xxxxxx, DCC012xxxxxx Momentary alert buttons, Remote reset used
Transas ShipGuard v4 xxxxxxxSKYxxxx Momentary alert buttons, Remote reset used
Russian T400 DST001xxxxxx Latching alert buttons, Local reset used
Ocean Alert DST001xxxxxx, DST002xxxxxx Latching alert buttons, Remote reset used
Pole Star DSAS Mk1 DCC004xxxxxx, DCC010xxxxxx Momentary alert buttons, Remote reset used
Pole Star DSAS Mk2 xxxxxxxSKYxxxx Momentary alert buttons, Remote reset used
Inmarsat C Various Inmarsat C includes all Furuno, JRC and Thrane & Thrane equipment
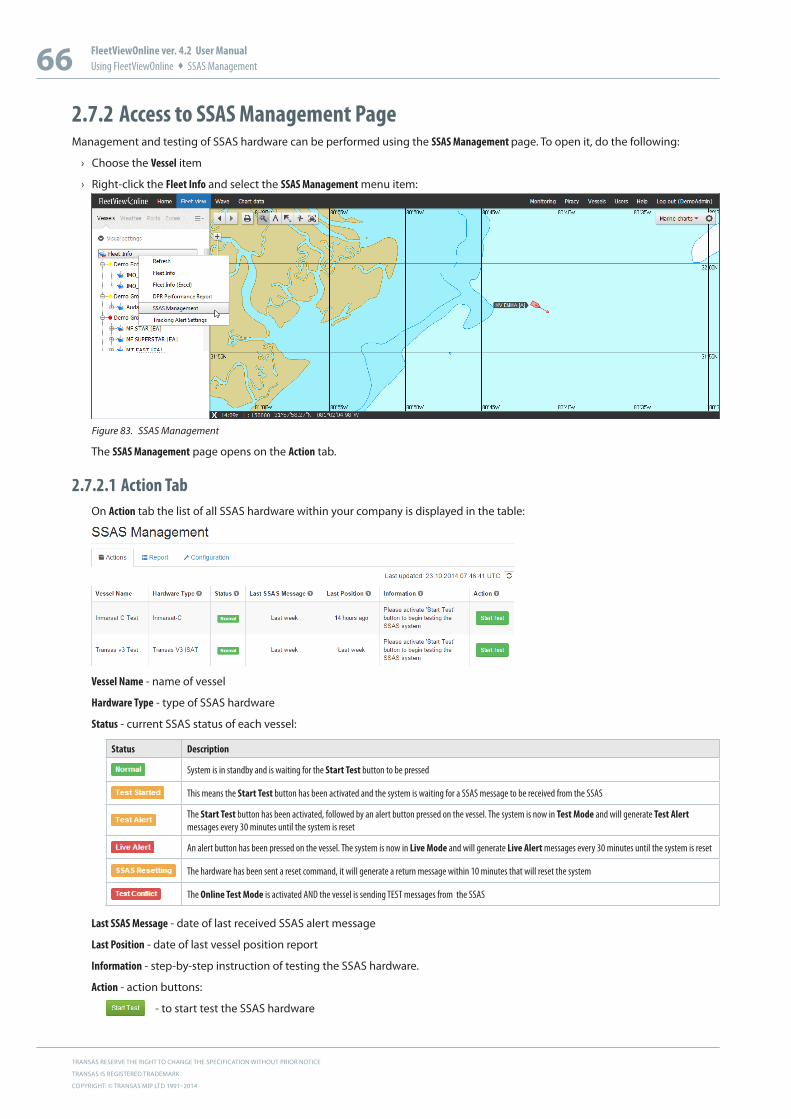
TRANSAS RESERVE THE RIGHT TO CHANGE THE SPECIFICATION WITHOUT PRIOR NOTICE
TRANSAS IS REGISTERED TRADEMARK
COPYRIGHT: © TRANSAS MIP LTD 1991–2014
66 FleetViewOnline ver. 4.2 User ManualUsing FleetViewOnline SSAS Management
2.7.2 Access to SSAS Management PageManagement and testing of SSAS hardware can be performed using the SSAS Management page. To open it, do the following:
› Choose the Vessel item
› Right-click the Fleet Info and select the SSAS Management menu item:
Figure 83. SSAS Management
The SSAS Management page opens on the Action tab.
2.7.2.1 Action TabOn Action tab the list of all SSAS hardware within your company is displayed in the table:
Vessel Name - name of vessel
Hardware Type - type of SSAS hardware
Status - current SSAS status of each vessel:
Status Description
System is in standby and is waiting for the Start Test button to be pressed
This means the Start Test button has been activated and the system is waiting for a SSAS message to be received from the SSAS
The Start Test button has been activated, followed by an alert button pressed on the vessel. The system is now in Test Mode and will generate Test Alert messages every 30 minutes until the system is reset
An alert button has been pressed on the vessel. The system is now in Live Mode and will generate Live Alert messages every 30 minutes until the system is reset
The hardware has been sent a reset command, it will generate a return message within 10 minutes that will reset the system
The Online Test Mode is activated AND the vessel is sending TEST messages from the SSAS
Last SSAS Message - date of last received SSAS alert message
Last Position - date of last vessel position report
Information - step-by-step instruction of testing the SSAS hardware.
Action - action buttons:
- to start test the SSAS hardware
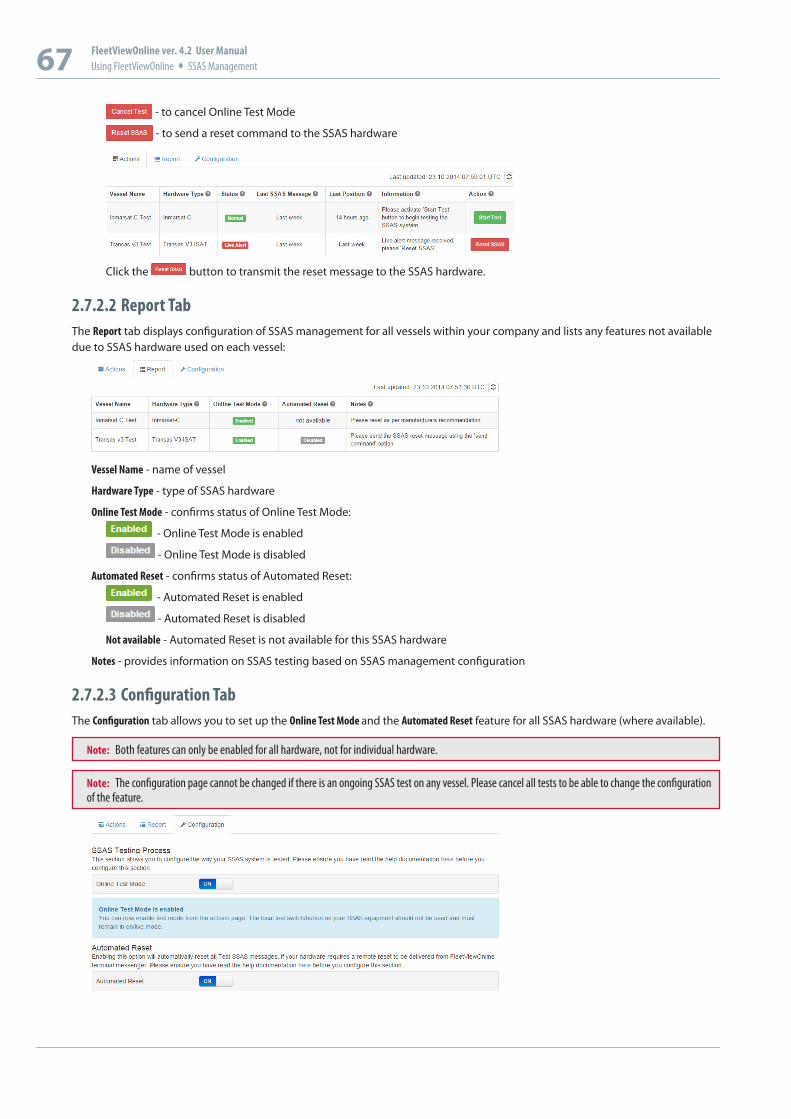
67 FleetViewOnline ver. 4.2 User ManualUsing FleetViewOnline SSAS Management
- to cancel Online Test Mode
- to send a reset command to the SSAS hardware
Click the button to transmit the reset message to the SSAS hardware.
2.7.2.2 Report TabThe Report tab displays configuration of SSAS management for all vessels within your company and lists any features not available due to SSAS hardware used on each vessel:
Vessel Name - name of vessel
Hardware Type - type of SSAS hardware
Online Test Mode - confirms status of Online Test Mode:
- Online Test Mode is enabled
- Online Test Mode is disabled
Automated Reset - confirms status of Automated Reset:
- Automated Reset is enabled
- Automated Reset is disabled
Not available - Automated Reset is not available for this SSAS hardware
Notes - provides information on SSAS testing based on SSAS management configuration
2.7.2.3 Configuration TabThe Configuration tab allows you to set up the Online Test Mode and the Automated Reset feature for all SSAS hardware (where available).
Note: Both features can only be enabled for all hardware, not for individual hardware.
Note: The configuration page cannot be changed if there is an ongoing SSAS test on any vessel. Please cancel all tests to be able to change the configuration of the feature.
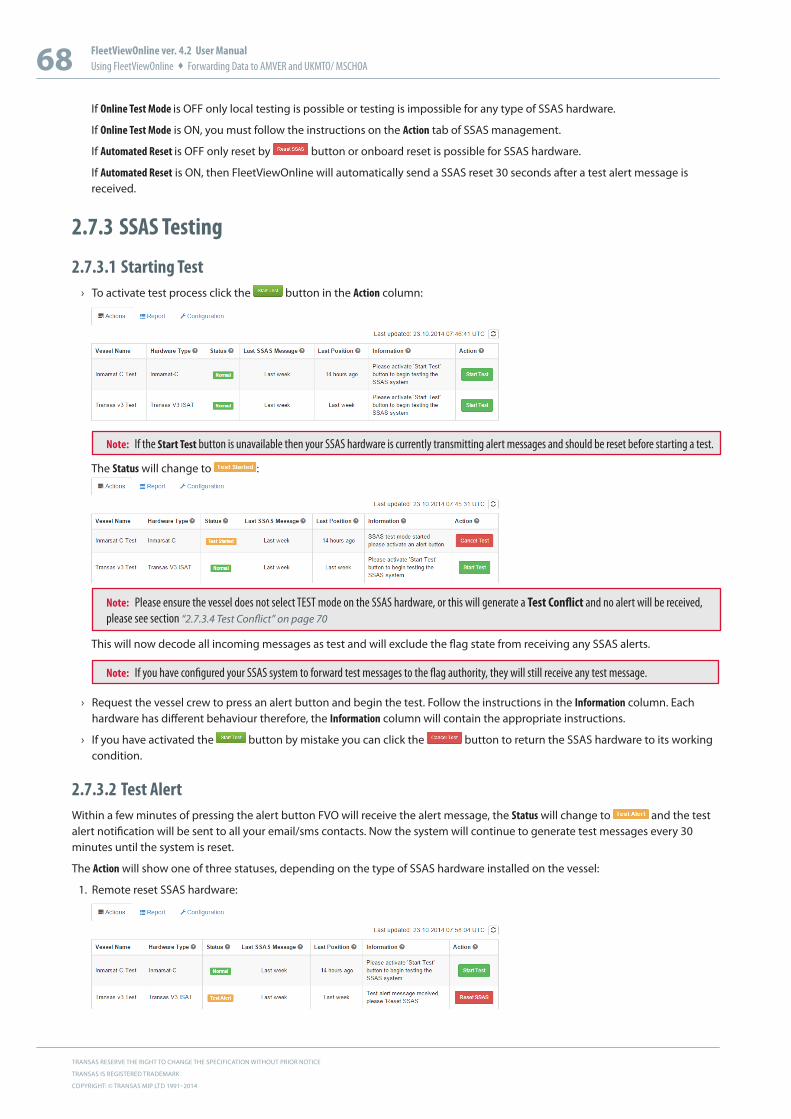
TRANSAS RESERVE THE RIGHT TO CHANGE THE SPECIFICATION WITHOUT PRIOR NOTICE
TRANSAS IS REGISTERED TRADEMARK
COPYRIGHT: © TRANSAS MIP LTD 1991–2014
68 FleetViewOnline ver. 4.2 User ManualUsing FleetViewOnline Forwarding Data to AMVER and UKMTO/ MSCHOA
If Online Test Mode is OFF only local testing is possible or testing is impossible for any type of SSAS hardware.
If Online Test Mode is ON, you must follow the instructions on the Action tab of SSAS management.
If Automated Reset is OFF only reset by button or onboard reset is possible for SSAS hardware.
If Automated Reset is ON, then FleetViewOnline will automatically send a SSAS reset 30 seconds after a test alert message is received.
2.7.3 SSAS Testing
2.7.3.1 Starting Test › To activate test process click the button in the Action column:
Note: If the Start Test button is unavailable then your SSAS hardware is currently transmitting alert messages and should be reset before starting a test.
The Status will change to :
Note: Please ensure the vessel does not select TEST mode on the SSAS hardware, or this will generate a Test Conflict and no alert will be received, please see section “2.7.3.4 Test Conflict” on page 70
This will now decode all incoming messages as test and will exclude the flag state from receiving any SSAS alerts.
Note: If you have configured your SSAS system to forward test messages to the flag authority, they will still receive any test message.
› Request the vessel crew to press an alert button and begin the test. Follow the instructions in the Information column. Each hardware has different behaviour therefore, the Information column will contain the appropriate instructions.
› If you have activated the button by mistake you can click the button to return the SSAS hardware to its working condition.
2.7.3.2 Test AlertWithin a few minutes of pressing the alert button FVO will receive the alert message, the Status will change to and the test alert notification will be sent to all your email/sms contacts. Now the system will continue to generate test messages every 30 minutes until the system is reset.
The Action will show one of three statuses, depending on the type of SSAS hardware installed on the vessel:
1. Remote reset SSAS hardware:

69 FleetViewOnline ver. 4.2 User ManualUsing FleetViewOnline SSAS Management
ű Click the button to transmit the reset message to the SSAS hardware
2. Local reset SSAS hardware
ű See the information message in the Information column.
3. Automated Reset
ű See the information message in the Information column.
Note: If the Status does not change within 10 minutes then refresh the page and check the alert button on the SSAS hardware has been pressed correctly.
2.7.3.3 Reset Test AlertAfter resetting the SSAS alert the Status will change to and a forward message will be sent to the SSAS hardware to reset the SSAS:
The SSAS receives the message and transits a reset confirmation message to FVO within 10 minutes. When FVO receives the reset confirmation message the Status will change to and the Action will change to :
Once the SSAS system is reset and you have finished with testing, you can click the button to exit the Test mode and to return the SSAS system to , or you can activate another alert button on the vessel and continue with the testing process.
If you do not click the button after completing your SSAS testing, the system will automatically exit the Online Test Mode after 4 hours of inactivity.
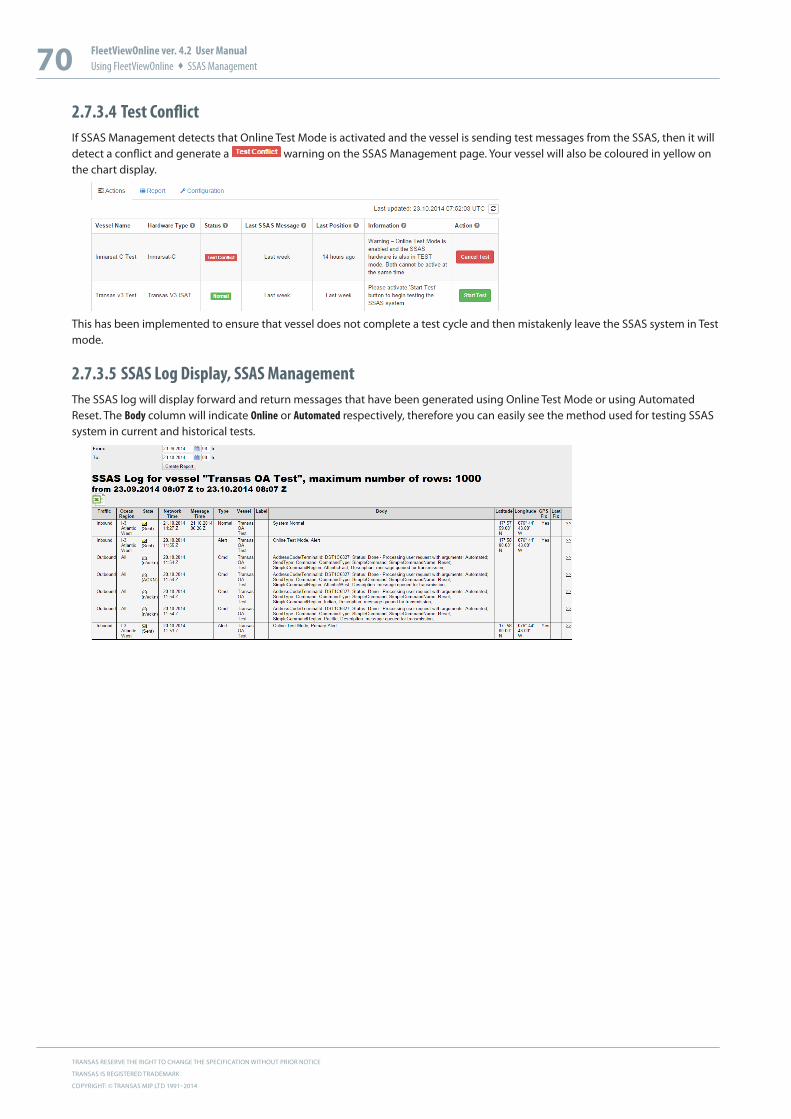
TRANSAS RESERVE THE RIGHT TO CHANGE THE SPECIFICATION WITHOUT PRIOR NOTICE
TRANSAS IS REGISTERED TRADEMARK
COPYRIGHT: © TRANSAS MIP LTD 1991–2014
70 FleetViewOnline ver. 4.2 User ManualUsing FleetViewOnline SSAS Management
2.7.3.4 Test ConflictIf SSAS Management detects that Online Test Mode is activated and the vessel is sending test messages from the SSAS, then it will detect a conflict and generate a warning on the SSAS Management page. Your vessel will also be coloured in yellow on the chart display.
This has been implemented to ensure that vessel does not complete a test cycle and then mistakenly leave the SSAS system in Test mode.
2.7.3.5 SSAS Log Display, SSAS ManagementThe SSAS log will display forward and return messages that have been generated using Online Test Mode or using Automated Reset. The Body column will indicate Online or Automated respectively, therefore you can easily see the method used for testing SSAS system in current and historical tests.

71 FleetViewOnline ver. 4.2 User ManualUsing FleetViewOnline Chart Data
2.8 Chart DataThe Chart data service is intended for shipping companies to monitor of their vessels charts usage. The following functionality are available:
• Viewing information about licensed TADS/AVCS charts and their expiration dates by each vessel of fleet
• Approving or cancelling chart orders
• Exporting information to MS Excel file.
• Viewing chart catalogue.
2.8.1 Ordering charts › Click the Chart data item to activate the chart monitoring service. The list of ships opens at the left of page.
› To see information about licensed charts right-click the ship name and choose the Show charts item from the pop-up menu. The table and diagram appears on the page:
Figure 84. Ordering charts
On the map, all the ordered charts will be outlined with green color.
In the table will be displayed the list of ordered charts. Rows of charts with expired license are marked with pink.
Charts selected in the table will be highlighted on the map with red color:
Figure 85. Selected charts
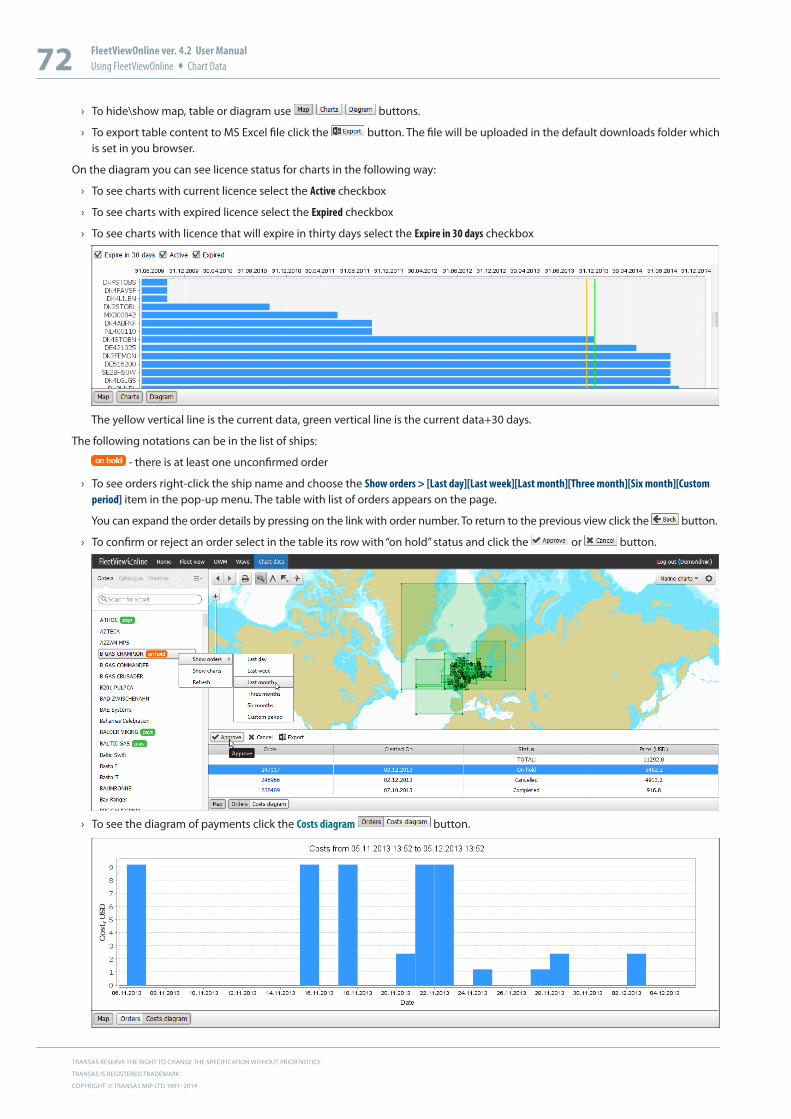
TRANSAS RESERVE THE RIGHT TO CHANGE THE SPECIFICATION WITHOUT PRIOR NOTICE
TRANSAS IS REGISTERED TRADEMARK
COPYRIGHT: © TRANSAS MIP LTD 1991–2014
72 FleetViewOnline ver. 4.2 User ManualUsing FleetViewOnline Chart Data
› To hide\show map, table or diagram use buttons.
› To export table content to MS Excel file click the button. The file will be uploaded in the default downloads folder which is set in you browser.
On the diagram you can see licence status for charts in the following way:
› To see charts with current licence select the Active checkbox
› To see charts with expired licence select the Expired checkbox
› To see charts with licence that will expire in thirty days select the Expire in 30 days checkbox
The yellow vertical line is the current data, green vertical line is the current data+30 days.
The following notations can be in the list of ships:
- there is at least one unconfirmed order
› To see orders right-click the ship name and choose the Show orders > [Last day][Last week][Last month][Three month][Six month][Custom period] item in the pop-up menu. The table with list of orders appears on the page.
You can expand the order details by pressing on the link with order number. To return to the previous view click the button.
› To confirm or reject an order select in the table its row with “on hold” status and click the or button.
› To see the diagram of payments click the Costs diagram button.
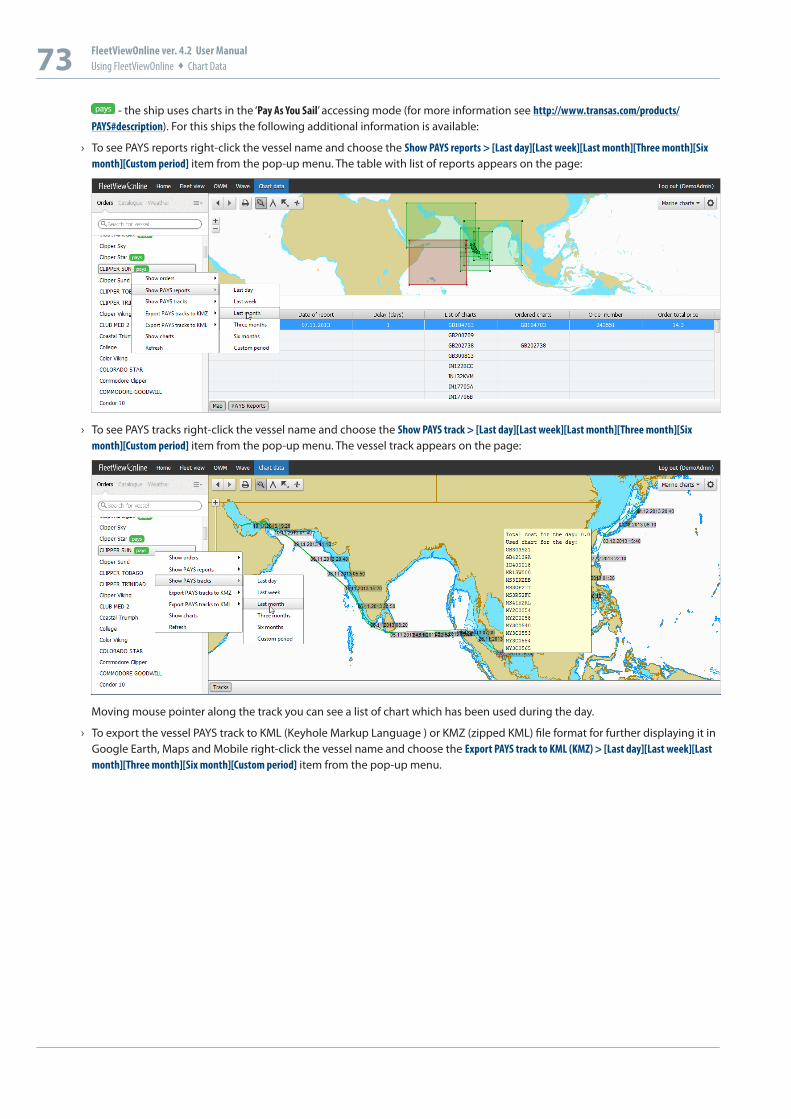
73 FleetViewOnline ver. 4.2 User ManualUsing FleetViewOnline Chart Data
- the ship uses charts in the ‘Pay As You Sail’ accessing mode (for more information see http://www.transas.com/products/PAYS#description). For this ships the following additional information is available:
› To see PAYS reports right-click the vessel name and choose the Show PAYS reports > [Last day][Last week][Last month][Three month][Six month][Custom period] item from the pop-up menu. The table with list of reports appears on the page:
› To see PAYS tracks right-click the vessel name and choose the Show PAYS track > [Last day][Last week][Last month][Three month][Six month][Custom period] item from the pop-up menu. The vessel track appears on the page:
Moving mouse pointer along the track you can see a list of chart which has been used during the day.
› To export the vessel PAYS track to KML (Keyhole Markup Language ) or KMZ (zipped KML) file format for further displaying it in Google Earth, Maps and Mobile right-click the vessel name and choose the Export PAYS track to KML (KMZ) > [Last day][Last week][Last month][Three month][Six month][Custom period] item from the pop-up menu.
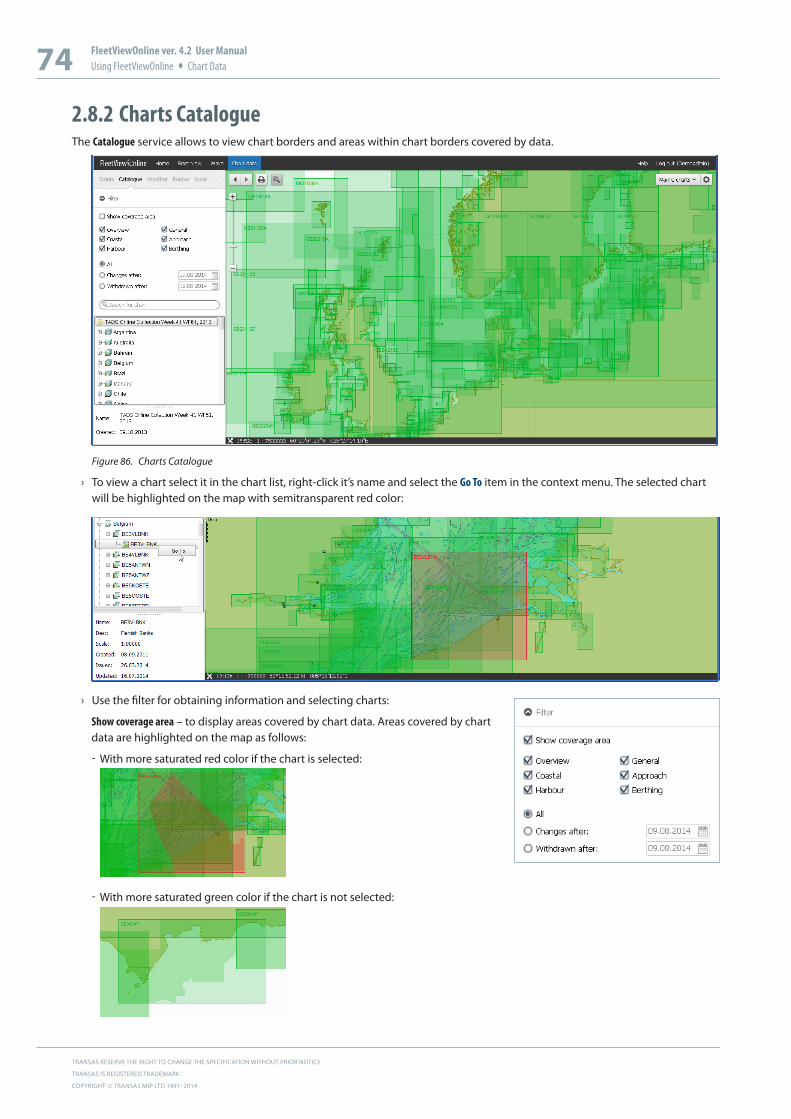
TRANSAS RESERVE THE RIGHT TO CHANGE THE SPECIFICATION WITHOUT PRIOR NOTICE
TRANSAS IS REGISTERED TRADEMARK
COPYRIGHT: © TRANSAS MIP LTD 1991–2014
74 FleetViewOnline ver. 4.2 User ManualUsing FleetViewOnline Chart Data
2.8.2 Charts CatalogueThe Catalogue service allows to view chart borders and areas within chart borders covered by data.
Figure 86. Charts Catalogue
› To view a chart select it in the chart list, right-click it’s name and select the Go To item in the context menu. The selected chart will be highlighted on the map with semitransparent red color:
› Use the filter for obtaining information and selecting charts:
Show coverage area – to display areas covered by chart data. Areas covered by chart data are highlighted on the map as follows:
ű With more saturated red color if the chart is selected:
ű With more saturated green color if the chart is not selected:
75 FleetViewOnline ver. 4.2 User ManualUsing FleetViewOnline Chart Data
Overview – is for overview charts with scales ranging from 1:1,500,001 or smaller
General – is for general charts with scales ranging from 1:600,001 - 1:1,500,000
Coastal – is for coastal charts with scales ranging from 1:150,001 - 1:600,000
Approach – is for approach charts with scales ranging from 1:50,001 - 1:150,000
Harbour – is for harbour charts with scales ranging from 1:25,000 – 1:50,000
Berthing – is for berthing charts with scales ranging from 1:24,999 or larger
All – to display all the charts
Changes after – to display charts issued for the first time and charts whose new editions have appeared, or which have been updated after the specified date
Withdrawn after – to display the charts removed from the collection after the specified date.
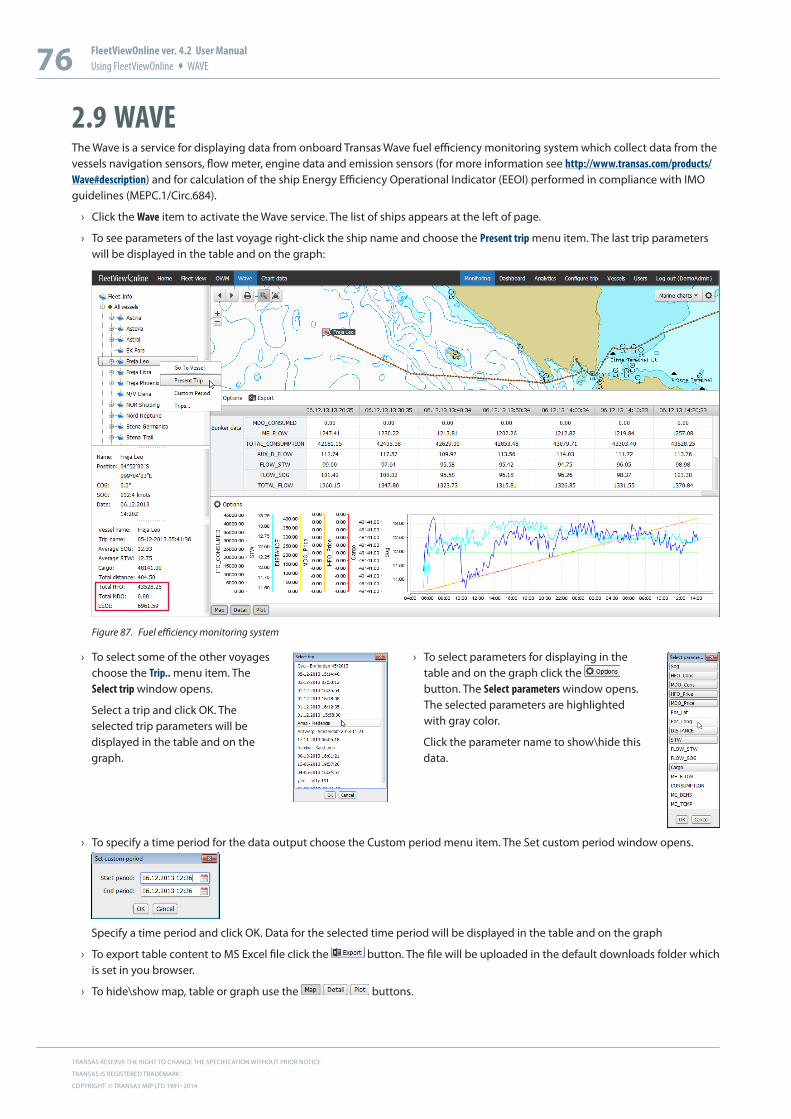
TRANSAS RESERVE THE RIGHT TO CHANGE THE SPECIFICATION WITHOUT PRIOR NOTICE
TRANSAS IS REGISTERED TRADEMARK
COPYRIGHT: © TRANSAS MIP LTD 1991–2014
76 FleetViewOnline ver. 4.2 User ManualUsing FleetViewOnline WAVE
2.9 WAVEThe Wave is a service for displaying data from onboard Transas Wave fuel efficiency monitoring system which collect data from the vessels navigation sensors, flow meter, engine data and emission sensors (for more information see http://www.transas.com/products/Wave#description) and for calculation of the ship Energy Efficiency Operational Indicator (EEOI) performed in compliance with IMO guidelines (MEPC.1/Circ.684).
› Click the Wave item to activate the Wave service. The list of ships appears at the left of page.
› To see parameters of the last voyage right-click the ship name and choose the Present trip menu item. The last trip parameters will be displayed in the table and on the graph:
Figure 87. Fuel efficiency monitoring system
› To select some of the other voyages choose the Trip.. menu item. The Select trip window opens.
Select a trip and click OK. The selected trip parameters will be displayed in the table and on the graph.
› To select parameters for displaying in the table and on the graph click the button. The Select parameters window opens. The selected parameters are highlighted with gray color.
Click the parameter name to show\hide this data.
› To specify a time period for the data output choose the Custom period menu item. The Set custom period window opens.
Specify a time period and click OK. Data for the selected time period will be displayed in the table and on the graph
› To export table content to MS Excel file click the button. The file will be uploaded in the default downloads folder which is set in you browser.
› To hide\show map, table or graph use the buttons.
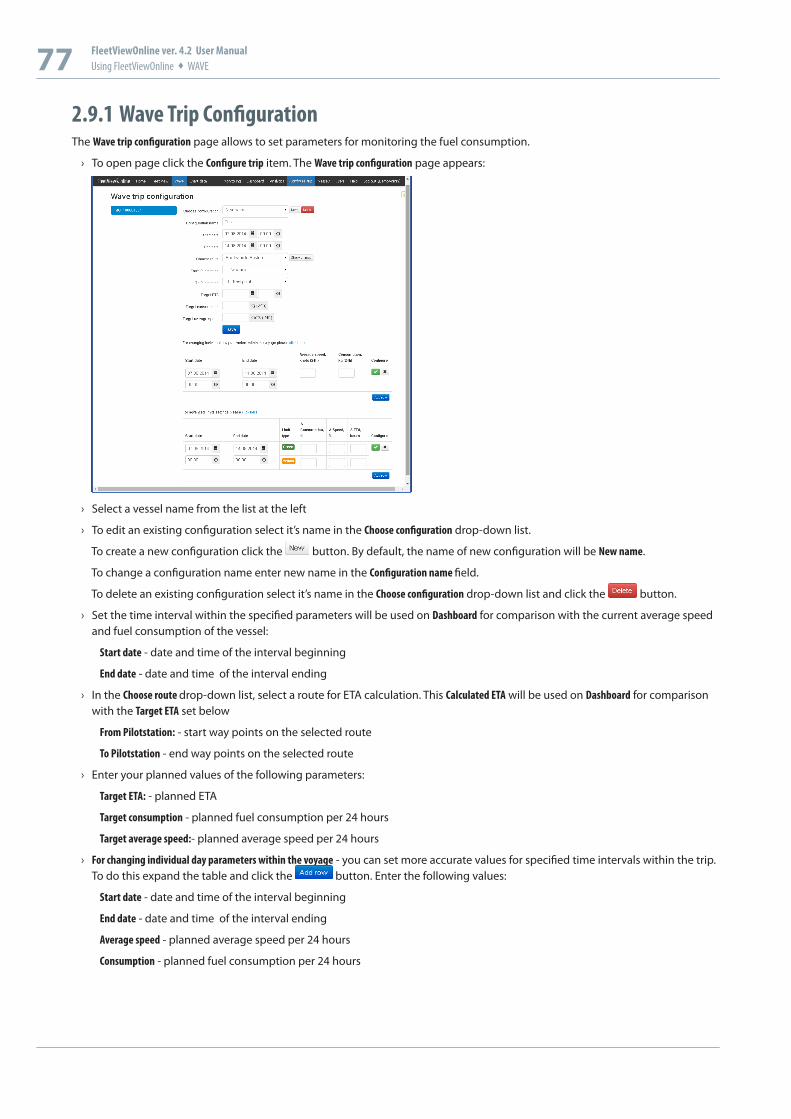
77 FleetViewOnline ver. 4.2 User ManualUsing FleetViewOnline WAVE
2.9.1 Wave Trip ConfigurationThe Wave trip configuration page allows to set parameters for monitoring the fuel consumption.
› To open page click the Configure trip item. The Wave trip configuration page appears:
› Select a vessel name from the list at the left
› To edit an existing configuration select it’s name in the Choose configuration drop-down list.
To create a new configuration click the button. By default, the name of new configuration will be New name.
To change a configuration name enter new name in the Configuration name field.
To delete an existing configuration select it’s name in the Choose configuration drop-down list and click the button.
› Set the time interval within the specified parameters will be used on Dashboard for comparison with the current average speed and fuel consumption of the vessel:
Start date - date and time of the interval beginning
End date - date and time of the interval ending
› In the Choose route drop-down list, select a route for ETA calculation. This Calculated ETA will be used on Dashboard for comparison with the Target ETA set below
From Pilotstation: - start way points on the selected route
To Pilotstation - end way points on the selected route
› Enter your planned values of the following parameters:
Target ETA: - planned ETA
Target consumption - planned fuel consumption per 24 hours
Target average speed:- planned average speed per 24 hours
› For changing individual day parameters within the voyage - you can set more accurate values for specified time intervals within the trip. To do this expand the table and click the button. Enter the following values:
Start date - date and time of the interval beginning
End date - date and time of the interval ending
Average speed - planned average speed per 24 hours
Consumption - planned fuel consumption per 24 hours
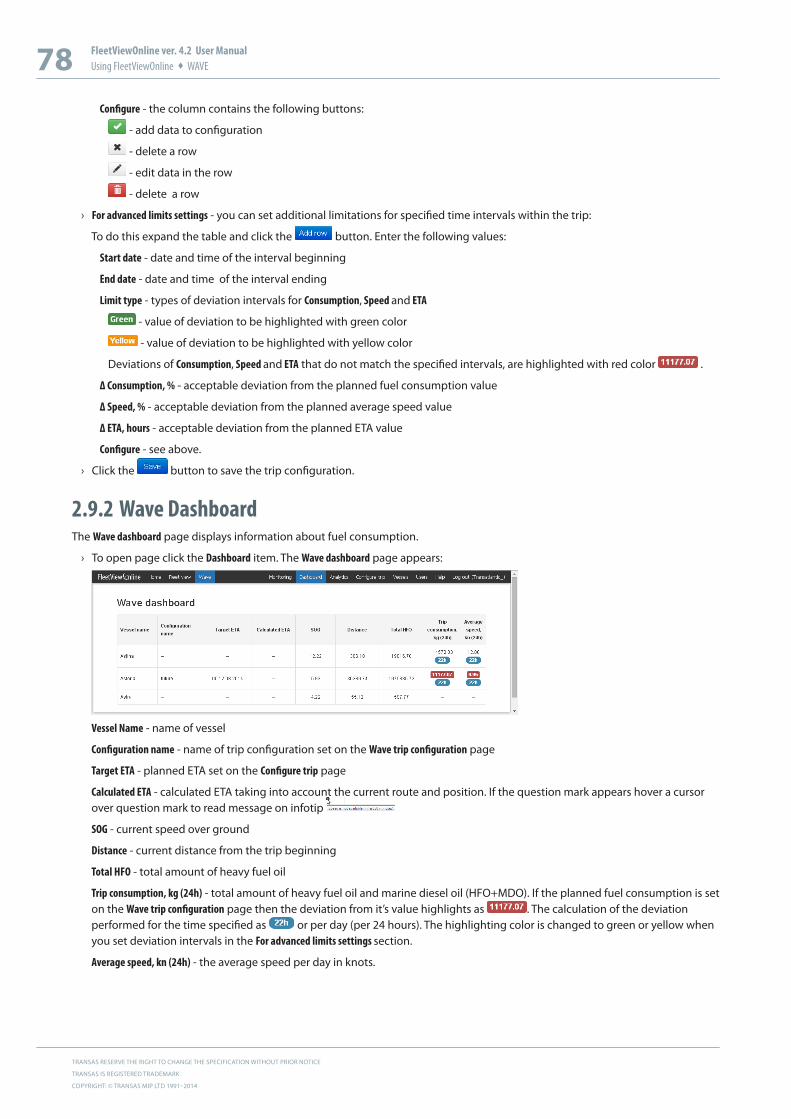
TRANSAS RESERVE THE RIGHT TO CHANGE THE SPECIFICATION WITHOUT PRIOR NOTICE
TRANSAS IS REGISTERED TRADEMARK
COPYRIGHT: © TRANSAS MIP LTD 1991–2014
78 FleetViewOnline ver. 4.2 User ManualUsing FleetViewOnline WAVE
Configure - the column contains the following buttons:
- add data to configuration
- delete a row
- edit data in the row
- delete a row
› For advanced limits settings - you can set additional limitations for specified time intervals within the trip:
To do this expand the table and click the button. Enter the following values:
Start date - date and time of the interval beginning
End date - date and time of the interval ending
Limit type - types of deviation intervals for Consumption, Speed and ETA
- value of deviation to be highlighted with green color
- value of deviation to be highlighted with yellow color
Deviations of Consumption, Speed and ETA that do not match the specified intervals, are highlighted with red color .
Δ Consumption, % - acceptable deviation from the planned fuel consumption value
Δ Speed, % - acceptable deviation from the planned average speed value
Δ ETA, hours - acceptable deviation from the planned ETA value
Configure - see above.
› Click the button to save the trip configuration.
2.9.2 Wave DashboardThe Wave dashboard page displays information about fuel consumption.
› To open page click the Dashboard item. The Wave dashboard page appears:
Vessel Name - name of vessel
Configuration name - name of trip configuration set on the Wave trip configuration page
Target ETA - planned ETA set on the Configure trip page
Calculated ETA - calculated ETA taking into account the current route and position. If the question mark appears hover a cursor over question mark to read message on infotip
SOG - current speed over ground
Distance - current distance from the trip beginning
Total HFO - total amount of heavy fuel oil
Trip consumption, kg (24h) - total amount of heavy fuel oil and marine diesel oil (HFO+MDO). If the planned fuel consumption is set on the Wave trip configuration page then the deviation from it’s value highlights as . The calculation of the deviation performed for the time specified as or per day (per 24 hours). The highlighting color is changed to green or yellow when you set deviation intervals in the For advanced limits settings section.
Average speed, kn (24h) - the average speed per day in knots.
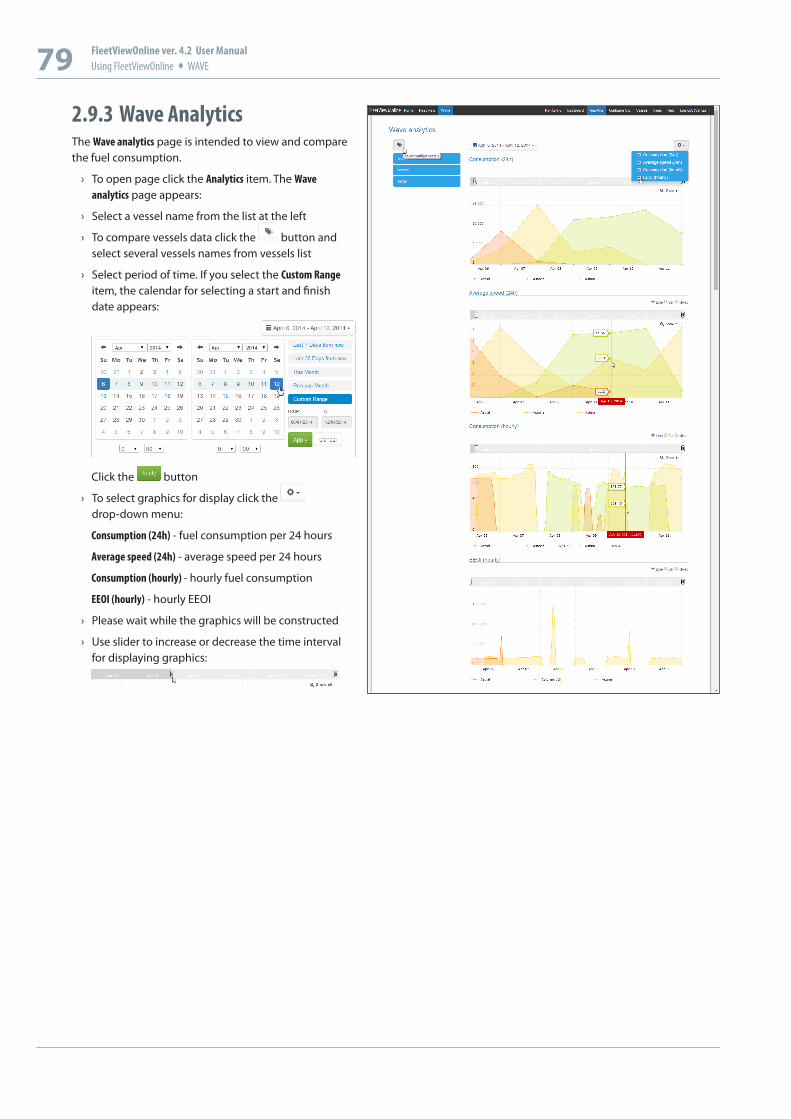
79 FleetViewOnline ver. 4.2 User ManualUsing FleetViewOnline WAVE
2.9.3 Wave AnalyticsThe Wave analytics page is intended to view and compare the fuel consumption.
› To open page click the Analytics item. The Wave analytics page appears:
› Select a vessel name from the list at the left
› To compare vessels data click the button and select several vessels names from vessels list
› Select period of time. If you select the Custom Range item, the calendar for selecting a start and finish date appears:
Click the button
› To select graphics for display click the drop-down menu:
Consumption (24h) - fuel consumption per 24 hours
Average speed (24h) - average speed per 24 hours
Consumption (hourly) - hourly fuel consumption
EEOI (hourly) - hourly EEOI
› Please wait while the graphics will be constructed
› Use slider to increase or decrease the time interval for displaying graphics:
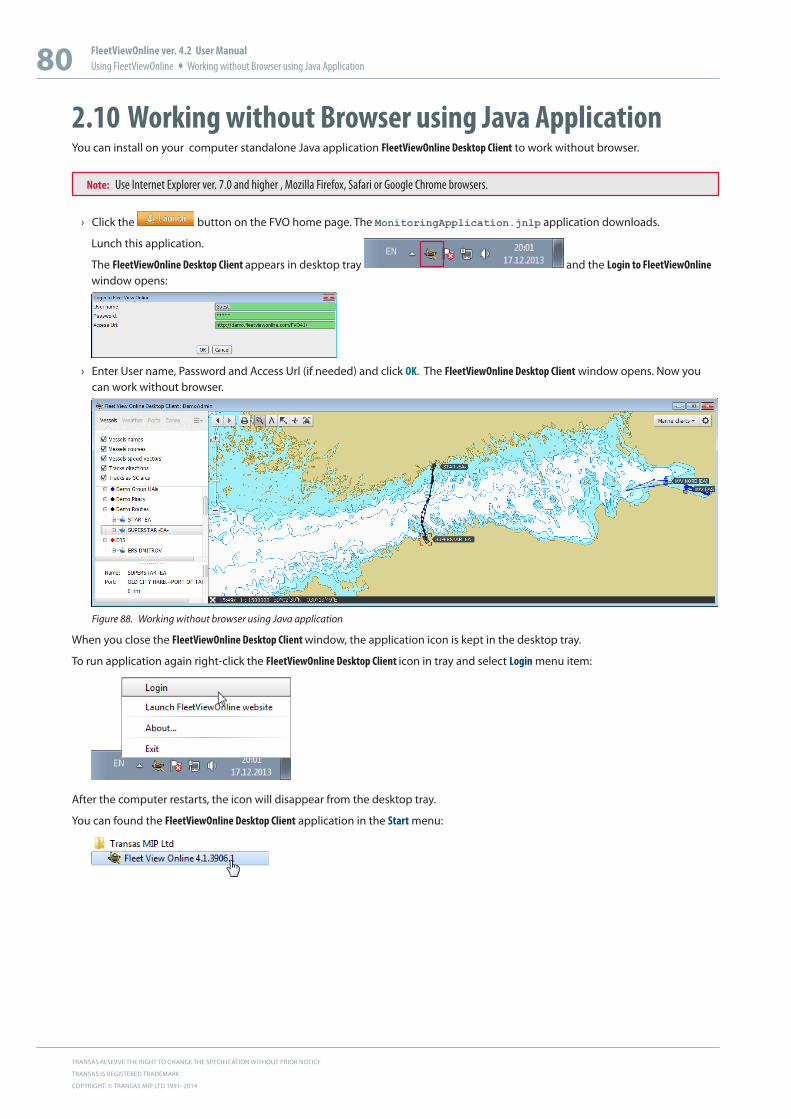
TRANSAS RESERVE THE RIGHT TO CHANGE THE SPECIFICATION WITHOUT PRIOR NOTICE
TRANSAS IS REGISTERED TRADEMARK
COPYRIGHT: © TRANSAS MIP LTD 1991–2014
80 FleetViewOnline ver. 4.2 User ManualUsing FleetViewOnline Working without Browser using Java Application
2.10 Working without Browser using Java ApplicationYou can install on your computer standalone Java application FleetViewOnline Desktop Client to work without browser.
Note: Use Internet Explorer ver. 7.0 and higher , Mozilla Firefox, Safari or Google Chrome browsers.
› Click the button on the FVO home page. The MonitoringApplication.jnlp application downloads.
Lunch this application.
The FleetViewOnline Desktop Client appears in desktop tray and the Login to FleetViewOnline window opens:
› Enter User name, Password and Access Url (if needed) and click OK. The FleetViewOnline Desktop Client window opens. Now you can work without browser.
Figure 88. Working without browser using Java application
When you close the FleetViewOnline Desktop Client window, the application icon is kept in the desktop tray.
To run application again right-click the FleetViewOnline Desktop Client icon in tray and select Login menu item:
After the computer restarts, the icon will disappear from the desktop tray.
You can found the FleetViewOnline Desktop Client application in the Start menu:
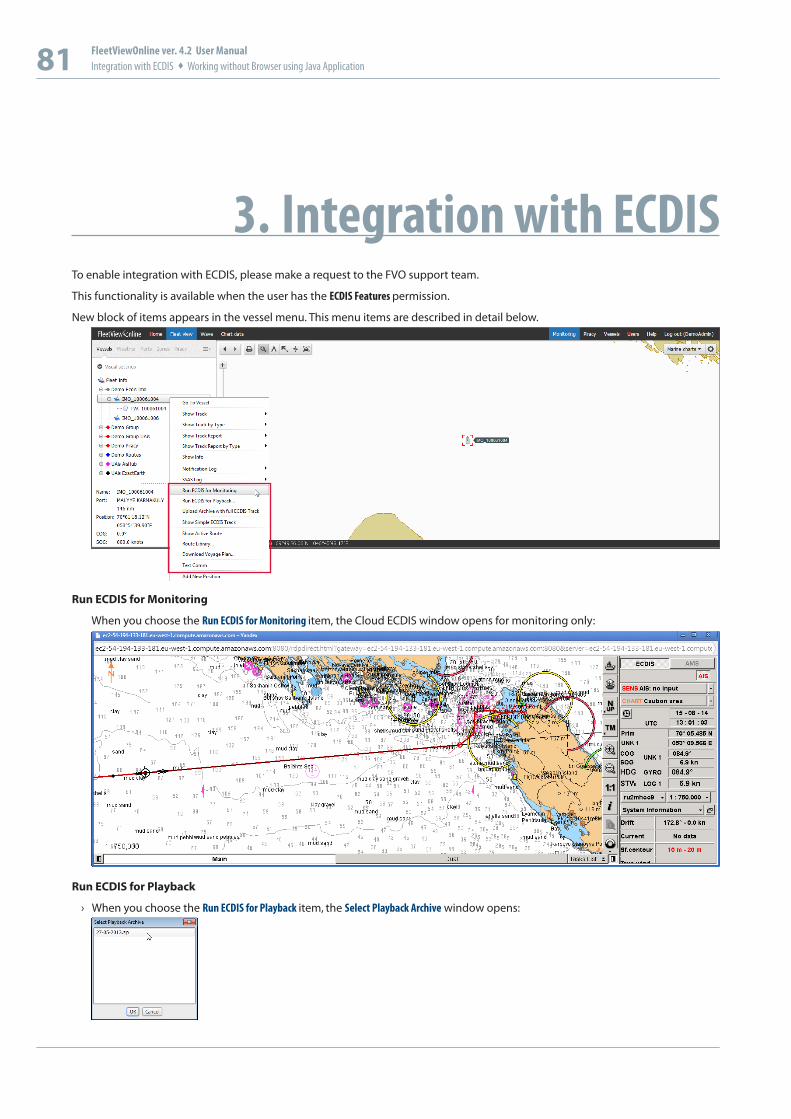
81 FleetViewOnline ver. 4.2 User ManualIntegration with ECDIS Working without Browser using Java Application
3. Integration with ECDISTo enable integration with ECDIS, please make a request to the FVO support team.
This functionality is available when the user has the ECDIS Features permission.
New block of items appears in the vessel menu. This menu items are described in detail below.
Run ECDIS for Monitoring
When you choose the Run ECDIS for Monitoring item, the Cloud ECDIS window opens for monitoring only:
Run ECDIS for Playback
› When you choose the Run ECDIS for Playback item, the Select Playback Archive window opens:
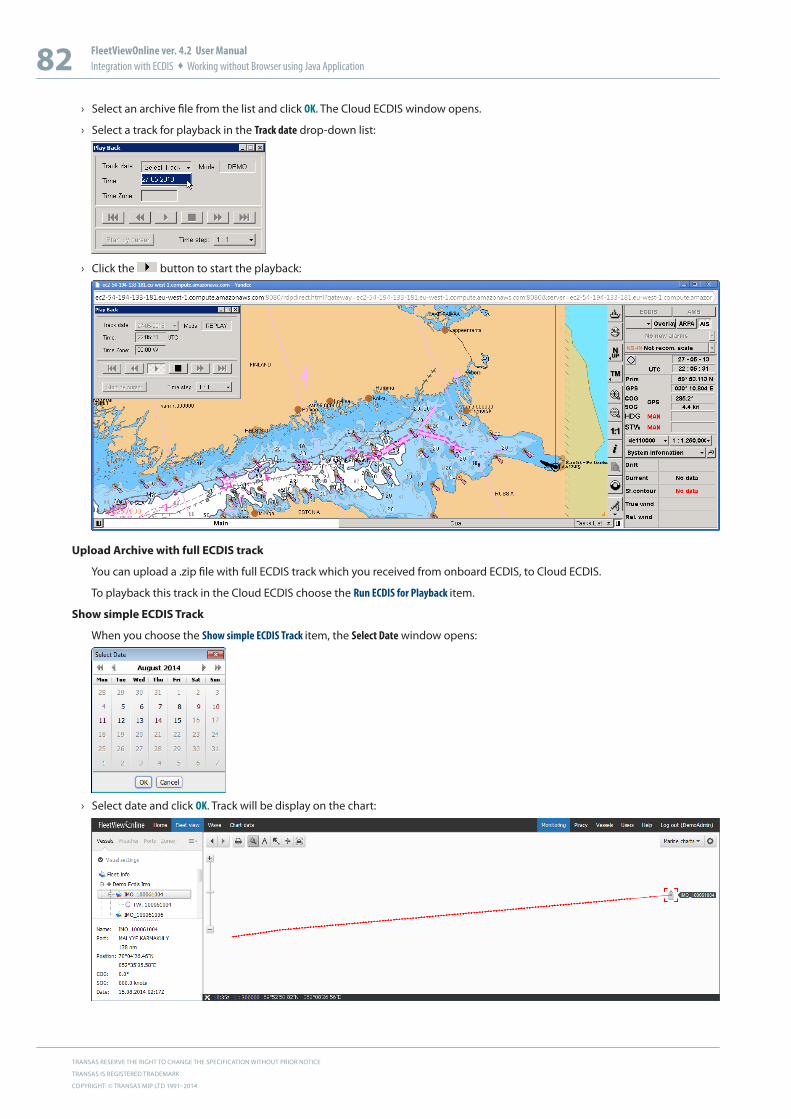
TRANSAS RESERVE THE RIGHT TO CHANGE THE SPECIFICATION WITHOUT PRIOR NOTICE
TRANSAS IS REGISTERED TRADEMARK
COPYRIGHT: © TRANSAS MIP LTD 1991–2014
82 FleetViewOnline ver. 4.2 User ManualIntegration with ECDIS Working without Browser using Java Application
› Select an archive file from the list and click OK. The Cloud ECDIS window opens.
› Select a track for playback in the Track date drop-down list:
› Click the button to start the playback:
Upload Archive with full ECDIS track
You can upload a .zip file with full ECDIS track which you received from onboard ECDIS, to Cloud ECDIS.
To playback this track in the Cloud ECDIS choose the Run ECDIS for Playback item.
Show simple ECDIS Track
When you choose the Show simple ECDIS Track item, the Select Date window opens:
› Select date and click OK. Track will be display on the chart:

83 FleetViewOnline ver. 4.2 User ManualIntegration with ECDIS Working without Browser using Java Application
Additional items will appear in vessel menu:
› To play vessel track choose the Play ECDIS Track item:
Show Active Route
The active route of selected vessel will be send from onboard NS4000 and will be display on the chart:
Route Library...
The route library will be send from onboard ECDIS and will display in the Route Library window
Download Voyage Plan
When you choose the Download Voyage Plan item the voyage plan will be send from onboard ECDIS in .pdf file.
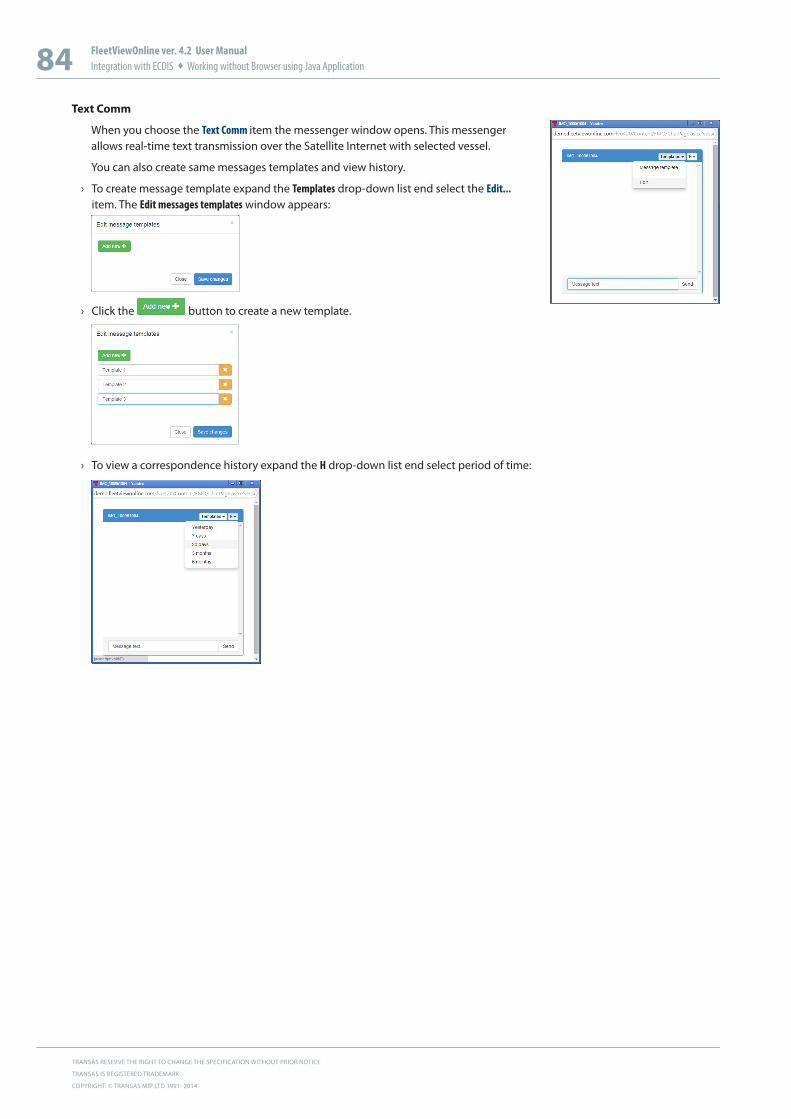
TRANSAS RESERVE THE RIGHT TO CHANGE THE SPECIFICATION WITHOUT PRIOR NOTICE
TRANSAS IS REGISTERED TRADEMARK
COPYRIGHT: © TRANSAS MIP LTD 1991–2014
84 FleetViewOnline ver. 4.2 User ManualIntegration with ECDIS Working without Browser using Java Application
Text Comm
When you choose the Text Comm item the messenger window opens. This messenger allows real-time text transmission over the Satellite Internet with selected vessel.
You can also create same messages templates and view history.
› To create message template expand the Templates drop-down list end select the Edit... item. The Edit messages templates window appears:
› Click the button to create a new template.
› To view a correspondence history expand the H drop-down list end select period of time:
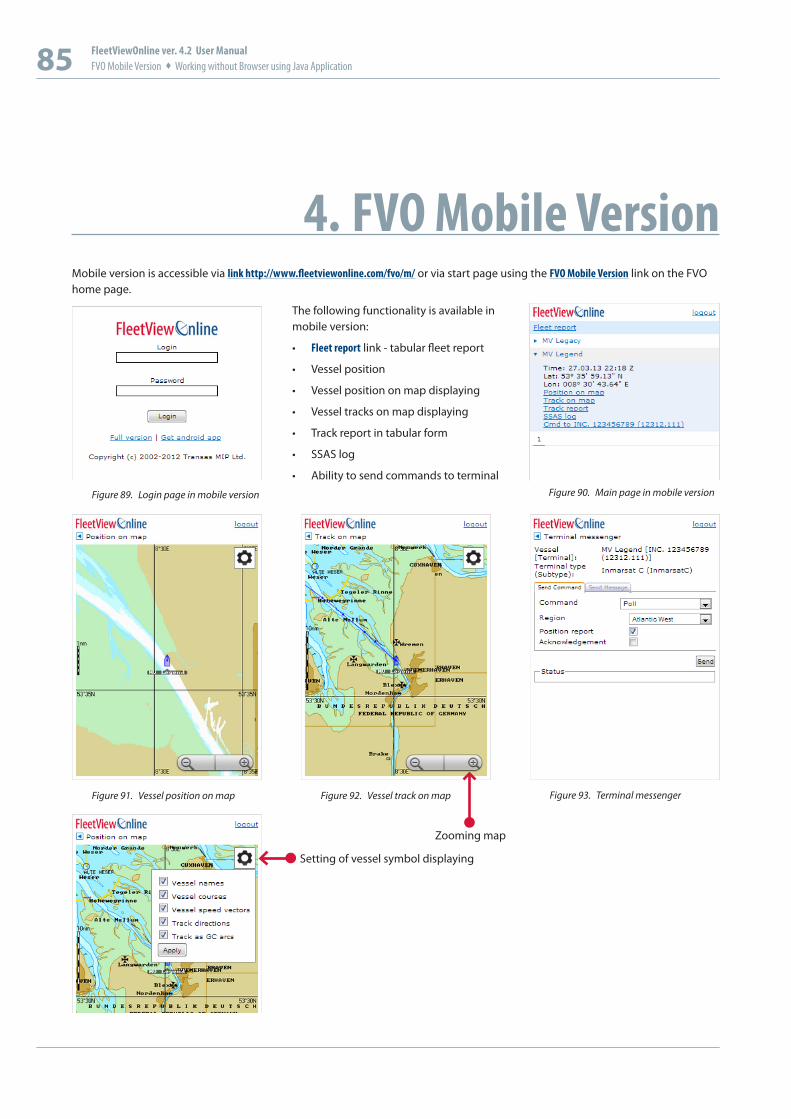
85 FleetViewOnline ver. 4.2 User ManualFVO Mobile Version Working without Browser using Java Application
4. FVO Mobile VersionMobile version is accessible via link http://www.fleetviewonline.com/fvo/m/ or via start page using the FVO Mobile Version link on the FVO home page.
The following functionality is available in mobile version:
• Fleet report link - tabular fleet report
• Vessel position
• Vessel position on map displaying
• Vessel tracks on map displaying
• Track report in tabular form
• SSAS log
• Ability to send commands to terminal
Setting of vessel symbol displaying
Zooming map
Figure 89. Login page in mobile version Figure 90. Main page in mobile version
Figure 91. Vessel position on map Figure 92. Vessel track on map Figure 93. Terminal messenger
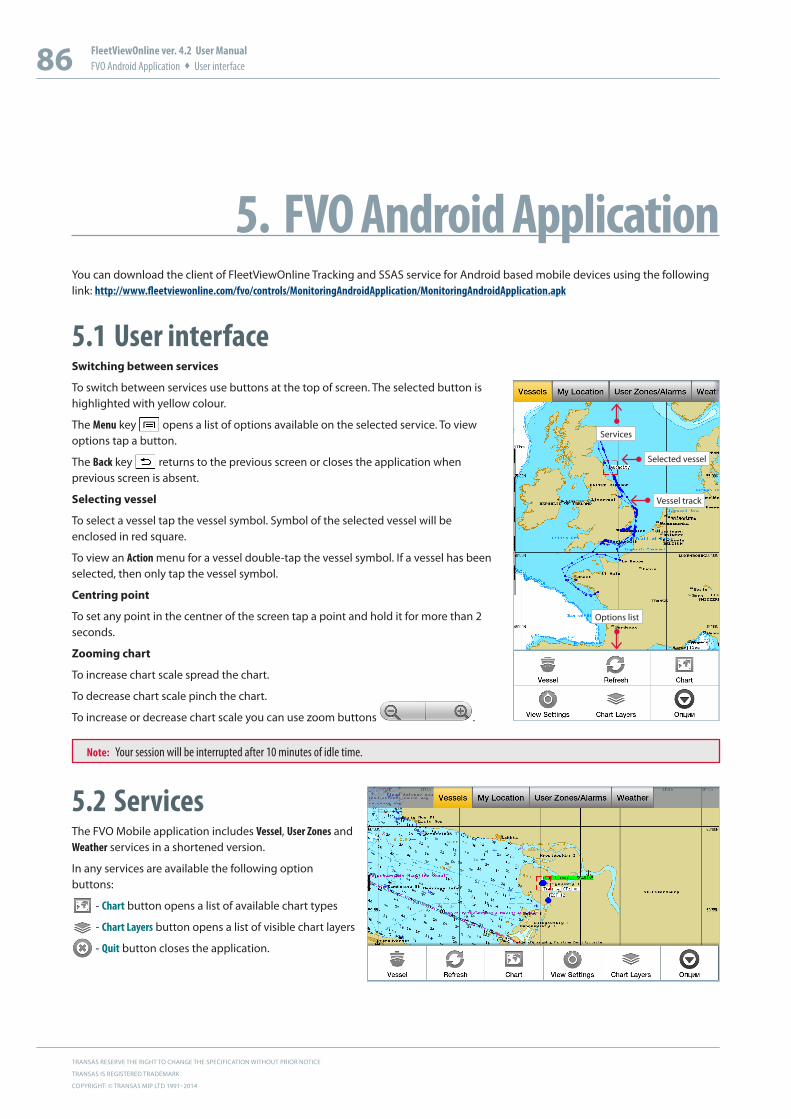
TRANSAS RESERVE THE RIGHT TO CHANGE THE SPECIFICATION WITHOUT PRIOR NOTICE
TRANSAS IS REGISTERED TRADEMARK
COPYRIGHT: © TRANSAS MIP LTD 1991–2014
86 FleetViewOnline ver. 4.2 User ManualFVO Android Application User interface
5. FVO Android ApplicationYou can download the client of FleetViewOnline Tracking and SSAS service for Android based mobile devices using the following link: http://www.fleetviewonline.com/fvo/controls/MonitoringAndroidApplication/MonitoringAndroidApplication.apk
5.1 User interfaceSwitching between services
To switch between services use buttons at the top of screen. The selected button is highlighted with yellow colour.
The Menu key opens a list of options available on the selected service. To view options tap a button.
The Back key returns to the previous screen or closes the application when previous screen is absent.
Selecting vessel
To select a vessel tap the vessel symbol. Symbol of the selected vessel will be enclosed in red square.
To view an Action menu for a vessel double-tap the vessel symbol. If a vessel has been selected, then only tap the vessel symbol.
Centring point
To set any point in the centner of the screen tap a point and hold it for more than 2 seconds.
Zooming chart
To increase chart scale spread the chart.
To decrease chart scale pinch the chart.
To increase or decrease chart scale you can use zoom buttons .
5.2 ServicesThe FVO Mobile application includes Vessel, User Zones and Weather services in a shortened version.
In any services are available the following option buttons:
- Chart button opens a list of available chart types
- Chart Layers button opens a list of visible chart layers
- Quit button closes the application.
Services
Options list
Selected vessel
Vessel track
Note: Your session will be interrupted after 10 minutes of idle time.

87 FleetViewOnline ver. 4.2 User ManualFVO Android Application Services
5.2.1 Vessel serviceIn the Vessel service are available the following specific buttons:
The Vessel button opens for the first time a list of available vessels. When any vessel has been selected, the Vessel button opens the following Action menu:
ű Select Other Vessel
ű Go to Selected Vessel
ű Show Info
ű Send Command - to send command and messages
ű Show Track
ű Show Track report
ű Show SSAS Log
ű Show OWS Log
ű Show Clear View Log
ű Show Fleet report
The View Settings button opens the list of vessel display settings to view:
ű Vessel names
ű Vessel courses
ű Vessel speed vector
ű Tracks directions
ű Tracks as GC arcs
Sending commands and messages
› Select the Vessel service
› Press Menu key. The Action menu opens.
› Tap the Send Command menu item. The browser page with the Send Command tab opens.
› To send message select the Send Message tab.
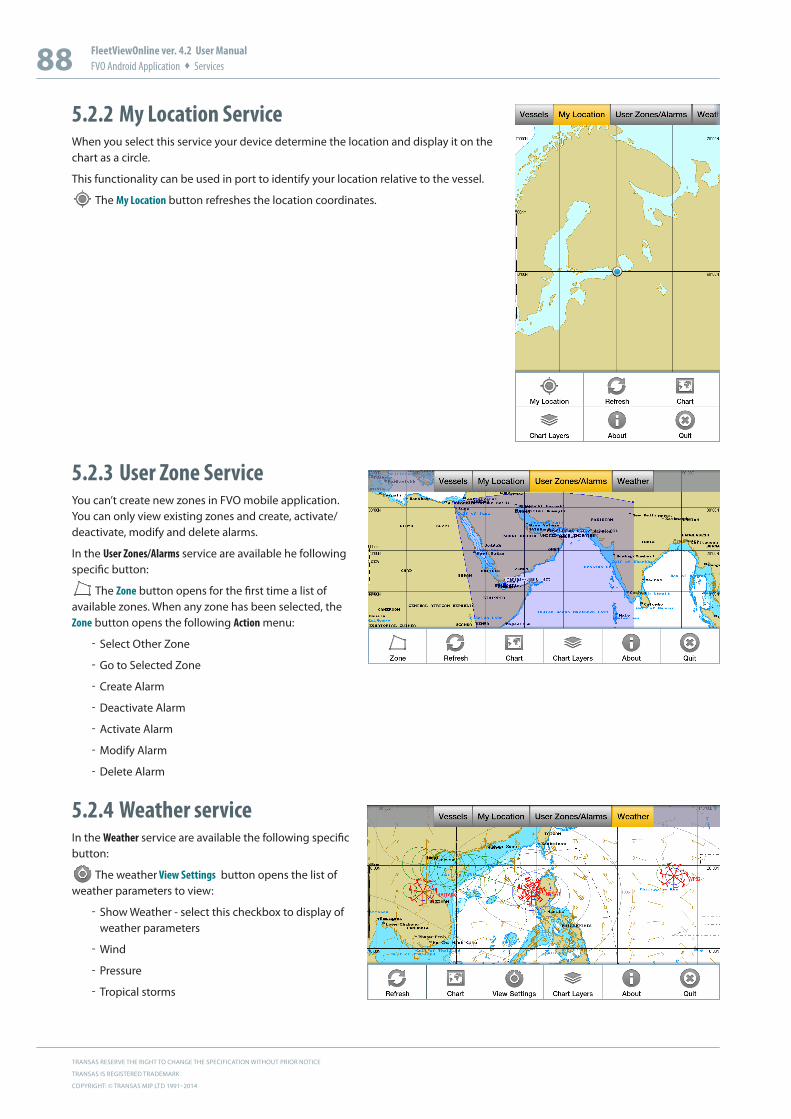
TRANSAS RESERVE THE RIGHT TO CHANGE THE SPECIFICATION WITHOUT PRIOR NOTICE
TRANSAS IS REGISTERED TRADEMARK
COPYRIGHT: © TRANSAS MIP LTD 1991–2014
88 FleetViewOnline ver. 4.2 User ManualFVO Android Application Services
5.2.2 My Location Service When you select this service your device determine the location and display it on the chart as a circle.
This functionality can be used in port to identify your location relative to the vessel.
The My Location button refreshes the location coordinates.
5.2.3 User Zone Service You can’t create new zones in FVO mobile application. You can only view existing zones and create, activate/deactivate, modify and delete alarms.
In the User Zones/Alarms service are available he following specific button:
The Zone button opens for the first time a list of available zones. When any zone has been selected, the Zone button opens the following Action menu:
ű Select Other Zone
ű Go to Selected Zone
ű Create Alarm
ű Deactivate Alarm
ű Activate Alarm
ű Modify Alarm
ű Delete Alarm
5.2.4 Weather service In the Weather service are available the following specific button:
The weather View Settings button opens the list of weather parameters to view:
ű Show Weather - select this checkbox to display of weather parameters
ű Wind
ű Pressure
ű Tropical storms


FleetViewOnlineUser manualTechnical Support
E-mail: [email protected]: +46 31 769 56 80 (During Office Hours 07:00 to 15:30 utc)Tel: +46 771 460 100 (After Office Hours/Weekends)