Embed Size (px)
Citation preview
FLEET MANAGER’S GUIDE TO ACCIDENT RECONSTRUCTION WITH TELEMATICS DATASiam Ahmed Technical Services EngineerOctober 2016

Accident Reconstruction with Telematics Data | 2
© 2016 Geotab Inc. All Rights Reserved.
About GeotabGeotab is a global leader in telematics, providing open platform fleet management solutions to businesses of all sizes. Geotab’s intuitive, full-featured solutions help businesses better manage their drivers and vehicles by extracting accurate and actionable intelligence from real-time and historical trips data. With more than 1 billion points of data collected daily, Geotab helps companies access critical business intelligence and benchmarking data to improve productivity, optimize fleets through the reduction of fuel consumption, enhance driver safety, and achieve stronger compliance to regulatory changes. The company’s products are represented and sold worldwide through its Authorized Partner network. To learn more, please visit www.geotab.com.
If you have any questions about this report or accident reconstruction, please email: [email protected].
For more fleet tips and best practices, visit www.geotab.com/blog
Accident Reconstruction with Telematics Data | 3
Introduction
What Is Accident Reconstruction?
When a vehicle collision occurs, it’s important to know what happened and why. Rebuilding as much information as possible is vital for insurance, training, and potential litigation.
Accident reconstruction with telematics is the process of using telematics data to understand the events that occurred before, during, and after a collision.
Telematics data is highly valuable because it provides an accurate, scientific record of events. It allows you to go beyond word-of-mouth testimony. The granularity of the data can tell you many things about the accident. Telematics makes it possible to gain a broader perspective by looking at the historical patterns for a specific driver or vehicle.
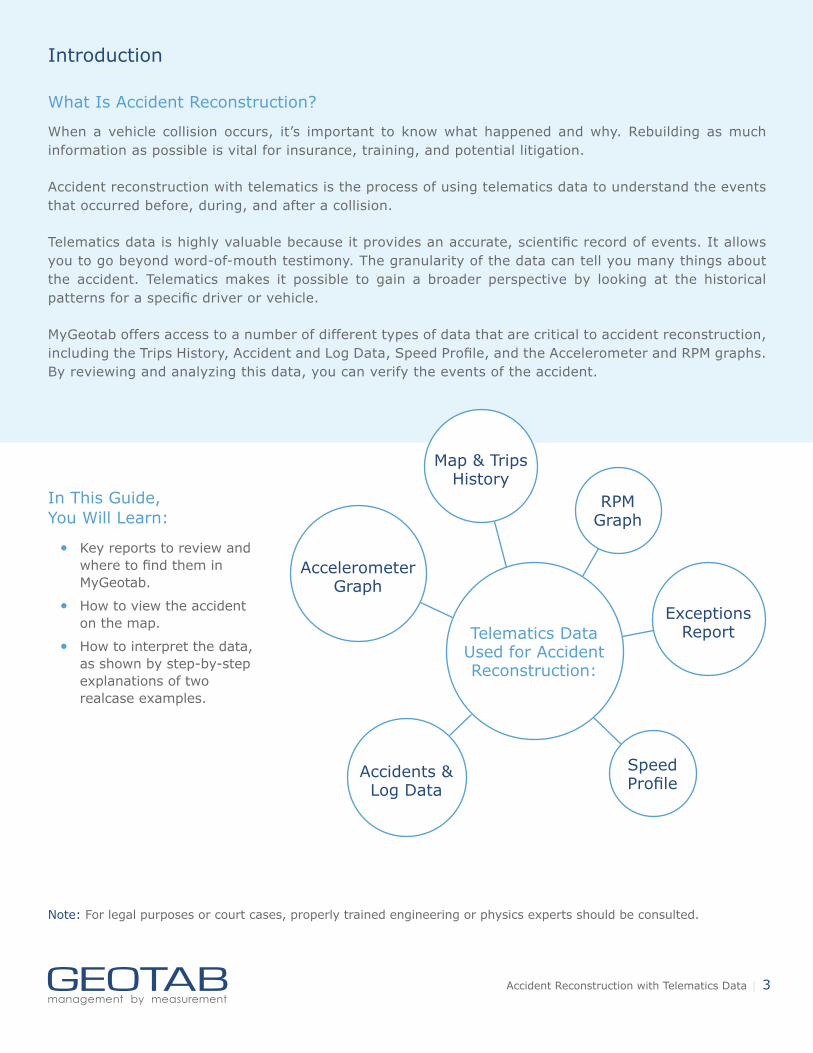
MyGeotab offers access to a number of different types of data that are critical to accident reconstruction, including the Trips History, Accident and Log Data, Speed Profile, and the Accelerometer and RPM graphs. By reviewing and analyzing this data, you can verify the events of the accident.
In This Guide, You Will Learn:
• Key reports to review and where to find them in MyGeotab.
• How to view the accident on the map.
• How to interpret the data, as shown by step-by-step explanations of two realcase examples.
Note: For legal purposes or court cases, properly trained engineering or physics experts should be consulted.
Telematics Data Used for Accident Reconstruction:
Map & Trips History
Accelerometer Graph
Speed Profile
RPM Graph
Accidents & Log Data
Exceptions Report
Accident Reconstruction with Telematics Data | 4
Reviewing Accident Data in MyGeotab
Key Reports
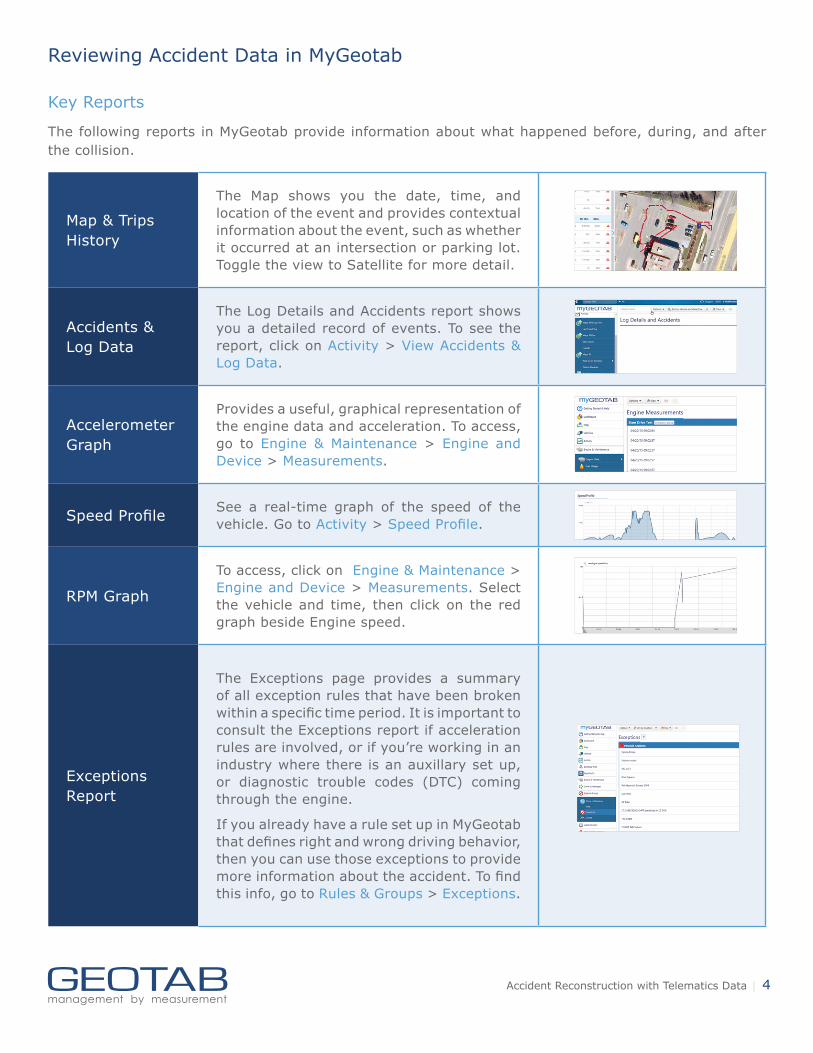
The following reports in MyGeotab provide information about what happened before, during, and after the collision.
Map & Trips History
The Map shows you the date, time, and location of the event and provides contextual information about the event, such as whether it occurred at an intersection or parking lot. Toggle the view to Satellite for more detail.
Accidents & Log Data
The Log Details and Accidents report shows you a detailed record of events. To see the report, click on Activity > View Accidents & Log Data.
Accelerometer Graph
Provides a useful, graphical representation of the engine data and acceleration. To access, go to Engine & Maintenance > Engine and Device > Measurements.
Speed Profile See a real-time graph of the speed of the vehicle. Go to Activity > Speed Profile.
RPM Graph
To access, click on Engine & Maintenance > Engine and Device > Measurements. Select the vehicle and time, then click on the red graph beside Engine speed.
Exceptions Report
The Exceptions page provides a summary of all exception rules that have been broken within a specific time period. It is important to consult the Exceptions report if acceleration rules are involved, or if you’re working in an industry where there is an auxillary set up, or diagnostic trouble codes (DTC) coming through the engine.
If you already have a rule set up in MyGeotab that defines right and wrong driving behavior, then you can use those exceptions to provide more information about the accident. To find this info, go to Rules & Groups > Exceptions.
Accident Reconstruction with Telematics Data | 5
Accident Detection
Accidents are detected by the Geotab GO device upon any acceleration greater than or equal to 2.5 g where 9.81 m/s2 is the acceleration due to the Earth’s gravity. The firmware will not use accelerometer Up/Down (aka Z axis) in this calculation. The calculation uses the magnitude of the hypotenuse between X and Y (√(X2+Y2)) Where X is Forward/Braking and Y is Side to Side.
When the Geotab GO device detects a 2.5 g event in any direction, the device is triggered to start recording at 100 Hz frequency. This detailed, granular information will be reflected in the trip.
Possible Accident Rule
MyGeotab has a base rule in the system called Possible Accident. This rule is triggered if the accelerometer detects a change of more than 2.55 G-force in the forward/braking or side-to-side direction. If possible, the device will send detailed forensic information about position, speed,and acceleration of the vehicle.
When the rule is set to On, a notification is sent to a user when a possible accident is detected. Even if the Possible Accident rule is not enabled, you can still see details in the Log Details and Accidents report.
Note: False alarms are possible. Knocking the device can trigger the rule accidentally, so installing the device out of the driver’s way is recommended.
Non Accident-Level Events
Sometimes an accident occurs where the accelerometer reading is less the 2.5 g. For example, in a low speed collision where both vehicles continued driving after or a slight rear end collision, an accident-level event might not be triggered. However, in these circumstances the data is still very important and helpful as accelerometer data is coming through at 100 Hz. The data is event-driven, so as there are more changes in direction or speed, there are more updates, resulting in a greater than normal number of logs.
Data Accuracy
How accurate is Geotab data? GPS coordinates are accurate to 2.5 m in any direction. Speed is accurate to 0.52 m/s. Geotab’s curve logic polls acceleration at a 300 Hz error rate and upon detection of an accident-level event, re-polls at a rate of 100 Hz.
There are many ways in which automatically generated reports can be in error. Some directly measured quantities in the report, such as acceleration, speed, and GPS location, are subject to their usual uncertainties and measurement errors. Derived quantities, such as point of impact, are also subject to potential calculation errors.
Accuracy: GPS: Accurate to 2.5 m. Speed: Accurate to 0.52 m/s. Curve logic: Polls at a 300 Hz error rate and upon detection re-polls at a rate of 100 Hz.
Accident Reconstruction with Telematics Data | 6
First Steps
Validation
Prior to performing an accident analysis using data from Geotab GO device data, you should verify a number of items.
Check to ensure the following were true for the specific device:
• Accurate ignition detection.
• Valid GPS latch.
• Good connectivity of the SIM card based on the device log time and server upload time. You will have to contact the Geotab support team to confirm this.
• Accelerometer had not been disabled due to excessive logging (usually caused by a loose installation).
Sources of error for vehicle position, speed, and acceleration are dependent on the specific model of device; verify these with Geotab for your specific device. In cases where the Geotab GO device was not rigidly attached to the OBD II connector, the initial acceleration data from the device remains correct, the reaction (or backward) acceleration will be in error due to the flexing of the harness. Additionally, the actual acceleration measured by the device may not be identical to the acceleration of the center of gravity of the vehicle depending on the location of the device relative to the center of gravity of the vehicle.
Data for Geotab GO devices are stored in secure data centers only accessible by Geotab. Always state the VIN (Vehicle Identification Number) for the vehicle Engine Control Module (ECM) data collected by the Geotab GO device.
Basic Procedure
In general, to reconstruct an accident in MyGeotab, you will carry out these steps:
1. Look up the accident in the Trips history and view it on the Map. Record the date, time, and location. Gather information about what the vehicle was doing at the time. Note any exceptions.
2. Review the Accidents & Log Data to pinpoint the accident-level event. Look for large g-force events. Then read up and down the log to understand what was happening before and after the accident, such as how fast the driver was going. Look for sharp acceleration or deceleration, either forward and backwards, side to side, or even up and down.
3. Check the Engine Measurements and Accelerometer graph for more clues on the direction of impact. Read forwards and backwards around the time of the event.
4. View the Speed Profile and RPM graph to see the speed of the vehicle before and after the accident and check for possible aggressive driving and driver reaction.
Additional Training:
Watch our Accident Reconstruction training video to learn more about uncovering accident data and reconstructing an accident. Available at: www.geotab.com/video/accident-reconstruction/
Accident Reconstruction with Telematics Data | 7
Case Examples: Reconstruction of Accident DataThe following section shows how you can use the different tools in MyGeotab to verify the circumstances of the collision. For illustration purposes, the information below comes from reconstructions of two real accidents involving passenger vehicles.
Case 1: Side Impact of Passenger Vehicle (Geotab GO7)
However, the map should not be the only tool used. There are several additional pieces of information that create a more complete accident reconstruction.
Map View
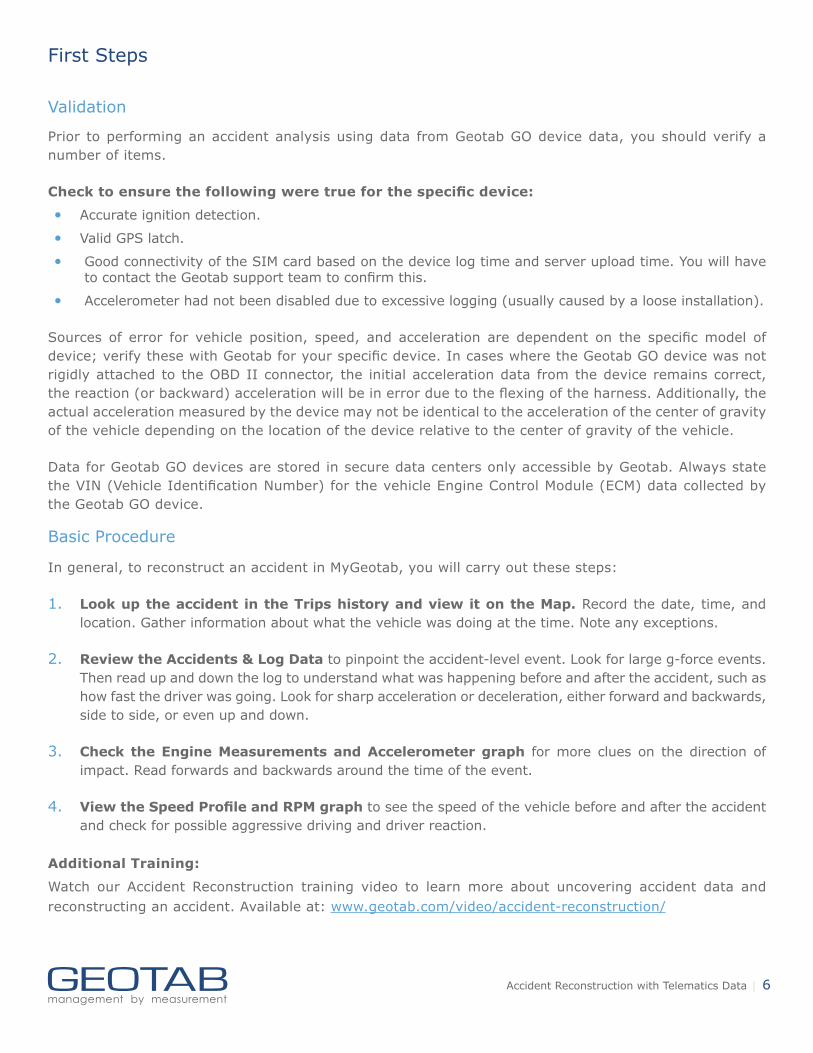
The first step to reconstructing accident data is to view the accident in the vehicle’s trips history. In MyGeotab, go to Map > Trips History. Specify the vehicle, then choose the date and the time of the accident to show the relevant trip on the map.
Note: The GPS data may be inaccurate for the initial few seconds after the ignition event as the device is still attempting to obtain GPS latch (locate 4 satellites). As shown in the image below, the vehicle started in the parking lot and drove to the main road, where it was hit from the side as it was trying to pull onto the road.
Figure 1. GPS map of accident reconstruction.
Accident Reconstruction with Telematics Data | 8
Accident and Log Data
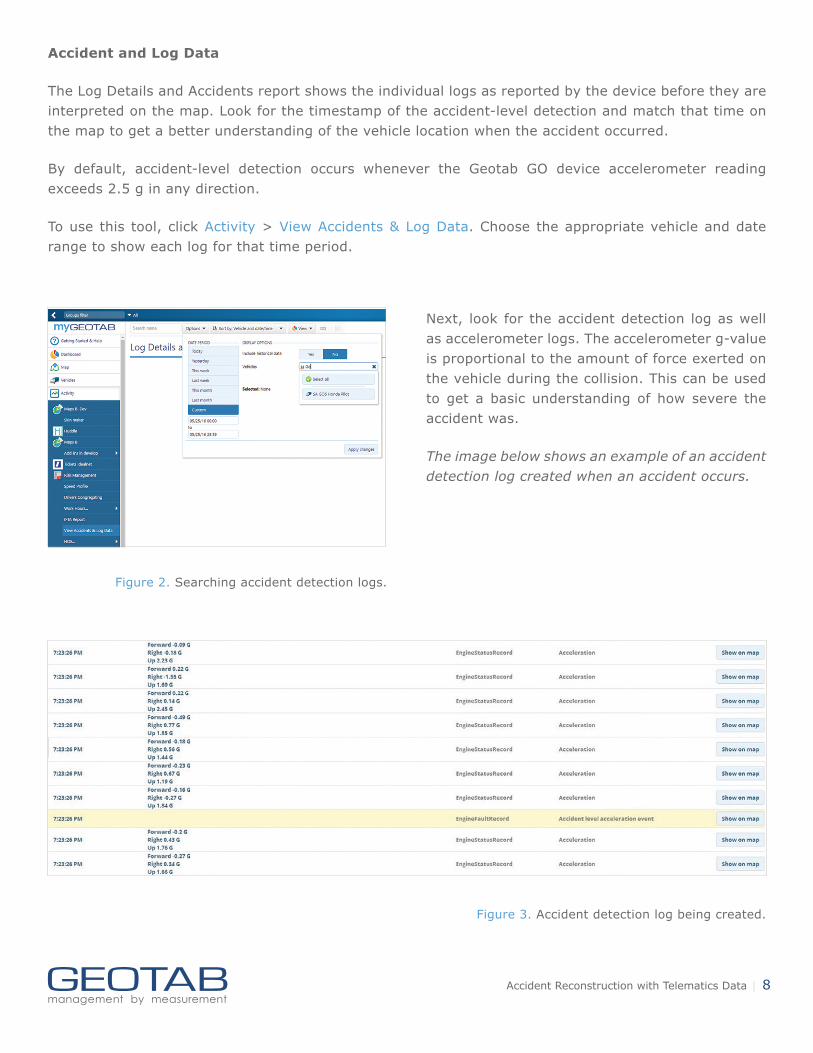
The Log Details and Accidents report shows the individual logs as reported by the device before they are interpreted on the map. Look for the timestamp of the accident-level detection and match that time on the map to get a better understanding of the vehicle location when the accident occurred.
By default, accident-level detection occurs whenever the Geotab GO device accelerometer reading exceeds 2.5 g in any direction.
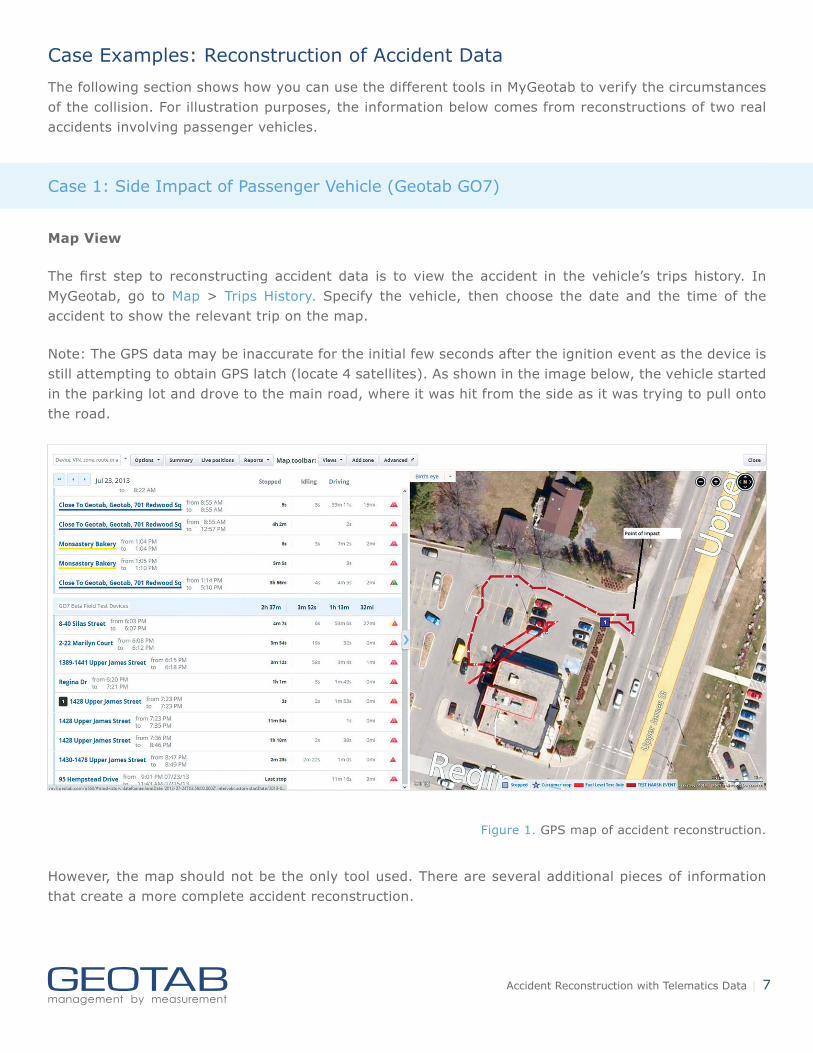
To use this tool, click Activity > View Accidents & Log Data. Choose the appropriate vehicle and date range to show each log for that time period.
Next, look for the accident detection log as well as accelerometer logs. The accelerometer g-value is proportional to the amount of force exerted on the vehicle during the collision. This can be used to get a basic understanding of how severe the accident was.
The image below shows an example of an accident detection log created when an accident occurs.
Figure 2. Searching accident detection logs.
Figure 3. Accident detection log being created.
Accident Reconstruction with Telematics Data | 9
Accelerometer Graph
The accelerometer graph is a useful tool that can be used to determine the direction from which the vehicle was hit and the relative force exerted in each direction due to the collision. To see this information, go to Engine & Maintenance > Engine Data > Engine Measurements.
From here, choose the correct vehicle and time to show all the engine data that was logged for the specified device.
Next, depending on the collision direction, click either:
• accelerometer side to side, or
• acceleration forward or braking.
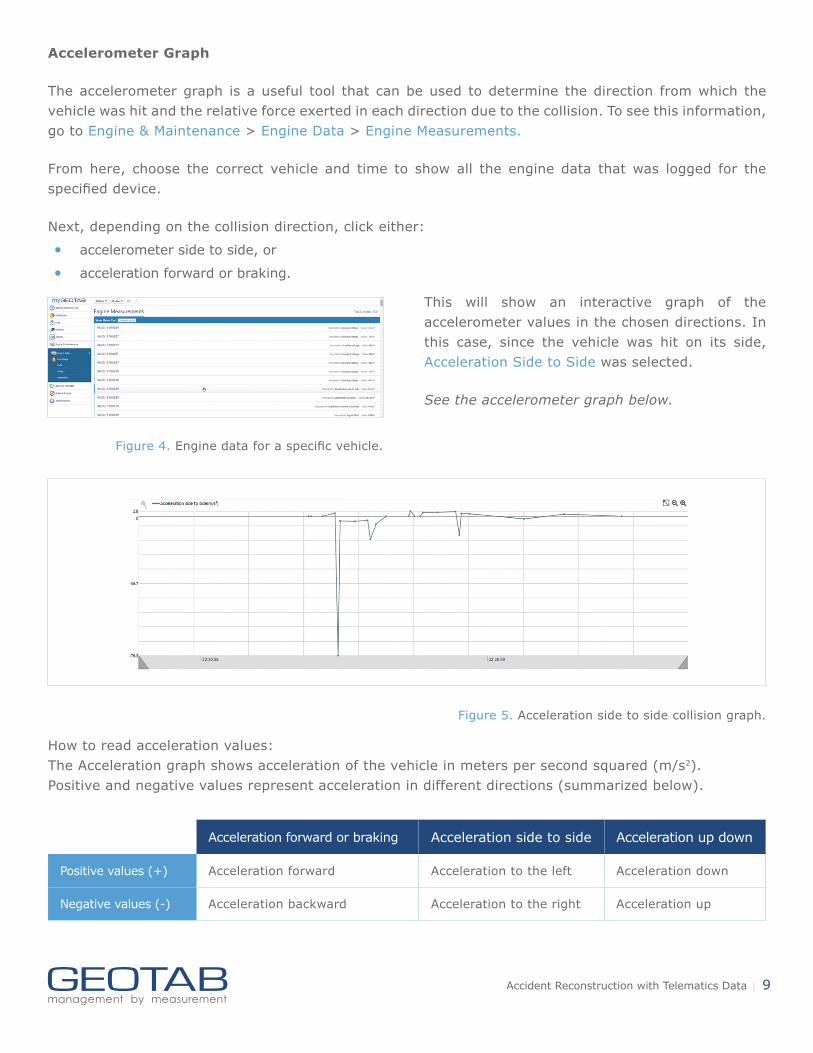
This will show an interactive graph of the accelerometer values in the chosen directions. In this case, since the vehicle was hit on its side, Acceleration Side to Side was selected.
See the accelerometer graph below.
Figure 4. Engine data for a specific vehicle.
Figure 5. Acceleration side to side collision graph.
How to read acceleration values: The Acceleration graph shows acceleration of the vehicle in meters per second squared (m/s2). Positive and negative values represent acceleration in different directions (summarized below).
Acceleration forward or braking Acceleration side to side Acceleration up down
Positive values (+) Acceleration forward Acceleration to the left Acceleration down
Negative values (-) Acceleration backward Acceleration to the right Acceleration up
Accident Reconstruction with Telematics Data | 10
In this case, it is evident that this vehicle was hit from the left which caused acceleration to the right at a rate of 54 m/s2.
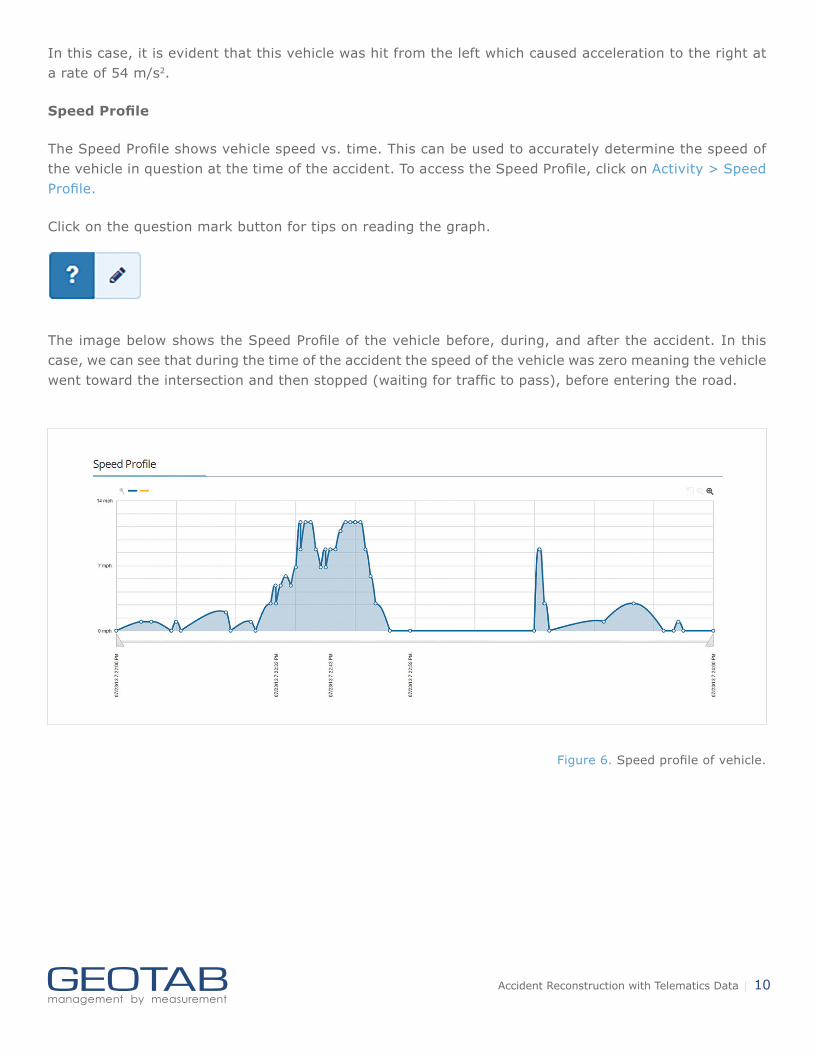
Speed Profile
The Speed Profile shows vehicle speed vs. time. This can be used to accurately determine the speed of the vehicle in question at the time of the accident. To access the Speed Profile, click on Activity > Speed Profile.
Click on the question mark button for tips on reading the graph.
The image below shows the Speed Profile of the vehicle before, during, and after the accident. In this case, we can see that during the time of the accident the speed of the vehicle was zero meaning the vehicle went toward the intersection and then stopped (waiting for traffic to pass), before entering the road.
Figure 6. Speed profile of vehicle.
Accident Reconstruction with Telematics Data | 11
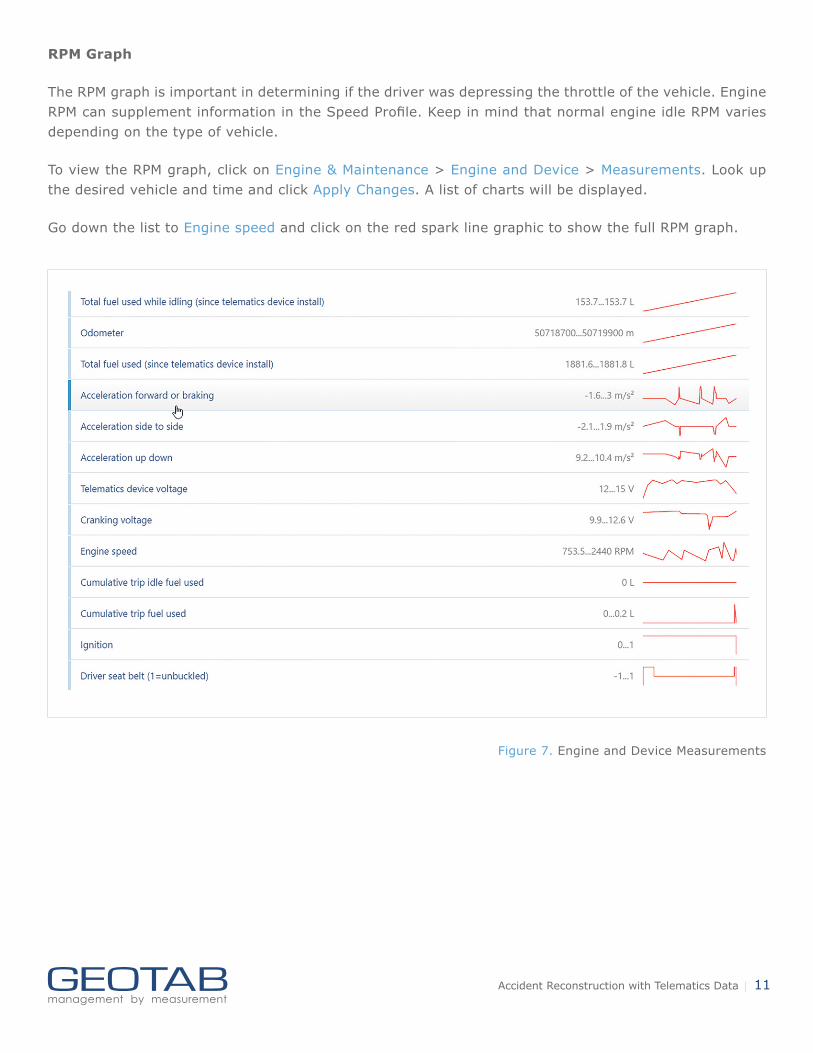
RPM Graph
The RPM graph is important in determining if the driver was depressing the throttle of the vehicle. Engine RPM can supplement information in the Speed Profile. Keep in mind that normal engine idle RPM varies depending on the type of vehicle.
To view the RPM graph, click on Engine & Maintenance > Engine and Device > Measurements. Look up the desired vehicle and time and click Apply Changes. A list of charts will be displayed.
Go down the list to Engine speed and click on the red spark line graphic to show the full RPM graph.
Figure 7. Engine and Device Measurements
Accident Reconstruction with Telematics Data | 12
Case 1: Conclusion
Based on the above information we can conclude that this vehicle moved toward the intersection slowly and came to a stop near the intersection. While stopped, another vehicle from the main road collided with this vehicle from the left side causing this vehicle to move to the right with an acceleration of 54 m/s2. The information however is not conclusive enough to show if the vehicle was or was not sticking out onto the main road due to the accuracy of the GPS latch being 2.5 m.
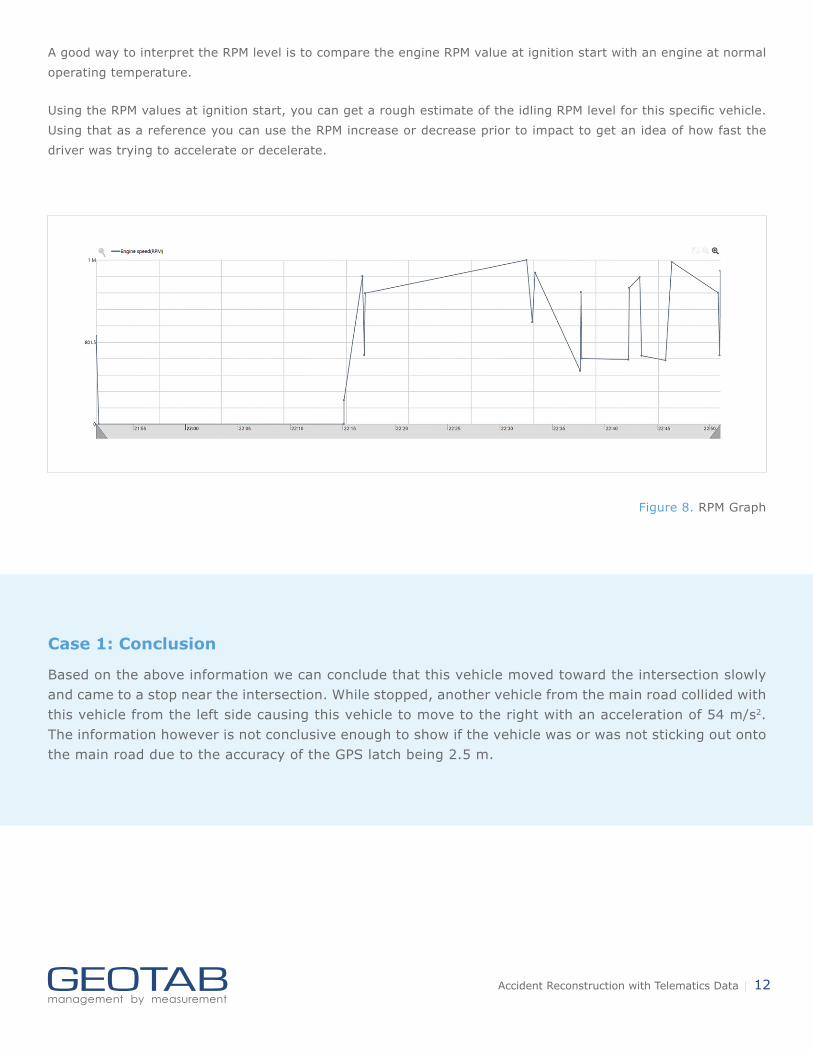
Figure 8. RPM Graph
A good way to interpret the RPM level is to compare the engine RPM value at ignition start with an engine at normal
operating temperature.
Using the RPM values at ignition start, you can get a rough estimate of the idling RPM level for this specific vehicle.
Using that as a reference you can use the RPM increase or decrease prior to impact to get an idea of how fast the
driver was trying to accelerate or decelerate.
Accident Reconstruction with Telematics Data | 13
Case 2: Rear Impact of Passenger Vehicle (GO6)
In this case, the driver reported being on the highway during rush hour when he was struck from the rear by the vehicle behind him. We will use the same process outlined above to analyze the data collected for this collision to verify this driver’s statement.
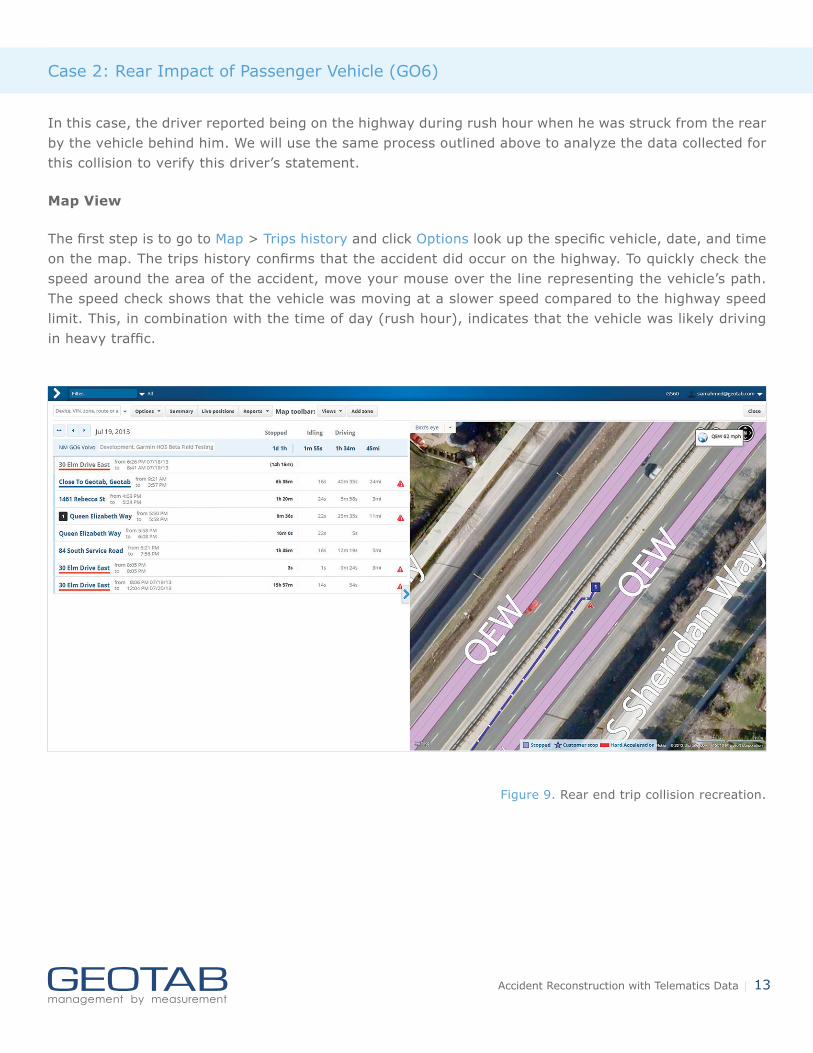
Map View
The first step is to go to Map > Trips history and click Options look up the specific vehicle, date, and time on the map. The trips history confirms that the accident did occur on the highway. To quickly check the speed around the area of the accident, move your mouse over the line representing the vehicle’s path. The speed check shows that the vehicle was moving at a slower speed compared to the highway speed limit. This, in combination with the time of day (rush hour), indicates that the vehicle was likely driving in heavy traffic.
Figure 9. Rear end trip collision recreation.
Accident Reconstruction with Telematics Data | 14
Accident and Log Data
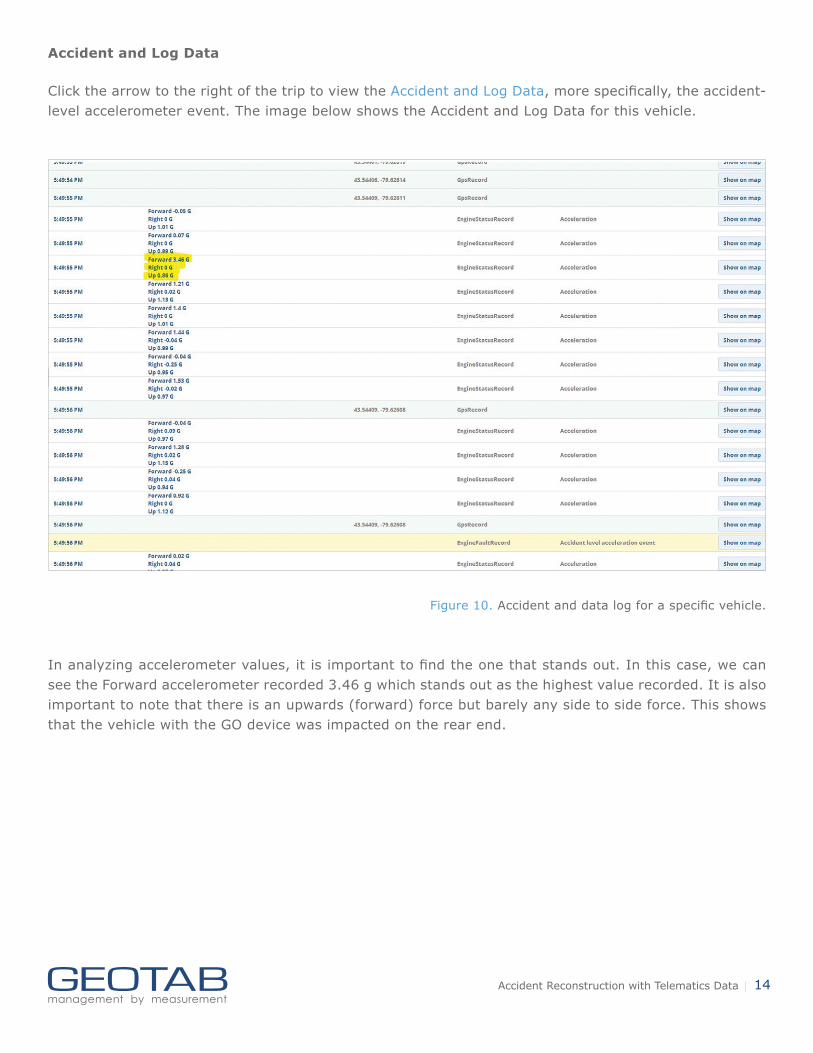
Click the arrow to the right of the trip to view the Accident and Log Data, more specifically, the accident-level accelerometer event. The image below shows the Accident and Log Data for this vehicle.
Figure 10. Accident and data log for a specific vehicle.
In analyzing accelerometer values, it is important to find the one that stands out. In this case, we can see the Forward accelerometer recorded 3.46 g which stands out as the highest value recorded. It is also important to note that there is an upwards (forward) force but barely any side to side force. This shows that the vehicle with the GO device was impacted on the rear end.
Accident Reconstruction with Telematics Data | 15
Accelerometer Graph
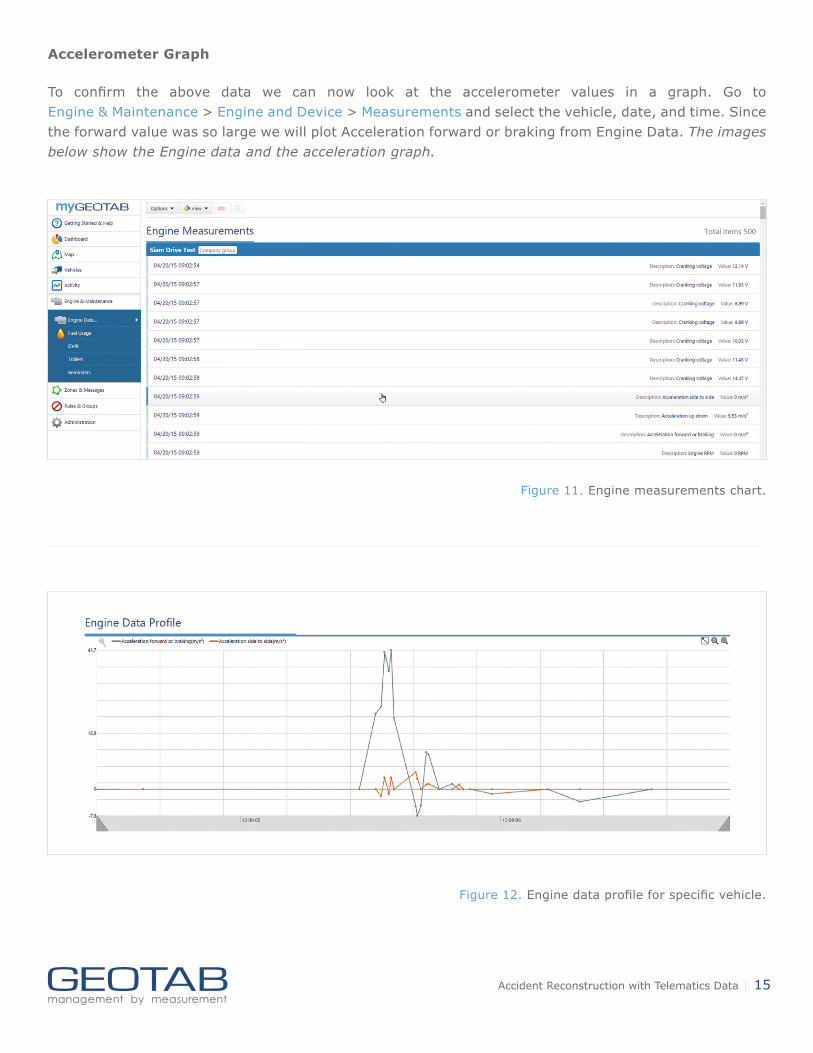
To confirm the above data we can now look at the accelerometer values in a graph. Go to Engine & Maintenance > Engine and Device > Measurements and select the vehicle, date, and time. Since the forward value was so large we will plot Acceleration forward or braking from Engine Data. The images below show the Engine data and the acceleration graph.
Figure 11. Engine measurements chart.
Figure 12. Engine data profile for specific vehicle.
Accident Reconstruction with Telematics Data | 16
In the graphs above, positive values represent forward acceleration whereas negative values represent reverse acceleration. We can see that at the time of the accident this vehicle had a large forward acceleration indicating that it was hit from the rear.
Speed Profile
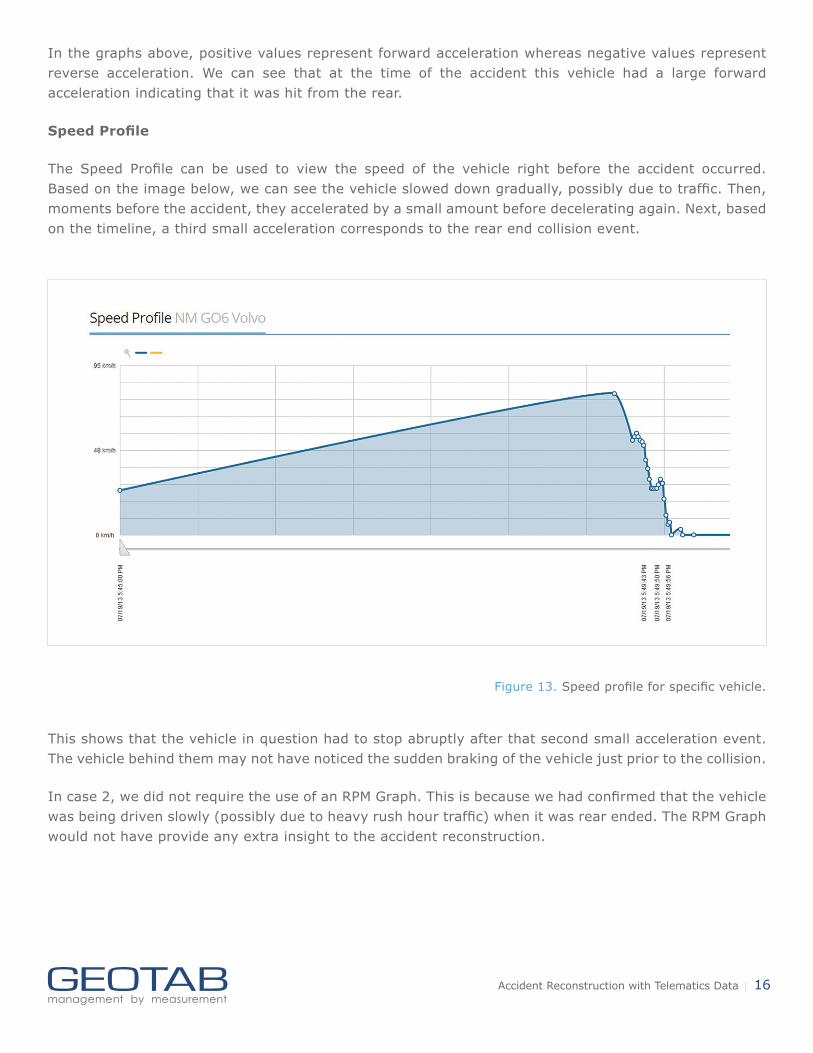
The Speed Profile can be used to view the speed of the vehicle right before the accident occurred. Based on the image below, we can see the vehicle slowed down gradually, possibly due to traffic. Then, moments before the accident, they accelerated by a small amount before decelerating again. Next, based on the timeline, a third small acceleration corresponds to the rear end collision event.
This shows that the vehicle in question had to stop abruptly after that second small acceleration event. The vehicle behind them may not have noticed the sudden braking of the vehicle just prior to the collision.
In case 2, we did not require the use of an RPM Graph. This is because we had confirmed that the vehicle was being driven slowly (possibly due to heavy rush hour traffic) when it was rear ended. The RPM Graph would not have provide any extra insight to the accident reconstruction.
Figure 13. Speed profile for specific vehicle.
Accident Reconstruction with Telematics Data | 17
The Roadmap for Future Developments
With the power of big data, we can now look at accidents at a larger scale. Geotab is taking full advantage of the technologies available to analyze driver patterns and provide more accurate information upon accidents. Predictive analytics will become an integral part of fleet safety management.
Fleets will be able to use big data to identify factors contributing to potential accidents and increasing a driver’s level of risk, such as location, weather, time of day, vehicle type, and specific driving patterns. The advanced analytics tools we are working towards will provide the exact information you need at your fingertips for analyzing point of impact and rollovers.
Case 2: Conclusion
In this case, based on the above information, we can estimate from the slowing down and moving forward that the driver may have been in traffic and moving at very low speeds and shortly thereafter was impacted from the rear by the following vehicle.