Embed Size (px)
Citation preview
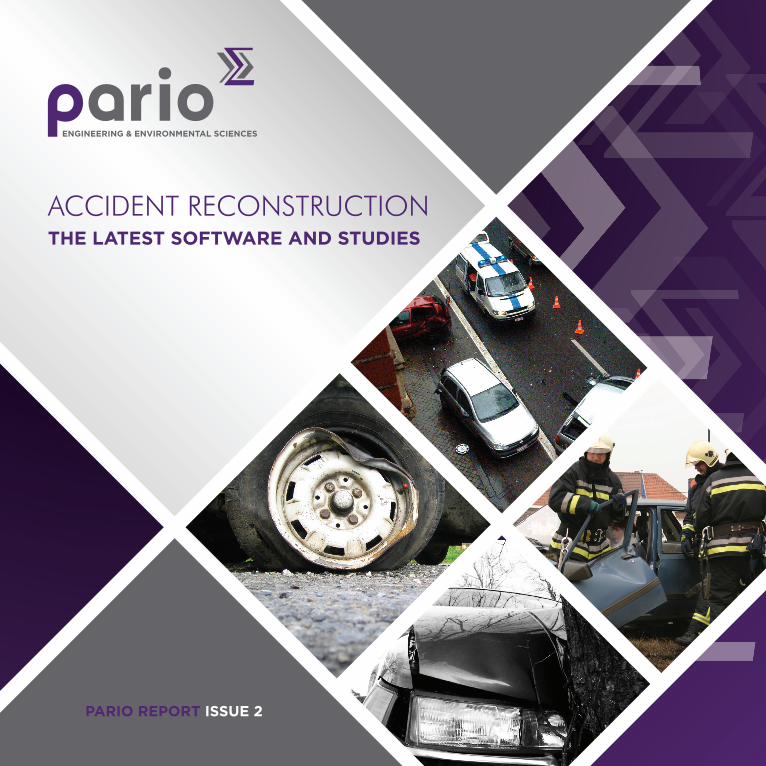
ACCIDENT RECONSTRUCTIONTHE LATEST SOFTWARE AND STUDIES
PARIO REPORT ISSUE 2
Is Your Engineer Using the Most Technically Advanced Software?Advanced Accident Reconstruction and 3D Accident Simulation Software
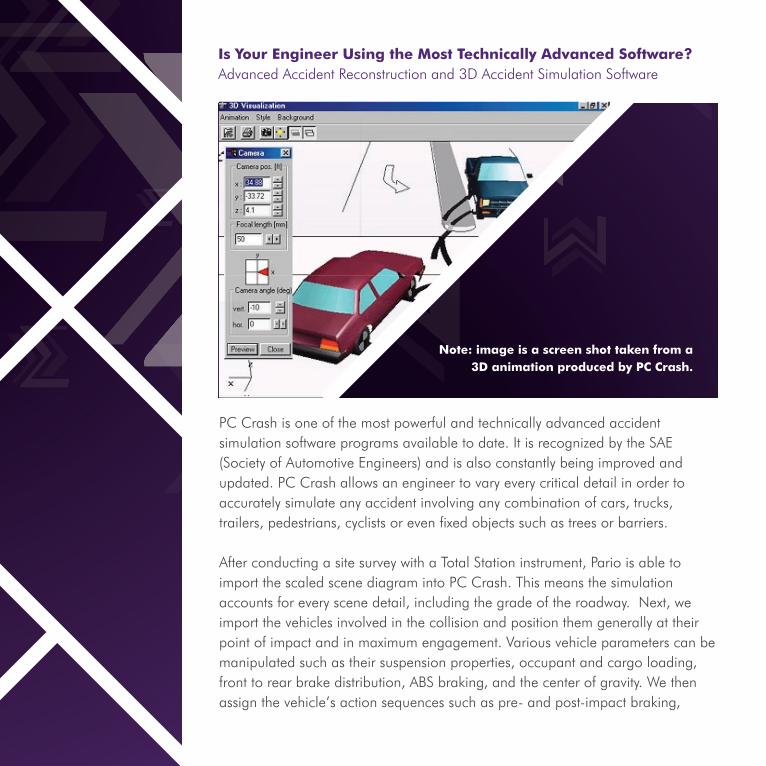
PC Crash is one of the most powerful and technically advanced accident simulation software programs available to date. It is recognized by the SAE (Society of Automotive Engineers) and is also constantly being improved and updated. PC Crash allows an engineer to vary every critical detail in order to accurately simulate any accident involving any combination of cars, trucks, trailers, pedestrians, cyclists or even fixed objects such as trees or barriers.
After conducting a site survey with a Total Station instrument, Pario is able to import the scaled scene diagram into PC Crash. This means the simulation accounts for every scene detail, including the grade of the roadway. Next, we import the vehicles involved in the collision and position them generally at their point of impact and in maximum engagement. Various vehicle parameters can be manipulated such as their suspension properties, occupant and cargo loading, front to rear brake distribution, ABS braking, and the center of gravity. We then assign the vehicle’s action sequences such as pre- and post-impact braking,
Note: image is a screen shot taken from a 3D animation produced by PC Crash.
steering, driver reaction, and even wheel lock-up effects due to post-impact damages. We are able to use information such as the final rest positions, skid marks or residual damages to determine the speeds of the vehicles. Analysis of collision avoidance or visibility issues can easily be examined with the resultant 3D animation produced by the technical project.
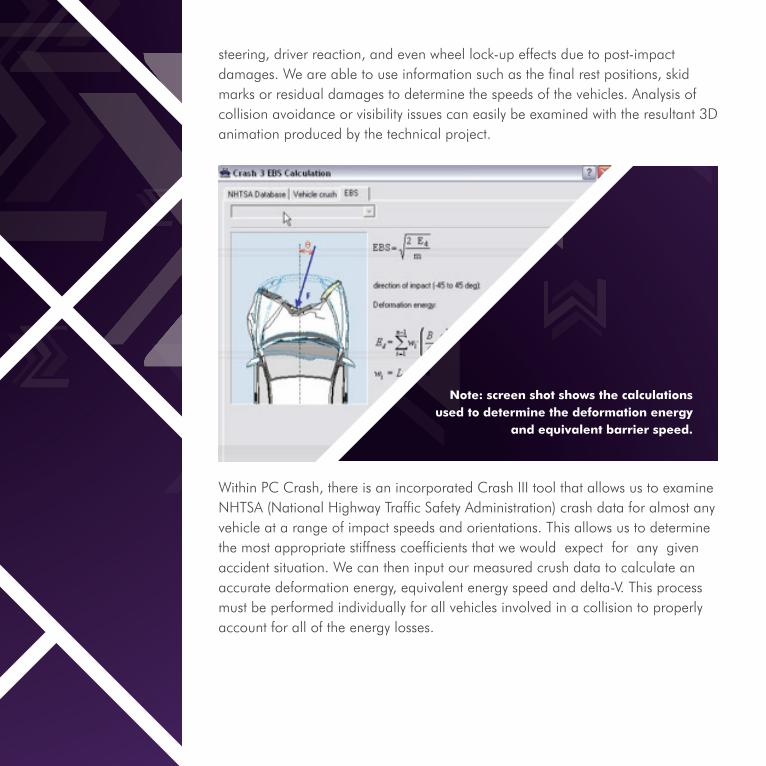
Note: screen shot shows the calculations used to determine the deformation energy
and equivalent barrier speed.
Within PC Crash, there is an incorporated Crash III tool that allows us to examine NHTSA (National Highway Traffic Safety Administration) crash data for almost any vehicle at a range of impact speeds and orientations. This allows us to determine the most appropriate stiffness coefficients that we would expect for any given accident situation. We can then input our measured crush data to calculate an accurate deformation energy, equivalent energy speed and delta-V. This process must be performed individually for all vehicles involved in a collision to properly account for all of the energy losses.

PC Crash also incorporates a collision optimizer tool, which allows us to solve for an unknown value. We can input any number of known parameters such as the final rest positions, equivalent energy speeds as calculated from vehicle damage, pre-impact directions or point of impact to name a few. Then, based on the known facts, we can solve for the impact speeds or point of impact. The collision optimizer will perform millions of calculations until it finds the most likely solution based on the available information.
Were You Denied Access To Vehicles But Now Have Photographs?Using Photogrammetry Software to Measure Vehicle Crush
Note: screen shot shows how points are referenced between an undamaged
exemplar vehicle and a photo of a damaged vehicle.
Photogrammetry is the science of taking measurements from photographs. There are many applications in the field of accident reconstruction and forensics including incident scene diagramming and vehicle crush measurements, even from photographs with an unknown source camera.

With the combination of a Pario calibrated camera, we are able to take photographs of an incident scene or an undamaged exemplar vehicle and use those photographs to create a 2D diagram or 3D model. By referencing exact points between photographs, our photogrammetry software can inversely solve for the camera positions and properties of our calibrated camera. For any given 360-degree digital photograph project it is possible to create a 3D point field to which any other photographs can be later referenced. With any known distance, such as a vehicle’s wheelbase, we can assign the project a scale so that measurements can then be taken in any direction or orientation on the photograph. In the case of an incident scene, this 3D data field can be used to extract scene evidence such as skid marks, which can be used to determine speeds and directions of vehicles. In the case of damaged vehicles, we are able to relate crushed portions of a damaged vehicle to the undamaged exemplar vehicle. We can accurately measure the crush to determine equivalent energy speeds, principle direction of force and many other important factors that could be used to reconstruct any accident.
Note the pink lines are from the undamaged exemplar vehicle, the white lines are from the damaged vehicle and
the green lines were crush measurements taken between the two vehicles.
Is Your Injury Claim Fraudulent? Real Life Crash Data Reveals Expected Injury Severity
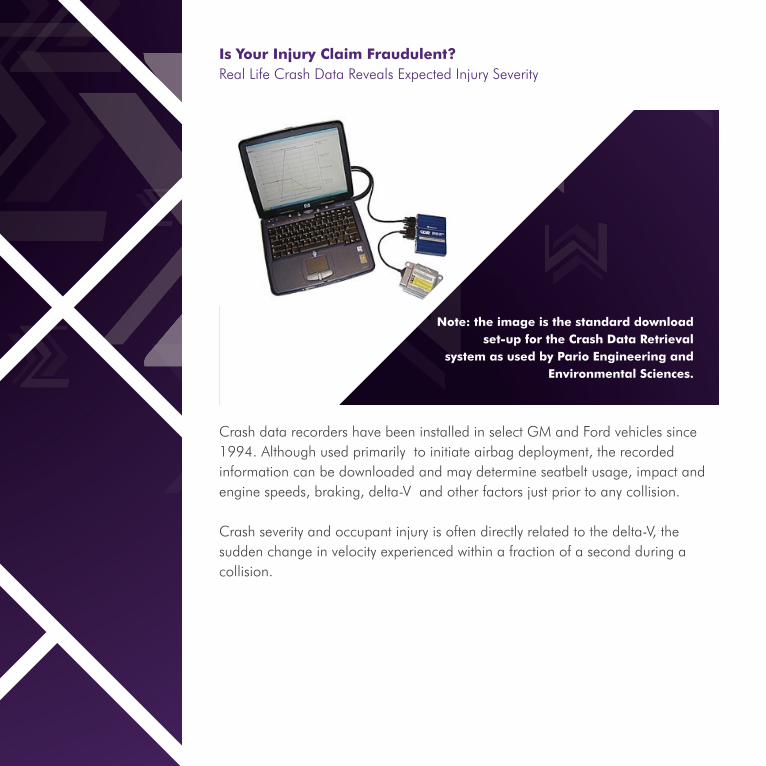
Note: the image is the standard download set-up for the Crash Data Retrieval
system as used by Pario Engineering and Environmental Sciences.
Crash data recorders have been installed in select GM and Ford vehicles since 1994. Although used primarily to initiate airbag deployment, the recorded information can be downloaded and may determine seatbelt usage, impact and engine speeds, braking, delta-V and other factors just prior to any collision.
Crash severity and occupant injury is often directly related to the delta-V, the sudden change in velocity experienced within a fraction of a second during a collision.
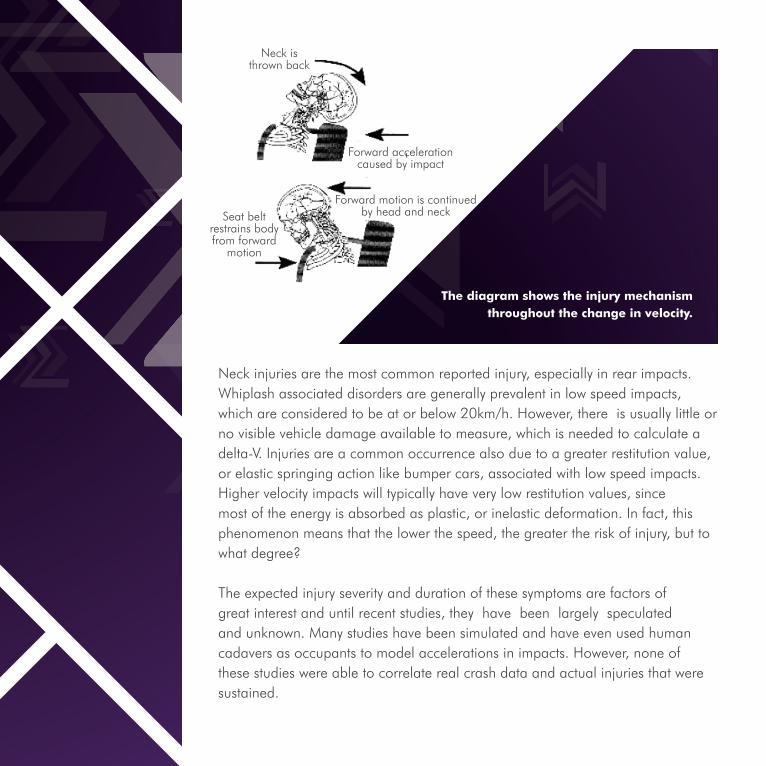
Neck injuries are the most common reported injury, especially in rear impacts. Whiplash associated disorders are generally prevalent in low speed impacts, which are considered to be at or below 20km/h. However, there is usually little or no visible vehicle damage available to measure, which is needed to calculate a delta-V. Injuries are a common occurrence also due to a greater restitution value, or elastic springing action like bumper cars, associated with low speed impacts. Higher velocity impacts will typically have very low restitution values, since most of the energy is absorbed as plastic, or inelastic deformation. In fact, this phenomenon means that the lower the speed, the greater the risk of injury, but to what degree?
The expected injury severity and duration of these symptoms are factors of great interest and until recent studies, they have been largely speculated and unknown. Many studies have been simulated and have even used human cadavers as occupants to model accelerations in impacts. However, none of these studies were able to correlate real crash data and actual injuries that were sustained.
The diagram shows the injury mechanism throughout the change in velocity.
Neck is thrown back
Forward acceleration caused by impact
Forward motion is continued by head and neckSeat belt
restrains body from forward
motion

More recently, articles have been published that have used real life impacts where the delta-V and crash pulses were measured with event data recorders. The medical history of the involved occupants was followed and their symptoms categorized by duration and severity. The study analyzed the ranges of delta-V, mean accelerations and peak head accelerations for each category.
It was found that higher peak and mean accelerations would be the best indicator for long-term disability. It was also discovered that a high change in velocity does not necessarily cause neck injury, if mean accelerations are below 6g and there are no peak accelerations. One study showed that no occupants involved in accidents with mean accelerations of 3g or less sustained injury for greater than one month.
For most occupants that sustain symptoms for greater than one month, the mean acceleration was greater than 4.5g and changes in velocity were higher than 15 km/h. Occupant’s reporting symptoms for less than one month, on average, corresponded to a delta-V of10.3 +/- 2.1 km/h and mean accelerations of 3.9 +/- 0.5g. Occupant’s reporting symptoms for greater than one month corresponded to an average delta-V of 20 +/- 4.8 km/h and mean accelerations of 5.3 +/- 0.6g. Pario has the means to download crash data to obtain exact delta-V’s experienced by occupants. Otherwise, we are able to calculate them based on impact damages and equivalent energy speeds. Either way, these studies have proven to be a great resource for determining the expected injury severity and duration, especially for low speed collisions, where claims are often questioned for their validity.
Toll Free: 1.888.762.4667 [email protected]