Embed Size (px)
Citation preview
Chapter 6
Zemenawit M. (MSc.) 2012 E.C
Fleet and Revenue Management

Fleet Management – Defined
• Fleet Management is a reduction of materials handling costs resulting in increased efficiency. – This requires a planned replacement program
which optimizes the economic life of the fleet.
• The overall goal is universal: to reduce costs. • However, each customer’s definition of, and
expectation from, fleet management is unique.

Fleet Facts – Understanding Costs • 20% of the
total cost of materials handling is associated with the acquisition cost of the fleet.
• 80% of total
cost is
related to
operator and
maintenance
expense. 20%
80%

Fleet Facts – Lifecycle
• The average vehicle is over 12 years old. • The average vehicle has an estimated
economic life of 10,000-14,000 hours. • As a fleet ages, the cost of operation
increases: – Repair expenses increase – Downtime increases – Productivity decreases

Fleet Facts – Utilization
• On average, companies have 10% to 20% more units in operation than are required to do the job.
• Short term rental units are often used to address shortages created by excessive downtime.
• vehicles are often sourced through multiple vendors, limiting flexibility related to fleet rotation and re-location.
Fleet Facts – Maintenance
• Many companies do not have scheduled or preventative maintenance programs for their vehicle fleets.
• vehicle fleets typically consist of a diverse mixture of brands, requiring an extensive inventory of parts to support them.
• Record keeping regarding vehicle maintenance is generally poor or non-existent.
7
fleet: the focus of TPM
• The Six big Losses
• fleet Effectiveness
• Calculating fleet Effectiveness
• fleet Management

8
Factors Affecting fleet Effectiveness
• fleet failure (breakdown)
• Setup and adjustment downtime
• Idling and minor stoppages
• Reduced speed
• Process defects
• Reduced yield
9
Cycle Time and Set-Up Reduction
Shorter runs produce customer orders with less lead time
• However, fleet breakdowns, idling and minor stoppages will make it very difficult
to reduce cycle times
• Hence, cycle time reductions result in shorter and more frequent production runs.
• Suddenly, set-ups and adjustments become crucial in reducing cycle times
• Past OEE studies show that set-up and adjustments can consume up to 50% of
total production time
• In such situation the six big losses become more of an issue to solve

10
The Six Big Losses
Down Time.
1. Breakdowns due to fleet failure.
2. Setup and adjustment (e.g. exchange of dies in injection molding machines, etc.)
Speed Losses.
3. Idling and minor stoppages (abnormal operation of sensor, etc.).
4. Reduced speed (discrepancies between designed and actual speed of fleet)
Defects.
5. Defects in process and rework (scrap and quality defects requiring repair)
6. Reduced yield between machine startup and stable production.

11
The fleet Losses (you can and must measure)
fleet Availability
•Setup and Adjustments
Including changeovers.
Programming.
Test runs.
•fleet Failures
Sporadic breakdowns.
Chronic breakdowns.
fleet Efficiency
•Idling and Minor Stoppages
Jams and other short stoppages.
No parts, no operator.
“Blocked”.
•Reduced Speed
fleet worn out.
Lack of accuracy.

12
Contd.
Quality •Process Defects
Scrap.
Rework
Others
fleet warm up etc.
No parts, no operator.

13
Availability
• Loading time = Total available time per day (or month) – Planned downtime
• Planned downtime: amount of downtime officially scheduled in the production plan
100Time Loading
TimeDown - Time Loading ty Availabili

14
Example
• Loading time per day = 460 min.
• Downtime: breakdowns = 20 min.
• Setup 20 min = 20 min.
• Adjustments = 20 min.
• Availability = ?
100Time Loading
TimeDown - Time Loading ty Availabili

15
Solution
• Loading time per day = 460 min.
• Downtime: breakdowns = 20 min.
• Setup 20 min = 20 min.
• Adjustments = 20 min.
• Availability = ?
%87100460
60 - 460 ty Availabili
100Time Loading
TimeDown - Time Loading ty Availabili

16
Performance Efficiency Contd.
• Alternative formula in case ideal cycle time is not known or products with
different cycle times are run on the same machine.
timeOperation
Lost time - timeOperation PE
• Lost time due to
– Idling and minor stoppages,
– Speed losses,

17
Rate of Quality
100 timeoperating Usable
loss timeDefects - timeoperating UsableQuality of Rate
100amount ocessedPr
rejects -amount ocessedPrQuality of Rate
Example
Processed amount = 200
Rejects = 4
%98200
4 - 200 Quality of Rate

18
Improvement Goals for the Six Big Losses

19
Measures of Effectiveness in Graph
*No
scheduled
production
* Failures
* Setup
C Target Output
EActual
Output
Total Operating time
Ava
ilabi
lity
Per
form
ance
Lost effectiveness
* Minor
Stoppages
* Reduced
Stoppages
Actual
Output
Running
time
D
B
Qua
lity
OEE = B/A X D/C X F/E Availability rate Performance rate Quality rate
A
* Scrap/
rework
* Startup losses
Good
OutputF
Net Operating
time

Single-Minute Exchange of Die (SMED)
SMED was originally designed to improve die press setups but its
principles apply to changeovers in all types of processes. Set-ups can
be either:
– Internal Setup: Operations that are performed while
a machine is stopped
– External Setup: Operations that are performed while
a machine is running 20
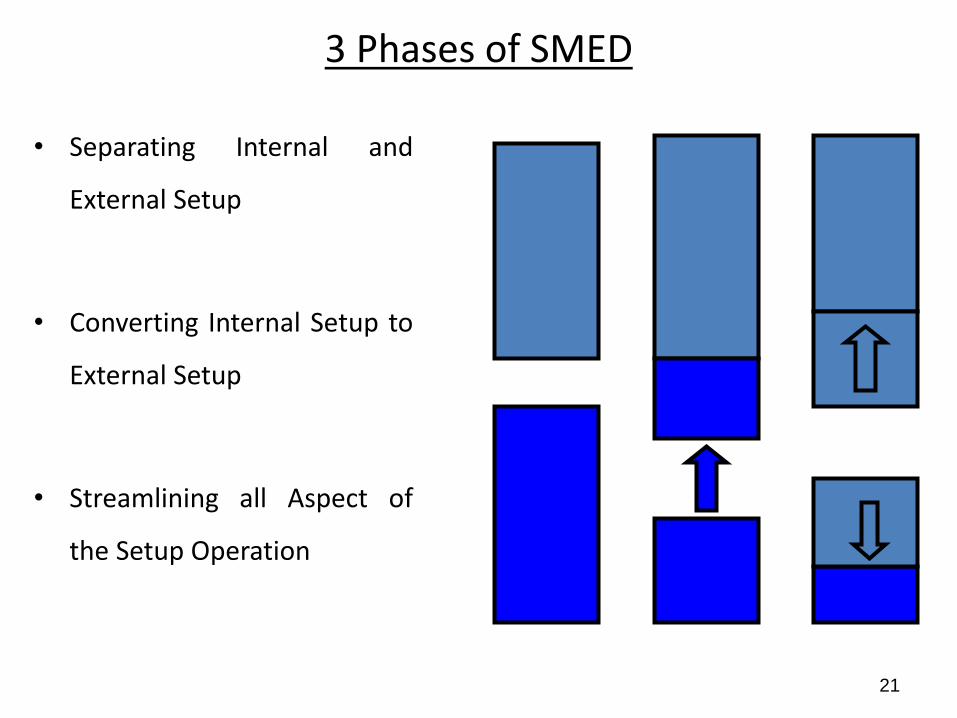
3 Phases of SMED
• Separating Internal and
External Setup
• Converting Internal Setup to
External Setup
• Streamlining all Aspect of
the Setup Operation
21

22
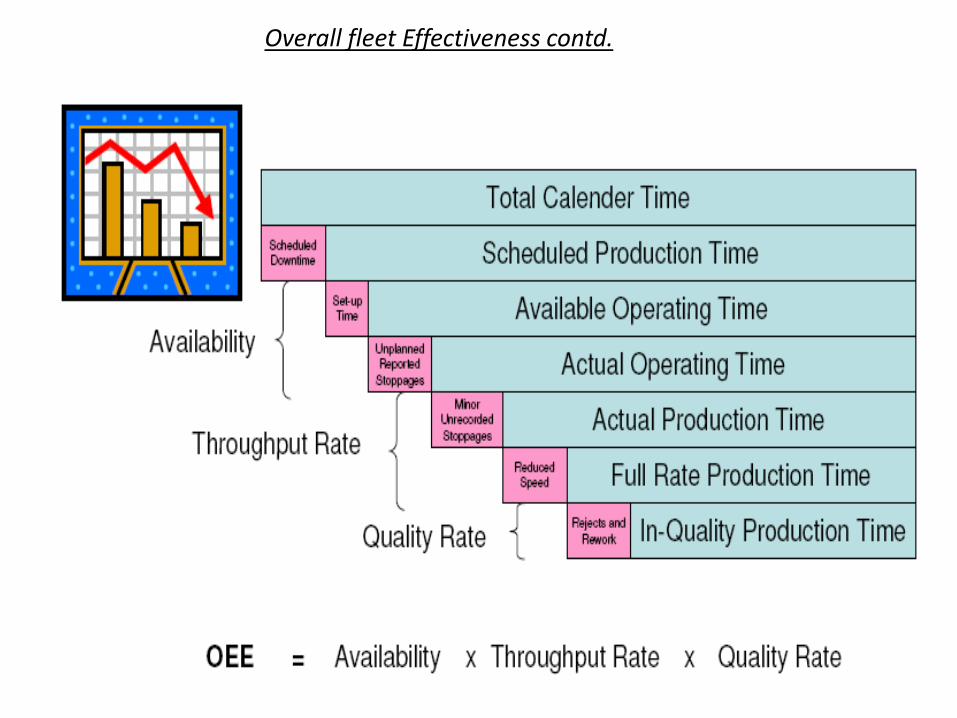
Overall fleet Effectiveness (OEE)
In an ideal factory, fleet would operate 100 percent of the time at
100 percent capacity, with an output of 100 percent good quality.
In real life, however, this situation is rare.
The difference between the ideal and the actual situation is due to losses.
Calculating the overall fleet effectiveness (OEE) rate is a crucial element of any
serious commitment to reduce fleet- and process-related wastes through total
productive maintenance (TPM) and other lean manufacturing methods like
Operational Excellence, Six Sigma or World Class Manufacturing.

Overall fleet Effectiveness (OEE) contd.
• When we buy a piece of fleet, we do so to carry out a specific function.
• So, let’s imagine that we have bought our new tool and installed it to the manufacturer’s standard.
• Everyone has been trained and we all know how to use it, how to set it up for production, and we have also started making our first product.
The question is how do we know when the tool has failed?
• We, as the users, need to consider all the different ways it can fail or how many ways it can fail to fulfill the description.
23

Overall fleet Effectiveness (OEE) contd.
Possibly there are three ways that failure may occur.
1. The fleet can stop working completely known as a total failure (Availability),
2. The fleet can work slower than it is capable of known as the partial failure (throughput rate/Performance), and
3. The fleet or product can lose quality known as quality failure (Quality).
%100*(%)availabletimetotal
downtimeavailabletimetotaltyAvailabili
%100*(%)unitsablemanufacturofnumberpossible
edmanufacturunitsofnumberePerformanc
24
%100*(%)producedunitsofnumber
defectsofnumberproducedunitsofnumberQuality
Overall fleet Effectiveness contd.
25

26
The six big losses contd.
Loss Categories The Six Big Losses
Downtime (lost
availability)
fleet failures, Setup and adjustments
Speed losses (lost
performance)
Idling and minor stoppages, Reduced speed
operation
Defect losses (lost
quality)
Scrap and rework Start-up losses

27
OEE (The six big losses) contd.
Overall fleet
Effectiveness
Availability
losses
Performanc
e losses
Quality
losses
Set-up
Breakdown
Minor
Stoppages
Speed
losses
Start-up
losses
In process
losses
Inconsistent Times, Poor tooling, Poor start up controls
Insufficient skills, Missing parts, Insufficient support,
Different methods, Excess start-up adjustment
Poor Planning & scheduling,
Lack of maintenance, Low operator interest,
Not knowing of problems, Poor Training,
Design Problems, Inferior Material
Material not available, Change over at start/end
Jams/misfeeds/ overloads, Operator error,
Operator absence
Unclear design specs., Poor maintenance history,
Incorrect settings, Poor Training,
Speed deliberately reduced, Inconsistent Material
Poor machine changeover, Inconsistent materials,
No start-up check lists, Waiting for temp. - pressures,
Minor adjustments
Temperature & pressure changes, Inconsistent materials,
Process not followed, Poor calibration,
Gauges not calibrated properly.
28
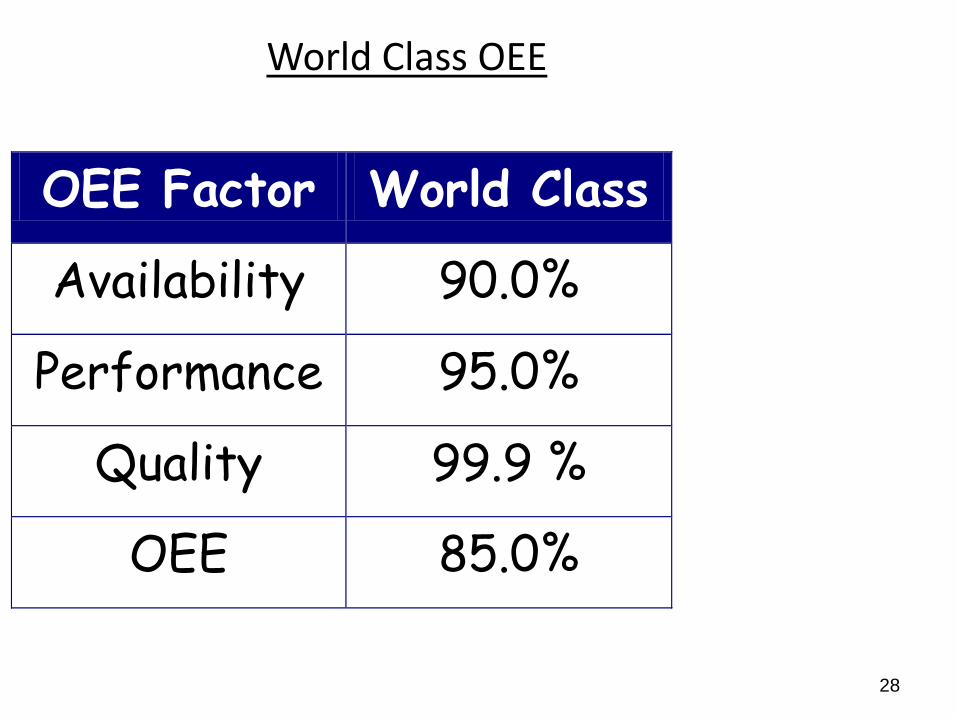
World Class OEE
OEE Factor World Class
Availability 90.0%
Performance 95.0%
Quality 99.9 %
OEE 85.0%

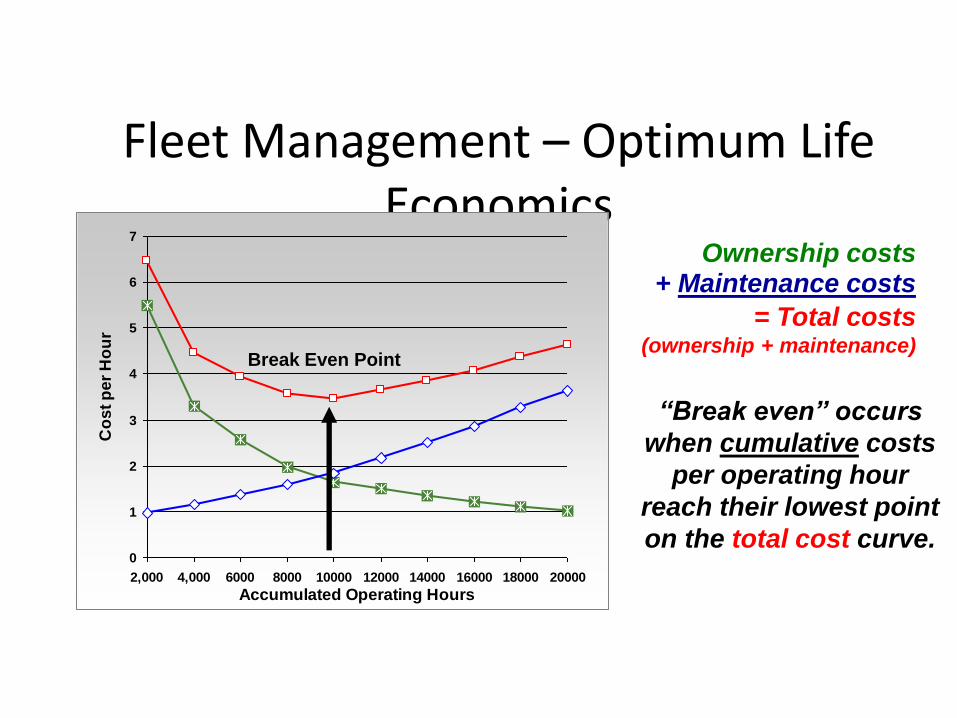
Fleet Management – Optimum Life Economics
• Understanding the point at which acquiring a new vehicle for your fleet is more cost-effective than continuing to repair your current fleet is critical to the deployment of an effective fleet management program.
• The graph on the following slide demonstrates the concept of Optimum Life Economics to determine a vehicle’s “Break Even” point.
Fleet Management – Optimum Life Economics
0
1
2
3
4
5
6
7
2,000 4,000 6000 8000 10000 12000 14000 16000 18000 20000
Accumulated Operating Hours
Co
st
pe
r H
ou
r
“Break even” occurs
when cumulative costs
per operating hour
reach their lowest point
on the total cost curve.
+ Maintenance costs Ownership costs
= Total costs (ownership + maintenance)
Break Even Point
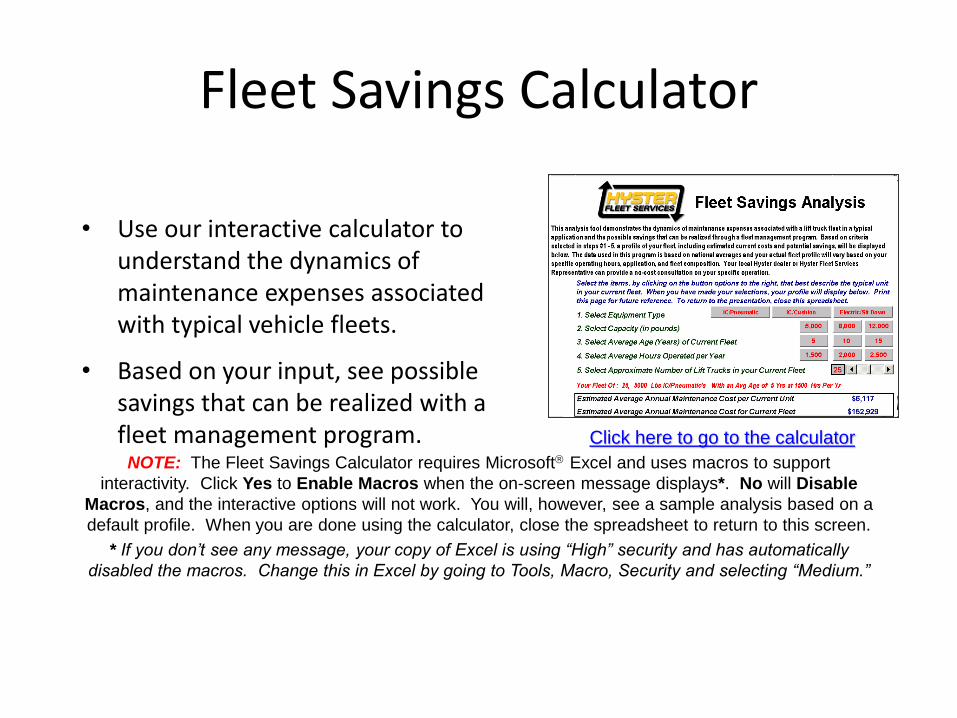
Fleet Savings Calculator
• Use our interactive calculator to understand the dynamics of maintenance expenses associated with typical vehicle fleets.
• Based on your input, see possible savings that can be realized with a fleet management program.
NOTE: The Fleet Savings Calculator requires Microsoft Excel and uses macros to support
interactivity. Click Yes to Enable Macros when the on-screen message displays*. No will Disable
Macros, and the interactive options will not work. You will, however, see a sample analysis based on a
default profile. When you are done using the calculator, close the spreadsheet to return to this screen.
* If you don’t see any message, your copy of Excel is using “High” security and has automatically
disabled the macros. Change this in Excel by going to Tools, Macro, Security and selecting “Medium.”
Click here to go to the calculator

Hyster Fleet Services
• A well designed fleet management program can:
Lower operating costs
Reduce fleet size
Increase utilization
Train operators/technicians
Evaluate contract maintenance
Determine financing alternatives
Improve or eliminate
parts inventory
Redirect head count
Monitor costs
Reduce supplier base
Maximize efficiency

Fleet Management Process Begin Here
Survey Monitor
Analysis Implement
Begin at “Survey” to step through and
see the details on our continuous process
Proposal

Fleet Management Process – Step 1: Survey
• Gather Information on the Existing Fleet – Make/Model
– Age/Serial Number
– Current/Anticipated Operating Hours
– Utilization/Required Availability
– Specifications/Special Requirements
– Application/Operating Conditions
– Maintenance History
Return to Process Flow

Fleet Management Process – Step 2: Analysis
• Compare Existing Fleet to Replacement – Maintenance History
Interpretation
– Utilization Studies
– Projected Maintenance
– Potential Savings
– ROI Analysis
Return to Process Flow

Fleet Management Process – Step 3: Proposal
• fleet Recommendations – Replacement Units and
Configurations
• Maintenance Options – Contract Maintenance or Parts
Inventory
• Training Recommendations – Operator and Mechanic
Return to Process Flow

Fleet Management Process – Step 4:
Implement • Finalize Action Plan
– Standardize Proposed Recommendations
– Product Supply Plan
– fleet Disposal Plan
– Establish Training Schedule
– Maintenance Arrangements
– Customer Commitment
Return to Process Flow

Fleet Management Process – Step 5: Monitor
• Regular Review of Plan – Condition of fleet
– Hours
– Utilization
– Maintenance Cost
– Fleet Size and Replenishment
– Management Reporting
Return to Process Flow
Step 5 completes the process.
Click forward arrow to continue.

International Air Regulation
• US policy has opened direct flights into many cities other than coastal gateways
• Price reductions not yet realized
• Foreign carriers may be reluctant -- requires opening of several European cities
• IATA provides collective rate making for international carriers

Modal Selection & Carrier Management

Cargo Characteristics
• Size: Dimensions & Volume • Weight: Absolute weight of cargo • Hazardous Cargo: Special handling and service
requirements • Density: the weight-to-volume ratio • Stowability: degree to which a product can fill
the available space in a transportation vehicle • Handling: ease or difficulty of handling the
product • Liability: Likelihood (& cost) of threat of theft or
pilferage

Distribution/Transportation Options
Landbridge
Mini-
landbridge
Rail
Micro-
bridge Truck/
rail

Land, Mini-, and Micro-bridges
• Consists of containers traveling over a sea leg and a land leg
• Reduces ship fuel and capital costs
• Reduces transit time
• Frees expensive ship for additional travel

Pipeline
• Initially used to feed other modes (rail)
• Common carrier
• Move more than 20% of intercity freight
• Growth peaked in 1988
• Primarily oil (60%) and natural gas
• Efficient (specific commodities),
• Low damage risk
• Low cost
• Limited geographic coverage, one-way
Truck
Rail
Air
Water
Pipeline

Road
• Most flexible and widely used
• Considerable competition within the industry
• Air and rail are chief competitors (particularly intermodal rail)
• Suitable for higher value, lower volume products (than rail)

Rail
• Cost-effective but influenced by government ownership and driving limits
• Energy-efficient and competitive with road over 500 miles
• Suitable for low value, high volume products

Water
• Heavy, dense freight
• Speed not an issue
• Inexpensive and suitable for low value, high volume products
• Domestic (inland) vs. ocean carriers

Types of Vessels
• Breakbulk Freighters
• Container Ships
• RORO
• Bulk Freighters
• Tankers
• Seagoing Barges
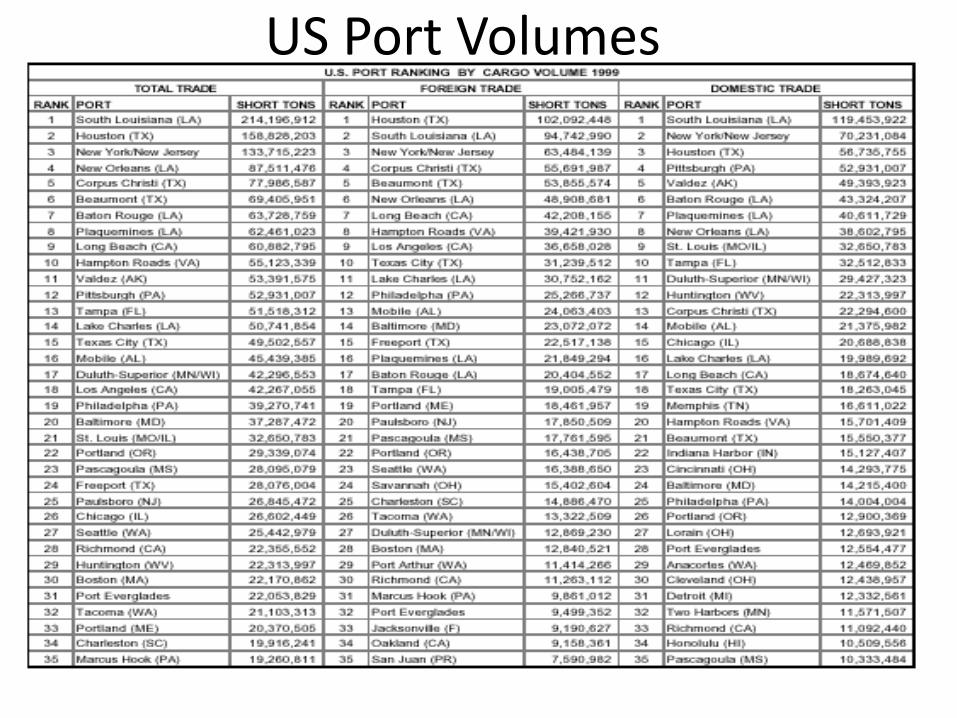
US Port Volumes

Port Authority • Government organization that owns,
operates, or provides wharf, dock, and other terminal investments
• Functions: – Rent waterside access
– Develop waterways and pier terminals
– Capital financing such as container-loading facilities
– Promote overall trade (Portland and Seattle even have www sites advertising their capabilities)

Future Directions
• Expansion due to growth in global trade
• Many firms entering markets -- growing need for value-added services
• Nationalism may constrain growth to protect domestic interests
• International transportation is different and will increase size of transportation firms
• FAST Ship technology
FASTSHIPS, such as the one rendered
above, may well ferry cargo between the
U.S. and Europe soon. Thanks to an
innovative hull design and high-powered
propulsion system, FastShips can sail
twice as fast as traditional freighters. As
a result, valuable cargo should be able to
cross the Atlantic Ocean in days rather
than weeks.

Liner Rate Making
• Costs fairly fixed in nature, low variable costs
• Ships designed for a specific trade route
• Price according to value of service to maximize profitability
• Charges based on a “weight or measure” (W/M) basis
• Different commodities would have different W/M charges

Conference Rate Making • Conferences represent several firms which
have banded together for collective rate making -- a steamship conference
• Composed only of member firms
• Contract or discounted rates (10 - 15%) charged to shippers signing “exclusive patronage agreements”

Problems with Conference System
• Oversupply of space has resulted in some liner firms withdrawing and offering lower rates
• Price cutting by ships owned by the former Soviet Union (under variable costs) in order to obtain hard currency
• Overall, they provide a somewhat stable rate structure which foster uniformity of rates and procedures
Air
• Expensive
• Fast
• Move highly perishable, high value and low volume items
• Mostly Intermodal

Rate Making: Air Cargo
• Value of service or cost of service
• Value of service applied to sensitive cargo and high demand routes
• Cost of service used in pricing cargo
• Utilization of space and product density drive
• Use standard density of 10.4 lbs/cf

Rate Making: Air Cargo
• Suppose a carrier charges $90 per cf
• Product has weight of 480 lbs with dimensions of 6’x5’x3’ or 90 cubic feet. 480/90 = 5.33 lbs/cf
• Carrier charges based on standard density since this is a low density item
• 90cuft x 10.4 lbs = 936 lbs is basis for charge
• Items with high density (> 10.4 lbs/cf) charged on actual weight

Other Air Cargo Rates
• General Cargo: Available for many commodities
• Class Rate: Used to attract freight and allow shippers to penetrate markets (generate demand)
• Container Rates: Cost based, often discounted based on number of containers on a route

Other Rate Considerations
• Time/volume Rates: Rate reduction for a guaranteed amount of tonnage or containers over a specific time period
• Currency Adjustment: Covers currency fluctuations
• Ports: Less competitive ports have had higher rail rates

Air Motor Pipeline Rail Water
Cost per
ton-mile
$0.425 $0.219 $0.011 $0.027 $0.0074
Operating
Ratio
high 80s 93 - 95% mid 50s low 70s 92 - 95%
Volume
Carried
0.1% 40.5% 16.3% 26.3% 16.8%
Speed 400 mph 40 mph 5 mph 20 mph 5 mph
Competitors Motor Air or I/M Rail
Water Water, Pipeline, or
Motor
Rail or Pipeline
Type of
Freight
High Value
Varies widely
Petrol or Slurry
Low value, Bulk
Low value, Bulk
Mode Characteristics

What is Intermodal Transportation?
• The use of two or modes of transportation in moving a shipment from origin to destination
• Mostly associated with “piggyback” or container shipments
• Combines advantages (and disadvantages) of each mode used
• Reduces risk of theft and loss
• Shortens customer order cycle time and effectively reduces costs
• Promotes “seamless” product movement: Eliminates unnecessary handling

Growth of Intermodal Transportation
• Deregulation – Removed barriers to modes working together
• Global business – Off-shore sourcing of goods
• Changes in business environment
– Higher operating costs
– Driver shortages
– Increased competitive pressures

Containerization
• Significant growth during Vietnam War
• Improves efficiency, protects materiel, reduces handling & pilferage
• Sizes: 20 ft (TEU) or 40 ft (FEU)
• Shorter to permit multiple units on railcars

Other Forms of Carriers

I. Third Party Providers
• The offering of nearly any form of transportation to a shipper or receiver as part of a total package of logistics services
• Shipper or user avoids capital outlays and investment
• Focus on core competency--let experts do logistics

II. Freight Forwarders
• Formerly common carriers
– non-asset owning
• Earn difference between what they charge (LTL, LCL) and what they pay (CL, TL)
• Issue bill of lading

Forwarder Operations
Forwarder
Terminal
Forwarder
Terminal
LTL
Shipper
For-hire
carrier
Consig
nees
Breakbulk Linehaul Consolidation Pickup

III. Owner-Operator
• Own or lease a truck and trailer and make services available to for-hire carriers
• Contract out their services to non-union carriers
• Provide overflow capacity and flexibility
• Reduce financial risk to carriers
IV. Freight Brokers
• Intermediaries who bring shippers and carriers together for a fee
• Find customers for carriers or carriers for shippers
• Reduce burden for carriers & shippers
• Find best means/rate for shippers
• Help maximize capacity for carrier
• Information Systems expanding opportunities

V. Express & Courier
• UPS, FEDEX, DHL
• Fast, door-to-door service
• Operate large network of terminals, pick up and delivery vehicles, and line haul
• Typically under 200 lbs
• Compete with Postal Service
• Future good due to expansion and innovative practices

Key Principles of Transportation Management
I. Improving Efficiency
• Rule of efficiency: Straight line, minimize stopping--avoid damage and cost (delay)
• Minimize handling: Avoid “handshakes” and attempt to make process “seamless”
• Full capacity: Reduce cost per unit
• Break bulk & consolidation on long haul • Avoid empty backhauls • Effective Scheduling: “Optimize” labor and fleet
(5%-10%) • Transportation rates are distance related, not
distance proportional

II. Efficient Use of Technology & fleet
• High utilization of expensive assets
• Larger the vehicle, the lower the cost per unit
• Speed does not equal economical operations
• Minimize vehicle gross weight
• Standardized vehicles and fleet
• Balance specialization with adaptability
• Examine trade-offs between IT and traditional logistics functions
Fu
el co
nsu
mp
tio
n
High
High Speed

III. Coordinate Operations
• Coordinate operations with requirements to ensure trade-offs and appropriate level of service
• Cost accountability as part of performance measurement
• Reliability is sometimes better than speed
• Look for opportunities to innovate, but recognize proven principles

Costing & Pricing

Rate versus Price
• Rate: – the amount that is lawfully charged and is based
on cost plus market supply and demand
• Price: – implies value based on prevailing market forces.
Charged under deregulation--carriers much more concerned with price.

Factors Influencing Transportation Costs
• Market-related factors » Degree of competition
» Location of markets
» Government regulation
» Freight traffic into and out of a market
» Domestic versus international movement

Factors Influencing Transportation Costs
Product-Related Factors
• Density: the weight-to-volume ratio
• Stowability: degree to which a product can fill
the available space in a transportation vehicle
• Handling: ease or difficulty of handling the
product
• Liability: threat of theft or pilferage
Factors Influencing Transport Pricing
• Market Structure Models
• Pure Competition (Road)
• Monopoly (Rail/Air)
• Oligopoly (Ocean/Air)
• Monopolistic Competition

Cost Concepts Used in Transportation
• Accounting cost: Cash outlays of firm. Allocation a problem
• Economic cost
– Opportunity cost
– Sunk cost
• Social cost --what are costs to society

Cost Structures
• Separable (traceable or directly assignable)
• Common
• Fixed, do not vary with volume
• Variable, vary with volume
• Marginal or incremental cost
• Out-of-pocket, immediately payable
Pricing of Transportation
• Transportation firms claim to know their costs but do not know how to price
• Relied on regulation and tariffs to set rates
• Must recognize impact of market forces, government regulation, other channel members, and competitors in establishing prices

Comparison of US Domestic Transportation Modes
• Economic characteristics » Cost
» Market coverage
» Degree of competition
» Predominant traffic
» Average length of haul
» fleet capacity

Comparison of US Domestic Transportation Modes
• Service characteristics
» Speed (time-in-transit)
» Availability
» Consistency (delivery time variability)
» Loss and damage
» Flexibility (adjustment to shipper’s needs)

Carrier Pricing
• Free-on-board (FOB)
• Cost-of-service pricing
• Value-of-service pricing
• Delivered pricing
• Quantity discounts
• Allowances
Mode/Carrier Selection
• Problem recognition
• Search process
• Choice process
• Postchoice evaluation

FOB Terms
• FOB = Free (freight) on board
• Comprise of two key elements of freight ownership and freight payment.
• Identifies your legal responsibilities during a transaction and perhaps hidden costs.

7. The Maritime Shipping Industry
• Introduction Ships and Shipping fleet Shipping Comany Operations Maritime Economics Shipping Regulation Managing Ocean Carriers Case Study: ?

9. Port and Facility Operations
• Introduction Port and Facility Functions Ocean Ports Air Ports Other Ports Warehousing Free Trade Zones Case Study: Fedex Midnight Turnaround

8. Air Transportation
• Introduction A Brief History of Aviation Airline Economics Airline Regulation Airplanes and Aviation fleet Managing Air Carriers Case Study: Holland's Fresh Cut Flowers
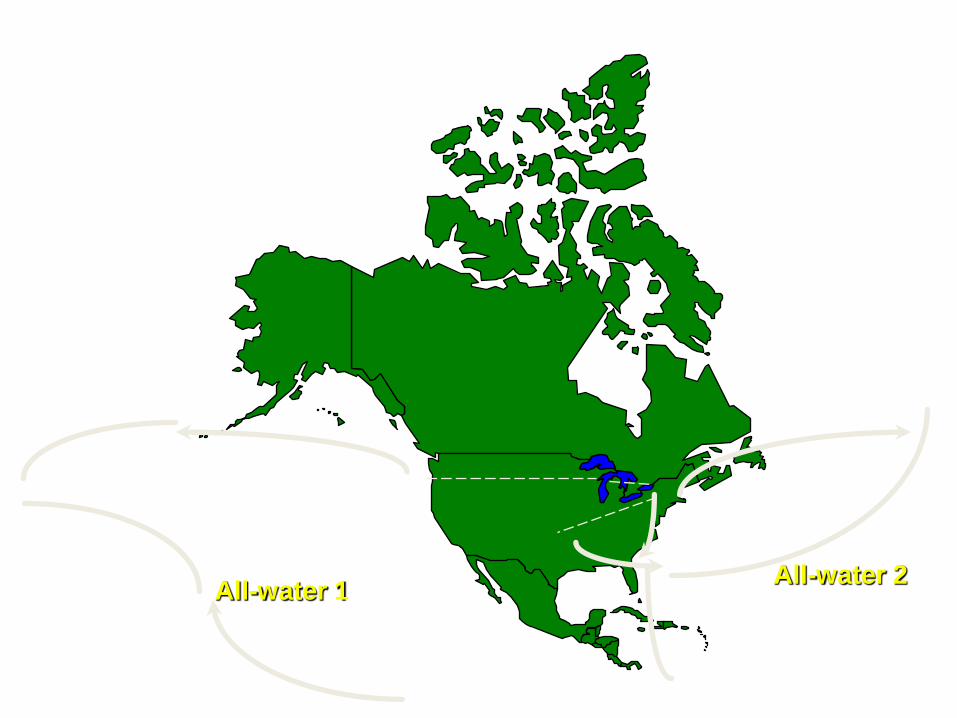
All-water 1 All-water 2

Revenue Management
• Revenue management, also known as yield management, is an essential instrument for matching supply and demand by dividing customers into different segments based on their purchase intentions and allocating capacity to the different segments in a way that maximizes a particular firm’s revenues (El Haddad, Roper & Jones, 2008).

• Basically, yield management is the process of allocating the right type of capacity to the right kind of customer at the right price so as to maximize revenue or yield.
• It is profitably applied by airlines, hotels, restaurants, golf courses, shopping malls, telephone operators, conference centres and other companies.
• The airline industry is considered the birthplace of yield management. After deregulation in the late 1970s, airline competition increased, and the airlines tried to operate their planes as efficiently as possible.
• Yield management was one of the methods developed as a way of increasing competitive advantage and increasing revenue. In airlines, yield management is concerned with selling the right seat to the right customer at the right price so as to maximize yield.
• Yield management is also applied mostly in a hotel industry.

• In a hotel context, yield management is concerned with market sensitive pricing of fixed room capacity relative to specific market characteristics. The 'goal' of YM is the formulation and profitable alignment of price, product and buyer.

Generally, Yield Management system will significantly alter the traditional approach to accommodation management specifically within the following key areas:
Management focus
Data collection
Optimum guest mix
Capacity levels
Technological input
Pricing
Customer hotel interface
Human resource implications
Incentive schemes
Training