Embed Size (px)
Citation preview

Flash Memory Summit
OPEN Session 303G: Market Research
Flash Memory Summit 2016 Santa Clara, CA
1

© Copyright 2006 SASI, LLC. All rights reserved
Flash Memory Venture Funding &
M&A Insights August 11, 2016
John Rotchford, Managing Director, SASI, LLC

3
Violin Memory, $50M 6th Nimble Storage, $40.7M 5th
Pure Storage, $40M 4th STT, $36M 1st
Avalanche Technology, $30M 3rd
Pure Storage, $150M 5th Skyera, $52M 2nd
Crocus Technology, $45M Later
Tegile, $35M 3rd SolidFire, $31M 4th
Tintri, $75M 5th Pure Storage, $225M 6th
PernixData, $35M 3rd Reduxio, $15M 2nd
NVMDurance, $1M 1st
Top Five Rounds Tegile, $70M 4th
Crossbar, $35M 4th Nantero, $31.5M 5th
Everspin Tech., $29M 2nd Crocus, $21M 5th
$335M
$388M $351M
$230M
$92M
$0
$50
$100
$150
$200
$250
$300
$350
$400
2012 2013 2014 2015 1H 2016
Tota
l Fun
ding
($M
) 12 Rds.
Avg. $32.3M 5 Rds.
Avg. $70.2M
12 Rds.
Avg. $27.9M
9 Rds.
Avg. $25.5M
Year
Flash Memory Venture Funding
Elastifile, $35M 2nd Avalanche Tech, 23M 6th
Diablo Tech, $19M 3rd E8 Storage, $12M 2nd
NVM Durance, $2.5M 1st
5 Rds.
Avg. $18.3M
We are seeing a shift from larger, later stage rounds to smaller, earlier stage rounds. This is the second wave of innovation and will ramp into 2017 and 2018….

4
Flash Memory M&A Transactions
$860M
$2.04B
$1.72B
$0
$1
$2
$3
2012 2013 2014 2015
Tota
l Con
side
ratio
n ($
B)
9 Deals
Median Deal Size: $213M 6 Deals
Median Deal Size: $450M
9 Deals
Median Deal Size: $80M
4 Deals
Median Deal Size: $870M
Year
$20 $19.93B
EMC/XtremIO, $430M IBM/Texas Memory Systems $250M
NetApp/CacheIQ, $90M
SanDisk/FlashSoft, $70M
WD/Virident Systems, $645M
Cisco/WhipTail, $415M WD/STEC, $340M
SanDisk/SMART Storage Systems, $307M
Fusion-io/NextGen, $119M
SanDisk/Fusion-io, $1.1B
Seagate/LSI, $450M EMC/DSSD, $150M
Top Deals WD/SanDisk, $19.0B
NetApp/SolidFire, $870M Silicon Motion/Shannon Sys, $57.5M
Micron/Tidal Systems, ND
2016 is off to a slow start with one trade but we see M&A picking up in 2nd half of 2016, into 2017….

Flash Market Consolidation
Buyer
Software
Systems
Sub-Systems
Hybrid
SSDs/ Controllers
Cisco Whiptail (2013)
EMC DSSD (2014)
XtremIO (2012)
IBM Texas Memory (2012)
Intel Nevex (2012)
NetApp SolidFire (2015)
CacheIO (2012)
Toshiba OCZ (2013)
OCZ (2013)
Samsung Proximal Data (2014)
NVELO (2012)
Seagate LSI (2014)
LSI/ (2014)
Violin Memory
GridIron (2013)
Western Digital
SanDisk (2015) Velobit (2013)
Skyera (2014)
SanDisk (2015) Virident (2013)
SanDisk (2015)
SanDisk (2015) STEC (2013)
Micron Tidal Systems (2015)
5
We expect market leaders to fuel further consolidation in 2017…

Flash Memory Venture Market Map
Systems
Our market map has expanded across all segments…..
Sub-Systems
Hybrid
Memory/Controllers
(MRAM)
(CBRAM)
(NMV)
Software
(MRAM)
(NRAM)
6
(MRAM)
(RRAM)
(PCIe)
(NVMe)
(NVMe)
(NVMe

Flash Memory Summit
Chris DePuy, Dell’Oro Group
Flash Memory Summit 2016 Santa Clara, CA
7
GROUP DELL'ORO

Agenda
Flash Memory Summit 2016 Santa Clara, CA
8
§ Forecast of flash growth in storage infrastructure market
§ The role storage will play in transition from on-premise data centers to clouds
§ Discussion about external storage system architectures
§ Acquisition candidates in converged trend

Flash as % of Total Capacity in External Storage Systems
Flash Memory Summit 2016 Santa Clara, CA
9
0%
30%
60%
2015 2016 2017 2018 2019 2020
GROUPDELL'ORO

External Systems – Cloud vs Enterprise
Flash Memory Summit 2016 Santa Clara, CA
10

Ports on External Storage Systems and Their Connected Servers
Flash Memory Summit 2016 Santa Clara, CA
11
0%
30%
60%
2015 2016 2017 2018 2019 2020
Fibre Channel
SAS and Other
Ethernet
Ports
GROUPDELL'ORO

Share – Converged Components
Flash Memory Summit 2016 Santa Clara, CA
12
*2015 data; Data Center (DC) Switch from Ethernet Switch Deployment Location Report, Mar. 2016; Servers from 4Q15 Server Report
Branded Vendor Storage Servers DC Switch
EMCHPEDELLNetAppIBMHuaweiHitachiLenovoCiscoOracleArista & Juniper
Others
GROUPDELL'ORO

OBJECTIVE ANALYSIS
Big Changes For 2016 & Beyond
Jim Handy

OBJECTIVE ANALYSIS – www.OBJECTIVE-ANALYSIS.com
OBJECTIVE ANALYSIS
Profound Analysts
Custom Consulting
Reports & Services

OBJECTIVE ANALYSIS – www.OBJECTIVE-ANALYSIS.com
Objective Analysis Semiconductor Forecast Accuracy
Year Forecast Actual 2008 Zero growth at best. -3%
2009 Growth in the mid teens -9%
2010 Should approach 30% 32%
2011 Muted revenue growth: 5% 0%
2012 Revenues drop as much as -5% -2.7%
2013 Revenues increase nearly 10% 4.9%
2014 Revenues up 20%+ 9.9%
2015 Revenues up ~10% -0.2%
2016 Revenues up ~10% TBD

OBJECTIVE ANALYSIS – www.OBJECTIVE-ANALYSIS.com
Outlook
• 3D NAND stall through 2017 – Breakthrough will occur in 2018
• Big collapse after that
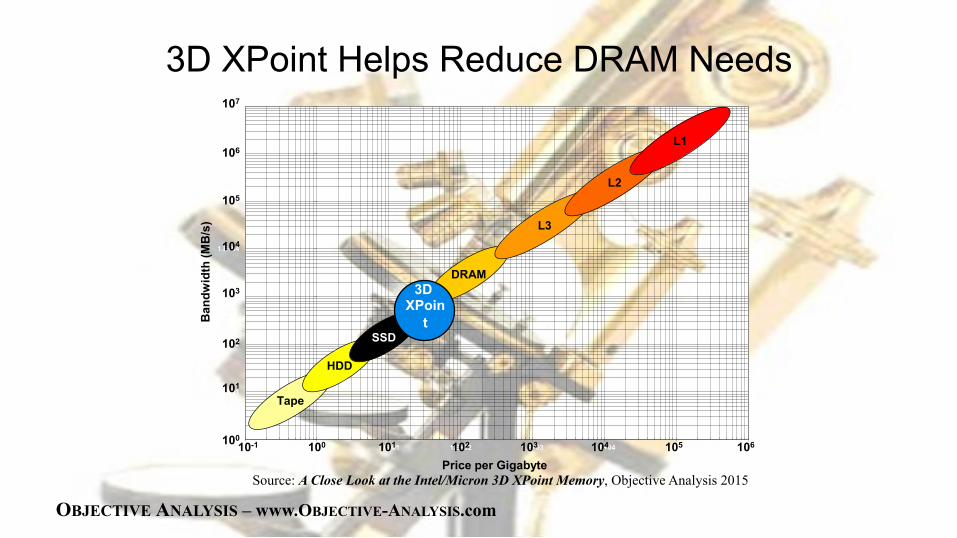
• 3D XPoint won’t hurt NAND sales – DRAM is threatened
• China will begin huge CapEx spend • SSD unit growth steady
– But revenues will cycle

OBJECTIVE ANALYSIS – www.OBJECTIVE-ANALYSIS.com
The Longer The Shortage, The Bigger The Collapse!
Collapse
Flat Pricing
Pric
e pe
r Gig
abyt
e
Time
OBJECTIVE ANALYSIS – www.OBJECTIVE-ANALYSIS.com
3D XPoint Helps Reduce DRAM Needs
1.E+00
1.E+01
1.E+02
1.E+03
1.E+04
1.E+05
1.E+06
1.E+07
1.E-01 1.E+00 1.E+01 1.E+02 1.E+03 1.E+04 1.E+05 1.E+06
Ban
dwid
th (M
B/s
)
Price per Gigabyte
Tape
HDD
SSD
DRAM
L3
L2
L1
101
100
102
103
104
105
106
107
101 102 103 104 105 10610010-1
3DXPoint
Source: A Close Look at the Intel/Micron 3D XPoint Memory, Objective Analysis 2015
3D XPoin
t

OBJECTIVE ANALYSIS – www.OBJECTIVE-ANALYSIS.com
China Spending About to Begin

OBJECTIVE ANALYSIS – www.OBJECTIVE-ANALYSIS.com
Steady SSD Unit Growth, But A Revenue Rollercoaster
$0
$10
$20
$30
$40
0
100
200
300
400
Rev
enue
s ($
B)
Uni
t Shi
pmen
ts (
Mu)
Units Revenues Source: Objective Analysis SSD Market Update 2015

OBJECTIVE ANALYSIS – www.OBJECTIVE-ANALYSIS.com
Average IOPS by Application
0 500,000
1,000,000 1,500,000 2,000,000 2,500,000 3,000,000 3,500,000
Database OLTP Cloud Science & Eng
IOPS
Req
uire
d
From: How Many IOPS Do You Really Need? Objective Analysis & Coughlin Assoc.

OBJECTIVE ANALYSIS – www.OBJECTIVE-ANALYSIS.com
Summary
• 3D NAND Stall will break through to an oversupply • 3D XPoint is a threat to DRAM • Major China CapEx coming • SSD units grow, but revenues gyrate

OBJECTIVE ANALYSIS
Thank You!
Jim Handy

Beyond Traditional NAND Flash Marketing Research
Brian Dargel
Santa Clara, CA August 2016
The views expressed here are solely those of the author in his private capacity and do not in any way represent the views of Micron Technology Inc.

Traditional Flash Market Research
Financial Research
Market Share Predictions
Technology Trends
Application / end-Market trends
Geopolitics / Industrial Policy / National Initiatives ¶
Santa Clara, CA August 2016

Santa Clara, CA August 2016
Source: Wikipedia
Source: CNN
Source: WSJ
~1997~
Source:AOL Source: Wikipedia
Source: Time
Source: Wikipedia
Source: Time

Santa Clara, CA August 2016
Other
Source: ICE, Memory 1997
1997 Publication of 1996 Flash Memory Market Data (Start of the NAND ramp)

Santa Clara, CA August 2016
80 70 60 50 40 30 20 10 0
100 90
1992 1995 1999 2005 2010 2015
Other Other Other Other
Source: ICE, Web-Feet Research

Santa Clara, CA August 2016
Industry ‘Pivot’

Santa Clara, CA August 2016
Information Flow Industrial Policy

Santa Clara, CA August 2016
• Chaebols • Korean Peninsula •Abenomics • The IT decline
• Cross-strait relations • IT dependence • National Initiatives • Socialism with Chinese characteristics
• Presidential Election • CFIUS
Where is the rest of the world

Flash/SSD Markets
Mark Webb MKW Ventures Consulting, LLC
Flash Memory Summit 2016 Santa Clara, CA
32

Flash Market Projections
Flash Memory Summit 2016 Santa Clara, CA
33
§ Market Summary § SSD Units § SSD Adoption Rates
§ Predictions § What will not happen
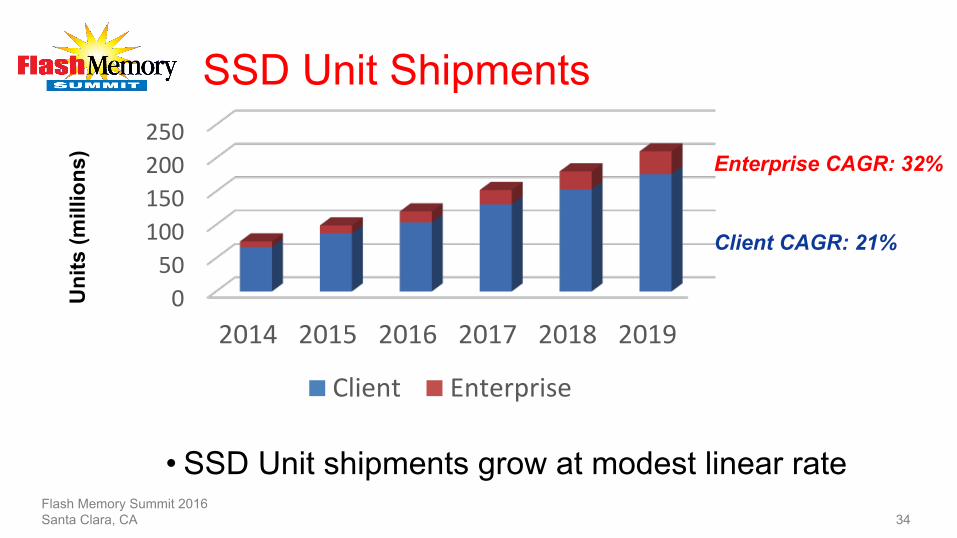
SSD Unit Shipments
Flash Memory Summit 2016 Santa Clara, CA
34
050100150200250
2014 2015 2016 2017 2018 2019
SSDUnitShipments(M)
Client Enterprise
Enterprise CAGR: 32%
Client CAGR: 21%
Uni
ts (m
illio
ns)
• SSD Unit shipments grow at modest linear rate

SSD Market Penetration
• SSDs are growing but still trail HDD
• Notebook: still TBD
• Tipping if cloud storage is first storage for 100% of notebooks
• Saturating if hybrid HDD or HDD still primary storage
• Enterprise: continues linear • 100% of performance
enterprise • <5% of capacity enterprise
Flash Memory Summit 2016 Santa Clara, CA

Predictions • SSD cost/GB drop 25% per year
• Prices 25% or more • TLC becomes dominant in all SDDs
• Client and Enterprise/Datacenter • Cloud/Hyperscale becomes dominate SSD market • Formfactors cost optimized for SSD applications
• M.2 for all applications • BGA for Phone/ultramobile, Notebooks
• SCM memory has multiple suppliers and technologies for >$1B market
Flash Memory Summit 2016 Santa Clara, CA
36

What Will NOT Happen
• HDDs will NOT go away • SCM memory will not replace DRAM or
NAND • No new major 3D NAND companies will arise
Flash Memory Summit 2016 Santa Clara, CA
37