Embed Size (px)
Citation preview
Flame speed enhancement of a nitrocellulose monopropellant using graphenemicrostructuresS. Jain, W. Park, Y. P. Chen, and L. Qiao Citation: Journal of Applied Physics 120, 174902 (2016); doi: 10.1063/1.4966933 View online: http://dx.doi.org/10.1063/1.4966933 View Table of Contents: http://scitation.aip.org/content/aip/journal/jap/120/17?ver=pdfcov Published by the AIP Publishing Articles you may be interested in Flame speed enhancement of solid nitrocellulose monopropellant coupled with graphite at microscales J. Appl. Phys. 119, 094904 (2016); 10.1063/1.4943226 Response analysis of a laminar premixed M-flame to flow perturbations using a linearized compressible Navier-Stokes solver Phys. Fluids 27, 043602 (2015); 10.1063/1.4918672 Characterization of Hall effect thruster propellant distributors with flame visualization Rev. Sci. Instrum. 84, 013302 (2013); 10.1063/1.4774049 Noncatalytic thermocouple coatings produced with chemical vapor deposition for flame temperaturemeasurements Rev. Sci. Instrum. 78, 013905 (2007); 10.1063/1.2426876 Plasma-enhanced combustion of propane using a silent discharge Phys. Plasmas 11, 2950 (2004); 10.1063/1.1688788
Reuse of AIP Publishing content is subject to the terms at: https://publishing.aip.org/authors/rights-and-permissions. Download to IP: 128.210.106.52 On: Thu, 03 Nov 2016
19:29:55
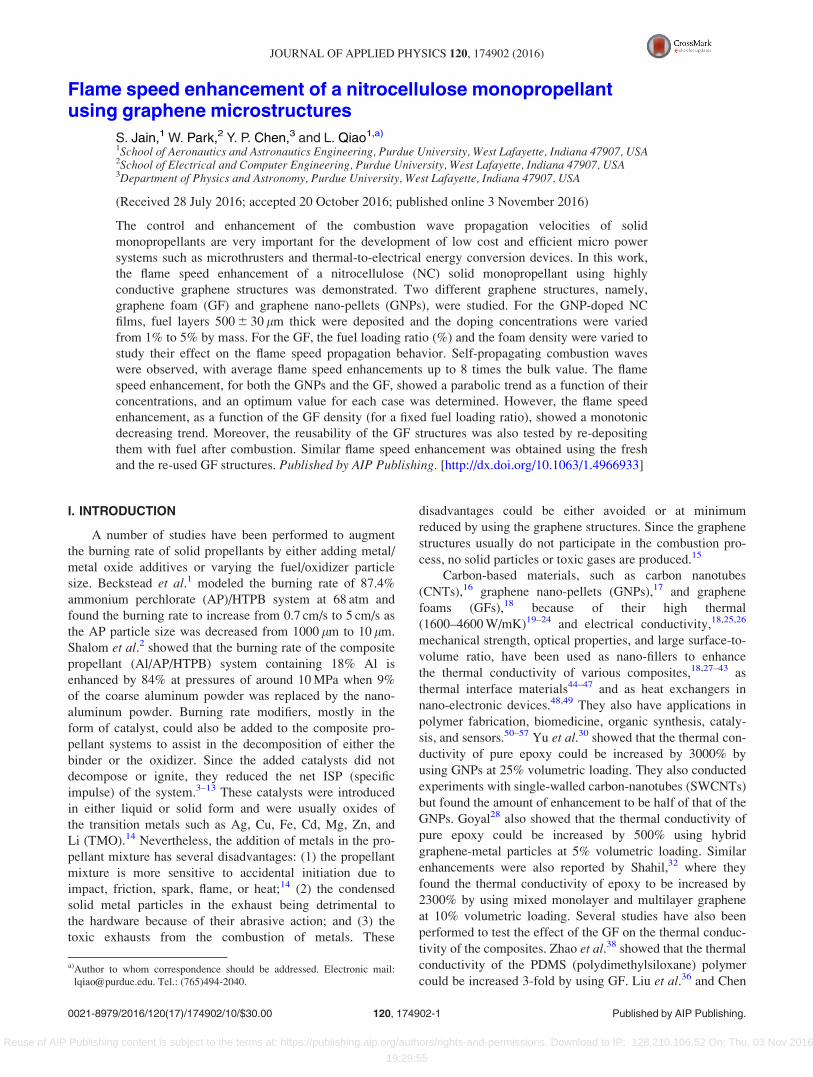
Flame speed enhancement of a nitrocellulose monopropellantusing graphene microstructures
S. Jain,1 W. Park,2 Y. P. Chen,3 and L. Qiao1,a)
1School of Aeronautics and Astronautics Engineering, Purdue University, West Lafayette, Indiana 47907, USA2School of Electrical and Computer Engineering, Purdue University, West Lafayette, Indiana 47907, USA3Department of Physics and Astronomy, Purdue University, West Lafayette, Indiana 47907, USA
(Received 28 July 2016; accepted 20 October 2016; published online 3 November 2016)
The control and enhancement of the combustion wave propagation velocities of solid
monopropellants are very important for the development of low cost and efficient micro power
systems such as microthrusters and thermal-to-electrical energy conversion devices. In this work,
the flame speed enhancement of a nitrocellulose (NC) solid monopropellant using highly
conductive graphene structures was demonstrated. Two different graphene structures, namely,
graphene foam (GF) and graphene nano-pellets (GNPs), were studied. For the GNP-doped NC
films, fuel layers 500 6 30 lm thick were deposited and the doping concentrations were varied
from 1% to 5% by mass. For the GF, the fuel loading ratio (%) and the foam density were varied to
study their effect on the flame speed propagation behavior. Self-propagating combustion waves
were observed, with average flame speed enhancements up to 8 times the bulk value. The flame
speed enhancement, for both the GNPs and the GF, showed a parabolic trend as a function of their
concentrations, and an optimum value for each case was determined. However, the flame speed
enhancement, as a function of the GF density (for a fixed fuel loading ratio), showed a monotonic
decreasing trend. Moreover, the reusability of the GF structures was also tested by re-depositing
them with fuel after combustion. Similar flame speed enhancement was obtained using the fresh
and the re-used GF structures. Published by AIP Publishing. [http://dx.doi.org/10.1063/1.4966933]
I. INTRODUCTION
A number of studies have been performed to augment
the burning rate of solid propellants by either adding metal/
metal oxide additives or varying the fuel/oxidizer particle
size. Beckstead et al.1 modeled the burning rate of 87.4%
ammonium perchlorate (AP)/HTPB system at 68 atm and
found the burning rate to increase from 0.7 cm/s to 5 cm/s as
the AP particle size was decreased from 1000 lm to 10 lm.
Shalom et al.2 showed that the burning rate of the composite
propellant (Al/AP/HTPB) system containing 18% Al is
enhanced by 84% at pressures of around 10 MPa when 9%
of the coarse aluminum powder was replaced by the nano-
aluminum powder. Burning rate modifiers, mostly in the
form of catalyst, could also be added to the composite pro-
pellant systems to assist in the decomposition of either the
binder or the oxidizer. Since the added catalysts did not
decompose or ignite, they reduced the net ISP (specific
impulse) of the system.3–13 These catalysts were introduced
in either liquid or solid form and were usually oxides of
the transition metals such as Ag, Cu, Fe, Cd, Mg, Zn, and
Li (TMO).14 Nevertheless, the addition of metals in the pro-
pellant mixture has several disadvantages: (1) the propellant
mixture is more sensitive to accidental initiation due to
impact, friction, spark, flame, or heat;14 (2) the condensed
solid metal particles in the exhaust being detrimental to
the hardware because of their abrasive action; and (3) the
toxic exhausts from the combustion of metals. These
disadvantages could be either avoided or at minimum
reduced by using the graphene structures. Since the graphene
structures usually do not participate in the combustion pro-
cess, no solid particles or toxic gases are produced.15
Carbon-based materials, such as carbon nanotubes
(CNTs),16 graphene nano-pellets (GNPs),17 and graphene
foams (GFs),18 because of their high thermal
(1600–4600 W/mK)19–24 and electrical conductivity,18,25,26
mechanical strength, optical properties, and large surface-to-
volume ratio, have been used as nano-fillers to enhance
the thermal conductivity of various composites,18,27–43 as
thermal interface materials44–47 and as heat exchangers in
nano-electronic devices.48,49 They also have applications in
polymer fabrication, biomedicine, organic synthesis, cataly-
sis, and sensors.50–57 Yu et al.30 showed that the thermal con-
ductivity of pure epoxy could be increased by 3000% by
using GNPs at 25% volumetric loading. They also conducted
experiments with single-walled carbon-nanotubes (SWCNTs)
but found the amount of enhancement to be half of that of the
GNPs. Goyal28 also showed that the thermal conductivity of
pure epoxy could be increased by 500% using hybrid
graphene-metal particles at 5% volumetric loading. Similar
enhancements were also reported by Shahil,32 where they
found the thermal conductivity of epoxy to be increased by
2300% by using mixed monolayer and multilayer graphene
at 10% volumetric loading. Several studies have also been
performed to test the effect of the GF on the thermal conduc-
tivity of the composites. Zhao et al.38 showed that the thermal
conductivity of the PDMS (polydimethylsiloxane) polymer
could be increased 3-fold by using GF. Liu et al.36 and Chen
a)Author to whom correspondence should be addressed. Electronic mail:
[email protected]. Tel.: (765)494-2040.
0021-8979/2016/120(17)/174902/10/$30.00 Published by AIP Publishing.120, 174902-1
JOURNAL OF APPLIED PHYSICS 120, 174902 (2016)
Reuse of AIP Publishing content is subject to the terms at: https://publishing.aip.org/authors/rights-and-permissions. Download to IP: 128.210.106.52 On: Thu, 03 Nov 2016
19:29:55
et al.18 showed that the thermal diffusivity of pure epoxy
could be increased 10 and 46 times using GF at 5% and 9%
by weight, respectively.
However, there exists contradiction in the literature on
the effects that the CNT addition has on the thermal conduc-
tivity of the composites. Huang et al.29 conducted experi-
ments with vertically aligned CNTs and found the thermal
conductivity of polymer/CNT complex to be increased by
280% at 0.3% weight fraction. However, Bonnet et al.58
found only a slight increase in the thermal conductivity,
around 55%, using CNTs at 7% by volume. An opposite trend
was observed by Moisala et al.,59 where the thermal conduc-
tivity of the epoxy/CNT composites decreased with the
addition of SWCNTs. A major limitation of using the carbon-
nanotubes is the thermal contact resistance at their interface
with both the medium and adjacent nanostructures.60–65 The
thermal boundary resistance (TBR) for CNTs has been
reported to be between 0.07 and 0.8 cm2/kW.60,66–68 A TBR
value of 0.04 cm2/kW was reported by Zhang et al.35 for the
GF. The thermal contact resistance is greatly reduced in the
GF because of its three-dimensional network of covalently
bonded two-dimensional graphene structures.41 The high ther-
mal resistance in the CNTs could be attributed either to the
high Kapitza resistance61 due to the mismatch between the
phonon density of states (DOS) between the 1-D CNTs and
the 3-D bulk material or to the lack of thermal percolation
in CNT composites.62 Park et al.47 reported a TBR value of
0.043 cm2/kW for the FLG (few layer graphene), whereas
Raza et al.69 and Shen et al.70 reported TBR values of around
0.1 cm2/kW and 0.3 cm2/kW for the GNPs, respectively.
Thus, the thermal contact resistance of the GNPs could be
expected to lie somewhere between that of the CNTs and the
GF. A comprehensive study was performed by Ji et al.,34 in
which the thermal conductivity enhancement of wax using
GF, GNPs, and CNTs was compared. The thermal conductiv-
ity of the composite increased by 18 (1% vol.), 11 (4% vol.),
and 6 (10% vol.) times using GF, GNPs, and CNTs,
respectively.
In addition to enhancing the thermal conductivity, these
carbon nanomaterials have also been shown to augment the
burning rate of various solid monopropellants. Since the
burning rate of solid monopropellants is controlled by heat
transport (from burned to unburned material), it depends on
the thermal conductivity of the propellants71,72 and thus
could be enhanced by coupling these solid propellants to
highly conductive graphene structures. Most of the solid
monopropellants have a thermal conductivity in the range of
0.1–1 W/mK,73 which is much lower than that of the carbon-
based materials (as high as a few thousand W/mK). Choi
et al.15 showed that the flame speed of a solid monopropel-
lant TNA (trinitramine) could be enhanced by 104 times by
coupling it to the MWCNTs (multi-wall carbon nanotubes)
at nanoscale. Furthermore, in our previous work,74 graphite
sheets were used to enhance the burning rate of a solid
monopropellant. Flame speed enhancements up to 4 times
were obtained. Zhang et al.75 also studied the effect of gra-
phene oxides (GOs) on the burning rate of nitrocellulose
(NC) and significant enhancements up to 7 times the bulk
value were observed.
In this work, GF and GNPs were chosen to be the ther-
mally conductive fillers to solid propellants because of their
unique thermal properties as described above. Their ability
to enhance the burning rates of solid propellants has not been
explored previously. An experiment was developed to mea-
sure the flame speeds of a monopropellant nitrocellulose
(NC) which was either doped with GNPs or filled in the GF
matrix. For the GNPs, the amount of GNPs added to NC was
varied, whereas for the GF, both the NC loading ratio (%)
and the GF density were varied. An optimum loading ratio
for both the GNPs and the GF was determined. The reusabil-
ity of the GF structures was also tested, and similar flame
speed enhancement was obtained using the fresh and the re-
used GF structures.
II. EXPERIMENTAL METHOD
A. Material selection
Nitrocellulose (C6H8(NO2)2O5), with a nitration level of
10.9%–11.2%, was selected as the solid fuel because of its
ease of combustion at atmospheric conditions and wide use
as an energetic polymeric binder in the nitrocellulose-based
propellants in solid rocket motors. In addition, the nitration
level of the solid propellant is such that it exhibits deflagra-
tion and not detonation during combustion. The nitrocellu-
lose solution (6% in ethanol/diethyl ether) was purchased
from Sigma-Aldrich, which was then further diluted using
acetone, giving the net NC solution to be 4% by weight.
GNPs (graphene nano-pellets) and GF were used as the
conductive materials. The GNPs were less than 3 nm thick
(3–8 graphene monolayers) with lateral dimensions ranging
between 2 and 8 lm, whereas the GF was 3 mm thick and
had an average porosity of 99.2%. The foam density was var-
ied from 8 mg/cm3 to 40 mg/cm3 to study its effect on the
average flame speed enhancements. For all the experiments
conducted, the dimensions of the foam sheet and the GNP-
doped fuel layer were kept constant to 2.5 cm � 0.6 cm. This
was done to make sure that the length of the samples was
much greater than the width so that the flame fronts obtained
were nearly planar.
B. Sample preparation
For the GNPs-doped NC films, the GNPs (A-12-25 G,
Graphene Laboratories) were added to the base NC solution
at various concentrations ranging from 1% to 5% of the
NC weight. An ultrasonic disruptor was used to disperse
the GNPs evenly in the base NC solution and to minimize
agglomeration. A series of four-second-long and four-second
apart pulses were used for 8 min. The GNP/NC solution was
then drop-casted onto a thermally insulating glass slide
(2.5 cm long and 0.6 cm wide) and evaporated at ambient
conditions leaving an adhesive coating of GNP-NC behind.
For all the cases tested, the GNP-doped fuel layers had a
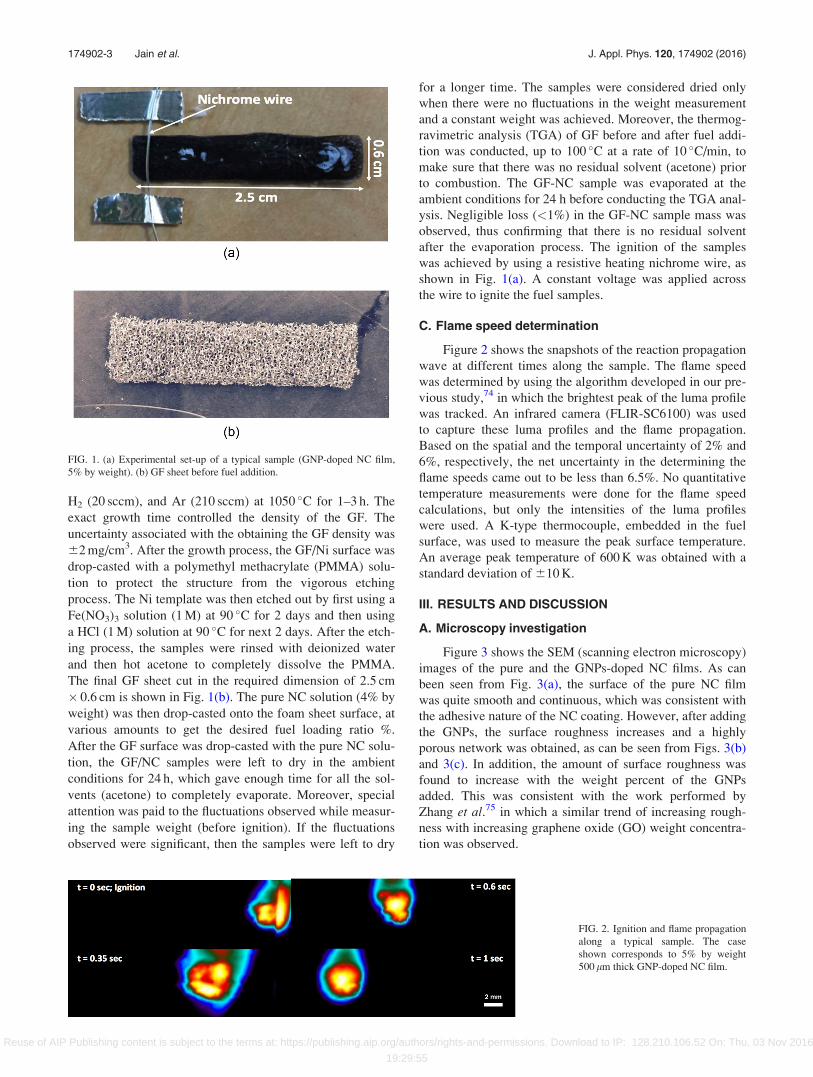
thickness of 500 6 30 lm as shown in Fig. 1(a).
The GF, following the method outlined by Chen et al.,18
was grown on a Ni template (3 mm-thick open-cell foam
with 75 pores per inch) by the chemical vapor deposition
(CVD) method with flowing a gas mixture of CH4 (20 sccm),
174902-2 Jain et al. J. Appl. Phys. 120, 174902 (2016)
Reuse of AIP Publishing content is subject to the terms at: https://publishing.aip.org/authors/rights-and-permissions. Download to IP: 128.210.106.52 On: Thu, 03 Nov 2016
19:29:55
H2 (20 sccm), and Ar (210 sccm) at 1050 �C for 1–3 h. The
exact growth time controlled the density of the GF. The
uncertainty associated with the obtaining the GF density was
62 mg/cm3. After the growth process, the GF/Ni surface was
drop-casted with a polymethyl methacrylate (PMMA) solu-
tion to protect the structure from the vigorous etching
process. The Ni template was then etched out by first using a
Fe(NO3)3 solution (1 M) at 90 �C for 2 days and then using
a HCl (1 M) solution at 90 �C for next 2 days. After the etch-
ing process, the samples were rinsed with deionized water
and then hot acetone to completely dissolve the PMMA.
The final GF sheet cut in the required dimension of 2.5 cm
� 0.6 cm is shown in Fig. 1(b). The pure NC solution (4% by
weight) was then drop-casted onto the foam sheet surface, at
various amounts to get the desired fuel loading ratio %.
After the GF surface was drop-casted with the pure NC solu-
tion, the GF/NC samples were left to dry in the ambient
conditions for 24 h, which gave enough time for all the sol-
vents (acetone) to completely evaporate. Moreover, special
attention was paid to the fluctuations observed while measur-
ing the sample weight (before ignition). If the fluctuations
observed were significant, then the samples were left to dry
for a longer time. The samples were considered dried only
when there were no fluctuations in the weight measurement
and a constant weight was achieved. Moreover, the thermog-
ravimetric analysis (TGA) of GF before and after fuel addi-
tion was conducted, up to 100 �C at a rate of 10 �C/min, to
make sure that there was no residual solvent (acetone) prior
to combustion. The GF-NC sample was evaporated at the
ambient conditions for 24 h before conducting the TGA anal-
ysis. Negligible loss (<1%) in the GF-NC sample mass was
observed, thus confirming that there is no residual solvent
after the evaporation process. The ignition of the samples
was achieved by using a resistive heating nichrome wire, as
shown in Fig. 1(a). A constant voltage was applied across
the wire to ignite the fuel samples.
C. Flame speed determination
Figure 2 shows the snapshots of the reaction propagation
wave at different times along the sample. The flame speed
was determined by using the algorithm developed in our pre-
vious study,74 in which the brightest peak of the luma profile
was tracked. An infrared camera (FLIR-SC6100) was used
to capture these luma profiles and the flame propagation.
Based on the spatial and the temporal uncertainty of 2% and
6%, respectively, the net uncertainty in the determining the
flame speeds came out to be less than 6.5%. No quantitative
temperature measurements were done for the flame speed
calculations, but only the intensities of the luma profiles
were used. A K-type thermocouple, embedded in the fuel
surface, was used to measure the peak surface temperature.
An average peak temperature of 600 K was obtained with a
standard deviation of 610 K.
III. RESULTS AND DISCUSSION
A. Microscopy investigation
Figure 3 shows the SEM (scanning electron microscopy)
images of the pure and the GNPs-doped NC films. As can
been seen from Fig. 3(a), the surface of the pure NC film
was quite smooth and continuous, which was consistent with
the adhesive nature of the NC coating. However, after adding
the GNPs, the surface roughness increases and a highly
porous network was obtained, as can be seen from Figs. 3(b)
and 3(c). In addition, the amount of surface roughness was
found to increase with the weight percent of the GNPs
added. This was consistent with the work performed by
Zhang et al.75 in which a similar trend of increasing rough-
ness with increasing graphene oxide (GO) weight concentra-
tion was observed.
FIG. 1. (a) Experimental set-up of a typical sample (GNP-doped NC film,
5% by weight). (b) GF sheet before fuel addition.
FIG. 2. Ignition and flame propagation
along a typical sample. The case
shown corresponds to 5% by weight
500 lm thick GNP-doped NC film.
174902-3 Jain et al. J. Appl. Phys. 120, 174902 (2016)
Reuse of AIP Publishing content is subject to the terms at: https://publishing.aip.org/authors/rights-and-permissions. Download to IP: 128.210.106.52 On: Thu, 03 Nov 2016
19:29:55
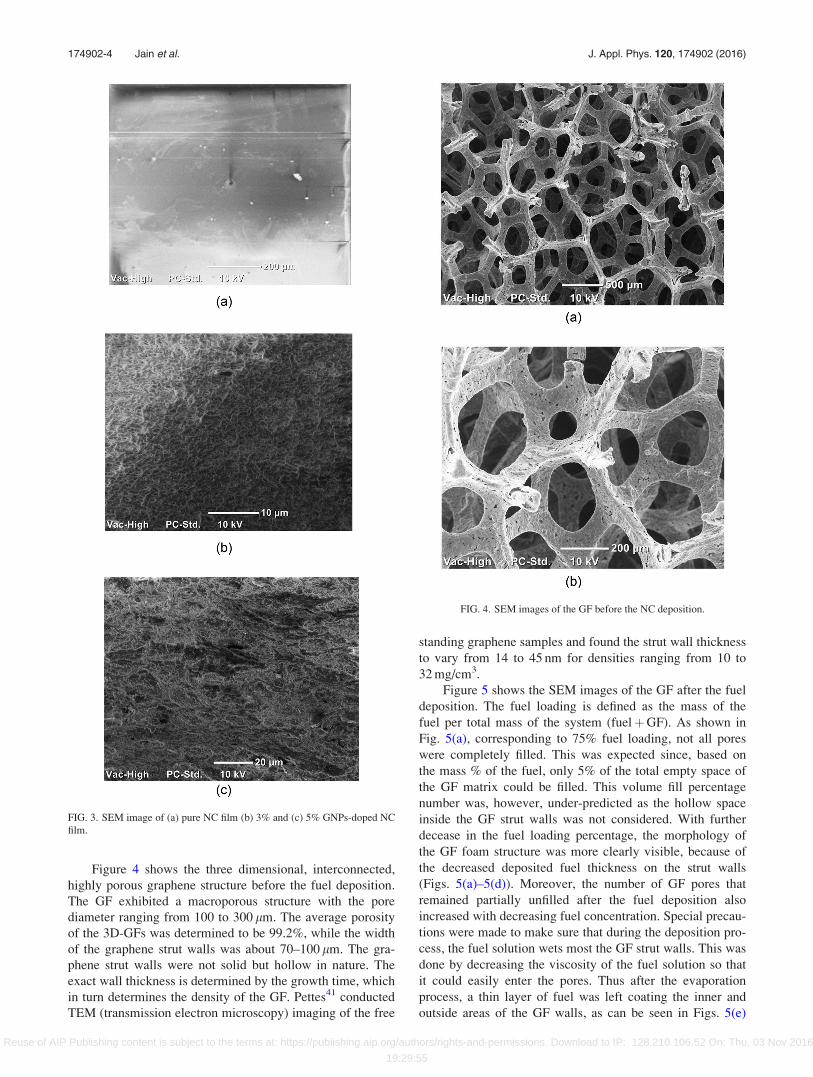
Figure 4 shows the three dimensional, interconnected,
highly porous graphene structure before the fuel deposition.
The GF exhibited a macroporous structure with the pore
diameter ranging from 100 to 300 lm. The average porosity
of the 3D-GFs was determined to be 99.2%, while the width
of the graphene strut walls was about 70–100 lm. The gra-
phene strut walls were not solid but hollow in nature. The
exact wall thickness is determined by the growth time, which
in turn determines the density of the GF. Pettes41 conducted
TEM (transmission electron microscopy) imaging of the free
standing graphene samples and found the strut wall thickness
to vary from 14 to 45 nm for densities ranging from 10 to
32 mg/cm3.
Figure 5 shows the SEM images of the GF after the fuel
deposition. The fuel loading is defined as the mass of the
fuel per total mass of the system (fuelþGF). As shown in
Fig. 5(a), corresponding to 75% fuel loading, not all pores
were completely filled. This was expected since, based on
the mass % of the fuel, only 5% of the total empty space of
the GF matrix could be filled. This volume fill percentage
number was, however, under-predicted as the hollow space
inside the GF strut walls was not considered. With further
decease in the fuel loading percentage, the morphology of
the GF foam structure was more clearly visible, because of
the decreased deposited fuel thickness on the strut walls
(Figs. 5(a)–5(d)). Moreover, the number of GF pores that
remained partially unfilled after the fuel deposition also
increased with decreasing fuel concentration. Special precau-
tions were made to make sure that during the deposition pro-
cess, the fuel solution wets most the GF strut walls. This was
done by decreasing the viscosity of the fuel solution so that
it could easily enter the pores. Thus after the evaporation
process, a thin layer of fuel was left coating the inner and
outside areas of the GF walls, as can be seen in Figs. 5(e)
FIG. 3. SEM image of (a) pure NC film (b) 3% and (c) 5% GNPs-doped NC
film.
FIG. 4. SEM images of the GF before the NC deposition.
174902-4 Jain et al. J. Appl. Phys. 120, 174902 (2016)
Reuse of AIP Publishing content is subject to the terms at: https://publishing.aip.org/authors/rights-and-permissions. Download to IP: 128.210.106.52 On: Thu, 03 Nov 2016
19:29:55
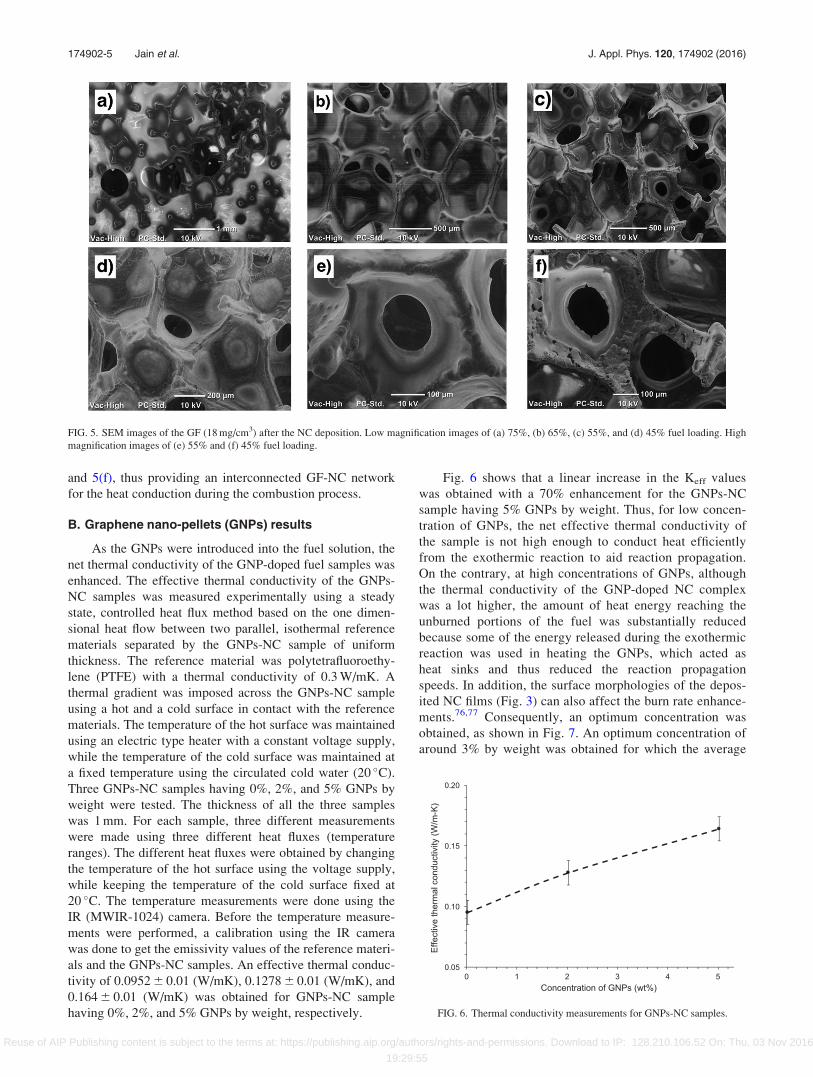
and 5(f), thus providing an interconnected GF-NC network
for the heat conduction during the combustion process.
B. Graphene nano-pellets (GNPs) results
As the GNPs were introduced into the fuel solution, the
net thermal conductivity of the GNP-doped fuel samples was
enhanced. The effective thermal conductivity of the GNPs-
NC samples was measured experimentally using a steady
state, controlled heat flux method based on the one dimen-
sional heat flow between two parallel, isothermal reference
materials separated by the GNPs-NC sample of uniform
thickness. The reference material was polytetrafluoroethy-
lene (PTFE) with a thermal conductivity of 0.3 W/mK. A
thermal gradient was imposed across the GNPs-NC sample
using a hot and a cold surface in contact with the reference
materials. The temperature of the hot surface was maintained
using an electric type heater with a constant voltage supply,
while the temperature of the cold surface was maintained at
a fixed temperature using the circulated cold water (20 �C).
Three GNPs-NC samples having 0%, 2%, and 5% GNPs by
weight were tested. The thickness of all the three samples
was 1 mm. For each sample, three different measurements
were made using three different heat fluxes (temperature
ranges). The different heat fluxes were obtained by changing
the temperature of the hot surface using the voltage supply,
while keeping the temperature of the cold surface fixed at
20 �C. The temperature measurements were done using the
IR (MWIR-1024) camera. Before the temperature measure-
ments were performed, a calibration using the IR camera
was done to get the emissivity values of the reference materi-
als and the GNPs-NC samples. An effective thermal conduc-
tivity of 0.0952 6 0.01 (W/mK), 0.1278 6 0.01 (W/mK), and
0.164 6 0.01 (W/mK) was obtained for GNPs-NC sample
having 0%, 2%, and 5% GNPs by weight, respectively.
Fig. 6 shows that a linear increase in the Keff values
was obtained with a 70% enhancement for the GNPs-NC
sample having 5% GNPs by weight. Thus, for low concen-
tration of GNPs, the net effective thermal conductivity of
the sample is not high enough to conduct heat efficiently
from the exothermic reaction to aid reaction propagation.
On the contrary, at high concentrations of GNPs, although
the thermal conductivity of the GNP-doped NC complex
was a lot higher, the amount of heat energy reaching the
unburned portions of the fuel was substantially reduced
because some of the energy released during the exothermic
reaction was used in heating the GNPs, which acted as
heat sinks and thus reduced the reaction propagation
speeds. In addition, the surface morphologies of the depos-
ited NC films (Fig. 3) can also affect the burn rate enhance-
ments.76,77 Consequently, an optimum concentration was
obtained, as shown in Fig. 7. An optimum concentration of
around 3% by weight was obtained for which the average
FIG. 5. SEM images of the GF (18 mg/cm3) after the NC deposition. Low magnification images of (a) 75%, (b) 65%, (c) 55%, and (d) 45% fuel loading. High
magnification images of (e) 55% and (f) 45% fuel loading.
FIG. 6. Thermal conductivity measurements for GNPs-NC samples.
174902-5 Jain et al. J. Appl. Phys. 120, 174902 (2016)
Reuse of AIP Publishing content is subject to the terms at: https://publishing.aip.org/authors/rights-and-permissions. Download to IP: 128.210.106.52 On: Thu, 03 Nov 2016
19:29:55
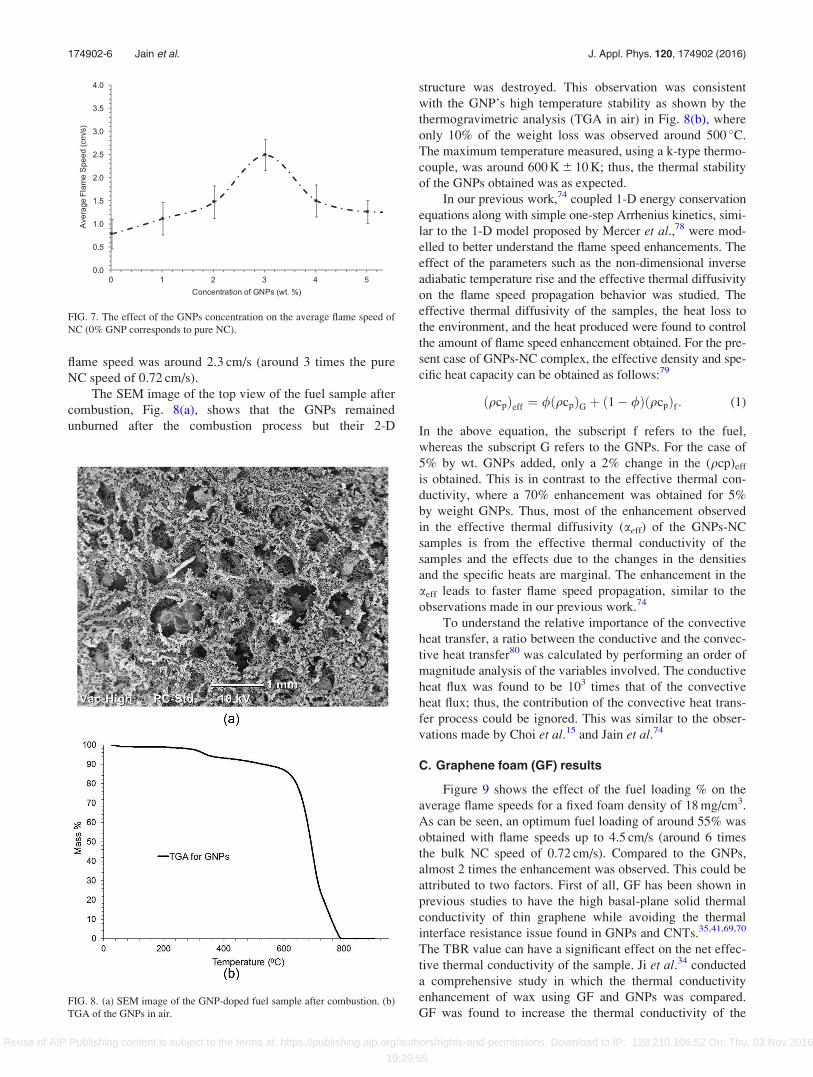
flame speed was around 2.3 cm/s (around 3 times the pure
NC speed of 0.72 cm/s).
The SEM image of the top view of the fuel sample after
combustion, Fig. 8(a), shows that the GNPs remained
unburned after the combustion process but their 2-D
structure was destroyed. This observation was consistent
with the GNP’s high temperature stability as shown by the
thermogravimetric analysis (TGA in air) in Fig. 8(b), where
only 10% of the weight loss was observed around 500 �C.
The maximum temperature measured, using a k-type thermo-
couple, was around 600 K 6 10 K; thus, the thermal stability
of the GNPs obtained was as expected.
In our previous work,74 coupled 1-D energy conservation
equations along with simple one-step Arrhenius kinetics, simi-
lar to the 1-D model proposed by Mercer et al.,78 were mod-
elled to better understand the flame speed enhancements. The
effect of the parameters such as the non-dimensional inverse
adiabatic temperature rise and the effective thermal diffusivity
on the flame speed propagation behavior was studied. The
effective thermal diffusivity of the samples, the heat loss to
the environment, and the heat produced were found to control
the amount of flame speed enhancement obtained. For the pre-
sent case of GNPs-NC complex, the effective density and spe-
cific heat capacity can be obtained as follows:79
ðqcpÞeff ¼ /ðqcpÞG þ ð1� /ÞðqcpÞf : (1)
In the above equation, the subscript f refers to the fuel,
whereas the subscript G refers to the GNPs. For the case of
5% by wt. GNPs added, only a 2% change in the (qcp)eff
is obtained. This is in contrast to the effective thermal con-
ductivity, where a 70% enhancement was obtained for 5%
by weight GNPs. Thus, most of the enhancement observed
in the effective thermal diffusivity (aeff) of the GNPs-NC
samples is from the effective thermal conductivity of the
samples and the effects due to the changes in the densities
and the specific heats are marginal. The enhancement in the
aeff leads to faster flame speed propagation, similar to the
observations made in our previous work.74
To understand the relative importance of the convective
heat transfer, a ratio between the conductive and the convec-
tive heat transfer80 was calculated by performing an order of
magnitude analysis of the variables involved. The conductive
heat flux was found to be 103 times that of the convective
heat flux; thus, the contribution of the convective heat trans-
fer process could be ignored. This was similar to the obser-
vations made by Choi et al.15 and Jain et al.74
C. Graphene foam (GF) results
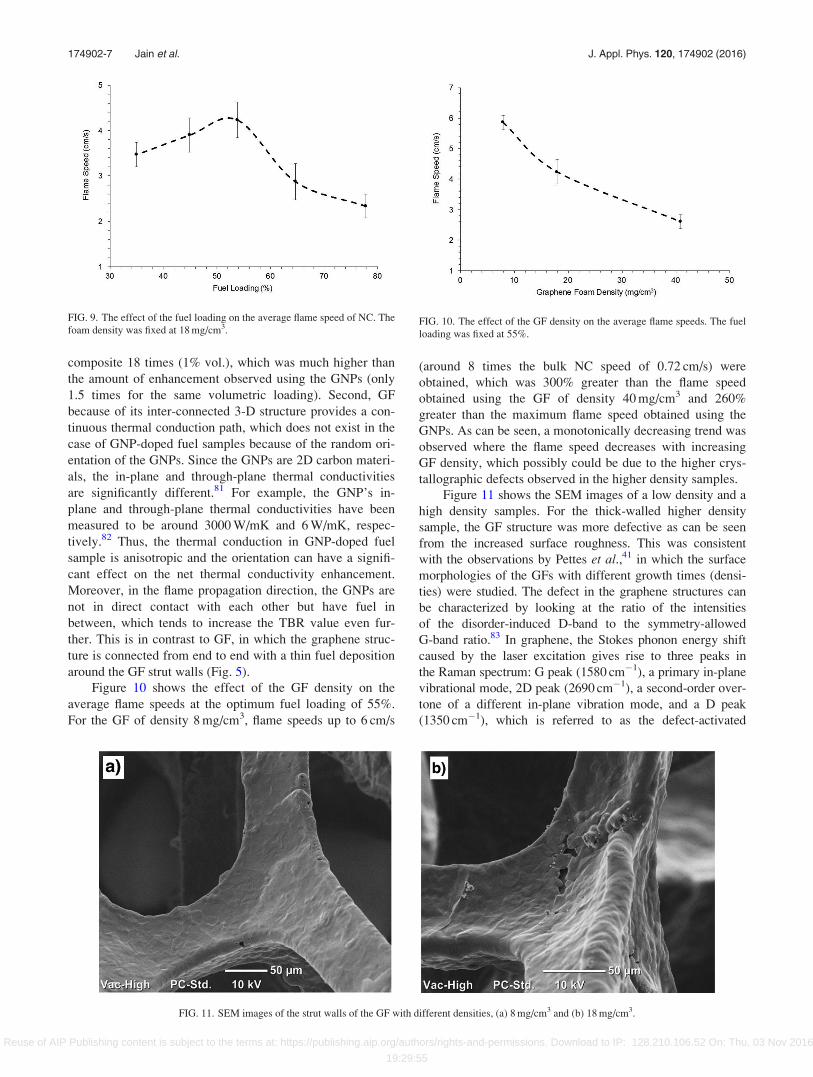
Figure 9 shows the effect of the fuel loading % on the
average flame speeds for a fixed foam density of 18 mg/cm3.
As can be seen, an optimum fuel loading of around 55% was
obtained with flame speeds up to 4.5 cm/s (around 6 times
the bulk NC speed of 0.72 cm/s). Compared to the GNPs,
almost 2 times the enhancement was observed. This could be
attributed to two factors. First of all, GF has been shown in
previous studies to have the high basal-plane solid thermal
conductivity of thin graphene while avoiding the thermal
interface resistance issue found in GNPs and CNTs.35,41,69,70
The TBR value can have a significant effect on the net effec-
tive thermal conductivity of the sample. Ji et al.34 conducted
a comprehensive study in which the thermal conductivity
enhancement of wax using GF and GNPs was compared.
GF was found to increase the thermal conductivity of the
FIG. 7. The effect of the GNPs concentration on the average flame speed of
NC (0% GNP corresponds to pure NC).
FIG. 8. (a) SEM image of the GNP-doped fuel sample after combustion. (b)
TGA of the GNPs in air.
174902-6 Jain et al. J. Appl. Phys. 120, 174902 (2016)
Reuse of AIP Publishing content is subject to the terms at: https://publishing.aip.org/authors/rights-and-permissions. Download to IP: 128.210.106.52 On: Thu, 03 Nov 2016
19:29:55
composite 18 times (1% vol.), which was much higher than
the amount of enhancement observed using the GNPs (only
1.5 times for the same volumetric loading). Second, GF
because of its inter-connected 3-D structure provides a con-
tinuous thermal conduction path, which does not exist in the
case of GNP-doped fuel samples because of the random ori-
entation of the GNPs. Since the GNPs are 2D carbon materi-
als, the in-plane and through-plane thermal conductivities
are significantly different.81 For example, the GNP’s in-
plane and through-plane thermal conductivities have been
measured to be around 3000 W/mK and 6 W/mK, respec-
tively.82 Thus, the thermal conduction in GNP-doped fuel
sample is anisotropic and the orientation can have a signifi-
cant effect on the net thermal conductivity enhancement.
Moreover, in the flame propagation direction, the GNPs are
not in direct contact with each other but have fuel in
between, which tends to increase the TBR value even fur-
ther. This is in contrast to GF, in which the graphene struc-
ture is connected from end to end with a thin fuel deposition
around the GF strut walls (Fig. 5).
Figure 10 shows the effect of the GF density on the
average flame speeds at the optimum fuel loading of 55%.
For the GF of density 8 mg/cm3, flame speeds up to 6 cm/s
(around 8 times the bulk NC speed of 0.72 cm/s) were
obtained, which was 300% greater than the flame speed
obtained using the GF of density 40 mg/cm3 and 260%
greater than the maximum flame speed obtained using the
GNPs. As can be seen, a monotonically decreasing trend was
observed where the flame speed decreases with increasing
GF density, which possibly could be due to the higher crys-
tallographic defects observed in the higher density samples.
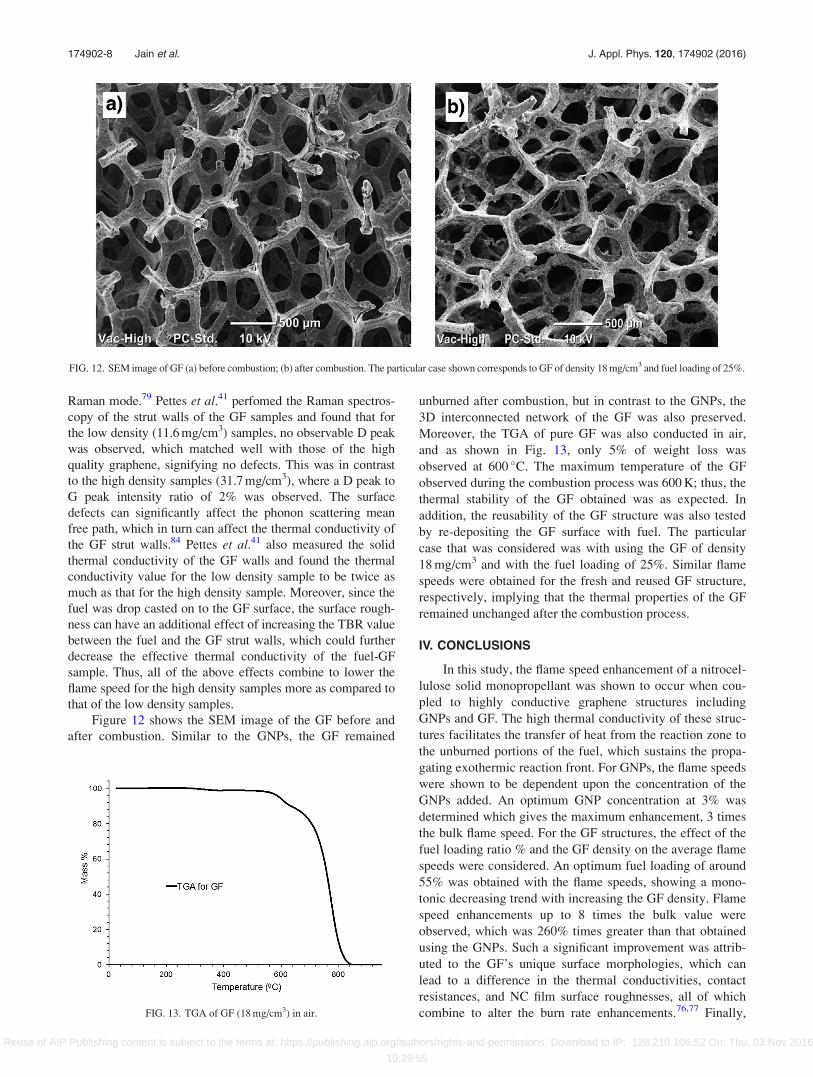
Figure 11 shows the SEM images of a low density and a
high density samples. For the thick-walled higher density
sample, the GF structure was more defective as can be seen
from the increased surface roughness. This was consistent
with the observations by Pettes et al.,41 in which the surface
morphologies of the GFs with different growth times (densi-
ties) were studied. The defect in the graphene structures can
be characterized by looking at the ratio of the intensities
of the disorder-induced D-band to the symmetry-allowed
G-band ratio.83 In graphene, the Stokes phonon energy shift
caused by the laser excitation gives rise to three peaks in
the Raman spectrum: G peak (1580 cm�1), a primary in-plane
vibrational mode, 2D peak (2690 cm�1), a second-order over-
tone of a different in-plane vibration mode, and a D peak
(1350 cm�1), which is referred to as the defect-activated
FIG. 9. The effect of the fuel loading on the average flame speed of NC. The
foam density was fixed at 18 mg/cm3.FIG. 10. The effect of the GF density on the average flame speeds. The fuel
loading was fixed at 55%.
FIG. 11. SEM images of the strut walls of the GF with different densities, (a) 8 mg/cm3 and (b) 18 mg/cm3.
174902-7 Jain et al. J. Appl. Phys. 120, 174902 (2016)
Reuse of AIP Publishing content is subject to the terms at: https://publishing.aip.org/authors/rights-and-permissions. Download to IP: 128.210.106.52 On: Thu, 03 Nov 2016
19:29:55
Raman mode.79 Pettes et al.41 perfomed the Raman spectros-
copy of the strut walls of the GF samples and found that for
the low density (11.6 mg/cm3) samples, no observable D peak
was observed, which matched well with those of the high
quality graphene, signifying no defects. This was in contrast
to the high density samples (31.7 mg/cm3), where a D peak to
G peak intensity ratio of 2% was observed. The surface
defects can significantly affect the phonon scattering mean
free path, which in turn can affect the thermal conductivity of
the GF strut walls.84 Pettes et al.41 also measured the solid
thermal conductivity of the GF walls and found the thermal
conductivity value for the low density sample to be twice as
much as that for the high density sample. Moreover, since the
fuel was drop casted on to the GF surface, the surface rough-
ness can have an additional effect of increasing the TBR value
between the fuel and the GF strut walls, which could further
decrease the effective thermal conductivity of the fuel-GF
sample. Thus, all of the above effects combine to lower the
flame speed for the high density samples more as compared to
that of the low density samples.
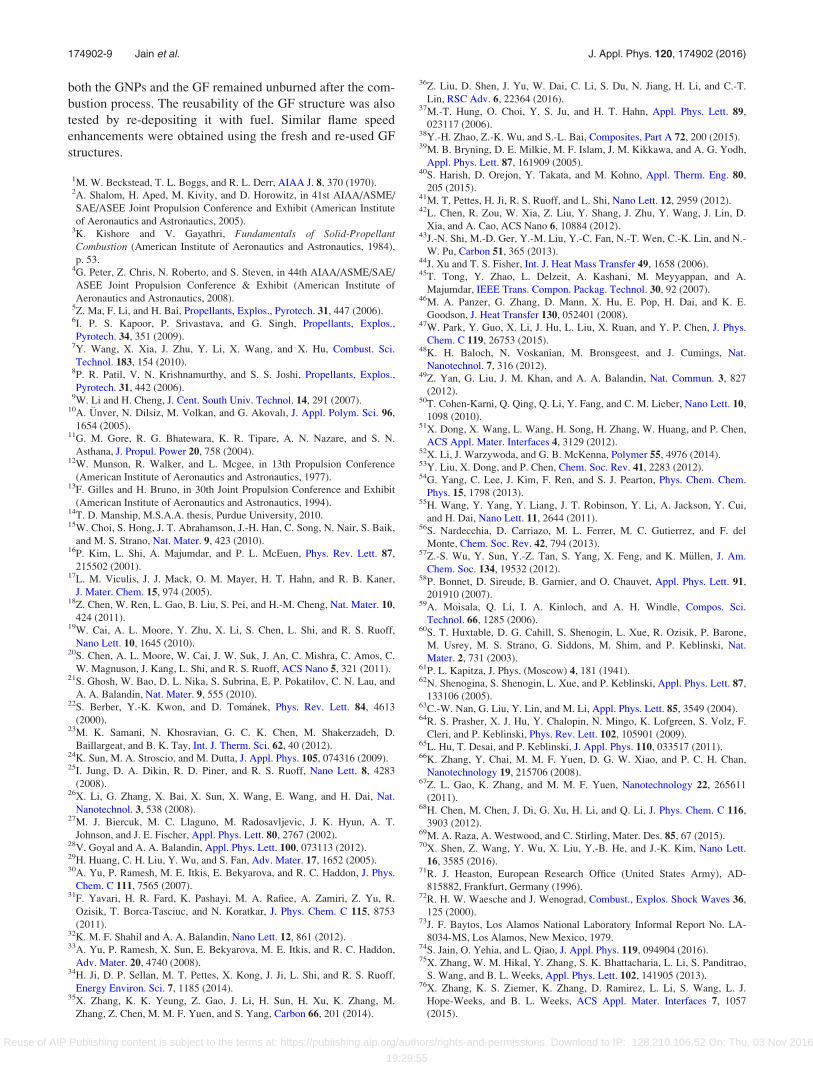
Figure 12 shows the SEM image of the GF before and
after combustion. Similar to the GNPs, the GF remained
unburned after combustion, but in contrast to the GNPs, the
3D interconnected network of the GF was also preserved.
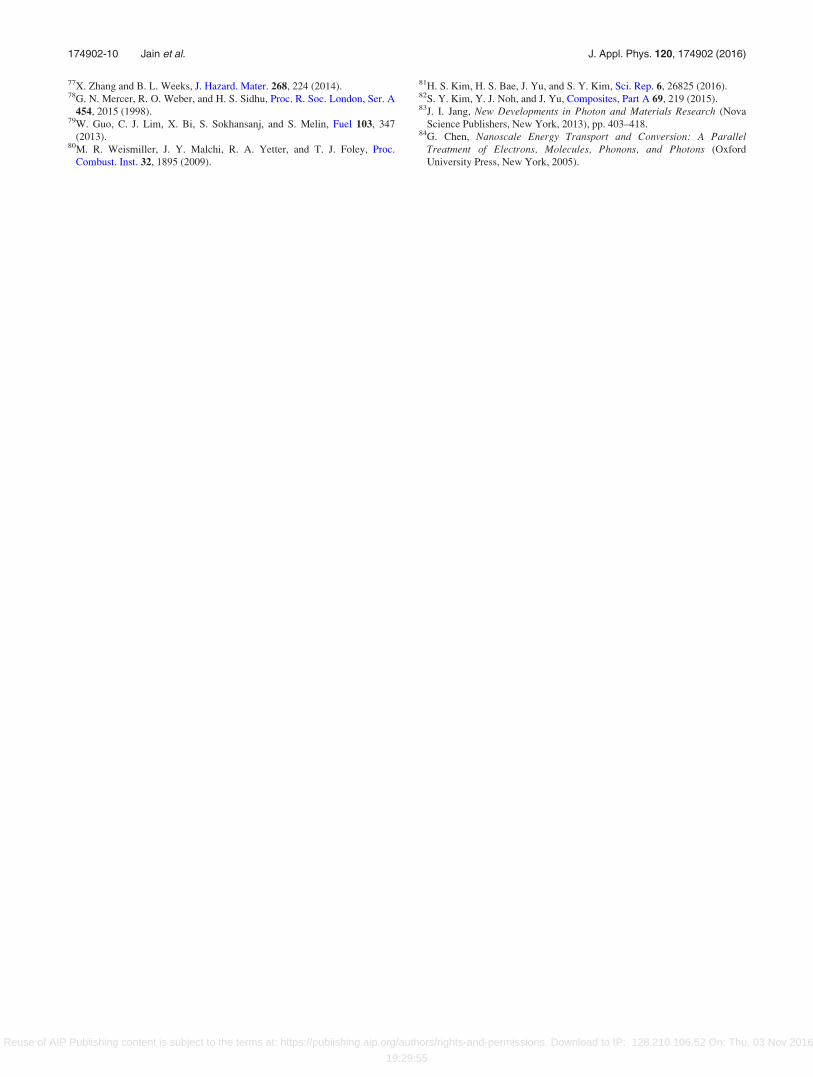
Moreover, the TGA of pure GF was also conducted in air,
and as shown in Fig. 13, only 5% of weight loss was
observed at 600 �C. The maximum temperature of the GF
observed during the combustion process was 600 K; thus, the
thermal stability of the GF obtained was as expected. In
addition, the reusability of the GF structure was also tested
by re-depositing the GF surface with fuel. The particular
case that was considered was with using the GF of density
18 mg/cm3 and with the fuel loading of 25%. Similar flame
speeds were obtained for the fresh and reused GF structure,
respectively, implying that the thermal properties of the GF
remained unchanged after the combustion process.
IV. CONCLUSIONS
In this study, the flame speed enhancement of a nitrocel-
lulose solid monopropellant was shown to occur when cou-
pled to highly conductive graphene structures including
GNPs and GF. The high thermal conductivity of these struc-
tures facilitates the transfer of heat from the reaction zone to
the unburned portions of the fuel, which sustains the propa-
gating exothermic reaction front. For GNPs, the flame speeds
were shown to be dependent upon the concentration of the
GNPs added. An optimum GNP concentration at 3% was
determined which gives the maximum enhancement, 3 times
the bulk flame speed. For the GF structures, the effect of the
fuel loading ratio % and the GF density on the average flame
speeds were considered. An optimum fuel loading of around
55% was obtained with the flame speeds, showing a mono-
tonic decreasing trend with increasing the GF density. Flame
speed enhancements up to 8 times the bulk value were
observed, which was 260% times greater than that obtained
using the GNPs. Such a significant improvement was attrib-
uted to the GF’s unique surface morphologies, which can
lead to a difference in the thermal conductivities, contact
resistances, and NC film surface roughnesses, all of which
combine to alter the burn rate enhancements.76,77 Finally,
FIG. 12. SEM image of GF (a) before combustion; (b) after combustion. The particular case shown corresponds to GF of density 18 mg/cm3 and fuel loading of 25%.
FIG. 13. TGA of GF (18 mg/cm3) in air.
174902-8 Jain et al. J. Appl. Phys. 120, 174902 (2016)
Reuse of AIP Publishing content is subject to the terms at: https://publishing.aip.org/authors/rights-and-permissions. Download to IP: 128.210.106.52 On: Thu, 03 Nov 2016
19:29:55
both the GNPs and the GF remained unburned after the com-
bustion process. The reusability of the GF structure was also
tested by re-depositing it with fuel. Similar flame speed
enhancements were obtained using the fresh and re-used GF
structures.
1M. W. Beckstead, T. L. Boggs, and R. L. Derr, AIAA J. 8, 370 (1970).2A. Shalom, H. Aped, M. Kivity, and D. Horowitz, in 41st AIAA/ASME/
SAE/ASEE Joint Propulsion Conference and Exhibit (American Institute
of Aeronautics and Astronautics, 2005).3K. Kishore and V. Gayathri, Fundamentals of Solid-PropellantCombustion (American Institute of Aeronautics and Astronautics, 1984),
p. 53.4G. Peter, Z. Chris, N. Roberto, and S. Steven, in 44th AIAA/ASME/SAE/
ASEE Joint Propulsion Conference & Exhibit (American Institute of
Aeronautics and Astronautics, 2008).5Z. Ma, F. Li, and H. Bai, Propellants, Explos., Pyrotech. 31, 447 (2006).6I. P. S. Kapoor, P. Srivastava, and G. Singh, Propellants, Explos.,
Pyrotech. 34, 351 (2009).7Y. Wang, X. Xia, J. Zhu, Y. Li, X. Wang, and X. Hu, Combust. Sci.
Technol. 183, 154 (2010).8P. R. Patil, V. N. Krishnamurthy, and S. S. Joshi, Propellants, Explos.,
Pyrotech. 31, 442 (2006).9W. Li and H. Cheng, J. Cent. South Univ. Technol. 14, 291 (2007).
10A. €Unver, N. Dilsiz, M. Volkan, and G. Akovalı, J. Appl. Polym. Sci. 96,
1654 (2005).11G. M. Gore, R. G. Bhatewara, K. R. Tipare, A. N. Nazare, and S. N.
Asthana, J. Propul. Power 20, 758 (2004).12W. Munson, R. Walker, and L. Mcgee, in 13th Propulsion Conference
(American Institute of Aeronautics and Astronautics, 1977).13F. Gilles and H. Bruno, in 30th Joint Propulsion Conference and Exhibit
(American Institute of Aeronautics and Astronautics, 1994).14T. D. Manship, M.S.A.A. thesis, Purdue University, 2010.15W. Choi, S. Hong, J. T. Abrahamson, J.-H. Han, C. Song, N. Nair, S. Baik,
and M. S. Strano, Nat. Mater. 9, 423 (2010).16P. Kim, L. Shi, A. Majumdar, and P. L. McEuen, Phys. Rev. Lett. 87,
215502 (2001).17L. M. Viculis, J. J. Mack, O. M. Mayer, H. T. Hahn, and R. B. Kaner,
J. Mater. Chem. 15, 974 (2005).18Z. Chen, W. Ren, L. Gao, B. Liu, S. Pei, and H.-M. Cheng, Nat. Mater. 10,
424 (2011).19W. Cai, A. L. Moore, Y. Zhu, X. Li, S. Chen, L. Shi, and R. S. Ruoff,
Nano Lett. 10, 1645 (2010).20S. Chen, A. L. Moore, W. Cai, J. W. Suk, J. An, C. Mishra, C. Amos, C.
W. Magnuson, J. Kang, L. Shi, and R. S. Ruoff, ACS Nano 5, 321 (2011).21S. Ghosh, W. Bao, D. L. Nika, S. Subrina, E. P. Pokatilov, C. N. Lau, and
A. A. Balandin, Nat. Mater. 9, 555 (2010).22S. Berber, Y.-K. Kwon, and D. Tom�anek, Phys. Rev. Lett. 84, 4613
(2000).23M. K. Samani, N. Khosravian, G. C. K. Chen, M. Shakerzadeh, D.
Baillargeat, and B. K. Tay, Int. J. Therm. Sci. 62, 40 (2012).24K. Sun, M. A. Stroscio, and M. Dutta, J. Appl. Phys. 105, 074316 (2009).25I. Jung, D. A. Dikin, R. D. Piner, and R. S. Ruoff, Nano Lett. 8, 4283
(2008).26X. Li, G. Zhang, X. Bai, X. Sun, X. Wang, E. Wang, and H. Dai, Nat.
Nanotechnol. 3, 538 (2008).27M. J. Biercuk, M. C. Llaguno, M. Radosavljevic, J. K. Hyun, A. T.
Johnson, and J. E. Fischer, Appl. Phys. Lett. 80, 2767 (2002).28V. Goyal and A. A. Balandin, Appl. Phys. Lett. 100, 073113 (2012).29H. Huang, C. H. Liu, Y. Wu, and S. Fan, Adv. Mater. 17, 1652 (2005).30A. Yu, P. Ramesh, M. E. Itkis, E. Bekyarova, and R. C. Haddon, J. Phys.
Chem. C 111, 7565 (2007).31F. Yavari, H. R. Fard, K. Pashayi, M. A. Rafiee, A. Zamiri, Z. Yu, R.
Ozisik, T. Borca-Tasciuc, and N. Koratkar, J. Phys. Chem. C 115, 8753
(2011).32K. M. F. Shahil and A. A. Balandin, Nano Lett. 12, 861 (2012).33A. Yu, P. Ramesh, X. Sun, E. Bekyarova, M. E. Itkis, and R. C. Haddon,
Adv. Mater. 20, 4740 (2008).34H. Ji, D. P. Sellan, M. T. Pettes, X. Kong, J. Ji, L. Shi, and R. S. Ruoff,
Energy Environ. Sci. 7, 1185 (2014).35X. Zhang, K. K. Yeung, Z. Gao, J. Li, H. Sun, H. Xu, K. Zhang, M.
Zhang, Z. Chen, M. M. F. Yuen, and S. Yang, Carbon 66, 201 (2014).
36Z. Liu, D. Shen, J. Yu, W. Dai, C. Li, S. Du, N. Jiang, H. Li, and C.-T.
Lin, RSC Adv. 6, 22364 (2016).37M.-T. Hung, O. Choi, Y. S. Ju, and H. T. Hahn, Appl. Phys. Lett. 89,
023117 (2006).38Y.-H. Zhao, Z.-K. Wu, and S.-L. Bai, Composites, Part A 72, 200 (2015).39M. B. Bryning, D. E. Milkie, M. F. Islam, J. M. Kikkawa, and A. G. Yodh,
Appl. Phys. Lett. 87, 161909 (2005).40S. Harish, D. Orejon, Y. Takata, and M. Kohno, Appl. Therm. Eng. 80,
205 (2015).41M. T. Pettes, H. Ji, R. S. Ruoff, and L. Shi, Nano Lett. 12, 2959 (2012).42L. Chen, R. Zou, W. Xia, Z. Liu, Y. Shang, J. Zhu, Y. Wang, J. Lin, D.
Xia, and A. Cao, ACS Nano 6, 10884 (2012).43J.-N. Shi, M.-D. Ger, Y.-M. Liu, Y.-C. Fan, N.-T. Wen, C.-K. Lin, and N.-
W. Pu, Carbon 51, 365 (2013).44J. Xu and T. S. Fisher, Int. J. Heat Mass Transfer 49, 1658 (2006).45T. Tong, Y. Zhao, L. Delzeit, A. Kashani, M. Meyyappan, and A.
Majumdar, IEEE Trans. Compon. Packag. Technol. 30, 92 (2007).46M. A. Panzer, G. Zhang, D. Mann, X. Hu, E. Pop, H. Dai, and K. E.
Goodson, J. Heat Transfer 130, 052401 (2008).47W. Park, Y. Guo, X. Li, J. Hu, L. Liu, X. Ruan, and Y. P. Chen, J. Phys.
Chem. C 119, 26753 (2015).48K. H. Baloch, N. Voskanian, M. Bronsgeest, and J. Cumings, Nat.
Nanotechnol. 7, 316 (2012).49Z. Yan, G. Liu, J. M. Khan, and A. A. Balandin, Nat. Commun. 3, 827
(2012).50T. Cohen-Karni, Q. Qing, Q. Li, Y. Fang, and C. M. Lieber, Nano Lett. 10,
1098 (2010).51X. Dong, X. Wang, L. Wang, H. Song, H. Zhang, W. Huang, and P. Chen,
ACS Appl. Mater. Interfaces 4, 3129 (2012).52X. Li, J. Warzywoda, and G. B. McKenna, Polymer 55, 4976 (2014).53Y. Liu, X. Dong, and P. Chen, Chem. Soc. Rev. 41, 2283 (2012).54G. Yang, C. Lee, J. Kim, F. Ren, and S. J. Pearton, Phys. Chem. Chem.
Phys. 15, 1798 (2013).55H. Wang, Y. Yang, Y. Liang, J. T. Robinson, Y. Li, A. Jackson, Y. Cui,
and H. Dai, Nano Lett. 11, 2644 (2011).56S. Nardecchia, D. Carriazo, M. L. Ferrer, M. C. Gutierrez, and F. del
Monte, Chem. Soc. Rev. 42, 794 (2013).57Z.-S. Wu, Y. Sun, Y.-Z. Tan, S. Yang, X. Feng, and K. M€ullen, J. Am.
Chem. Soc. 134, 19532 (2012).58P. Bonnet, D. Sireude, B. Garnier, and O. Chauvet, Appl. Phys. Lett. 91,
201910 (2007).59A. Moisala, Q. Li, I. A. Kinloch, and A. H. Windle, Compos. Sci.
Technol. 66, 1285 (2006).60S. T. Huxtable, D. G. Cahill, S. Shenogin, L. Xue, R. Ozisik, P. Barone,
M. Usrey, M. S. Strano, G. Siddons, M. Shim, and P. Keblinski, Nat.
Mater. 2, 731 (2003).61P. L. Kapitza, J. Phys. (Moscow) 4, 181 (1941).62N. Shenogina, S. Shenogin, L. Xue, and P. Keblinski, Appl. Phys. Lett. 87,
133106 (2005).63C.-W. Nan, G. Liu, Y. Lin, and M. Li, Appl. Phys. Lett. 85, 3549 (2004).64R. S. Prasher, X. J. Hu, Y. Chalopin, N. Mingo, K. Lofgreen, S. Volz, F.
Cleri, and P. Keblinski, Phys. Rev. Lett. 102, 105901 (2009).65L. Hu, T. Desai, and P. Keblinski, J. Appl. Phys. 110, 033517 (2011).66K. Zhang, Y. Chai, M. M. F. Yuen, D. G. W. Xiao, and P. C. H. Chan,
Nanotechnology 19, 215706 (2008).67Z. L. Gao, K. Zhang, and M. M. F. Yuen, Nanotechnology 22, 265611
(2011).68H. Chen, M. Chen, J. Di, G. Xu, H. Li, and Q. Li, J. Phys. Chem. C 116,
3903 (2012).69M. A. Raza, A. Westwood, and C. Stirling, Mater. Des. 85, 67 (2015).70X. Shen, Z. Wang, Y. Wu, X. Liu, Y.-B. He, and J.-K. Kim, Nano Lett.
16, 3585 (2016).71R. J. Heaston, European Research Office (United States Army), AD-
815882, Frankfurt, Germany (1996).72R. H. W. Waesche and J. Wenograd, Combust., Explos. Shock Waves 36,
125 (2000).73J. F. Baytos, Los Alamos National Laboratory Informal Report No. LA-
8034-MS, Los Alamos, New Mexico, 1979.74S. Jain, O. Yehia, and L. Qiao, J. Appl. Phys. 119, 094904 (2016).75X. Zhang, W. M. Hikal, Y. Zhang, S. K. Bhattacharia, L. Li, S. Panditrao,
S. Wang, and B. L. Weeks, Appl. Phys. Lett. 102, 141905 (2013).76X. Zhang, K. S. Ziemer, K. Zhang, D. Ramirez, L. Li, S. Wang, L. J.
Hope-Weeks, and B. L. Weeks, ACS Appl. Mater. Interfaces 7, 1057
(2015).
174902-9 Jain et al. J. Appl. Phys. 120, 174902 (2016)
Reuse of AIP Publishing content is subject to the terms at: https://publishing.aip.org/authors/rights-and-permissions. Download to IP: 128.210.106.52 On: Thu, 03 Nov 2016
19:29:55
77X. Zhang and B. L. Weeks, J. Hazard. Mater. 268, 224 (2014).78G. N. Mercer, R. O. Weber, and H. S. Sidhu, Proc. R. Soc. London, Ser. A
454, 2015 (1998).79W. Guo, C. J. Lim, X. Bi, S. Sokhansanj, and S. Melin, Fuel 103, 347
(2013).80M. R. Weismiller, J. Y. Malchi, R. A. Yetter, and T. J. Foley, Proc.
Combust. Inst. 32, 1895 (2009).
81H. S. Kim, H. S. Bae, J. Yu, and S. Y. Kim, Sci. Rep. 6, 26825 (2016).82S. Y. Kim, Y. J. Noh, and J. Yu, Composites, Part A 69, 219 (2015).83J. I. Jang, New Developments in Photon and Materials Research (Nova
Science Publishers, New York, 2013), pp. 403–418.84G. Chen, Nanoscale Energy Transport and Conversion: A Parallel
Treatment of Electrons, Molecules, Phonons, and Photons (Oxford
University Press, New York, 2005).
174902-10 Jain et al. J. Appl. Phys. 120, 174902 (2016)
Reuse of AIP Publishing content is subject to the terms at: https://publishing.aip.org/authors/rights-and-permissions. Download to IP: 128.210.106.52 On: Thu, 03 Nov 2016
19:29:55