Embed Size (px)
Citation preview

© 2014 The Vanguard Group, Inc. All rights reserved. Vanguard Marketing Corporation, Distributor.
FISBROCS 102014
Connect with Vanguard® > institutional.vanguard.com > 800-310-8876
Vanguard Institutional Investor Group
P.O. Box 2900Valley Forge, PA 19482-2900
For more information about Vanguard funds, visit institutional.vanguard.com or call 800-523-1036 to obtain a prospectus. Investment objectives, risks, charges, expenses, and other important information about a fund are contained in the prospectus; read and consider it carefully before investing.
All investing is subject to risk, including the possible loss of the money you invest.
Bond funds are subject to interest rate risk, which is the chance bond prices overall will decline because of rising interest rates, and credit risk, which is the chance a bond issuer will fail to pay interest and principal in a timely manner or that negative perceptions of the issuer’s ability to make such payments will cause the price of that bond to decline.
U.S. government backing of Treasury or agency securities applies only to the underlying securities and does not prevent share-price fluctuations. Unlike stocks and bonds, U.S. Treasury bills are guaranteed as to the timely payment of principal and interest.
The Long-Term Investment-Grade Fund is subject to currency hedging risk, which is the chance that currency hedging transactions may not perfectly offset the fund’s foreign currency exposures and may eliminate any chance for a fund to benefit from favorable fluctuations in those currencies. The fund will incur expenses to hedge its currency exposures.
The Extended Duration Treasury Index Fund is subject to interest rate risk and credit risk. Interest rate risk is the chance that bond prices overall will decline because of rising interest rates. Interest rate risk is expected to be extremely high for the fund because it invests mainly in zero coupon long-term bonds, which have prices that are very sensitive to interest rate changes. Because the fund invests mainly in Treasury STRIPS with maturities ranging from 20 to 30 years, rising interest rates may cause the value of the fund’s investments to decline significantly.
Duration is a measure of the sensitivity of the price (the value of principal) of a fixed income investment to a change in interest rates. Duration is expressed as a number of years.
Diversification does not ensure a profit or protect against a loss.
About the Vanguard Capital Markets Model ®
IMPORTANT: The projections or other information generated by the Vanguard Capital Markets Model (VCMM) regarding
the likelihood of various investment outcomes are hypothetical in nature, do not reflect actual investment results, and are not guarantees of future results. VCMM results will vary with each use and over time.
The VCMM projections are based on a statistical analysis of historical data. Future returns may behave differently from the historical patterns captured in the VCMM. More important, the VCMM may be underestimating extreme negative scenarios unobserved in the historical period on which the model estimation is based.
The Vanguard Capital Markets Model is a proprietary financial simulation tool developed and maintained by Vanguard’s primary investment research and advice teams. The model forecasts distributions of future returns for a wide array of broad asset classes. Those asset classes include U.S. and international equity markets, several maturities of the U.S. Treasury and corporate fixed income markets, international fixed income markets, U.S. money markets, commodities, and certain alternative investment strategies. The theoretical and empirical foundation for the Vanguard Capital Markets Model is that the returns of various asset classes reflect the compensation investors require for bearing different types of systematic risk (beta). At the core of the model are estimates of the dynamic statistical relationship between risk factors and asset returns, obtained from statistical analysis based on available monthly financial and economic data from as early as 1960. Using a system of estimated equations, the model then applies a Monte Carlo simulation method to project the estimated interrelationships among risk factors and asset classes as well as uncertainty and randomness over time. The model generates a large set of simulated outcomes for each asset class over several time horizons. Forecasts are obtained by computing measures of central tendency in these simulations. Results produced by the tool will vary with each use and over time.
The VCMM projections are based on a statistical analysis of historical data. Future returns may behave differently from the historical patterns captured in the VCMM. More important, the VCMM may be underestimating extreme negative scenarios unobserved in the historical period on which the model estimation is based.
Note: LDI, or liability-driven investing, is a form of investing in which investment risk is measured by the performance of assets relative to a liability, such as that of a defined benefit plan.
For institutional use only. Not for distribution to retail investors.
Fixed income for defined benefit plan investingSophisticated products and approach, straightforward execution
A scrupulous attention to the details of successful LDI investing
Whether DB investors achieve their plan’s investment goals depends upon a lot—starting with determining the most effective strategy, then selecting the most efficient investments to implement it all along the path to full funding.
At Vanguard, these investors can depend on our investment-strategy professionals and those who manage our fixed income investments. A combination of their experience, Vanguard research, expertise, and sophisticated investment models helps ensure the integrity of the investments and the value they bring to clients’ LDI strategies. The most critical elements are highlighted below.
Customized liability-driven strategies. Vanguard partners with DB plan sponsors and their investment teams to hone in on a path with a high probability of improving their plans’ funded status while reducing risk.
Constant, robust risk management. Our risk management team of quantitative researchers, data analysts, and portfolio analysts applies sophisticated tools and deep experience to control risk in our active and indexed fixed income investments. By choice, the team is a stand-alone group, reporting to Vanguard’s chief investment officer. This segregation preserves the integrity of a rigid checks-and-balance system.
Vigilant credit-risk research. Vanguard’s credit analysts combine proprietary research tools and their deep experience to help protect against credits that could go bad. This helps provide the results intrinsic to and expected from a successful LDI strategy. Their efforts have resulted in a consistent track record of success in reducing volatility by helping to shield DB investors from downside risk.
Disciplined duration policies. LDI strategies—and the fixed income investments used to implement them—focus on achieving a tight match to the duration of a DB plan’s liabilities. Simply put, sponsors don’t want duration to be off, because it’s key to any successful LDI strategy. DB investors with Vanguard benefit from constant oversight that has led to distinct yield-curve positioning for Vanguard’s short-, intermediate-, and long-term funds.
Tight benchmark tracking. Because funding volatility is a big concern for DB investors, Vanguard’s sophisticated tools and risk-management techniques closely track two important benchmarks that gauge the success of DB investing:
• Investment-fund tracking error relative to the fund’s benchmark.
• DB assets-to-liabilities tracking error that helps determine how well plan assets are hedging plan liabilities and reducing risk for plan sponsors.
Performance. DB investors have benefited from Vanguard bond fund portfolios that have consistently outperformed their respective peers over one-, three-, five-, and ten-year periods.2
Lower costs. Vanguard is one of the largest investment managers in the world. This means we can leverage our size—along with our experience and ownership structure—to keep costs down.
A unique ownership structure. Unlike most investment firms that are either publicly traded or privately owned, Vanguard is owned by the Vanguard funds, which, in turn, are owned by their shareholders. There are no private interests or stockholders, no conflicting loyalties. Revenues are shared with our client owners by reducing fees or improving how we serve them.
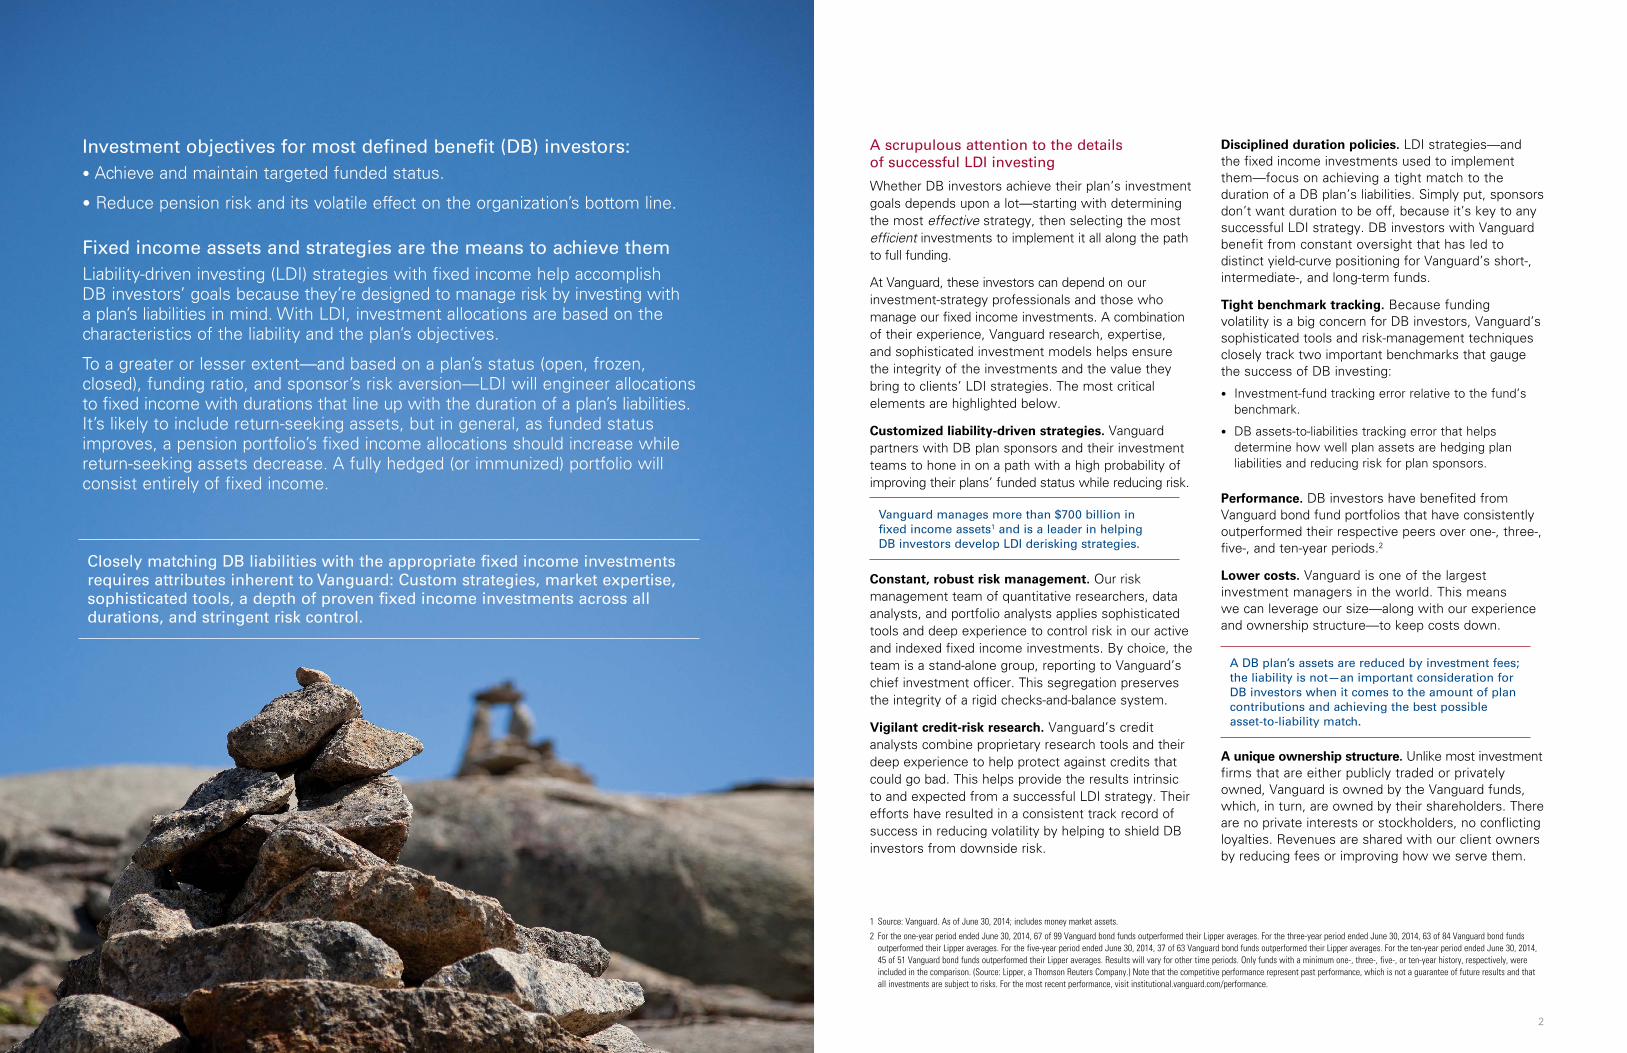
Investment objectives for most defined benefit (DB) investors:• Achieve and maintain targeted funded status.
• Reduce pension risk and its volatile effect on the organization’s bottom line.
Fixed income assets and strategies are the means to achieve themLiability-driven investing (LDI) strategies with fixed income help accomplish DB investors’ goals because they’re designed to manage risk by investing with a plan’s liabilities in mind. With LDI, investment allocations are based on the characteristics of the liability and the plan’s objectives.
To a greater or lesser extent—and based on a plan’s status (open, frozen, closed), funding ratio, and sponsor’s risk aversion—LDI will engineer allocations to fixed income with durations that line up with the duration of a plan’s liabilities.It’s likely to include return-seeking assets, but in general, as funded status improves, a pension portfolio’s fixed income allocations should increase while return-seeking assets decrease. A fully hedged (or immunized) portfolio will consist entirely of fixed income.
1 Source: Vanguard. As of June 30, 2014; includes money market assets.
2 For the one-year period ended June 30, 2014, 67 of 99 Vanguard bond funds outperformed their Lipper averages. For the three-year period ended June 30, 2014, 63 of 84 Vanguard bond funds outperformed their Lipper averages. For the five-year period ended June 30, 2014, 37 of 63 Vanguard bond funds outperformed their Lipper averages. For the ten-year period ended June 30, 2014, 45 of 51 Vanguard bond funds outperformed their Lipper averages. Results will vary for other time periods. Only funds with a minimum one-, three-, five-, or ten-year history, respectively, were included in the comparison. (Source: Lipper, a Thomson Reuters Company.) Note that the competitive performance represent past performance, which is not a guarantee of future results and that all investments are subject to risks. For the most recent performance, visit institutional.vanguard.com/performance.
2
A DB plan’s assets are reduced by investment fees; the liability is not—an important consideration for DB investors when it comes to the amount of plan contributions and achieving the best possible asset-to-liability match.
Vanguard manages more than $700 billion in fixed income assets1 and is a leader in helping DB investors develop LDI derisking strategies.
Closely matching DB liabilities with the appropriate fixed income investments requires attributes inherent to Vanguard: Custom strategies, market expertise, sophisticated tools, a depth of proven fixed income investments across all durations, and stringent risk control.

43
3 As of June 30, 2014.
4 Source: Vanguard. As of June 30, 2014; includes money market assets.
5 Source: Vanguard. As of June 30, 2014.
IMPORTANT: The projections or other information generated by Vanguard Capital Markets Model (VCMM) regarding the likelihood of various investment outcomes are hypothetical in nature, do not reflect actual investment results, and are not guarantees of future results. See “Important information” on back cover for more about VCMM.
Vanguard fixed income: Accommodating derisking strategies all along the glide path to full funding
The breadth of Vanguard fixed income funds can accommodate changes in asset allocation that are triggered all along a glide path, as illustrated in this sample glide path for a frozen plan. As the funded status for this sample plan rises from less than 80% to an appropriate funding target of 105%, the asset allocation moves from 60% equities to 100% fixed income when the target is reached.
Ass
et a
lloca
tio
n
Total Stock Market Index Institutional Shares
Total International Stock Index Institutional Shares
Extended Duration Treasury Index Institutional Shares
Long-Term Bond Index Institutional Shares
Long-Term Investment-Grade Admiral Shares
0
20
40
60
80
100%
Funded status trigger
<80% 80% 85% 90% 100% 105%95%
Vanguard fund:
Source: Vanguard, Fundamentals of liability-driven investing Stockton, 2014.
Benefit from the expertise of an industry leader
DB investors can turn to Vanguard for answers about their portfolios and broader issues that affect derisking decision-making.
World-class portfolio management: Vanguard Fixed Income Group
• More than 100 investment professionals, including portfolio managers, traders, analysts, researchers, and support staff3.
• A senior management team—the overwhelming majority of members have more than two decades of fixed income experience, most of it with Vanguard.
• The investment talent of Wellington Management Company, LLP. Among the nation’s most respected institutional investment and LDI managers, it serves as subadvisor for certain Vanguard actively managed fixed income assets, including Vanguard Long-Term Investment-Grade Fund—one of the key components of strategies designed to match liabilities.
• Active fixed income assets under management: More than $375 billion.4
• Indexed fixed income assets under management: More than $325 billion.5
Sophisticated tools: Vanguard Capital Markets Model®
We balance our experience and judgment with quantitative tools and approaches—including proprietary financial modeling, which applies economic and return forecasts. Along with information and data unique to each DB investor, this modeling:
• Produces a range of potential investment outcomes and probabilities of success.
• Helps DB investors evaluate trade-offs associated with each outcome.
• Considers “what if” scenarios, such as the effect on contribution costs and portfolio volatility.
Ongoing research, LDI strategies, and solutions: Vanguard Investment Strategy Group (ISG)
In broad terms, ISG develops and maintains Vanguard’s investment methodology, ongoing research, and portfolio solutions used by our institutional clients, including DB investors. Their endeavors also inform the management strategies of Vanguard fixed income funds. In an environment that’s complex and challenging, dedicated DB professionals within ISG partner with DB investors to define their risk and return goals and develop the appropriate investment strategy that has the greatest probability of achieving their objectives. In addition to their considerable expertise and experience, this includes:
• Sophisticated asset-liability modeling.
• Client-event simulation studies.
• Glide path tests.
• Portfolio construction.
Liability-matching considerations: The advantages and value of funds
Vanguard research—and our DB clients—have found that using funds in an LDI portfolio provides a solid match to most pension liability profiles. Funds also provide other benefits difficult to obtain from individual issues.
Diversification and cash flow, downgrades, and defaults. Funds invest in hundreds or thousands of bonds. A more concentrated portfolio of individual bonds carries more specific issue risk to defaults or downgrades which could diminish the value of assets needed to meet the anticipated liability stream.
Liquidity. A portfolio of individual bonds may be fairly illiquid, making them difficult and expensive to adjust as the DB plan’s cash flow changes—which it will. Funds, on the other hand, usually allow for the purchase and sale of shares with little or no difficulty.
Rebalancing. Funds’ liquidity makes asset rebalancing easier as the assets and liabilities develop over time.
Costs. The lower they are, the better the result. A customized LDI bond fund portfolio can often be less expensive than one composed of individual bonds.
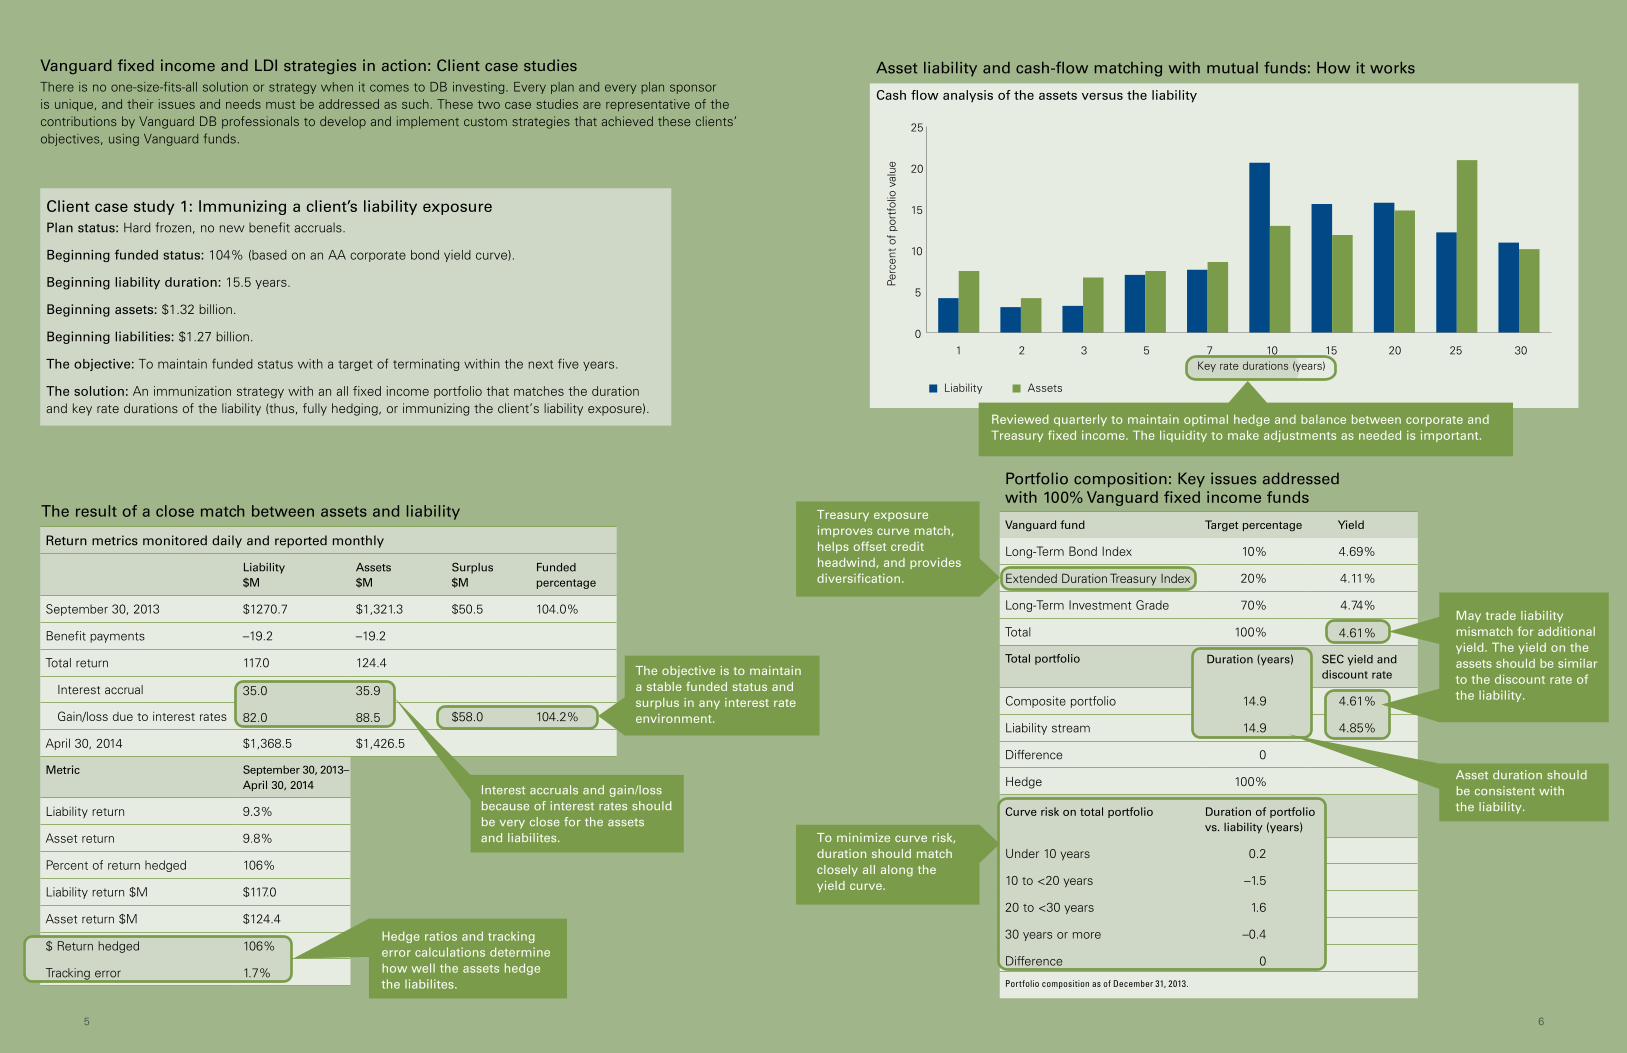
Return metrics monitored daily and reported monthly
Liability $M
Assets $M
Surplus $M
Funded percentage
September 30, 2013 $1270.7 $1,321.3 $50.5 104.0%
Benefit payments –19.2 –19.2
Total return 117.0 124.4
Interest accrual
Gain/loss due to interest rates 82 88.5
April 30, 2014 $1,368.5 $1,426.5 $58.00 104.20%
Metric September 30, 2013– April 30, 2014
Liability return 9.3%
Asset return 9.8%
Percent of return hedged 106%
Liability return $M $117.0
Asset return $M $124.4
35.0 35.9
82.0 88.5 $58.0 104.2%
$ Return hedged 106%
Tracking error 1.7%
Portfolio composition: Key issues addressed with 100% Vanguard fixed income funds
Vanguard fund Target percentage Yield
Long-Term Bond Index 10% 4.69%
Extended Duration Treasury Index 20% 4.11%
Long-Term Investment Grade 70% 4.74%
Total 100%
Total portfolio
Composite portfolio
Liability stream
Difference 0
Hedge 100%
Portfolio composition as of December 31, 2013.
Curve risk on total portfolio Duration of portfolio vs. liability (years)
Under 10 years 0.2
10 to <20 years –1.5
20 to <30 years 1.6
30 years or more –0.4
Difference 0
65
Vanguard fixed income and LDI strategies in action: Client case studiesThere is no one-size-fits-all solution or strategy when it comes to DB investing. Every plan and every plan sponsor is unique, and their issues and needs must be addressed as such. These two case studies are representative of the contributions by Vanguard DB professionals to develop and implement custom strategies that achieved these clients’ objectives, using Vanguard funds.
0
5
10
15
20
25
1 2 3 5 7 10 15 20 25 30
Perc
ent
of p
ortf
olio
val
ue
Liability Assets
Asset liability and cash-flow matching with mutual funds: How it works
Cash flow analysis of the assets versus the liability
Treasury exposure improves curve match, helps offset credit headwind, and provides diversification.
Reviewed quarterly to maintain optimal hedge and balance between corporate and Treasury fixed income. The liquidity to make adjustments as needed is important.
The result of a close match between assets and liability
Key rate durations (years)
May trade liability mismatch for additional yield. The yield on the assets should be similar to the discount rate of the liability.
Asset duration should be consistent with the liability.
Duration (years) SEC yield and discount rate
14.9 4.61%
14.9 4.85%
4.61%
Extended Duration Treasury Index
To minimize curve risk, duration should match closely all along the yield curve.
Interest accruals and gain/loss because of interest rates should be very close for the assets and liabilites.
The objective is to maintain a stable funded status and surplus in any interest rate environment.
Hedge ratios and tracking error calculations determine how well the assets hedge the liabilites.
Client case study 1: Immunizing a client’s liability exposurePlan status: Hard frozen, no new benefit accruals.
Beginning funded status: 104% (based on an AA corporate bond yield curve).
Beginning liability duration: 15.5 years.
Beginning assets: $1.32 billion.
Beginning liabilities: $1.27 billion.
The objective: To maintain funded status with a target of terminating within the next five years.
The solution: An immunization strategy with an all fixed income portfolio that matches the duration and key rate durations of the liability (thus, fully hedging, or immunizing the client’s liability exposure).
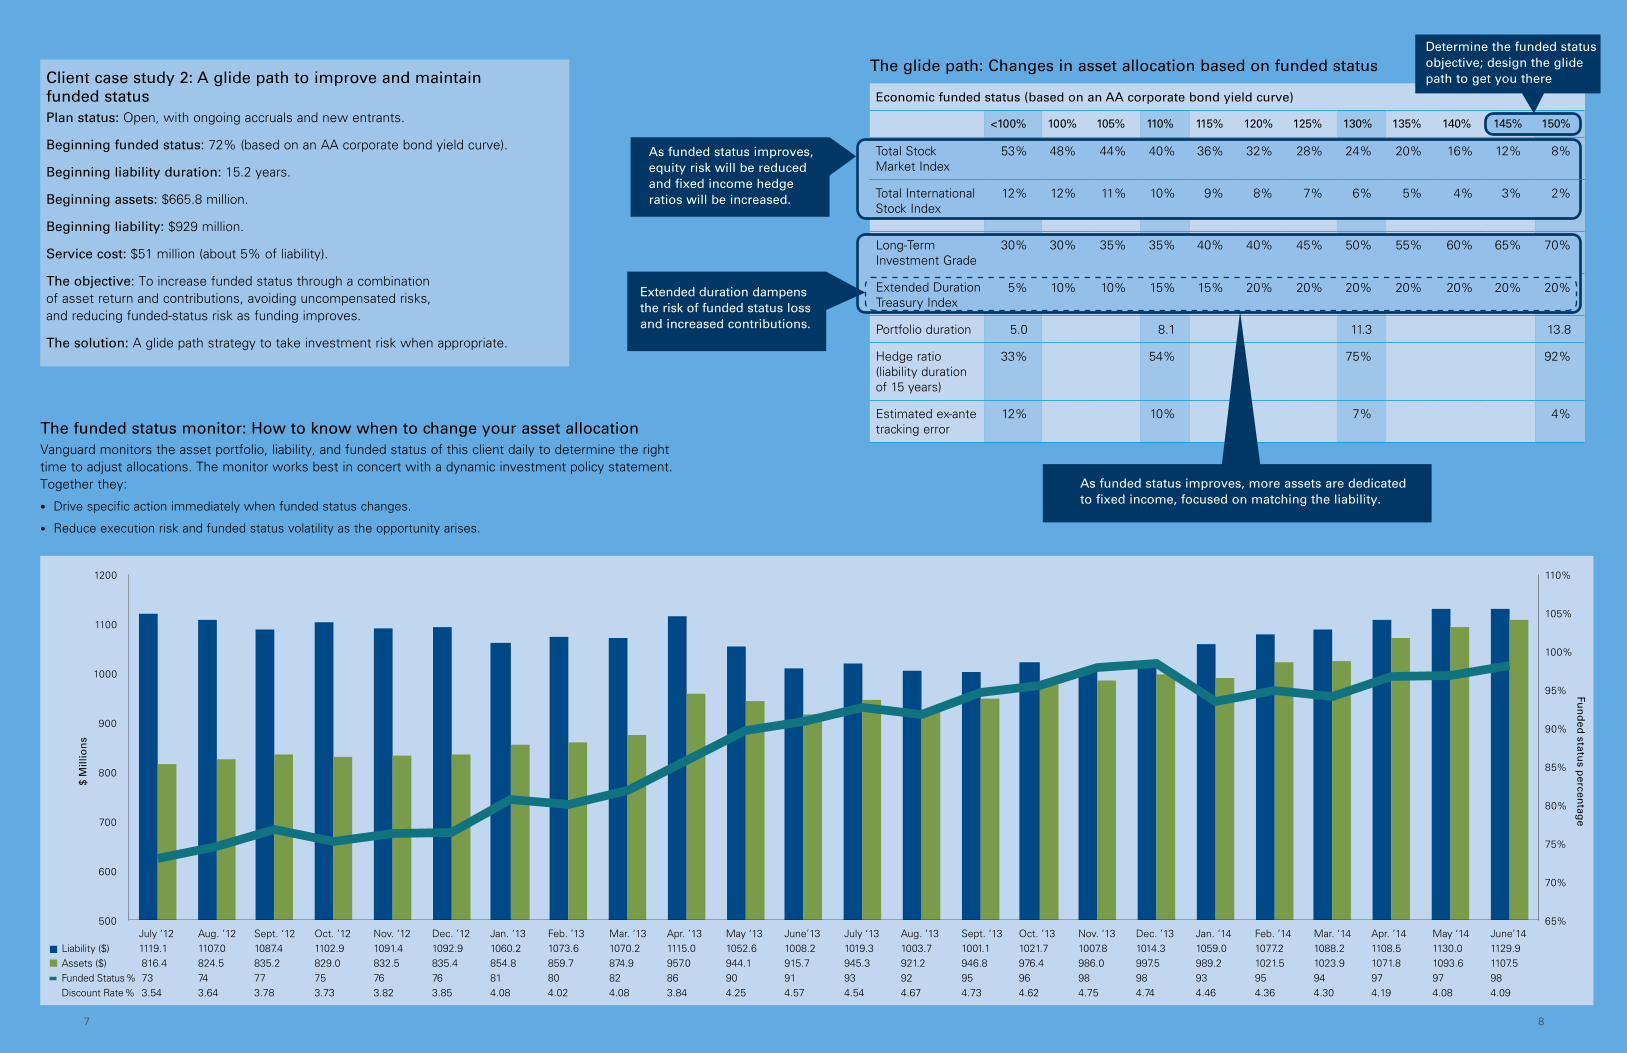
Economic funded status (based on an AA corporate bond yield curve)
<100% 100% 105% 110% 115% 120% 125% 130% 135% 140%
Long-Term Investment Grade
30% 30% 35% 35% 40% 40% 45% 50% 55% 60% 65% 70%
Extended Duration Treasury
5% 10% 10% 15% 15% 20% 20% 20% 20% 20% 20% 20%
Portfolio duration 5.0 8.1 11.3 13.8
Hedge ratio (liability duration of 15 years)
33% 54% 75% 92%
Estimated ex-ante tracking error
12% 10% 7% 4%
Long-Term Investment Grade
Extended Duration Treasury Index
30% 30% 35% 35% 40% 40% 45% 50% 55% 60% 65% 70%
5% 10% 10% 15% 15% 20% 20% 20% 20% 20% 20% 20%
87
The glide path: Changes in asset allocation based on funded status
The funded status monitor: How to know when to change your asset allocationVanguard monitors the asset portfolio, liability, and funded status of this client daily to determine the right time to adjust allocations. The monitor works best in concert with a dynamic investment policy statement. Together they:
• Drive specific action immediately when funded status changes.
• Reduce execution risk and funded status volatility as the opportunity arises.
Client case study 2: A glide path to improve and maintain funded statusPlan status: Open, with ongoing accruals and new entrants.
Beginning funded status: 72% (based on an AA corporate bond yield curve).
Beginning liability duration: 15.2 years.
Beginning assets: $665.8 million.
Beginning liability: $929 million.
Service cost: $51 million (about 5% of liability).
The objective: To increase funded status through a combination of asset return and contributions, avoiding uncompensated risks, and reducing funded-status risk as funding improves.
The solution: A glide path strategy to take investment risk when appropriate.
As funded status improves, equity risk will be reduced and fixed income hedge ratios will be increased.
Extended duration dampens the risk of funded status loss and increased contributions.
As funded status improves, more assets are dedicated to fixed income, focused on matching the liability.
65%
70%
75%
80%
85%
90%
95%
100%
105%
110%
500
600
700
800
900
1000
1100
1200
$ M
illio
ns
Liability ($) Assets ($) Funded Status % Discount Rate %
July ‘12 Aug. ’12 Sept. ‘12 Oct. ’12 Nov. ‘12 Dec. ’12 Jan. ‘13 Feb. ’13 Mar. ‘13 Apr. ’13 May ‘13 June’13 July ‘13 Aug. ’13 Sept. ‘13 Oct. ’13 Nov. ‘13 Dec. ’13 Jan. ‘14 Feb. ’14 Mar. ‘14 Apr. ’14 May ‘14 June’141119.1 1107.0 1087.4 1102.9 1091.4 1092.9 1060.2 1073.6 1070.2 1115.0 1052.6 1008.2 1019.3 1003.7 1001.1 1021.7 1007.8 1014.3 1059.0 1077.2 1088.2 1108.5 1130.0 1129.9 816.4 824.5 835.2 829.0 832.5 835.4 854.8 859.7 874.9 957.0 944.1 915.7 945.3 921.2 946.8 976.4 986.0 997.5 989.2 1021.5 1023.9 1071.8 1093.6 1107.5 73 74 77 75 76 76 81 80 82 86 90 91 93 92 95 96 98 98 93 95 94 97 97 98 3.54 3.64 3.78 3.73 3.82 3.85 4.08 4.02 4.08 3.84 4.25 4.57 4.54 4.67 4.73 4.62 4.75 4.74 4.46 4.36 4.30 4.19 4.08 4.09
Fun
ded
status p
ercentag
e
Total Stock Market Index
53% 48% 44% 40% 36% 32% 28% 24% 20% 16% 12% 8%
Total International Stock Index
12% 12% 11% 10% 9% 8% 7% 6% 5% 4% 3% 2%
145% 150%
Determine the funded status objective; design the glide path to get you there
109
Liability matching, risk reduction, and straightforward execution with Vanguard funds
Vanguard’s active and passive fixed income funds cover durations found all along the yield curve, making them a sound choice for strategies designed to match liabilities in derisking and other LDI approaches. Each, of course, is crafted and monitored with the attention to detail described earlier. Some are especially useful at the long end of the yield curve, others for plans close to termination, and still others in combination with return-seeking assets for open plans or to fill other particular needs of the strategy and portfolio.
Your Vanguard representative can provide more detail on these funds and other information about how they can accommodate any customized LDI strategy.
Short-term funds
Vanguard Short-Term Bond Index Fund
Vanguard Short-Term Corporate Bond Index Fund
Vanguard Short-Term Investment-Grade Fund
Intermediate-term funds
Vanguard Intermediate-Term Bond Index Fund
Vanguard Intermediate-Term Corporate Bond Index Fund
Vanguard Intermediate-Term Investment-Grade Fund
Vanguard Total Bond Market Index Fund
Long-term and extended-duration funds
Vanguard Long-Term Investment-Grade Fund
Vanguard Long-Term Corporate Bond Index Fund
Vanguard Long-Term Bond Index Fund
Vanguard Long-Term Treasury Fund
Vanguard Extended Duration Treasury Index Fund
Vanguard fund/duration Investments Typical uses
Extended Duration Treasury Index 23–27 years
STRIPS • To enhance match at long end of curve
• In high-equity exposure portfolios
• With high-duration DB plans
Long-Term Bond Index 11–14 years
Investment-grade corporate (about 51%), Treasury, Agency bonds
• A single-fund LDI solution
• Good liability match, with Treasury exposure
• In high equity exposure portfolios
Long-Term Corporate Bond Index 11–13 years
99%+ investment-grade corporate bonds
• A single-fund LDI solution
• Good liability match
• Key for portfolios focused on hedging/matchingLong-Term Investment-Grade Fund 11–13 years
95%+ credits, with about 75% of them corporates
A closer look: Four Vanguard funds most widely applicable to liability matching
Take the next step: Let’s start the conversation
As a DB investor, you know what you want your investment strategy to accomplish. We’d be privileged to begin the conversation to learn more about your circumstances and share our approach to helping you meet your goals. Contact your Vanguard representative or call 800-310-8876.
For more information
The following research and commentary provide in-depth information on Vanguard fixed income investments and our approach to defined benefit plan investing. They’re available at institutional.vanguard.com or by calling your Vanguard representative or 800-310-8876.
• Pension derisking: Start with the end in mind
• Pension derisking: Diversify or hedge?
• Pension risk: How much are you really taking?
• Glide path ALM: A dynamic allocation approach to derisking
• Pension plan immunization strategies: How close can you get?
• Fundamentals of liability-driven investing
• DB investing essentials
• For better pension liability matching, consider adding Treasuries
• Frozen pension plans: Is immunization or termination the right choice?
• The impact of equities in pension investing: It’s not just return
• Is it alpha or beta? The story behind active bond-fund excess returns
• The case for index-fund investing


![Investor Presentation - Analyst / Institutional Investor Meeting [Company Update]](https://img.pdfslide.us/doc/110x75/577c98301a28ab163a8b4855/investor-presentation-analyst-institutional-investor-meeting-company-update.jpg)