Embed Size (px)
Citation preview
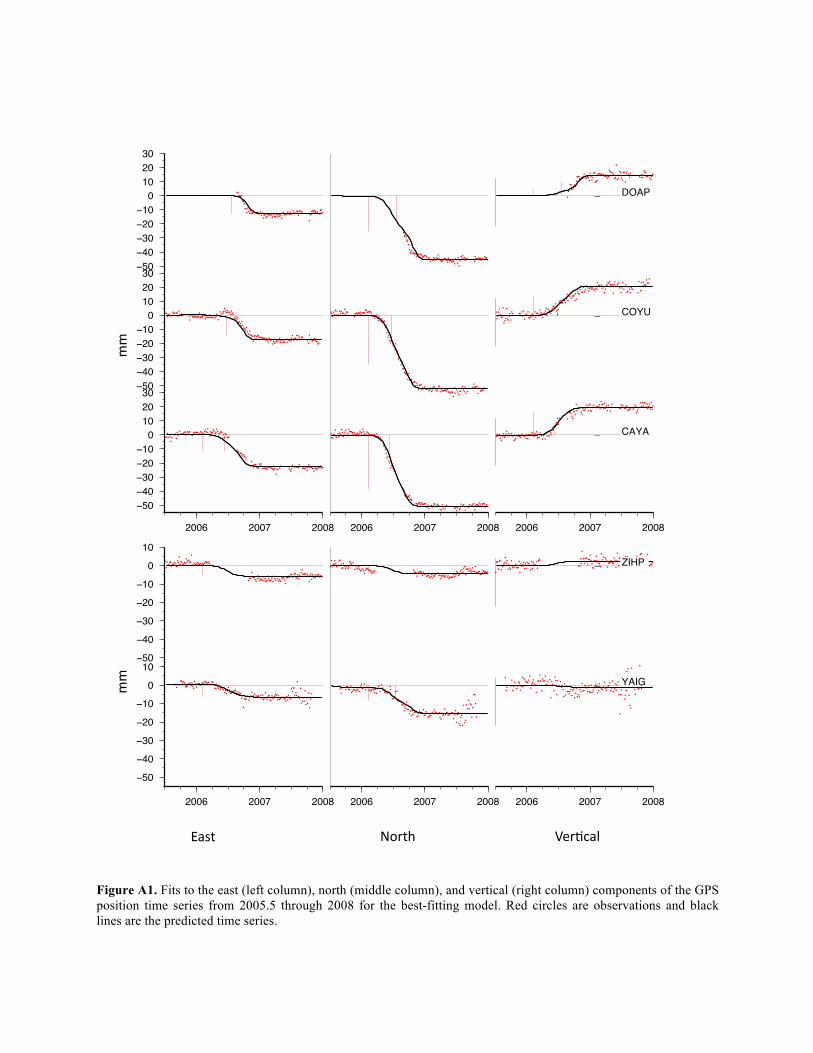
Figure A1. Fits to the east (left column), north (middle column), and vertical (right column) components of the GPS position time series from 2005.5 through 2008 for the best-fitting model. Red circles are observations and black lines are the predicted time series.
Figure A1. Fits to the east (left column), north (middle column), and vertical (right column) components of the GPS position time series from 2005.5 through 2008 for the best-fitting model. Red circles are observations and black lines are the predicted time series.!
2013 Oct 31 13:30:58
East − North − Up
67s9 _ CGP4 _page_ 1
−50−40−30−20−10
0102030
2006 2007 2008 2006 2007 2008 2006 2007 2008
CAYA _
−50−40−30−20−10
0102030
COYU _
−50−40−30−20−10
0102030
DOAP _
2013 Oct 31 13:31:11
East − North − Up
67s9 _ CGP3 _page_ 7
−50−40−30−20−10
010
2006 2007 2008 2006 2007 2008 2006 2007 2008
YAIG _
−50−40−30−20−10
010
ZIHP _
East% North% Ver,cal%
mm%
mm%
1
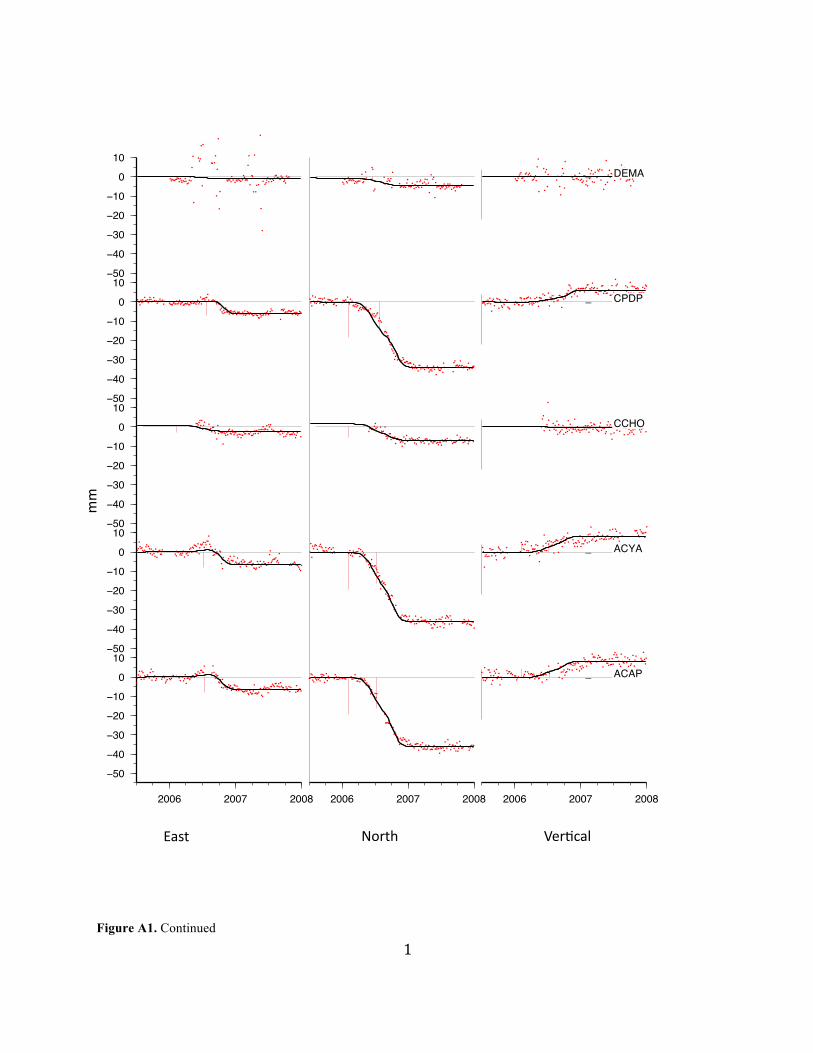
Figure A1. Continued
Figure A1. Continued
East% North% Ver,cal%
2013 Oct 31 13:31:05
East − North − Up
67s9 _ CGP3 _page_ 1
−50−40−30−20−10
010
2006 2007 2008 2006 2007 2008 2006 2007 2008
ACAP _
−50−40−30−20−10
010
ACYA _
−50−40−30−20−10
010
CCHO _
−50−40−30−20−10
010
CPDP _
−50−40−30−20−10
010
DEMA _
mm%

2
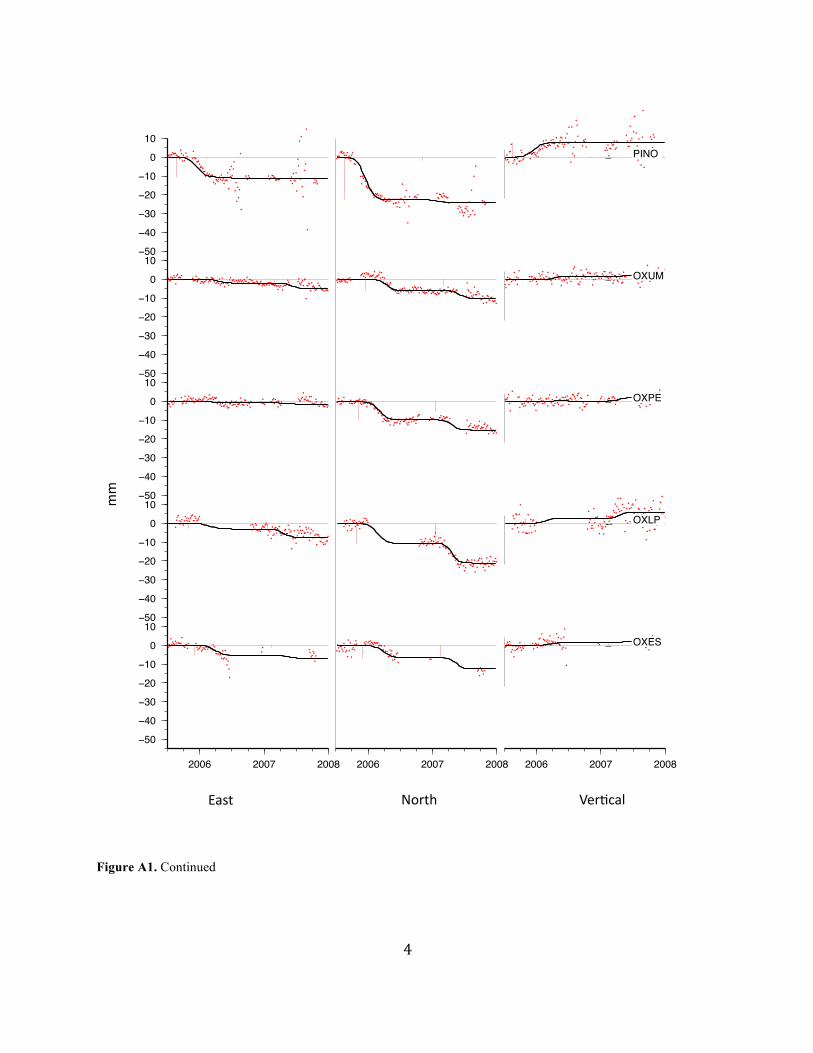
Figure A1. Continued
Figure A1. Continued
East% North% Ver,cal%
2013 Oct 31 13:31:06
East − North − Up
67s9 _ CGP3 _page_ 2
−50−40−30−20−10
010
2006 2007 2008 2006 2007 2008 2006 2007 2008
HUAT _
−50−40−30−20−10
010
IGUA _
−50−40−30−20−10
010
MARO _
−50−40−30−20−10
010
MEZC _
−50−40−30−20−10
010
MOCS _
mm%

3
Figure A1. Continued
Figure A1. Continued
East% North% Ver,cal%
2013 Oct 31 13:31:07
East − North − Up
67s9 _ CGP3 _page_ 3
−50−40−30−20−10
010
2006 2007 2008 2006 2007 2008 2006 2007 2008
MPAA _
−50−40−30−20−10
010
MRRA _
−50−40−30−20−10
010
OAX2 _
−50−40−30−20−10
010
OAXU _
−50−40−30−20−10
010
OXEC _
mm%
4
Figure A1. Continued
Figure A1. Continued
East% North% Ver,cal%
2013 Oct 31 13:31:08
East − North − Up
67s9 _ CGP3 _page_ 4
−50−40−30−20−10
010
2006 2007 2008 2006 2007 2008 2006 2007 2008
OXES _
−50−40−30−20−10
010
OXLP _
−50−40−30−20−10
010
OXPE _
−50−40−30−20−10
010
OXUM _
−50−40−30−20−10
010
PINO _
mm%

5
Figure A1. Continued
Figure A1. Continued
East% North% Ver,cal%
2013 Oct 31 13:31:09
East − North − Up
67s9 _ CGP3 _page_ 5
−50−40−30−20−10
010
2006 2007 2008 2006 2007 2008 2006 2007 2008
TOL2 _
−50−40−30−20−10
010
UCHI _
−50−40−30−20−10
010
UCOE _
−50−40−30−20−10
010
UIGF _
−50−40−30−20−10
010
UJAL _mm%

6
Figure A1. Continued
Figure A1. Continued
East% North% Ver,cal%
2013 Oct 31 13:31:10
East − North − Up
67s9 _ CGP3 _page_ 6
−50−40−30−20−10
010
2006 2007 2008 2006 2007 2008 2006 2007 2008
UJUR _
−50−40−30−20−10
010
UNIP _
−50−40−30−20−10
010
UPEC _
−50−40−30−20−10
010
UTON _
−50−40−30−20−10
010
UXAL _
mm%

7
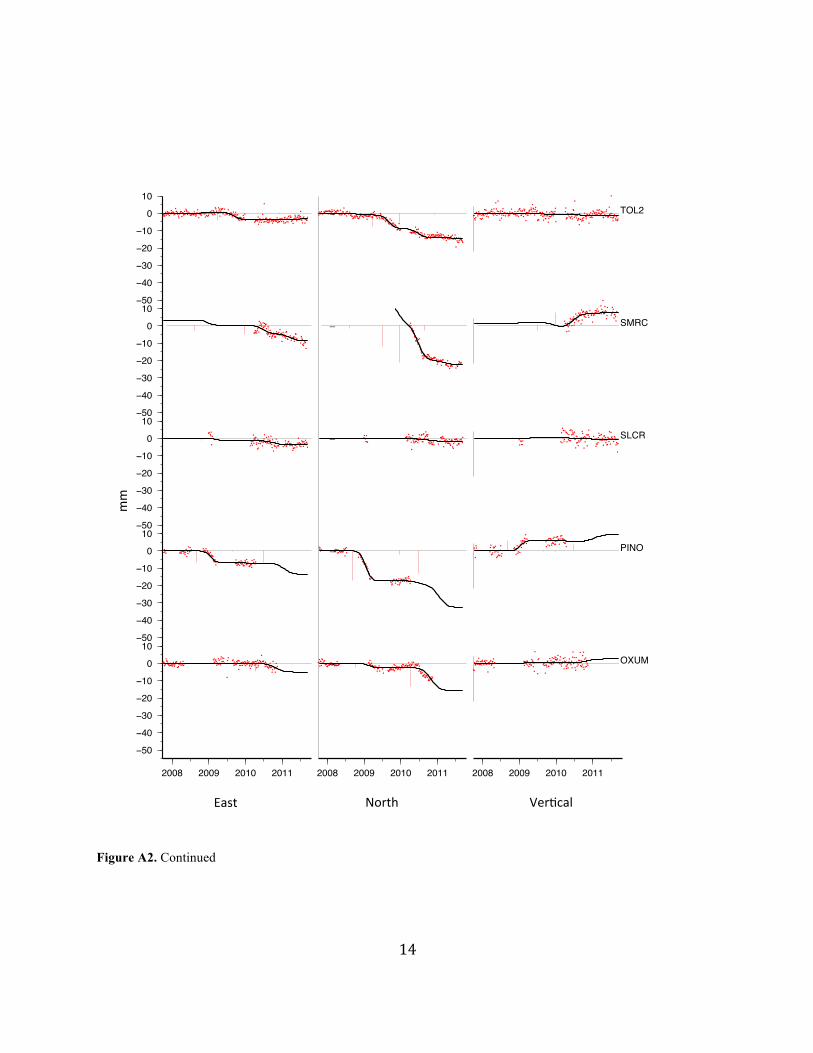
Figure A2. Same as Fig. A1, but for the period 2008.5 to 2011.7 2013 Nov 12 10:07:33
East − North − Up
cbs5 _ CGP4 _page_ 1
−50−40−30−20−10
01020
2008 2009 2010 2011 2008 2009 2010 2011 2008 2009 2010 2011
CAYA _
−50−40−30−20−10
01020
COYB _
−50−40−30−20−10
01020
DOAP _
−50−40−30−20−10
01020
OXMA _
−50−40−30−20−10
01020
TCPN _
−50−40−30−20−10
01020
ZIHP _
Figure A2. Same as Fig. A1, but for the period 2008.5 to 2011.7!
East% North% Ver,cal%
mm%

8
Figure A2. Continued
Figure A2. Continued
East% North% Ver,cal%
mm%
2013 Nov 12 10:07:37
East − North − Up
cbs5 _ CGP3 _page_ 1
−50−40−30−20−10
010
2008 2009 2010 2011 2008 2009 2010 2011 2008 2009 2010 2011
ACAP _
−50−40−30−20−10
010
ACYA _
−50−40−30−20−10
010
AYT2 _
−50−40−30−20−10
010
CCHO _
−50−40−30−20−10
010
CECM _

9
Figure A2. Continued
Figure A2. Continued
East% North% Ver,cal%
mm%
2013 Nov 12 10:07:38
East − North − Up
cbs5 _ CGP3 _page_ 2
−50
−40
−30
−20
−10
0
10
2008 2009 2010 2011 2008 2009 2010 2011 2008 2009 2010 2011
CPDP _
−50
−40
−30
−20
−10
0
10DEMA _
−50
−40
−30
−20
−10
0
10HUAT _
−50
−40
−30
−20
−10
0
10ICEP _
−50
−40
−30
−20
−10
0
10IGUA _

10
Figure A2. Continued
Figure A2. Continued
East% North% Ver,cal%
mm%
2013 Nov 12 10:07:39
East − North − Up
cbs5 _ CGP3 _page_ 3
−50−40−30−20−10
010
2008 2009 2010 2011 2008 2009 2010 2011 2008 2009 2010 2011
LAZA _
−50−40−30−20−10
010
MEZC _
−50−40−30−20−10
010
MMX1 _
−50−40−30−20−10
010
MOCS _
−50−40−30−20−10
010
MOGA _

11
Figure A2. Continued
Figure A2. Continued
East% North% Ver,cal%
mm%
2013 Nov 12 10:07:40
East − North − Up
cbs5 _ CGP3 _page_ 4
−50−40−30−20−10
010
2008 2009 2010 2011 2008 2009 2010 2011 2008 2009 2010 2011
MPAA _
−50−40−30−20−10
010
MRQL _
−50−40−30−20−10
010
MRRA _
−50−40−30−20−10
010
OAX2 _
−50−40−30−20−10
010
OAXU _

12
Figure A2. Continued
Figure A2. Continued
East% North% Ver,cal%
mm%
2013 Nov 12 10:07:41
East − North − Up
cbs5 _ CGP3 _page_ 5
−50−40−30−20−10
010
2008 2009 2010 2011 2008 2009 2010 2011 2008 2009 2010 2011
OMTP _
−50−40−30−20−10
010
OXAC _
−50−40−30−20−10
010
OXEC _
−50−40−30−20−10
010
OXES _
−50−40−30−20−10
010
OXGU _

13
Figure A2. Continued
Figure A2. Continued
East% North% Ver,cal%
mm%
2013 Nov 12 10:07:42
East − North − Up
cbs5 _ CGP3 _page_ 6
−50−40−30−20−10
010
2008 2009 2010 2011 2008 2009 2010 2011 2008 2009 2010 2011
OXLP _
−50−40−30−20−10
010
OXNC _
−50−40−30−20−10
010
OXPE _
−50−40−30−20−10
010
OXTH _
−50−40−30−20−10
010
OXTU _
14
Figure A2. Continued
Figure A2. Continued
East% North% Ver,cal%
mm%
2013 Nov 12 10:07:43
East − North − Up
cbs5 _ CGP3 _page_ 7
−50−40−30−20−10
010
2008 2009 2010 2011 2008 2009 2010 2011 2008 2009 2010 2011
OXUM _
−50−40−30−20−10
010
PINO _
−50−40−30−20−10
010
SLCR _
−50−40−30−20−10
010
SMRC _
−50−40−30−20−10
010
TOL2 _

15
Figure A2. Continued
Figure A2. Continued
East% North% Ver,cal%
mm%
2013 Nov 12 10:07:44
East − North − Up
cbs5 _ CGP3 _page_ 8
−50−40−30−20−10
010
2008 2009 2010 2011 2008 2009 2010 2011 2008 2009 2010 2011
UCHI _
−50−40−30−20−10
010
UCOC _
−50−40−30−20−10
010
UCOE _
−50−40−30−20−10
010
UGOL _
−50−40−30−20−10
010
UIGF _

16
Figure A2. Continued
Figure A2. Continued
East% North% Ver,cal%
mm%
2013 Nov 12 10:07:45
East − North − Up
cbs5 _ CGP3 _page_ 9
−50−40−30−20−10
010
2008 2009 2010 2011 2008 2009 2010 2011 2008 2009 2010 2011
UJAL _
−50−40−30−20−10
010
UJUR _
−50−40−30−20−10
010
UNIP _
−50−40−30−20−10
010
UPEC _
−50−40−30−20−10
010
UTON _

17
Figure A2. Continued
Figure A2. Continued
East% North% Ver,cal%
mm%
2013 Nov 12 10:07:46
East − North − Up
cbs5 _ CGP3 _page_ 10
−50
−40
−30
−20
−10
0
10
2008 2009 2010 2011 2008 2009 2010 2011 2008 2009 2010 2011
UXAL _
−50
−40
−30
−20
−10
0
10UZIT _
18
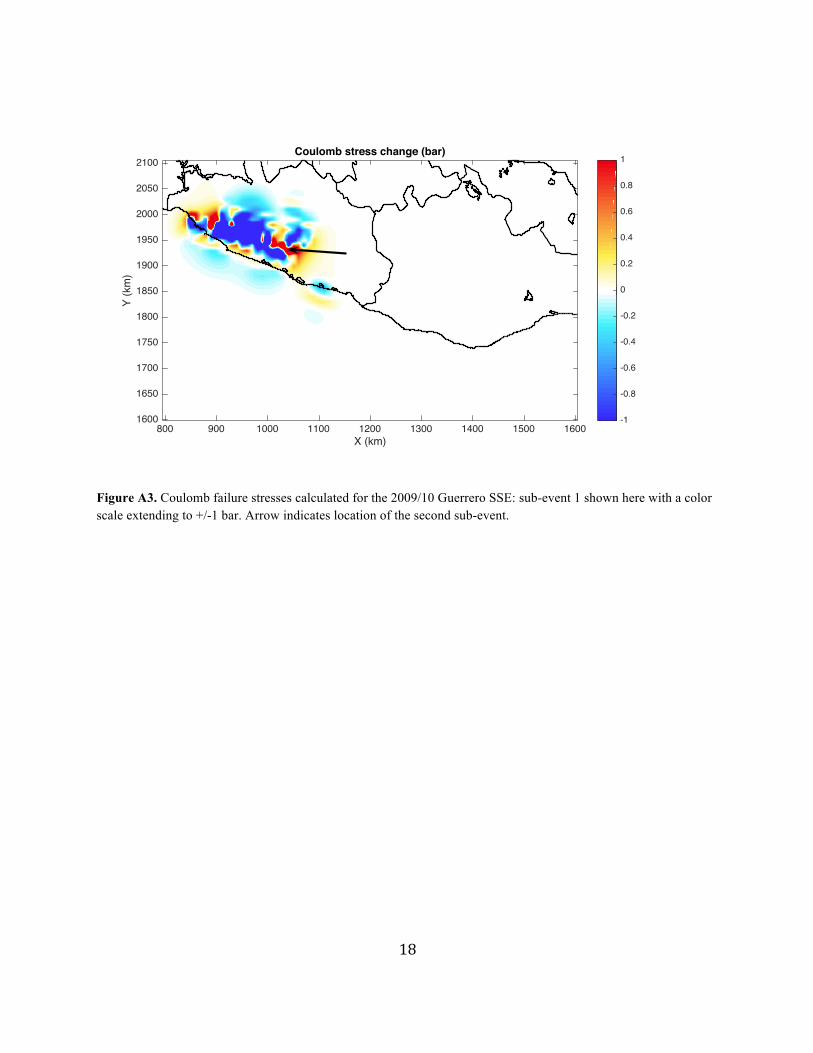
Figure A3. Coulomb failure stresses calculated for the 2009/10 Guerrero SSE: sub-event 1 shown here with a color scale extending to +/-1 bar. Arrow indicates location of the second sub-event.
Figure A3. Coulomb failure stresses calculated for the 2009/10 Guerrero SSE: sub-event 1 shown here with a color scale extending to +/-1 bar. Arrow indicates location of the second sub-event.
Coulomb stress change (bar)
Coulomb 3.3.01 04-Nov-2015 09:02:01 fault_patches_cbs5_002.nod.30mm.inpSpecified faults: 288/15/90 Depth: 35.00 km Friction: 0.40
800 900 1000 1100 1200 1300 1400 1500 1600X (km)
1600
1650
1700
1750
1800
1850
1900
1950
2000
2050
2100
Y (k
m)
-1
-0.8
-0.6
-0.4
-0.2
0
0.2
0.4
0.6
0.8
1


![arXiv:1805.08298v2 [cs.CV] 24 Nov 2018epxing/papers/2018/Li_etal_nips18.pdfradiologists for the chest x-ray image on the left column. The right column contains three reports generated](https://img.pdfslide.us/doc/110x75/5e8fcaf26dd187783230ac64/arxiv180508298v2-cscv-24-nov-epxingpapers2018lietalnips18pdf-radiologists.jpg)


![GCSE - RevisionWorld(a) Circle the word below that best fits gap a: bounced mended soothed injured [1] (b) Circle the word below that best fits gap b: left taken rescued treated [1]](https://img.pdfslide.us/doc/110x75/5fc86f77b6212e2b82614437/gcse-revisionworld-a-circle-the-word-below-that-best-fits-gap-a-bounced-mended.jpg)