Embed Size (px)
Citation preview
Fiscal Year 2020 Financial Report As
of
and f
or
Years
Ended J
une 3
0, 2019 a
nd 2
020
CM Life Celebrated 100 years of
reporting
CMU Police
Department
celebrated 50 years
of helping to keep
the university safe
College of Business
celebrated 50 years
for the School of
Accounting
Central Michigan University Board of Trustees
Tricia A. Keith, Birmingham, Chair Todd J. Anson, Charlevoix
Isaiah M. Oliver, Flint Edward J. Plawecki, Plymouth
Michael A. Sandler, West Bloomfield Richard K. Studley, Grand Ledge, Vice Chair
Robert F. Wardrop II, Grand Rapids, Vice Chair William H. Weideman, Midland
President and Vice Presidents
Robert O. Davies, President Mary Schutten, Provost / Executive Vice President
Barrie Wilkes, Vice President of Finance and Administrative Services Heidi Tracy, Vice President / Advancement
A.T. Miller, Vice President / Chief Diversity Officer David Weindorf, Vice President Research and Innovation
Manuel Rupe, Vice President and General Counsel George Kikano, Vice President Health Affairs & Dean of College of Medicine
John Veilleux, Vice President Univ Comm & Chief Marketing Officer Jennifer Dehaemers, Vice President Student Recruitment & Retention
Jim Bujaki, Vice President Information Technology & Chief Information Officer
Financial Administrative Staff
Mary Moran Hill, Associate Vice President of Financial Services & Reporting / Controller Julie Montross, Assistant Controller Financial Reporting Kim Wagester, Assistant Controller Financial Services
Beth Timmerman, Director of Internal Audit
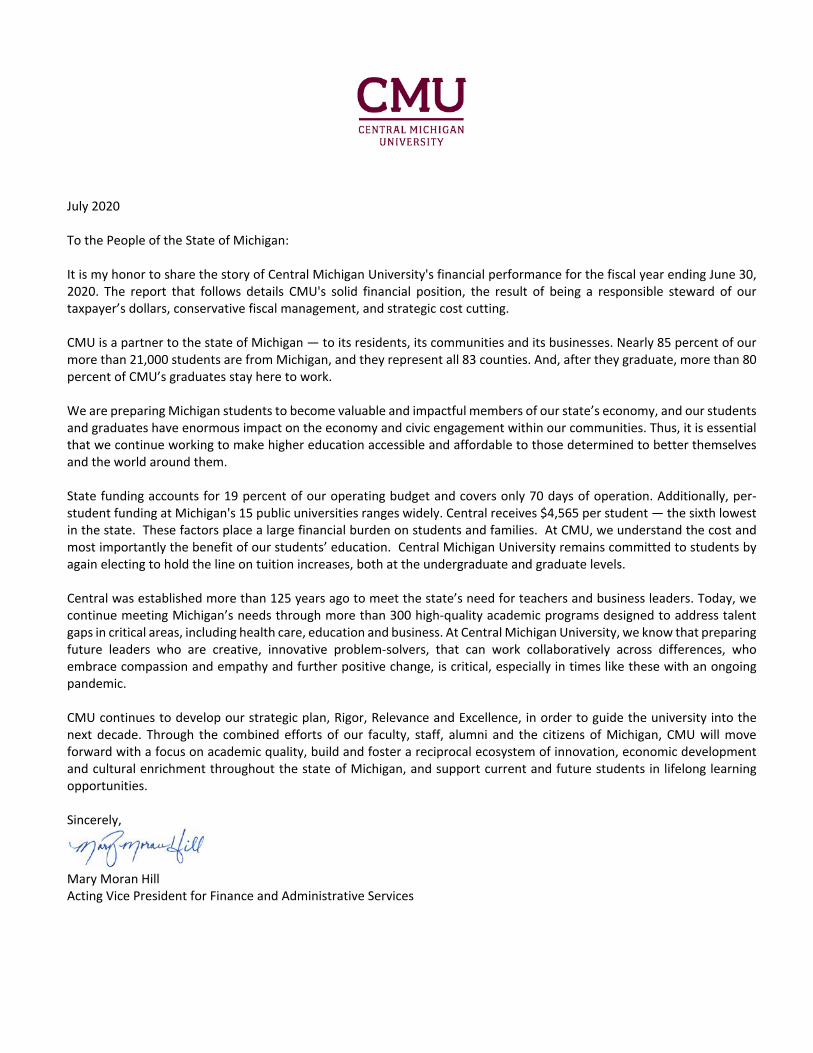
July 2020 To the People of the State of Michigan: It is my honor to share the story of Central Michigan University's financial performance for the fiscal year ending June 30, 2020. The report that follows details CMU's solid financial position, the result of being a responsible steward of our taxpayer’s dollars, conservative fiscal management, and strategic cost cutting. CMU is a partner to the state of Michigan — to its residents, its communities and its businesses. Nearly 85 percent of our more than 21,000 students are from Michigan, and they represent all 83 counties. And, after they graduate, more than 80 percent of CMU’s graduates stay here to work. We are preparing Michigan students to become valuable and impactful members of our state’s economy, and our students and graduates have enormous impact on the economy and civic engagement within our communities. Thus, it is essential that we continue working to make higher education accessible and affordable to those determined to better themselves and the world around them. State funding accounts for 19 percent of our operating budget and covers only 70 days of operation. Additionally, per-student funding at Michigan's 15 public universities ranges widely. Central receives $4,565 per student — the sixth lowest in the state. These factors place a large financial burden on students and families. At CMU, we understand the cost and most importantly the benefit of our students’ education. Central Michigan University remains committed to students by again electing to hold the line on tuition increases, both at the undergraduate and graduate levels. Central was established more than 125 years ago to meet the state’s need for teachers and business leaders. Today, we continue meeting Michigan’s needs through more than 300 high-quality academic programs designed to address talent gaps in critical areas, including health care, education and business. At Central Michigan University, we know that preparing future leaders who are creative, innovative problem-solvers, that can work collaboratively across differences, who embrace compassion and empathy and further positive change, is critical, especially in times like these with an ongoing pandemic. CMU continues to develop our strategic plan, Rigor, Relevance and Excellence, in order to guide the university into the next decade. Through the combined efforts of our faculty, staff, alumni and the citizens of Michigan, CMU will move forward with a focus on academic quality, build and foster a reciprocal ecosystem of innovation, economic development and cultural enrichment throughout the state of Michigan, and support current and future students in lifelong learning opportunities. Sincerely,
Mary Moran Hill Acting Vice President for Finance and Administrative Services

This page intentionally left blank.
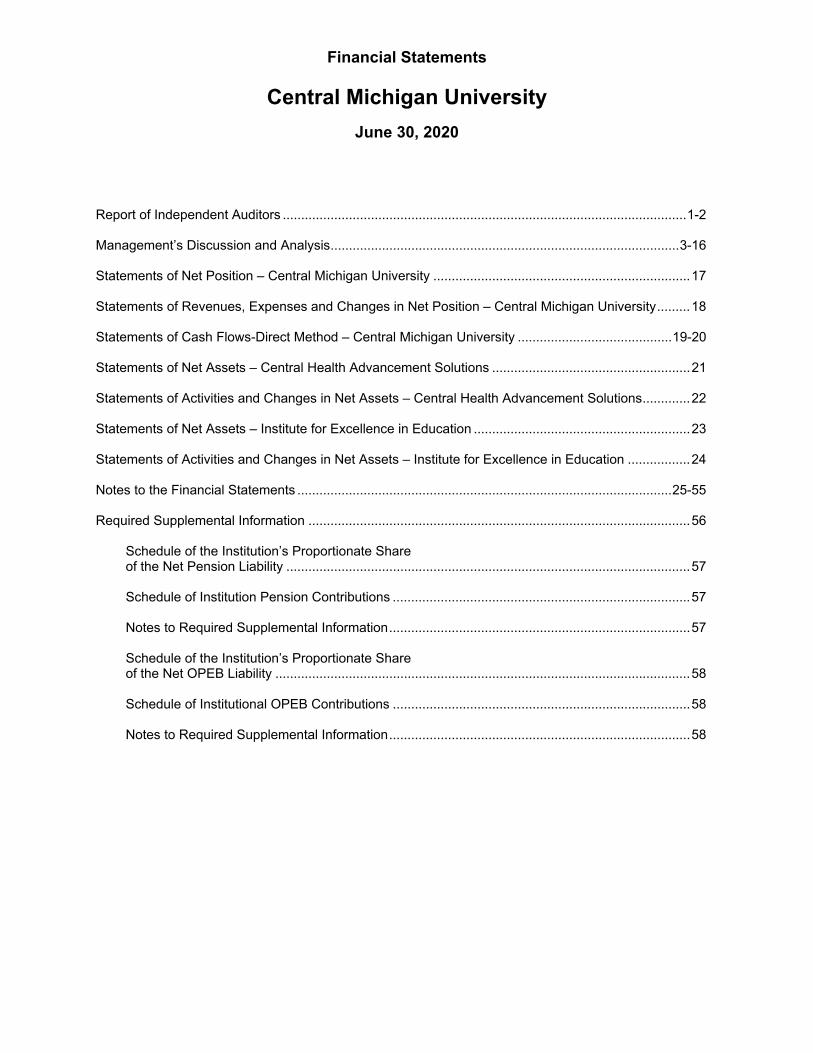
Financial Statements
Central Michigan University
June 30, 2020 Report of Independent Auditors .............................................................................................................. 1-2 Management’s Discussion and Analysis ............................................................................................... 3-16 Statements of Net Position – Central Michigan University ...................................................................... 17 Statements of Revenues, Expenses and Changes in Net Position – Central Michigan University ......... 18 Statements of Cash Flows-Direct Method – Central Michigan University .......................................... 19-20 Statements of Net Assets – Central Health Advancement Solutions ...................................................... 21 Statements of Activities and Changes in Net Assets – Central Health Advancement Solutions ............. 22 Statements of Net Assets – Institute for Excellence in Education ........................................................... 23 Statements of Activities and Changes in Net Assets – Institute for Excellence in Education ................. 24 Notes to the Financial Statements ...................................................................................................... 25-55 Required Supplemental Information ........................................................................................................ 56
Schedule of the Institution’s Proportionate Share of the Net Pension Liability .............................................................................................................. 57 Schedule of Institution Pension Contributions ................................................................................. 57 Notes to Required Supplemental Information .................................................................................. 57 Schedule of the Institution’s Proportionate Share of the Net OPEB Liability ................................................................................................................. 58 Schedule of Institutional OPEB Contributions ................................................................................. 58 Notes to Required Supplemental Information .................................................................................. 58

Financial Report 2020
1
Independent Auditor's Report
To the Board of Trustees Central Michigan University
Report on the Financial Statements
We have audited the accompanying financial statements of Central Michigan University (the "University"), a component unit of the State of Michigan, and its discretely presented component units as of and for the years ended June 30, 2020 and 2019 and the related notes to the financial statements, which collectively comprise Central Michigan University's basic financial statements, as listed in the table of contents.
Management’s Responsibility for the Financial Statements
Management is responsible for the preparation and fair presentation of these financial statements in accordance with accounting principles generally accepted in the United States of America; this includes the design, implementation, and maintenance of internal control relevant to the preparation and fair presentation of financial statements that are free from material misstatement, whether due to fraud or error.
Auditor’s Responsibility
Our responsibility is to express opinions on these financial statements based on our audits. We did not audit the financial statements of Central Health Advancement Solutions (CHAS) or the Institute of Excellence in Education (IEE), which represent all of the balances of the assets, net assets, and revenue of the discretely presented component units. Those financial statements were audited by other auditors, whose report has been furnished to us, and our opinion, insofar as it relates to the amounts included for CHAS and IEE, is based solely on the report of the other auditors. We conducted our audits in accordance with auditing standards generally accepted in the United States of America and the standards applicable to financial audits contained in Government Auditing Standards, issued by the Comptroller General of the United States. Those standards require that we plan and perform the audits to obtain reasonable assurance about whether the financial statements are free from material misstatement. The financial statements of CHAS and IEE were not audited under Government Auditing Standards.
An audit involves performing procedures to obtain audit evidence about the amounts and disclosures in the financial statements. The procedures selected depend on the auditor’s judgment, including the assessment of the risks of material misstatement of the financial statements, whether due to fraud or error. In making those risk assessments, the auditor considers internal control relevant to the entity’s preparation and fair presentation of the financial statements in order to design audit procedures that are appropriate in the circumstances, but not for the purpose of expressing an opinion on the effectiveness of the entity’s internal control. Accordingly, we express no such opinion. An audit also includes evaluating the appropriateness of accounting policies used and the reasonableness of significant accounting estimates made by management, as well as evaluating the overall presentation of the financial statements.
We believe that the audit evidence we have obtained is sufficient and appropriate to provide a basis for our audit opinions.
Opinions
In our opinion, based on our audit and the report of other auditors, the financial statements referred to above present fairly, in all material respects, the financial position of Central Michigan University and its discretely presented component units as of June 30, 2020 and 2019 and the changes in its financial position and cash flows, where applicable, for the years then ended in accordance with accounting principles generally accepted in the United States of America.

Financial Report 2020
2
To the Board of Trustees Central Michigan University
Emphasis of Matter
As discussed in Note 1 to the financial statements, the COVID-19 pandemic has impacted the operations of the University. Our opinion is not modified with respect to this matter.
Other Matters
Required Supplemental Information
Accounting principles generally accepted in the United States of America require that the management's discussion and analysis, schedule of the institution's proportionate share of the net pension liability and schedule of institution pension contributions, and schedule of the institution's proportionate share of the net OPEB liability and schedule of institution OPEB contributions be presented to supplement the basic financial statements. Such information, although not a part of the basic financial statements, is required by the Governmental Accounting Standards Board, which considers it to be an essential part of financial reporting for placing the basic financial statements in an appropriate operational, economic, or historical context. We have applied certain limited procedures to the required supplemental information in accordance with auditing standards generally accepted in the United States of America, which consisted of inquiries of management about the methods of preparing the information and comparing the information for consistency with management's responses to our inquiries, the basic financial statements, and other knowledge we obtained during our audit of the basic financial statements. We do not express an opinion or provide any assurance on the information because the limited procedures do not provide us with sufficient evidence to express an opinion or provide any assurance.
Other Information
Our audit was conducted for the purpose of forming opinions on the financial statements that collectively comprise the University's basic financial statements. The listing of board of trustees, president and vice presidents, and financial administrative staff and introductory letter are presented for the purpose of additional analysis and are not a required part of the basic financial statements. The listing of board of trustees, president and vice presidents, and financial administrative staff and introductory letter have not been subjected to the auditing procedures applied in the audit of the basic financial statements, and, accordingly, we do not express an opinion or provide any assurance on them.
Other Reporting Required by Government Auditing Standards
In accordance with Government Auditing Standards, we have also issued our report dated September 24, 2020 on our consideration of the Central Michigan University's internal control over financial reporting and on our tests of its compliance with certain provisions of laws, regulations, contracts, grant agreements, and other matters. The purpose of that report is to describe the scope of our testing of internal control over financial reporting and compliance and the results of that testing, and not to provide an opinion on the internal control over financial reporting or on compliance. That report is an integral part of an audit performed in accordance with Government Auditing Standards in considering Central Michigan University's internal control over financial reporting and compliance.
September 24, 2020
MANAGEMENT’S DISCUSSION AND ANALYSIS Central Michigan University
Fi
nanc
ial R
epor
t 202
0
3
INTRODUCTION This section of the Central Michigan University (the university or CMU) annual financial report presents a discussion and analysis of the financial performance of the university for the fiscal year ended June 30, 2020, with selected comparative information for the years ended June 30, 2019, and 2018. For accurate contextual understanding, read this discussion prepared by management, along with the financial statements and related note disclosures, in its entirety. The discussion and analysis focus is on current activities, resulting changes and currently known facts. REPORTING ENTITY Central Michigan University is an institution of higher education and a component unit of the State of Michigan. The financial reporting entity consists of the university and other organizations for which the university is financially accountable. Under the provision of Governmental Accounting Standards Board (GASB) Statement No. 61, The Financial Reporting Entity: Omnibus, Central Michigan University College of Business Administration Foundation (CBAF) and the Central Michigan University Foundation have been determined to be component units. Their activity has been blended into the university’s financial statements. The CBAF was dissolved in August of 2017. It had no financial activity in the fiscal years ended June 30, 2020 and June 30, 2019 and insignificant activity in the fiscal year ended June 30, 2018. Under the same GASB Statement No. 61, Central Health Advancement Solutions (CHAS) and the Institute for Excellence in Education (IEE) have been determined to be significant component units. Accordingly, CHAS and IEE are discretely presented in the university’s financial statements. Refer to Note 1 to the financial statements for more information regarding these component units and other affiliated entities. FACTORS INFLUENCING FUTURE PERIODS Central Michigan University, while facing external factors beyond our control, is committed to keeping higher education affordable and accessible to students and families. The university continues to expand programs, undertake new initiatives, and meet its core mission and ongoing operating needs through effectively managing finances and streamlining processes. However, declining population in the high school cohort in Michigan and impacts resulting from the COVID-19 global pandemic, may have an adverse effect on the university’s ability to meet its goals. The level of enrollment, amount of state support, potential compensation and benefit increases, and cost of extensive efforts to mitigate COVID-19 are major impact factors on student tuition and fee increases. The university’s state appropriations for fiscal year 2020 were $9.1 million below its peak appropriations of eighteen years ago. In fiscal year 2020, state appropriations contributed approximately 18.1% of university revenues. In fiscal year 2002, state appropriations contributed approximately 31.5% of university revenues. The university also has a required supplemental contribution to the Michigan Public School Employees’ Retirement System (MPSERS) for retiree pension and health care benefits that additionally reduces the revenue available for operations. The required contribution back to the state was $15.8 million for fiscal year 2020 compared to $6.2 million for fiscal year 2002. The university is committed to preserving academic quality, providing excellent service to our students, and not dramatically increasing tuition and fees for our students and their families. The university continues to set the bar in maintaining low tuition and fee increases even though state appropriations are less than what they were eighteen years ago. Significant efforts, such as the newly created student financial wellness collaborative, will allow us to better educate and assist students with financial needs while we continue to identify and implement efficient and effective cost-saving measures. Recognizing the continued financial challenges of our students and their families, the university has increased total CMU aid from approximately $31.2 million in 2008 to $69.9 million in 2020, making degrees possible for many students who otherwise could not pursue their dream of higher education. Central Michigan University continues to be committed to addressing the financial needs of our students and their families. The COVID-19 global pandemic has created unique challenges for the university that are expected to continue well into the next fiscal year. Significant effort and resources have been invested, to ensure the

MANAGEMENT’S DISCUSSION AND ANALYSIS (continued) Central Michigan University
Fi
nanc
ial R
epor
t 202
0
4
safety of the campus community while maintaining the financial stability of the university. A Hyflex teaching modality has been implemented to allow summer and fall classes to resume as both face to face and online academic opportunities. Additionally, safety guidelines such as face coverings, disinfectant stations, social distancing and signage have been implemented to ensure safety in all academic, administrative, dining and residence hall facilities. Central Michigan University is prepared for and committed to its number one priority of keeping the campus community safe. Operating Budget and Deferred Maintenance The university’s Board of Trustees approved the operating budget for fiscal year 2021 of $428 million. The balanced budget was adjusted to align our expense with our anticipated revenue streams. This includes staffing, supplies and equipment reductions, along with incremental increases to fulfill collective bargaining agreements and other necessary costs. The university models a five-year forecast of its revenue and expense budget. This model is significantly impacted by unpredictable future state appropriations funding, declining levels of Michigan high school graduates causing potential declining enrollment, and modest increases in salary, benefits, and equipment costs. The university remains steadfast in its commitment to achieve operational efficiencies, implement additional cost-saving measures where appropriate, and increase financial aid for our students. With these economic factors in sight, the university is continuing its fiscally conservative approach as good stewards of its available resources. The formal budget and modeling process includes the university’s annual review of the priority needs and requirements for deferred maintenance, technology, renovations, and new construction projects. This comprehensive review allows for systematic prioritization on an institutional basis. Priorities are set based on anticipated future funding, with maintenance related projects having priority over new initiatives. The campus has many deferred maintenance needs as documented in a detailed audit of each building. The current estimate of existing deferred maintenance needs, adjusted for inflation, is $231.94 million, $115.36 million of that is for general fund supported facilities. Starting with fiscal year 1999, the university has dedicated between $4.5 to $7.9 million per year toward addressing these needs annually, with an average allocation of approximately $5.4 million per year for the past 22 years. During fiscal year 2020, the university expended approximately $ 39.0 million on plant related projects. Funding sources included State Building Authority appropriations, gifts, and other university funds. Academic Priorities The university has a longstanding tradition of enhancing student learning and success as well as contributing to the discovery and dissemination of knowledge. Dedicated faculty, committed to leading-edge research and active teaching methodologies, work to grow the wisdom, technological sophistication and creativity of CMU students. As part of our commitment to enhance student success and elevate academic excellence, periodic reviews are conducted in areas of academic structure, academic support services, and academic responsibility centered management budgeting, focused on enhancing the delivery of education. College of Medicine The Central Michigan University College of Medicine (CMED) is the nation’s 137th medical school and was founded to produce high-quality physicians for underserved communities in Michigan. In the 2019-2020 academic year, CMED focused on solidifying and strengthening existing relationships while exploring additional educational opportunities for our students. The number of applicants to CMED continues to expand showing great interest in the program. The matriculating class of 2019 was selected from over 7400 applicants. 11% of the students in the 2019 class represent CMED defined diversity categories that include Hispanic, African American, Native American and medically underserved urban and rural areas of Michigan. 81% of the 2019 class call Michigan home. CMED continued to be successful with their 2019-2020 Match. Match statistics provide evidence that CMED is advancing the mission of the medical school. 75% matched to primary care and 40% matched to a residency program in Michigan.
MANAGEMENT’S DISCUSSION AND ANALYSIS (continued) Central Michigan University
Finan
cial Rep
ort 2020
5
The Accreditation Council of Graduate Medical Education (ACGME) is the body responsible for reviewing and accrediting residency programs (GME). The CMU College of Medicine is the academic sponsor of seven residency programs based at CMU Medical Education Partners (CMEP) in Saginaw. CMEP is a GME consortium and partnership between CMU, Covenant HealthCare and Ascension St. Mary’s. All residency programs including family medicine, internal medicine, emergency medicine, emergency medical services, psychiatry, podiatry, and general surgery are accredited. Leadership from CMEP, CMU, Covenant HealthCare and Ascension St. Mary’s, are engaged with a national consultant to redesign the governance and operational structure of CMEP. As CMEP is the employer of the majority of CMU’s clinical faculty, and represents over two thirds of the College’s budget, the approach toward the reorganization has been thoughtful and strategic. CMED’s continuing medical education (CME) program obtained “Accreditation with Commendation” from the Accreditation Committee for Continuing Medical Education (ACCME) and is the Great Lakes Bay Region’s provider of educational programs for physicians and other healthcare. During the 2019-2020 academic year, the College has worked to engage in strategic clinical affiliations to meet long-term educational and financial needs. The College’s learning and working environment remains strong and the focus has shifted to building ongoing curricular continuous quality improvement that sustains the College’s ability to attract the best students, to recruit and retain faculty, and engage support staff. At their meeting in June 2019, the CMU Board of Trustees approved a 25-year agreement with Covenant Healthcare in Saginaw. The agreement builds on existing relationships between the College of Medicine and Covenant and will be a model for affiliation with other clinical partners in Michigan. To address a gap in educational offerings, CMED affiliated with Children’s Hospital of Michigan and University Pediatrics in Detroit to provide clinical training in Pediatrics and its subspecialties for our students. It is our hope that the relationship can expand to include research and other academic collaborations. Student Recruitment and Retention The Student Recruitment and Retention (SRR) Division, formed June 1, 2020, provides strategic leadership for the university’s recruitment and retention efforts in support of fulfilling CMU’s vision and strategic priorities. The division consists of Admissions, Career Development Center, the Registrar’s office, Scholarships and Financial Aid, and the Office of Student Support. Student recruitment and retention is dependent upon data-informed strategic planning. In the profession, it is often referred to as enrollment management and is an iterative process that includes active participation by the university community. A Strategic Enrollment Management (SEM) Plan is developed and updated regularly to coincide with the timing and goals of the university’s Strategic Plan as well as in response to the opportunities and challenges presented in the market. The SEM Plan provides a roadmap for intentional efforts and initiatives to both strategically and tactically achieve enrollment goals. Continuous input is used from a broad contingent across the university to assess the appropriateness and effectiveness of the Plan’s goals and objectives. This year was marked by transitions. Transitions in leadership, splitting of the former division of Enrollment and Student Success into two divisions; SRR and Student Affairs, and transitions brought on by the COVID-19 global pandemic. The SRR division quickly changed course by creating online and virtual new student orientation programs, virtual campus visits for prospective students, and virtual employer fairs along with online career counseling appointments. We also implemented a new scholarship database and a new, more informative financial aid award letter. The Registrar was instrumental in getting the multi-semester registration system developed and implemented, providing students with an improved academic planning tool. The university also changed the following recruitment strategy and tactics: implemented territory management, reaching out to students earlier in high school to build affinity, and expanding national and international reach by becoming a member of The Common Application for the Fall 2020 admission cycle. Looking forward, our biggest and most impactful project will be the selection and implementation of a new Customer Relationship Management (CRM) system. We are also engaged in work to decrease our tuition discount rate.
MANAGEMENT’S DISCUSSION AND ANALYSIS (continued) Central Michigan University
Finan
cial Rep
ort 2020
6
The university continues to evaluate opportunities to diversify its revenue streams by identifying audiences for traditional programming and alternative professional development/training, revising pricing strategies, and leveraging auxiliary enterprises. These efforts help to make sure that the university remains solvent and is well positioned to proactively respond to trends, environmental influences, and the continued shift within the university’s target audiences. Campus Master Plan and Campus Identity Project
The Campus Master Plan ensures that CMU’s campus and facilities align with the Imperatives, Strategies and Targets updated by the 2017- 2022 Strategic Planning Team, accelerating learning and enhancing the success of CMU students. The Campus Master Plan includes a facilities condition assessment, infrastructure assessment, and land use plan. It also includes a space utilization study, bench marked against similar universities. This comprehensive evaluation of the campus and facilities provides information that guides our investment in new facilities, major renovations, and deferred maintenance.
The goal of the Campus Identity Project was to create a campus with an engaging outdoor environment, clear borders, effective signage, and simplified yet strategic landscaping. The landscape will reflect a strong sense of academic impact, with walkways and open spaces that inspire and connect all who visit, study, work, and live here. Implementation of the plan was postponed in 2020 due to the COVID-19 global pandemic.
The Campus Master Plan and Campus Identity Project provides strategic guidance identifying and prioritizing capital and deferred maintenance projects across campus. Together the two initiatives have guided decision making on capital project placement including pedestrian and motorized vehicle access. The Capital Plan, created in 2013, was updated in 2017 to continue the alignment of CMU's investment in facilities with the Strategic Plan.
CMU Research Corporation
Central Michigan University Research Corporation (CMURC) is a professional coworking space with accelerator programs focused on product and strategic development for entrepreneurs to positively impact the economy in the Great Lakes Bay Region. The organization is a single point of contact for startups and established businesses who want to harness the intellectual, technological, and material resources of Central Michigan University to grow their ideas and businesses. Created nearly two decades ago, it brings together local, regional and statewide partners to accelerate the success of entrepreneurs, growing businesses, and jobs by leveraging the resources of Central Michigan University, the Mount Pleasant SmartZone, and the Michigan Economic Development Corporation’s 21st Century Jobs Trust Fund. Recognized as one of the top Michigan SmartZones, CMURC expanded from the Mount Pleasant location to open three new facilities: Uptown Bay City in March 2017, Riverfront Saginaw in September 2018 , and Midland in 2020. This venture demonstrates that CMU is a community partner in spurring economic development activities to graduate and retain more Michigan residents and improve our state’s economy and future development. USING THE ANNUAL REPORT The university’s financial report includes three financial statements: the Statements of Net Position, the Statements of Revenues, Expenses and Changes in Net Position, and the Statements of Cash Flows. These financial statements are prepared in accordance with the Governmental Accounting Standards Board (GASB) Statements. STATEMENTS OF NET POSITION The Statements of Net Position include all assets and liabilities. The Statements of Net Position are prepared under the accrual basis of accounting, whereby revenues and assets are recognized when the services or goods/products are provided and expenses and liabilities are recognized when others provide the service or product, regardless of when cash is exchanged. Net position, consisting of the net amount
MANAGEMENT’S DISCUSSION AND ANALYSIS (continued) Central Michigan University
Finan
cial Rep
ort 2020
7
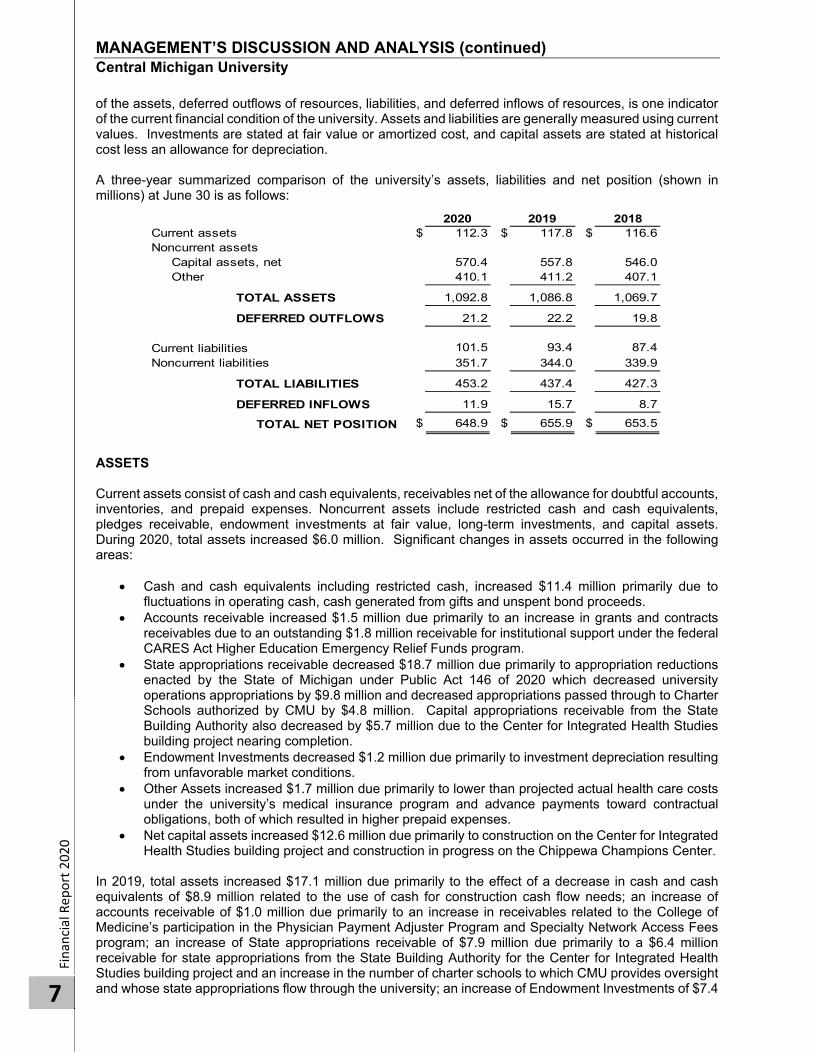
of the assets, deferred outflows of resources, liabilities, and deferred inflows of resources, is one indicator of the current financial condition of the university. Assets and liabilities are generally measured using current values. Investments are stated at fair value or amortized cost, and capital assets are stated at historical cost less an allowance for depreciation. A three-year summarized comparison of the university’s assets, liabilities and net position (shown in millions) at June 30 is as follows:
ASSETS Current assets consist of cash and cash equivalents, receivables net of the allowance for doubtful accounts, inventories, and prepaid expenses. Noncurrent assets include restricted cash and cash equivalents, pledges receivable, endowment investments at fair value, long-term investments, and capital assets. During 2020, total assets increased $6.0 million. Significant changes in assets occurred in the following areas:
Cash and cash equivalents including restricted cash, increased $11.4 million primarily due to fluctuations in operating cash, cash generated from gifts and unspent bond proceeds.
Accounts receivable increased $1.5 million due primarily to an increase in grants and contracts receivables due to an outstanding $1.8 million receivable for institutional support under the federal CARES Act Higher Education Emergency Relief Funds program.
State appropriations receivable decreased $18.7 million due primarily to appropriation reductions enacted by the State of Michigan under Public Act 146 of 2020 which decreased university operations appropriations by $9.8 million and decreased appropriations passed through to Charter Schools authorized by CMU by $4.8 million. Capital appropriations receivable from the State Building Authority also decreased by $5.7 million due to the Center for Integrated Health Studies building project nearing completion.
Endowment Investments decreased $1.2 million due primarily to investment depreciation resulting from unfavorable market conditions.
Other Assets increased $1.7 million due primarily to lower than projected actual health care costs under the university’s medical insurance program and advance payments toward contractual obligations, both of which resulted in higher prepaid expenses.
Net capital assets increased $12.6 million due primarily to construction on the Center for Integrated Health Studies building project and construction in progress on the Chippewa Champions Center.
In 2019, total assets increased $17.1 million due primarily to the effect of a decrease in cash and cash equivalents of $8.9 million related to the use of cash for construction cash flow needs; an increase of accounts receivable of $1.0 million due primarily to an increase in receivables related to the College of Medicine’s participation in the Physician Payment Adjuster Program and Specialty Network Access Fees program; an increase of State appropriations receivable of $7.9 million due primarily to a $6.4 million receivable for state appropriations from the State Building Authority for the Center for Integrated Health Studies building project and an increase in the number of charter schools to which CMU provides oversight and whose state appropriations flow through the university; an increase of Endowment Investments of $7.4
2020 2019 2018Current assets $ 112.3 $ 117.8 $ 116.6Noncurrent assets
Capital assets, net 570.4 557.8 546.0Other 410.1 411.2 407.1
TOTAL ASSETS 1,092.8 1,086.8 1,069.7
DEFERRED OUTFLOWS 21.2 22.2 19.8
Current liabilities 101.5 93.4 87.4Noncurrent liabilities 351.7 344.0 339.9
TOTAL LIABILITIES 453.2 437.4 427.3
DEFERRED INFLOWS 11.9 15.7 8.7
TOTAL NET POSITION $ 648.9 $ 655.9 $ 653.5
MANAGEMENT’S DISCUSSION AND ANALYSIS (continued) Central Michigan University
Finan
cial Rep
ort 2020
8
million due primarily to investment appreciation due to favorable market conditions and donor gifts; a decrease of other Long-Term Investments of $4.2 million due primarily to capital needs net of favorable market conditions and an increase in net capital assets of $11.8 million due primarily to construction in progress on the Center for Health Studies building project, Chippewa Champions Center and Residence Life facilities improvements.
Capital Assets
At June 30, 2020, the university had $1.045 billion invested in capital assets and accumulated depreciation of $475 million. Depreciation totaled $27.7 million for the current fiscal year compared to $26.9 million last year. Refer to Note 5 to the financial statements for details regarding capital assets.
The university had three significant projects in progress as of June 30, 2020:
Chippewa Champions Center ($22.2 million of construction in progress). The $32.5 million projectincludes the design and construction of a new facility at the north end of Kelly/Shorts Stadium andthe design and installation of a new video board at the south end of Kelly/Shorts Stadium. The newvideo board was in-service and capitalized as of June 30, 2020. The new facility will house footballoperations, a weight room and locker rooms, and will provide student training opportunities withsports medicine, strength and conditioning labs, a nutrition and fueling station and a hydrotherapycenter.
Carey Residence Hall Remodeling project ($1.7 million of construction in progress). The $4.8million project includes newly upgraded suites designed to accommodate two students, electricaland life safety infrastructure upgrades, and interior and exterior renovations.
Upgrade of a 1250 Ton Absorber located in the Central Energy Facility ($1.6 million of constructionin progress). The project includes replacement of the existing absorber.
The university has three significant projects that were placed in-service and capitalized as of June 30, 2020:
Center for Integrated Health Studies was completed in November 2019 and accounted for $22million in capitalized expenditures. The project included approximately 62,000 square feet of spaceand is located in the university’s health professions corridor. Students in the program will be part ofa patient-centered medical home model that emphasizes the teamwork needed among all healthcare professionals.
Various Residence Life Facilities Infrastructure Improvements were completed and accounted for$5.3 million in capitalized expenditures. The project includes upgrades and improvements to theNorth Community Residence Halls, including electrical and life safety infrastructure upgrades andinterior and exterior renovations, and East, South and Towers Residence Halls infrastructureupgrades and improvements.
Design and installation of a new video board at the south end of Kelly/Shorts Stadium wascompleted and accounted for $1.8 million in capitalized expenditures.
In 2019, capital assets increased $11.8 million due to a net increase of $38.7 million in capitalized costs primarily in the areas of construction in progress, buildings, land improvements, and equipment less $26.9 million in depreciation.
Endowment and Pooled Operating Investments
During 2020, endowment investments decreased $1.2 million, and pooled operating investments decreased by $0.8 million. The endowment and operating decreases are a result of investment depreciation due to unfavorable market conditions amid the COVID-19 global pandemic. Investment income for 2020 within both investment portfolios is comprised of a $4.7 million increase in market value, $4.1 million of investment income net of financial fees, and $2.1 million realized gain from the sale of long-term investments. Earnings distributed from endowments for scholarships and fellowships totaled $7.7 million. This spending distribution was offset by gifts received for endowments of $2.2 million and a change in cash on hand in the endowment of $0.3 million.
During 2019, endowment investments increased $7.4 million, and pooled operating investments decreased by $4.2 million. The endowment increase was a result of investment appreciation due to favorable market
MANAGEMENT’S DISCUSSION AND ANALYSIS (continued) Central Michigan University
Finan
cial Rep
ort 2020
9
conditions and donor gifts. The pooled operating decrease was a result of capital needs net of favorable market conditions. Investment income for 2019 within both investment portfolios was comprised of a $3.6 million increase in market value, $7.5 million of investment income net of financial fees, and $8.5 million realized gain from the sale of long-term investments. Earnings distributed from endowments for scholarships and fellowships totaled $6.5 million. The spending distribution was offset by gifts received for endowments of $3.4 million and a change in cash on hand in the endowment of $0.3 million.
DEFERRED OUTFLOWS During 2020, deferred outflows decreased by $1.0 million due primarily to a $1.1 million change in the market value position of hedging derivatives on variable rate debt reducing the deferral of expense, offset by increases in deferral of expense of $1.2 million and $0.7 million primarily related to changes in assumptions in the valuations of the university’s proportionate share of the Michigan Public School Employee’s Retirement System (MPSERS) plan net pension and Other Post Employment Benefits (OPEB) liabilities, respectively. During 2019, deferred outflows increased by $2.4 million due primarily to a $1.0 million change in market value position of hedging derivatives on variable rate debt reducing the deferral of expense and an increase of $1.3 million deferral of expense related to changes in assumptions to the Michigan Public School Employee’s Retirement System (MPSERS) plan net OPEB liability. Refer to Note 9 to the financial statements for detail regarding the MPSERS plan. LIABILITIES Current liabilities consist of accounts payable, unearned revenue, deposits, and the current portion of the long-term obligations payable within the next twelve months. During 2020, current liabilities increased $8.1 million. Significant changes in current liabilities occurred in the following areas as of June 30, 2020:
Accrued payables to vendors increased $5.6 million due primarily to a $6.9 million increase in the amount due to medical partners participating with the College of Medicine in the Physician Payment Adjuster Program and Specialty Network Access Fees program.
Accrued payables to charter schools decreased $3.5 million due primarily to appropriation reductions enacted by the State of Michigan under Public Act 146 of 2020 which decreased appropriations due to Charter Schools authorized by CMU.
During 2019, current liabilities increased $6.0 million primarily due to accrued payables to vendors increasing $5.2 million due to the construction project related payables primarily for the Center for Integrated Health Studies, Chippewa Champion Center and Residence Life Facilities improvements; and accrued payables to charter schools increasing $1.2 million due to an increase in the number of charter schools to which CMU provides oversight and related increases in state aid. Noncurrent liabilities consist of long-term debt and other obligations for which the principal is due more than one year from the balance sheet date and net pension and OPEB obligations for the MPSERS retirement plan. Also included is the Retirement Service Award program, accrued compensated absences, and bonded debt. Refer to Note 7 to the financial statements for the detail regarding the change in long-term debt, hedging instruments, and other obligations. During 2020, noncurrent liabilities increased $7.7 million. Significant changes in noncurrent liabilities occurred in the following areas as of June 30, 2020:
Debt service of $6.1 million was recorded on outstanding bond and note principal, and premium amortization.
Issued $10.8 million in new bonds and $14.6 million in bonds to refinance $16.6 million in bonds previously issued in 2009.
Market value of hedging derivatives increased by $1.1 million. Recorded $8.1 million in additional net pension liability for unfunded obligations to the Michigan
Public School Employee’s Retirement System (MPSERS) plan. Recorded a $6.7 million decrease in net OPEB liability for unfunded obligations to the Michigan
Public School Employee’s Retirement System (MPSERS) plan.
MANAGEMENT’S DISCUSSION AND ANALYSIS (continued) Central Michigan University
Finan
cial Rep
ort 2020
10
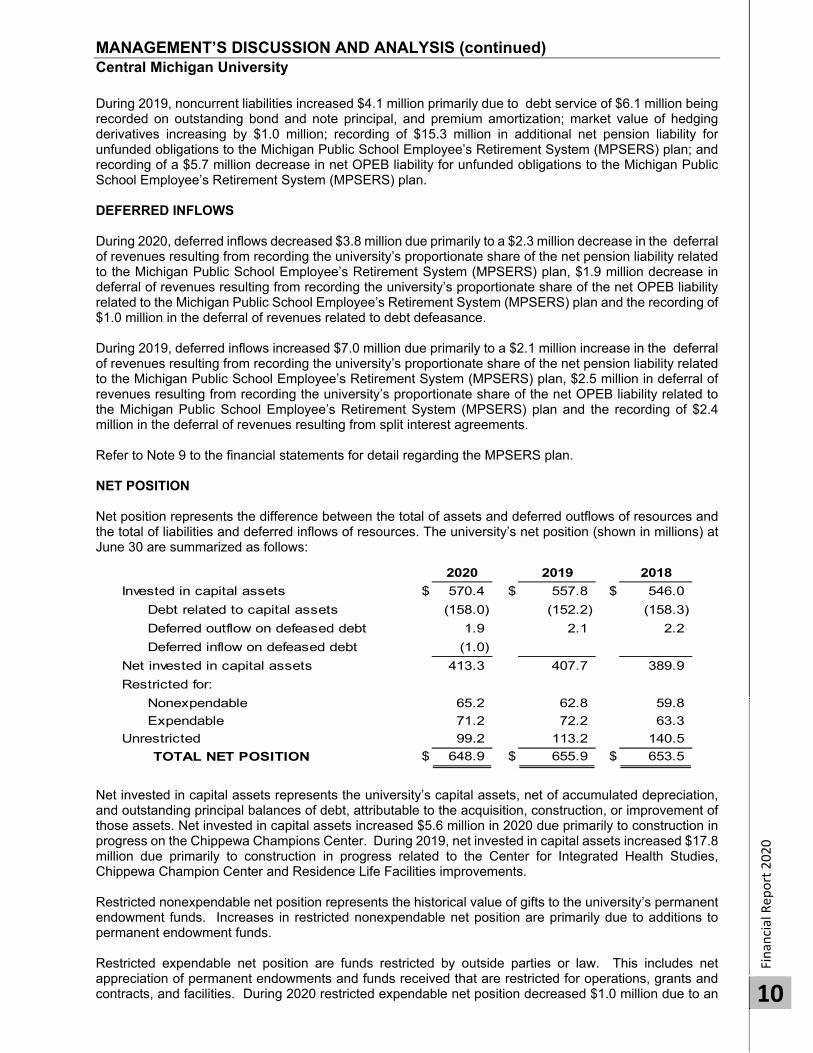
During 2019, noncurrent liabilities increased $4.1 million primarily due to debt service of $6.1 million being recorded on outstanding bond and note principal, and premium amortization; market value of hedging derivatives increasing by $1.0 million; recording of $15.3 million in additional net pension liability for unfunded obligations to the Michigan Public School Employee’s Retirement System (MPSERS) plan; and recording of a $5.7 million decrease in net OPEB liability for unfunded obligations to the Michigan Public School Employee’s Retirement System (MPSERS) plan. DEFERRED INFLOWS During 2020, deferred inflows decreased $3.8 million due primarily to a $2.3 million decrease in the deferral of revenues resulting from recording the university’s proportionate share of the net pension liability related to the Michigan Public School Employee’s Retirement System (MPSERS) plan, $1.9 million decrease in deferral of revenues resulting from recording the university’s proportionate share of the net OPEB liability related to the Michigan Public School Employee’s Retirement System (MPSERS) plan and the recording of $1.0 million in the deferral of revenues related to debt defeasance. During 2019, deferred inflows increased $7.0 million due primarily to a $2.1 million increase in the deferral of revenues resulting from recording the university’s proportionate share of the net pension liability related to the Michigan Public School Employee’s Retirement System (MPSERS) plan, $2.5 million in deferral of revenues resulting from recording the university’s proportionate share of the net OPEB liability related to the Michigan Public School Employee’s Retirement System (MPSERS) plan and the recording of $2.4 million in the deferral of revenues resulting from split interest agreements. Refer to Note 9 to the financial statements for detail regarding the MPSERS plan. NET POSITION Net position represents the difference between the total of assets and deferred outflows of resources and the total of liabilities and deferred inflows of resources. The university’s net position (shown in millions) at June 30 are summarized as follows:
Net invested in capital assets represents the university’s capital assets, net of accumulated depreciation, and outstanding principal balances of debt, attributable to the acquisition, construction, or improvement of those assets. Net invested in capital assets increased $5.6 million in 2020 due primarily to construction in progress on the Chippewa Champions Center. During 2019, net invested in capital assets increased $17.8 million due primarily to construction in progress related to the Center for Integrated Health Studies, Chippewa Champion Center and Residence Life Facilities improvements. Restricted nonexpendable net position represents the historical value of gifts to the university’s permanent endowment funds. Increases in restricted nonexpendable net position are primarily due to additions to permanent endowment funds. Restricted expendable net position are funds restricted by outside parties or law. This includes net appreciation of permanent endowments and funds received that are restricted for operations, grants and contracts, and facilities. During 2020 restricted expendable net position decreased $1.0 million due to an
2020 2019 2018
Invested in capital assets $ 570.4 $ 557.8 $ 546.0
Debt related to capital assets (158.0) (152.2) (158.3)
Deferred outflow on defeased debt 1.9 2.1 2.2
Deferred inflow on defeased debt (1.0)
Net invested in capital assets 413.3 407.7 389.9
Restricted for:
Nonexpendable 65.2 62.8 59.8
Expendable 71.2 72.2 63.3
Unrestricted 99.2 113.2 140.5
TOTAL NET POSITION $ 648.9 $ 655.9 $ 653.5
MANAGEMENT’S DISCUSSION AND ANALYSIS (continued) Central Michigan University
Finan
cial Rep
ort 2020
11
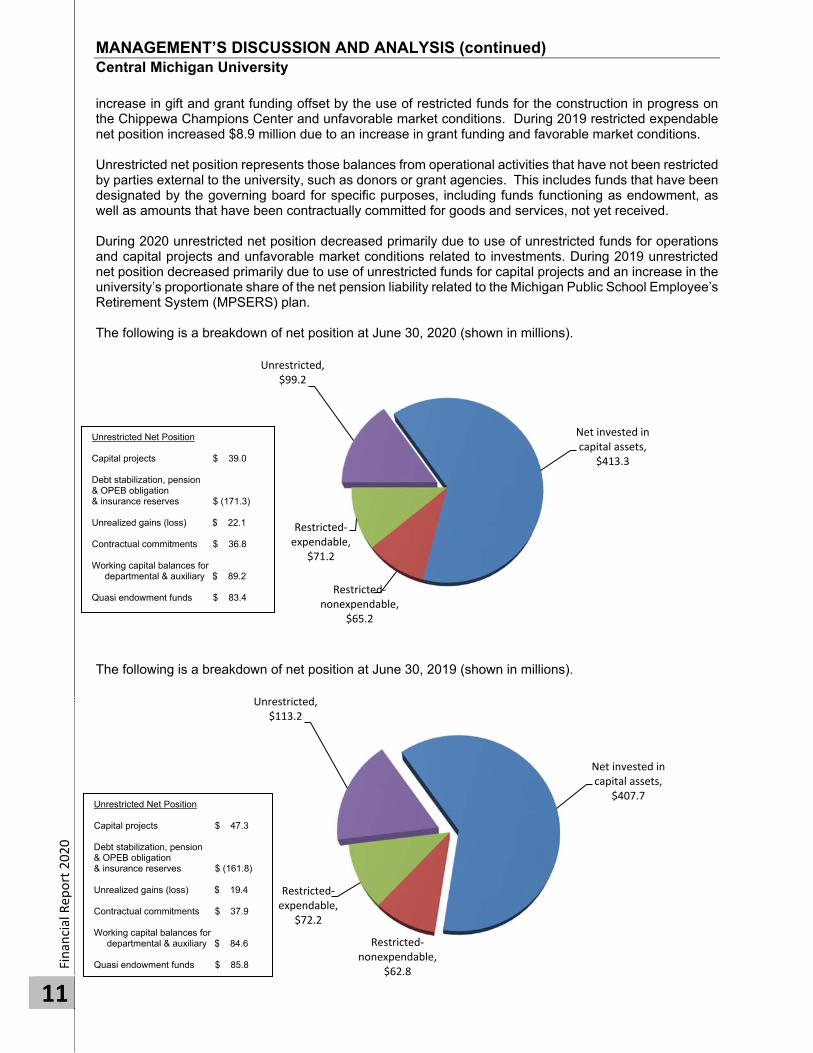
increase in gift and grant funding offset by the use of restricted funds for the construction in progress on the Chippewa Champions Center and unfavorable market conditions. During 2019 restricted expendable net position increased $8.9 million due to an increase in grant funding and favorable market conditions. Unrestricted net position represents those balances from operational activities that have not been restricted by parties external to the university, such as donors or grant agencies. This includes funds that have been designated by the governing board for specific purposes, including funds functioning as endowment, as well as amounts that have been contractually committed for goods and services, not yet received. During 2020 unrestricted net position decreased primarily due to use of unrestricted funds for operations and capital projects and unfavorable market conditions related to investments. During 2019 unrestricted net position decreased primarily due to use of unrestricted funds for capital projects and an increase in the university’s proportionate share of the net pension liability related to the Michigan Public School Employee’s Retirement System (MPSERS) plan. The following is a breakdown of net position at June 30, 2020 (shown in millions).
The following is a breakdown of net position at June 30, 2019 (shown in millions).
Net invested in capital assets,
$413.3
Restricted‐nonexpendable,
$65.2
Restricted‐expendable,
$71.2
Unrestricted, $99.2
Net invested in capital assets,
$407.7
Restricted‐nonexpendable,
$62.8
Restricted‐expendable,
$72.2
Unrestricted, $113.2
Unrestricted Net Position Capital projects $ 39.0 Debt stabilization, pension & OPEB obligation & insurance reserves $ (171.3) Unrealized gains (loss) $ 22.1 Contractual commitments $ 36.8 Working capital balances for departmental & auxiliary $ 89.2 Quasi endowment funds $ 83.4
Unrestricted Net Position Capital projects $ 47.3 Debt stabilization, pension & OPEB obligation & insurance reserves $ (161.8) Unrealized gains (loss) $ 19.4 Contractual commitments $ 37.9 Working capital balances for departmental & auxiliary $ 84.6 Quasi endowment funds $ 85.8
MANAGEMENT’S DISCUSSION AND ANALYSIS (continued) Central Michigan University
Finan
cial Rep
ort 2020
12
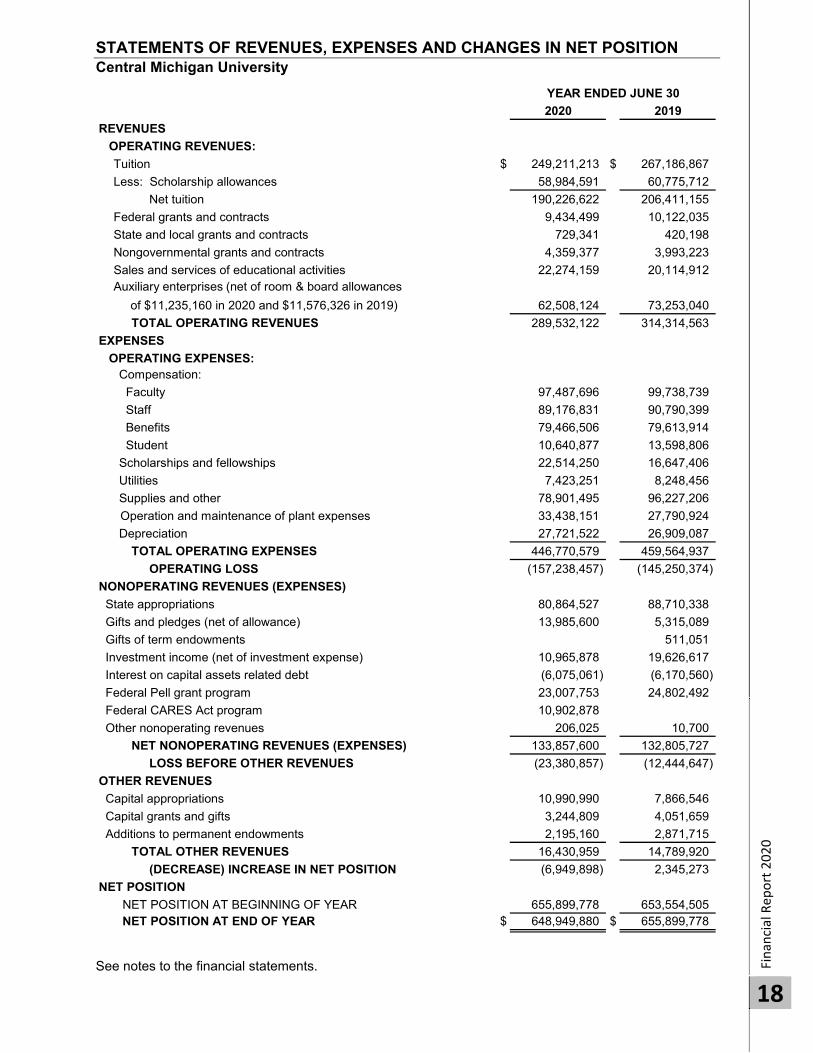
STATEMENTS OF REVENUES, EXPENSES AND CHANGES IN NET POSITION
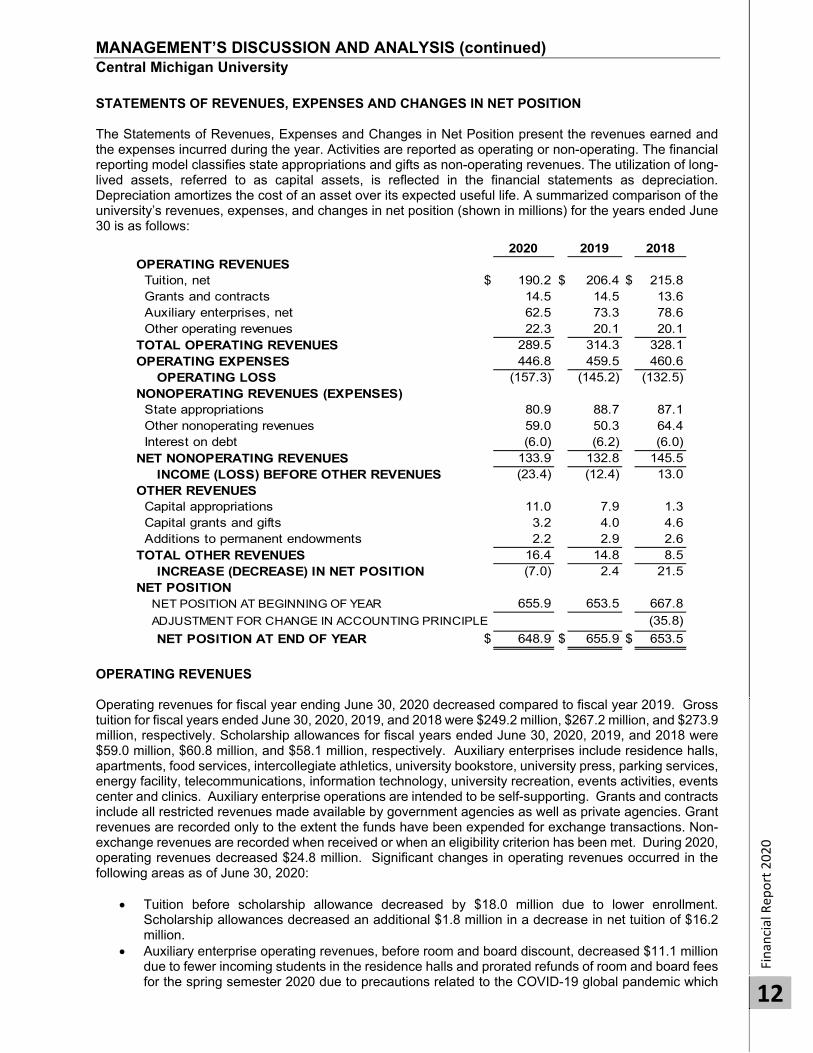
The Statements of Revenues, Expenses and Changes in Net Position present the revenues earned and the expenses incurred during the year. Activities are reported as operating or non-operating. The financial reporting model classifies state appropriations and gifts as non-operating revenues. The utilization of long-lived assets, referred to as capital assets, is reflected in the financial statements as depreciation. Depreciation amortizes the cost of an asset over its expected useful life. A summarized comparison of the university’s revenues, expenses, and changes in net position (shown in millions) for the years ended June 30 is as follows:
OPERATING REVENUES
Operating revenues for fiscal year ending June 30, 2020 decreased compared to fiscal year 2019. Gross tuition for fiscal years ended June 30, 2020, 2019, and 2018 were $249.2 million, $267.2 million, and $273.9 million, respectively. Scholarship allowances for fiscal years ended June 30, 2020, 2019, and 2018 were $59.0 million, $60.8 million, and $58.1 million, respectively. Auxiliary enterprises include residence halls, apartments, food services, intercollegiate athletics, university bookstore, university press, parking services, energy facility, telecommunications, information technology, university recreation, events activities, events center and clinics. Auxiliary enterprise operations are intended to be self-supporting. Grants and contracts include all restricted revenues made available by government agencies as well as private agencies. Grant revenues are recorded only to the extent the funds have been expended for exchange transactions. Non-exchange revenues are recorded when received or when an eligibility criterion has been met. During 2020, operating revenues decreased $24.8 million. Significant changes in operating revenues occurred in the following areas as of June 30, 2020:
Tuition before scholarship allowance decreased by $18.0 million due to lower enrollment.Scholarship allowances decreased an additional $1.8 million in a decrease in net tuition of $16.2million.
Auxiliary enterprise operating revenues, before room and board discount, decreased $11.1 milliondue to fewer incoming students in the residence halls and prorated refunds of room and board feesfor the spring semester 2020 due to precautions related to the COVID-19 global pandemic which
2020 2019 2018OPERATING REVENUES Tuition, net $ 190.2 $ 206.4 $ 215.8
Grants and contracts 14.5 14.5 13.6 Auxiliary enterprises, net 62.5 73.3 78.6
Other operating revenues 22.3 20.1 20.1 TOTAL OPERATING REVENUES 289.5 314.3 328.1 OPERATING EXPENSES 446.8 459.5 460.6 OPERATING LOSS (157.3) (145.2) (132.5)
State appropriations 80.9 88.7 87.1 Other nonoperating revenues 59.0 50.3 64.4 Interest on debt (6.0) (6.2) (6.0)
NET NONOPERATING REVENUES 133.9 132.8 145.5 (23.4) (12.4) 13.0
OTHER REVENUES Capital appropriations 11.0 7.9 1.3
Capital grants and gifts 3.2 4.0 4.6 Additions to permanent endowments 2.2 2.9 2.6 TOTAL OTHER REVENUES 16.4 14.8 8.5 INCREASE (DECREASE) IN NET POSITION (7.0) 2.4 21.5 NET POSITION NET POSITION AT BEGINNING OF YEAR 655.9 653.5 667.8
ADJUSTMENT FOR CHANGE IN ACCOUNTING PRINCIPLE (35.8)
NET POSITION AT END OF YEAR $ 648.9 $ 655.9 $ 653.5
NONOPERATING REVENUES (EXPENSES)
INCOME (LOSS) BEFORE OTHER REVENUES
MANAGEMENT’S DISCUSSION AND ANALYSIS (continued) Central Michigan University
Finan
cial Rep
ort 2020
13
limited service in the residence halls and dining facilities starting in March 2020. A decrease in room and board allowance resulted in an overall decrease of $10.8 million.
During 2019, tuition before scholarship allowance decreased by $6.7 million due to lower enrollment and a student services fee increase, however a $2.7 million increase in scholarship allowances resulted in a decrease in net tuition of $9.4 million. Grants and contracts operating revenues increased $0.9 million. Auxiliary enterprise operating revenues, before room and board discount, decreased $6.5 million primarily due to fewer incoming students in the residence halls. A decrease in room and board allowance resulted in an overall decrease of $5.3 million.
OPERATING EXPENSES
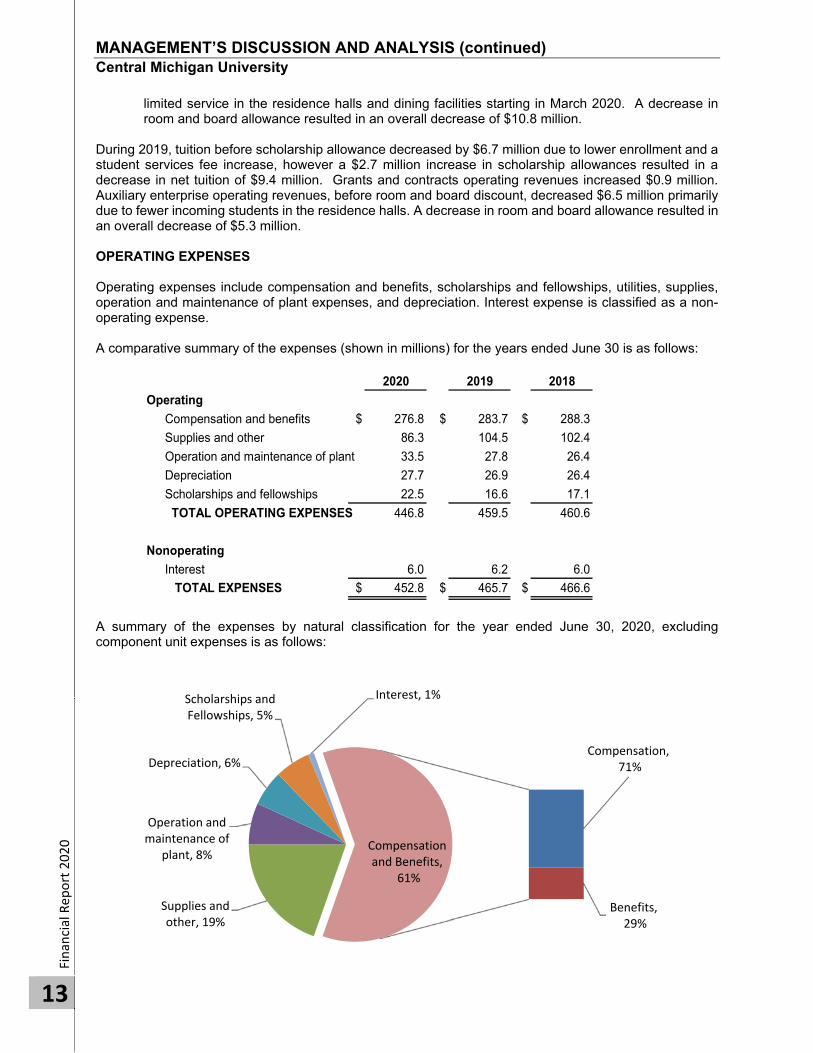
Operating expenses include compensation and benefits, scholarships and fellowships, utilities, supplies, operation and maintenance of plant expenses, and depreciation. Interest expense is classified as a non-operating expense.
A comparative summary of the expenses (shown in millions) for the years ended June 30 is as follows:
2020 2019 2018
Operating
Compensation and benefits $ 276.8 $ 283.7 $ 288.3
Supplies and other 86.3 104.5 102.4
Operation and maintenance of plant 33.5 27.8 26.4
Depreciation 27.7 26.9 26.4
Scholarships and fellowships 22.5 16.6 17.1
TOTAL OPERATING EXPENSES 446.8 459.5 460.6
Nonoperating
Interest 6.0 6.2 6.0
TOTAL EXPENSES $ 452.8 $ 465.7 $ 466.6
A summary of the expenses by natural classification for the year ended June 30, 2020, excluding component unit expenses is as follows:
Compensation,71%
Benefits,29%
Supplies and other, 19%
Operation and maintenance of
plant, 8%
Depreciation, 6%
Scholarships and Fellowships, 5%
Interest, 1%
Compensation and Benefits,
61%

MANAGEMENT’S DISCUSSION AND ANALYSIS (continued) Central Michigan University
Finan
cial Rep
ort 2020
14
Significant changes in operating expenses occurred in the following areas as of June 30, 2020:
Compensation and benefit expenses decreased $6.9 million. Of this decrease, the university
compensation decreased 3.3% and benefits decreased 0.2%. The change in compensation and benefits primarily resulted from a decrease in the number of filled faculty and staff positions and a significant decrease in student compensation of $3.0 million primarily in the spring semester 2020 due to precautions related to the COVID-19 global pandemic which severely limited available positions and the ability of students to continue working starting in March 2020.
Supplies and Other decreased $18.2 million due primarily to a $13.5 million net decrease in expense to support the unfunded portion of the Michigan Public School Employee’s Retirement System (MPSERS) pension and OPEB plan as well as reductions in expenses in the auxiliary units caused by closures due to precautions related to the COVID-19 global pandemic during the spring and summer 2020 semesters which limited service in the residence halls and dining facilities and cancelled most university events, conferences, camps and university recreation services starting in March 2020.
Operation and maintenance of plant expenses increased $5.7 million due primarily to substantial cosmetic renovations to several residence halls, final clean up and redevelopment of the Barnes Hall site as green space and furnishings, equipment and technology expenses related to placing the Center for Integrated Health Studies building in service.
Scholarship and Fellowship expenses increased $5.9 million due primarily to the awarding of $5.7 million of student aid in accordance with the federal CARES Act Higher Education Emergency Relief Funds program.
During 2019, compensation and benefit expenses decreased $4.5 million. Of this decrease, the university compensation decreased 0.9% and benefits decreased 3.3%. The change in compensation and benefits primarily resulted from a decrease in the number of filled faculty, staff and student positions offset by a modest compensation increase and the effect of the university’s contribution to the employee health care premium cost share remaining flat compared to prior year. Supplies and Other increased $2.1 million due primarily to a $6.4 million net increase in expense to support the unfunded portion of the Michigan Public School Employee’s Retirement System (MPSERS) pension and OPEB plan, offset by recording an increase of $2.6 million in prepaid expenses primarily driven by timing of library acquisitions and overall planned expense reductions due to budget constraints caused by lower enrollment. Operation and maintenance of plant expenses increased $1.4 million due primarily to expensing the residual asset balance related to the demolition of Barnes Hall and the scoreboard structure in Kelly Shorts stadium. A comparative summary of the expenses by functional classification (shown in millions) for the years ended June 30 is as follows:
Instruction $ 139.7 31 % $ 145.6 31 % $ 149.2 32 %
Research 16.0 4 15.6 3 14.4 3
Public Service 17.4 4 16.9 4 17.5 4
Academic Support 49.4 11 48.8 10 50.0 11
Student Services 23.9 5 24.3 5 25.8 5
Institutional Support 35.9 8 35.9 8 35.6 8
Scholarships and Fellowships 18.7 4 12.7 3 16.9 3
Operation and Maintenance of Plant 33.5 7 27.8 6 26.4 6
Auxiliary Services 85.5 19 92.6 20 92.2 20
Depreciation 27.7 6 26.9 6 26.4 6
Other (1.0) 0 12.4 3 6.2 1
Interest Expense 6.1 1 6.2 1 6.0 1 Total Expenses by Function $ 452.8 100 % $ 465.7 100 % $ 466.6 100 %
Note: Component unit expenses are not shown on the above report.
2020 2019 2018

MANAGEMENT’S DISCUSSION AND ANALYSIS (continued) Central Michigan University
Finan
cial Rep
ort 2020
15
Significant changes in functional expenses occurred in the following areas as of June 30, 2020:
Instructional expenses decreased $5.9 million due primarily to planned cost reductions related to lower enrollment including a decrease in the number of filled faculty positions and a corresponding decrease in instructional supplies and equipment spending.
Scholarships and Fellowship expenses increased $6.0 million primarily due to the awarding of $5.7 million of student aid in accordance with the federal CARES Act Higher Education Emergency Relief Funds program.
Operation and maintenance of plant expenses increased $5.7 million due primarily to substantial cosmetic renovations to several residence halls, final clean up and redevelopment of the Barnes Hall site as green space and furnishings, equipment and technology expenses related to placing the Center for Integrated Health Studies building in service.
Auxiliary Enterprises decreased $7.1 million primarily due to precautions taken related to the COVID-19 global pandemic during the spring and summer 2020 semesters which limited service in the residence halls and dining facilities and cancelled most university events, conferences, camps and recreation services starting in March 2020.
Other expenses decreased $13.4 million primarily due changes in the unfunded portion of the MPSERS net pension and net OPEB liability.
During 2019, instructional expenses decreased $3.6 million due primarily to planned cost reductions related to lower enrollment including a decrease in the number of filled faculty positions and a corresponding decrease in instructional supplies and equipment spending. Research expenses increased $1.2 million primarily due to increased compensation and supplies and equipment expense on sponsored projects. Academic Support decreased $1.2 million due primarily to recognizing a sizeable amount of prepaid expense for library subscription and publication materials. Scholarships and Fellowship expenses decreased $4.2 million primarily due to student aid expenses being supported by auxiliary units and other functional categories. NON-OPERATING REVENUES (EXPENSES) Non-operating revenues (expenses) consist of state appropriations, gifts and pledges (net of allowance), investment income including realized gains and losses, Federal Pell grant program, Federal CARES Act Higher Education Emergency Relief Funds program and other non-operating revenues less interest on debt-financed capital assets. Significant changes in non-operating revenues (expenses) occurred in the following areas as of June 30, 2020:
State Appropriations decreased $7.8 million primarily due to appropriation reductions enacted by the State of Michigan under Public Act 146 of 2020 which decreased university operations appropriations by $9.8 million.
Gifts and pledges (net of allowance) increased $8.2 million primarily due to gifts and contributions from donors.
Investment income decreased $8.7 million due to less favorable market conditions than the prior year.
Federal CARES Act program revenue increased $10.9 million due to new funding awarded under the Federal CARES Act Higher Education Emergency Relief Funds program.
During 2019, gifts and pledges (net of allowance) decreased $2.6 million primarily due to fewer donations towards operating initiatives. Investment income decreased $9.9 million due to less favorable market conditions than the prior year. OTHER REVENUES Other revenues consist of capital appropriations and capital grants and gifts, including pledges and additions to permanent endowments. A gift received by the university, where a donor has specified that only the investment earnings from that gift can be expended for the purpose designated by the donor, is classified as a permanent endowment. The principal cannot be expended. Endowment gifts do not include
MANAGEMENT’S DISCUSSION AND ANALYSIS (continued) Central Michigan University
Finan
cial Rep
ort 2020
16
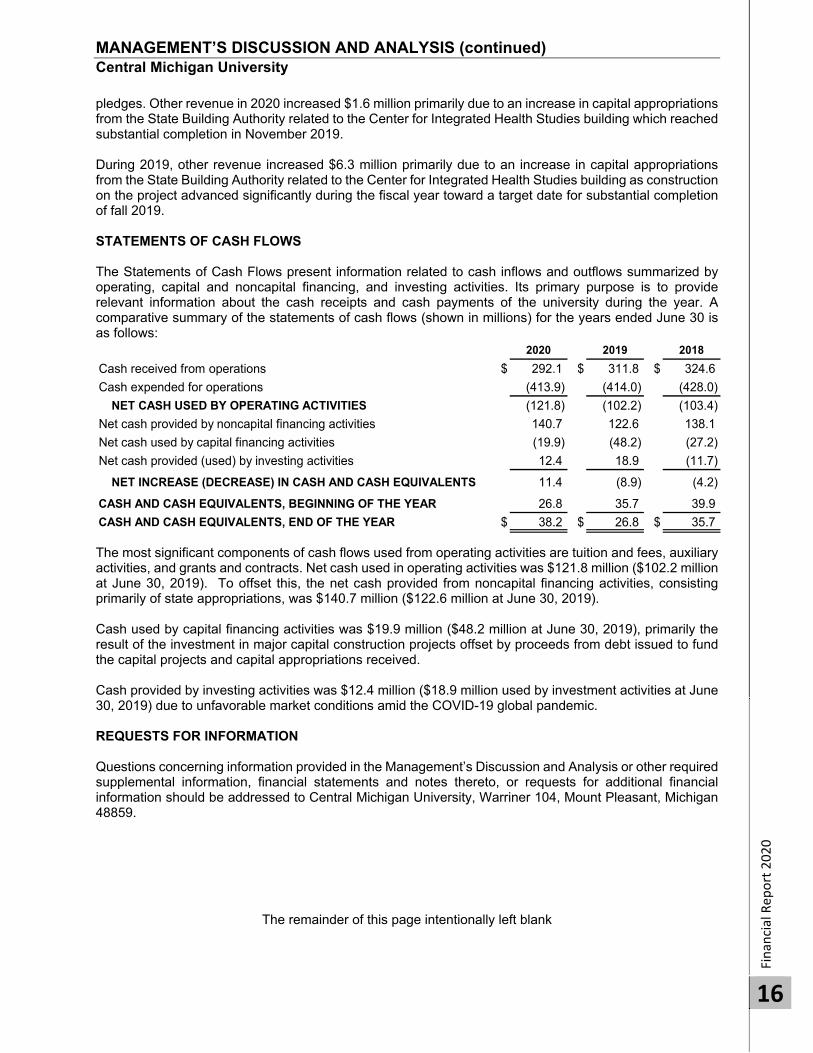
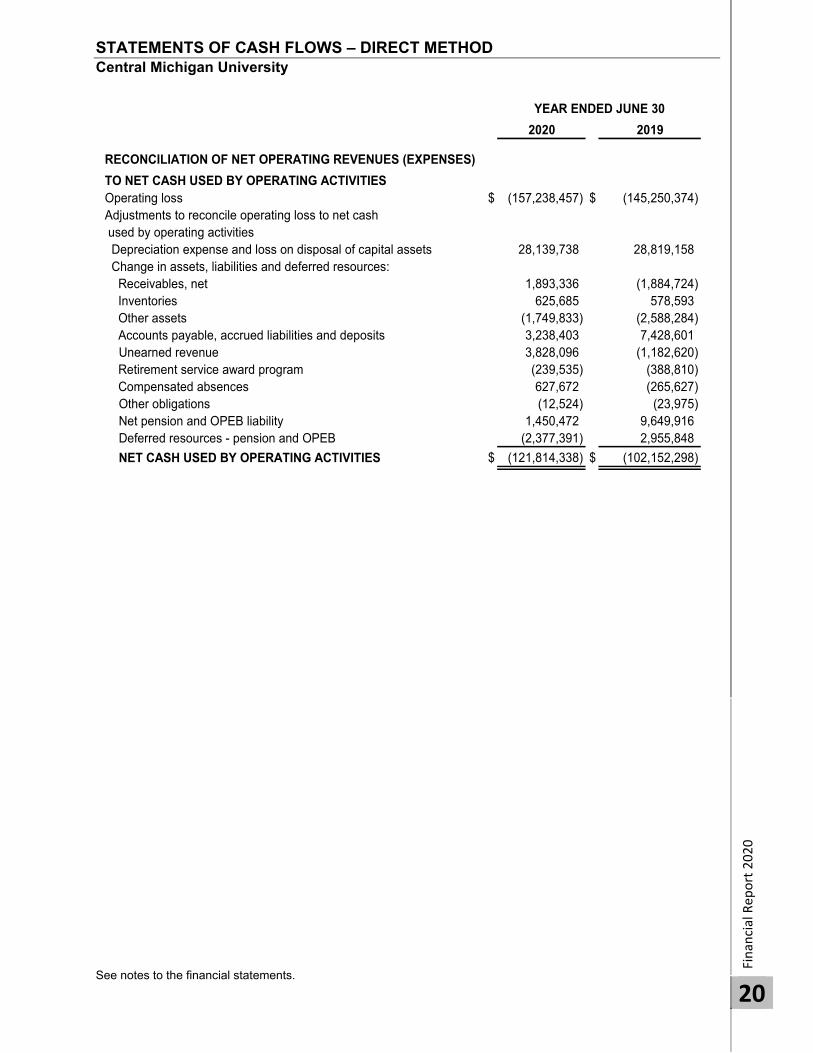
pledges. Other revenue in 2020 increased $1.6 million primarily due to an increase in capital appropriations from the State Building Authority related to the Center for Integrated Health Studies building which reached substantial completion in November 2019. During 2019, other revenue increased $6.3 million primarily due to an increase in capital appropriations from the State Building Authority related to the Center for Integrated Health Studies building as construction on the project advanced significantly during the fiscal year toward a target date for substantial completion of fall 2019. STATEMENTS OF CASH FLOWS The Statements of Cash Flows present information related to cash inflows and outflows summarized by operating, capital and noncapital financing, and investing activities. Its primary purpose is to provide relevant information about the cash receipts and cash payments of the university during the year. A comparative summary of the statements of cash flows (shown in millions) for the years ended June 30 is as follows:
2020 2019 2018
Cash received from operations $ 292.1 $ 311.8 $ 324.6
Cash expended for operations (413.9) (414.0) (428.0)
NET CASH USED BY OPERATING ACTIVITIES (121.8) (102.2) (103.4)
Net cash provided by noncapital financing activities 140.7 122.6 138.1
Net cash used by capital financing activities (19.9) (48.2) (27.2)
Net cash provided (used) by investing activities 12.4 18.9 (11.7)
NET INCREASE (DECREASE) IN CASH AND CASH EQUIVALENTS 11.4 (8.9) (4.2)
CASH AND CASH EQUIVALENTS, BEGINNING OF THE YEAR 26.8 35.7 39.9
CASH AND CASH EQUIVALENTS, END OF THE YEAR $ 38.2 $ 26.8 $ 35.7
The most significant components of cash flows used from operating activities are tuition and fees, auxiliary activities, and grants and contracts. Net cash used in operating activities was $121.8 million ($102.2 million at June 30, 2019). To offset this, the net cash provided from noncapital financing activities, consisting primarily of state appropriations, was $140.7 million ($122.6 million at June 30, 2019). Cash used by capital financing activities was $19.9 million ($48.2 million at June 30, 2019), primarily the result of the investment in major capital construction projects offset by proceeds from debt issued to fund the capital projects and capital appropriations received. Cash provided by investing activities was $12.4 million ($18.9 million used by investment activities at June 30, 2019) due to unfavorable market conditions amid the COVID-19 global pandemic. REQUESTS FOR INFORMATION Questions concerning information provided in the Management’s Discussion and Analysis or other required supplemental information, financial statements and notes thereto, or requests for additional financial information should be addressed to Central Michigan University, Warriner 104, Mount Pleasant, Michigan 48859.
The remainder of this page intentionally left blank
STATEMENTS OF NET POSITION Central Michigan University
Finan
cial Rep
ort 2020
17
See notes to the financial statements.
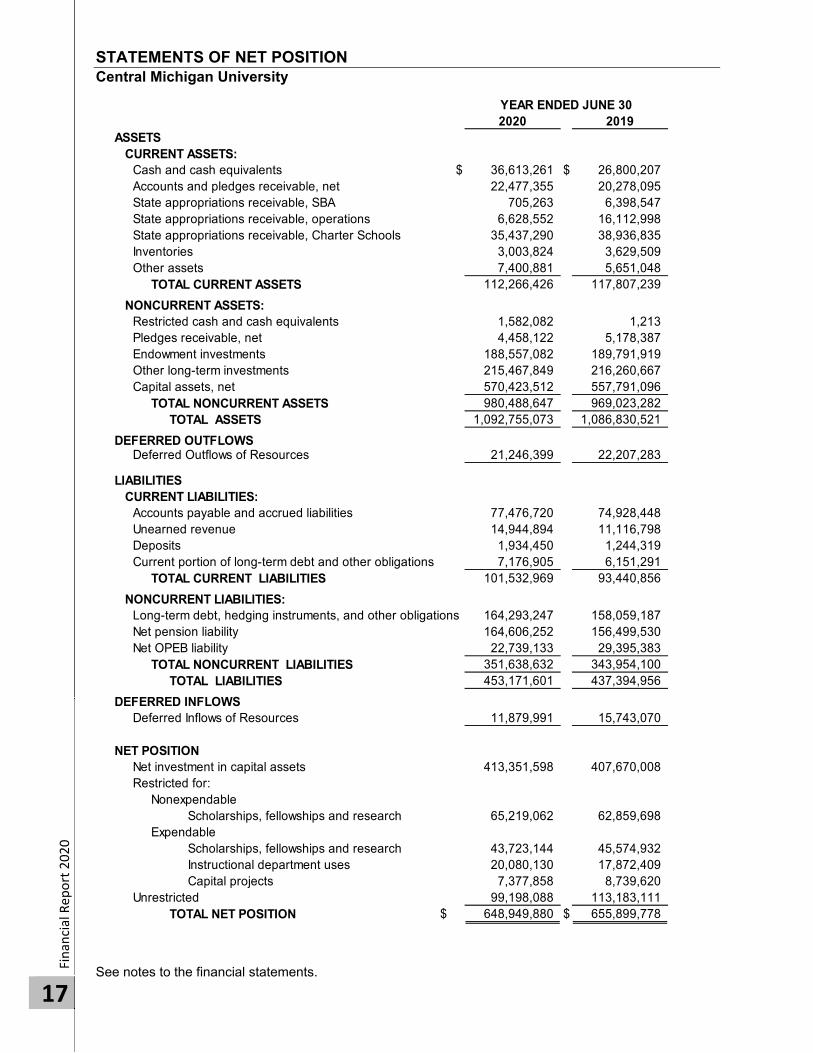
2020 2019ASSETS CURRENT ASSETS:
Cash and cash equivalents $ 36,613,261 $ 26,800,207Accounts and pledges receivable, net 22,477,355 20,278,095State appropriations receivable, SBA 705,263 6,398,547State appropriations receivable, operations 6,628,552 16,112,998State appropriations receivable, Charter Schools 35,437,290 38,936,835Inventories 3,003,824 3,629,509Other assets 7,400,881 5,651,048
TOTAL CURRENT ASSETS 112,266,426 117,807,239
NONCURRENT ASSETS:Restricted cash and cash equivalents 1,582,082 1,213Pledges receivable, net 4,458,122 5,178,387Endowment investments 188,557,082 189,791,919Other long-term investments 215,467,849 216,260,667Capital assets, net 570,423,512 557,791,096
TOTAL NONCURRENT ASSETS 980,488,647 969,023,282TOTAL ASSETS 1,092,755,073 1,086,830,521
DEFERRED OUTFLOWS21,246,399 22,207,283
LIABILITIES CURRENT LIABILITIES:
Accounts payable and accrued liabilities 77,476,720 74,928,448Unearned revenue 14,944,894 11,116,798Deposits 1,934,450 1,244,319Current portion of long-term debt and other obligations 7,176,905 6,151,291
TOTAL CURRENT LIABILITIES 101,532,969 93,440,856
NONCURRENT LIABILITIES:Long-term debt, hedging instruments, and other obligations 164,293,247 158,059,187Net pension liability 164,606,252 156,499,530Net OPEB liability 22,739,133 29,395,383
TOTAL NONCURRENT LIABILITIES 351,638,632 343,954,100TOTAL LIABILITIES 453,171,601 437,394,956
DEFERRED INFLOWS11,879,991 15,743,070
NET POSITIONNet investment in capital assets 413,351,598 407,670,008Restricted for:
NonexpendableScholarships, fellowships and research 65,219,062 62,859,698
ExpendableScholarships, fellowships and research 43,723,144 45,574,932Instructional department uses 20,080,130 17,872,409Capital projects 7,377,858 8,739,620
Unrestricted 99,198,088 113,183,111TOTAL NET POSITION $ 648,949,880 $ 655,899,778
YEAR ENDED JUNE 30
Deferred Outflows of Resources
Deferred Inflows of Resources
STATEMENTS OF REVENUES, EXPENSES AND CHANGES IN NET POSITION Central Michigan University
Finan
cial Rep
ort 2020
18
2020 2019
REVENUES
OPERATING REVENUES:
Tuition $ 249,211,213 $ 267,186,867
Less: Scholarship allowances 58,984,591 60,775,712
Net tuition 190,226,622 206,411,155
Federal grants and contracts 9,434,499 10,122,035
State and local grants and contracts 729,341 420,198
Nongovernmental grants and contracts 4,359,377 3,993,223
Sales and services of educational activities 22,274,159 20,114,912Auxiliary enterprises (net of room & board allowances
of $11,235,160 in 2020 and $11,576,326 in 2019) 62,508,124 73,253,040
TOTAL OPERATING REVENUES 289,532,122 314,314,563
EXPENSES
OPERATING EXPENSES: Compensation:
Faculty 97,487,696 99,738,739
Staff 89,176,831 90,790,399
Benefits 79,466,506 79,613,914
Student 10,640,877 13,598,806
Scholarships and fellowships 22,514,250 16,647,406
Utilities 7,423,251 8,248,456
Supplies and other 78,901,495 96,227,206
Operation and maintenance of plant expenses 33,438,151 27,790,924
Depreciation 27,721,522 26,909,087
TOTAL OPERATING EXPENSES 446,770,579 459,564,937
OPERATING LOSS (157,238,457) (145,250,374)
NONOPERATING REVENUES (EXPENSES)
State appropriations 80,864,527 88,710,338
Gifts and pledges (net of allowance) 13,985,600 5,315,089
Gifts of term endowments 511,051
Investment income (net of investment expense) 10,965,878 19,626,617
Interest on capital assets related debt (6,075,061) (6,170,560)
Federal Pell grant program 23,007,753 24,802,492
Federal CARES Act program 10,902,878
Other nonoperating revenues 206,025 10,700
NET NONOPERATING REVENUES (EXPENSES) 133,857,600 132,805,727
LOSS BEFORE OTHER REVENUES (23,380,857) (12,444,647)
OTHER REVENUES
Capital appropriations 10,990,990 7,866,546
Capital grants and gifts 3,244,809 4,051,659
Additions to permanent endowments 2,195,160 2,871,715
TOTAL OTHER REVENUES 16,430,959 14,789,920
(DECREASE) INCREASE IN NET POSITION (6,949,898) 2,345,273
NET POSITION
NET POSITION AT BEGINNING OF YEAR 655,899,778 653,554,505 NET POSITION AT END OF YEAR $ 648,949,880 $ 655,899,778
YEAR ENDED JUNE 30
See notes to the financial statements.

STATEMENTS OF CASH FLOWS – DIRECT METHOD Central Michigan University
Finan
cial Rep
ort 2020
19
2020 2019
CASH FLOW FROM OPERATING ACTIVITIESTuition $ 195,012,520 $ 206,232,709Grants and contracts 13,519,574 15,388,874Payments to suppliers (106,627,699) (101,489,702)Payments for utilities (7,423,251) (8,248,456)Payments to employees (197,379,681) (203,981,405)Payments for benefits (78,590,315) (80,383,116)Payments for scholarships and fellowships (22,514,249) (16,647,406)Auxiliary activities 62,856,739 72,698,666Sales and services of educational activities 20,734,895 17,545,071Other payments (1,402,871) (3,267,533)
NET CASH USED BY OPERATING ACTIVITIES (121,814,338) (102,152,298)
CASH FLOW FROM NONCAPITAL FINANCING ACTIVITIESState appropriations 90,387,230 88,450,096William D. Ford PLUS direct lending receipts 144,601,107 158,913,320William D. Ford PLUS direct lending disbursements (144,601,107) (158,913,320)Federal Pell grant program 23,007,753 24,802,492Federal CARES Act program 10,574,722Other nonoperating revenue 206,025 10,700Gifts for other than capital purposes 14,352,988 5,992,063Gifts for endowment purposes 2,195,160 3,382,766
NET CASH PROVIDED BY NONCAPITAL FINANCING ACTIVITIES 140,723,878 122,638,117
CASH FLOW FROM CAPITAL FINANCING ACTIVITIESProceeds from capital debt 13,294,975Contribution to debt refunding (183,247)Capital appropriations 16,684,274 1,471,131Capital grants and gifts received 3,332,789 3,065,059Purchases of capital assets (40,772,154) (40,660,729)Principal paid on capital debt and leases (5,465,000) (5,485,000)Interest paid on capital debt and leases (6,770,964) (6,625,199)Insurance proceeds 1,617
NET CASH USED BY CAPITAL FINANCING ACTIVITIES (19,879,327) (48,233,121)
CASH FLOW FROM INVESTING ACTIVITIESProceeds from sales and maturities of investments 268,432,030 740,645,047Income on investments, net 6,251,232 16,010,006Purchase of investments (262,319,552) (737,803,266)
NET CASH PROVIDED (USED) BY INVESTING ACTIVITIES 12,363,710 18,851,787
NET DECREASE IN CASH AND CASH EQUIVALENTS 11,393,923 (8,895,515)
CASH AND CASH EQUIVALENTS-BEGINNING OF THE YEAR 26,801,420 35,696,935
CASH AND CASH EQUIVALENTS-END OF THE YEAR $ 38,195,343 $ 26,801,420
YEAR ENDED JUNE 30
See notes to the financial statements.
STATEMENTS OF CASH FLOWS – DIRECT METHOD Central Michigan University
Finan
cial Rep
ort 2020
20
2020 2019
RECONCILIATION OF NET OPERATING REVENUES (EXPENSES)
TO NET CASH USED BY OPERATING ACTIVITIESOperating loss $ (157,238,457) $ (145,250,374)Adjustments to reconcile operating loss to net cash used by operating activities Depreciation expense and loss on disposal of capital assets 28,139,738 28,819,158 Change in assets, liabilities and deferred resources: Receivables, net 1,893,336 (1,884,724) Inventories 625,685 578,593 Other assets (1,749,833) (2,588,284) Accounts payable, accrued liabilities and deposits 3,238,403 7,428,601
Unearned revenue 3,828,096 (1,182,620) Retirement service award program (239,535) (388,810) Compensated absences 627,672 (265,627)
Other obligations (12,524) (23,975)Net pension and OPEB liability 1,450,472 9,649,916
Deferred resources - pension and OPEB (2,377,391) 2,955,848
NET CASH USED BY OPERATING ACTIVITIES $ (121,814,338) $ (102,152,298)
YEAR ENDED JUNE 30
See notes to the financial statements.

STATEMENTS OF NET ASSETS Central Health Advancement Solutions
Finan
cial Rep
ort 2020
21
2020 2019ASSETS
CURRENT ASSETS:Cash and cash equivalents $ 8,985,707 $ 2,296,565Cash - designated funds 121,075 51,040Patient accounts receivable, less allowance for doubtful accounts of $430,943 in 2020 and $319,429 in 2019 488,451 1,083,972Receivables - member hospitals 599,031 665,146Receivables - funding support 490,049 1,105,432Prepaid expenses and other assets 742,620 1,162,144
TOTAL CURRENT ASSETS 11,426,933 6,364,299
ASSETS WHOSE USE IS LIMITED:Investments 815,760 797,523
TOTAL ASSETS WHOSE USE IS LIMITED: 815,760 797,523
Other Assets 13,540 1,584,462Leasehold improvements, furniture, and equipment, net 1,574,060 1,634,330
TOTAL ASSETS $ 13,830,293 $ 10,407,982
LIABILITIES CURRENT LIABILITIES:
Accounts payable $ 242,985 $ 310,266Other accrued liabilities 34,026 34,026Payable to CMU 265,678Payroll and related liabilities 2,908,172 2,488,101Note Payable 5,049,500Unearned revenue 519,354 747,953
TOTAL CURRENT LIABILITIES 8,754,037 3,846,024
Estimated professional liability under self-insurance 200,000 200,000TOTAL LIABLITIES 8,954,037 4,046,024
NET ASSETSWithout donor restrictions 4,876,256 6,361,958
TOTAL LIABLITIES AND NET ASSETS $ 13,830,293 $ 10,407,982
YEAR ENDED JUNE 30
See Notes 1 and 12 to the Central Michigan University financial statements.

STATEMENTS OF ACTIVITIES AND CHANGES IN NET ASSETS Central Health Advancement Solutions
Finan
cial Rep
ort 2020
22
2020 2019UNRESTRICTED REVENUES AND OTHER SUPPORT
Member hospitals $ 19,404,048 $ 17,364,738 Net patient service revenue 10,950,539 11,188,626 Quality incentive programs 2,275,089 1,545,446 Contracts and other revenue 13,757,147 13,925,874
46,386,823 44,024,684
OPERATING EXPENSESSalaries, wages, and payroll taxes 32,357,959 29,802,101 Employee benefits 5,729,236 4,669,702 Recruiting 366,141 352,843 Consumable supplies 771,788 794,306 Educational supplies and services 418,791 428,596 Consulting and contractual services 1,545,632 1,973,844 Communications 264,786 276,494 Educational conferences and travel 856,685 858,764 Grant expenses 367,429 688,690 Insurance 912,078 864,819 Facility and equipment 2,056,492 2,098,654 Other expenses 113,504 165,856 Depreciation 381,753 376,169 Provision for bad debts 224,655 481,013 Professional liability expense 315,639
TOTAL OPERATING EXPENSES 46,366,929 44,147,490
19,894 (122,806) Adjustment for medical funding receivable (1,505,596) Decrease in net assets without donor restrictions (1,485,702) (122,806)
NET ASSETSNET ASSETS AT BEGINNING OF YEAR 6,361,958 6,484,764 NET ASSETS AT END OF YEAR $ 4,876,256 $ 6,361,958
YEAR ENDED JUNE 30
TOTAL UNRESTRICTED REVENUES AND OTHER SUPPORT
Unrestricted Revenues and other support (under) over operating expenses
STATEMENTS OF NET ASSETS The Institute for Excellence in Education
Finan
cial Rep
ort 2020
23
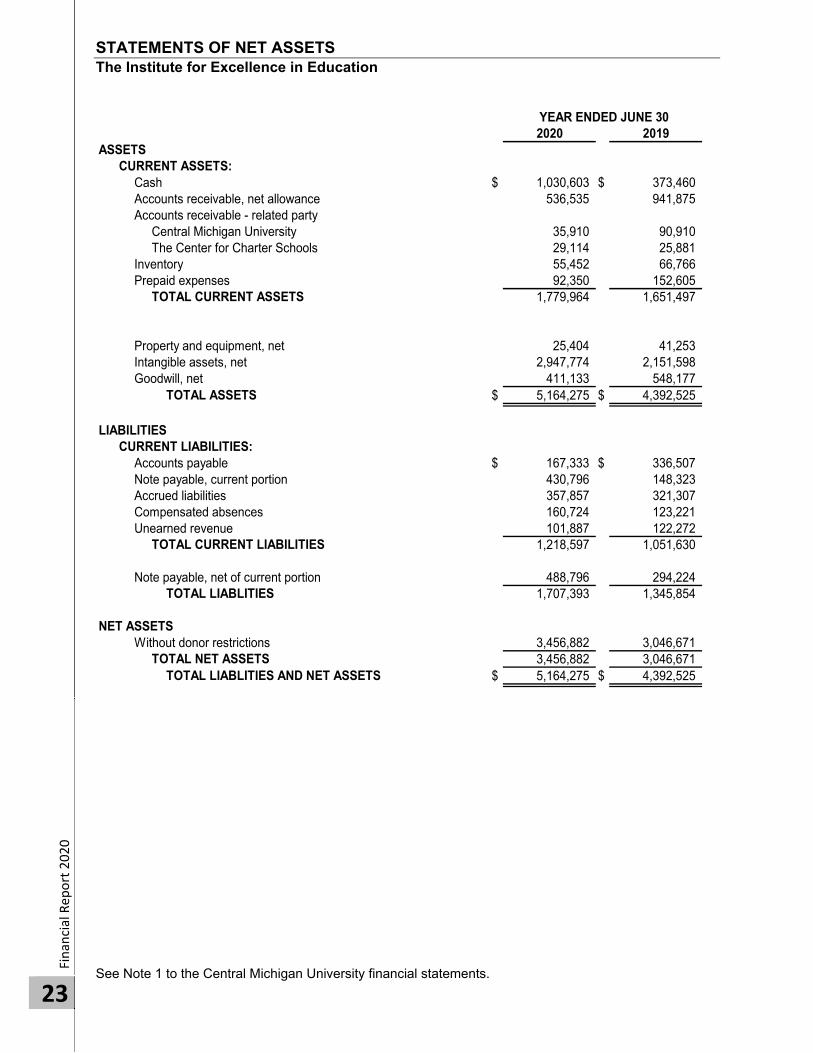
2020 2019ASSETS
CURRENT ASSETS:Cash $ 1,030,603 $ 373,460Accounts receivable, net allowance 536,535 941,875Accounts receivable - related party
Central Michigan University 35,910 90,910The Center for Charter Schools 29,114 25,881
Inventory 55,452 66,766Prepaid expenses 92,350 152,605
TOTAL CURRENT ASSETS 1,779,964 1,651,497
Property and equipment, net 25,404 41,253Intangible assets, net 2,947,774 2,151,598Goodwill, net 411,133 548,177
TOTAL ASSETS $ 5,164,275 $ 4,392,525
LIABILITIES CURRENT LIABILITIES:
Accounts payable $ 167,333 $ 336,507Note payable, current portion 430,796 148,323Accrued liabilities 357,857 321,307Compensated absences 160,724 123,221Unearned revenue 101,887 122,272
TOTAL CURRENT LIABILITIES 1,218,597 1,051,630
Note payable, net of current portion 488,796 294,224TOTAL LIABLITIES 1,707,393 1,345,854
NET ASSETSWithout donor restrictions 3,456,882 3,046,671
TOTAL NET ASSETS 3,456,882 3,046,671TOTAL LIABLITIES AND NET ASSETS $ 5,164,275 $ 4,392,525
YEAR ENDED JUNE 30
See Note 1 to the Central Michigan University financial statements.

STATEMENTS OF ACTIVITIES AND CHANGES IN NET ASSETS The Institute for Excellence in Education
Finan
cial Rep
ort 2020
24
2020 2019OPERATING REVENUE AND OTHER SUPPORT
State Appropriations - related partyCentral Michigan University $ 445,000 $ 500,000
Service Revenue 6,036,998 6,266,127 Federal Grants 849,367 208,365 Contributions 2,329 18,061 Contributions - related party 100,000 300,000 Book revenue, net of cost of goods sold 15,430 27,320 Other revenue 5,282 5,848 Interest Income 274 Gain on disposal of property and equipment 250 1,183
7,454,930 7,326,904
OPERATING EXPENSESCompensation 3,444,449 3,785,841 Benefits 996,562 905,251 Interest 19,439 25,362 Occupancy 105,646 107,032 Services and fees 988,585 266,073 Supplies and other 221,605 227,477 Telephone 28,278 25,899 Marketing 88,324 76,488 Travel 280,144 510,761 Bad Debt 950 20,776
TOTAL EXPENSES BEFORE DEPRECIATION AND AMORTIZATION 6,173,982 5,950,960
CHANGE IN NET ASSETS FROM OPERATIONS BEFOREDEPRECIATION AND AMORTIZATION 1,280,948 1,375,944
Depreciation 20,324 24,480
Amoritization 850,413 847,042
CHANGE IN NET ASSETS 410,211 504,422
NET ASSETS
NET ASSETS AT BEGINNING OF YEAR 3,046,671 2,542,249
NET ASSETS AT END OF YEAR $ 3,456,882 $ 3,046,671
YEAR ENDED JUNE 30
TOTAL UNRESTRICTED REVENUES AND OTHER SUPPORT

NOTES TO THE FINANCIAL STATEMENTS Central Michigan University
Fi
nanc
ial R
epor
t 202
0
25
NOTE 1--ORGANIZATION, BASIS OF PRESENTATION AND SUMMARY OF SIGNIFICANT ACCOUNTING POLICIES Organization Central Michigan University (the university or CMU) is an institution of higher education and is considered to be a component unit of the State of Michigan because the Governor of the State of Michigan appoints its Board of Trustees (the board). Accordingly, the university is included in the state’s financial statements as a discrete component unit. Transactions with the State of Michigan relate primarily to appropriations for operations, appropriations for Charter Schools, grants from various state agencies, State Building Authority (SBA) revenues and payments to the state retirement program for university employees. The university has six affiliated organizations that were evaluated in accordance with Governmental Accounting Standards Board (GASB) Statement No. 61, The Financial Reporting Entity: Omnibus, which the university adopted July 1, 2010 and GASB Statement No. 80, Blending Requirements for Certain Component Units, which the university adopted July 1, 2016. Each organization is described below as well as the impact that it has on the university’s financial statements:
• Central Health Advancement Solutions (CHAS) is a Michigan nonprofit corporation established January 28, 2011 and is organized on a non-stock membership basis. The sole member of the corporation is the Board of Trustees of Central Michigan University. The purpose for which the corporation is organized and to be operated is exclusively charitable, educational and scientific within the meaning of Section 501(c)(3) of the Internal Revenue Code of 1986, as amended and corresponding provision of any subsequent federal tax laws. The corporation is administered solely for the benefit of the sole member by providing, directly or indirectly, assistance and benefit, financial or otherwise, to the sole member through whatever means are determined appropriate by the Board of Directors of the corporation. Effective January 1, 2011, CHAS entered into a Member’s Agreement that provides a 90% membership interest in CMU Medical Education Partners whose purpose is to integrate medical education, research, and service, primarily for the training of medical residents and other medical related personnel. In accordance with the provisions of GASB Statement No. 61, CHAS is discretely presented in the university’s financial statements (refer to pages 21 and 22 for CHAS financial statements). The June 30, 2020 audited financial statements for CHAS can be found at: www.cmich.edu
• The CMU College of Business Administration Foundation (CBAF) was a Michigan nonprofit
corporation established January 28, 2011 and was registered as a charitable trust under the Charitable Organizations and Solicitations Act (COSA), MCL 400.271 et seq. and the Supervision of Trustees for Charitable Purposes Act, 1961 PA 101, MCL 14.251 et seq. (STCPA). The purpose for which the corporation was organized and operated was to solicit, receive, hold and administer and disburse cash/non-cash investment funds to support the charitable, educational and scientific purposes of CMU’s College of Business Administration. In accordance with the provisions of GASB Statement No. 61, CBAF was blended into the university’s financial statements because CBAF provides services entirely to the university and the activity was not significant to the university. During fiscal year 2017 it was determined that given the modest gifts, grants and contributions received, the CBAF had not been able to fully meet its objectives. On February 22, 2017, the CBAF Board recommended a plan of dissolution of the foundation to the corporation’s sole member, the CMU Board of Trustees. On April 27, 2017 the CMU Board of Trustees approved the CBAF plan of dissolution. On May 30, 2017 a dissolution questionnaire was filed with the Michigan Department of the Attorney General. Dissolution of the CBAF was completed as of August 16, 2017 when CMU received notification from the Michigan Department of Licensing and Regulatory Affairs that all paperwork was endorsed and filed. Due to the dissolution of the CBAF in August of 2017, there was no financial activity in the fiscal years ended June 30, 2020 and June 30, 2019 and insignificant activity in the fiscal year ended June 30, 2018. Audited financial statements for CBAF for years prior to fiscal year 2017 can be found at: www.cmich.edu.
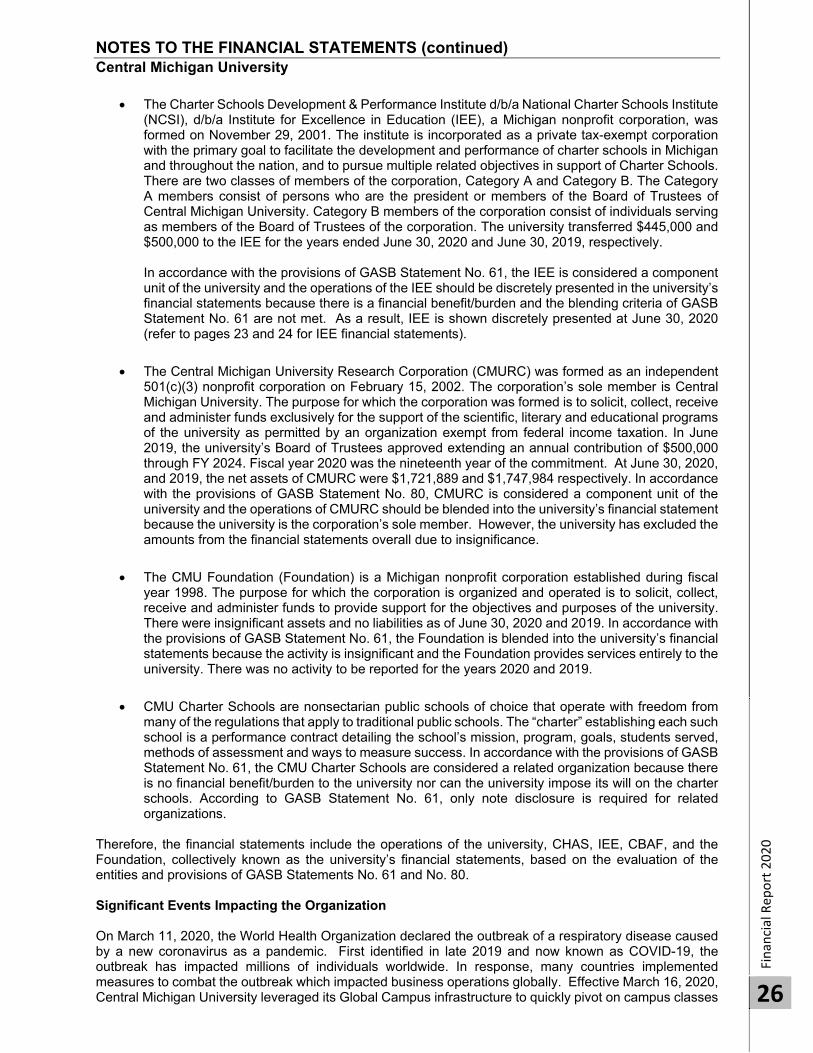
NOTES TO THE FINANCIAL STATEMENTS (continued) Central Michigan University
Finan
cial Rep
ort 2020
26
The Charter Schools Development & Performance Institute d/b/a National Charter Schools Institute(NCSI), d/b/a Institute for Excellence in Education (IEE), a Michigan nonprofit corporation, wasformed on November 29, 2001. The institute is incorporated as a private tax-exempt corporationwith the primary goal to facilitate the development and performance of charter schools in Michiganand throughout the nation, and to pursue multiple related objectives in support of Charter Schools.There are two classes of members of the corporation, Category A and Category B. The CategoryA members consist of persons who are the president or members of the Board of Trustees ofCentral Michigan University. Category B members of the corporation consist of individuals servingas members of the Board of Trustees of the corporation. The university transferred $445,000 and$500,000 to the IEE for the years ended June 30, 2020 and June 30, 2019, respectively.
In accordance with the provisions of GASB Statement No. 61, the IEE is considered a componentunit of the university and the operations of the IEE should be discretely presented in the university’sfinancial statements because there is a financial benefit/burden and the blending criteria of GASBStatement No. 61 are not met. As a result, IEE is shown discretely presented at June 30, 2020(refer to pages 23 and 24 for IEE financial statements).
The Central Michigan University Research Corporation (CMURC) was formed as an independent501(c)(3) nonprofit corporation on February 15, 2002. The corporation’s sole member is CentralMichigan University. The purpose for which the corporation was formed is to solicit, collect, receiveand administer funds exclusively for the support of the scientific, literary and educational programsof the university as permitted by an organization exempt from federal income taxation. In June2019, the university’s Board of Trustees approved extending an annual contribution of $500,000through FY 2024. Fiscal year 2020 was the nineteenth year of the commitment. At June 30, 2020,and 2019, the net assets of CMURC were $1,721,889 and $1,747,984 respectively. In accordancewith the provisions of GASB Statement No. 80, CMURC is considered a component unit of theuniversity and the operations of CMURC should be blended into the university’s financial statementbecause the university is the corporation’s sole member. However, the university has excluded theamounts from the financial statements overall due to insignificance.
The CMU Foundation (Foundation) is a Michigan nonprofit corporation established during fiscalyear 1998. The purpose for which the corporation is organized and operated is to solicit, collect,receive and administer funds to provide support for the objectives and purposes of the university.There were insignificant assets and no liabilities as of June 30, 2020 and 2019. In accordance withthe provisions of GASB Statement No. 61, the Foundation is blended into the university’s financialstatements because the activity is insignificant and the Foundation provides services entirely to theuniversity. There was no activity to be reported for the years 2020 and 2019.
CMU Charter Schools are nonsectarian public schools of choice that operate with freedom frommany of the regulations that apply to traditional public schools. The “charter” establishing each suchschool is a performance contract detailing the school’s mission, program, goals, students served,methods of assessment and ways to measure success. In accordance with the provisions of GASBStatement No. 61, the CMU Charter Schools are considered a related organization because thereis no financial benefit/burden to the university nor can the university impose its will on the charterschools. According to GASB Statement No. 61, only note disclosure is required for relatedorganizations.
Therefore, the financial statements include the operations of the university, CHAS, IEE, CBAF, and the Foundation, collectively known as the university’s financial statements, based on the evaluation of the entities and provisions of GASB Statements No. 61 and No. 80.
Significant Events Impacting the Organization
On March 11, 2020, the World Health Organization declared the outbreak of a respiratory disease caused by a new coronavirus as a pandemic. First identified in late 2019 and now known as COVID-19, the outbreak has impacted millions of individuals worldwide. In response, many countries implemented measures to combat the outbreak which impacted business operations globally. Effective March 16, 2020, Central Michigan University leveraged its Global Campus infrastructure to quickly pivot on campus classes

NOTES TO THE FINANCIAL STATEMENTS (continued) Central Michigan University
Fi
nanc
ial R
epor
t 202
0
27
to online education for the remainder of the spring 2020 semester. Students were encouraged not to return to campus housing after spring break ended on March 15, resulting in large room and board refunds and significant losses of other auxiliary revenues. An abundance of resources continues to be allocated toward responding to this global pandemic to ensure operational sustainability. No impairments were recorded as of the balance sheet date; however, due to significant uncertainty surrounding the situation, management’s professional perspective regarding this could change in the future. Basis of Presentation The accompanying financial statements have been prepared using the economic resource measurement focus and the accrual basis of accounting. The statements incorporate all fund groups utilized internally by the university. These statements have been prepared in accordance with accounting principles generally accepted in the United States of America as prescribed by the Governmental Accounting Standards Board. The university follows the “business-type” activities requirements of GASB Statement No. 34, Basic Financial Statements-and Management’s Discussion and Analysis-for State and Local Governments, and GASB Statement No. 35, Basic Financial Statements-and Management’s Discussion and Analysis-for Public Colleges and Universities. This statement requires the following components of the university’s financial statements:
• Management’s discussion and analysis
• Basic financial statements including a Statements of Net Position, Statements of Revenues, Expenses and Changes in Net Position and Statements of Cash Flows for the university as a whole
• Notes to the financial statements
GASB Statement No. 34 establishes standards for external financial reporting for public colleges and universities and requires that resources be classified for accounting and reporting purposes into the following four net asset categories:
• Net investment in capital assets: Capital assets, net of accumulated depreciation and outstanding principal balances of debt attributable to the acquisition, construction or improvement of those assets.
• Restricted: Nonexpendable – Net position subject to externally imposed constraints that they be maintained permanently by the university. Such assets include the university’s permanent endowment funds.
Expendable – Net position whose use by the university is subject to externally imposed constraints that can be fulfilled by actions of the university pursuant to those constraints or that expire by the passage of time.
• Unrestricted: Net positions that are not subject to externally imposed constraints. Unrestricted net
positions may be designated for specific purposes by action of management or the board or may otherwise be limited by contractual agreements with outside parties. Substantially all unrestricted net positions are designated for academic, research and outreach programs and initiatives, postemployment benefits, operating and stabilization reserves, capital projects and capital asset renewals and replacements.
This statement also requires the university to report revenues net of discounts and allowances. Gift and grant revenues are recognized at the later of the pledge date or when the eligibility requirement of the gifts and grants are met. In addition, direct lending is not reported as federal revenue and scholarship expenditures but is instead treated as an agency transaction.
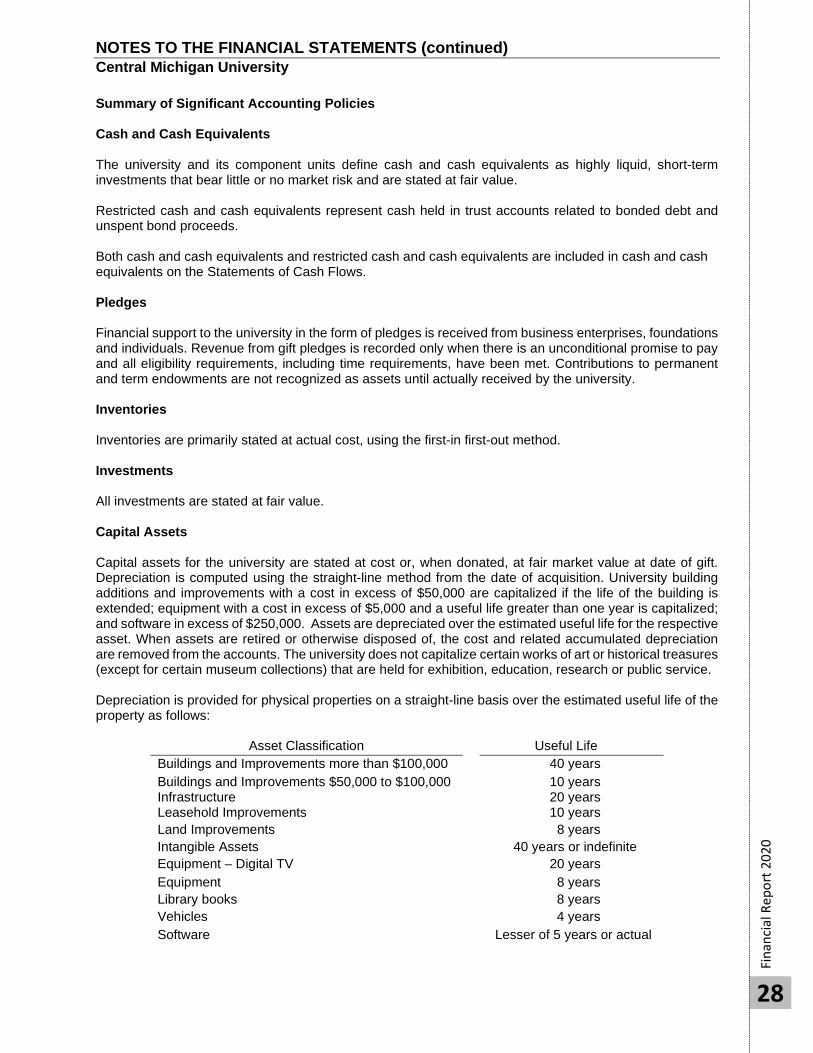
NOTES TO THE FINANCIAL STATEMENTS (continued) Central Michigan University
Fi
nanc
ial R
epor
t 202
0
28
Summary of Significant Accounting Policies Cash and Cash Equivalents The university and its component units define cash and cash equivalents as highly liquid, short-term investments that bear little or no market risk and are stated at fair value. Restricted cash and cash equivalents represent cash held in trust accounts related to bonded debt and unspent bond proceeds. Both cash and cash equivalents and restricted cash and cash equivalents are included in cash and cash equivalents on the Statements of Cash Flows. Pledges Financial support to the university in the form of pledges is received from business enterprises, foundations and individuals. Revenue from gift pledges is recorded only when there is an unconditional promise to pay and all eligibility requirements, including time requirements, have been met. Contributions to permanent and term endowments are not recognized as assets until actually received by the university. Inventories Inventories are primarily stated at actual cost, using the first-in first-out method. Investments All investments are stated at fair value. Capital Assets Capital assets for the university are stated at cost or, when donated, at fair market value at date of gift. Depreciation is computed using the straight-line method from the date of acquisition. University building additions and improvements with a cost in excess of $50,000 are capitalized if the life of the building is extended; equipment with a cost in excess of $5,000 and a useful life greater than one year is capitalized; and software in excess of $250,000. Assets are depreciated over the estimated useful life for the respective asset. When assets are retired or otherwise disposed of, the cost and related accumulated depreciation are removed from the accounts. The university does not capitalize certain works of art or historical treasures (except for certain museum collections) that are held for exhibition, education, research or public service.
Depreciation is provided for physical properties on a straight-line basis over the estimated useful life of the property as follows:
Asset Classification Useful Life Buildings and Improvements more than $100,000 40 years Buildings and Improvements $50,000 to $100,000 10 years Infrastructure 20 years Leasehold Improvements 10 years Land Improvements 8 years Intangible Assets 40 years or indefinite Equipment – Digital TV 20 years Equipment 8 years Library books 8 years Vehicles 4 years Software Lesser of 5 years or actual

NOTES TO THE FINANCIAL STATEMENTS (continued) Central Michigan University
Fi
nanc
ial R
epor
t 202
0
29
Compensated Absences University employees earn vacation and sick leave benefits based, in part, on length of service. Vacation pay is fully vested when earned. Upon separation from service, employees are paid accumulated vacation based upon the nature of separation (death, retirement or termination). Certain limitations have been placed on the hours of vacation that employees may accumulate and carry over for payment at death, retirement or termination. Unused hours exceeding these limitations are forfeited. Pensions and Other Post-Employment Benefits (OPEB) For purposes of measuring the net pension and other post-employment benefit (OPEB) liability, deferred outflows of resources and deferred inflows of resources related to pensions and OPEB, and pension and OPEB expense, information about the fiduciary net position of the Michigan Public School Employees’ Retirement System (MPSERS) and additions to/deductions from MPSERS fiduciary net position have been determined on the same basis as they are reported by MPSERS. MPSERS uses the economic resources measurement focus and the full accrual basis of accounting. Contribution revenue is recorded as contributions are due, pursuant to legal requirements. Benefit payments (including refunds of employee contributions) are recognized as expense when due and payable in accordance with the benefit terms. Related plan investments are reported at fair value. Unearned Revenue Unearned revenue consists primarily of advance ticket sales for athletic events; summer school tuition, fall room and board not earned during the current year, and contract and sponsored program advances. CHAS Estimated Professional Liability The provision for estimated self-insured medical malpractice claims is actuarially determined and includes estimates of the costs for both reported claims and claims incurred but not reported. The liability is approximately $200 thousand at June 30, 2020, $200 thousand at June 30, 2019, and is included in the member hospital and malpractice fund liability. Additionally, CHAS has malpractice funding held by trustee of approximately $815 thousand at June 30, 2020 and $790 thousand at June 30, 2019. Deferred Outflows and Deferred Inflows In addition to assets, the statement of financial position reports a separate section for deferred outflows of resources. This separate financial statement element, deferred outflows of resources, represents a consumption of net position that applies to a future period and as such, is not recognized as an outflow of resources (expense/expenditure) until that time. Deferred outflows of resources consist of interest rate swap agreements that are stated at fair value based on the zero coupon valuation method, gains or losses on the defeasance of debt and deferred resources related to the university’s proportionate share of the net pension and other post-employment benefit liability for the Michigan Public School Employee’s Retirement System (MPSERS) plan. The university recorded deferred outflows for hedging instruments (noncurrent liabilities) of $6,572,388 at June 30, 2020, and $5,509,327 at June 30, 2019. Also included in deferred outflows is the gain or loss on the defeasance of three General Revenue Bonds Series: Series 2002A valued at $916,263 and $991,060, net of amortization, at June 30, 2020 and 2019, respectively; Series 2005 valued at $838,071 and $896,883, net of amortization, at June 30, 2020 and 2019 respectively; and Series 2006 valued at $179,217 and $190,969, net of amortization, at June 30, 2020 and 2019 respectively. The value of deferred outflows related to the MPSERS plan for pensions was $9,717,976 and $10,877,586 as of June 30, 2020 and 2019 respectively, and for other post-employment benefits (OPEB) was $3,022,484 and $3,741,458 as of June 30, 2020 and 2019, respectively. See Note 9 for additional information on deferred outflows related to the MPSERS plan. In addition to liabilities, the statement of financial position reports a separate section for deferred inflows of resources. This separate financial statement element, deferred inflows of resources, represents an acquisition of net position that applies to a future period and as such, is not recognized as an inflow of resources (revenue) until that time. Deferred inflows of resources consist of future revenue streams related to the defeasance of debt and split-interest agreements, deferred inflows of resources related to state appropriations received after the measurement date, and deferred inflows of resources related to the

NOTES TO THE FINANCIAL STATEMENTS (continued) Central Michigan University
Fi
nanc
ial R
epor
t 202
0
30
university’s proportionate share of the net pension and net OPEB liability for the MPSERS plan. The university recorded deferred inflows of resources related to the gain or loss on the defeasance of the General Revenue Bonds Series 2009 valued at $984,464, net of amortization, at June 30, 2020. Deferred inflows of resources applicable to split-interest agreements include $4,566,335 and $5,196,159 at June 30, 2020 and 2019 respectively. See Note 8 for additional information on deferred inflows related to split-interest agreements. At June 30, 2020 and 2019, respectively, deferred inflows related to changes in the pension portion of the MPSERS plan were $2,979,059 and $5,342,389, and the value related to changes in the OPEB portion of the MPSERS plan was $2,105,368 and $3,998,013. See Note 9 for additional information on deferred inflows related to the MPSERS plan. The value of deferred inflows of resources related to funding received through state appropriations for contributions to the MPSERS plan, after the measurement date, was $1,244,765 and $1,206,509 at June 30, 2020 and June 30, 2019, respectively. Bond Issuance Costs Bond issuance costs are expensed when incurred. Operating and Non-operating Revenues Operating revenues of the university consist of tuition, grants and contracts, sales and services of educational activities and auxiliary enterprise revenues. Certain significant revenue streams relied upon for operations are recorded as non-operating revenues, as defined by GASB Statement No. 34, including state appropriations, Federal Pell grant revenue, gifts and investment income. Restricted and unrestricted resources are spent and tracked at the discretion of the recipient university department within the guidelines of donor restrictions, if any. Revenue Recognition Revenues are recognized when earned and expenditures are recognized when the good or service is provided. Restricted grant revenue is recognized only to the extent expended. Student Tuition Student tuition revenues are reported net of scholarship allowances in the Statements of Revenues, Expenses and Changes in Net Position. Scholarship allowances represent the difference between the stated charge for goods and services provided by the university and the amount that is paid by the students or third parties on behalf of the students, where the university has discretion over such expenses. Auxiliary Enterprises Auxiliary enterprises primarily represent revenues generated from University Residence Services, intercollegiate athletics, clinics and various other departmental activities that provide services to the student body, faculty, staff and general public. CHAS Revenue CHAS has agreements with third-party payers that provide for reimbursements to the corporation at amounts different from its established rates. Contractual adjustments under third-party reimbursement programs represent the difference between the corporation’s established rates for services and amounts reimbursed by third-party payers. The corporation grants credit without collateral to its patients, most of who are Michigan residents and are insured under third-party payer agreements. Significant concentrations of CHAS accounts receivable at June 30, 2020 and June 30, 2019 include Medicare (4.58% and 21.8%), Blue Cross (9.42% and 13.1%), Medicaid (31.01% and 20.1%) and other commercial insurers and self-pay (54.99% and 45.0%), respectively. CHAS patient accounts receivable and revenue are recorded when patient services are performed. Patient accounts receivable are recorded at the corporation’s established rates with contractual adjustments, charity allowances, policy discounts and the provision for uncollectible accounts deducted to arrive at net patient accounts receivable. Patient services are recorded net of an allowance for doubtful accounts of
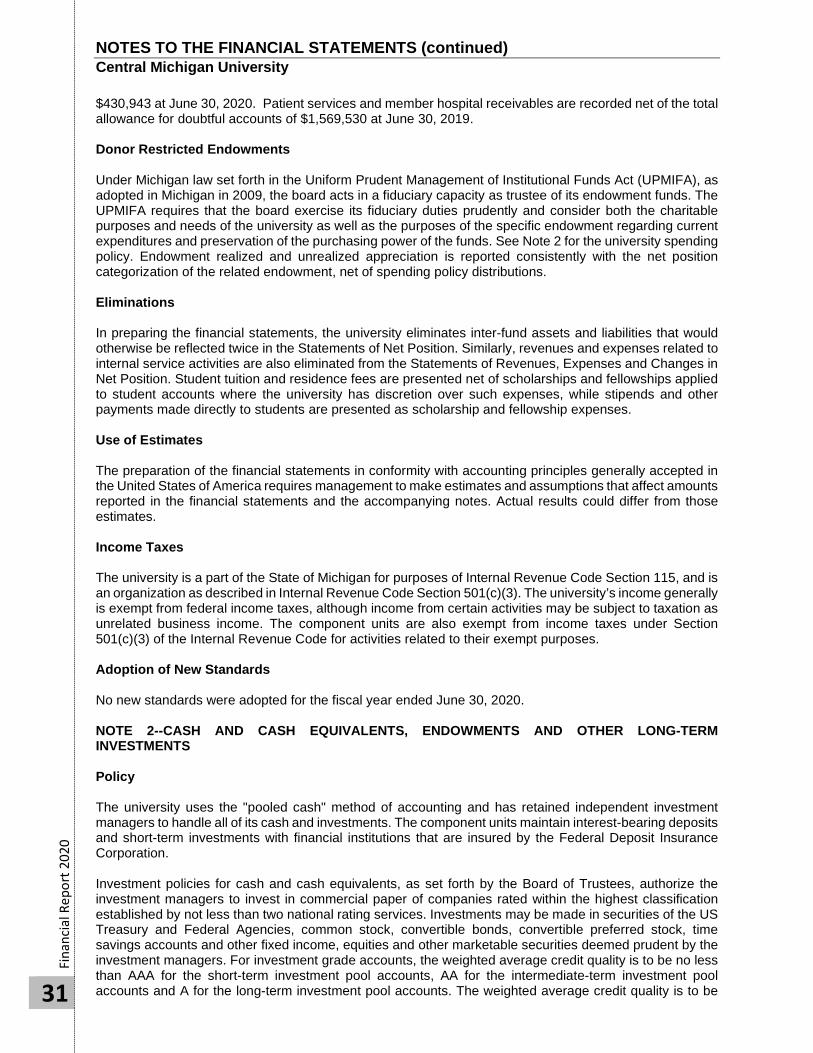
NOTES TO THE FINANCIAL STATEMENTS (continued) Central Michigan University
Fi
nanc
ial R
epor
t 202
0
31
$430,943 at June 30, 2020. Patient services and member hospital receivables are recorded net of the total allowance for doubtful accounts of $1,569,530 at June 30, 2019. Donor Restricted Endowments Under Michigan law set forth in the Uniform Prudent Management of Institutional Funds Act (UPMIFA), as adopted in Michigan in 2009, the board acts in a fiduciary capacity as trustee of its endowment funds. The UPMIFA requires that the board exercise its fiduciary duties prudently and consider both the charitable purposes and needs of the university as well as the purposes of the specific endowment regarding current expenditures and preservation of the purchasing power of the funds. See Note 2 for the university spending policy. Endowment realized and unrealized appreciation is reported consistently with the net position categorization of the related endowment, net of spending policy distributions. Eliminations In preparing the financial statements, the university eliminates inter-fund assets and liabilities that would otherwise be reflected twice in the Statements of Net Position. Similarly, revenues and expenses related to internal service activities are also eliminated from the Statements of Revenues, Expenses and Changes in Net Position. Student tuition and residence fees are presented net of scholarships and fellowships applied to student accounts where the university has discretion over such expenses, while stipends and other payments made directly to students are presented as scholarship and fellowship expenses. Use of Estimates The preparation of the financial statements in conformity with accounting principles generally accepted in the United States of America requires management to make estimates and assumptions that affect amounts reported in the financial statements and the accompanying notes. Actual results could differ from those estimates. Income Taxes The university is a part of the State of Michigan for purposes of Internal Revenue Code Section 115, and is an organization as described in Internal Revenue Code Section 501(c)(3). The university’s income generally is exempt from federal income taxes, although income from certain activities may be subject to taxation as unrelated business income. The component units are also exempt from income taxes under Section 501(c)(3) of the Internal Revenue Code for activities related to their exempt purposes. Adoption of New Standards No new standards were adopted for the fiscal year ended June 30, 2020. NOTE 2--CASH AND CASH EQUIVALENTS, ENDOWMENTS AND OTHER LONG-TERM INVESTMENTS Policy The university uses the "pooled cash" method of accounting and has retained independent investment managers to handle all of its cash and investments. The component units maintain interest-bearing deposits and short-term investments with financial institutions that are insured by the Federal Deposit Insurance Corporation. Investment policies for cash and cash equivalents, as set forth by the Board of Trustees, authorize the investment managers to invest in commercial paper of companies rated within the highest classification established by not less than two national rating services. Investments may be made in securities of the US Treasury and Federal Agencies, common stock, convertible bonds, convertible preferred stock, time savings accounts and other fixed income, equities and other marketable securities deemed prudent by the investment managers. For investment grade accounts, the weighted average credit quality is to be no less than AAA for the short-term investment pool accounts, AA for the intermediate-term investment pool accounts and A for the long-term investment pool accounts. The weighted average credit quality is to be

NOTES TO THE FINANCIAL STATEMENTS (continued) Central Michigan University
Fi
nanc
ial R
epor
t 202
0
32
no less than B for the non-investment grade long-term investment pool accounts. In addition, the minimum acceptable credit quality at the time of purchase for individual securities shall be A for the short-term investment pool accounts and BBB for the intermediate-term and long-term investment pool accounts. Policies regarding marketable securities in the endowment investments, as set forth by the Board of Trustees, authorize the investment managers to invest in equities, bonds or other marketable securities as outlined in the CMU Endowment Investment Policy Statement (found on the Board of Trustees website). The endowment income spending policy is 4.75% of the 20-quarter rolling average of the market value of the endowment pool of which 0.25% is allocated to an administrative fee. Under state law, the Uniform Prudent Management of Institutional Funds Act (UPMIFA), the university may appropriate for spending as much of the endowment as the institution deems prudent for the uses, benefits, purposes and duration for which the particular endowment fund was established, subject to evaluation of several specific factors including general economic conditions and the fund’s purpose. Although UPMIFA allows spending of the original gift, the university’s board policy does not allow the annual spending income allocation to reduce the original gift principal. Therefore, some of the endowments may not have distributed for fiscal year 2020. The spending policy is reviewed periodically by the investment committee, who recommend changes to the Board of Trustees. The net appreciation on investments of donor-restricted endowments available for authorization for expenditure approximates $39,152,140 at June 30, 2020, and $40,666,612 at June 30, 2019. The net appreciation is a component of restricted, expendable net positions. The yields of the endowment investments were as follows:
2020 2019Interest and Dividends 0.4 % 0.4 %Net Realized and Unrealized Gains 1.7 % 5.5 %
Total Return 2.1 % 5.9 %
June 30
The university had the following investments:
2020 2019Investments:
Bonds (Including Bonds, Mutual Funds, & ETFs) $ 115,063,872 $ 111,789,264 Equities (Including Equities, Mutual Funds, & ETFs) 215,448,200 217,594,362 Real Estate 51,385 84,806 Life Insurance Policies 239,025 293,251 Alternative Investments 67,718,249 64,852,709 Cash Equivalents-Endowments/Restricted 2,746,451 6,482,248 Beneficial Interests in Split-Interest Agreements 4,339,831 4,957,159 Cash Equivalents 1,210,970 4,892,276 Cash Deposits 35,402,291 21,907,931 Total Investments $ 442,220,274 $ 432,854,006
As Reported on the Statements of Net PositionCurrent Investments:
Cash and Cash Equivalents $ 36,613,261 $ 26,800,207 Noncurrent Investments:
Restricted Cash and Cash Equivalents 1,582,082 1,213 Endowment Investments 188,557,082 189,791,919 Other Long-Term Investments 215,467,849 216,260,667 Total Noncurrent Investments 405,607,013 406,053,799
Total Investments $ 442,220,274 $ 432,854,006
Fair Market Value June 30
Investments at Amortized Cost The university invests in the Governments of Michigan Investing Cooperatively (GovMIC) program. The GovMIC share class was specifically designed for governmental entities and is a class within the broader Michigan Liquid Asset Fund (MILAF) portfolio. This external investment pool provides daily liquidity and flexibility to investors and measures its investments at amortized cost. There are no minimum deposit or redemption requirements for investors in the fund, nor are there any limits on the number of deposits or withdrawals. The fund is invested in compliance with Michigan Public Act 20. For Term MILAF funds, there

NOTES TO THE FINANCIAL STATEMENTS (continued) Central Michigan University
Fi
nanc
ial R
epor
t 202
0
33
is a one-day minimum investment period and investments may not be redeemed, without penalty, for at least 14 calendar days with the exception of direct investments of funds distributed by the State of Michigan. Redemptions made prior to the end of the applicable 14-day period are subject to a penalty equal to 15 days’ interest on the amount redeemed. The university only had holdings in the GovMIC daily liquidity fund of the MILAF portfolio and the values were $1,581,839 as of June 30, 2020 of restricted bond proceeds and $274,255 as of June 30, 2019 of operating cash. Credit Risk For investments in non-mutual and non-pooled funds, no more than 10% of the portfolio, at cost, can be invested in any single issue, except the investments in U.S. government securities. The weighted average quality is to be no less than “AAA” (or its equivalent rating by two national rating agencies) for the short-term investment pool accounts, “AA” for the intermediate-term investment pool accounts, and “A” for the investment grade accounts long-term investment pool accounts. In addition, the minimum acceptable credit quality at the time of purchase for individual securities in the investment grade accounts shall be “A” for the short-term investment pool accounts, and “BBB” for the intermediate-term and investment grade long-term pool accounts. The diversified fixed income manager shall maintain an overall weighted average credit rating of B or better. As of June 30, 2020, the weighted average of all University debt instruments fell within the Standard & Poor’s credit rating range of AAA to B. Interest Rate Risk Interest rate risk is the risk that the value of investments will decrease as a result of a rise in interest rates. The university does not have a formal investment policy that limits investment maturities as a means of managing its exposure to fair value losses arising from increasing interest rates. The maturities of fixed income investments as of June 30, 2020 and 2019 are as follows:
Investment TypeLess than 1
year 1-5 years 5-10 yearsMore than 10
years TotalUS Treasury/TIPS $ 1,812,666 $ 7,040,924 $ 7,655,398 $ 2,988,418 $ 19,497,406Core Fixed Income 2,656,603 12,744,517 6,453,974 5,607,155 27,462,249Short Duration Fixed Income 2,859,684 10,645,714 (144,186) 1,202 13,362,414Emerging Market Debt 961,047 633,376 1,413,197 3,094,267 6,101,887Global Multi-Sector Fixed Income 9,149,694 8,028,391 5,698,900 2,294,530 25,171,515Absolute Return Fixed Income 1,931,449 10,849,442 7,592,028 3,095,482 23,468,401
Total $ 19,371,143 $ 49,942,364 $ 28,669,311 $ 17,081,054 $ 115,063,872
Investment TypeLess than 1
year 1-5 years 5-10 yearsMore than 10
years TotalUS Treasury/TIPS $ 792,859 $ 5,742,670 $ 10,498,486 $ 2,097,900 $ 19,131,915Core Fixed Income 1,864,853 11,237,184 7,289,501 4,927,332 25,318,870Short Duration Fixed Income 2,235,057 10,469,410 58,717 1,276 12,764,460Emerging Market Debt 788,358 755,510 1,723,637 2,704,904 5,972,409 Global Multi-Sector Fixed Income 7,193,917 10,931,844 6,307,496 1,328,016 25,761,273 Absolute Return Fixed Income 3,990,207 8,800,382 7,512,187 2,537,561 22,840,337
Total $ 16,865,251 $ 47,937,000 $ 33,390,024 $ 13,596,989 $ 111,789,264
Fixed Income Investment MaturitiesJune 30, 2020
June 30, 2019Fixed Income Investment Maturities
Concentration of Credit Risk Deliberate management of the asset mix among classes of investments is a necessary and desirable responsibility. In the allocation of assets, diversification of investments among asset classes that are not similarly affected by economic, political or social developments is a highly desirable objective. The
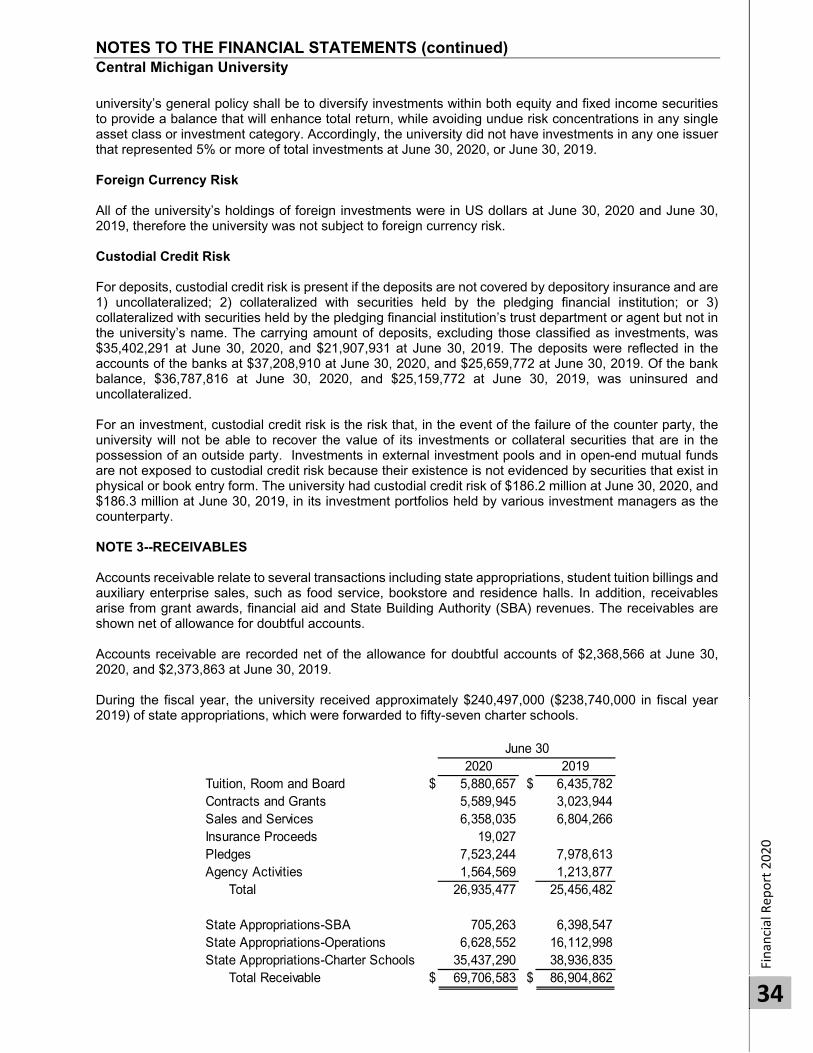
NOTES TO THE FINANCIAL STATEMENTS (continued) Central Michigan University
Finan
cial Rep
ort 2020
34
university’s general policy shall be to diversify investments within both equity and fixed income securities to provide a balance that will enhance total return, while avoiding undue risk concentrations in any single asset class or investment category. Accordingly, the university did not have investments in any one issuer that represented 5% or more of total investments at June 30, 2020, or June 30, 2019. Foreign Currency Risk All of the university’s holdings of foreign investments were in US dollars at June 30, 2020 and June 30, 2019, therefore the university was not subject to foreign currency risk. Custodial Credit Risk For deposits, custodial credit risk is present if the deposits are not covered by depository insurance and are 1) uncollateralized; 2) collateralized with securities held by the pledging financial institution; or 3) collateralized with securities held by the pledging financial institution’s trust department or agent but not in the university’s name. The carrying amount of deposits, excluding those classified as investments, was $35,402,291 at June 30, 2020, and $21,907,931 at June 30, 2019. The deposits were reflected in the accounts of the banks at $37,208,910 at June 30, 2020, and $25,659,772 at June 30, 2019. Of the bank balance, $36,787,816 at June 30, 2020, and $25,159,772 at June 30, 2019, was uninsured and uncollateralized. For an investment, custodial credit risk is the risk that, in the event of the failure of the counter party, the university will not be able to recover the value of its investments or collateral securities that are in the possession of an outside party. Investments in external investment pools and in open-end mutual funds are not exposed to custodial credit risk because their existence is not evidenced by securities that exist in physical or book entry form. The university had custodial credit risk of $186.2 million at June 30, 2020, and $186.3 million at June 30, 2019, in its investment portfolios held by various investment managers as the counterparty. NOTE 3--RECEIVABLES Accounts receivable relate to several transactions including state appropriations, student tuition billings and auxiliary enterprise sales, such as food service, bookstore and residence halls. In addition, receivables arise from grant awards, financial aid and State Building Authority (SBA) revenues. The receivables are shown net of allowance for doubtful accounts. Accounts receivable are recorded net of the allowance for doubtful accounts of $2,368,566 at June 30, 2020, and $2,373,863 at June 30, 2019. During the fiscal year, the university received approximately $240,497,000 ($238,740,000 in fiscal year 2019) of state appropriations, which were forwarded to fifty-seven charter schools.
2020 2019Tuition, Room and Board $ 5,880,657 $ 6,435,782Contracts and Grants 5,589,945 3,023,944Sales and Services 6,358,035 6,804,266Insurance Proceeds 19,027Pledges 7,523,244 7,978,613Agency Activities 1,564,569 1,213,877
Total 26,935,477 25,456,482
State Appropriations-SBA 705,263 6,398,547State Appropriations-Operations 6,628,552 16,112,998State Appropriations-Charter Schools 35,437,290 38,936,835
Total Receivable $ 69,706,583 $ 86,904,862
June 30
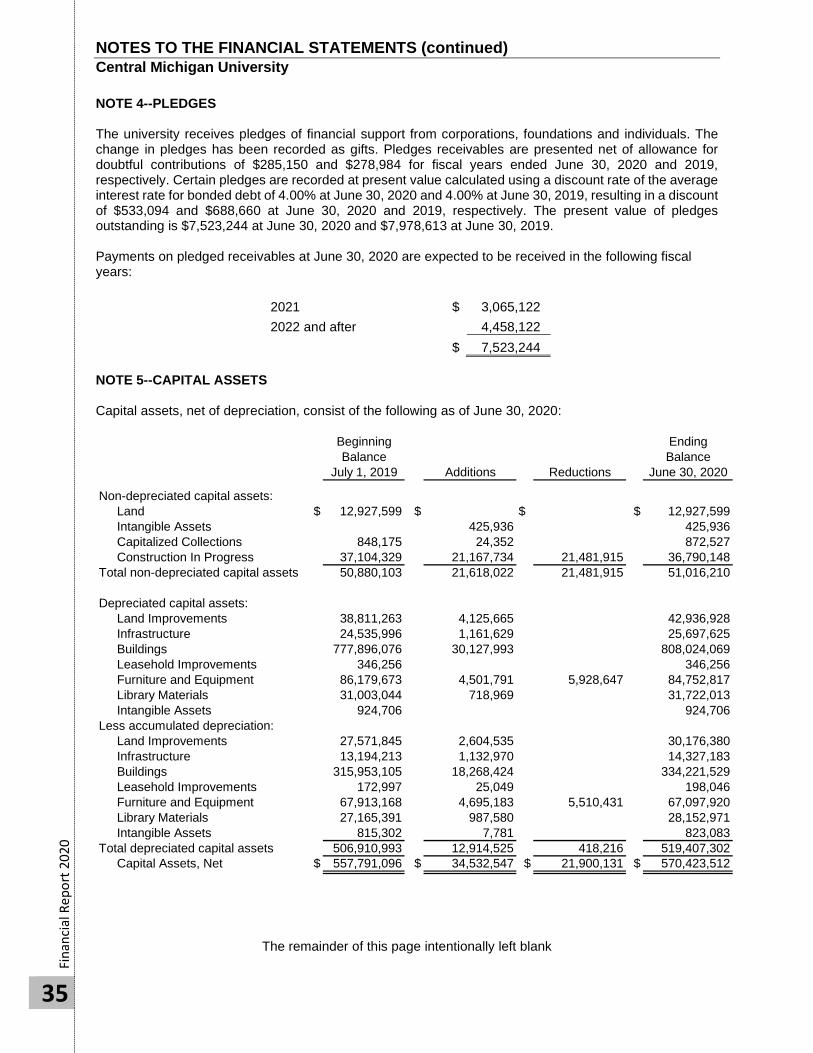
NOTES TO THE FINANCIAL STATEMENTS (continued) Central Michigan University
Fi
nanc
ial R
epor
t 202
0
35
NOTE 4--PLEDGES The university receives pledges of financial support from corporations, foundations and individuals. The change in pledges has been recorded as gifts. Pledges receivables are presented net of allowance for doubtful contributions of $285,150 and $278,984 for fiscal years ended June 30, 2020 and 2019, respectively. Certain pledges are recorded at present value calculated using a discount rate of the average interest rate for bonded debt of 4.00% at June 30, 2020 and 4.00% at June 30, 2019, resulting in a discount of $533,094 and $688,660 at June 30, 2020 and 2019, respectively. The present value of pledges outstanding is $7,523,244 at June 30, 2020 and $7,978,613 at June 30, 2019. Payments on pledged receivables at June 30, 2020 are expected to be received in the following fiscal years:
2021 $ 3,065,122 2022 and after 4,458,122
$ 7,523,244 NOTE 5--CAPITAL ASSETS Capital assets, net of depreciation, consist of the following as of June 30, 2020:
Beginning EndingBalance Balance
July 1, 2019 Additions Reductions June 30, 2020
Non-depreciated capital assets:Land $ 12,927,599 $ $ $ 12,927,599Intangible Assets 425,936 425,936Capitalized Collections 848,175 24,352 872,527Construction In Progress 37,104,329 21,167,734 21,481,915 36,790,148
Total non-depreciated capital assets 50,880,103 21,618,022 21,481,915 51,016,210
Depreciated capital assets:Land Improvements 38,811,263 4,125,665 42,936,928Infrastructure 24,535,996 1,161,629 25,697,625Buildings 777,896,076 30,127,993 808,024,069Leasehold Improvements 346,256 346,256Furniture and Equipment 86,179,673 4,501,791 5,928,647 84,752,817Library Materials 31,003,044 718,969 31,722,013Intangible Assets 924,706 924,706
Less accumulated depreciation:Land Improvements 27,571,845 2,604,535 30,176,380Infrastructure 13,194,213 1,132,970 14,327,183Buildings 315,953,105 18,268,424 334,221,529Leasehold Improvements 172,997 25,049 198,046Furniture and Equipment 67,913,168 4,695,183 5,510,431 67,097,920Library Materials 27,165,391 987,580 28,152,971Intangible Assets 815,302 7,781 823,083
Total depreciated capital assets 506,910,993 12,914,525 418,216 519,407,302Capital Assets, Net $ 557,791,096 $ 34,532,547 $ 21,900,131 $ 570,423,512
The remainder of this page intentionally left blank
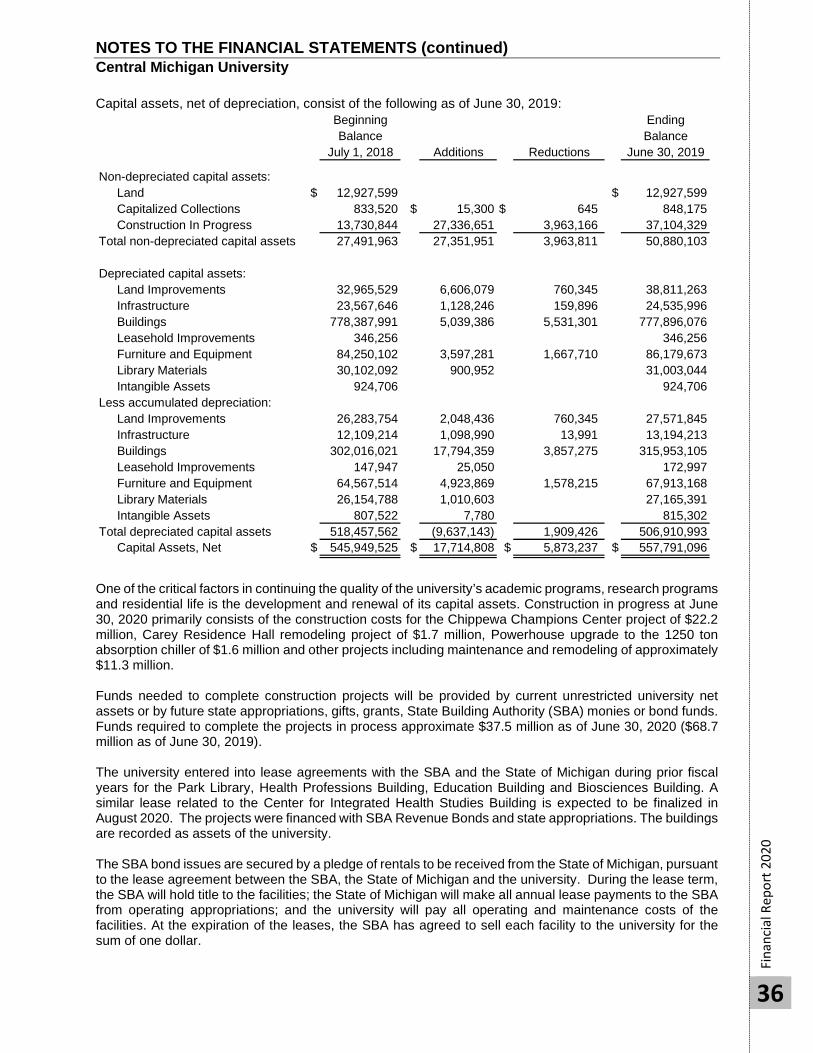
NOTES TO THE FINANCIAL STATEMENTS (continued) Central Michigan University
Fi
nanc
ial R
epor
t 202
0
36
Capital assets, net of depreciation, consist of the following as of June 30, 2019: Beginning EndingBalance Balance
July 1, 2018 Additions Reductions June 30, 2019
Non-depreciated capital assets:Land $ 12,927,599 $ 12,927,599Capitalized Collections 833,520 $ 15,300 $ 645 848,175Construction In Progress 13,730,844 27,336,651 3,963,166 37,104,329
Total non-depreciated capital assets 27,491,963 27,351,951 3,963,811 50,880,103
Depreciated capital assets:Land Improvements 32,965,529 6,606,079 760,345 38,811,263Infrastructure 23,567,646 1,128,246 159,896 24,535,996Buildings 778,387,991 5,039,386 5,531,301 777,896,076Leasehold Improvements 346,256 346,256Furniture and Equipment 84,250,102 3,597,281 1,667,710 86,179,673Library Materials 30,102,092 900,952 31,003,044Intangible Assets 924,706 924,706
Less accumulated depreciation:Land Improvements 26,283,754 2,048,436 760,345 27,571,845Infrastructure 12,109,214 1,098,990 13,991 13,194,213Buildings 302,016,021 17,794,359 3,857,275 315,953,105Leasehold Improvements 147,947 25,050 172,997Furniture and Equipment 64,567,514 4,923,869 1,578,215 67,913,168Library Materials 26,154,788 1,010,603 27,165,391Intangible Assets 807,522 7,780 815,302
Total depreciated capital assets 518,457,562 (9,637,143) 1,909,426 506,910,993Capital Assets, Net $ 545,949,525 $ 17,714,808 $ 5,873,237 $ 557,791,096
One of the critical factors in continuing the quality of the university’s academic programs, research programs and residential life is the development and renewal of its capital assets. Construction in progress at June 30, 2020 primarily consists of the construction costs for the Chippewa Champions Center project of $22.2 million, Carey Residence Hall remodeling project of $1.7 million, Powerhouse upgrade to the 1250 ton absorption chiller of $1.6 million and other projects including maintenance and remodeling of approximately $11.3 million. Funds needed to complete construction projects will be provided by current unrestricted university net assets or by future state appropriations, gifts, grants, State Building Authority (SBA) monies or bond funds. Funds required to complete the projects in process approximate $37.5 million as of June 30, 2020 ($68.7 million as of June 30, 2019). The university entered into lease agreements with the SBA and the State of Michigan during prior fiscal years for the Park Library, Health Professions Building, Education Building and Biosciences Building. A similar lease related to the Center for Integrated Health Studies Building is expected to be finalized in August 2020. The projects were financed with SBA Revenue Bonds and state appropriations. The buildings are recorded as assets of the university. The SBA bond issues are secured by a pledge of rentals to be received from the State of Michigan, pursuant to the lease agreement between the SBA, the State of Michigan and the university. During the lease term, the SBA will hold title to the facilities; the State of Michigan will make all annual lease payments to the SBA from operating appropriations; and the university will pay all operating and maintenance costs of the facilities. At the expiration of the leases, the SBA has agreed to sell each facility to the university for the sum of one dollar.

NOTES TO THE FINANCIAL STATEMENTS (continued) Central Michigan University
Fi
nanc
ial R
epor
t 202
0
37
NOTE 6--ACCOUNTS PAYABLE AND ACCRUED LIABILITIES Accounts payable and accrued liabilities represent amounts due at June 30 for goods and services received prior to the end of the fiscal year.
2020 2019University Wages and Benefits $ 13,188,456 $ 12,774,679University Supplies 28,850,974 23,224,458Charter Schools 35,437,290 38,929,311 Total $ 77,476,720 $ 74,928,448
NOTE 7--LONG-TERM DEBT, HEDGING INSTRUMENTS AND OTHER OBLIGATIONS Long-term debt, hedging instruments and other obligations consist of the following as of June 30, 2020:
Beginning EndingBalance Balance Current
July 1, 2019 Additions Reductions June 30, 2020 PortionGeneral Revenue Bonds:
Series 2008A Series Bonds $ 20,805,000 $ 430,000 $ 20,375,000 $ 555,000 Series 2009A Series Bonds 18,545,000 18,545,000 Series 2009A Unamortized Premium 1,247,000 1,247,000 Series 2012A Series Bonds 21,060,000 580,000 20,480,000 725,000 Series 2014: Series Bonds 40,030,000 1,680,000 38,350,000 1,765,000 Term Bonds 22,105,000 22,105,000Series 2014 Unamortized Premium 6,868,000 272,000 6,596,000 272,000 Series 2016 Series Bonds 18,705,000 740,000 17,965,000 780,000 Series 2016 Unamortized Premium 2,535,000 156,000 2,379,000 156,000 Series 2019 Series Bonds $ 25,410,000 25,410,000 2,125,000 Series 2019 Unamortized Premium 4,416,750 255,750 4,161,000 292,000 Total Long-Term Debt 151,900,000 29,826,750 23,905,750 157,821,000 6,670,000
Other Obligations:Note Payable 300,000 100,000 200,000 100,000 Hedging Instruments 5,509,327 1,063,061 6,572,388Compensated Absences 5,486,163 627,672 6,113,835 231,695 Retirement Service Programs 998,772 239,535 759,237 171,518 Other Obligations 16,216 49,954 62,478 3,692 3,692 Total $ 164,210,478 $ 31,567,437 $ 24,307,763 $ 171,470,152 $ 7,176,905
The remainder of this page intentionally left blank
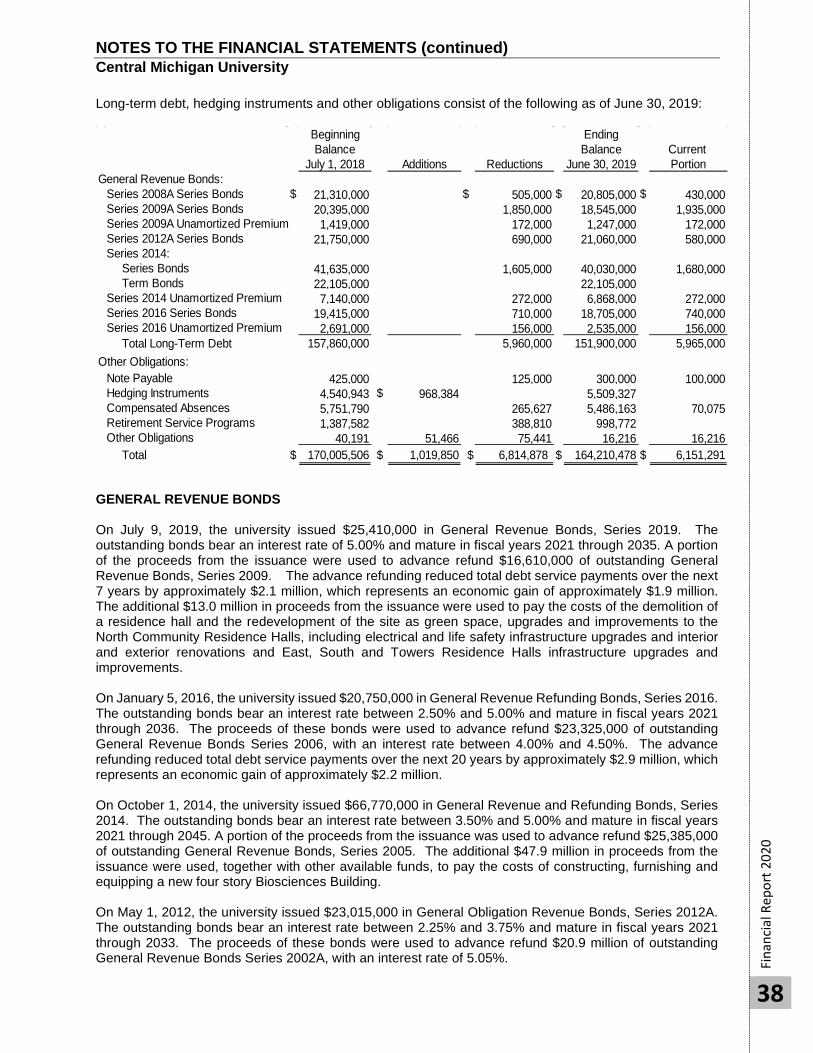
NOTES TO THE FINANCIAL STATEMENTS (continued) Central Michigan University
Fi
nanc
ial R
epor
t 202
0
38
Long-term debt, hedging instruments and other obligations consist of the following as of June 30, 2019:
Beginning EndingBalance Balance Current
July 1, 2018 Additions Reductions June 30, 2019 PortionGeneral Revenue Bonds:
Series 2008A Series Bonds $ 21,310,000 $ 505,000 $ 20,805,000 $ 430,000 Series 2009A Series Bonds 20,395,000 1,850,000 18,545,000 1,935,000 Series 2009A Unamortized Premium 1,419,000 172,000 1,247,000 172,000 Series 2012A Series Bonds 21,750,000 690,000 21,060,000 580,000 Series 2014: Series Bonds 41,635,000 1,605,000 40,030,000 1,680,000 Term Bonds 22,105,000 22,105,000Series 2014 Unamortized Premium 7,140,000 272,000 6,868,000 272,000 Series 2016 Series Bonds 19,415,000 710,000 18,705,000 740,000 Series 2016 Unamortized Premium 2,691,000 156,000 2,535,000 156,000 Total Long-Term Debt 157,860,000 5,960,000 151,900,000 5,965,000
Other Obligations:Note Payable 425,000 125,000 300,000 100,000 Hedging Instruments 4,540,943 $ 968,384 5,509,327Compensated Absences 5,751,790 265,627 5,486,163 70,075 Retirement Service Programs 1,387,582 388,810 998,772Other Obligations 40,191 51,466 75,441 16,216 16,216 Total $ 170,005,506 $ 1,019,850 $ 6,814,878 $ 164,210,478 $ 6,151,291
GENERAL REVENUE BONDS On July 9, 2019, the university issued $25,410,000 in General Revenue Bonds, Series 2019. The outstanding bonds bear an interest rate of 5.00% and mature in fiscal years 2021 through 2035. A portion of the proceeds from the issuance were used to advance refund $16,610,000 of outstanding General Revenue Bonds, Series 2009. The advance refunding reduced total debt service payments over the next 7 years by approximately $2.1 million, which represents an economic gain of approximately $1.9 million. The additional $13.0 million in proceeds from the issuance were used to pay the costs of the demolition of a residence hall and the redevelopment of the site as green space, upgrades and improvements to the North Community Residence Halls, including electrical and life safety infrastructure upgrades and interior and exterior renovations and East, South and Towers Residence Halls infrastructure upgrades and improvements. On January 5, 2016, the university issued $20,750,000 in General Revenue Refunding Bonds, Series 2016. The outstanding bonds bear an interest rate between 2.50% and 5.00% and mature in fiscal years 2021 through 2036. The proceeds of these bonds were used to advance refund $23,325,000 of outstanding General Revenue Bonds Series 2006, with an interest rate between 4.00% and 4.50%. The advance refunding reduced total debt service payments over the next 20 years by approximately $2.9 million, which represents an economic gain of approximately $2.2 million. On October 1, 2014, the university issued $66,770,000 in General Revenue and Refunding Bonds, Series 2014. The outstanding bonds bear an interest rate between 3.50% and 5.00% and mature in fiscal years 2021 through 2045. A portion of the proceeds from the issuance was used to advance refund $25,385,000 of outstanding General Revenue Bonds, Series 2005. The additional $47.9 million in proceeds from the issuance were used, together with other available funds, to pay the costs of constructing, furnishing and equipping a new four story Biosciences Building. On May 1, 2012, the university issued $23,015,000 in General Obligation Revenue Bonds, Series 2012A. The outstanding bonds bear an interest rate between 2.25% and 3.75% and mature in fiscal years 2021 through 2033. The proceeds of these bonds were used to advance refund $20.9 million of outstanding General Revenue Bonds Series 2002A, with an interest rate of 5.05%.

NOTES TO THE FINANCIAL STATEMENTS (continued) Central Michigan University
Fi
nanc
ial R
epor
t 202
0
39
On October 1, 2009, the university issued $32,265,000 in General Revenue Bonds, Series 2009. The outstanding bonds bear an interest rate between 4.00% and 5.00% and mature in fiscal years 2021 through 2027. Proceeds from this issuance were $35,181,688, consisting of principal amount of the bonds ($32,265,000) and net original issue premium of $2,916,688. The proceeds from the sale of the bonds were used to refund the General Revenue Bonds, Series 1998. On May 1, 2008, the university issued $43,025,000 in General Revenue Bonds, Series 2008A. The variable rate bonds mature in the fiscal years 2021 through 2033. Proceeds from this issuance were $43,025,000 of principal. The proceeds from the sale of the bonds were used to retire the 2002 Select Auction Variable Rate Securities (SAVRS) Series A and B bonds. The university retained the related swaps, and these swaps are now designated as a hedge against the General Revenue Bonds, Series 2008A as a means to fix the variable rate bond, and minimize long-term interest rate risk. The principal and interest on notes and bonds are payable only from certain general revenues. The obligations are generally callable. The principal and interest (using June 30, 2020 rates) amounts due in each of the succeeding five years ending June 30 and thereafter are as follows:
Interest RatePrincipal Interest Swaps, Net Total
2021 $ 5,950,000 $ 5,585,706 $ 908,852 $ 12,444,558 2022 6,210,000 5,330,173 895,904 12,436,077 2023 6,505,000 5,055,147 878,269 12,438,416 2024 6,780,000 4,778,129 860,432 12,418,561 2025 7,120,000 4,487,672 838,703 12,446,375
2026-2030 40,935,000 17,900,285 3,453,836 62,289,121 2031-2035 47,505,000 10,206,612 723,042 58,434,654 2036-2040 11,395,000 3,773,125 15,168,125 2041-2045 12,285,000 1,267,700 13,552,700
Total 144,685,000 $ 58,384,549 $ 8,559,038 $ 211,628,587 Unamortized Premium 13,136,000
$ 157,821,000
HEDGING INSTRUMENTS The university has one pay-fixed, receive-variable, interest rate swap at June 30, 2020 and 2019. The objective of this swap is to hedge interest rate risk on the Series 2008A bonds. A description of the swap is as follows: Under this March 2002 swap, the university pays the counterparty a fixed payment of 4.44% and receives a variable payment of 67% of the London Interbank Offered Rate (LIBOR) (0.08271% at June 30, 2020). The swap agreement matures on October 1, 2032. The university received $3,806,000 from the counterparty which was used to terminate the original swap with Lehman Brothers. Effective November 7, 2008, the swap agreement was assumed by Deutsche Bank AG. The swap provisions and termination date remain unchanged. As of June 30, 2020 and 2019, the swap agreement had a notional amount of $20,250,000 and $20,675,000, respectively, and was in a negative position of $6,572,388 and $5,509,327, respectively. As long as the variable rate portion of the swap being received by the university is less than the fixed rate being paid, the university will continue to be in a negative position on the swap. The pay-fixed, receive-variable, interest rate swap is considered a cash flow hedge. The change in fair value was an increase to deferred outflows of $1,063,061 and $968,384 for fiscal year 2020 and 2019, respectively. The accumulated change in fair value of ($6,572,388) and ($5,509,327) is recorded in deferred outflows at June 30, 2020 and 2019, respectively. The fair value of the interest rate swap was estimated using the zero-coupon method. This method calculates the future net settlement payments required by the swap, assuming that the current forward rates
NOTES TO THE FINANCIAL STATEMENTS (continued) Central Michigan University
Fi
nanc
ial R
epor
t 202
0
40
implied by the yield curve correctly anticipate future spot interest rates. These payments are then discounted using the spot rates implied by the current yield curve for hypothetical zero-coupon bonds due on the date of each future net settlement on the swap. To measure non-performance risk for a derivative liability, credit spreads implied by the credit rating for debt issues by entities with similar credit characteristics was used. This is the best method available under current market conditions since the university has no credit default swaps that actively trade in the marketplace. For a derivative asset, the adjustment for non-performance risk of counterparties is determined by analyzing counterparty-specific credit default swaps, if available. If not available, credit default swaps in the market for entities of similar type and rating are used. This analysis is used to construct a credit curve that is applied to the discount curve on the net settlement payments of the derivative. Credit Risk As of June 30, 2020 and 2019, the hedging derivative instrument is a liability and therefore the university is not exposed to the credit risk of its swap counterparties. However, should interest rates change and the fair value of the swap become positive, the university would be exposed to credit risk in the amount of the hedging instrument’s fair value. As of June 30, 2020 and 2019, the derivative counterparty is rated Baa3 and Baa2, respectively, which suggests a capacity to meet financial commitments. The university is not aware of any circumstance or condition that would preclude the counterparty from complying with the terms of the derivative agreement. The university monitors counterparty credit risk on an ongoing basis for any significant adverse changes. Interest Rate Risk Interest payments on the hedged variable-rate debt are generally expected to increase (decrease) as SIFMA rate increases (decreases). The university believes it has effectively hedged interest rate risk on the hedged portion of its variable-rate debt by entering into an interest rate swap. Basis Risk The variable-rate debt hedged by the interest rate swap is, weekly-resetting variable rate demand obligation bonds. The university is exposed to basis risk since the variable rate receipts from the hedging derivatives are based on a rate or index other than the interest rates the university pays on its hedged debt. Termination Risk The university or its hedging counterparty may terminate a hedging instrument if the other party fails to perform under the terms of the contract. In addition, the university’s swap counterparty has the right to terminate a hedging instrument if the credit rating of the university’s unenhanced, unlimited tax general obligation bonds is withdrawn or reduced by any two of Fitch, Moody’s, and S&P below BBB/Baa2. If such an event occurs, the university could be forced to terminate a derivative in a liability position. Rollover Risk Rollover risk is the risk that a hedging instrument associated with a hedgeable item does not extend to the maturity of that hedgeable item. As of June 30, 2020, the university does not believe that rollover risk is significant. Foreign Currency Risk All hedging instruments are denominated in US dollars and therefore the university is not exposed to foreign currency risk. Market Access Risk Market access risk is the risk that the university will not be able to enter credit markets or that credit will become more costly. For example, to complete a hedging instrument’s objective, an issuance of refunding
NOTES TO THE FINANCIAL STATEMENTS (continued) Central Michigan University
Fi
nanc
ial R
epor
t 202
0
41
bonds may be planned in the future. If at that time the university is unable to enter credit markets, expected cost savings may not be realized. CREDIT LIMIT The university entered into a commercial card services agreement as of January 28, 2011 and amended as of July 16, 2013 and December 21, 2017, which supports the university business card program. As part of the agreement, the university has an available credit limit in the amount of $8 million as of June 30, 2020 and June 30, 2019. The outstanding balance is due monthly. Due to the timing of the monthly close for the credit card statements, the university had an outstanding balance of $125,761 as of June 30, 2020 under the credit limit. There was an outstanding balance of $121,618 as of June 30, 2019. LETTER OF CREDIT In June 2019, the university signed a new stand by Letter of Credit agreement with a new counter party in the amount of outstanding bond principal plus 35 days interest equal to $20,570,377 to provide credit enhancement and liquidity support for certain General Revenue Refunding Bonds, Series 2008A. The expiration date of the stand by Letter of Credit is July 3, 2024. The previous stand by letter of credit agreement was signed on May 1, 2008, amended by a First Amendment agreement dated August 1, 2010, amended by a Second Amendment agreement dated June 28, 2013 and amended by a Third Amendment agreement dated June 30, 2016. The expiration date of the previous stand by Letter of Credit is July 1, 2019. LINE OF CREDIT On June 25, 2020, the university signed a revolving line of credit agreement by which it can borrow up to $60 million. Borrowings against the line of credit are payable from general revenues and secured by a pledge of general revenues of equal standing and priority with the pledge of general revenues for general revenue bonds or notes payable. The expiration date of the line of credit is June 24, 2021. Interest will be paid on amounts outstanding at a rate per annum equal to the sum of LIBOR plus 150 basis points. There have been no draws on this line of credit as of June 30, 2020. OTHER OBLIGATIONS The Retirement Service Award program and compensated absences have been determined to be primarily long-term liabilities. Other obligations have been determined to be primarily short-term liabilities.
The remainder of this page intentionally left blank
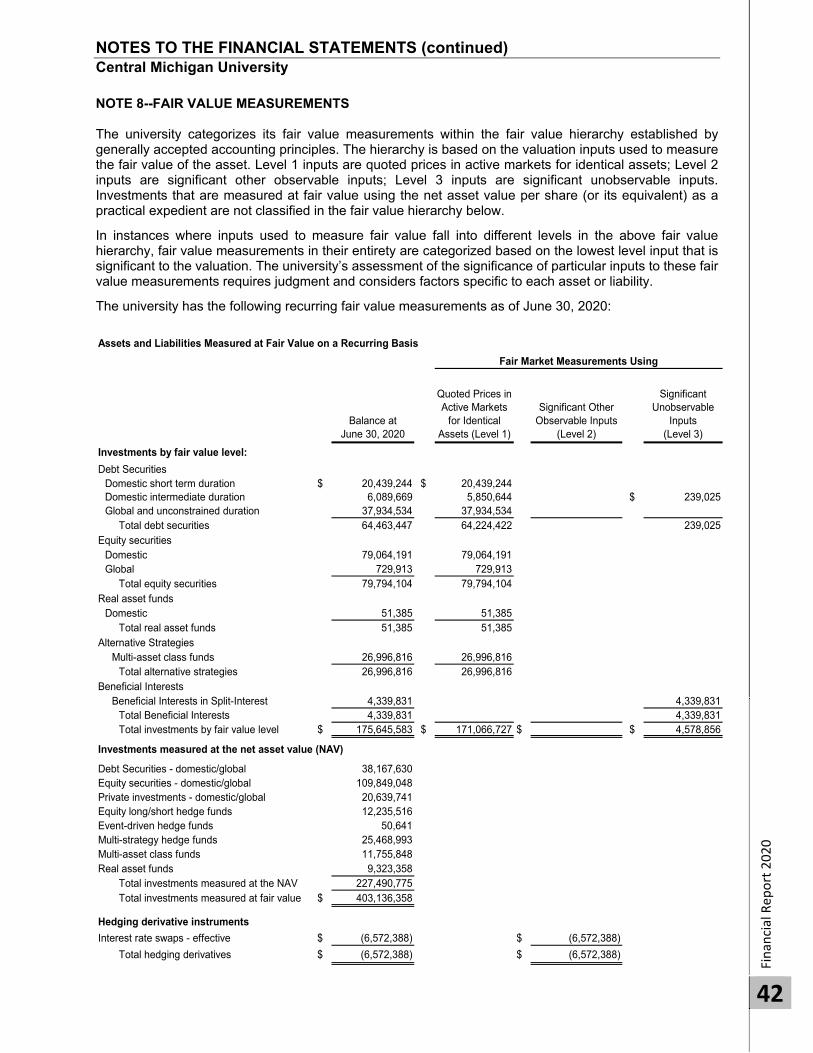
NOTES TO THE FINANCIAL STATEMENTS (continued) Central Michigan University
Finan
cial Rep
ort 2020
42
NOTE 8--FAIR VALUE MEASUREMENTS The university categorizes its fair value measurements within the fair value hierarchy established by generally accepted accounting principles. The hierarchy is based on the valuation inputs used to measure the fair value of the asset. Level 1 inputs are quoted prices in active markets for identical assets; Level 2 inputs are significant other observable inputs; Level 3 inputs are significant unobservable inputs. Investments that are measured at fair value using the net asset value per share (or its equivalent) as a practical expedient are not classified in the fair value hierarchy below.
In instances where inputs used to measure fair value fall into different levels in the above fair value hierarchy, fair value measurements in their entirety are categorized based on the lowest level input that is significant to the valuation. The university’s assessment of the significance of particular inputs to these fair value measurements requires judgment and considers factors specific to each asset or liability.
The university has the following recurring fair value measurements as of June 30, 2020:
Assets and Liabilities Measured at Fair Value on a Recurring Basis
Balance at June 30, 2020
Quoted Prices in Active Markets
for Identical Assets (Level 1)
Significant Other Observable Inputs
(Level 2)
Significant Unobservable
Inputs (Level 3)
Investments by fair value level:
Debt SecuritiesDomestic short term duration $ 20,439,244 $ 20,439,244 Domestic intermediate duration 6,089,669 5,850,644 $ 239,025 Global and unconstrained duration 37,934,534 37,934,534
Total debt securities 64,463,447 64,224,422 239,025 Equity securities
Domestic 79,064,191 79,064,191 Global 729,913 729,913
Total equity securities 79,794,104 79,794,104 Real asset funds
Domestic 51,385 51,385 Total real asset funds 51,385 51,385
Alternative StrategiesMulti-asset class funds 26,996,816 26,996,816
Total alternative strategies 26,996,816 26,996,816 Beneficial Interests
Beneficial Interests in Split-Interest 4,339,831 4,339,831 Total Beneficial Interests 4,339,831 4,339,831 Total investments by fair value level $ 175,645,583 $ 171,066,727 $ $ 4,578,856
Investments measured at the net asset value (NAV)
Debt Securities - domestic/global 38,167,630 Equity securities - domestic/global 109,849,048 Private investments - domestic/global 20,639,741 Equity long/short hedge funds 12,235,516 Event-driven hedge funds 50,641 Multi-strategy hedge funds 25,468,993 Multi-asset class funds 11,755,848 Real asset funds 9,323,358
Total investments measured at the NAV 227,490,775 Total investments measured at fair value $ 403,136,358
Hedging derivative instruments
Interest rate swaps - effective $ (6,572,388) $ (6,572,388)
Total hedging derivatives $ (6,572,388) $ (6,572,388)
Fair Market Measurements Using
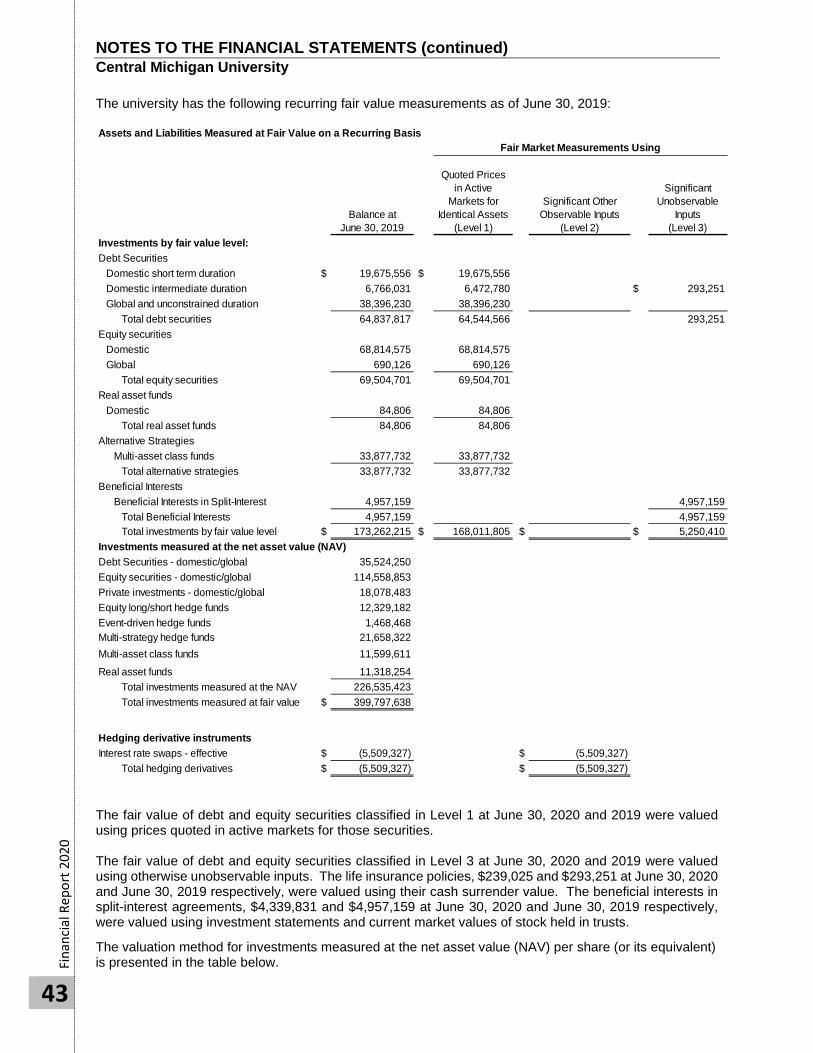
NOTES TO THE FINANCIAL STATEMENTS (continued) Central Michigan University
Fi
nanc
ial R
epor
t 202
0
43
The university has the following recurring fair value measurements as of June 30, 2019:
Assets and Liabilities Measured at Fair Value on a Recurring Basis
Balance at June 30, 2019
Quoted Prices in Active
Markets for Identical Assets
(Level 1)
Significant Other Observable Inputs
(Level 2)
Significant Unobservable
Inputs (Level 3)
Investments by fair value level:Debt Securities
Domestic short term duration $ 19,675,556 $ 19,675,556 Domestic intermediate duration 6,766,031 6,472,780 $ 293,251 Global and unconstrained duration 38,396,230 38,396,230
Total debt securities 64,837,817 64,544,566 293,251 Equity securities
Domestic 68,814,575 68,814,575 Global 690,126 690,126
Total equity securities 69,504,701 69,504,701 Real asset funds
Domestic 84,806 84,806 Total real asset funds 84,806 84,806
Alternative StrategiesMulti-asset class funds 33,877,732 33,877,732
Total alternative strategies 33,877,732 33,877,732 Beneficial Interests
Beneficial Interests in Split-Interest 4,957,159 4,957,159 Total Beneficial Interests 4,957,159 4,957,159 Total investments by fair value level $ 173,262,215 $ 168,011,805 $ $ 5,250,410
Investments measured at the net asset value (NAV)Debt Securities - domestic/global 35,524,250 Equity securities - domestic/global 114,558,853 Private investments - domestic/global 18,078,483 Equity long/short hedge funds 12,329,182 Event-driven hedge funds 1,468,468 Multi-strategy hedge funds 21,658,322 Multi-asset class funds 11,599,611 Real asset funds 11,318,254
Total investments measured at the NAV 226,535,423 Total investments measured at fair value $ 399,797,638
Hedging derivative instrumentsInterest rate swaps - effective $ (5,509,327) $ (5,509,327)
Total hedging derivatives $ (5,509,327) $ (5,509,327)
Fair Market Measurements Using
The fair value of debt and equity securities classified in Level 1 at June 30, 2020 and 2019 were valued using prices quoted in active markets for those securities. The fair value of debt and equity securities classified in Level 3 at June 30, 2020 and 2019 were valued using otherwise unobservable inputs. The life insurance policies, $239,025 and $293,251 at June 30, 2020 and June 30, 2019 respectively, were valued using their cash surrender value. The beneficial interests in split-interest agreements, $4,339,831 and $4,957,159 at June 30, 2020 and June 30, 2019 respectively, were valued using investment statements and current market values of stock held in trusts.
The valuation method for investments measured at the net asset value (NAV) per share (or its equivalent) is presented in the table below.
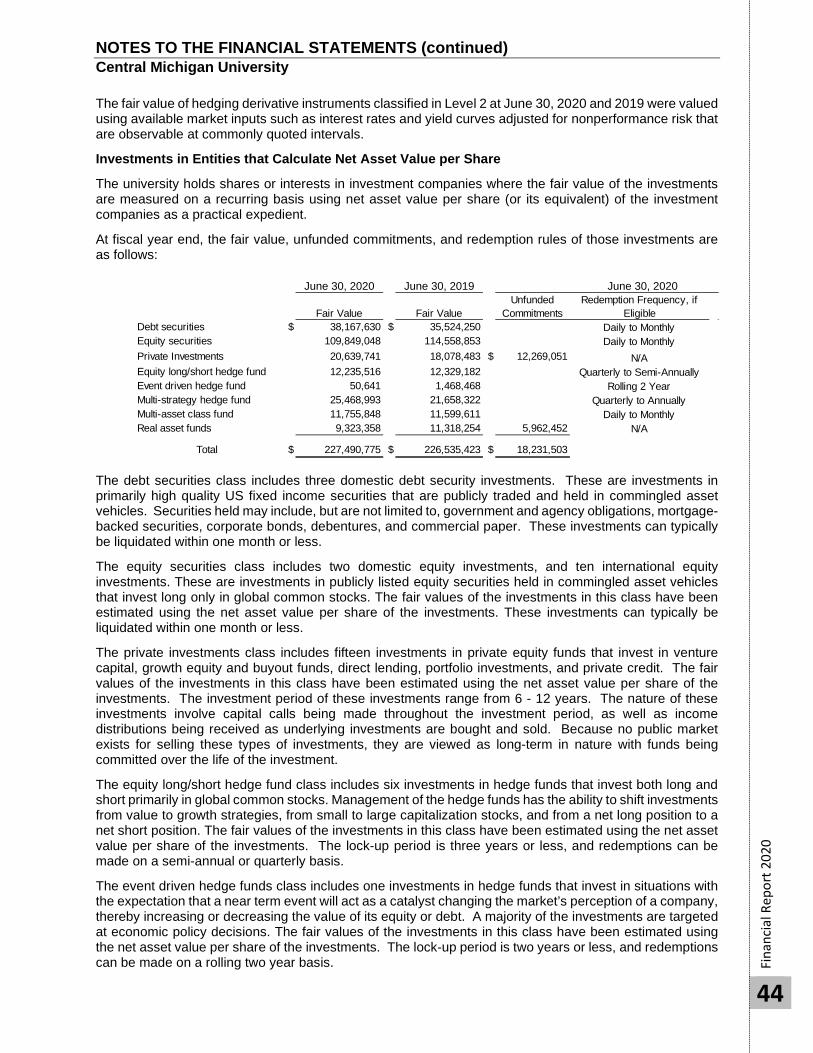
NOTES TO THE FINANCIAL STATEMENTS (continued) Central Michigan University
Fi
nanc
ial R
epor
t 202
0
44
The fair value of hedging derivative instruments classified in Level 2 at June 30, 2020 and 2019 were valued using available market inputs such as interest rates and yield curves adjusted for nonperformance risk that are observable at commonly quoted intervals.
Investments in Entities that Calculate Net Asset Value per Share
The university holds shares or interests in investment companies where the fair value of the investments are measured on a recurring basis using net asset value per share (or its equivalent) of the investment companies as a practical expedient.
At fiscal year end, the fair value, unfunded commitments, and redemption rules of those investments are as follows:
June 30, 2020 June 30, 2019
Fair Value Fair Value Unfunded
Commitments Redemption Frequency, if
Eligible Debt securities $ 38,167,630 $ 35,524,250 Daily to MonthlyEquity securities 109,849,048 114,558,853 Daily to MonthlyPrivate Investments 20,639,741 18,078,483 $ 12,269,051 N/AEquity long/short hedge fund 12,235,516 12,329,182 Quarterly to Semi-AnnuallyEvent driven hedge fund 50,641 1,468,468 Rolling 2 YearMulti-strategy hedge fund 25,468,993 21,658,322 Quarterly to AnnuallyMulti-asset class fund 11,755,848 11,599,611 Daily to MonthlyReal asset funds 9,323,358 11,318,254 5,962,452 N/A
Total $ 227,490,775 $ 226,535,423 $ 18,231,503
June 30, 2020
The debt securities class includes three domestic debt security investments. These are investments in primarily high quality US fixed income securities that are publicly traded and held in commingled asset vehicles. Securities held may include, but are not limited to, government and agency obligations, mortgage-backed securities, corporate bonds, debentures, and commercial paper. These investments can typically be liquidated within one month or less.
The equity securities class includes two domestic equity investments, and ten international equity investments. These are investments in publicly listed equity securities held in commingled asset vehicles that invest long only in global common stocks. The fair values of the investments in this class have been estimated using the net asset value per share of the investments. These investments can typically be liquidated within one month or less.
The private investments class includes fifteen investments in private equity funds that invest in venture capital, growth equity and buyout funds, direct lending, portfolio investments, and private credit. The fair values of the investments in this class have been estimated using the net asset value per share of the investments. The investment period of these investments range from 6 - 12 years. The nature of these investments involve capital calls being made throughout the investment period, as well as income distributions being received as underlying investments are bought and sold. Because no public market exists for selling these types of investments, they are viewed as long-term in nature with funds being committed over the life of the investment.
The equity long/short hedge fund class includes six investments in hedge funds that invest both long and short primarily in global common stocks. Management of the hedge funds has the ability to shift investments from value to growth strategies, from small to large capitalization stocks, and from a net long position to a net short position. The fair values of the investments in this class have been estimated using the net asset value per share of the investments. The lock-up period is three years or less, and redemptions can be made on a semi-annual or quarterly basis.
The event driven hedge funds class includes one investments in hedge funds that invest in situations with the expectation that a near term event will act as a catalyst changing the market’s perception of a company, thereby increasing or decreasing the value of its equity or debt. A majority of the investments are targeted at economic policy decisions. The fair values of the investments in this class have been estimated using the net asset value per share of the investments. The lock-up period is two years or less, and redemptions can be made on a rolling two year basis.
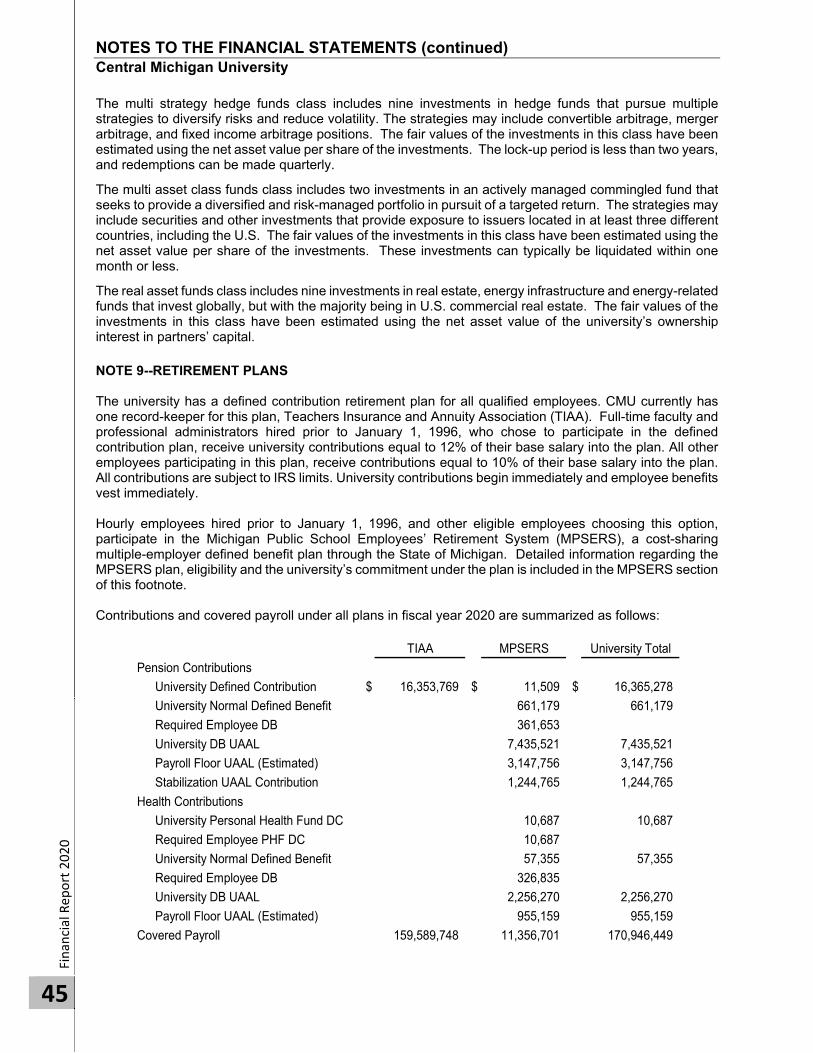
NOTES TO THE FINANCIAL STATEMENTS (continued) Central Michigan University
Finan
cial Rep
ort 2020
45
The multi strategy hedge funds class includes nine investments in hedge funds that pursue multiple strategies to diversify risks and reduce volatility. The strategies may include convertible arbitrage, merger arbitrage, and fixed income arbitrage positions. The fair values of the investments in this class have been estimated using the net asset value per share of the investments. The lock-up period is less than two years, and redemptions can be made quarterly.
The multi asset class funds class includes two investments in an actively managed commingled fund that seeks to provide a diversified and risk-managed portfolio in pursuit of a targeted return. The strategies may include securities and other investments that provide exposure to issuers located in at least three different countries, including the U.S. The fair values of the investments in this class have been estimated using the net asset value per share of the investments. These investments can typically be liquidated within one month or less.
The real asset funds class includes nine investments in real estate, energy infrastructure and energy-related funds that invest globally, but with the majority being in U.S. commercial real estate. The fair values of the investments in this class have been estimated using the net asset value of the university’s ownership interest in partners’ capital.
NOTE 9--RETIREMENT PLANS The university has a defined contribution retirement plan for all qualified employees. CMU currently has one record-keeper for this plan, Teachers Insurance and Annuity Association (TIAA). Full-time faculty and professional administrators hired prior to January 1, 1996, who chose to participate in the defined contribution plan, receive university contributions equal to 12% of their base salary into the plan. All other employees participating in this plan, receive contributions equal to 10% of their base salary into the plan. All contributions are subject to IRS limits. University contributions begin immediately and employee benefits vest immediately. Hourly employees hired prior to January 1, 1996, and other eligible employees choosing this option, participate in the Michigan Public School Employees’ Retirement System (MPSERS), a cost-sharing multiple-employer defined benefit plan through the State of Michigan. Detailed information regarding the MPSERS plan, eligibility and the university’s commitment under the plan is included in the MPSERS section of this footnote. Contributions and covered payroll under all plans in fiscal year 2020 are summarized as follows:
TIAA MPSERS University Total
Pension Contributions
University Defined Contribution $ 16,353,769 $ 11,509 $ 16,365,278
University Normal Defined Benefit 661,179 661,179
Required Employee DB 361,653
University DB UAAL 7,435,521 7,435,521
Payroll Floor UAAL (Estimated) 3,147,756 3,147,756
Stabilization UAAL Contribution 1,244,765 1,244,765
Health Contributions
University Personal Health Fund DC 10,687 10,687
Required Employee PHF DC 10,687
University Normal Defined Benefit 57,355 57,355
Required Employee DB 326,835
University DB UAAL 2,256,270 2,256,270
Payroll Floor UAAL (Estimated) 955,159 955,159
Covered Payroll 159,589,748 11,356,701 170,946,449

NOTES TO THE FINANCIAL STATEMENTS (continued) Central Michigan University
Finan
cial Rep
ort 2020
46
The university also sponsors the Retirement Service Award program covering certain employees hired before a specific date in 1976 and certain maintenance and food service employees. The plan provides for distributions to qualifying employees at retirement based principally on length of service and salary at retirement. Liabilities of $673,716 for fiscal year 2020 and $858,188 for fiscal year 2019 related to this program are included in the university Statements of Net Position. The assets are included with the university’s cash and cash equivalents. The corresponding liabilities have been included with university’s long-term debt, hedging instruments and other long-term obligations. MPSERS – MICHIGAN PUBLIC SCHOOL EMPLOYEES’ RETIREMENT SYSTEM Plan Description Michigan Public School Employees’ Retirement System (MPSERS), is a cost-sharing multiple-employer defined benefit and defined contribution plan through the State of Michigan. Employees hired on or after January 1, 1996 cannot participate in MPSERS, unless they previously were enrolled in the plan at Central Michigan University, or one of the other six universities that are part of MPSERS. The system provides retirement, survivor, and disability benefits to plan members and their beneficiaries. The system also provides post-employment health care benefits to retirees and beneficiaries who elect to receive those benefits. The State of Michigan Office of Retirement Services issues an annual financial report that includes financial statements and required supplementary information regarding MPSERS. The report is available on the web at http:www.michigan.gov/orsschools, or by writing to the Office of Retirement System (ORS) at 530 West Allegan Street, Lansing MI 48929. In July 2015, ORS determined that MPSERS has two reporting units: universities and non-universities. Office of Retirement Services provided the universities a separate net pension liability and net other postemployment benefits (OPEB) liability. Separate pension and OPEB information related to the universities reporting unit included in this plan is not available. Contributions Public Act 300 of 1980, as amended, required the university to contribute amounts necessary to finance the coverage of pension and OPEB benefits of active and retired members. Contribution provisions are specified by State statute and may be amended only by action of the State Legislature. Under these provisions, each university’s contribution is expected to finance the costs of benefits earned by employees during the year, with an additional amount to finance a portion of the unfunded accrued liability. The university’s contributions are determined based on employee elections. There are four different benefit options included in the plan available to employees based on date of hire. The university also contributes to MPSERS a percentage of member and non-member payrolls, determined by the plan’s actuaries, for the unfunded actuarial accrued liability (UAAL) portion of future pensions and health benefits. Public Act 136 of 2016 sets a rate cap of 25.73 percent for university employer UAAL contributions. In addition, the new law establishes a requirement for a payroll floor. In a given fiscal year, each university owes UAAL contributions based on the greater of its payroll floor or its actual payroll. The payroll floor was $53,613,315 and $52,562,142 for fiscal year 2020 and 2019, respectively. Contribution rates are adjusted annually by the ORS. The rates for the defined benefit plan are as follows:
Normal
Pension Rate
Unfunded Pension
Rate
Normal
Health Rate
Unfunded
Health Rate 10/01/19 – 06/30/20 6.29% 19.74% 0.58% 5.99% 10/01/18 – 09/30/19 5.29% 19.74% 0.43% 5.99% 07/01/18 – 09/30/18 4.87% 19.60% 0.31% 6.13%
Employees starting between January 1, 1990, and December 31, 1995, are required to contribute between 3.0% and 6.29% of their annual pay. During the period February 1, 2013 through June 30, 2013 employees could transition to a defined contribution plan.
The university’s required defined benefit contributions to MPSERS normal pension costs, totaled $661,179 in fiscal year 2020 and $656,354 in fiscal year 2019. Required employee contributions were $361,653 in fiscal year 2020 and $401,595 in fiscal year 2019. The university’s contributions to the unfunded MPSERS

NOTES TO THE FINANCIAL STATEMENTS (continued) Central Michigan University
Fi
nanc
ial R
epor
t 202
0
47
defined benefit pensions totaled $10,583,277 in fiscal year 2020 and $10,358,012 in fiscal year 2019. The university also recorded $1,244,765 and $1,206,509 of stabilization rate revenue from the State of Michigan to assist in funding the MPSERS pension and health Unfunded Actuarial Accrued Liability (UAAL) for the year ended June 30, 2020 and June 30, 2019, respectively. The university’s contributions toward the MPSERS defined contribution plan totaled $11,509 in fiscal year 2020 and $16,816 in fiscal year 2019.
Benefits Provided
Benefit provisions of the defined benefit pension plan also are established by State statute. Public Act 300 of 1980, as amended, establishes eligibility and benefit provisions for the defined benefit (DB) pension plan.
Depending on the plan option selected, member retirement benefits are calculated as final average compensation, times years of service, times a pension factor ranging from 1.25 percent to 1.50 percent. The requirements to retire begin at the age of 55 with years of service ranging from 10 to 30 years, depending on when the employee became a member. Early retirement is computed in the same manner as a regular pension, but is permanently reduced 0.50 percent for each full and partial month between the pension effective date and the date the member will attain age 60. There is no mandatory retirement age.
Members are eligible for non-duty disability benefits after 10 years of service and for duty-related disability benefits upon hire. Disability retirement benefits are determined in the same manner as retirement benefits but are payable immediately without an actuarial reduction.
Benefits may transfer to a beneficiary upon death, and are determined in the same manner as retirement benefits, but with an actuarial reduction.
Benefit terms provide for annual cost-of-living adjustments to each employee’s retirement allowance subsequent to the employee’s retirement date. The annual adjustment, if applicable, is 3 percent. For some members that do not receive an annual increase, they are eligible to receive a supplemental payment in those years when investment earnings exceed actuarial assumptions. Net Pension Liability, Deferrals, and Pension Expense
At June 30, 2020 and June 30, 2019, the university reported a pension liability of $164,606,252 and $156,499,530, respectively for its proportionate share of the net pension liability as calculated for the universities reporting unit of MPSERS. The net pension liability for fiscal year 2020 was measured as of September 30, 2019, and the total pension liability used to calculate the net pension liability was determined by an actuarial valuation as of September 30, 2018, that used update procedures to roll forward the estimated liability to September 30, 2019. The net pension liability for fiscal year 2019 was measured as of September 30, 2018, and the total pension liability used to calculate the net pension liability was determined by an actuarial valuation as of September 30, 2017, that used update procedures to roll forward the estimated liability to September 30, 2018. The university’s proportion of the net pension liability was based on statutorily required contributions relative to all participating universities’ contributions for the measurement period. At September 30, 2019, September 30, 2018 and September 30, 2017, the university’s proportion was 24.58 percent, 24.49 percent and 24.54 percent respectively of the universities reporting unit. For the year ended June 30, 2020 and June 30, 2019, the university recognized pension expense of $19,283,343 and $29,146,907, respectively. At June 30, 2020 and June 30, 2019, the university reported a payable of $226,320 and $329,046, respectively for the outstanding amount of contributions to the pension plan.
The remainder of this page intentionally left blank
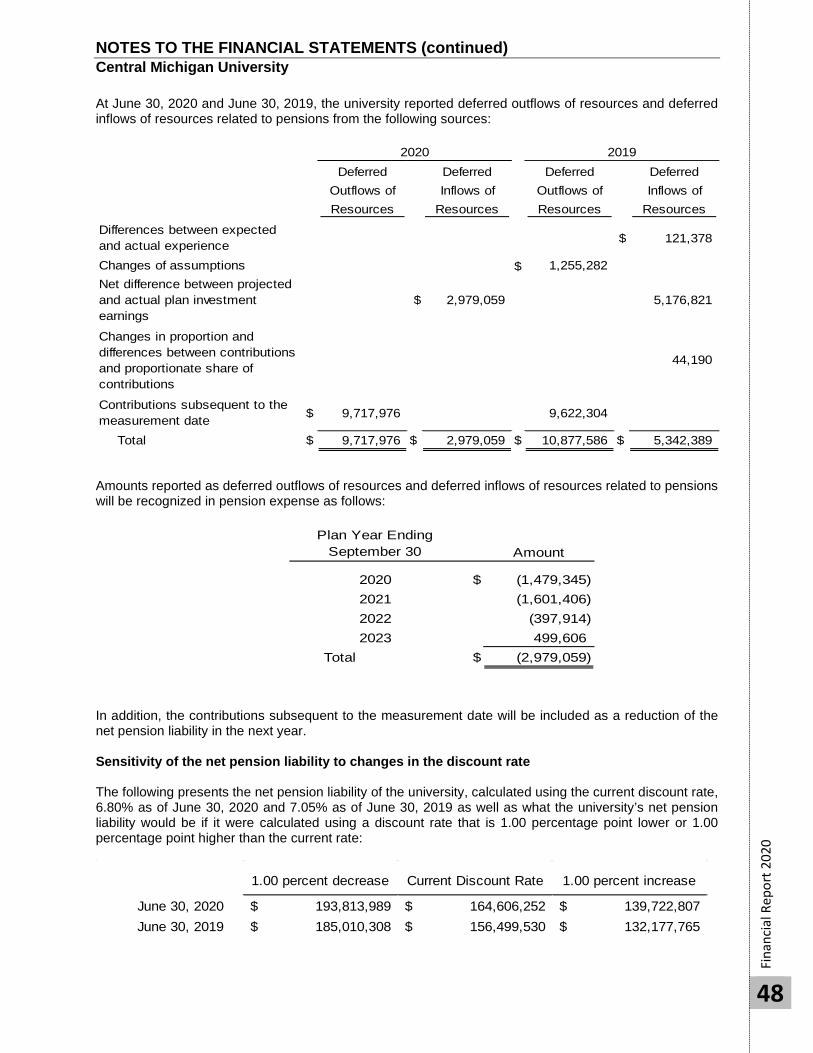
NOTES TO THE FINANCIAL STATEMENTS (continued) Central Michigan University
Fi
nanc
ial R
epor
t 202
0
48
At June 30, 2020 and June 30, 2019, the university reported deferred outflows of resources and deferred inflows of resources related to pensions from the following sources:
Deferred Outflows of Resources
Deferred Inflows of
Resources
Deferred Outflows of Resources
Deferred Inflows of
ResourcesDifferences between expected and actual experience $ 121,378
Changes of assumptions $ 1,255,282 Net difference between projected and actual plan investment earnings
$ 2,979,059 5,176,821
Changes in proportion and differences between contributions and proportionate share of contributions
44,190
Contributions subsequent to the measurement date $ 9,717,976 9,622,304
Total $ 9,717,976 $ 2,979,059 $ 10,877,586 $ 5,342,389
2020 2019
Amounts reported as deferred outflows of resources and deferred inflows of resources related to pensions will be recognized in pension expense as follows:
In addition, the contributions subsequent to the measurement date will be included as a reduction of the net pension liability in the next year. Sensitivity of the net pension liability to changes in the discount rate The following presents the net pension liability of the university, calculated using the current discount rate, 6.80% as of June 30, 2020 and 7.05% as of June 30, 2019 as well as what the university’s net pension liability would be if it were calculated using a discount rate that is 1.00 percentage point lower or 1.00 percentage point higher than the current rate:
1.00 percent decrease Current Discount Rate 1.00 percent increase
June 30, 2020 193,813,989$ 164,606,252$ 139,722,807$ June 30, 2019 185,010,308$ 156,499,530$ 132,177,765$
Plan Year Ending September 30 Amount
2020 $ (1,479,345) 2021 (1,601,406) 2022 (397,914) 2023 499,606
Total $ (2,979,059)
NOTES TO THE FINANCIAL STATEMENTS (continued) Central Michigan University
Fi
nanc
ial R
epor
t 202
0
49
Pension plan fiduciary net position Detailed information about the pension plan’s fiduciary net position is available in the separately issued MPSERS financial report. Postemployment Benefits Other Than Pensions (OPEB) Under the MPSERS Act, all retirees participating in the MPSERS pension plan have the option of continuing health, dental, and vision coverage through MPSERS. The MPSERS Board of trustees annually sets the employer contribution rate to fund the benefits. For the plan years beginning October 1, 2019 and October 1, 2018 the university contribution rate was 5.99% of both member and non-member payroll wages to cover current and future unfunded retiree health benefits. Prior to October 1, 2014 the university contributions were based on actual retiree insurance coverage and corresponding premium subsidy (a pay as you go basis). The university’s monthly contribution for retiree health care benefits, aggregated to $3,268,784 during the 2020 university fiscal year and $3,215,494 during the 2019 university fiscal year. Effective July 1, 2010, all active employees enrolled in MPSERS are required to contribute 3.0% of their pay toward retiree healthcare. Under Public Act 300 of 2012, during the period February 1, 2013 through June 30, 2013 employees could elect out of the healthcare premium subsidy and into the Personal Healthcare Fund (PHF), depending upon their date of hire and retirement plan election. Members were given the choice between continuing the 3% contribution to retiree healthcare and keeping the premium subsidy benefit described above, or choosing not to pay the 3% contribution and instead opting out of the retiree healthcare benefit and becoming a participant in the Personal Healthcare Fund (PHF), a portable, tax-deferred fund that can be used to pay healthcare expenses in retirement. Participants in the PHF are automatically enrolled in a 2% employee contribution into their 457 account as of their transition date, earning them a 2% employer match into a 403B account. The university’s required contributions into PHF accounts were $10,687 and $12,291 for the university fiscal years ended June 30, 2020 and June 30, 2019, respectively. At June 30, 2020 and June 2019, the university reported a liability of $22,739,133 and $29,395,383, respectively, for its proportionate share of the net OPEB liability calculated for the universities reporting unit of MPSERS. The net OPEB liability for fiscal year 2020 was measured as of September 30, 2019, and the total OPEB liability used to calculate the net OPEB liability was determined by an actuarial valuation as of September 30, 2018, that used update procedures to roll forward the estimated liability to September 30, 2019. The net OPEB liability for fiscal year 2019 was measured as of September 30, 2018, and the total OPEB liability used to calculate the net OPEB liability was determined by an actuarial valuation as of September 30, 2017, that used update procedures to roll forward the estimated liability to September 30, 2018. The university’s proportion of the net OPEB liability was based on statutorily required contributions relative to all participating universities’ contributions for the measurement period. At September 30, 2019, September 30, 2018, and September 30, 2017, the university’s proportion was 24.78 percent, 24.78 percent and 24.66 percent respectively, of the universities reporting unit. For the year ended June 30, 2020 and June 30, 2019, the university recognized OPEB expense of $(4,597,806) and $(1,271,151), respectively.
The remainder of this page intentionally left blank
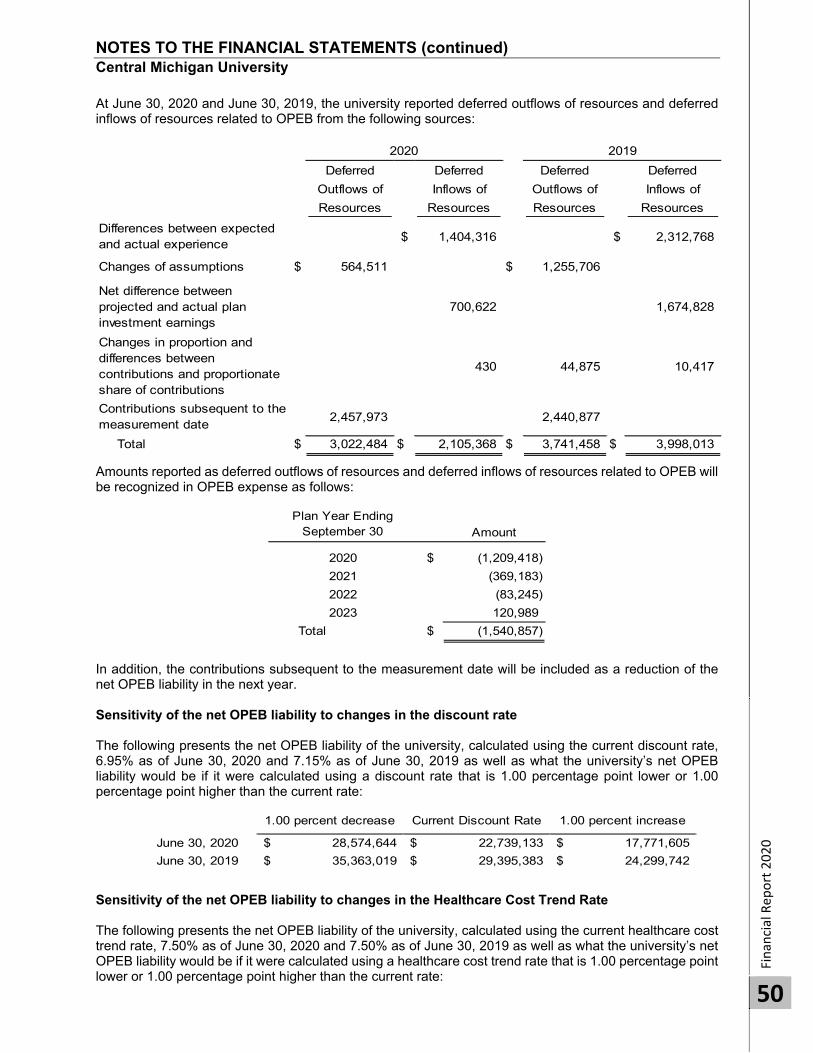
NOTES TO THE FINANCIAL STATEMENTS (continued) Central Michigan University
Finan
cial Rep
ort 2020
50
At June 30, 2020 and June 30, 2019, the university reported deferred outflows of resources and deferred inflows of resources related to OPEB from the following sources:
Deferred
Outflows of
Resources
Deferred
Inflows of
Resources
Deferred
Outflows of
Resources
Deferred
Inflows of
Resources
Differences between expected and actual experience
$ 1,404,316 $ 2,312,768
Changes of assumptions $ 564,511 $ 1,255,706
Net difference between projected and actual plan investment earnings
700,622 1,674,828
Changes in proportion and differences between contributions and proportionate share of contributions
430 44,875 10,417
Contributions subsequent to the measurement date
2,457,973 2,440,877
Total $ 3,022,484 $ 2,105,368 $ 3,741,458 $ 3,998,013
2020 2019
Amounts reported as deferred outflows of resources and deferred inflows of resources related to OPEB will be recognized in OPEB expense as follows:
Plan Year Ending September 30 Amount
2020 $ (1,209,418)
2021 (369,183)
2022 (83,245)
2023 120,989
Total $ (1,540,857)
In addition, the contributions subsequent to the measurement date will be included as a reduction of the net OPEB liability in the next year.
Sensitivity of the net OPEB liability to changes in the discount rate The following presents the net OPEB liability of the university, calculated using the current discount rate, 6.95% as of June 30, 2020 and 7.15% as of June 30, 2019 as well as what the university’s net OPEB liability would be if it were calculated using a discount rate that is 1.00 percentage point lower or 1.00 percentage point higher than the current rate:
1.00 percent decrease Current Discount Rate 1.00 percent increase
June 30, 2020 28,574,644$ 22,739,133$ 17,771,605$
June 30, 2019 35,363,019$ 29,395,383$ 24,299,742$ Sensitivity of the net OPEB liability to changes in the Healthcare Cost Trend Rate The following presents the net OPEB liability of the university, calculated using the current healthcare cost trend rate, 7.50% as of June 30, 2020 and 7.50% as of June 30, 2019 as well as what the university’s net OPEB liability would be if it were calculated using a healthcare cost trend rate that is 1.00 percentage point lower or 1.00 percentage point higher than the current rate:
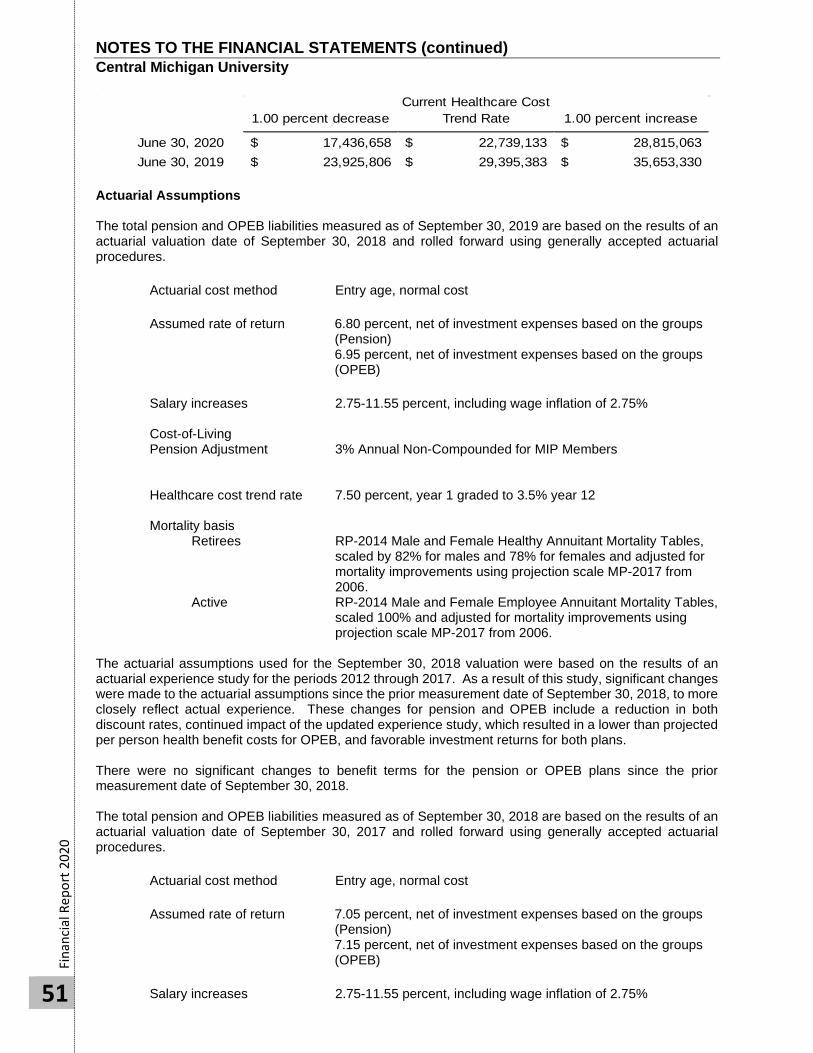
NOTES TO THE FINANCIAL STATEMENTS (continued) Central Michigan University
Fi
nanc
ial R
epor
t 202
0
51
1.00 percent decrease Current Healthcare Cost
Trend Rate 1.00 percent increase
June 30, 2020 17,436,658$ 22,739,133$ 28,815,063$ June 30, 2019 23,925,806$ 29,395,383$ 35,653,330$
Actuarial Assumptions The total pension and OPEB liabilities measured as of September 30, 2019 are based on the results of an actuarial valuation date of September 30, 2018 and rolled forward using generally accepted actuarial procedures.
Actuarial cost method Entry age, normal cost Assumed rate of return 6.80 percent, net of investment expenses based on the groups
(Pension) 6.95 percent, net of investment expenses based on the groups (OPEB)
Salary increases 2.75-11.55 percent, including wage inflation of 2.75% Cost-of-Living Pension Adjustment 3% Annual Non-Compounded for MIP Members Healthcare cost trend rate 7.50 percent, year 1 graded to 3.5% year 12 Mortality basis
Retirees RP-2014 Male and Female Healthy Annuitant Mortality Tables, scaled by 82% for males and 78% for females and adjusted for mortality improvements using projection scale MP-2017 from 2006.
Active RP-2014 Male and Female Employee Annuitant Mortality Tables, scaled 100% and adjusted for mortality improvements using projection scale MP-2017 from 2006.
The actuarial assumptions used for the September 30, 2018 valuation were based on the results of an actuarial experience study for the periods 2012 through 2017. As a result of this study, significant changes were made to the actuarial assumptions since the prior measurement date of September 30, 2018, to more closely reflect actual experience. These changes for pension and OPEB include a reduction in both discount rates, continued impact of the updated experience study, which resulted in a lower than projected per person health benefit costs for OPEB, and favorable investment returns for both plans. There were no significant changes to benefit terms for the pension or OPEB plans since the prior measurement date of September 30, 2018. The total pension and OPEB liabilities measured as of September 30, 2018 are based on the results of an actuarial valuation date of September 30, 2017 and rolled forward using generally accepted actuarial procedures.
Actuarial cost method Entry age, normal cost Assumed rate of return 7.05 percent, net of investment expenses based on the groups
(Pension) 7.15 percent, net of investment expenses based on the groups (OPEB)
Salary increases 2.75-11.55 percent, including wage inflation of 2.75%
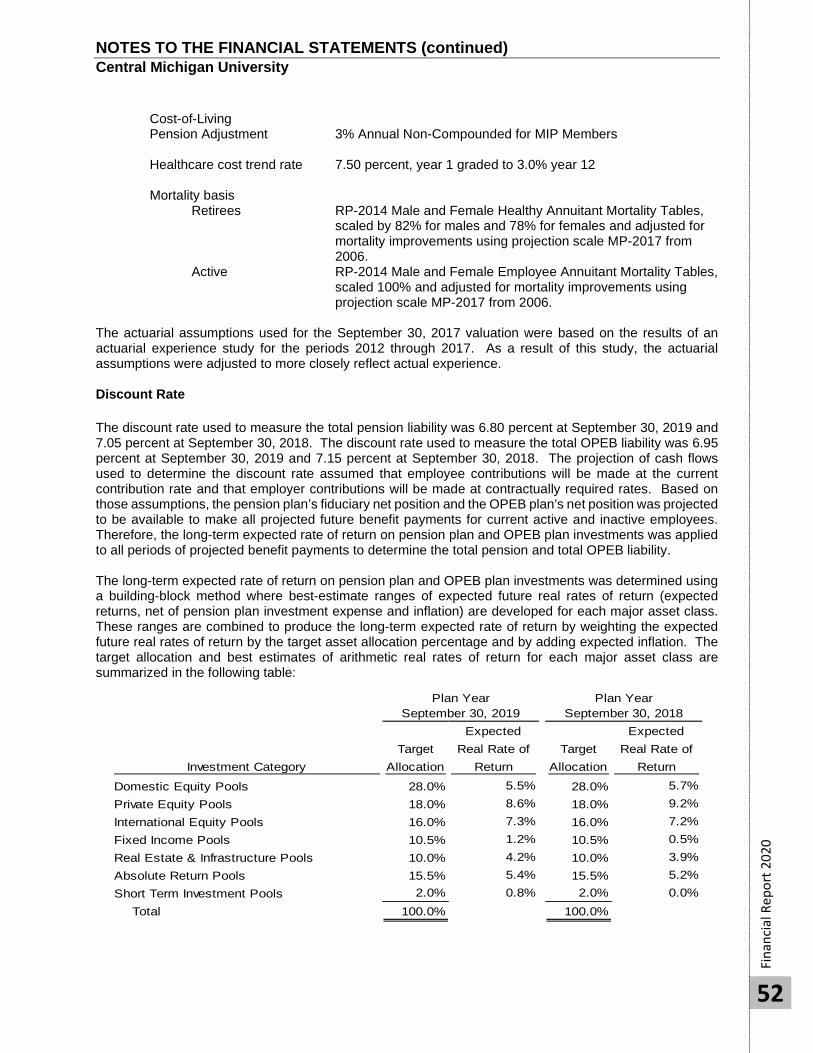
NOTES TO THE FINANCIAL STATEMENTS (continued) Central Michigan University
Fi
nanc
ial R
epor
t 202
0
52
Cost-of-Living Pension Adjustment 3% Annual Non-Compounded for MIP Members Healthcare cost trend rate 7.50 percent, year 1 graded to 3.0% year 12 Mortality basis
Retirees RP-2014 Male and Female Healthy Annuitant Mortality Tables, scaled by 82% for males and 78% for females and adjusted for mortality improvements using projection scale MP-2017 from 2006.
Active RP-2014 Male and Female Employee Annuitant Mortality Tables, scaled 100% and adjusted for mortality improvements using projection scale MP-2017 from 2006.
The actuarial assumptions used for the September 30, 2017 valuation were based on the results of an actuarial experience study for the periods 2012 through 2017. As a result of this study, the actuarial assumptions were adjusted to more closely reflect actual experience. Discount Rate The discount rate used to measure the total pension liability was 6.80 percent at September 30, 2019 and 7.05 percent at September 30, 2018. The discount rate used to measure the total OPEB liability was 6.95 percent at September 30, 2019 and 7.15 percent at September 30, 2018. The projection of cash flows used to determine the discount rate assumed that employee contributions will be made at the current contribution rate and that employer contributions will be made at contractually required rates. Based on those assumptions, the pension plan’s fiduciary net position and the OPEB plan’s net position was projected to be available to make all projected future benefit payments for current active and inactive employees. Therefore, the long-term expected rate of return on pension plan and OPEB plan investments was applied to all periods of projected benefit payments to determine the total pension and total OPEB liability.
The long-term expected rate of return on pension plan and OPEB plan investments was determined using a building-block method where best-estimate ranges of expected future real rates of return (expected returns, net of pension plan investment expense and inflation) are developed for each major asset class. These ranges are combined to produce the long-term expected rate of return by weighting the expected future real rates of return by the target asset allocation percentage and by adding expected inflation. The target allocation and best estimates of arithmetic real rates of return for each major asset class are summarized in the following table:
Investment CategoryTarget
Allocation
Expected
Real Rate of Return
Target Allocation
Expected
Real Rate of Return
Domestic Equity Pools 28.0% 5.5% 28.0% 5.7%Private Equity Pools 18.0% 8.6% 18.0% 9.2%International Equity Pools 16.0% 7.3% 16.0% 7.2%Fixed Income Pools 10.5% 1.2% 10.5% 0.5%Real Estate & Infrastructure Pools 10.0% 4.2% 10.0% 3.9%Absolute Return Pools 15.5% 5.4% 15.5% 5.2%Short Term Investment Pools 2.0% 0.8% 2.0% 0.0%
Total 100.0% 100.0%
Plan Year September 30, 2019
Plan Year September 30, 2018
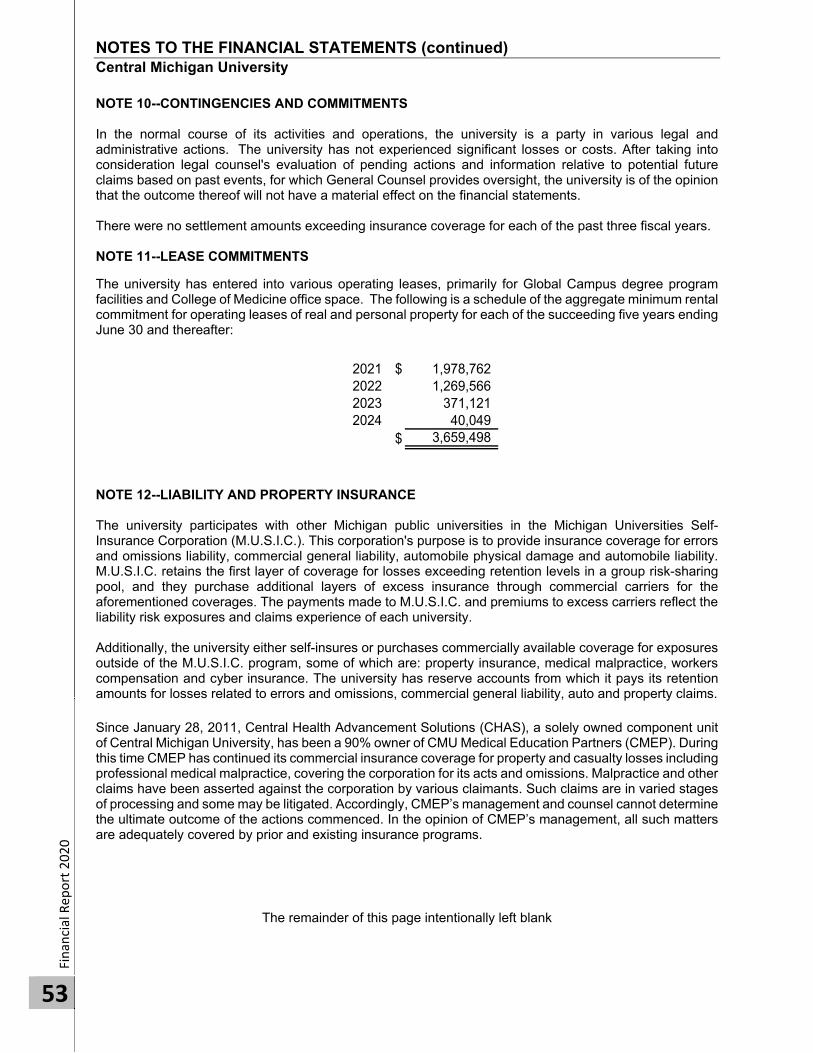
NOTES TO THE FINANCIAL STATEMENTS (continued) Central Michigan University
Finan
cial Rep
ort 2020
53
NOTE 10--CONTINGENCIES AND COMMITMENTS In the normal course of its activities and operations, the university is a party in various legal and administrative actions. The university has not experienced significant losses or costs. After taking into consideration legal counsel's evaluation of pending actions and information relative to potential future claims based on past events, for which General Counsel provides oversight, the university is of the opinion that the outcome thereof will not have a material effect on the financial statements. There were no settlement amounts exceeding insurance coverage for each of the past three fiscal years.
NOTE 11--LEASE COMMITMENTS The university has entered into various operating leases, primarily for Global Campus degree program facilities and College of Medicine office space. The following is a schedule of the aggregate minimum rental commitment for operating leases of real and personal property for each of the succeeding five years ending June 30 and thereafter:
2021 $ 1,978,762 2022 1,269,566 2023 371,121 2024 40,049
$ 3,659,498
NOTE 12--LIABILITY AND PROPERTY INSURANCE The university participates with other Michigan public universities in the Michigan Universities Self-Insurance Corporation (M.U.S.I.C.). This corporation's purpose is to provide insurance coverage for errors and omissions liability, commercial general liability, automobile physical damage and automobile liability. M.U.S.I.C. retains the first layer of coverage for losses exceeding retention levels in a group risk-sharing pool, and they purchase additional layers of excess insurance through commercial carriers for the aforementioned coverages. The payments made to M.U.S.I.C. and premiums to excess carriers reflect the liability risk exposures and claims experience of each university. Additionally, the university either self-insures or purchases commercially available coverage for exposures outside of the M.U.S.I.C. program, some of which are: property insurance, medical malpractice, workers compensation and cyber insurance. The university has reserve accounts from which it pays its retention amounts for losses related to errors and omissions, commercial general liability, auto and property claims.
Since January 28, 2011, Central Health Advancement Solutions (CHAS), a solely owned component unit of Central Michigan University, has been a 90% owner of CMU Medical Education Partners (CMEP). During this time CMEP has continued its commercial insurance coverage for property and casualty losses including professional medical malpractice, covering the corporation for its acts and omissions. Malpractice and other claims have been asserted against the corporation by various claimants. Such claims are in varied stages of processing and some may be litigated. Accordingly, CMEP’s management and counsel cannot determine the ultimate outcome of the actions commenced. In the opinion of CMEP’s management, all such matters are adequately covered by prior and existing insurance programs.
The remainder of this page intentionally left blank

NOTES TO THE FINANCIAL STATEMENTS (continued) Central Michigan University
Fi
nanc
ial R
epor
t 202
0
54
NOTE 13--FUNCTIONAL CLASSIFICATION OF OPERATING EXPENSES The university’s operating expenses by functional classification were as follows for years ended June 30:
Compensation Supplies Scholarshipsand and and
Total Benefits Other Fellowships Utilities DepreciationInstruction $ 139,709,389 $ 127,220,867 $ 7,713,564 $ 4,592,512 $ 182,446 Research 15,992,944 8,338,893 6,908,787 745,264 Public Service 17,422,713 9,434,832 7,621,104 41,270 325,507 Academic Support 49,401,126 35,146,481 14,042,918 176,270 35,457 Student Services 23,893,827 17,670,664 6,045,415 177,748 Institutional Support 35,857,518 27,199,950 8,542,303 41,917 73,348 Operations and Maintenance of Plant 33,493,714 11,173,725 22,285,087 23,812 11,090 Scholarships & Fellowships 18,727,516 1,025,994 200,294 17,501,228 Auxiliary Enterprises 85,518,220 39,611,654 39,896,934 (785,771) 6,795,403 Depreciation 27,721,522 $ 27,721,522 Other (967,910) (51,150) (916,760) Total Operating Expenses 446,770,579 $ 276,771,910 $ 112,339,646 $ 22,514,250 $ 7,423,251 $ 27,721,522 Interest Expense 6,075,061 Total Expenses $ 452,845,640
2020
Compensation Supplies Scholarshipsand and and
Total Benefits Other Fellowships Utilities DepreciationInstruction $ 145,557,704 $ 130,980,742 $ 9,358,106 $ 4,994,989 $ 223,867 Research 15,611,205 7,194,847 7,643,151 773,207 Public Service 16,870,078 9,166,341 7,268,430 68,595 366,712 Academic Support 48,797,683 36,234,982 12,378,232 145,975 38,494 Student Services 24,299,100 17,789,448 6,308,168 202,973 (1,489) Institutional Support 35,899,710 27,409,232 8,368,194 42,855 79,429 Operations and Maintenance of Plant 27,791,395 11,044,104 16,738,588 8,703 Scholarships & Fellowships 12,745,876 1,017,954 274,235 11,453,687 Auxiliary Enterprises 92,645,407 43,089,085 43,058,457 (1,034,875) 7,532,740 Depreciation 26,909,087 $ 26,909,087 Other 12,437,692 (184,877) 12,622,569 Total Operating Expenses 459,564,937 $ 283,741,858 $ 124,018,130 $ 16,647,406 $ 8,248,456 $ 26,909,087 Interest Expense 6,170,560 Total Expenses $ 465,735,497
2019
NOTES TO THE FINANCIAL STATEMENTS (continued) Central Michigan University
Fi
nanc
ial R
epor
t 202
0
55
NOTE 14--NEW ACCOUNTING PRONOUNCEMENTS In January 2017, the Governmental Accounting Standards Board issued GASB Statement No. 84, Fiduciary Activities, establishing criteria for identifying fiduciary activities of governments and improves guidance for accounting and financial reporting related to how these activities should be reported. The university is currently evaluating the impact of this standard, specifically related to holding assets for other organizations and registered student organizations. The provisions of this statement are effective for the university’s financial statements for the year ending June 30, 2021. In June 2017, the Governmental Accounting Standards Board issued GASB Statement No. 87, Leases, which increases the usefulness of governments' financial statements by requiring recognition of certain lease assets and liabilities for leases that previously were classified as operating leases. This statement establishes a single model for lease accounting based on the foundational principle that leases are financings of the right to use an underlying asset. Under this statement, a lessee is required to recognize a lease liability and an intangible right-to-use lease asset, and a lessor is required to recognize a lease receivable and a deferred inflow of resources. The new lease standard is expected to have a significant effect on the university’s financial statements as a result of the lease of space for educational, research, public service and administrative purposes as well as storage that are currently classified as operating leases. The effect of applying the new lease guidance on the financial statements has not yet been determined. The provisions of this statement are effective for the university’s financial statements for the year ending June 30, 2022. In March 2020, the GASB issued Statement No. 93, Replacement of Interbank Offered Rates. With the London Interbank Offered Rate (LIBOR) expecting to cease existence in its current form at the end of 2021, this statement addresses accounting and financial reporting implications that result from the replacement of an interbank offered rate (IBOR) in hedging derivative instruments and leases. The removal of LIBOR as an appropriate benchmark interest rate for a hedging derivative instrument is effective for the University's financial statements for the year ending June 30, 2022. All other requirements of the statement are effective for the University's financial statements for the year ending June 30, 2021. Lease modification requirements are effective one year later.
The remainder of this page intentionally left blank

Finan
cial Rep
ort 2020
56
Required Supplemental Information

REQUIRED SUPPLEMENTAL INFORMATION (continued) Central Michigan University
Finan
cial Rep
ort 2020
57
Schedule of the Institution’s Proportionate Share of the Net Pension Liability Michigan Public School Employees Retirement Plan
(Amounts were determined as of 9/30 of each fiscal year)
2019 2018 2017 2016 2015 2014
University’s proportion of the Universities collective MPSERS net pension liability:
As a percentage 24.58% 24.49% 24.54%
24.49% 23.49% 24.89%
Amount $164,606,252 $156,499,530 $141,154,617 $137,188,658 $128,881,423 $93,365,966
University’s covered payroll $52,821,000 $51,785,566 $52,547,000 $50,770,000 $40,847,274 $45,313,116
University’s proportional share of the collective pension liability (amount), as a percentage of the University’s covered payroll 311.63% 302.21% 268.63% 270.22% 315.52% 206.05%
MPSERS fiduciary net position as a percentage of the total pension liability 44.24% 45.87% 47.42% 46.77% 47.45% 63.00%
Schedule of Institution Pension Contributions Michigan Public School Employees Retirement Plan
(Amounts were determined as of 6/30 of each fiscal year)
2020 2019 2018 2017 2016 2015
Statutorily required contribution $12,489,221 $12,220,875 $11,850,788 $10,398,409 $9,124,243 $8,048,600
Contributions in relation to the actuarially determined contractually required contribution $12,489,221 $12,220,875 $11,850,788 $10,398,409 $9,124,243 $8,048,600
Contribution deficiency (excess)
Covered payroll $53,613,315 $52,562,142 $51,975,500 $52,102,750 $42,389,435 $41,843,844
Contributions as a percentage of covered payroll 23.29% 23.25% 22.80% 19.96% 21.52% 19.23%
NOTES TO REQUIRED SUPPLEMENTAL INFORMATION For the Year Ended June 30, 2020
The employer’s covered payroll is defined by GASB 82, Pension Issues—an amendment to GASB Statements No. 67, No. 68, and No. 73, as payroll on which contributions to a pension plan are based; and by GASB 85, Omnibus 2017, as payroll on which contributions to the OPEB plan are based. For university employers, covered payroll for both pension and OPEB is the greater of 1) university payroll on which contributions to the plan are based or 2) the required minimum payroll amount required by PA 136 of 2016. Changes of benefit terms: There were no changes in benefit terms in 2019, 2018, 2017, 2016, 2015 or 2014. Changes of assumptions: For 2019, the discount rate for the September 30, 2018 annual actuarial valuation decreased by 0.25%. For 2018, the discount rate for the September 30, 2017 annual actuarial valuation decreased by 0.45% and the valuation also includes the impact of an updated experience study for the periods from 2012 to 2017. For 2017, the discount rate for the September 30, 2016 annual actuarial valuation decreased by 0.50%. There were no changes of assumptions in 2016, 2015 or 2014.
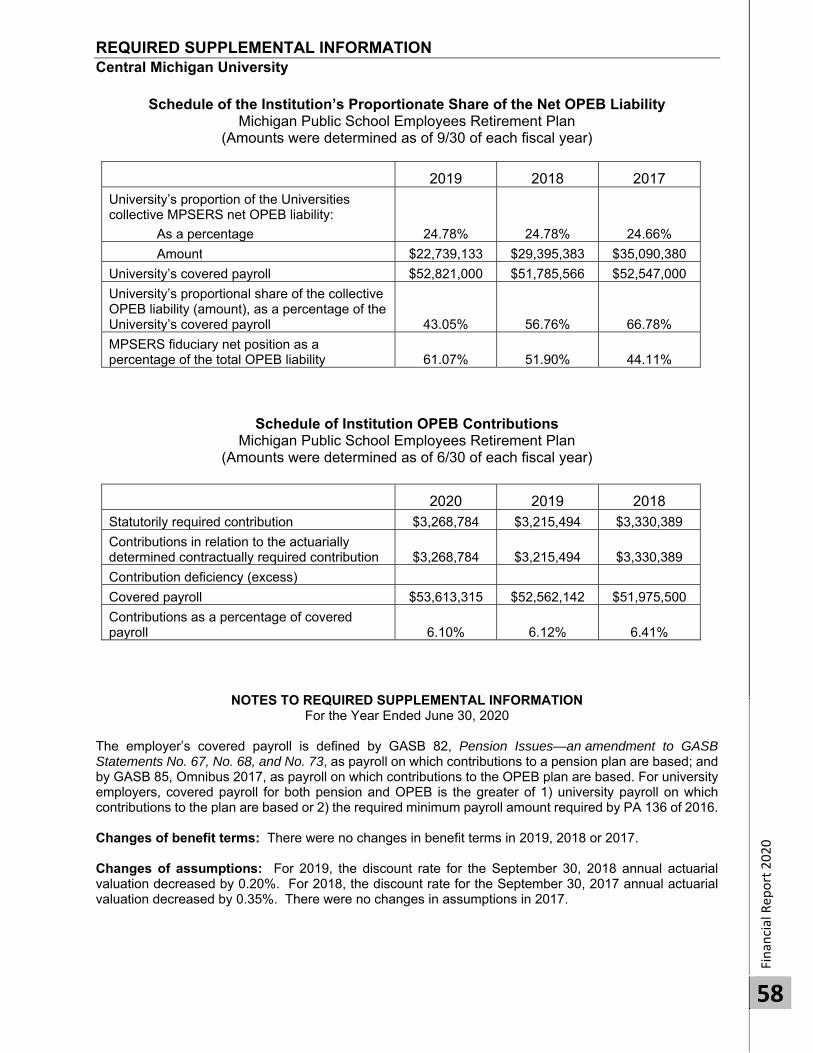
REQUIRED SUPPLEMENTAL INFORMATION Central Michigan University
Finan
cial Rep
ort 2020
58
Schedule of the Institution’s Proportionate Share of the Net OPEB Liability Michigan Public School Employees Retirement Plan
(Amounts were determined as of 9/30 of each fiscal year)
2019 2018 2017University’s proportion of the Universities collective MPSERS net OPEB liability:
As a percentage 24.78% 24.78% 24.66%
Amount $22,739,133 $29,395,383 $35,090,380
University’s covered payroll $52,821,000 $51,785,566 $52,547,000
University’s proportional share of the collective OPEB liability (amount), as a percentage of the University’s covered payroll 43.05% 56.76% 66.78%
MPSERS fiduciary net position as a percentage of the total OPEB liability 61.07% 51.90% 44.11%
Schedule of Institution OPEB Contributions Michigan Public School Employees Retirement Plan
(Amounts were determined as of 6/30 of each fiscal year)
2020 2019 2018Statutorily required contribution $3,268,784 $3,215,494 $3,330,389
Contributions in relation to the actuarially determined contractually required contribution $3,268,784 $3,215,494 $3,330,389
Contribution deficiency (excess)
Covered payroll $53,613,315 $52,562,142 $51,975,500
Contributions as a percentage of covered payroll 6.10% 6.12% 6.41%
NOTES TO REQUIRED SUPPLEMENTAL INFORMATION For the Year Ended June 30, 2020
The employer’s covered payroll is defined by GASB 82, Pension Issues—an amendment to GASB Statements No. 67, No. 68, and No. 73, as payroll on which contributions to a pension plan are based; and by GASB 85, Omnibus 2017, as payroll on which contributions to the OPEB plan are based. For university employers, covered payroll for both pension and OPEB is the greater of 1) university payroll on which contributions to the plan are based or 2) the required minimum payroll amount required by PA 136 of 2016. Changes of benefit terms: There were no changes in benefit terms in 2019, 2018 or 2017. Changes of assumptions: For 2019, the discount rate for the September 30, 2018 annual actuarial valuation decreased by 0.20%. For 2018, the discount rate for the September 30, 2017 annual actuarial valuation decreased by 0.35%. There were no changes in assumptions in 2017.