Embed Size (px)
Citation preview

Fiscal Year 2012-2013
Annual Report
for the

Table of Contents
Page Executive Summary 1 Monthly Operations Report Summary 2 Plant Performance 4 Environmental, Health and Safety 7 System Assessment and Status 9 Outstanding Issues and Recommendations 26 Sales and Marketing 27
Utilities and Fuel Procurement 29
Financial Report 32
Appendix 1 – Customer List
Appendix 2 – Revenues
Appendix 3 – Customer Rate Reconciliation
Appendix 4 – CEPS Invoice Reconciliation (FEA) Exhibit 1 – Performance Guarantee Calculations


Monthly Operations Report Summary Constellation NewEnergy, Inc. (CNE) submits a written report to the Metro Nashville District Energy System (DES) team on or about the 10th day of each month to convey the operational activities of the prior month. These reports are broken up in to four major sections. The first item included in each report is the Summary. This section gives an overview of the entire report, addresses news, events, and other business activities. The next section is Operations, which includes plant reliability and efficiency data, environmental, health & safety, accidents, personnel, and employee training. The third section of the report lists and discusses all Maintenance activities in and around the Energy Generation Facility (EGF). Items covered in this section include the building and grounds, warranty issues, preventive and predictive maintenance and construction projects. The final section of these reports is about the Energy Distribution System (EDS). Items discussed in this section are customers, sales and marketing, system maintenance and repairs, and distribution system projects. Operations Summary The EGF continued to furnish reliable steam and chilled water service to the DES customers over the past twelve months. There was one scheduled chilled water outage and one scheduled steam outage during the year. Some customers requested service interruptions so they could make repairs in their respective buildings. With the exception of these, service has been uninterrupted. The plant is fully staffed with an outstanding work force. There were no reportable or lost time accidents for the year. Training classes were conducted in conjunction with the monthly Safety Meetings. Employees also received training related to plant systems, equipment and corporate programs and requirements. For the tenth consecutive year, there were no environmental excursions or violations. Maintenance activities were performed as scheduled in the EGF and in the EDS. A great deal of planning and coordination go into the project work both in the plant and in the distribution system. Contractors continue to work to complete the open DES projects. Communications with the DES customers are performed on a routine basis. Any issues they might have are dealt with courteously and expeditiously. All customers are reported to be satisfied with the services we are providing. News, Events & Other Business The Nashville District Energy System Invitational Golf Tournament took place on July 21, 2012 at Pine Creek Golf Course in Mt. Juliet, Tennessee. This year marked the 20th Anniversary of this event and was the 9th consecutive year it has been put on by Constellation Energy. This event was attended by customers, employees, contractors, vendors and friends and was a tremendous success.
-2-

A tour of the EGF was conducted on August 23, 2012 for representatives of Felda-IFFCO, a food grade oil producer from Cincinnati, Ohio. CNE also shot a short marketing video clip at the EGF on the same day. Former mayor Bill Purcell was interviewed during this video. In September 2012, CNE Managers attended an annual meeting of the Building Owners and Managers Association and an annual meeting of the Association of Energy Engineers. CNE Managers also attended the Nashville Downtown Partnership Awards Luncheon held in the Renaissance Hotel Grand Ball Room. A group from the Metro Finance Department toured the EGF September 10, 2012. CNE’s General Manager and Operations Supervisor attended a Water Treatment Seminar September 13, 2012. Baltimore Gas & Electric President/CNE SVP met with managers and toured the EGF September 17, 2012. On October 27, 2012, several employees from the Nashville, Hendersonville, Old Hickory, Fort Washington, New York, North Carolina and Pittsburgh offices participated in a Constellation sponsored Habitat for Humanity build in Antioch, TN. Miller-Motte Technical College students toured the EGF on November 3, 2012. The Fall 2012 MNDES e-Newsletter was distributed on November 8, 2012. This issue contained a new interactive feature; a video tour of the EDS tunnels. http://e2.ma/message/9y54c/pv9d1 In February 2013, the Siemens control software was upgraded and the computers were replaced in the Control Room. The Annual DES Customer Meeting was held in the Nashville Downtown Partnership meeting room on March 21, 2013. Kevin Jacobs and Dan Coyle from TEG gave a review of the DES for the past year and anticipated upcoming events. During April 2013, The Tennessee 811 Annual Meeting in Mt. Juliet, Tennessee was attended by plant managers. The Metropolitan Government of Davidson County celebrated its 50th Anniversary on April 6, 2013. The Music City Center Grand Opening and ribbon cutting was held on May 20, 2013. On May 23, 2013, CNE issued the Spring Newsletter. Plant Manager’s attended the annual National Boiler meeting in Alabama on June 7, 2013 and students from Miller-Motte Technical College toured the EGF June 25, 2013. As usual, teleconferences were held on Friday mornings to discuss Natural Gas purchases and Monthly CNE/DES operations meetings were held on the third Wednesday of each month. The Metro DES Advisory Board met quarterly on the third Thursday of August, November, February and May in the EGF conference room.
-3-

Plant Performance Facility Operations Plant Reliability The EGF continued to provide reliable service to the DES customers. The following items describe minor incidents, short in duration, when the EGF experienced an excursion outside parameters of the performance guarantees. With the exception of uncontrollable circumstances, the guarantees are to maintain 150 psig of export steam pressure leaving the EGF and to deliver 43.3 degree chilled water to each customer were met. On July 23, 2012, while starting an additional chiller, the chilled water temperature rose to 45.0° F. It was back to normal within 24 minutes. On September 23, 2012, at approximately 2:00 a. m., the Siemens, MBC, Panel 4, failed and shutdown all of the chillers. Operations personnel restarted the chillers manually and called in CNE I & E personnel. The temperature was above 43.3° F for approximately 65 minutes with a peak of 49.9° F. The panel was replaced and the plant was returned to normal operation. On October 12, 2012, as temperatures rose, one of the two boilers that were in operation was taken offline. Later in the day, the system load increased which required an additional boiler to be placed back online. Before this could be accomplished, the plant experienced a steam pressure drop below 150 psi down for approximately 45 minutes with a low of 143 psi. On November 15, 2012 a system malfunction caused a relief valve to open. The pressure was reduced to 147 psi and was below 150 psi for approximately 90 minutes to allow the valve to re-seat. On January 8, 2013 the steam pressure dropped to 140 psi when the safety relief valve lifted on #1 Boiler. The cause could not be determined, so #2 Boiler was put on line, and the safety valve on #1 Boiler was replaced. The pressure was below 150 psi for approximately 45 minutes. As the steam load increased on January 13, 2013, operators attempted to put #1 Boiler on line. The burner would not light due to a failed flame scanner. Another boiler was put in service in its place. The pressure dropped to 139 psi and was below 150 psi for approximately 45 minutes before the system recovered. The flame scanner was replaced. On January 30, 2013, operators attempted to put #3 Boiler on line. It would not light due to a failed flame scanner. The system pressure dropped to 145 psi before another boiler was put on in its place. The pressure was below 150 psi for approximately 45 minutes. This flame scanner has been replaced.
-4-

On February 8, 2013, while installing a new battery on the server back-up power supply, the cable to the Siemens Insight System was inadvertently disconnected. This caused the chillers to trip off line. The chillers were immediately restarted and were outside of plant guarantees for 36 minutes. The supply temperature peaked at 46.4º F. On February 26, 2013 the steam pressure dropped below 150 psi for approximately 45 minutes, with a low pressure of 147 psi. This occurred while rotating Boilers to even out run time. On March 17, 2013, while putting an additional boiler online, the steam pressure dropped below our 150 psi for approximately 60 minutes. It reached a low point of 136 psi during this timeframe. A leak was discovered in #1 Expansion Tank bladder. Repairs will be made as soon as safe access is established. On March 25, 2013, #1 Boiler tripped off line while CNE I & E personnel were checking the O2 Sensor. The steam pressure was below plant guarantees for approximately 45 minutes with a low pressure reading of 124 psi. On May 2, 2013, the chilled water supply temperature rose above the guarantee for approximately 40 minutes. After performing maintenance on Chiller 6A, water had to be passed through the machine in order to prevent the tubes from freezing while transferring refrigerant back in to the unit. The highest temperature recorded was 45.8º F. On May 4, 2013, the steam pressure fluctuated over a period of 60 minutes. This was caused while putting on an additional boiler due to a higher than normal steam load at the MCC. The lowest pressure recorded was 141 psi. On June 12, 2013, the chilled water supply temperature rose above the guarantee for 8 minutes. While starting a chiller due to increased load another chiller tripped offline. Both of these chillers were re-started immediately. The highest temperature recorded was 44.7º F. Constellation Energy is not required to report any upset that lasts less than thirty minutes. The following availability percentages include every minute the plant was outside the contractual service delivery parameters; not necessarily down. Reliability does not include the scheduled outages allowed per the ARMA.
DowntimeScheduled Unscheduled Availability Reliability
Boilers 1580 minutes 480 minutes 99.61% 99.91%Chillers 390 minutes 181 minutes 99.89% 99.97%
-5-

Plant Efficiency As usual, following the annual boiler inspections at the end of July 2012, two boilers were placed in wet lay-up, one in stand-by, and one de-aerator tank was isolated due to the reduced steam demand during the summer months. One boiler and one de-aerator were left on line. This equipment is rotated monthly. This is done to increase steam efficiency during the cooling season. Stand-by boilers are taken out of wet lay-up and the second DA Tank was put back in service during the month of November in preparation for the heating season. Constellation submitted the final version of the Metro DES annual reconciliation for Fiscal Year 2012 - 2013 on September 24, 2013. The annual reconciliation for this time period consisted primarily of a true-up for chemicals. For reference, the annual reconciliation is included in Appendix 4 of this report. Constellation Energy’s efficiency guarantees consist of five key conversion rates:
1. Electric-to-Steam (kWh per klb-sold) 2. Fuel-to-Steam (Dekatherm per klb-send-out) 3. Water-to-Steam (gallons) 4. Electric-to-Chilled Water (kWh per ton-hr-sold) 5. Water-to-Chilled Water (gallon per ton-hr-sold)
The table below represents the efficiency guarantees from July 1, 2012 through June 30, 2013:
Units of Measure Contractual Guarantee
Actual Rate
1. Electricity-to-Steam kWh per klb 6.000 2.735 2. Fuel-to-Steam Dth per klb 1.684 1.362 3. Water-to-Steam Gallons 12,840,719 12,458,471 4. Electricity-to-Chilled Water kWh per ton-hr 1.055 0.857 5. Water-to-Chilled Water Gallons per ton-hr 5.250 1.780
-6-

Environmental, Health and Safety Environmental There have been no environmental violations since the plant began commercial operations in December 2003. Storm water samples were collected, inspections conducted and a report was generated quarterly. Storm Water Pollution Prevention Plan (SWPPP) refresher training is also conducted annually. Regulatory Compliance Required reporting activities were submitted as follows: • The Semi-Annual Emissions Report was sent to the Metro Nashville Health Department on
July 11, 2012. • The Semi-Annual Air Emissions Report was sent to the Metro Health Department on January
10, 2013.
• The Title V Certificate of Compliance was sent to the EPA on January 10, 2013.
• The Annual Emissions Report and Emission Fees were sent to the Metro Health Department on January 25, 2013.
• The Annual Tier II Reports were sent to the Nashville Fire Department, Davidson County
Local Emergency Planning Commission (LEPC) and the State Emergency Response Commission on January 31, 2013.
• The Annual Greenhouse Gas Report was sent to the EPA on March 1, 2013.
• The CNE EHS Supervisor performed an internal EHS Audit on June 12-13, 2013.
-7-

Health Due to the increasing cost of health insurance and Constellation’s commitment to their employee’s wellbeing, several programs are offered throughout the year. Many Nashville employees have taken advantage of a walking fitness program. Safety CNE plant personnel continue to conduct themselves in a safe manner. There have been no reportable or lost time accidents for the past 23 months. Monthly safety meetings were coordinated and scheduled by the CEPS Operations Manager/Safety Officer. Training classes are conducted in conjunction with each safety meeting. Safety and accident reports are issued and posted each month. The refrigerant alarm, escape devices and gas monitors are checked weekly. Preventative maintenance and calibrations are performed monthly on the portable gas monitors used in the EDS. Fire extinguishers are also checked monthly. Per OSHA standards regarding the electrical code and arc flash hazards, our “hot stick” and “High Voltage Glove Kits” were sent out for inspection and recertification.
Accident Report
Total OSHA Lost Time TotalAccidents Reportable Accidents Lost Days
July 2012 0 0 0 0August 0 0 0 0
September 0 0 0 0October 0 0 0 0
November 0 0 0 0December 0 0 0 0
January 2013 0 0 0 0February 0 0 0 0March 0 0 0 0April 0 0 0 0May 0 0 0 0June 0 0 0 0
Total 0 0 0 0
-8-

System Assessment and Status
Personnel
The plant is fully staffed with an exceptional work force. CNE prides itself on keeping employees engaged which results in a very low turnover rate. There were no personnel changes during FY 2012-13.
Training In order to maintain and operate the facility safely, reliably and efficiently a significant amount of employee training is required. The following demonstrates some of the training that was conducted throughout the year:
• All employees completed Exelon Ethics training. This included three courses; Code of Business Conduct, Preventing Work Place Violence and NERC General Awareness.
• A Water Treatment Seminar was attended by CNE’s Operations Supervisor and Plant
Manager on September 13, 2012 at Gaylord Opryland. • CNE employees completed corporate Retail Power Compliance Training
• CNE employees completed corporate Environmental Management Training • The Maintenance Supervisor, Operations Supervisor and I & E Supervisor completed
annual Building Warden Training on November 28, 2012.
• CNE Managers completed Hyperion Training for corporate Financial Reporting
• CNE employees completed a Diversity and Inclusion on-line survey during the month of January
• A CNE Electrician attended Arc Flash Training provided by Siemens on April 3, 2013.
• CNE Administrative Operations Representative attended continuing education classes to keep his CPA Certification current
• CNE Office Coordinator attended computer classes at New Horizons
-9-

Training classes conducted in conjunction with our monthly safety meetings included:
• Annual Fire Extinguisher Training (conducted by the Metro Fire Department) • Hazardous Communications & Blood borne Pathogens • AED, Adult First Aid and Adult CPR Training and Annual Certification (conducted by the
American Red Cross)
• Confined Space Entry
• Storm Water Pollution Prevention Plan Annual Certification (SWPPP) & Spill Prevention Controls and Countermeasures (SPCC) (conducted by Greg Morris, CNE EHS Manager)
• Slips, Trips, & Falls
• Lock Out/Tag Out
• Emergency Preparedness, Recovery and Contingency
• Workplace Violence, Harassment and Safety
• Heat Stress
• MSDS & Chemical Safety
• Personal Protective Equipment – Eye Safety, Hearing Protection, etc.
All classes, unless otherwise specified, were conducted by Hazmat Training, our safety consultant.
-10-

Customer Service CNE personnel routinely communicate with the customers each month through e-mails, phone calls or visits. When customers have heating or cooling issues inside their buildings, we assist them with trouble-shooting and attempt to resolve their problems. When a service interruption is required, whether it is project related or an emergency, activities are coordinated closely with the customers to keep the impact to a minimum. The annual DES customer meeting took place March 21, 2013 in the Downtown Partnership conference room. The state of the EDS, upcoming projects, fuel costs and many other issues were discussed. DES customers are routinely invited to participate in the CNE/Nashville District Energy System Annual Golf Tournament, attend Titans football games or meet for breakfast or lunch. These relationships help further a positive image of the DES in the community and promote existing building owners to assist us in our sales efforts. CNE’s Customer Service Representative reviews each customers meter readings monthly. For those who do not meet their contractual chilled water return temperature requirements, a Thermal-Inefficiency-Fuel-Surcharge (TIFS) penalty is assessed. TIFS are added directly to customer invoices. When a customer habitually exceeds their contractual demand capacity, the meter data is sent to the DES Contract Administrator for review and evaluation. If a capacity adjustment is deemed appropriate, CNE assists by setting up a meeting with the customer. During these meetings an explanation of the adjustment is discussed. The reason for the excursion is investigated and suggestions are made to keep it from reoccurring. Metro issued letters to the DES customers regarding the re-distribution of engineering and insurance costs. Another letter was issued regarding chilled water delta T control modifications. Both of these proposed changes benefit the customer.
-11-

Facility and Equipment Maintenance During the course of normal operation, preventative, predictive and routine maintenance items must be scheduled and completed. During the summer months the lawn is mowed weekly and landscaping is routinely manicured. This includes trimming trees and shrubs, putting pine straw in the beds, maintaining the irrigation system and replacing dead plants. The building and grounds are policed and the lighting is maintained year round. The carpets are shampooed in the office areas, the tile floors are stripped and waxed and the restroom floors are cleaned and sealed annually.
Preventive and Predictive Maintenance The following items were accomplished to increase equipment life, reliability, efficiency and safety: CNE personnel perform daily equipment inspections, check bearing temperatures, oil levels, belt tensions, etc. In addition, preventative maintenance is performed on the following equipment monthly: HVAC units, cooling towers cell, condenser water pumps, chilled water pumps, boiler feed water pumps, condensate pumps, motors, instrument air compressors and driers. The roof surface is inspected and cleaned. The propane system is also test fired and leak checked monthly. Annual pressure vessel inspections are scheduled to be completed during the cooling season. The inspections are conducted by Arise Incorporated. They are State Certified Boiler Inspectors, working as a subcontractor to our insurance carrier. These inspections are required in order to renew our operating permits. Boiler inspections consist of a visual examination of the mud drum, steam drum, economizer, tubes and fire box. #2 and #4 boilers and #1 de-aerator tanks were inspected in July 2012. #1 and #3 boilers and #2 de-aerator tanks were recently inspected in June 2013. All units received a passing grade and their respective permits have been renewed. #2 and #4 boilers are scheduled to be re-inspected in July 2013. Inspections were witnessed by our chemical vendor’s representative and plant personnel. When units are off line for inspection, preventative maintenance is performed on the forced draft fans, low water cut out switches and other associated equipment. Annual chiller inspections, although not required, are scheduled and executed during the heating season as a good maintenance practice. These inspections include opening the condensers and cleaning the tubes, performing vibration analysis and taking oil sample analysis on each chiller. Eddy Current testing was conducted on Chillers 7, 8 and 9. Controls and purge units are also checked for proper operation.
-12-

As part of the Preventive and Predictive maintenance program CNE had a contractor take alignment and vibration readings on all pumps, fans and motors. These readings are compared to the previous year’s readings. All readings were within the normal range; however, the readings on #5A Chiller were close enough to warrant additional testing. This was performed on May 23, 2013 and it is within acceptable limits. The infrared testing conducted on the chiller motor starters found two loose connections on Chillers 1B and 6B. The fuses were removed, cleaned and checked for tightness. A follow up test indicated the repairs were successful. The high-voltage switch gear preventive maintenance was scheduled and executed during the fall. Inspections and testing was conducted on the following equipment: transformers, vacuum breakers, relays, load break switches, infrared inspections and oil sample analysis. Repairs and Replacements From time to time emergency repairs and replacements must be made. The following are examples of the routine maintenance and emergency repairs that have been performed in the EGF in the past 12 months:
July 2012 • Replaced 8 inch isolation valve on # 2 DA Tank. • Repaired sight glass on Flash Tank • Repaired leak on CWT 8941 chemical line • Installed bypass on # 2 Boiler Mud Drum blow down line • Replaced isolation valve on # 3 Water Softener August 2012 • Replaced batteries in the Siemens MBC Panels • Replaced the flow sensor on # 1 Softener • Calibrated O2 Analyzer on # 4 Boiler • Calibrated O2 Analyzer on # 1 Boiler • PGTI replaced faulty relay on Switchgear 3A • Installed new mud drum blow down valve on # 2 Boiler • Painted Floors in Boiler, Pump and Chiller Alleys • Replaced drive belt on # 9 Cooling Tower
-13-

September 2012 • Installed new signs on exterior of Plant • Trimmed trees • Painted chiller, pump and boiler area floors • Repaired Switchgear 1 exhaust fan • Calibrated the O2 Analyzer on # 2 Boiler • Installed new actuator on # 4 Boiler Blow down October 2012 • Replaced belts on # 6 and # 15 Cooling Towers • Trane replaced purge unit compressor on # 6 B Chiller • Trane replaced capacitors and relays on # 6B and # 9B chiller oil pumps • Installed new main backflow preventer on domestic water line November 2012 • Replaced batteries in Switchgear 2 • Rebuilt #3 Softener Controls • Replaced exhaust fan in Switchgear 1 • Winterization of Boiler Room • Repaired Sprinkler System Air Compressor
December 2012 • Replaced Compressor on Fire Sprinkler System • Repaired strainer on Flash Tank • Replaced condenser water thermometer on # 1 Chiller • Purchased and began installing new computer hardware January 2013 • Installed new gasket on #5 Chiller Condenser Head • Replaced #1 Boiler Safety Relief Valve • Replaced diaphragm on #2 Phosphate Pump • Continue installing new computer hardware • Replace leaving water temperature sensor on #2 Chiller • Replace gauge on #1 Phosphate Pump • Replaced Oil Pump Capacitor and Relay on #7A Chiller • Replaced Flame Scanners on #1 and #3 Boilers. • Replaced batteries in UPS for Switchgear 5
-14-

February 2013 • Replaced belt on # 2 Cooling Tower • Repaired sight glass on Flash Tank • Replaced coupling on # # BFWP • Replace coupling on # 3 Condensate Pump • Repaired # 3 Camera • Installed Oil Heaters in the following Chillers: 1A, 1B, 2B, 4A, 4B, 7A March 2013 • Replaced Gas Vent Valve on # 3 Boiler • Replaced foot valve on # 3 Boiler Phosphate Pump • Replaced Purge suction sensors on the following Chillers: 2A, 7A, 7B & 9B • Repaired junction box on #10 Cooling Tower fan motor • Repaired igniter on # 3Boiler Burner • Inspected and calibrated O2 Analyzer on # 1 Boiler April 2013 • Replaced actuator on # 3 Chiller Condenser Water Inlet Valve • Rebuilt 2 actuators for future use on Chiller Valves • Started up irrigation system for EGF lawn • Weatherproof cable tray wall penetration from switchyard in top building • Trane replaced all flat gaskets on #6 Chiller • Replaced Bearings on #12 Cooling Tower Fan Shaft • PGTI replaced meters on Switchgear 5B and Switchgear 6B • Had carpets cleaned and tile floors stripped and waxed May 2013 • Replaced 1” gate valve on #3 Boiler Steam Blanket • Replaced sight glass on #1 & #3 Boilers • Landscaped around EGF (trimmed trees & shrubs and put pine straw in beds) • Trane replaced purge exhaust solenoid on #7 Chiller • Replaced Bearings on #13 Cooling Tower Fan Shaft • Replaced the pneumatic actuator on #4 Chiller Condenser Water Valve • Replaced Breaker on #17 Cooling Tower • MRG in process of replacing the fill in #6 and #14 Cooling Towers
-15-

June 2013 • Replaced #1 Boiler Mud Drum Blow down Valve • Replaced sight glass on #2 Boiler • Landscaped around EGF (trimmed trees on north side of Plant) • Replaced the pneumatic actuators on #2 and # 6 Chiller Condenser Water Valves • Replaced Breaker on #17 Cooling Tower • MRG replaced the fill in #1 and #9 Cooling Towers • Replaced outboard bearing on #6 Chilled Water Pump • Removed and cleaned strainer on cooling tower blow down line
-16-

Modifications and Improvements The following improvements were performed in and around the generation facility:
Installed new fill in Cooling Towers 1, 6, 9 and 14
Re-coated the basins and riser pipes in Cooling Towers 1, 6, 9 and 14
-17-

Purchased and installed new computers and monitors for plant
Installed new signs on building which included the new Constellation Logo
-18-

Energy Distribution System Preventive and Predictive Maintenance
All the direct buried portions of the EDS are checked monthly by means of thermographic imaging. When a hot spot or cool spot is detected, it indicates a possible leak in our piping. Depending on the severity of the thermal temperature variance from the surrounding area, a determination is made whether to dig up the affected area. Constellation Energy maintenance personnel perform monthly inspections of EDS tunnels, as well as, the State steam tunnel and the A.A. Birch building tunnel. Monthly manhole inspections are also conducted. The condition of the structures, piping, supports, insulation, seals, lighting and ventilation is documented. Any deficiencies noted are prioritized and scheduled for repair accordingly.
CNE personnel have been very diligent in monitoring condensate return quality. When unacceptable levels of iron and hardness contamination are discovered, the condensate return is placed to drain either in the customers building or in the EDS tunnel. This water is not suitable for use in the boilers. Since Constellation Energy has limited control over what the DES customers return, alternative remedies continue to be explored for this problem. When the customer meter readings are taken for the preceding month, the readings are reviewed. If they vary 30% high or low, from the three year average, Instrumentation personnel check the questionable metering devices for calibration as required in the customer buildings. An air compressor was installed in the Andrew Jackson Building mechanical room to operate the Pressure Reducing Valve on the State steam loop. This unit is inspected monthly and maintenance is performed as required. An alarm on this air compressor is tested on a regular basis. Sump pump alarms at the A.A. Birch Building, CJC and Manhole 18 are also tested periodically. Tempering Stations have been installed on the condensate return system in the Regions Bank Building, located at 401 Union Street and in the Municipal Auditorium. These units are inspected for proper operation monthly.
-19-

Routine Maintenance and Emergency Repairs Some repairs can be made without disrupting service to the customers while others require sections of the system to be shut down. When possible, CNE will hire an on-line leak repair contractor to facilitate steam leak repairs without interrupting service to the DES customers. Several expansion joints, valves and flanges were repaired throughout the system during the past year using this technique. The majority of jobs performed in the EDS require off duty policemen to perform traffic control. The following are examples of the routine maintenance and emergency repairs that have been performed on the EDS in FY12-13. July 2012 • Repaired leak on steam trap strainer in Wells Fargo Bank building. August 2012 • CNE I & E personnel repaired conduit and lighting in the Broadway Tunnel. • CNE I & E personnel pulled new wire from the EGF to sump pump in Manhole B. • CNE I & E personnel removed the RTD’s and pressure transmitters from the State Capitol
Building so that renovations could be performed. September 2012 • CNE I & E personnel met with Comcast to troubleshoot a Cx Panel communication issue at
Wells Fargo. • CNE I & E personnel re-installed the RTD’s and pressure transmitters at the State Capitol
Building and re-energized the Cx Panel. October 2012 • CNE Maintenance personnel assisted the State Capitol restore steam service to their building
on October 3, 2012 and Chilled Water service on October 17, 2012. • CNE Maintenance personnel assisted Colt Atlantic with online leak repairs to steam
expansion joints in Manholes 2 and 10. November 2012 • CNE Maintenance personnel replaced the steam traps in Manhole 11 and Manhole A. January 2013 • CNE Maintenance personnel pumped out Manhole B2 16 days and Manhole S5 19 days
during the month. The increase was due to the additional rainfall. Normally, these would only be pumped out once per month.
-20-

February 2013 • CNE Maintenance personnel replaced a failed level transmitter on the Manhole 18
Condensate Tanks on February 5, 2013. • CNE I & E Personnel replaced the temperature control valve on the tempering station at the
Municipal Auditorium on February 14, 2013. • CNE Maintenance personnel assisted TEG and SE Engineering with review of Manholes 1,
2,6,10 and 13 for possible structural repairs on February 21, 2013. • CNE Maintenance personnel assisted CNE’s Operations Manager and representatives from
TEG and Civil Design Group to review the distribution lines from the Plant to Manhole K on February 25, 2013.
March 2013 • CNE Maintenance personnel restored steam service to the Andrew Jackson Building
following contractor repairs on March 2, 2013. • CNE Maintenance personnel restored chilled water service to the Andrew Jackson Building
following contractor repairs on March 4, 2013. • On March 7th and March 21st, CNE Maintenance personnel assisted TEG with their review of
the leaking condensate line from the 4th & Church Building in the 4th Avenue EDS Tunnel. • CNE Maintenance personnel began the disassembly of the south exhaust fan in the 4th Avenue
EDS Tunnel. • CNE Maintenance personnel responded to a water main break at 3rd Avenue South and
Molloy Street on March 12th that flooded Manhole B4. This required monitoring and pumping throughout the night and the following day to prevent damage to the steam line. Additionally, the condensate line insulation was damaged at this intersection while MWS was excavating. The insulation was repaired by our insulation contractor with CNE supervision on March 15, 2013.
April 2013 • The 4th Avenue Tunnel south side exhaust fan repairs were completed and a new motor was
installed. • Metro events personnel anchored something in the lid to Manhole K in Riverfront Park. As a
result, the concrete lid of the vault was stenciled with the following message:
-21-
Property of MNDES DO NOT DRILL

May 2013 • CNE Maintenance and I & E personnel replaced the Temperature Control Valve (TCV) at the
Metro Public Library on May 11, 2013. • CNE Maintenance personnel isolated the chilled water to the State Loop on May 11, 2013 to
allow the State Supreme Court Building personnel to remove a strainer on the chilled water return line in their building.
• CNE Maintenance personnel assisted the contractors with a review of Manholes 1, 2 and 10 on May 30, 2013 for the DES-100 Manhole 10 Roof Replacement and DES-101 Manhole 1 Abandonment Projects.
June 2013 • CNE I&E personnel repaired the HP steam transmitter at the Bridgestone Arena • CNE Maintenance personnel isolated the steam to the Andrew Jackson Building on June 13,
2013 to allow their contractor to make repairs. Service was restored on June 16, 2013.
-22-

DES Projects
A lack of funding kept several projects from being initiated during the past year; however, the following were performed:
DES-033 Manhole Lid and Ring Replacement
This is an open ended project. From time to time it becomes necessary to replace manhole rings and lids, either due to normal wear or Metro Public Works paving projects. The castings are manufactured in Nashville by John Bouchard & Sons and Constellation Energy usually contracts with C.K. Masonry to perform the installations.
DES-077 Music City Center Service Connection
Metro’s contractor completed repairs in Manholes B9 and B10 on July 18, 2012. The manholes were inspected and the steam was initiated between Manhole B4 and Manhole B10. The expansion joints were checked for proper movement and steam traps were checked for proper operation. Steam service from Manhole 10 into the MCCC was provided on July 24, 2012.
DES-077C Steam and Chilled Water Metering
C-Tech checked out the steam metering during the startup on July 24, 2012 and found a bad valve actuator on the main steam line. This was removed and sent back to the factory. A replacement actuator was installed in August 2012.
MCCC Cx Panel MCCC Metering Devices
-23-

DES-080 Miscellaneous Manhole and Tunnel Safety Repairs
This project, carried over from last year, included Change Order #2. A walkthrough was conducted on October 25, 2012. There were two punch list items which were satisfactorily completed in January 2013.
DES-094 Exploratory Excavation & Repairs on Molloy Street
Due to an Independence Day celebration, the paving for this project had to be delayed into FY12-13. The final paving across First Avenue was completed August 10, 2012. All backup documentation was delivered to TEG for review and was approved in October 2012.
Final paving on First Avenue
DES-095A Manhole B2 Water Infiltration Remediation - Vault Leak Repairs
C.K. Masonry sealed the area around the steam penetration on the west side of the manhole on July 3, 2012. This work, along with the repair of the city water line leak, reduced the amount of water entering the manhole significantly.
DES-097 Cooling Tower Performance Test 2 Metro had a second cooling tower performance test conducted by McHale and Associates, Inc. the week of July 23, 2012. TEG shared the final test results with CNE on September 27, 2012. The towers were found to be performing adequately.
-24-

DES-098 Hyatt Place Hotel Service Connections
A pre-bid meeting was held on August 9, 2012 to review the drawings and project specifications with potential contractors. The bids were submitted August 24, 2012 and the project was awarded August 31, 2012. John E. Green was the successful bidder. A coordination meeting was held on September 19, 2012 at the offices of Hunt Hardin Construction to review the project. Installation of the chilled water supply and return lines as well as steam and condensate began as scheduled on October 15, 2012. On November 30, 2012, the project reached substantial completion. The ability to furnish service is in place. A final walkthrough was completed on December 5, 2012 for the service connection portion of this project with no punch list items. The metering was delivered to the mechanical contractor for installation. C-Tech is scheduled to complete the installation and setup of the metering equipment in July 2013 after permanent power provided.
Service lines entering building on Molloy Street Service lines stubbed out in parking garage
-25-

DES-099 2012 Steam Outage
A system wide steam outage was required to remove an 8 inch isolation valve from Manhole B and replace it with a spool piece. This work occurred on July 8th and 9th. Additional work completed during this outage included:
• Cleaning out a drip leg and drain valve and replacing a trap assembly at Station 7-81 in the EDS Tunnel.
• An existing steam trap assembly and isolation valves were replaced at Station B-65 in the EDS Tunnel.
• Packing was replaced in the steam isolation valve to the War Memorial Building in the State Tunnel.
• An existing steam trap assembly and isolation valves were replaced in Manhole 10.
• The hand wheel was replaced on the steam drain valve in Manhole 18. • Isolation valves were replaced on 3 drip legs and trap assemblies in
Manhole L at Riverfront Park. (This was warranty work performed by JEG at no charge)
• Replaced the drain valve on the drip leg in Manhole 23. The steam outage took longer than expected due to several factors:
• Depressurizing of the steam system took approximately 1 ½ hours longer than anticipated because of the low customer load
• Two major thunderstorms required additional pumping of manholes • Due to safety concerns, personnel had to be removed from work site during
the lightning storm. • The contractor had an issue passing a weld x-ray test in Manhole B.
DES-100 Manhole 10 Vault Lid Replacement and Sump Pump Installation
The Pre-bid meeting was held on May 23, 2013 and a site walkthrough was conducted on May 30, 2013. This project was put on hold until design modifications can be completed. In the meantime, Piedmont Gas relocated the natural gas line that ran across the manhole lid. This portion of the project was completed on June 24, 2013.
DES-101 Manhole 1 Abandonment
A Pre-bid meeting was held on May 23, 2013 and a walkthrough to review the project was conducted on May 30, 2013. Bids were received on June 10, 2013 and the project was awarded to Beltline Construction on June 24, 2013. This project is scheduled to be complete by August 1, 2013.
-26-

Outstanding Issues and Recommendations
Each year CNE meets with Metro representatives to discuss outstanding issues and project recommendations. Below is a list of those items. Outstanding Issues Potential projects that should be customer funded: • Polisher on Condensate return system • Oxygen Trim on burners • Capacitor Bank on Electrical feed to plant • Reverse Osmosis system on boiler make-up water • Chilled Water or Ice storage Recommendations for FY 2013-2014
• A. A. Birch Tunnel Structural Repairs and Water Infiltration Remediation • Continue Pipe insulation restoration in manholes • Continue Pipe insulation restoration in tunnels • Replace Bellows Expansion Joint in Manhole 23 • Manhole & Tunnel Structural Steel Rehabilitation & Corrosion Prevention • Repair Manhole 6 concrete vault • Repair Manhole 13 concrete vault • Replace condensate line from Manhole 6 to Manhole 23 • Replace steam and condensate service lines to the Sheraton Hotel • Replace steam and condensate service lines to the Hermitage Hotel • Investigate the installation of additional Division Valves • Investigate decoupling the Polk Building to improve chilled water system hydraulics • Investigate to the possibility of a satellite plant
o This would provide complete system back up in case a catastrophe occurred at the EGF. It would also allow potential new customers to be served south of Broadway.
• Investigate system expansion from existing EGF o Add additional boiler, chiller and associated equipment to existing plant o Add new service lines from plant, west on Peabody Street and north 4th Avenue
connecting to existing lines at Molloy Street to allow for supply piping system redundancy.
-27-

Sales and Marketing
Sales and Marketing Review The potential exists for a major system expansion. Due to the volume of development taking place south of Broadway, around the new Music City Center, several potential new customers have been identified. The proposed new buildings are as follows: • A new Hyatt Regency Hotel is to be built on Broadway between 2nd and 3rd Avenue. • A mixed use complex is slated to be built next door to the Encore at 2nd Avenue and
Demonbreun and is anticipated to be approximately the same size as the new Hyatt Place Hotel
• Another hotel has been proposed to be built on Korean Veterans Parkway between 4th and 5th Avenue and is reported to be larger than the new Omni Hotel next to the Music City Hall of Fame.
• An eight story, mixed use, residential and retail building has been proposed for Peabody Street between 3rd Avenue and Almond Street.
Since the Music City Center is now on line, Metro has decided not to pursue additional customers until we have gained more experience with the actual load requirements of this mammoth building. With the exception of the Hyatt Place Hotel, which has already been connected to the system and scheduled to open in November 2013, sales activities have currently been suspended. Continuing activities include: • A Sales and Marketing Report is included in the Monthly Operations Report. • The DES E-newsletter is produced and issued twice per year. • The CNE/NDES Annual Golf Tournament for existing and potential customers as well as
strategic partners. • CNE personnel participate in Nashville Business groups and developers meetings held
throughout the year. • CNE management staff attends meetings and social events to target local engineering,
development and business groups and provide presentations and tours of DES to point out the positive attributes of the system.
-28-

The following table, furnished by Thermal Engineering Group, Inc., March 14, 2013, indicates the remaining system capacity. System Capacity
Diversity Factor 53.31% 61.40% Chilled Water (tons) Steam (pph) Installed Capacity 20,800 195,000 Capacity including redundant equipment 23,400 260,000 Max Allowable Customer Load 20,400 157,560 Maximum System Peaks 17,225 120,842 Net Undiversified Capacity Available for Sale 3,175 36,719 Net Diversified Capacity Available for Sale 5,705 47,386 Contract Capacity for Existing Customers 30,067 297,554 Diversified Potential for Contract Capacities 36,022 351,240
-29-

Utilities and Fuel Procurement
During FY 2012-2013, CNE provided proactive support to Metro in the areas of fuel procurement and risk management. Metro, in a collaborative effort with CNE, Fellon-McCord and Associates, Inc. and Gas Supply Consulting Company, made natural gas and propane procurement recommendations. Procurement decisions were made based upon a matrix of pricing and consumption factors including but not limited to then-current pricing conditions, future pricing conditions, technical and fundamental pricing trends, consumption variances as a function of incremental demand and conservation and budgetary considerations. All natural gas supply was procured from Atmos Energy Marketing Company (“AEM”) under the terms and conditions of an agreement between CNE and AEM for a service period extending through June 2013. The costs includes the amount paid to AEM for the cost of gas (including transportation to the Nashville city gate), Piedmont for the cost of transportation from the city gate to the plant and the risk management fees, but it does not include the FEA. Following is a report of the natural gas purchased in FY2012-2013: Natural Gas
Month Quantity (DT) Unit Cost AmountJuly, 2012 20,440.8 4.2602$ 87,082.03$ August 23,703.1 4.2600$ 100,975.59$ September 30,163.4 3.8894$ 117,316.70$ October 48,589.1 4.0023$ 194,469.24$ November 57,658.7 4.4619$ 257,267.45$ December 67,197.4 4.4203$ 297,031.52$ January, 2013 79,827.6 4.2397$ 338,447.24$ February 72,451.8 4.2019$ 304,436.49$ March 77,024.5 4.3762$ 337,072.66$ April 46,890.1 4.7277$ 221,682.56$ May 37,439.8 4.8932$ 183,199.36$ June 28,659.7 4.6635$ 133,653.22$
Total 590,046.0 4.3601$ 2,572,634.06$
-30-

Below is the report for propane used during FY2012-2013:
PropaneMonth Quantity (DT) Unit Cost Amount
July, 2012 0 N/A -$ August 0 N/A -$ September 0 N/A -$ October 33 17.6439$ 582.25$ November 25 17.3404$ 433.51$ December 25 17.3404$ 433.51$ January, 2013 0 N/A -$ February 197 17.6046$ 3,468.10$ March 0 N/A -$ April 25 17.3404$ 433.51$ May 0 N/A -$ June 0 N/A -$
Total 305 17.3404$ 5,350.88$
During FY2012-2013, electricity was purchased each month based on the Nashville Electric Service rate schedule. Electricity
Month Quantity (Kwh) Unit Cost AmountJuly, 2012 7,668,711 0.10425$ 799,443.66$ August 6,953,632 0.10504$ 730,420.63$ September 5,742,275 0.11260$ 646,608.31$ October 3,850,005 0.07529$ 289,870.45$ November 2,953,337 0.08032$ 237,206.80$ December 2,752,850 0.10113$ 278,396.59$ January, 2013 2,801,161 0.09826$ 275,244.88$ February 2,602,044 0.09768$ 254,167.77$ March 2,959,823 0.09180$ 271,723.75$ April 3,956,939 0.07453$ 294,919.78$ May 5,304,790 0.07330$ 388,838.26$ June 7,046,185 0.10683$ 752,740.43$
Total 54,591,752 0.09561$ 5,219,581.31$
-31-

The following table indicates the water purchased based on the Metro Water Department rate schedule.
Water & SewerMonth Quantity (Kgal) Unit Cost Amount
July, 2012 18,061,956 0.00363$ 65,541.66$ August 18,756,100 0.00365$ 68,367.09$ September 18,254,940 0.00364$ 66,437.59$ October 10,782,420 0.00365$ 39,351.58$ November 9,512,316 0.00366$ 34,837.70$ December 7,999,112 0.00366$ 29,289.90$ January, 2013 6,829,988 0.00365$ 24,900.86$ February 7,902,620 0.00366$ 28,950.60$ March 6,734,992 0.00366$ 24,680.89$ April 7,537,596 0.00367$ 27,654.13$ May 10,119,692 0.00365$ 36,960.14$ June 14,722,884 0.00364$ 53,626.05$
Total 137,214,616 0.00365$ 500,598.19$
-32-

Financial Report
The following is an explanation of the Appendices associated with this financial report. Appendix 1 – Customer List This chart lists the number of customers served by the District Energy System (DES). The customers are sorted according to three categories: • Private Customers • State of Tennessee Customers • Metropolitan Nashville (City) Customers Appendix 2 – Revenues This chart summarizes the revenues charged per month by DES to each customer for fiscal year 2012-2013. Appendix 3 – Customer Rate Reconciliation Monthly Reconciliation charts from July 2012 to June 2013 are found in this appendix. The final chart is a Summary Reconciliation table for FY 12-13. These charts detail the amount allocable to customers to the amount allocated to customers. The difference in the allocable amount and the amount allocated to customers is paid by Metro and is called the Metro Funding Amount (MFA). a. Facilities Capital Charge – The debt service on revenue bonds issued for the project.
b. System Operator Charge – Includes the system operator’s fee which is most of the
operations and maintenance costs of the system.
c. EDS Improvements Charge – Due to a CPI adjustment of 1.0278%, the annual replacement and repair allowance was $184,370 for FY 12-13.
d. Metro Incremental Administrative Charge – Per the customer service agreement are the “actual, reasonable and necessary” cost over and above current Metro operating costs to manage the DES system and operator.
e. Pass Through Charges –
i. Water and Sewer – The actual cost of providing water and sewer services. ii. Water Treatment Chemicals – The actual cost of chemicals for treating water.
-32-

iii. Engineering – The engineering costs required for any non-capital projects, customer related issues, meetings, etc.
iv. Insurance – The cost to maintain all-risk property insurance and business insurance policies.
v. EDS Electricity – The cost of electricity for tunnel lights and safety equipment. vi. EDS Surcharge – Surcharge to private customers only to cap their annual cost of any
EDS repairs made by Metro ($73,621). f. Energy Charges –
i. Electricity – The actual cost of electricity. ii. Natural Gas – The actual cost of natural gas.
iii. Propane Gas – The actual cost of propane.
Appendix 4 – CEPS Invoice Reconciliation (FEA) Exhibit 1 – Performance Guarantee Calculations
-33-

Appendix 1

Metro Nashville District Energy System Customers June 30, 2013
Private State Metro 1 Wells Fargo Plaza 16 Andrew Jackson 31 Regions Bank (401 Union) 2 Parkway Tower 17 Central Services 32 A.A. Birch 3 Sheraton Hotel 18 Cordell Hull 33 Historic Metro Courthouse 4 Hermitage Hotel 19 John Sevier 34 Municipal Auditorium 5 501 Union Building 20 War Memorial 35 Criminal Justice Center 6 4th & Church Building 21 Library & Archives 36 Convention Center 7 Fifth-Third Financial Center 22 Supreme Court 37 Bridgestone Arena 8 Renaissance Hotel 23 State Capitol 38 L.P. Field 9 Renaissance Office Tower 24 James K. Polk 39 Hume-Fogg High School 10 St. Mary’s Catholic Church 25 Citizens Plaza 40 Nashville Public Library 11 Nashville City Center 26 Snodgrass Tennessee Tower 41 Music City Center 12 Wildhorse Saloon 27 Tennessee State University 13 Ryman Auditorium 28 Tennessee Performing Arts Center 14 Schermerhorn Symphony Center 29 Legislative Plaza 15 Viridian Residential Tower 30 Rachael Jackson

Appendix 2

Metro Nashville District Energy SystemFY 12 - 13
Appendix 2 FY 12-13
Chilled Water and Steam Revenues
Cust
omer
N
o.
Cust
omer
N
ame
July
Augu
st
Sept
embe
r
Oct
ober
Nov
embe
r
Dece
mbe
r
Janu
ary
Febr
uary
Mar
ch
April
May
June
(in
clud
ing
True
Up)
Tota
l
2 A. A. Birch 82,199.32$ 76,025.90$ 67,869.71$ 51,855.79$ 55,692.60$ 56,405.97$ 56,360.21$ 53,840.07$ 55,775.27$ 51,933.62$ 52,451.54$ 60,840.03$ 721,250.03$ 4 Historic Metro Courthouse 34,090.78$ 31,259.23$ 26,541.05$ 21,500.19$ 22,429.40$ 24,065.17$ 24,504.85$ 23,346.24$ 24,241.40$ 22,713.21$ 23,239.34$ 26,932.75$ 304,863.61$ 7 Parkway Towers 29,660.71$ 28,872.94$ 25,819.77$ 25,414.08$ 27,937.57$ 29,706.78$ 31,369.11$ 29,897.43$ 31,024.43$ 25,690.36$ 24,693.06$ 25,605.15$ 335,691.39$ 9 Wells Fargo Plaza 17,706.97$ 15,480.84$ 12,646.00$ 10,740.71$ 12,239.58$ 11,259.74$ 10,610.89$ 10,274.86$ 10,735.18$ 10,877.36$ 13,032.51$ 17,072.79$ 152,677.43$
10 501 Union Building 7,087.26$ 7,083.09$ 7,080.01$ 7,083.58$ 7,070.76$ 7,072.18$ 7,077.77$ 7,061.52$ 7,065.25$ 7,081.67$ 7,364.08$ 6,735.32$ 84,862.49$ 11 Sheraton Hotel 76,819.59$ 69,776.39$ 62,407.57$ 53,872.38$ 53,461.55$ 56,850.11$ 58,724.67$ 58,094.70$ 56,388.47$ 49,556.31$ 53,937.97$ 67,018.86$ 716,908.57$ 12 Municipal Auditorium 23,897.62$ 21,016.64$ 18,691.04$ 16,499.07$ 17,393.78$ 23,068.98$ 25,806.18$ 25,272.27$ 24,856.74$ 17,771.77$ 16,260.53$ 21,088.50$ 251,623.12$ 21 Hermitage Hotel 29,324.81$ 27,690.02$ 25,179.47$ 19,176.76$ 23,406.22$ 22,610.90$ 21,841.92$ 20,176.78$ 20,861.41$ 19,822.40$ 20,240.66$ 23,700.40$ 274,031.75$ 24 Criminal Justice Center 51,501.79$ 49,646.00$ 45,400.20$ 41,328.32$ 45,766.04$ 49,110.54$ 49,290.48$ 46,417.99$ 50,402.33$ 42,006.26$ 40,751.61$ 44,742.98$ 556,364.54$ 25 501 Union Building 13,411.95$ 14,290.40$ 15,457.75$ 12,802.52$ 13,962.15$ 12,632.52$ 13,729.20$ 12,480.64$ 13,684.98$ 12,409.37$ 13,053.29$ 15,223.21$ 163,137.98$ 28 4th & Church Building 46,606.59$ 42,544.86$ 36,084.21$ 25,030.05$ 32,649.56$ 34,994.88$ 36,301.60$ 34,484.53$ 35,098.59$ 32,386.42$ 28,852.85$ 37,311.60$ 422,345.74$ 29 Fifth-Third Financial Center 40,431.43$ 38,419.52$ 32,414.18$ 24,206.07$ 23,035.39$ 23,486.71$ 22,980.33$ 23,077.69$ 22,912.93$ 24,352.80$ 27,327.01$ 33,173.74$ 335,817.80$ 32 Renaissance Hotel 86,124.64$ 82,173.09$ 75,645.91$ 70,024.08$ 72,171.42$ 74,575.51$ 75,831.42$ 70,302.83$ 73,596.63$ 68,734.34$ 68,397.96$ 76,279.68$ 893,857.51$ 33 Convention Center 91,933.73$ 80,586.73$ 80,889.33$ 64,501.52$ 63,999.63$ 68,090.31$ 74,383.30$ 67,164.21$ 67,139.07$ 65,917.53$ 69,566.92$ 80,781.53$ 874,953.81$ 34 Renaissance Office Tower 16,160.44$ 14,509.22$ 12,062.98$ 8,004.21$ 7,355.38$ 7,137.52$ 7,214.21$ 7,052.30$ 7,026.30$ 7,721.16$ 8,295.98$ 10,740.66$ 113,280.36$ 35 St. Mary's Catholic Church 952.99$ 952.99$ 952.99$ 952.99$ 952.99$ 952.99$ 952.99$ 952.99$ 952.99$ 952.99$ 952.99$ 952.99$ 11,435.88$ 36 Nashville City Center 45,816.95$ 41,145.22$ 33,264.27$ 24,777.98$ 22,652.75$ 22,978.04$ 22,238.32$ 21,600.42$ 21,505.71$ 23,747.15$ 26,948.19$ 37,043.96$ 343,718.96$ 38 Wildhorse Saloon 16,406.70$ 14,648.78$ 12,182.37$ 8,182.07$ 9,474.28$ 9,873.90$ 10,106.38$ 9,041.81$ 9,797.30$ 9,618.82$ 10,360.90$ 12,857.11$ 132,550.42$ 39 Ryman Auditorium 22,975.14$ 22,193.50$ 18,554.32$ 13,434.37$ 12,958.45$ 13,661.45$ 12,939.76$ 11,976.16$ 12,881.25$ 13,086.87$ 15,154.20$ 20,035.16$ 189,850.63$ 40 Bridgestone Arena 144,553.52$ 171,985.45$ 160,291.83$ 117,809.45$ 102,776.54$ 93,255.32$ 101,205.78$ 109,614.76$ 122,239.89$ 116,085.03$ 131,638.59$ 142,716.48$ 1,514,172.64$ 41 L.P. Field 82,622.94$ 77,988.24$ 61,382.02$ 34,481.97$ 28,733.42$ 30,528.28$ 28,153.75$ 26,595.21$ 27,513.63$ 33,563.91$ 42,654.56$ 65,929.00$ 540,146.93$ 43 Hume-Fogg High School 20,451.05$ 20,011.59$ 17,159.76$ 13,019.03$ 15,779.91$ 15,513.81$ 15,933.18$ 13,984.86$ 14,268.01$ 13,109.51$ 13,672.15$ 15,766.03$ 188,668.89$ 44 Schermerhorn Symphony Center 31,661.21$ 29,216.24$ 31,211.03$ 25,457.89$ 25,137.47$ 25,253.66$ 25,514.93$ 24,813.51$ 25,981.47$ 23,532.60$ 25,869.01$ 29,201.38$ 322,850.40$ 45 Nashville Public Library 36,954.93$ 34,737.47$ 29,685.00$ 19,969.92$ 19,794.16$ 21,761.01$ 19,603.71$ 16,973.90$ 16,637.70$ 17,181.98$ 18,801.42$ 29,219.23$ 281,320.43$ 49 Viridian Residential Tower 24,281.30$ 22,680.77$ 19,765.37$ 14,997.93$ 14,226.07$ 14,414.33$ 14,057.28$ 13,852.16$ 14,003.94$ 14,534.16$ 15,901.75$ 20,194.81$ 202,909.87$ 50 Music City Center 76,476.14$ 115,112.49$ 171,006.83$ 116,842.34$ 88,111.44$ 87,563.13$ 95,784.95$ 99,897.40$ 106,459.05$ 106,359.18$ 242,414.33$ 318,092.42$ 1,624,119.70$ S1 State Government of TN 527,693.89$ 497,177.86$ 440,167.76$ 396,774.26$ 421,532.65$ 441,767.69$ 450,234.87$ 424,445.31$ 434,528.95$ 387,240.88$ 391,340.73$ 472,027.79$ 5,284,932.64$
Grand Totals: 1,677,804.39$ 1,647,225.47$ 1,539,812.73$ 1,238,739.53$ 1,240,701.16$ 1,278,591.43$ 1,312,752.04$ 1,262,692.55$ 1,307,578.87$ 1,217,987.66$ 1,403,174.13$ 1,711,283.56$ 16,838,343.52$

Appendix 3

Metro Nashville District Energy SystemFY 12 - 13
Appendix 3 FY 12-13
Chilled Water and Steam Revenues July, 12 - June, 13
Cust
omer
N
umbe
r
Cust
omer
Nam
e
Cap
acity
Ope
ratin
g
EDS
Impr
ovem
ent
Met
ro
Incr
emen
tal
Wat
er A
nd
Sew
er
Che
mic
al
Trea
tmen
t
Engi
neer
ing
Insu
ranc
e
EDS
Elec
trici
ty
EDS
Mai
nt
Cos
ts A
lloc
TIFS
Elec
trici
ty
Nat
ural
Gas
Prop
ane
Tota
l
2 A. A. Birch 136,092.48$ 184,445.88$ 8,079.60$ 21,587.78$ 24,165.77$ 5,899.29$ 580.69$ 1,190.72$ 3,290.41$ -$ 15,283.36$ 187,056.21$ 133,313.55$ 264.29$ 721,250.03$ 4 Historic Metro Courthouse 64,425.96$ 86,065.80$ 3,770.16$ 10,073.57$ 8,268.36$ 2,120.20$ 270.68$ 555.63$ 1,535.43$ -$ 8,006.85$ 80,722.32$ 38,967.70$ 80.95$ 304,863.61$ 7 Parkway Towers 58,735.56$ 83,502.12$ 3,657.36$ 9,772.23$ 10,131.18$ 3,008.40$ 263.77$ 539.00$ 1,489.50$ 7,866.00$ 478.75$ 109,525.35$ 46,620.01$ 102.16$ 335,691.39$ 9 Wells Fargo Plaza 21,753.29$ 30,434.80$ 1,333.03$ 3,552.91$ 5,966.06$ 1,519.44$ 89.76$ 195.37$ 543.34$ 2,826.00$ 1,365.18$ 56,239.42$ 26,804.78$ 54.05$ 152,677.43$
10 501 Union Building 29,923.80$ 43,338.24$ 1,898.16$ 5,071.64$ -$ -$ 137.01$ 279.74$ 773.02$ 3,440.88$ -$ -$ -$ -$ 84,862.49$ 11 Sheraton Hotel 123,933.00$ 167,717.16$ 7,346.76$ 19,629.85$ 23,749.83$ 6,140.99$ 332.39$ 1,082.72$ 2,992.01$ 13,644.00$ 12,953.42$ 203,091.67$ 134,021.65$ 273.12$ 716,908.57$ 12 Municipal Auditorium 62,906.48$ 89,872.21$ 3,936.37$ 10,521.30$ 3,612.99$ 1,115.08$ 286.54$ 586.86$ 1,602.88$ -$ 864.71$ 32,324.84$ 43,894.85$ 98.01$ 251,623.12$ 21 Hermitage Hotel 59,861.64$ 78,640.56$ 3,444.96$ 9,204.83$ 7,332.02$ 1,858.72$ 247.04$ 507.71$ 1,403.00$ 3,072.00$ 6,006.92$ 70,910.42$ 31,476.81$ 65.12$ 274,031.75$ 24 Criminal Justice Center 101,220.48$ 129,296.40$ 5,664.48$ 15,135.08$ 19,283.13$ 5,403.94$ 405.26$ 834.81$ 2,306.93$ -$ 7,839.30$ 183,588.78$ 85,210.79$ 175.16$ 556,364.54$ 25 501 Union Building 23,601.96$ 31,702.08$ 1,388.64$ 3,710.51$ 6,233.30$ 1,717.37$ 99.67$ 204.66$ 565.58$ 2,580.96$ 451.70$ 58,719.19$ 32,095.25$ 67.11$ 163,137.98$ 28 4th & Church Building 231,097.68$ -$ -$ -$ 11,144.89$ 3,050.39$ 254.71$ 510.19$ -$ -$ 2,677.18$ 128,880.43$ 44,631.08$ 99.19$ 422,345.74$ 29 Fifth-Third Financial Center 72,130.92$ 117,341.40$ 5,138.16$ 13,728.88$ 8,027.78$ 1,908.99$ 373.77$ 757.25$ 2,092.54$ 8,726.04$ 2,497.88$ 103,094.19$ -$ -$ 335,817.80$ 32 Renaissance Hotel 148,674.12$ 195,577.80$ 8,567.76$ 22,892.23$ 30,978.79$ 8,489.32$ 614.41$ 1,262.67$ 3,489.27$ 16,224.00$ 22.71$ 289,868.78$ 166,847.19$ 348.46$ 893,857.51$ 33 Convention Center 183,066.48$ 247,609.80$ 10,846.44$ 28,980.79$ 26,343.85$ 6,944.16$ 779.32$ 1,598.50$ 4,417.27$ -$ -$ 266,584.92$ 97,581.20$ 201.08$ 874,953.81$ 34 Renaissance Office Tower 17,635.08$ 28,688.52$ 1,256.28$ 3,356.51$ 4,272.38$ 1,022.49$ 91.41$ 185.14$ 511.61$ 2,520.00$ -$ 53,740.94$ -$ -$ 113,280.36$ 35 St. Mary's Catholic Church 11,067.00$ -$ -$ -$ -$ -$ -$ -$ -$ 368.88$ -$ -$ -$ -$ 11,435.88$ 36 Nashville City Center 58,783.56$ 95,628.24$ 4,187.40$ 11,188.45$ 11,621.92$ 2,821.21$ 304.53$ 617.12$ 1,705.32$ 8,358.00$ 51.47$ 148,451.74$ -$ -$ 343,718.96$ 38 Wildhorse Saloon 21,974.93$ 31,464.72$ 1,378.17$ 3,674.32$ 4,422.56$ 1,133.16$ 93.82$ 202.14$ 561.59$ 2,028.00$ 141.47$ 49,572.51$ 15,869.02$ 34.01$ 132,550.42$ 39 Ryman Auditorium 22,466.40$ 32,776.51$ 1,435.49$ 3,827.63$ 8,778.49$ 2,119.42$ 57.43$ 212.00$ 584.44$ 1,965.96$ -$ 72,123.35$ 43,418.51$ 85.00$ 189,850.63$ 40 Bridgestone Arena 243,127.32$ 354,635.76$ 15,532.08$ 41,500.77$ 59,926.32$ 15,125.68$ 1,121.87$ 2,289.06$ 6,325.57$ -$ 11,115.37$ 559,902.28$ 203,176.94$ 393.62$ 1,514,172.64$ 41 L.P. Field 103,735.68$ 168,755.64$ 7,389.48$ 19,744.28$ 16,364.07$ 3,360.65$ 537.46$ 1,089.04$ 3,009.40$ -$ 1,026.38$ 215,134.85$ -$ -$ 540,146.93$ 43 Hume-Fogg High School 34,546.56$ 48,167.76$ 2,109.84$ 5,637.20$ 6,684.13$ 1,649.29$ 151.90$ 310.94$ 859.25$ -$ 1,223.94$ 50,031.37$ 37,223.57$ 73.14$ 188,668.89$ 44 Schermerhorn Symphony Center 168,324.00$ -$ -$ -$ 10,326.28$ 2,674.31$ 183.97$ 367.52$ -$ -$ -$ 89,863.33$ 51,007.90$ 103.09$ 322,850.40$ 45 Nashville Public Library 76,620.24$ -$ -$ -$ 13,447.25$ 3,405.00$ 285.39$ 573.38$ -$ -$ 1,228.44$ 159,133.35$ 26,569.03$ 58.35$ 281,320.43$ 49 Viridian Residential Tower 137,256.96$ -$ -$ -$ 4,002.39$ 880.40$ 140.57$ 274.85$ -$ -$ 8,744.42$ 51,610.28$ -$ -$ 202,909.87$ 50 Music City Center 155,130.82$ 38,344.60$ -$ 10,176.88$ 87,010.38$ 23,371.97$ (2,300.05)$ 4,245.14$ -$ -$ 346.42$ 727,171.26$ 579,437.63$ 1,184.65$ 1,624,119.70$ S1 State Government of TN 1,639,133.88$ 1,184,308.08$ -$ -$ 149,810.83$ 40,292.85$ -$ 8,432.62$ 23,302.69$ -$ 66,073.57$ 1,411,892.16$ 760,102.37$ 1,583.59$ 5,284,932.64$
Grand Totals: 4,007,226.28$ 3,468,314.08$ 98,360.62$ 272,967.64$ 561,904.95$ 147,032.72$ 5,403.32$ 28,904.78$ 63,361.05$ 73,620.72$ 148,399.44$ 5,359,233.94$ 2,598,269.83$ 5,344.15$ 16,838,343.52$ Rate Calculation Totals: 4,205,784.96$ 4,762,127.76$ 156,714.48$ 418,728.55$ 562,092.11$ 147,098.81$ 7,091.62$ 23,095.92$ 63,822.62$ 73,620.72$ 148,399.44$ 5,360,508.03$ 2,601,318.12$ 5,350.88$ 18,535,754.02$ Deviation: (198,558.68)$ (1,293,813.68)$ (58,353.86)$ (152,255.59)$ (188.26)$ (21.67)$ (10,216.88)$ 5,808.86$ (461.57)$ -$ -$ (1,279.27)$ (3,107.21)$ 6.73$ (1,697,410.50)$

Metro Nashville District Energy SystemFY 12 - 13
Appendix 3
Chilled Water and Steam Revenues July, 12
Cust
omer
N
umbe
r
Cust
omer
N
ame
Cap
acity
Ope
ratin
g
EDS
Impr
ovem
ent
Met
ro
Incr
emen
tal
Wat
er A
nd
Sew
er
Che
mic
al
Trea
tmen
t
Engi
neer
ing
Insu
ranc
e
EDS
Elec
trici
ty
EDS
Mai
nt
Cos
ts A
lloc
TIFS
Elec
trici
ty
Nat
ural
Gas
Prop
ane
Tota
l
2 A. A. Birch 11,341.04$ 15,370.49$ 673.30$ 1,873.40$ 5,073.38$ 524.99$ 101.15$ -$ 311.96$ -$ 1,049.09$ 34,188.83$ 11,691.69$ -$ 82,199.32$ 4 Historic Metro Courthouse 5,368.83$ 7,172.15$ 314.18$ 874.19$ 1,606.81$ 153.05$ 47.20$ -$ 145.57$ -$ 511.45$ 16,092.86$ 1,804.49$ -$ 34,090.78$ 7 Parkway Towers 4,894.63$ 6,958.51$ 304.78$ 848.04$ 1,112.19$ 97.24$ 45.79$ -$ 141.22$ 655.50$ -$ 14,602.81$ -$ -$ 29,660.71$ 9 Wells Fargo Plaza 1,907.86$ 2,690.93$ 117.86$ 327.95$ 1,067.55$ 104.85$ 17.71$ -$ 54.61$ 235.50$ 97.61$ 9,430.95$ 1,653.59$ -$ 17,706.97$
10 501 Union Building 2,493.65$ 3,611.52$ 158.18$ 440.12$ -$ -$ 23.76$ -$ 73.29$ 286.74$ -$ -$ -$ -$ 7,087.26$ 11 Sheraton Hotel 10,327.75$ 13,976.43$ 612.23$ 1,703.49$ 4,279.20$ 425.50$ 91.97$ -$ 283.66$ 1,137.00$ 877.27$ 35,728.73$ 7,376.36$ -$ 76,819.59$ 12 Municipal Auditorium 5,182.79$ 7,427.28$ 325.31$ 905.16$ 701.94$ 61.85$ 48.87$ -$ 150.73$ -$ -$ 9,024.50$ 69.19$ -$ 23,897.62$ 21 Hermitage Hotel 4,988.47$ 6,553.38$ 287.08$ 798.80$ 1,304.87$ 125.06$ 43.13$ -$ 133.01$ 256.00$ 496.54$ 12,762.66$ 1,575.81$ -$ 29,324.81$ 24 Criminal Justice Center 8,435.04$ 10,774.70$ 472.04$ 1,313.43$ 2,597.32$ 255.98$ 70.91$ -$ 218.71$ -$ 619.92$ 22,593.92$ 4,149.82$ -$ 51,501.79$ 25 501 Union Building 1,966.83$ 2,641.84$ 115.72$ 322.00$ 568.29$ 49.69$ 17.38$ -$ 53.62$ 215.08$ -$ 7,461.50$ -$ -$ 13,411.95$ 28 4th & Church Building 19,258.14$ -$ -$ -$ 1,908.70$ 166.88$ 53.08$ -$ -$ -$ 158.98$ 25,060.81$ -$ -$ 46,606.59$ 29 Fifth-Third Financial Center 6,010.91$ 9,778.45$ 428.18$ 1,191.40$ 1,543.05$ 134.91$ 64.33$ -$ 198.39$ 727.17$ 94.74$ 20,259.90$ -$ -$ 40,431.43$ 32 Renaissance Hotel 12,389.51$ 16,298.15$ 713.98$ 1,986.60$ 4,355.80$ 416.24$ 107.26$ -$ 330.81$ 1,352.00$ -$ 43,089.44$ 5,084.85$ -$ 86,124.64$ 33 Convention Center 15,255.54$ 20,634.15$ 903.87$ 2,514.97$ 4,352.05$ 419.15$ 135.78$ -$ 418.78$ -$ -$ 41,749.02$ 5,550.42$ -$ 91,933.73$ 34 Renaissance Office Tower 1,469.59$ 2,390.71$ 104.69$ 291.28$ 818.02$ 71.52$ 15.73$ -$ 48.50$ 210.00$ -$ 10,740.40$ -$ -$ 16,160.44$ 35 St. Mary's Catholic Church 922.25$ -$ -$ -$ -$ -$ -$ -$ -$ 30.74$ -$ -$ -$ -$ 952.99$ 36 Nashville City Center 4,898.63$ 7,969.02$ 348.95$ 970.94$ 2,160.68$ 188.91$ 52.42$ -$ 161.68$ 696.50$ -$ 28,369.22$ -$ -$ 45,816.95$ 38 Wildhorse Saloon 1,915.77$ 2,759.56$ 120.87$ 336.30$ 803.34$ 71.77$ 18.16$ -$ 56.00$ 169.00$ -$ 9,934.97$ 220.96$ -$ 16,406.70$ 39 Ryman Auditorium 1,771.88$ 2,669.62$ 116.92$ 325.31$ 1,651.20$ 166.52$ 17.57$ -$ 54.17$ 163.83$ -$ 12,856.46$ 3,181.66$ -$ 22,975.14$ 40 Bridgestone Arena 20,260.61$ 29,552.98$ 1,294.34$ 3,601.46$ 7,629.61$ 744.90$ 194.44$ -$ 599.70$ -$ 321.69$ 69,175.54$ 11,178.25$ -$ 144,553.52$ 41 L.P. Field 8,644.64$ 14,062.97$ 615.79$ 1,713.42$ 4,015.09$ 351.04$ 92.51$ -$ 285.31$ -$ 124.89$ 52,717.28$ -$ -$ 82,622.94$ 43 Hume-Fogg High School 2,878.88$ 4,013.98$ 175.82$ 489.20$ 1,315.40$ 138.56$ 26.41$ -$ 81.46$ -$ 56.77$ 7,892.92$ 3,381.65$ -$ 20,451.05$ 44 Schermerhorn Symphony Center 14,027.00$ -$ -$ -$ 1,555.72$ 153.85$ 38.29$ -$ -$ -$ -$ 13,326.09$ 2,560.26$ -$ 31,661.21$ 45 Nashville Public Library 6,385.02$ -$ -$ -$ 2,146.79$ 188.08$ 59.59$ -$ -$ -$ 86.95$ 28,033.00$ 55.50$ -$ 36,954.93$ 49 Viridian Residential Tower 11,438.08$ -$ -$ -$ 877.59$ 76.73$ 28.88$ -$ -$ -$ 337.42$ 11,522.60$ -$ -$ 24,281.30$ 50 Music City Center -$ 2,125.91$ -$ -$ 5,405.76$ 482.49$ -$ -$ -$ -$ -$ 67,043.92$ 1,418.06$ -$ 76,476.14$ S1 State Government of TN 136,594.49$ 98,692.34$ -$ -$ 23,782.85$ 2,286.31$ -$ -$ 2,209.24$ -$ 4,571.80$ 229,832.87$ 29,723.99$ -$ 527,693.89$
Grand Totals: 321,027.83$ 288,125.07$ 8,204.09$ 22,827.46$ 82,633.20$ 7,856.07$ 1,412.32$ -$ 6,010.42$ 6,135.06$ 9,405.12$ 833,491.20$ 90,676.55$ -$ 1,677,804.39$ Rate Calculation Totals: 350,482.08$ 396,843.98$ 13,059.54$ 36,337.50$ 82,650.11$ 7,857.56$ 1,961.94$ -$ 6,050.84$ 6,135.06$ 9,405.12$ 833,713.60$ 90,676.57$ -$ 1,835,173.90$ Deviation: (29,454.25)$ (108,718.91)$ (4,855.45)$ (13,510.04)$ (16.91)$ (1.49)$ (549.62)$ -$ (40.42)$ -$ -$ (222.40)$ (0.02)$ -$ (157,369.51)$

Metro Nashville District Energy SystemFY 12 - 13
Apendix 3
Chilled Water and Steam Revenues August, 12
Cust
omer
N
umbe
r
Cust
omer
N
ame
Cap
acity
Ope
ratin
g
ED
S
Impr
ovem
ent
Met
ro
Incr
emen
tal
Wat
er A
nd
Sew
er
Che
mic
al
Trea
tmen
t
Eng
inee
ring
Insu
ranc
e
ED
S
Ele
ctric
ity
ED
S M
aint
C
osts
Allo
c
TIFS
Ele
ctric
ity
Nat
ural
Gas
Pro
pane
Tota
l
2 A. A. Birch 11,341.04$ 15,370.49$ 673.30$ 1,873.40$ 4,305.32$ 530.64$ 101.15$ -$ 294.23$ -$ 1,064.99$ 30,134.73$ 10,336.61$ -$ 76,025.90$ 4 Historic Metro Courthouse 5,368.83$ 7,172.15$ 314.18$ 874.19$ 1,412.41$ 160.66$ 47.20$ -$ 137.30$ -$ 532.61$ 13,532.42$ 1,707.28$ -$ 31,259.23$ 7 Parkway Towers 4,894.63$ 6,958.51$ 304.78$ 848.04$ 1,130.01$ 117.65$ 45.79$ -$ 133.19$ 655.50$ -$ 13,784.84$ -$ -$ 28,872.94$ 9 Wells Fargo Plaza 1,804.13$ 2,522.17$ 110.47$ 307.39$ 891.12$ 103.38$ 16.60$ -$ 48.28$ 235.50$ 122.24$ 7,988.84$ 1,330.72$ -$ 15,480.84$
10 501 Union Building 2,493.65$ 3,611.52$ 158.18$ 440.12$ -$ -$ 23.76$ -$ 69.12$ 286.74$ -$ -$ -$ -$ 7,083.09$ 11 Sheraton Hotel 10,327.75$ 13,976.43$ 612.23$ 1,703.49$ 3,572.78$ 419.47$ 91.97$ -$ 267.54$ 1,137.00$ 1,028.28$ 30,681.87$ 5,957.58$ -$ 69,776.39$ 12 Municipal Auditorium 5,182.79$ 7,427.28$ 325.31$ 905.16$ 518.01$ 55.16$ 48.87$ -$ 142.16$ -$ 272.49$ 5,985.23$ 154.18$ -$ 21,016.64$ 21 Hermitage Hotel 4,988.47$ 6,553.38$ 287.08$ 798.80$ 1,191.25$ 136.10$ 43.13$ -$ 125.46$ 256.00$ 544.98$ 11,249.94$ 1,515.43$ -$ 27,690.02$ 24 Criminal Justice Center 8,435.04$ 10,774.70$ 472.04$ 1,313.43$ 2,399.21$ 278.82$ 70.91$ -$ 206.28$ -$ 673.05$ 21,380.67$ 3,641.85$ -$ 49,646.00$ 25 501 Union Building 1,966.83$ 2,641.84$ 115.72$ 322.00$ 740.15$ 83.30$ 17.38$ -$ 50.58$ 215.08$ 19.87$ 7,335.79$ 781.86$ -$ 14,290.40$ 28 4th & Church Building 19,258.14$ -$ -$ -$ 1,742.19$ 181.39$ 53.13$ -$ -$ -$ 57.23$ 21,252.78$ -$ -$ 42,544.86$ 29 Fifth-Third Financial Center 6,010.91$ 9,778.45$ 428.18$ 1,191.40$ 1,496.92$ 155.85$ 64.33$ -$ 187.12$ 727.17$ 118.42$ 18,260.77$ -$ -$ 38,419.52$ 32 Renaissance Hotel 12,389.51$ 16,298.15$ 713.98$ 1,986.60$ 4,006.86$ 446.87$ 107.26$ -$ 312.01$ 1,352.00$ 22.71$ 40,812.12$ 3,725.02$ -$ 82,173.09$ 33 Convention Center 15,255.54$ 20,634.15$ 903.87$ 2,514.97$ 3,381.31$ 381.20$ 135.78$ -$ 394.99$ -$ -$ 33,327.47$ 3,657.45$ -$ 80,586.73$ 34 Renaissance Office Tower 1,469.59$ 2,390.71$ 104.69$ 291.28$ 750.32$ 78.12$ 15.73$ -$ 45.75$ 210.00$ -$ 9,153.03$ -$ -$ 14,509.22$ 35 St. Mary's Catholic Church 922.25$ -$ -$ -$ -$ -$ -$ -$ -$ 30.74$ -$ -$ -$ -$ 952.99$ 36 Nashville City Center 4,898.63$ 7,969.02$ 348.95$ 970.94$ 1,958.68$ 203.93$ 52.42$ -$ 152.49$ 696.50$ -$ 23,893.66$ -$ -$ 41,145.22$ 38 Wildhorse Saloon 1,823.56$ 2,609.56$ 114.30$ 318.03$ 733.72$ 77.86$ 17.17$ -$ 49.94$ 169.00$ -$ 8,551.26$ 184.38$ -$ 14,648.78$ 39 Ryman Auditorium 1,881.32$ 2,736.99$ 119.87$ 333.54$ 1,579.00$ 192.75$ 18.01$ -$ 52.38$ 163.83$ -$ 11,558.74$ 3,557.07$ -$ 22,193.50$ 40 Bridgestone Arena 20,260.61$ 29,552.98$ 1,294.34$ 3,601.46$ 10,329.83$ 1,222.93$ 194.44$ -$ 565.64$ -$ 510.92$ 85,955.99$ 18,496.31$ -$ 171,985.45$ 41 L.P. Field 8,644.64$ 14,062.97$ 615.79$ 1,713.42$ 3,939.58$ 410.17$ 92.51$ -$ 269.10$ -$ 181.66$ 48,058.40$ -$ -$ 77,988.24$ 43 Hume-Fogg High School 2,878.88$ 4,013.98$ 175.82$ 489.20$ 1,181.50$ 146.62$ 26.41$ -$ 76.83$ -$ 61.31$ 7,999.57$ 2,961.47$ -$ 20,011.59$ 44 Schermerhorn Symphony Center 14,027.00$ -$ -$ -$ 1,347.26$ 159.35$ 38.32$ -$ -$ -$ -$ 11,250.12$ 2,394.19$ -$ 29,216.24$ 45 Nashville Public Library 6,385.02$ -$ -$ -$ 2,120.27$ 220.75$ 59.63$ -$ -$ -$ 86.95$ 25,864.85$ -$ -$ 34,737.47$ 49 Viridian Residential Tower 11,438.08$ -$ -$ -$ 817.16$ 85.08$ 28.94$ -$ -$ -$ 343.14$ 9,968.37$ -$ -$ 22,680.77$ 50 Music City Center -$ 2,125.91$ -$ -$ 10,087.95$ 1,196.38$ -$ -$ -$ -$ -$ 83,377.93$ 18,324.32$ -$ 115,112.49$ S1 State Government of TN 136,594.49$ 98,692.34$ -$ -$ 21,462.18$ 2,445.82$ -$ -$ 2,083.75$ -$ 4,979.38$ 204,415.37$ 26,504.53$ -$ 497,177.86$
Grand Totals: 320,941.33$ 287,873.68$ 8,193.08$ 22,796.86$ 83,094.99$ 9,490.25$ 1,410.84$ -$ 5,664.14$ 6,135.06$ 10,620.23$ 785,774.76$ 105,230.25$ -$ 1,647,225.47$ Rate Calculation Totals: 350,482.08$ 396,843.98$ 13,059.54$ 36,337.50$ 83,112.96$ 9,495.62$ 1,961.94$ -$ 5,707.07$ 6,135.06$ 10,620.23$ 785,994.08$ 105,230.27$ -$ 1,804,980.33$ Deviation: (29,540.75)$ (108,970.30)$ (4,866.46)$ (13,540.64)$ (17.97)$ (5.37)$ (551.10)$ -$ (42.93)$ -$ -$ (219.32)$ (0.02)$ -$ (157,754.86)$

Metro Nashville District Energy SystemFY 12 - 13
Appendix 3
Chilled Water and Steam Revenues September, 12
Cust
omer
N
umbe
r
Cust
omer
N
ame
Cap
acity
Ope
ratin
g
ED
S
Impr
ovem
ent M
etro
In
crem
enta
l
Wat
er A
nd
Sew
er
Che
mic
al
Trea
tmen
t
Eng
inee
ring
Insu
ranc
e
ED
S
Ele
ctric
ity
ED
S M
aint
C
osts
Allo
c
TIFS
Ele
ctric
ity
Nat
ural
Gas
Pro
pane
Tota
l
2 A. A. Birch 11,341.04$ 15,370.49$ 673.30$ 1,873.40$ 3,684.83$ 366.81$ 101.15$ -$ 281.11$ -$ 1,080.88$ 24,491.75$ 8,604.95$ -$ 67,869.71$ 4 Historic Metro Courthouse 5,368.83$ 7,172.15$ 314.18$ 874.19$ 1,085.78$ 103.39$ 47.20$ -$ 131.17$ -$ 617.27$ 9,608.17$ 1,218.72$ -$ 26,541.05$ 7 Parkway Towers 4,894.63$ 6,958.51$ 304.78$ 848.04$ 1,000.55$ 91.27$ 45.79$ -$ 127.25$ 655.50$ -$ 10,893.45$ -$ -$ 25,819.77$ 9 Wells Fargo Plaza 1,804.13$ 2,522.17$ 110.47$ 307.39$ 683.73$ 65.58$ 16.60$ -$ 46.13$ 235.50$ 145.83$ 5,806.94$ 901.53$ -$ 12,646.00$
10 501 Union Building 2,493.65$ 3,611.52$ 158.18$ 440.12$ -$ -$ 23.76$ -$ 66.04$ 286.74$ -$ -$ -$ -$ 7,080.01$ 11 Sheraton Hotel 10,327.75$ 13,976.43$ 612.23$ 1,703.49$ 3,171.60$ 310.25$ 91.97$ -$ 255.62$ 1,137.00$ 1,081.49$ 23,868.68$ 5,871.06$ -$ 62,407.57$ 12 Municipal Auditorium 5,182.79$ 7,427.28$ 325.31$ 905.16$ 393.39$ 36.33$ 48.87$ -$ 135.82$ -$ 56.31$ 4,053.34$ 126.44$ -$ 18,691.04$ 21 Hermitage Hotel 4,988.47$ 6,553.38$ 287.08$ 798.80$ 1,065.34$ 102.29$ 43.13$ -$ 119.86$ 256.00$ 535.90$ 8,995.91$ 1,433.31$ -$ 25,179.47$ 24 Criminal Justice Center 8,435.04$ 10,774.70$ 472.04$ 1,313.43$ 2,158.54$ 207.33$ 70.91$ -$ 197.09$ -$ 657.11$ 18,188.87$ 2,925.14$ -$ 45,400.20$ 25 501 Union Building 1,966.83$ 2,641.84$ 115.72$ 322.00$ 974.43$ 95.68$ 17.38$ -$ 48.31$ 215.08$ 6.62$ 7,147.97$ 1,905.89$ -$ 15,457.75$ 28 4th & Church Building 19,258.14$ -$ -$ -$ 1,386.97$ 126.51$ 53.13$ -$ -$ -$ 158.98$ 15,100.48$ -$ -$ 36,084.21$ 29 Fifth-Third Financial Center 6,010.91$ 9,778.45$ 428.18$ 1,191.40$ 1,158.22$ 105.65$ 64.33$ -$ 178.77$ 727.17$ 161.05$ 12,610.05$ -$ -$ 32,414.18$ 32 Renaissance Hotel 12,389.51$ 16,298.15$ 713.98$ 1,986.60$ 3,892.64$ 373.20$ 107.26$ -$ 298.10$ 1,352.00$ -$ 33,153.25$ 5,081.22$ -$ 75,645.91$ 33 Convention Center 15,255.54$ 20,634.15$ 903.87$ 2,514.97$ 3,751.07$ 359.13$ 135.78$ -$ 377.38$ -$ -$ 32,200.08$ 4,757.36$ -$ 80,889.33$ 34 Renaissance Office Tower 1,469.59$ 2,390.71$ 104.69$ 291.28$ 629.23$ 57.40$ 15.73$ -$ 43.71$ 210.00$ -$ 6,850.64$ -$ -$ 12,062.98$ 35 St. Mary's Catholic Church 922.25$ -$ -$ -$ -$ -$ -$ -$ -$ 30.74$ -$ -$ -$ -$ 952.99$ 36 Nashville City Center 4,898.63$ 7,969.02$ 348.95$ 970.94$ 1,517.88$ 138.46$ 52.42$ -$ 145.69$ 696.50$ -$ 16,525.78$ -$ -$ 33,264.27$ 38 Wildhorse Saloon 1,823.56$ 2,609.56$ 114.30$ 318.03$ 600.73$ 55.29$ 17.17$ -$ 47.72$ 169.00$ -$ 6,288.18$ 138.83$ -$ 12,182.37$ 39 Ryman Auditorium 1,881.32$ 2,736.99$ 119.87$ 333.54$ 1,291.63$ 127.57$ 18.01$ -$ 50.05$ 163.83$ -$ 9,097.47$ 2,734.04$ -$ 18,554.32$ 40 Bridgestone Arena 20,260.61$ 29,552.98$ 1,294.34$ 3,601.46$ 10,074.95$ 990.98$ 194.44$ -$ 540.40$ -$ 556.34$ 73,047.90$ 20,177.43$ -$ 160,291.83$ 41 L.P. Field 8,644.64$ 14,062.97$ 615.79$ 1,713.42$ 2,985.65$ 272.34$ 92.51$ -$ 257.09$ -$ 231.62$ 32,505.99$ -$ -$ 61,382.02$ 43 Hume-Fogg High School 2,878.88$ 4,013.98$ 175.82$ 489.20$ 925.57$ 91.73$ 26.41$ -$ 73.41$ -$ 77.21$ 6,361.55$ 2,046.00$ -$ 17,159.76$ 44 Schermerhorn Symphony Center 14,027.00$ -$ -$ -$ 1,656.30$ 162.92$ 38.32$ -$ -$ -$ -$ 12,009.81$ 3,316.68$ -$ 31,211.03$ 45 Nashville Public Library 6,385.02$ -$ -$ -$ 1,970.14$ 181.68$ 59.63$ -$ -$ -$ 89.18$ 20,447.39$ 551.96$ -$ 29,685.00$ 49 Viridian Residential Tower 11,438.08$ -$ -$ -$ 662.68$ 60.45$ 28.94$ -$ -$ -$ 360.30$ 7,214.92$ -$ -$ 19,765.37$ 50 Music City Center -$ 2,125.91$ -$ -$ 16,476.88$ 1,628.06$ -$ -$ -$ -$ -$ 115,708.99$ 35,066.99$ -$ 171,006.83$ S1 State Government of TN 136,594.49$ 98,692.34$ -$ -$ 18,183.15$ 1,748.41$ -$ -$ 1,990.78$ -$ 5,533.35$ 152,250.72$ 25,174.52$ -$ 440,167.76$
Grand Totals: 320,941.33$ 287,873.68$ 8,193.08$ 22,796.86$ 81,381.88$ 7,858.71$ 1,410.84$ -$ 5,411.50$ 6,135.06$ 11,349.44$ 664,428.28$ 122,032.07$ -$ 1,539,812.73$ Rate Calculation Totals: 350,482.08$ 396,843.98$ 13,059.54$ 36,337.50$ 81,402.20$ 7,857.53$ 1,961.94$ -$ 5,452.37$ 6,135.06$ 11,349.44$ 664,610.49$ 122,053.38$ -$ 1,697,545.51$ Deviation: (29,540.75)$ (108,970.30)$ (4,866.46)$ (13,540.64)$ (20.32)$ 1.18$ (551.10)$ -$ (40.87)$ -$ -$ (182.21)$ (21.31)$ -$ (157,732.78)$

Metro Nashville District Energy SystemFY 12 - 13
Appendix 3
Chilled Water and Steam Revenues October, 12
Cust
omer
N
umbe
r
Cust
omer
N
ame
Cap
acity
Ope
ratin
g
ED
S
Impr
ovem
ent
Met
ro
Incr
emen
tal
Wat
er A
nd
Sew
er
Che
mic
al
Trea
tmen
t
Eng
inee
ring
Insu
ranc
e
ED
S
Ele
ctric
ity
ED
S M
aint
C
osts
Allo
c
TIFS
Ele
ctric
ity
Nat
ural
Gas
Pro
pane
Tota
l
2 A. A. Birch 11,341.04$ 15,370.49$ 673.30$ 1,873.40$ 1,714.66$ 336.60$ 101.15$ -$ 296.31$ -$ 1,271.63$ 10,043.73$ 8,833.48$ -$ 51,855.79$ 4 Historic Metro Courthouse 5,368.83$ 7,172.15$ 314.18$ 874.19$ 593.58$ 114.26$ 47.20$ -$ 138.27$ -$ 684.29$ 3,740.68$ 2,452.56$ -$ 21,500.19$ 7 Parkway Towers 4,894.63$ 6,958.51$ 304.78$ 848.04$ 1,043.75$ 197.21$ 45.79$ -$ 134.13$ 655.50$ -$ 7,008.54$ 3,323.20$ -$ 25,414.08$ 9 Wells Fargo Plaza 1,804.13$ 2,522.17$ 110.47$ 307.39$ 478.36$ 92.28$ 16.60$ -$ 48.62$ 235.50$ 104.98$ 2,991.99$ 2,028.22$ -$ 10,740.71$
10 501 Union Building 2,493.65$ 3,611.52$ 158.18$ 440.12$ -$ -$ 23.76$ -$ 69.61$ 286.74$ -$ -$ -$ -$ 7,083.58$ 11 Sheraton Hotel 10,327.75$ 13,976.43$ 612.23$ 1,703.49$ 2,001.77$ 394.18$ 91.97$ -$ 269.44$ 1,137.00$ 1,136.14$ 11,583.53$ 10,638.45$ -$ 53,872.38$ 12 Municipal Auditorium 5,182.79$ 7,427.28$ 325.31$ 905.16$ 200.53$ 37.39$ 48.87$ -$ 143.17$ -$ 317.91$ 1,403.83$ 506.83$ -$ 16,499.07$ 21 Hermitage Hotel 4,988.47$ 6,553.38$ 287.08$ 798.80$ 514.40$ 96.61$ 43.13$ -$ 126.35$ 256.00$ 508.65$ 3,521.93$ 1,481.96$ -$ 19,176.76$ 24 Criminal Justice Center 8,435.04$ 10,774.70$ 472.04$ 1,313.43$ 1,744.89$ 330.28$ 70.91$ -$ 207.75$ -$ 619.92$ 11,649.11$ 5,710.25$ -$ 41,328.32$ 25 501 Union Building 1,966.83$ 2,641.84$ 115.72$ 322.00$ 651.83$ 124.67$ 17.38$ -$ 50.93$ 215.08$ 15.90$ 4,200.69$ 2,479.65$ -$ 12,802.52$ 28 4th & Church Building 19,258.14$ -$ -$ -$ 570.71$ 103.78$ 53.13$ -$ -$ -$ 6.36$ 4,304.02$ 733.91$ -$ 25,030.05$ 29 Fifth-Third Financial Center 6,010.91$ 9,778.45$ 428.18$ 1,191.40$ 609.07$ 107.83$ 64.33$ -$ 188.44$ 727.17$ 165.79$ 4,934.50$ -$ -$ 24,206.07$ 32 Renaissance Hotel 12,389.51$ 16,298.15$ 713.98$ 1,986.60$ 3,063.29$ 597.87$ 107.26$ -$ 314.22$ 1,352.00$ -$ 18,347.30$ 14,853.90$ -$ 70,024.08$ 33 Convention Center 15,255.54$ 20,634.15$ 903.87$ 2,514.97$ 2,253.11$ 423.60$ 135.78$ -$ 397.79$ -$ -$ 15,376.05$ 6,606.66$ -$ 64,501.52$ 34 Renaissance Office Tower 1,469.59$ 2,390.71$ 104.69$ 291.28$ 374.63$ 66.33$ 15.73$ -$ 46.07$ 210.00$ -$ 3,035.18$ -$ -$ 8,004.21$ 35 St. Mary's Catholic Church 922.25$ -$ -$ -$ -$ -$ -$ -$ -$ 30.74$ -$ -$ -$ -$ 952.99$ 36 Nashville City Center 4,898.63$ 7,969.02$ 348.95$ 970.94$ 1,044.10$ 184.85$ 52.42$ -$ 153.57$ 696.50$ -$ 8,459.00$ -$ -$ 24,777.98$ 38 Wildhorse Saloon 1,823.56$ 2,609.56$ 114.30$ 318.03$ 304.83$ 55.55$ 17.17$ -$ 50.30$ 169.00$ 11.13$ 2,285.08$ 423.56$ -$ 8,182.07$ 39 Ryman Auditorium 1,881.32$ 2,736.99$ 119.87$ 333.54$ 687.31$ 133.20$ 18.01$ -$ 52.76$ 163.83$ -$ 4,226.10$ 3,081.44$ -$ 13,434.37$ 40 Bridgestone Arena 20,260.61$ 29,552.98$ 1,294.34$ 3,601.46$ 5,473.73$ 1,039.35$ 194.44$ -$ 569.64$ -$ 870.46$ 36,160.51$ 18,791.93$ -$ 117,809.45$ 41 L.P. Field 8,644.64$ 14,062.97$ 615.79$ 1,713.42$ 954.28$ 168.95$ 92.51$ -$ 271.01$ -$ 227.08$ 7,731.32$ -$ -$ 34,481.97$ 43 Hume-Fogg High School 2,878.88$ 4,013.98$ 175.82$ 489.20$ 443.99$ 86.00$ 26.41$ -$ 77.38$ -$ 113.54$ 2,735.12$ 1,978.71$ -$ 13,019.03$ 44 Schermerhorn Symphony Center 14,027.00$ -$ -$ -$ 966.88$ 187.12$ 38.32$ -$ -$ -$ -$ 5,977.04$ 4,261.53$ -$ 25,457.89$ 45 Nashville Public Library 6,385.02$ -$ -$ -$ 1,299.34$ 239.09$ 59.63$ -$ -$ -$ 93.64$ 9,472.26$ 2,420.94$ -$ 19,969.92$ 49 Viridian Residential Tower 11,438.08$ -$ -$ -$ 320.13$ 56.68$ 28.94$ -$ -$ -$ 560.47$ 2,593.63$ -$ -$ 14,997.93$ 50 Music City Center -$ 2,125.91$ -$ -$ 8,730.39$ 1,767.49$ -$ -$ -$ -$ -$ 44,884.37$ 59,334.18$ -$ 116,842.34$ S1 State Government of TN 136,594.49$ 98,692.34$ -$ -$ 13,423.76$ 2,572.73$ -$ -$ 2,098.49$ -$ 5,033.13$ 85,906.08$ 52,453.24$ -$ 396,774.26$
Grand Totals: 320,941.33$ 287,873.68$ 8,193.08$ 22,796.86$ 49,463.32$ 9,513.90$ 1,410.84$ -$ 5,704.25$ 6,135.06$ 11,741.02$ 312,571.59$ 202,394.60$ -$ 1,238,739.53$ Rate Calculation Totals: 350,482.08$ 396,843.98$ 13,059.54$ 36,337.50$ 49,482.48$ 9,517.04$ 1,961.94$ -$ 5,747.54$ 6,135.06$ 11,741.02$ 312,654.81$ 202,560.64$ -$ 1,396,523.63$ Deviation: (29,540.75)$ (108,970.30)$ (4,866.46)$ (13,540.64)$ (19.16)$ (3.14)$ (551.10)$ -$ (43.29)$ -$ -$ (83.22)$ (166.04)$ -$ (157,784.10)$

Metro Nashville District Energy SystemFY 12 - 13
Appendix 3
Chilled Water and Steam Revenues November, 12
Cust
omer
N
umbe
r
Cust
omer
N
ame
Cap
acity
Ope
ratin
g
ED
S
Impr
ovem
ent
Met
ro
Incr
emen
tal
Wat
er A
nd
Sew
er
Che
mic
al
Trea
tmen
t
Eng
inee
ring
Insu
ranc
e
ED
S
Ele
ctric
ity
ED
S M
aint
C
osts
Allo
c
TIFS
Ele
ctric
ity
Nat
ural
Gas
Pro
pane
Tota
l
2 A. A. Birch 11,341.04$ 15,370.49$ 673.30$ 1,873.40$ 1,597.27$ 303.60$ 101.15$ -$ 241.75$ -$ 1,525.95$ 8,614.59$ 14,050.06$ -$ 55,692.60$ 4 Historic Metro Courthouse 5,368.83$ 7,172.15$ 314.18$ 874.19$ 527.99$ 99.34$ 47.20$ -$ 112.81$ -$ 790.10$ 2,969.30$ 4,153.31$ -$ 22,429.40$ 7 Parkway Towers 4,894.63$ 6,958.51$ 304.78$ 848.04$ 1,106.24$ 202.34$ 45.79$ -$ 109.43$ 655.50$ -$ 6,916.62$ 5,895.69$ -$ 27,937.57$ 9 Wells Fargo Plaza 1,804.13$ 2,522.17$ 110.47$ 307.39$ 522.04$ 96.54$ 16.60$ -$ 39.67$ 235.50$ 153.88$ 3,137.25$ 3,293.94$ -$ 12,239.58$
10 501 Union Building 2,493.65$ 3,611.52$ 158.18$ 440.12$ -$ -$ 23.76$ -$ 56.79$ 286.74$ -$ -$ -$ -$ 7,070.76$ 11 Sheraton Hotel 10,327.75$ 13,976.43$ 612.23$ 1,703.49$ 1,620.74$ 306.25$ 91.97$ -$ 219.83$ 1,137.00$ 1,128.95$ 8,958.95$ 13,377.96$ -$ 53,461.55$ 12 Municipal Auditorium 5,182.79$ 7,427.28$ 325.31$ 905.16$ 129.52$ 28.44$ 48.87$ -$ 116.80$ -$ -$ 240.11$ 2,989.50$ -$ 17,393.78$ 21 Hermitage Hotel 4,988.47$ 6,553.38$ 287.08$ 798.80$ 718.08$ 133.36$ 43.13$ -$ 103.08$ 256.00$ 472.32$ 4,247.28$ 4,805.24$ -$ 23,406.22$ 24 Criminal Justice Center 8,435.04$ 10,774.70$ 472.04$ 1,313.43$ 1,917.12$ 349.03$ 70.91$ -$ 169.49$ -$ 650.91$ 12,181.14$ 9,432.23$ -$ 45,766.04$ 25 501 Union Building 1,966.83$ 2,641.84$ 115.72$ 322.00$ 600.94$ 112.37$ 17.38$ -$ 41.56$ 215.08$ 74.18$ 3,462.75$ 4,391.50$ -$ 13,962.15$ 28 4th & Church Building 19,258.14$ -$ -$ -$ 943.70$ 175.42$ 53.13$ -$ -$ -$ 267.08$ 5,563.66$ 6,388.43$ -$ 32,649.56$ 29 Fifth-Third Financial Center 6,010.91$ 9,778.45$ 428.18$ 1,191.40$ 504.61$ 86.74$ 64.33$ -$ 153.74$ 727.17$ 268.42$ 3,821.44$ -$ -$ 23,035.39$ 32 Renaissance Hotel 12,389.51$ 16,298.15$ 713.98$ 1,986.60$ 2,838.74$ 526.98$ 107.26$ -$ 256.36$ 1,352.00$ -$ 16,818.75$ 18,883.09$ -$ 72,171.42$ 33 Convention Center 15,255.54$ 20,634.15$ 903.87$ 2,514.97$ 2,000.30$ 362.29$ 135.78$ -$ 324.54$ -$ -$ 12,934.61$ 8,933.58$ -$ 63,999.63$ 34 Renaissance Office Tower 1,469.59$ 2,390.71$ 104.69$ 291.28$ 324.28$ 55.74$ 15.73$ -$ 37.59$ 210.00$ -$ 2,455.77$ -$ -$ 7,355.38$ 35 St. Mary's Catholic Church 922.25$ -$ -$ -$ -$ -$ -$ -$ -$ 30.74$ -$ -$ -$ -$ 952.99$ 36 Nashville City Center 4,898.63$ 7,969.02$ 348.95$ 970.94$ 868.04$ 149.21$ 52.42$ -$ 125.29$ 696.50$ -$ 6,573.75$ -$ -$ 22,652.75$ 38 Wildhorse Saloon 1,823.56$ 2,609.56$ 114.30$ 318.03$ 321.11$ 59.48$ 17.17$ -$ 41.03$ 169.00$ 11.13$ 1,918.44$ 2,071.47$ -$ 9,474.28$ 39 Ryman Auditorium 1,881.32$ 2,736.99$ 119.87$ 333.54$ 546.17$ 101.79$ 18.01$ -$ 43.04$ 163.83$ -$ 3,188.24$ 3,825.65$ -$ 12,958.45$ 40 Bridgestone Arena 20,260.61$ 29,552.98$ 1,294.34$ 3,601.46$ 3,889.86$ 701.54$ 194.44$ -$ 464.75$ -$ 1,381.38$ 25,512.48$ 15,922.70$ -$ 102,776.54$ 41 L.P. Field 8,644.64$ 14,062.97$ 615.79$ 1,713.42$ 379.06$ 65.16$ 92.51$ -$ 221.10$ -$ 68.12$ 2,870.65$ -$ -$ 28,733.42$ 43 Hume-Fogg High School 2,878.88$ 4,013.98$ 175.82$ 489.20$ 563.68$ 105.35$ 26.41$ -$ 63.13$ -$ 115.81$ 3,254.45$ 4,093.20$ -$ 15,779.91$ 44 Schermerhorn Symphony Center 14,027.00$ -$ -$ -$ 836.04$ 154.01$ 38.32$ -$ -$ -$ -$ 5,095.74$ 4,986.36$ -$ 25,137.47$ 45 Nashville Public Library 6,385.02$ -$ -$ -$ 1,121.73$ 202.20$ 59.63$ -$ -$ -$ 118.16$ 7,370.79$ 4,536.63$ -$ 19,794.16$ 49 Viridian Residential Tower 11,438.08$ -$ -$ -$ 193.21$ 33.21$ 28.94$ -$ -$ -$ 1,069.46$ 1,463.17$ -$ -$ 14,226.07$ 50 Music City Center -$ 2,125.91$ -$ -$ 5,408.85$ 1,035.75$ -$ -$ -$ -$ -$ 28,252.25$ 51,288.68$ -$ 88,111.44$ S1 State Government of TN 136,594.49$ 98,692.34$ -$ -$ 12,963.48$ 2,408.12$ -$ -$ 1,712.10$ -$ 5,551.44$ 76,615.94$ 86,994.74$ -$ 421,532.65$
Grand Totals: 320,941.33$ 287,873.68$ 8,193.08$ 22,796.86$ 42,442.80$ 7,854.26$ 1,410.84$ -$ 4,653.88$ 6,135.06$ 13,647.29$ 254,438.12$ 270,313.96$ -$ 1,240,701.16$ Rate Calculation Totals: 350,482.08$ 396,843.98$ 13,059.54$ 36,337.50$ 42,461.15$ 7,857.53$ 1,961.94$ -$ 4,689.09$ 6,135.06$ 13,647.29$ 254,481.36$ 270,700.11$ -$ 1,398,656.63$ Deviation: (29,540.75)$ (108,970.30)$ (4,866.46)$ (13,540.64)$ (18.35)$ (3.27)$ (551.10)$ -$ (35.21)$ -$ -$ (43.24)$ (386.15)$ -$ (157,955.47)$

Metro Nashville District Energy SystemFY 12 - 13
Appendix 3
Chilled Water and Steam Revenues December, 12
Cust
omer
N
umbe
r
Cust
omer
N
ame
Cap
acity
Ope
ratin
g
ED
S
Impr
ovem
ent
Met
ro
Incr
emen
tal
Wat
er A
nd
Sew
er
Che
mic
al
Trea
tmen
t
Eng
inee
ring
Insu
ranc
e
ED
S
Ele
ctric
ity
ED
S M
aint
C
osts
Allo
c
TIFS
Ele
ctric
ity
Nat
ural
Gas
Pro
pane
Tota
l
2 A. A. Birch 11,341.04$ 15,370.49$ 673.30$ 1,873.40$ 1,106.37$ 296.85$ 101.15$ -$ 247.74$ -$ 1,637.22$ 9,435.70$ 14,322.71$ -$ 56,405.97$ 4 Historic Metro Courthouse 5,368.83$ 7,172.15$ 314.18$ 874.19$ 420.59$ 112.85$ 47.20$ -$ 115.60$ -$ 790.10$ 3,684.50$ 5,164.98$ -$ 24,065.17$ 7 Parkway Towers 4,894.63$ 6,958.51$ 304.78$ 848.04$ 780.08$ 209.30$ 45.79$ -$ 112.15$ 655.50$ 87.42$ 7,689.56$ 7,121.02$ -$ 29,706.78$ 9 Wells Fargo Plaza 1,804.13$ 2,522.17$ 110.47$ 307.39$ 285.98$ 76.73$ 16.60$ -$ 40.65$ 235.50$ 116.49$ 2,651.47$ 3,092.16$ -$ 11,259.74$
10 501 Union Building 2,493.65$ 3,611.52$ 158.18$ 440.12$ -$ -$ 23.76$ -$ 58.21$ 286.74$ -$ -$ -$ -$ 7,072.18$ 11 Sheraton Hotel 10,327.75$ 13,976.43$ 612.23$ 1,703.49$ 1,246.54$ 334.46$ 91.97$ -$ 225.28$ 1,137.00$ 1,078.61$ 10,979.40$ 15,136.95$ -$ 56,850.11$ 12 Municipal Auditorium 5,182.79$ 7,427.28$ 325.31$ 905.16$ 267.67$ 71.81$ 48.87$ -$ 119.71$ -$ -$ 695.47$ 8,024.91$ -$ 23,068.98$ 21 Hermitage Hotel 4,988.47$ 6,553.38$ 287.08$ 798.80$ 434.46$ 116.57$ 43.13$ -$ 105.63$ 256.00$ 548.01$ 4,159.47$ 4,319.90$ -$ 22,610.90$ 24 Criminal Justice Center 8,435.04$ 10,774.70$ 472.04$ 1,313.43$ 1,420.62$ 381.17$ 70.91$ -$ 173.69$ -$ 659.77$ 14,837.92$ 10,571.25$ -$ 49,110.54$ 25 501 Union Building 1,966.83$ 2,641.84$ 115.72$ 322.00$ 382.91$ 102.74$ 17.38$ -$ 42.59$ 215.08$ 33.12$ 4,029.53$ 2,762.78$ -$ 12,632.52$ 28 4th & Church Building 19,258.14$ -$ -$ -$ 720.34$ 193.28$ 53.13$ -$ -$ -$ 286.16$ 6,669.48$ 7,814.35$ -$ 34,994.88$ 29 Fifth-Third Financial Center 6,010.91$ 9,778.45$ 428.18$ 1,191.40$ 335.93$ 90.14$ 64.33$ -$ 157.55$ 727.17$ 323.68$ 4,378.97$ -$ -$ 23,486.71$ 32 Renaissance Hotel 12,389.51$ 16,298.15$ 713.98$ 1,986.60$ 1,952.29$ 523.82$ 107.26$ -$ 262.72$ 1,352.00$ -$ 18,217.45$ 20,771.73$ -$ 74,575.51$ 33 Convention Center 15,255.54$ 20,634.15$ 903.87$ 2,514.97$ 1,477.83$ 396.52$ 135.78$ -$ 332.59$ -$ -$ 15,431.98$ 11,007.08$ -$ 68,090.31$ 34 Renaissance Office Tower 1,469.59$ 2,390.71$ 104.69$ 291.28$ 182.96$ 49.09$ 15.73$ -$ 38.52$ 210.00$ -$ 2,384.95$ -$ -$ 7,137.52$ 35 St. Mary's Catholic Church 922.25$ -$ -$ -$ -$ -$ -$ -$ -$ 30.74$ -$ -$ -$ -$ 952.99$ 36 Nashville City Center 4,898.63$ 7,969.02$ 348.95$ 970.94$ 553.23$ 148.45$ 52.42$ -$ 128.40$ 696.50$ -$ 7,211.50$ -$ -$ 22,978.04$ 38 Wildhorse Saloon 1,823.56$ 2,609.56$ 114.30$ 318.03$ 226.04$ 60.65$ 17.17$ -$ 42.05$ 169.00$ 20.66$ 2,131.34$ 2,341.54$ -$ 9,873.90$ 39 Ryman Auditorium 1,881.32$ 2,736.99$ 119.87$ 333.54$ 394.63$ 105.88$ 18.01$ -$ 44.11$ 163.83$ -$ 3,691.92$ 4,171.35$ -$ 13,661.45$ 40 Bridgestone Arena 20,260.61$ 29,552.98$ 1,294.34$ 3,601.46$ 2,018.45$ 541.58$ 194.44$ -$ 476.27$ -$ 1,305.69$ 22,199.76$ 11,809.74$ -$ 93,255.32$ 41 L.P. Field 8,644.64$ 14,062.97$ 615.79$ 1,713.42$ 350.50$ 94.05$ 92.51$ -$ 226.59$ -$ 158.95$ 4,568.86$ -$ -$ 30,528.28$ 43 Hume-Fogg High School 2,878.88$ 4,013.98$ 175.82$ 489.20$ 357.16$ 95.83$ 26.41$ -$ 64.70$ -$ 127.16$ 3,251.64$ 4,033.03$ -$ 15,513.81$ 44 Schermerhorn Symphony Center 14,027.00$ -$ -$ -$ 550.89$ 147.81$ 38.32$ -$ -$ -$ -$ 5,414.05$ 5,075.59$ -$ 25,253.66$ 45 Nashville Public Library 6,385.02$ -$ -$ -$ 835.94$ 224.30$ 59.63$ -$ -$ -$ 124.85$ 9,169.31$ 4,961.96$ -$ 21,761.01$ 49 Viridian Residential Tower 11,438.08$ -$ -$ -$ 123.69$ 33.19$ 28.94$ -$ -$ -$ 1,178.12$ 1,612.31$ -$ -$ 14,414.33$ 50 Music City Center -$ 2,125.91$ -$ -$ 3,554.03$ 953.55$ -$ -$ -$ -$ -$ 27,848.81$ 53,080.83$ -$ 87,563.13$ S1 State Government of TN 136,594.49$ 98,692.34$ -$ -$ 9,290.11$ 2,492.61$ -$ -$ 1,754.53$ -$ 6,136.86$ 86,008.00$ 100,798.75$ -$ 441,767.69$
Grand Totals: 320,941.33$ 287,873.68$ 8,193.08$ 22,796.86$ 29,269.24$ 7,853.23$ 1,410.84$ -$ 4,769.28$ 6,135.06$ 14,612.87$ 278,353.35$ 296,382.61$ -$ 1,278,591.43$ Rate Calculation Totals: 350,482.08$ 396,843.98$ 13,059.54$ 36,337.50$ 29,289.90$ 7,857.53$ 1,961.94$ -$ 4,805.40$ 6,135.06$ 14,612.87$ 278,396.59$ 297,031.52$ -$ 1,436,813.91$ Deviation: (29,540.75)$ (108,970.30)$ (4,866.46)$ (13,540.64)$ (20.66)$ (4.30)$ (551.10)$ -$ (36.12)$ -$ (43.24)$ (648.91)$ -$ (158,222.48)$

Metro Nashville District Energy SystemFY 12 - 13
Appendix 3
Chilled Water and Steam Revenues January, 13
Cust
omer
N
umbe
r
Cust
omer
N
ame
Cap
acity
Ope
ratin
g
ED
S
Impr
ovem
ent
Met
ro
Incr
emen
tal
Wat
er A
nd
Sew
er
Che
mic
al
Trea
tmen
t
Eng
inee
ring
Insu
ranc
e
ED
S
Ele
ctric
ity
ED
S M
aint
C
osts
Allo
c
TIFS
Ele
ctric
ity
Nat
ural
Gas
Pro
pane
Tota
l
2 A. A. Birch 11,341.04$ 15,370.49$ 673.30$ 1,873.40$ 989.37$ 381.60$ 101.15$ -$ 271.57$ -$ -$ 10,537.18$ 14,821.11$ -$ 56,360.21$ 4 Historic Metro Courthouse 5,368.83$ 7,172.15$ 314.18$ 874.19$ 339.62$ 130.99$ 47.20$ -$ 126.73$ -$ 814.79$ 3,366.88$ 5,949.29$ -$ 24,504.85$ 7 Parkway Towers 4,894.63$ 6,958.51$ 304.78$ 848.04$ 695.31$ 268.18$ 45.79$ -$ 122.94$ 655.50$ 174.85$ 7,986.88$ 8,413.70$ -$ 31,369.11$ 9 Wells Fargo Plaza 1,804.13$ 2,522.17$ 110.47$ 307.39$ 193.92$ 74.80$ 16.60$ -$ 44.56$ 235.50$ 94.92$ 1,968.68$ 3,237.75$ -$ 10,610.89$
10 501 Union Building 2,493.65$ 3,611.52$ 158.18$ 440.12$ -$ -$ 23.76$ -$ 63.80$ 286.74$ -$ -$ -$ -$ 7,077.77$ 11 Sheraton Hotel 10,327.75$ 13,976.43$ 612.23$ 1,703.49$ 1,049.36$ 404.73$ 91.97$ -$ 246.94$ 1,137.00$ 1,150.52$ 10,714.07$ 17,310.18$ -$ 58,724.67$ 12 Municipal Auditorium 5,182.79$ 7,427.28$ 325.31$ 905.16$ 277.00$ 106.84$ 48.87$ -$ 131.22$ -$ -$ 1,189.02$ 10,212.69$ -$ 25,806.18$ 21 Hermitage Hotel 4,988.47$ 6,553.38$ 287.08$ 798.80$ 307.56$ 118.63$ 43.13$ -$ 115.80$ 256.00$ 590.40$ 3,316.61$ 4,466.06$ -$ 21,841.92$ 24 Criminal Justice Center 8,435.04$ 10,774.70$ 472.04$ 1,313.43$ 1,182.19$ 455.96$ 70.91$ -$ 190.40$ -$ 673.05$ 14,464.35$ 11,258.41$ -$ 49,290.48$ 25 501 Union Building 1,966.83$ 2,641.84$ 115.72$ 322.00$ 323.46$ 124.76$ 17.38$ -$ 46.68$ 215.08$ 41.06$ 3,598.97$ 4,315.42$ -$ 13,729.20$ 28 4th & Church Building 19,258.14$ -$ -$ -$ 607.11$ 234.16$ 53.13$ -$ -$ -$ 298.88$ 6,347.36$ 9,502.82$ -$ 36,301.60$ 29 Fifth-Third Financial Center 6,010.91$ 9,778.45$ 428.18$ 1,191.40$ 264.29$ 101.93$ 64.33$ -$ 172.71$ 727.17$ 276.31$ 3,964.65$ -$ -$ 22,980.33$ 32 Renaissance Hotel 12,389.51$ 16,298.15$ 713.98$ 1,986.60$ 1,614.96$ 622.89$ 107.26$ -$ 287.98$ 1,352.00$ -$ 17,582.48$ 22,875.61$ -$ 75,831.42$ 33 Convention Center 15,255.54$ 20,634.15$ 903.87$ 2,514.97$ 1,427.12$ 550.42$ 135.78$ -$ 364.58$ -$ -$ 16,828.80$ 15,768.07$ -$ 74,383.30$ 34 Renaissance Office Tower 1,469.59$ 2,390.71$ 104.69$ 291.28$ 164.15$ 63.31$ 15.73$ -$ 42.23$ 210.00$ -$ 2,462.52$ -$ -$ 7,214.21$ 35 St. Mary's Catholic Church 922.25$ -$ -$ -$ -$ -$ -$ -$ -$ 30.74$ -$ -$ -$ -$ 952.99$ 36 Nashville City Center 4,898.63$ 7,969.02$ 348.95$ 970.94$ 436.21$ 168.24$ 52.42$ -$ 140.75$ 696.50$ 12.87$ 6,543.79$ -$ -$ 22,238.32$ 38 Wildhorse Saloon 1,823.56$ 2,609.56$ 114.30$ 318.03$ 186.31$ 71.85$ 17.17$ -$ 46.10$ 169.00$ 27.02$ 2,005.33$ 2,718.15$ -$ 10,106.38$ 39 Ryman Auditorium 1,881.32$ 2,736.99$ 119.87$ 333.54$ 274.52$ 105.88$ 18.01$ -$ 48.36$ 163.83$ -$ 2,833.01$ 4,424.43$ -$ 12,939.76$ 40 Bridgestone Arena 20,260.61$ 29,552.98$ 1,294.34$ 3,601.46$ 2,119.76$ 817.56$ 194.44$ -$ 522.08$ -$ 1,570.61$ 27,921.63$ 13,350.31$ -$ 101,205.78$ 41 L.P. Field 8,644.64$ 14,062.97$ 615.79$ 1,713.42$ 169.40$ 65.33$ 92.51$ -$ 248.39$ -$ -$ 2,541.30$ -$ -$ 28,153.75$ 43 Hume-Fogg High School 2,878.88$ 4,013.98$ 175.82$ 489.20$ 300.84$ 116.03$ 26.41$ -$ 70.92$ -$ 127.16$ 3,194.40$ 4,539.54$ -$ 15,933.18$ 44 Schermerhorn Symphony Center 14,027.00$ -$ -$ -$ 437.96$ 168.92$ 38.32$ -$ -$ -$ -$ 4,820.96$ 6,021.77$ -$ 25,514.93$ 45 Nashville Public Library 6,385.02$ -$ -$ -$ 573.09$ 221.03$ 59.63$ -$ -$ -$ 120.39$ 7,103.90$ 5,140.65$ -$ 19,603.71$ 49 Viridian Residential Tower 11,438.08$ -$ -$ -$ 77.45$ 29.87$ 28.94$ -$ -$ -$ 1,321.10$ 1,161.84$ -$ -$ 14,057.28$ 50 Music City Center -$ 2,125.91$ -$ -$ 3,164.18$ 1,220.43$ -$ -$ -$ -$ -$ 30,353.35$ 58,921.08$ -$ 95,784.95$ S1 State Government of TN 136,594.49$ 98,692.34$ -$ -$ 7,709.04$ 2,973.34$ -$ -$ 1,923.30$ -$ 5,454.34$ 82,389.87$ 114,498.15$ -$ 450,234.87$
Grand Totals: 320,941.33$ 287,873.68$ 8,193.08$ 22,796.86$ 24,884.18$ 9,597.68$ 1,410.84$ -$ 5,228.04$ 6,135.06$ 12,748.27$ 275,197.83$ 337,745.19$ -$ 1,312,752.04$ Rate Calculation Totals: 350,482.08$ 396,843.98$ 13,059.54$ 36,337.50$ 24,900.86$ 9,605.42$ 1,961.94$ -$ 5,267.77$ 6,135.06$ 12,748.27$ 275,244.88$ 338,447.24$ -$ 1,471,034.54$ Deviation: (29,540.75)$ (108,970.30)$ (4,866.46)$ (13,540.64)$ (16.68)$ (7.74)$ (551.10)$ -$ (39.73)$ -$ (47.05)$ (702.05)$ -$ (158,282.50)$

Metro Nashville District Energy SystemFY 12 - 13
Appendix 3
Chilled Water and Steam Revenues February, 13
Cust
omer
N
umbe
r
Cust
omer
N
ame
Cap
acity
Ope
ratin
g
ED
S
Impr
ovem
ent
Met
ro
Incr
emen
tal
Wat
er A
nd
Sew
er
Che
mic
al
Trea
tmen
t
Eng
inee
ring
Insu
ranc
e
ED
S
Ele
ctric
ity
ED
S M
aint
C
osts
Allo
c
TIFS
Ele
ctric
ity
Nat
ural
Gas
Pro
pane
Tota
l
2 A. A. Birch 11,341.04$ 15,370.49$ 673.30$ 1,873.40$ 997.19$ 329.29$ 101.15$ -$ 202.40$ -$ 1,669.01$ 7,887.13$ 13,395.67$ -$ 53,840.07$ 4 Historic Metro Courthouse 5,368.83$ 7,172.15$ 314.18$ 874.19$ 398.43$ 131.57$ 47.20$ -$ 94.45$ -$ 807.74$ 3,306.88$ 4,830.62$ -$ 23,346.24$ 7 Parkway Towers 4,894.63$ 6,958.51$ 304.78$ 848.04$ 820.74$ 271.03$ 45.79$ -$ 91.63$ 655.50$ 104.08$ 7,602.12$ 7,300.58$ -$ 29,897.43$ 9 Wells Fargo Plaza 1,804.13$ 2,522.17$ 110.47$ 307.39$ 239.28$ 79.02$ 16.60$ -$ 33.21$ 235.50$ 120.80$ 2,020.28$ 2,786.01$ -$ 10,274.86$
10 501 Union Building 2,493.65$ 3,611.52$ 158.18$ 440.12$ -$ -$ 23.76$ -$ 47.55$ 286.74$ -$ -$ -$ -$ 7,061.52$ 11 Sheraton Hotel 10,327.75$ 13,976.43$ 612.23$ 1,703.49$ 1,306.30$ 431.37$ 91.97$ -$ 184.05$ 1,137.00$ 1,150.52$ 10,632.22$ 16,541.37$ -$ 58,094.70$ 12 Municipal Auditorium 5,325.39$ 7,576.25$ 331.84$ 923.33$ 314.97$ 104.01$ 49.85$ -$ 99.76$ -$ -$ 866.35$ 9,680.52$ -$ 25,272.27$ 21 Hermitage Hotel 4,988.47$ 6,553.38$ 287.08$ 798.80$ 322.11$ 106.37$ 43.13$ -$ 86.30$ 256.00$ 351.21$ 2,756.27$ 3,627.66$ -$ 20,176.78$ 24 Criminal Justice Center 8,435.04$ 10,774.70$ 472.04$ 1,313.43$ 1,344.29$ 443.92$ 70.91$ -$ 141.91$ -$ 642.06$ 13,143.89$ 9,635.80$ -$ 46,417.99$ 25 501 Union Building 1,966.83$ 2,641.84$ 115.72$ 322.00$ 341.41$ 112.74$ 17.38$ -$ 34.79$ 215.08$ 76.83$ 2,976.68$ 3,659.34$ -$ 12,480.64$ 28 4th & Church Building 19,258.14$ -$ -$ -$ 698.06$ 230.52$ 53.10$ -$ -$ -$ 279.80$ 5,917.89$ 8,047.02$ -$ 34,484.53$ 29 Fifth-Third Financial Center 6,010.91$ 9,778.45$ 428.18$ 1,191.40$ 341.23$ 112.68$ 64.33$ -$ 128.72$ 727.17$ 228.95$ 4,065.67$ -$ -$ 23,077.69$ 32 Renaissance Hotel 12,389.51$ 16,298.15$ 713.98$ 1,986.60$ 1,776.37$ 586.60$ 107.26$ -$ 214.63$ 1,352.00$ -$ 15,339.42$ 19,538.31$ -$ 70,302.83$ 33 Convention Center 15,255.54$ 20,634.15$ 903.87$ 2,514.97$ 1,395.59$ 460.86$ 135.78$ -$ 271.72$ -$ -$ 12,820.03$ 12,771.70$ -$ 67,164.21$ 34 Renaissance Office Tower 1,469.59$ 2,390.71$ 104.69$ 291.28$ 191.68$ 63.30$ 15.73$ -$ 31.47$ 210.00$ -$ 2,283.85$ -$ -$ 7,052.30$ 35 St. Mary's Catholic Church 922.25$ -$ -$ -$ -$ -$ -$ -$ -$ 30.74$ -$ -$ -$ -$ 952.99$ 36 Nashville City Center 4,898.63$ 7,969.02$ 348.95$ 970.94$ 493.75$ 163.05$ 52.42$ -$ 104.90$ 696.50$ 19.30$ 5,882.96$ -$ -$ 21,600.42$ 38 Wildhorse Saloon 1,823.56$ 2,609.56$ 114.30$ 318.03$ 177.85$ 58.73$ 17.17$ -$ 34.36$ 169.00$ 44.51$ 1,458.22$ 2,216.52$ -$ 9,041.81$ 39 Ryman Auditorium 1,881.32$ 2,736.99$ 119.87$ 333.54$ 298.19$ 98.47$ 18.01$ -$ 36.03$ 163.83$ -$ 2,390.04$ 3,899.87$ -$ 11,976.16$ 40 Bridgestone Arena 20,260.61$ 29,552.98$ 1,294.34$ 3,601.46$ 3,180.02$ 1,050.14$ 194.44$ -$ 389.10$ -$ 1,532.76$ 33,356.48$ 15,202.43$ -$ 109,614.76$ 41 L.P. Field 8,644.64$ 14,062.97$ 615.79$ 1,713.42$ 96.70$ 31.93$ 92.51$ -$ 185.12$ -$ -$ 1,152.13$ -$ -$ 26,595.21$ 43 Hume-Fogg High School 2,878.88$ 4,013.98$ 175.82$ 489.20$ 287.69$ 95.00$ 26.41$ -$ 52.85$ -$ 129.43$ 2,404.78$ 3,430.82$ -$ 13,984.86$ 44 Schermerhorn Symphony Center 14,027.00$ -$ -$ -$ 529.86$ 174.97$ 38.30$ -$ -$ -$ -$ 4,728.41$ 5,314.97$ -$ 24,813.51$ 45 Nashville Public Library 6,385.02$ -$ -$ -$ 578.53$ 191.05$ 59.59$ -$ -$ -$ 124.85$ 5,728.30$ 3,906.56$ -$ 16,973.90$ 49 Viridian Residential Tower 11,438.08$ -$ -$ -$ 79.04$ 26.10$ 28.94$ -$ -$ -$ 1,338.26$ 941.74$ -$ -$ 13,852.16$ 50 Music City Center -$ 2,125.91$ -$ -$ 4,091.49$ 1,351.11$ -$ -$ -$ -$ -$ 30,234.86$ 62,094.03$ -$ 99,897.40$ S1 State Government of TN 136,594.49$ 98,692.34$ -$ -$ 8,633.11$ 2,850.87$ -$ -$ 1,433.41$ -$ 5,987.42$ 74,230.56$ 96,023.11$ -$ 424,445.31$
Grand Totals: 321,083.93$ 288,022.65$ 8,199.61$ 22,815.03$ 28,933.88$ 9,554.70$ 1,411.73$ -$ 3,898.36$ 6,135.06$ 14,607.53$ 254,127.16$ 303,902.91$ -$ 1,262,692.55$ Rate Calculation Totals: 350,482.08$ 396,843.98$ 13,059.54$ 36,337.50$ 28,950.60$ 9,559.86$ 1,961.94$ -$ 3,925.91$ 6,135.06$ 14,607.53$ 254,167.77$ 304,436.49$ -$ 1,420,468.26$ Deviation: (29,398.15)$ (108,821.33)$ (4,859.93)$ (13,522.47)$ (16.72)$ (5.16)$ (550.21)$ -$ (27.55)$ -$ -$ (40.61)$ (533.58)$ -$ (157,775.71)$

Metro Nashville District Energy SystemFY 12 - 13
Appendix 3
Chilled Water and Steam Revenues March, 13
Cust
omer
N
umbe
r
Cust
omer
N
ame
Cap
acity
Ope
ratin
g
ED
S
Impr
ovem
ent M
etro
In
crem
enta
l
Wat
er A
nd
Sew
er
Che
mic
al
Trea
tmen
t
Eng
inee
ring
Insu
ranc
e
ED
S
Ele
ctric
ity
ED
S M
aint
C
osts
Allo
c
TIFS
Ele
ctric
ity
Nat
ural
Gas
Pro
pane
Tota
l
2 A. A. Birch 11,341.04$ 15,370.49$ 673.30$ 1,873.40$ 847.44$ 328.29$ 101.15$ -$ 218.28$ -$ 1,732.59$ 8,310.21$ 14,979.08$ -$ 55,775.27$ 4 Historic Metro Courthouse 5,368.83$ 7,172.15$ 314.18$ 874.19$ 348.93$ 135.17$ 47.20$ -$ 101.86$ -$ 783.05$ 3,632.77$ 5,463.07$ -$ 24,241.40$ 7 Parkway Towers 4,894.63$ 6,958.51$ 304.78$ 848.04$ 692.45$ 268.26$ 45.79$ -$ 98.81$ 655.50$ 112.40$ 8,023.20$ 8,122.06$ -$ 31,024.43$ 9 Wells Fargo Plaza 1,804.13$ 2,522.17$ 110.47$ 307.39$ 210.79$ 81.66$ 16.60$ -$ 35.82$ 235.50$ 122.24$ 2,282.77$ 3,005.64$ -$ 10,735.18$
10 501 Union Building 2,493.65$ 3,611.52$ 158.18$ 440.12$ -$ -$ 23.76$ -$ 51.28$ 286.74$ -$ -$ -$ -$ 7,065.25$ 11 Sheraton Hotel 10,327.75$ 13,976.43$ 612.23$ 1,703.49$ 948.62$ 367.48$ 91.97$ -$ 198.48$ 1,137.00$ 1,150.52$ 9,385.82$ 16,488.68$ -$ 56,388.47$ 12 Municipal Auditorium 5,325.39$ 7,576.25$ 331.84$ 923.33$ 248.69$ 96.33$ 49.85$ -$ 107.58$ -$ -$ 1,001.50$ 9,195.98$ -$ 24,856.74$ 21 Hermitage Hotel 4,988.47$ 6,553.38$ 287.08$ 798.80$ 285.30$ 110.52$ 43.13$ -$ 93.07$ 256.00$ 342.13$ 3,112.85$ 3,990.68$ -$ 20,861.41$ 24 Criminal Justice Center 8,435.04$ 10,774.70$ 472.04$ 1,313.43$ 1,228.53$ 475.93$ 70.91$ -$ 153.04$ -$ 606.63$ 14,992.13$ 11,879.95$ -$ 50,402.33$ 25 501 Union Building 1,966.83$ 2,641.84$ 115.72$ 322.00$ 313.89$ 121.60$ 17.38$ -$ 37.52$ 215.08$ 64.91$ 3,402.02$ 4,466.19$ -$ 13,684.98$ 28 4th & Church Building 19,258.14$ -$ -$ -$ 592.36$ 229.48$ 53.10$ -$ -$ -$ 254.36$ 6,479.08$ 8,232.07$ -$ 35,098.59$ 29 Fifth-Third Financial Center 6,010.91$ 9,778.45$ 428.18$ 1,191.40$ 262.58$ 101.73$ 64.33$ -$ 138.81$ 727.17$ 244.74$ 3,964.63$ -$ -$ 22,912.93$ 32 Renaissance Hotel 12,389.51$ 16,298.15$ 713.98$ 1,986.60$ 1,529.48$ 592.52$ 107.26$ -$ 231.47$ 1,352.00$ -$ 16,553.17$ 21,842.49$ -$ 73,596.63$ 33 Convention Center 15,255.54$ 20,634.15$ 903.87$ 2,514.97$ 1,164.01$ 450.94$ 135.78$ -$ 293.03$ -$ -$ 14,065.35$ 11,721.43$ -$ 67,139.07$ 34 Renaissance Office Tower 1,469.59$ 2,390.71$ 104.69$ 291.28$ 152.27$ 58.99$ 15.73$ -$ 33.94$ 210.00$ -$ 2,299.10$ -$ -$ 7,026.30$ 35 St. Mary's Catholic Church 922.25$ -$ -$ -$ -$ -$ -$ -$ -$ 30.74$ -$ -$ -$ -$ 952.99$ 36 Nashville City Center 4,898.63$ 7,969.02$ 348.95$ 970.94$ 390.44$ 151.26$ 52.42$ -$ 113.12$ 696.50$ 19.30$ 5,895.13$ -$ -$ 21,505.71$ 38 Wildhorse Saloon 1,823.56$ 2,609.56$ 114.30$ 318.03$ 176.13$ 68.23$ 17.17$ -$ 37.06$ 169.00$ 27.02$ 1,899.48$ 2,537.76$ -$ 9,797.30$ 39 Ryman Auditorium 1,881.32$ 2,736.99$ 119.87$ 333.54$ 274.68$ 106.41$ 18.01$ -$ 38.86$ 163.83$ -$ 2,839.28$ 4,368.46$ -$ 12,881.25$ 40 Bridgestone Arena 20,260.61$ 29,552.98$ 1,294.34$ 3,601.46$ 3,081.38$ 1,193.74$ 194.44$ -$ 419.62$ -$ 1,267.84$ 40,178.73$ 21,194.75$ -$ 122,239.89$ 41 L.P. Field 8,644.64$ 14,062.97$ 615.79$ 1,713.42$ 132.52$ 51.34$ 92.51$ -$ 199.63$ -$ -$ 2,000.81$ -$ -$ 27,513.63$ 43 Hume-Fogg High School 2,878.88$ 4,013.98$ 175.82$ 489.20$ 235.41$ 91.19$ 26.41$ -$ 57.00$ -$ 129.43$ 2,436.29$ 3,734.40$ -$ 14,268.01$ 44 Schermerhorn Symphony Center 14,027.00$ -$ -$ -$ 468.39$ 181.45$ 38.30$ -$ -$ -$ -$ 5,279.44$ 5,986.89$ -$ 25,981.47$ 45 Nashville Public Library 6,385.02$ -$ -$ -$ 468.25$ 181.40$ 59.59$ -$ -$ -$ 129.31$ 6,068.07$ 3,346.06$ -$ 16,637.70$ 49 Viridian Residential Tower 11,438.08$ -$ -$ -$ 76.87$ 29.78$ 28.94$ -$ -$ -$ 1,269.63$ 1,160.64$ -$ -$ 14,003.94$ 50 Music City Center -$ 2,125.91$ -$ -$ 3,266.05$ 1,265.20$ -$ -$ -$ -$ -$ 27,734.92$ 72,066.97$ -$ 106,459.05$ S1 State Government of TN 136,594.49$ 98,692.34$ -$ -$ 7,274.95$ 2,818.29$ -$ -$ 1,545.81$ -$ 4,851.35$ 78,682.21$ 104,069.51$ -$ 434,528.95$
Grand Totals: 321,083.93$ 288,022.65$ 8,199.61$ 22,815.03$ 24,670.41$ 9,557.19$ 1,411.73$ -$ 4,204.09$ 6,135.06$ 13,107.45$ 271,679.60$ 336,692.12$ -$ 1,307,578.87$ Rate Calculation Totals: 350,482.08$ 396,843.98$ 13,059.54$ 36,337.50$ 24,680.89$ 9,559.86$ 1,961.94$ -$ 4,233.68$ 6,135.06$ 13,107.45$ 271,723.75$ 337,072.66$ -$ 1,465,198.39$ Deviation: (29,398.15)$ (108,821.33)$ (4,859.93)$ (13,522.47)$ (10.48)$ (2.67)$ (550.21)$ -$ (29.59)$ -$ (44.15)$ (380.54)$ -$ (157,619.52)$
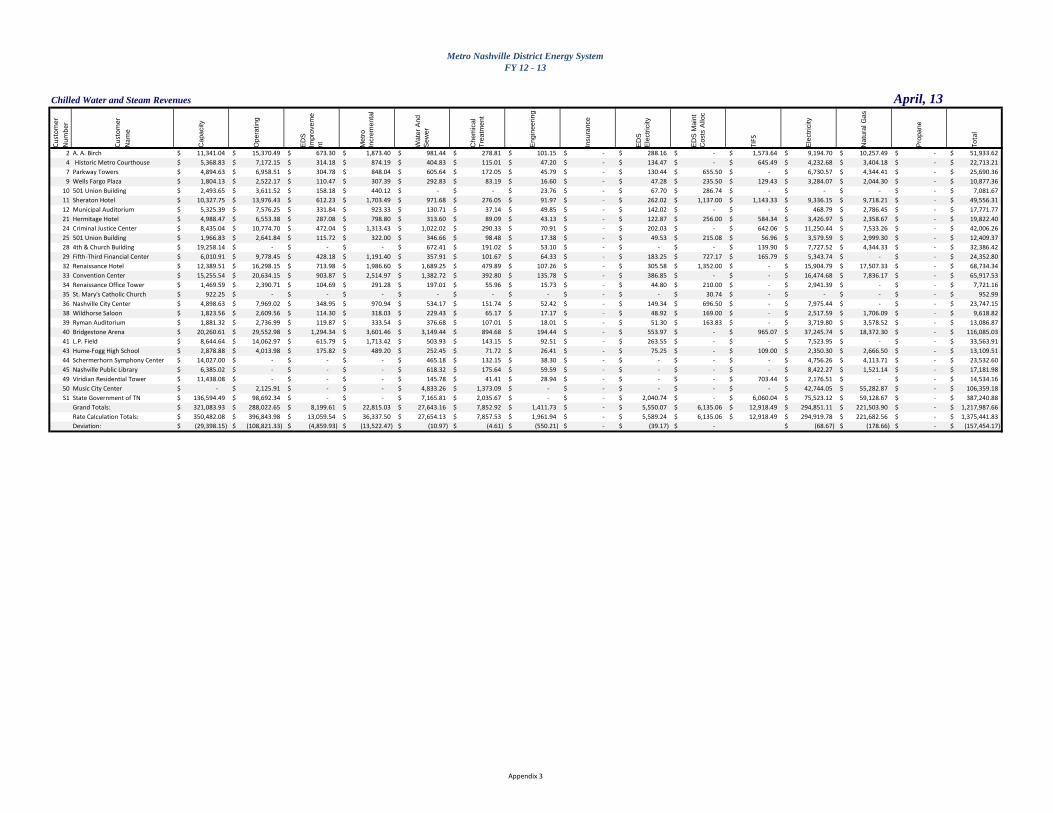
Metro Nashville District Energy SystemFY 12 - 13
Appendix 3
Chilled Water and Steam Revenues April, 13
Cust
omer
N
umbe
r
Cust
omer
N
ame
Cap
acity
Ope
ratin
g
ED
S
Impr
ovem
ent M
etro
In
crem
enta
l
Wat
er A
nd
Sew
er
Che
mic
al
Trea
tmen
t
Eng
inee
ring
Insu
ranc
e
ED
S
Ele
ctric
ity
ED
S M
aint
C
osts
Allo
c
TIFS
Ele
ctric
ity
Nat
ural
Gas
Pro
pane
Tota
l
2 A. A. Birch 11,341.04$ 15,370.49$ 673.30$ 1,873.40$ 981.44$ 278.81$ 101.15$ -$ 288.16$ -$ 1,573.64$ 9,194.70$ 10,257.49$ -$ 51,933.62$ 4 Historic Metro Courthouse 5,368.83$ 7,172.15$ 314.18$ 874.19$ 404.83$ 115.01$ 47.20$ -$ 134.47$ -$ 645.49$ 4,232.68$ 3,404.18$ -$ 22,713.21$ 7 Parkway Towers 4,894.63$ 6,958.51$ 304.78$ 848.04$ 605.64$ 172.05$ 45.79$ -$ 130.44$ 655.50$ -$ 6,730.57$ 4,344.41$ -$ 25,690.36$ 9 Wells Fargo Plaza 1,804.13$ 2,522.17$ 110.47$ 307.39$ 292.83$ 83.19$ 16.60$ -$ 47.28$ 235.50$ 129.43$ 3,284.07$ 2,044.30$ -$ 10,877.36$
10 501 Union Building 2,493.65$ 3,611.52$ 158.18$ 440.12$ -$ -$ 23.76$ -$ 67.70$ 286.74$ -$ -$ -$ -$ 7,081.67$ 11 Sheraton Hotel 10,327.75$ 13,976.43$ 612.23$ 1,703.49$ 971.68$ 276.05$ 91.97$ -$ 262.02$ 1,137.00$ 1,143.33$ 9,336.15$ 9,718.21$ -$ 49,556.31$ 12 Municipal Auditorium 5,325.39$ 7,576.25$ 331.84$ 923.33$ 130.71$ 37.14$ 49.85$ -$ 142.02$ -$ -$ 468.79$ 2,786.45$ -$ 17,771.77$ 21 Hermitage Hotel 4,988.47$ 6,553.38$ 287.08$ 798.80$ 313.60$ 89.09$ 43.13$ -$ 122.87$ 256.00$ 584.34$ 3,426.97$ 2,358.67$ -$ 19,822.40$ 24 Criminal Justice Center 8,435.04$ 10,774.70$ 472.04$ 1,313.43$ 1,022.02$ 290.33$ 70.91$ -$ 202.03$ -$ 642.06$ 11,250.44$ 7,533.26$ -$ 42,006.26$ 25 501 Union Building 1,966.83$ 2,641.84$ 115.72$ 322.00$ 346.66$ 98.48$ 17.38$ -$ 49.53$ 215.08$ 56.96$ 3,579.59$ 2,999.30$ -$ 12,409.37$ 28 4th & Church Building 19,258.14$ -$ -$ -$ 672.41$ 191.02$ 53.10$ -$ -$ -$ 139.90$ 7,727.52$ 4,344.33$ -$ 32,386.42$ 29 Fifth-Third Financial Center 6,010.91$ 9,778.45$ 428.18$ 1,191.40$ 357.91$ 101.67$ 64.33$ -$ 183.25$ 727.17$ 165.79$ 5,343.74$ -$ -$ 24,352.80$ 32 Renaissance Hotel 12,389.51$ 16,298.15$ 713.98$ 1,986.60$ 1,689.25$ 479.89$ 107.26$ -$ 305.58$ 1,352.00$ -$ 15,904.79$ 17,507.33$ -$ 68,734.34$ 33 Convention Center 15,255.54$ 20,634.15$ 903.87$ 2,514.97$ 1,382.72$ 392.80$ 135.78$ -$ 386.85$ -$ -$ 16,474.68$ 7,836.17$ -$ 65,917.53$ 34 Renaissance Office Tower 1,469.59$ 2,390.71$ 104.69$ 291.28$ 197.01$ 55.96$ 15.73$ -$ 44.80$ 210.00$ -$ 2,941.39$ -$ -$ 7,721.16$ 35 St. Mary's Catholic Church 922.25$ -$ -$ -$ -$ -$ -$ -$ -$ 30.74$ -$ -$ -$ -$ 952.99$ 36 Nashville City Center 4,898.63$ 7,969.02$ 348.95$ 970.94$ 534.17$ 151.74$ 52.42$ -$ 149.34$ 696.50$ -$ 7,975.44$ -$ -$ 23,747.15$ 38 Wildhorse Saloon 1,823.56$ 2,609.56$ 114.30$ 318.03$ 229.43$ 65.17$ 17.17$ -$ 48.92$ 169.00$ -$ 2,517.59$ 1,706.09$ -$ 9,618.82$ 39 Ryman Auditorium 1,881.32$ 2,736.99$ 119.87$ 333.54$ 376.68$ 107.01$ 18.01$ -$ 51.30$ 163.83$ -$ 3,719.80$ 3,578.52$ -$ 13,086.87$ 40 Bridgestone Arena 20,260.61$ 29,552.98$ 1,294.34$ 3,601.46$ 3,149.44$ 894.68$ 194.44$ -$ 553.97$ -$ 965.07$ 37,245.74$ 18,372.30$ -$ 116,085.03$ 41 L.P. Field 8,644.64$ 14,062.97$ 615.79$ 1,713.42$ 503.93$ 143.15$ 92.51$ -$ 263.55$ -$ -$ 7,523.95$ -$ -$ 33,563.91$ 43 Hume-Fogg High School 2,878.88$ 4,013.98$ 175.82$ 489.20$ 252.45$ 71.72$ 26.41$ -$ 75.25$ -$ 109.00$ 2,350.30$ 2,666.50$ -$ 13,109.51$ 44 Schermerhorn Symphony Center 14,027.00$ -$ -$ -$ 465.18$ 132.15$ 38.30$ -$ -$ -$ -$ 4,756.26$ 4,113.71$ -$ 23,532.60$ 45 Nashville Public Library 6,385.02$ -$ -$ -$ 618.32$ 175.64$ 59.59$ -$ -$ -$ -$ 8,422.27$ 1,521.14$ -$ 17,181.98$ 49 Viridian Residential Tower 11,438.08$ -$ -$ -$ 145.78$ 41.41$ 28.94$ -$ -$ -$ 703.44$ 2,176.51$ -$ -$ 14,534.16$ 50 Music City Center -$ 2,125.91$ -$ -$ 4,833.26$ 1,373.09$ -$ -$ -$ -$ -$ 42,744.05$ 55,282.87$ -$ 106,359.18$ S1 State Government of TN 136,594.49$ 98,692.34$ -$ -$ 7,165.81$ 2,035.67$ -$ -$ 2,040.74$ -$ 6,060.04$ 75,523.12$ 59,128.67$ -$ 387,240.88$
Grand Totals: 321,083.93$ 288,022.65$ 8,199.61$ 22,815.03$ 27,643.16$ 7,852.92$ 1,411.73$ -$ 5,550.07$ 6,135.06$ 12,918.49$ 294,851.11$ 221,503.90$ -$ 1,217,987.66$ Rate Calculation Totals: 350,482.08$ 396,843.98$ 13,059.54$ 36,337.50$ 27,654.13$ 7,857.53$ 1,961.94$ -$ 5,589.24$ 6,135.06$ 12,918.49$ 294,919.78$ 221,682.56$ -$ 1,375,441.83$ Deviation: (29,398.15)$ (108,821.33)$ (4,859.93)$ (13,522.47)$ (10.97)$ (4.61)$ (550.21)$ -$ (39.17)$ -$ (68.67)$ (178.66)$ -$ (157,454.17)$

Metro Nashville District Energy SystemFY 12 - 13
Appendix 3
Chilled Water and Steam Revenues May, 13
Cust
omer
N
umbe
r
Cust
omer
N
ame
Cap
acity
Ope
ratin
g
ED
S
Impr
ovem
ent M
etro
In
crem
enta
l
Wat
er A
nd
Sew
er
Che
mic
al
Trea
tmen
t
Eng
inee
ring
Insu
ranc
e
ED
S
Ele
ctric
ity
ED
S M
aint
C
osts
Allo
c
TIFS
Ele
ctric
ity
Nat
ural
Gas
Pro
pane
Tota
l
2 A. A. Birch 11,341.04$ 15,370.49$ 673.30$ 1,873.40$ 1,199.32$ 254.92$ 101.15$ 1,190.72$ 299.52$ -$ 1,430.58$ 11,488.58$ 7,228.52$ -$ 52,451.54$ 4 Historic Metro Courthouse 5,368.83$ 7,172.15$ 314.18$ 874.19$ 492.45$ 104.67$ 47.20$ 555.63$ 139.77$ -$ 606.69$ 5,604.39$ 1,959.19$ -$ 23,239.34$ 7 Parkway Towers 4,894.63$ 6,958.51$ 304.78$ 848.04$ 623.15$ 132.45$ 45.79$ 539.00$ 135.59$ 655.50$ -$ 7,204.01$ 2,351.61$ -$ 24,693.06$ 9 Wells Fargo Plaza 1,804.13$ 2,522.17$ 110.47$ 307.39$ 465.04$ 98.84$ 16.60$ 195.37$ 49.15$ 235.50$ 92.04$ 5,342.32$ 1,793.49$ -$ 13,032.51$
10 501 Union Building 2,493.65$ 3,611.52$ 158.18$ 440.12$ -$ -$ 23.76$ 279.74$ 70.37$ 286.74$ -$ -$ -$ -$ 7,364.08$ 11 Sheraton Hotel 10,327.75$ 13,976.43$ 612.23$ 1,703.49$ 1,408.82$ 299.44$ 91.97$ 1,082.72$ 272.36$ 1,137.00$ 1,071.42$ 13,730.84$ 8,223.50$ -$ 53,937.97$ 12 Municipal Auditorium 5,325.39$ 7,576.25$ 331.84$ 923.33$ 79.63$ 16.92$ 49.85$ 586.86$ 147.63$ -$ 22.71$ 1,073.15$ 126.97$ -$ 16,260.53$ 21 Hermitage Hotel 4,988.47$ 6,553.38$ 287.08$ 798.80$ 372.48$ 79.16$ 43.13$ 507.71$ 127.71$ 256.00$ 517.73$ 4,325.35$ 1,383.66$ -$ 20,240.66$ 24 Criminal Justice Center 8,435.04$ 10,774.70$ 472.04$ 1,313.43$ 1,075.77$ 228.65$ 70.91$ 834.81$ 210.00$ -$ 681.91$ 11,284.80$ 5,369.55$ -$ 40,751.61$ 25 501 Union Building 1,966.83$ 2,641.84$ 115.72$ 322.00$ 445.48$ 94.68$ 17.38$ 204.66$ 51.48$ 215.08$ 41.06$ 4,377.50$ 2,559.58$ -$ 13,053.29$ 28 4th & Church Building 19,258.14$ -$ -$ -$ 541.31$ 115.04$ 43.35$ 510.19$ -$ -$ 330.67$ 8,054.15$ -$ -$ 28,852.85$ 29 Fifth-Third Financial Center 6,010.91$ 9,778.45$ 428.18$ 1,191.40$ 499.44$ 106.14$ 64.33$ 757.25$ 190.48$ 727.17$ 142.10$ 7,431.16$ -$ -$ 27,327.01$ 32 Renaissance Hotel 12,389.51$ 16,298.15$ 713.98$ 1,986.60$ 2,021.46$ 429.67$ 107.26$ 1,262.67$ 317.62$ 1,352.00$ -$ 19,571.82$ 11,947.22$ -$ 68,397.96$ 33 Convention Center 15,255.54$ 20,634.15$ 903.87$ 2,514.97$ 1,704.64$ 362.31$ 135.78$ 1,598.50$ 402.10$ -$ -$ 20,322.80$ 5,732.26$ -$ 69,566.92$ 34 Renaissance Office Tower 1,469.59$ 2,390.71$ 104.69$ 291.28$ 222.62$ 47.31$ 15.73$ 185.14$ 46.57$ 210.00$ -$ 3,312.34$ -$ -$ 8,295.98$ 35 St. Mary's Catholic Church 922.25$ -$ -$ -$ -$ -$ -$ -$ -$ 30.74$ -$ -$ -$ -$ 952.99$ 36 Nashville City Center 4,898.63$ 7,969.02$ 348.95$ 970.94$ 698.47$ 148.44$ 52.42$ 617.12$ 155.23$ 696.50$ -$ 10,392.47$ -$ -$ 26,948.19$ 38 Wildhorse Saloon 1,823.56$ 2,609.56$ 114.30$ 318.03$ 305.06$ 64.84$ 17.17$ 202.14$ 50.84$ 169.00$ -$ 3,465.53$ 1,220.87$ -$ 10,360.90$ 39 Ryman Auditorium 1,881.32$ 2,736.99$ 119.87$ 333.54$ 571.39$ 121.46$ 18.01$ 212.00$ 53.32$ 163.83$ -$ 5,290.86$ 3,651.61$ -$ 15,154.20$ 40 Bridgestone Arena 20,260.61$ 29,552.98$ 1,294.34$ 3,601.46$ 4,376.23$ 930.17$ 194.44$ 2,289.06$ 575.81$ -$ 378.46$ 42,735.98$ 25,449.05$ -$ 131,638.59$ 41 L.P. Field 8,644.64$ 14,062.97$ 615.79$ 1,713.42$ 1,004.40$ 213.46$ 92.51$ 1,089.04$ 273.94$ -$ -$ 14,944.39$ -$ -$ 42,654.56$ 43 Hume-Fogg High School 2,878.88$ 4,013.98$ 175.82$ 489.20$ 331.25$ 70.41$ 26.41$ 310.94$ 78.22$ -$ 97.64$ 2,955.81$ 2,243.59$ -$ 13,672.15$ 44 Schermerhorn Symphony Center 14,027.00$ -$ -$ -$ 679.67$ 144.46$ 31.22$ 367.52$ -$ -$ -$ 6,423.78$ 4,195.36$ -$ 25,869.01$ 45 Nashville Public Library 6,385.02$ -$ -$ -$ 724.69$ 154.02$ 48.71$ 573.38$ -$ -$ 115.93$ 10,658.83$ 140.84$ -$ 18,801.42$ 49 Viridian Residential Tower 11,438.08$ -$ -$ -$ 243.58$ 51.77$ 23.35$ 274.85$ -$ -$ 245.92$ 3,624.20$ -$ -$ 15,901.75$ 50 Music City Center 77,565.41$ 8,542.75$ -$ 6,678.99$ 8,546.00$ 1,816.50$ 360.64$ 4,245.14$ -$ -$ 346.42$ 75,010.45$ 59,302.03$ -$ 242,414.33$ S1 State Government of TN 136,594.49$ 98,692.34$ -$ -$ 8,317.71$ 1,767.91$ -$ 8,432.62$ 2,121.22$ -$ 7,037.89$ 90,116.54$ 38,260.01$ -$ 391,340.73$
Grand Totals: 398,649.34$ 294,439.49$ 8,199.61$ 29,494.02$ 36,950.06$ 7,853.64$ 1,739.07$ 28,904.78$ 5,768.93$ 6,135.06$ 13,159.17$ 388,742.05$ 183,138.91$ -$ 1,403,174.13$ Rate Calculation Totals: 350,482.08$ 396,843.98$ 13,059.54$ 36,337.50$ 36,960.14$ 7,857.53$ 1,961.94$ 23,095.92$ 5,809.69$ 6,135.06$ 13,159.17$ 388,838.26$ 183,199.36$ -$ 1,463,740.17$ Deviation: 48,167.26$ (102,404.49)$ (4,859.93)$ (6,843.48)$ (10.08)$ (3.89)$ (222.87)$ 5,808.86$ (40.76)$ -$ -$ (96.21)$ (60.45)$ -$ (60,566.04)$

Metro Nashville District Energy SystemFY 12 - 13
Appendix 3
Chilled Water and Steam Revenues June, 13
Cust
omer
N
umbe
r
Cust
omer
N
ame
Cap
acity
Ope
ratin
g
ED
S
Impr
ovem
ent M
etro
In
crem
enta
l
Wat
er A
nd
Sew
er
Che
mic
al
Trea
tmen
t
Eng
inee
ring
Insu
ranc
e
ED
S
Ele
ctric
ity
ED
S M
aint
C
osts
Allo
c
TIFS
Ele
ctric
ity
Nat
ural
Gas
Pro
pane
Tota
l
2 A. A. Birch 11,341.04$ 15,370.49$ 673.30$ 1,873.40$ 1,773.79$ 288.00$ 101.15$ -$ 337.38$ -$ 1,247.78$ 22,982.43$ 5,943.06$ -$ 61,931.82$ 4 Historic Metro Courthouse 5,368.83$ 7,172.15$ 314.18$ 874.19$ 682.54$ 110.82$ 47.20$ -$ 157.43$ -$ 423.27$ 11,054.45$ 1,212.51$ -$ 27,417.57$ 7 Parkway Towers 4,894.63$ 6,958.51$ 304.78$ 848.04$ 585.49$ 95.05$ 45.79$ -$ 152.72$ 655.50$ -$ 11,226.79$ 192.59$ -$ 25,959.89$ 9 Wells Fargo Plaza 1,804.13$ 2,522.17$ 110.47$ 307.39$ 668.01$ 108.46$ 16.60$ -$ 55.36$ 235.50$ 64.72$ 9,407.18$ 1,872.78$ -$ 17,172.77$
10 501 Union Building 2,493.65$ 3,611.52$ 158.18$ 440.12$ -$ -$ 23.76$ -$ 79.26$ 286.74$ -$ -$ -$ -$ 7,093.23$ 11 Sheraton Hotel 10,327.75$ 13,976.43$ 612.23$ 1,703.49$ 2,287.14$ 371.35$ 91.97$ -$ 306.79$ 1,137.00$ 956.37$ 27,765.94$ 8,570.65$ -$ 68,107.11$ 12 Municipal Auditorium 5,325.39$ 7,576.25$ 331.84$ 923.33$ 367.56$ 59.67$ 49.85$ -$ 166.28$ -$ 195.29$ 6,374.88$ 448.00$ -$ 21,818.34$ 21 Hermitage Hotel 4,988.47$ 6,553.38$ 287.08$ 798.80$ 542.81$ 88.13$ 43.13$ -$ 143.86$ 256.00$ 514.71$ 9,125.41$ 801.99$ -$ 24,143.77$ 24 Criminal Justice Center 8,435.04$ 10,774.70$ 472.04$ 1,313.43$ 1,300.63$ 211.18$ 70.91$ -$ 236.54$ -$ 712.91$ 17,863.77$ 3,866.03$ -$ 45,257.18$ 25 501 Union Building 1,966.83$ 2,641.84$ 115.72$ 322.00$ 578.14$ 93.87$ 17.38$ -$ 57.99$ 215.08$ 21.19$ 7,225.39$ 2,065.98$ -$ 15,321.41$ 28 4th & Church Building 19,258.14$ -$ -$ -$ 834.37$ 135.46$ 43.35$ -$ -$ -$ 438.78$ 16,563.80$ 0.08$ -$ 37,273.98$ 29 Fifth-Third Financial Center 6,010.91$ 9,778.45$ 428.18$ 1,191.40$ 713.92$ 115.90$ 64.33$ -$ 214.56$ 727.17$ 307.89$ 14,172.88$ -$ -$ 33,725.59$ 32 Renaissance Hotel 12,389.51$ 16,298.15$ 713.98$ 1,986.60$ 2,404.75$ 390.44$ 107.26$ -$ 357.77$ 1,352.00$ -$ 34,868.91$ 6,253.81$ -$ 77,123.18$ 33 Convention Center 15,255.54$ 20,634.15$ 903.87$ 2,514.97$ 2,209.35$ 358.70$ 135.78$ -$ 452.92$ -$ -$ 35,392.27$ 4,114.63$ -$ 81,972.18$ 34 Renaissance Office Tower 1,469.59$ 2,390.71$ 104.69$ 291.28$ 296.26$ 48.10$ 15.73$ -$ 52.46$ 210.00$ -$ 5,881.46$ -$ -$ 10,760.28$ 35 St. Mary's Catholic Church 922.25$ -$ -$ -$ -$ -$ -$ -$ -$ 30.74$ -$ -$ -$ -$ 952.99$ 36 Nashville City Center 4,898.63$ 7,969.02$ 348.95$ 970.94$ 1,052.53$ 170.88$ 52.42$ -$ 174.86$ 696.50$ -$ 20,894.87$ -$ -$ 37,229.60$ 38 Wildhorse Saloon 1,823.56$ 2,609.56$ 114.30$ 318.03$ 386.13$ 62.69$ 17.17$ -$ 57.27$ 169.00$ -$ 7,177.85$ 236.98$ -$ 12,972.54$ 39 Ryman Auditorium 1,881.32$ 2,736.99$ 119.87$ 333.54$ 873.87$ 141.89$ 18.01$ -$ 60.06$ 163.83$ -$ 10,526.63$ 3,314.53$ -$ 20,170.54$ 40 Bridgestone Arena 20,260.61$ 29,552.98$ 1,294.34$ 3,601.46$ 4,930.32$ 800.50$ 194.44$ -$ 648.59$ -$ 454.15$ 67,118.50$ 14,945.79$ -$ 143,801.68$ 41 L.P. Field 8,644.64$ 14,062.97$ 615.79$ 1,713.42$ 1,951.85$ 316.88$ 92.51$ -$ 308.57$ -$ 34.06$ 38,748.35$ -$ -$ 66,489.04$ 43 Hume-Fogg High School 2,878.88$ 4,013.98$ 175.82$ 489.20$ 517.36$ 84.00$ 26.41$ -$ 88.10$ -$ 79.48$ 5,263.14$ 2,433.13$ -$ 16,049.50$ 44 Schermerhorn Symphony Center 14,027.00$ -$ -$ -$ 883.94$ 143.52$ 31.22$ -$ -$ -$ -$ 10,901.61$ 3,229.50$ -$ 29,216.79$ 45 Nashville Public Library 6,385.02$ -$ -$ -$ 1,081.90$ 175.64$ 48.71$ -$ -$ -$ 138.23$ 20,982.29$ 240.86$ -$ 29,052.65$ 49 Viridian Residential Tower 11,438.08$ -$ -$ -$ 414.39$ 67.27$ 23.35$ -$ -$ -$ 17.16$ 8,226.45$ -$ -$ 20,186.70$ 50 Music City Center 77,565.41$ 8,542.75$ -$ 6,678.99$ 13,864.48$ 2,251.17$ 360.64$ -$ -$ -$ -$ 155,016.89$ 58,416.23$ -$ 322,696.56$ S1 State Government of TN 136,594.49$ 98,692.34$ -$ -$ 12,415.11$ 2,015.71$ -$ -$ 2,389.32$ -$ 4,876.57$ 177,791.93$ 33,368.95$ -$ 468,144.42$
Grand Totals: 398,649.34$ 294,439.49$ 8,199.61$ 29,494.02$ 53,616.64$ 8,705.28$ 1,739.07$ -$ 6,498.09$ 6,135.06$ 10,482.56$ 752,554.07$ 151,528.08$ -$ 1,722,041.31$ Rate Calculation Totals: 350,482.08$ 396,843.98$ 13,059.54$ 36,337.50$ 53,626.05$ 8,708.70$ 1,961.94$ -$ 6,544.02$ 6,135.06$ 10,482.56$ 752,740.43$ 151,528.10$ -$ 1,788,449.96$ Deviation: 48,167.26$ (102,404.49)$ (4,859.93)$ (6,843.48)$ (9.41)$ (3.42)$ (222.87)$ -$ (45.93)$ -$ -$ (186.36)$ (0.02)$ -$ (66,408.65)$

Metro Nashville District Energy SystemFY 12 - 13
Appendix 3
Chilled Water and Steam Revenues True Up
Cust
omer
N
umbe
r
Cust
omer
N
ame
Cap
acity
Ope
ratin
g
ED
S
Impr
ovem
ent M
etro
In
crem
enta
l
Wat
er A
nd
Sew
er
Che
mic
al
Trea
tmen
t
Eng
inee
ring
Insu
ranc
e
ED
S
Ele
ctric
ity
ED
S M
aint
C
osts
Allo
c
TIFS
Ele
ctric
ity
Nat
ural
Gas
Pro
pane
Tota
l
2 A. A. Birch -$ -$ -$ (893.02)$ (104.61)$ 1,678.89$ (633.11)$ -$ -$ -$ -$ (253.35)$ (1,150.88)$ 264.29$ (1,091.79)$ 4 Historic Metro Courthouse -$ -$ -$ (416.71)$ (45.60)$ 648.42$ (295.72)$ -$ -$ -$ -$ (103.66)$ (352.50)$ 80.95$ (484.82)$ 7 Parkway Towers -$ -$ -$ (404.25)$ (64.42)$ 886.37$ (285.71)$ -$ -$ -$ -$ (144.04)$ (444.85)$ 102.16$ (354.74)$ 9 Wells Fargo Plaza -$ -$ -$ (156.33)$ (32.59)$ 454.11$ (110.55)$ -$ -$ -$ -$ (73.32)$ (235.35)$ 54.05$ (99.98)$
10 501 Union Building -$ -$ -$ (209.80)$ -$ -$ (148.11)$ -$ -$ -$ -$ -$ -$ -$ (357.91)$ 11 Sheraton Hotel -$ -$ -$ (812.03)$ (114.72)$ 1,800.46$ (771.25)$ -$ -$ -$ -$ (274.53)$ (1,189.30)$ 273.12$ (1,088.25)$ 12 Municipal Auditorium -$ -$ -$ (431.47)$ (16.63)$ 403.19$ (304.80)$ -$ -$ -$ -$ (51.33)$ (426.81)$ 98.01$ (729.84)$ 21 Hermitage Hotel -$ -$ -$ (380.77)$ (40.24)$ 556.83$ (270.52)$ -$ -$ -$ -$ (90.23)$ (283.56)$ 65.12$ (443.37)$ 24 Criminal Justice Center -$ -$ -$ (626.08)$ (108.00)$ 1,495.36$ (445.66)$ -$ -$ -$ -$ (242.23)$ (762.75)$ 175.16$ (514.20)$ 25 501 Union Building -$ -$ -$ (153.49)$ (34.29)$ 502.79$ (108.89)$ -$ -$ -$ -$ (79.19)$ (292.24)$ 67.11$ (98.20)$ 28 4th & Church Building -$ -$ -$ -$ (73.34)$ 967.45$ (363.15)$ -$ -$ -$ -$ (160.60)$ (431.93)$ 99.19$ 37.62$ 29 Fifth-Third Financial Center -$ -$ -$ (567.92)$ (59.39)$ 587.82$ (398.19)$ -$ -$ -$ -$ (114.17)$ -$ -$ (551.85)$ 32 Renaissance Hotel -$ -$ -$ (946.97)$ (167.10)$ 2,502.33$ (672.71)$ -$ -$ -$ -$ (390.12)$ (1,517.39)$ 348.46$ (843.50)$ 33 Convention Center -$ -$ -$ (1,198.85)$ (155.25)$ 2,026.24$ (850.04)$ -$ -$ -$ -$ (338.22)$ (875.61)$ 201.08$ (1,190.65)$ 34 Renaissance Office Tower -$ -$ -$ (138.85)$ (31.05)$ 307.32$ (97.35)$ -$ -$ -$ -$ (59.69)$ -$ -$ (19.62)$ 35 St. Mary's Catholic Church -$ -$ -$ -$ -$ -$ -$ -$ -$ -$ -$ -$ -$ -$ -$ 36 Nashville City Center -$ -$ -$ (462.83)$ (86.26)$ 853.79$ (324.51)$ -$ -$ -$ -$ (165.83)$ -$ -$ (185.64)$ 38 Wildhorse Saloon -$ -$ -$ (160.31)$ (28.12)$ 361.05$ (113.21)$ -$ -$ -$ -$ (60.76)$ (148.09)$ 34.01$ (115.43)$ 39 Ryman Auditorium -$ -$ -$ (166.62)$ (40.78)$ 610.59$ (158.25)$ -$ -$ -$ -$ (95.20)$ (370.12)$ 85.00$ (135.38)$ 40 Bridgestone Arena -$ -$ -$ (1,716.75)$ (327.26)$ 4,197.61$ (1,211.41)$ -$ -$ -$ -$ (706.96)$ (1,714.05)$ 393.62$ (1,085.20)$ 41 L.P. Field -$ -$ -$ (816.76)$ (118.89)$ 1,176.85$ (572.66)$ -$ -$ -$ -$ (228.58)$ -$ -$ (560.04)$ 43 Hume-Fogg High School -$ -$ -$ (233.20)$ (28.17)$ 456.85$ (165.02)$ -$ -$ -$ -$ (68.60)$ (318.47)$ 73.14$ (283.47)$ 44 Schermerhorn Symphony Center -$ -$ -$ -$ (51.81)$ 763.78$ (261.58)$ -$ -$ -$ -$ (119.98)$ (448.91)$ 103.09$ (15.41)$ 45 Nashville Public Library -$ -$ -$ -$ (91.74)$ 1,050.12$ (408.17)$ -$ -$ -$ -$ (187.91)$ (254.07)$ 58.35$ 166.58$ 49 Viridian Residential Tower -$ -$ -$ -$ (29.18)$ 288.86$ (195.47)$ -$ -$ -$ -$ (56.10)$ -$ -$ 8.11$ 50 Music City Center -$ -$ -$ (3,181.10)$ (418.94)$ 7,030.75$ (3,021.33)$ -$ -$ -$ -$ (1,039.53)$ (5,158.64)$ 1,184.65$ (4,604.14)$ S1 State Government of TN -$ -$ -$ -$ (810.43)$ 11,877.06$ -$ -$ -$ -$ -$ (1,871.05)$ (6,895.80)$ 1,583.59$ 3,883.37$
Grand Totals: -$ -$ -$ (14,074.11)$ (3,078.81)$ 43,484.89$ (12,187.37)$ -$ -$ -$ -$ (6,975.18)$ (23,271.32)$ 5,344.15$ (10,757.75)$ Rate Calculation Totals: -$ -$ -$ (17,321.45)$ (3,079.36)$ 43,507.10$ (16,451.66)$ -$ -$ -$ -$ (6,977.77)$ (23,300.78)$ 5,350.88$ (18,273.04)$ Deviation: -$ -$ -$ (3,247.34)$ (0.55)$ 22.21$ (4,264.29)$ -$ -$ -$ -$ (2.59)$ (29.46)$ 6.73$ 7,515.29$

Appendix 4

FILE: NDE FEA Reconciliation FY 12-13 - Copy PRINTSTAMP: 9/26/2013 11:16 AM
1 REV: 12 DATE: 09/26/133 NASHVILLE, TENNESSEE
4 CE INVOICE RECONCILIATION - FY 2012 - 201356 FINALIZE FUEL EFFICIENCY ADJUSTMENTS78 SUMMARY ELECTRIC FEA FUEL GAS FEA WATER FEA System TOTAL Include FEA9 STEAM SYSTEM $29,218.70 $111,346.03 $241.78 $140,806.51 in INVOICE YES
10 CHILLED WATER SYSTEM $296,614.34 $0.00 $137,249.96 $433,864.30 (YES/NO) NO11 TOTAL $325,833.04 $111,346.03 $137,491.74 $574,670.81 YES1213 ELECTRICITY-TO-STEAM CONVERSION14 CONTRACTUAL GUARANTEE 6.000 kWh per mlb sold CES PENALTY/BONUS CALCULATION PENALTY BONUS15 Metering Inaccuracy Buffer 0% RATE VARIANCE kWh per mlb sold 0.000 3.26516 GUARANTEED MAX QUANTITY 6.000 kWh per mlb sold STEAM SOLD 374,366 mlb17 CEPS FUEL EFFICIENCY ADJUSTM 6.000 kWh per mlb sold VARIANCE in kWh = RATE VARIANCE x STEAM SOLD 0 1,222,39918 CEPS ACTUAL CONVERSION RATE 2.735 kWh per mlb sold AVERAGE ELECTRIC PRICE $0.0956 / kWh19 CEPS PENALTY / BONUS $0.00 $29,218.7020 NOTE: Penalty at 100% of variance and Bonus at 25% of variance21 FUEL GAS-TO-STEAM CONVERSION22 CONTRACTUAL GUARANTEE (varies by Condensate Return, see below) CES PENALTY/BONUS CALCULATION PENALTY BONUS23 Given Condensate Return at 79% of Send-out RATE VARIANCE Dth. per mlb sold 0.000 0.23424 168 °F avg. Temp. STEAM SEND-OUT 433,527 mlb25 GUARANTEED MAX QUANTITY 1.684 Dth.per mlb sold VARIANCE in Dth. = RATE VARIANCE x STEAM SOLD 0 101,44526 CEPS FUEL EFFICIENCY ADJUSTM 1.596 Dth.per mlb sold AVERAGE FUEL PRICE $4.3904 / Dth.27 CEPS ACTUAL CONVERSION RATE 1.362 Dth.per mlb sold CEPS PENALTY / BONUS $0.00 $111,346.0328 NOTE: Penalty at 100% of variance and Bonus at 25% of variance29 WATER-TO-STEAM CONVERSION30 CONTRACTUAL GUARANTEE (varies by Plant Send-out, see below)) CES PENALTY/BONUS CALCULATION PENALTY BONUS31 PLANT LOSSES 15% VARIANCE in gallons = GMQ - CES ACTUAL USE 0 382,24832 VOLUMETRIC CONVERSION 7.4805 gallons per cft AVERAGE WATER PRICE $2.5301 / kGall33 CONDENSATE RETURN SPEC. VOL 8.15585 gall per lb CEPS PENALTY / BONUS $0.00 $241.7834 GUARANTEED MAX QUANTITY 12,840,719 gallons Average water pice excludes sewer.35 CEPS ACTUAL USE 12,458,471 gallons36 NOTE: Penalty at 100% of variance and Bonus at 25% of variance37 ELECTRICITY-TO-CHILLED WATER CONVERSION38 CONTRACTUAL GUARANTEE 1.055 kWh per ton-hr sold CES PENALTY/BONUS CALCULATION PENALTY BONUS39 Metering Inaccuracy Buffer 0% RATE VARIANCE kWh per ton-hr sold 0.000 0.19840 GUARANTEED MAX QUANTITY 1.055 kWh per ton-hr sold CHILLED WATER SOLD 62,537,600 ton-hrs41 CEPS FUEL EFFICIENCY ADJUSTM 1.055 kWh per ton-hr sold VARIANCE in kWh = RATE VARIANCE x CHW SOLD 0 12,409,21442 CEPS ACTUAL CONVERSION RATE 0.857 kWh per ton-hr sold AVERAGE ELECTRIC PRICE $0.0956 / kWh43 CEPS PENALTY / BONUS $0.00 $296,614.3444 NOTE: Penalty at 100% of variance and Bonus at 25% of variance45 WATER-TO-CHILLED WATER CONVERSION46 CONTRACTUAL GUARANTEE 5.250 gall per ton-hr sold CES PENALTY/BONUS CALCULATION PENALTY BONUS47 Metering Inaccuracy Buffer 0% RATE VARIANCE gall per ton-hr sold 0.000 3.47048 GUARANTEED MAX QUANTITY 5.250 gall per ton-hr sold CHILLED WATER SOLD 62,537,600 ton-hrs49 CEPS FUEL EFFICIENCY ADJUSTM 5.250 gall per ton-hr sold VARIANCE in gallons = RATE VARIANCE x CHW SOLD 0 216,987,40050 CEPS ACTUAL CONVERSION RATE 1.780 gall per ton-hr sold AVERAGE WATER PRICE $2.5301 / kGall51 CEPS PENALTY / BONUS $0.00 $137,249.9652 NOTE: Penalty at 100% of variance and Bonus at 25% of variance53545556 COMPARISON PREVIOUSLY BILLED VS. RECONCILED AMOUNTS57 STEAM SYSTEM CHILLED WATER SYSTEM58 CALCULATED RECONCILED VARIANCE CALCULATED RECONCILED VARIANCE59 ELECTRIC $27,685.81 $29,218.70 $1,532.89 ELECTRIC $312,673.31 $296,614.34 ($16,058.97)60 FUEL GAS $111,324.55 $111,346.03 $21.48 FUEL GAS $0.00 $0.00 $0.0061 WATER ($92.28) $241.78 $334.06 WATER $137,240.35 $137,249.96 $9.6162 TOTAL $138,918.08 $140,806.51 $1,888.43 TOTAL $449,913.66 $433,864.30 ($16,049.36)636465 COMPARISON AMOUNT COLLECTED BY METRO VS 97-13 CAP66 METRO PAID METRO OWES67 STEAM CHILLED WATER TOTAL CE CUSTOMER68 ELECTRIC $5,875.52 $142,028.97 $147,904.4969 FUEL GAS $34,109.96 $0.00 $34,109.9670 WATER $59.13 $64,514.15 $64,573.2871 TOTAL $40,044.61 $206,543.12 $246,587.73 $231,104.70 $15,483.0372
FEA COLLECTED BY METRO

1 REV: 12 DATE: 09/26/133 NASHVILLE, TENNESSEE
4 CE INVOICE RECONCILIATION - FY 2012 - 201356 SALES SUMMARY FROM CUSTOMER METER READS 1 2 3 4 5 67 MONTH 7 8 9 10 11 12 1 2 3 4 5 6 TOTAL
8 STEAM SALES Previously invoiced, lbs 7,535,349 10,311,710 16,235,962 29,975,979 39,751,080 44,119,574 54,441,523 49,875,549 52,735,178 30,485,383 22,914,596 15,984,243 374,366,126
9 Reconciled, lbs 7,535,349 10,311,710 16,235,962 29,975,979 39,751,080 44,119,574 54,441,523 49,875,549 52,735,178 30,485,383 22,914,596 15,984,243 374,366,126
10 CHW SALES Previously invoiced, ton-hrs 8,397,398 7,770,111 6,543,832 4,551,105 3,315,824 3,189,266 3,199,667 2,969,072 3,328,335 4,687,794 6,327,422 8,257,774 62,537,600
11 Reconciled, ton-hrs 8,397,398 7,770,111 6,543,832 4,551,105 3,315,824 3,189,266 3,199,667 2,969,072 3,328,335 4,687,794 6,327,422 8,257,774 62,537,600
12 SUMMARY FROM CUSTOMER METER READS from INVOICES (paste link)13 START DATE 07/01/12 08/01/12 09/01/12 10/01/12 10/01/12 12/01/12 01/01/13 02/01/13 03/01/13 04/01/13 05/01/13 06/01/13 07/01/12
14 END DATE 07/31/12 08/31/12 09/30/12 10/31/12 10/31/12 12/31/12 01/31/13 02/28/13 03/31/13 04/30/13 05/31/13 06/30/13 06/30/13
15 CHW SALES ton-hrs 8,397,398 7,770,111 6,543,832 4,551,105 3,315,824 3,189,266 3,199,667 2,969,072 3,328,335 4,687,794 6,327,422 8,257,774 62,537,600
16 CHW SENDOUT ton-hrs 8,666,700 8,182,000 6,623,300 4,843,979 3,406,109 3,346,000 3,384,400 3,194,100 3,559,000 4,962,500 6,580,600 8,655,900 65,404,588
17 CHW ELECTRIC kWh 7,534,737 6,827,438 5,620,081 3,697,670 2,768,839 2,569,789 2,597,243 2,434,428 2,764,735 3,802,386 5,152,287 6,907,700 52,677,334
18 CHW MUW galls 17,145,000 15,571,000 12,490,000 7,944,000 5,368,000 4,914,000 4,712,000 4,145,000 4,976,000 8,090,000 10,969,000 15,011,000 111,335,000
19 STEAM SALES mlbs 7,535 10,312 16,236 29,976 39,751 44,120 54,442 49,876 52,735 30,485 22,915 15,984 374,367
20 STEAM SENDOUT mlbs 14,180 17,370 21,829 35,388 43,736 48,578 58,158 52,916 56,512 35,145 28,152 21,563 433,527
21 STEAM PRODUCTION mlbs 17,392 20,618 25,032 40,165 51,086 57,275 67,211 60,646 65,272 41,016 31,746 24,457 501,916
22 NATURAL GAS mmBtu 20,408 23,699 29,909 48,232 57,739 66,904 79,506 72,633 77,358 47,393 37,449 28,706 589,936
23 PROPANE mmBtu 0 0 0 33 25 25 0 197 0 25 0 0 303
24 STEAM ELECTRIC kWh 48,021 50,441 52,191 75,460 107,491 111,936 127,676 117,459 124,624 86,087 68,203 53,084 1,022,673
25 CONDENSATE RETURN galls 190,000 1,488,300 2,050,900 3,629,300 4,351,100 4,753,700 5,721,500 5,261,100 5,656,700 3,566,700 3,026,300 2,293,900 41,989,500
26 mlbs 1,550 12,138 16,727 29,600 35,487 38,770 46,664 42,909 46,135 29,089 24,682 18,709 342,460
27 °F 144 °F 189 °F 174 °F 165 °F 164 °F 168 °F 169 °F 170 °F 165 °F 165 °F 181 °F 177 °F 169.4
28 STEAM MUW galls 1,643,710 790,400 578,190 739,200 1,141,460 1,387,730 1,673,900 1,423,610 1,441,620 772,560 405,590 337,150 12,335,120
29 mlbs 13,717 6,596 4,825 6,169 9,526 11,581 13,969 11,880 12,031 6,447 3,385 2,814 102,940
30 Days in Service 31 31 30 31 31 31 31 28 31 30 31 30 366
31 Efficiency - Cooling kWh/ton-hr-Sold 0.897 0.879 0.859 0.812 0.835 0.806 0.812 0.820 0.831 0.811 0.814 0.837 0.842
32 Efficiency - Heating Dth/klb-Sendout 1.439 1.364 1.370 1.364 1.321 1.378 1.367 1.376 1.369 1.349 1.330 1.331 1.361
333435

File: NDE FEA Reconciliation FY 12-13 - Copy Page 3 of 6 Printstamp: 9/26/2013 11:16 AM
1 s REV: 12 DATE: 09/26/133 NASHVILLE, TENNESSEE
4 CE INVOICE RECONCILIATION - FY 2012 - 201356 UTILITY INVOICES (Paste Link)7 Month of Service 7 8 9 10 11 12 1 2 3 4 5 6 TOTAL
8 ELECTRIC SERVICE (NES)
9 Service Dates From 7/1/2012 8/1/2012 9/1/2012 10/1/2012 11/1/2012 12/1/2012 1/1/2013 2/1/2013 3/1/2013 4/1/2013 5/1/2013 6/1/2013 7/1/201210 To 7/31/2012 8/31/2012 9/30/2012 10/31/2012 11/30/2012 12/31/2012 1/31/2013 2/28/2013 3/31/2013 4/30/2013 5/31/2013 6/30/2013 6/30/201311 PEAK Demand kW 16,338 15,430 14,834 0 0 9,380 9,380 9,380 9,380 0 0 16,228 16,33812 Service Period Use kWh 7,668,711 6,953,632 5,742,275 3,850,005 2,953,337 2,752,850 2,801,161 2,602,044 2,959,823 3,956,939 5,304,790 7,046,185 54,591,75213 Service Period Charge $ 799,443.66$ 730,420.63$ 646,608.31$ 289,870.45$ 237,206.80$ 278,396.59$ 275,244.88$ 254,167.77$ 271,723.75$ 294,919.78$ 388,838.26$ 752,740.43$ 5,219,581.31$ 14 Average Charge $/kWh 0.104200$ 0.105000$ 0.112600$ 0.075300$ 0.080300$ 0.101100$ 0.098300$ 0.097700$ 0.091800$ 0.074500$ 0.073300$ 0.106800$ 0.095611$ 15 NATURAL GAS SERVICE
16 Service Dates From 7/1/2012 8/1/2012 9/1/2012 10/1/2012 11/1/2012 12/1/2012 1/1/2013 2/1/2013 3/1/2013 4/1/2013 5/1/2013 6/1/2013 7/1/201217 To 7/31/2012 8/31/2012 9/30/2012 10/31/2012 11/30/2012 12/31/2012 1/31/2013 2/28/2013 3/31/2013 4/30/2013 5/31/2013 6/30/2013 6/30/201318 UTILITY METER Readings Start 147,349 167,389 190,904 220,828 268,558 325,533 391,868 470,749 542,271 618,232 664,293 701,10719 Ending 167,389 190,904 220,828 268,558 325,533 391,868 470,749 542,271 618,232 664,293 701,107 728,95920 UTILITY METER Multiplier 10 10 10 10 10 10 10 10 10 10 10 1021 HEAT FACTOR 1.020 1.008 1.008 1.018 1.012 1.013 1.012 1.013 1.014 1.018 1.017 1.02922 Service Period Use CCF 200,400 235,150 299,240 477,300 569,750 663,350 788,810 715,220 759,610 460,610 368,140 278,520 5,816,10023 Dth 20,440.8 23,703.1 30,163.4 48,589.1 57,658.7 67,197.4 79,827.6 72,451.8 77,024.5 46,890.1 37,439.8 28,659.7 590,046.024 Service Period Charges25 CONSULTANTS $ $7,971.73 $7,971.73 $7,971.73 $7,971.73 $7,971.73 $7,971.73 $7,971.73 $7,971.73 $7,971.73 $7,971.73 $7,971.73 $7,971.73 95,660.7626 NASHVILLE GAS $ 11,597.90$ 12,559.29$ 14,463.12$ 19,893.14$ 23,171.59$ 25,376.96$ 29,099.05$ 26,925.42$ 28,272.98$ 19,392.44$ 16,618.37$ 14,029.19$ 241,399.4527 ATMOS $ 67,512.40$ 80,444.57$ 94,881.85$ 166,604.37$ 226,124.13$ 263,682.83$ 301,376.46$ 269,539.34$ 300,827.95$ 194,318.39$ 158,609.26$ 129,527.18$ 2,253,448.7328 TOTAL $ 87,082.03$ $100,975.59 117,316.70$ 194,469.24$ 257,267.45$ 297,031.52$ 338,447.24$ 304,436.49$ 337,072.66$ 221,682.56$ 183,199.36$ 151,528.10$ 2,590,508.94$ 29 Average Charge $/Dth 4.2602$ 4.2600$ 3.8894$ 4.0023$ 4.4619$ 4.4203$ 4.2397$ 4.2019$ 4.3762$ 4.7277$ 4.8932$ 5.2871$ 4.3904$ 30 WATER SERVICE (DOMESTIC AND PLANT)
31 Service Dates From 7/1/2012 8/1/2012 9/1/2012 10/1/2012 11/1/2012 12/1/2012 1/1/2013 2/1/2013 3/1/2013 4/1/2013 5/1/2013 6/1/2013 7/1/201232 To 7/31/2012 8/31/2012 9/30/2012 10/31/2012 11/30/2012 12/31/2012 1/31/2013 2/28/2013 3/31/2013 4/30/2013 5/31/2013 6/30/2013 6/30/201333 UTILITY METER Readings34 DOMESTIC Start35 Ending36 PLANT METER #1 Start37 Ending38 PLANT METER #2 Start39 Ending40 Service Period Use41 DOMESTIC CCF 0 29 26 20 25 21 0 27 17 25 21 22 23342 PLANT METER #1 CCF 24,147 25,075 24,405 14,415 12,717 10,694 9,131 10,565 9,004 10,077 13,529 19,683 183,44243 PLANT METER #2 CCF 044 TOTAL CCF 24,147 25,104 24,431 14,435 12,742 10,715 9,131 10,592 9,021 10,102 13,550 19,705 183,67545 PLANT ONLY CCF 24,147 25,075 24,405 14,415 12,717 10,694 9,131 10,565 9,004 10,077 13,529 19,683 183,44246 GALLONS 18,061,956 18,756,100 18,254,940 10,782,420 9,512,316 7,999,112 6,829,988 7,902,620 6,734,992 7,537,596 10,119,692 14,722,884 137,214,61647 Service Period Charges48 DOMESTIC WATER $ 26.97$ 93.93$ 86.49$ 71.61$ 84.01$ 74.09$ 26.97$ 106.64$ 64.17$ 84.01$ 74.09$ 76.57$ 869.55$ 49 SEWER $ 57.75$ 200.85$ 184.95$ 153.15$ 179.65$ 158.45$ 57.75$ 227.90$ 137.25$ 179.65$ 158.45$ 163.75$ 1,859.55$ 50 PLANT WATER $ 45,679.58$ 47,449.20$ 46,180.15$ 27,281.04$ 24,071.76$ 20,243.38$ 17,276.82$ 20,006.40$ 17,044.47$ 19,078.53$ 25,605.54$ 37,246.53$ 347,163.40$ 51 SEWER $ 19,677.36$ 20,433.68$ 19,886.00$ 11,745.78$ 10,360.28$ 8,713.98$ 7,439.32$ 8,609.66$ 7,335.00$ 8,211.94$ 11,022.06$ 16,039.20$ 149,474.26$ 52 STATE FEE @ 10% 100.00$ 189.43$ 100.00$ 100.00$ 142.00$ 100.00$ 100.00$ -$ 100.00$ 100.00$ 100.00$ 100.00$ 1,231.43$ 53 TOTAL 65,541.66$ 68,367.09$ 66,437.59$ 39,351.58$ 34,837.70$ 29,289.90$ 24,900.86$ 28,950.60$ 24,680.89$ 27,654.13$ 36,960.14$ 53,626.05$ 500,598.19$ 54 PLANT, WATER ONLY $ 45,679.58$ 47,449.20$ 46,180.15$ 27,281.04$ 24,071.76$ 20,243.38$ 17,276.82$ 20,006.40$ 17,044.47$ 19,078.53$ 25,605.54$ 37,246.53$ 347,163.40$ 55 Average Charge $/kGall 2.5290$ 2.5298$ 2.5297$ 2.5301$ 2.5306$ 2.5307$ 2.5296$ 2.5316$ 2.5307$ 2.5311$ 2.5303$ 2.5298$ 2.5301$ 565758 MONTHLY FEAs 0 0 0 0 0 0 0 0 0 0 0 0 0
59 Service Dates From 7/1/2012 8/1/2012 9/1/2012 10/1/2012 11/1/2012 12/1/2012 1/1/2013 2/1/2013 3/1/2013 4/1/2013 5/1/2013 6/1/2013 7/1/201260 To 7/31/2012 8/31/2012 9/30/2012 10/31/2012 11/30/2012 12/31/2012 1/31/2013 2/28/2013 3/31/2013 4/30/2013 5/31/2013 6/30/2013 6/30/201361 STEAM ELECTRIC -$292.91 $298.83 $1,273.93 $1,965.44 $2,630.23 $3,861.66 $4,890.03 $4,440.37 $4,401.76 $1,803.31 $1,269.81 $1,143.35 $27,685.8162 FUEL GAS $3,594.54 $4,254.68 $4,736.68 $8,091.40 $13,432.66 $11,608.14 $13,993.13 $12,110.66 $13,910.84 $10,149.37 $8,402.68 $7,039.77 $111,324.5563 WATER $76.36 -$1,205.65 $1,137.94 $43.98 $6.50 -$47.36 -$176.84 -$67.82 $4.51 $46.55 $50.37 $39.18 -$92.2864 CHW ELECTRIC $34,562.85 $55,274.62 $16,728.25 $20,818.92 $14,644.33 $20,071.56 $19,107.53 $17,042.10 $17,110.30 $21,303.68 $27,943.96 $48,065.21 $312,673.3165 FUEL GAS $0.00 $0.00 $0.00 $0.00 $0.00 $0.00 $0.00 $0.00 $0.00 $0.00 $0.00 $0.00 $0.0066 WATER $17,032.09 $15,951.52 $13,826.67 $10,086.92 $7,616.95 $7,483.90 $7,642.64 $7,242.15 $7,907.11 $10,453.31 $14,073.03 $17,924.06 $137,240.3567 54,972.93$ 74,574.00$ 37,703.47$ 41,006.66$ 38,330.67$ 42,977.90$ 45,456.49$ 40,767.46$ 43,334.52$ 43,756.22$ 51,739.85$ 74,211.57$ 588,831.74$
6869 STEAM CAPACITY TEST ADJUSTMENTS70 Month 7 8 9 10 11 12 TOTAL71 NATURAL GAS72 USAGE CREDIT MCF 073 Dth 074 $ -$
File: NDE FEA Reconciliation FY 12-13 - Copy Page 4 of 6 Printstamp: 9/26/2013 11:16 AM
1 s REV: 12 DATE: 09/26/133 NASHVILLE, TENNESSEE
4 CE INVOICE RECONCILIATION - FY 2012 - 201375 ELECTRIC76 USAGE CREDIT kWh 077 $ -$ 78 WATER79 USAGE CREDIT kGallon 080 $ -$ 81 PLANT STEAM82 SEND-OUT CREDIT mlb 083848586 PLANT READINGS (Paste Link)87 Month 7 8 9 10 11 12 1 2 3 4 5 6 TOTAL88 DATE OF READINGS From 7/1/2012 8/1/2012 9/1/2012 10/1/2012 11/1/2012 12/1/2012 1/1/2013 2/1/2013 3/1/2013 4/1/2013 5/1/2013 6/1/2012 6/1/201289 (coincides with Customer Dates) To 7/31/2012 8/31/2012 9/30/2012 10/31/2012 11/30/2012 12/31/2012 1/31/2013 2/28/2013 3/31/2013 4/30/2013 5/31/2013 6/30/2012 5/31/201390 ELECTRIC METERS
91 SWG-2A Start Reading 65,231.07 66,434.95 67,850.11 68,801.08 69,358.90 69,585.24 70,514.03 70,990.23 71,616.66 71,924.21 72,383.02 73,484.2192 End Reading 66,434.95 67,850.11 68,801.08 69,358.90 69,585.24 70,514.03 70,990.23 71,616.66 71,924.21 72,383.02 73,484.21 74,112.3093 Period Use in units = 1,000 x kWh 1,203,880 1,415,160 950,970 557,820 226,340 928,790 476,200 626,430 307,550 458,810 1,101,190 628,090 8,881,23094 SWG-2B Start Reading 93,895.39 95,595.33 97,565.52 99,081.81 99,939.63 100,600.28 101,310.89 102,097.45 102,911.63 103,561.65 104,402.60 978.7795 End Reading 95,595.33 97,565.52 99,081.81 99,939.63 100,600.28 101,310.89 102,097.45 102,911.63 103,561.65 104,402.60 978.77 2,935.8896 Period Use in units = 1,000 x kWh 1,699,940 1,970,190 1,516,290 857,820 660,650 710,610 786,560 814,180 650,020 840,950 1,167,080 1,957,110 13,631,40097 SWG-3A Start Reading 66,269.42 67,787.12 200.91 1,020.56 1,458.74 1,762.70 1,992.14 2,497.70 2,878.05 3,656.67 4,157.92 4,811.2298 End Reading 67,787.12 200.91 1,020.56 1,458.74 1,762.70 1,992.14 2,497.70 2,878.05 3,656.67 4,157.92 4,811.22 6,408.2099 Period Use in units = 1,000 x kWh 1,517,700 738,710 819,650 438,180 303,960 229,440 505,560 380,350 778,620 501,250 653,300 1,596,980 8,463,700
100 SWG-3B Start Reading 72,738.62 74,259.38 75,433.57 76,451.76 77,333.21 78,162.52 78,260.63 78,490.99 78,490.99 78,863.99 79,914.67 80,881.01101 End Reading 74,259.38 75,433.57 76,451.76 77,333.21 78,162.52 78,260.63 78,490.99 78,490.99 78,863.99 79,914.67 80,881.01 82,056.94102 Period Use in units = 1,000 x kWh 1,520,760 1,174,190 1,018,190 881,450 829,310 98,110 230,360 0 373,000 1,050,680 966,340 1,175,930 9,318,320103 SWG-4A Start Reading 917,806.00 1,294,418.00 1,645,215.00 1,859,403.00 2,064,430.00 2,209,639.00 2,355,996.00 2,475,956.00 2,613,156.00 2,760,111.00 2,950,350.00 3,169,339.00104 End Reading 1,294,418.00 1,645,215.00 1,859,403.00 2,064,430.00 2,209,639.00 2,355,996.00 2,475,956.00 2,613,156.00 2,760,111.00 2,950,350.00 3,169,339.00 3,451,704.00105 Period Use in units = 1 x kWh 376,612 350,797 214,188 205,027 145,209 146,357 119,960 137,200 146,955 190,239 218,989 282,365 2,533,898106 SWG-4B Start Reading 18,072,644.00 18,372,546.00 18,671,803.00 18,996,067.00 19,157,685.00 19,300,338.00 19,389,210.00 19,503,824.00 19,637,543.00 19,784,836.00 19,976,905.00 20,261,736.00107 End Reading 18,372,546.00 18,671,803.00 18,996,067.00 19,157,685.00 19,300,338.00 19,389,210.00 19,503,824.00 19,637,543.00 19,784,836.00 19,976,905.00 20,261,736.00 20,611,740.00108 Period Use in units = 1 x kWh 299,902 299,257 324,264 161,618 142,653 88,872 114,614 133,719 147,293 192,069 284,831 350,004 2,539,096109 SWG-5A Start Reading 14,265,885.00 14,396,875.00 14,617,160.00 14,836,810.00 15,029,502.00 15,167,425.00 15,270,950.00 15,455,425.00 15,554,907.00 15,724,466.00 15,962,509.00 16,142,506.00110 End Reading 14,396,875.00 14,617,160.00 14,836,810.00 15,029,502.00 15,167,425.00 15,270,950.00 15,455,425.00 15,554,907.00 15,724,466.00 15,962,509.00 16,142,506.00 16,371,198.00111 Period Use in units = 1 x kWh 130,990 220,285 219,650 192,692 137,923 103,525 184,475 99,482 169,559 238,043 179,997 228,692 2,105,313112 SWG-5B Start Reading 12,915,567.00 13,206,547.00 13,386,329.00 13,533,717.00 13,633,341.00 13,765,292.00 13,853,992.00 13,867,897.00 13,954,897.00 13,991,225.00 23,468.00 217,811.00113 End Reading 13,206,547.00 13,386,329.00 13,533,717.00 13,633,341.00 13,765,292.00 13,853,992.00 13,867,897.00 13,954,897.00 13,991,225.00 23,468.00 217,811.00 402,529.00114 Period Use in units = 1 x kWh 290,980 179,782 147,388 99,624 131,951 88,700 13,905 87,000 37,026 53,272 194,343 184,718 1,508,689115 MCC-1 Start Reading 12,454,548.40 12,683,770.80 12,895,891.20 13,111,692.80 13,248,902.50 13,337,190.80 13,403,176.10 13,470,713.60 13,509,745.90 13,572,895.60 13,699,185.10 13,892,000.10116 End Reading 12,683,770.80 12,895,891.20 13,111,692.80 13,248,902.50 13,337,190.80 13,403,176.10 13,470,713.60 13,509,745.90 13,572,895.60 13,699,185.10 13,892,000.10 14,145,920.10117 Period Use in units = 1 x kWh 229,222 212,120 215,802 137,210 88,288 65,985 67,538 39,032 63,150 126,290 192,815 253,920 1,691,372118 MCC-2 Start Reading 12,509,931.90 12,728,042.20 12,948,525.80 13,097,442.90 13,217,409.70 13,273,702.30 13,335,472.20 13,385,935.20 13,445,985.10 13,490,220.80 13,593,016.90 13,740,415.10119 End Reading 12,728,042.20 12,948,525.80 13,097,442.90 13,217,409.70 13,273,702.30 13,335,472.20 13,385,935.20 13,445,985.10 13,490,220.80 13,593,016.90 13,740,415.10 13,946,136.90120 Period Use in units = 1 x kWh 218,110 220,484 148,917 119,967 56,293 61,770 50,463 60,050 44,236 102,796 147,398 205,722 1,436,205121 MCC-3 Start Reading 2,994,832.60 3,017,498.40 3,039,219.60 3,043,818.40 3,060,093.10 3,096,476.50 3,145,828.10 3,203,227.00 3,256,083.80 3,313,060.10 3,347,967.30 3,377,136.90122 End Reading 3,017,498.40 3,039,219.60 3,043,818.40 3,060,093.10 3,096,476.50 3,145,828.10 3,203,227.00 3,256,083.80 3,313,060.10 3,347,967.30 3,377,136.90 3,401,307.30123 Period Use in units = 1 x kWh 22,666 21,721 4,599 16,275 36,383 49,352 57,399 52,857 56,976 34,907 29,170 24,170 406,475124 MCC-4 Start Reading 4,050,403.90 4,075,463.90 4,103,842.50 4,151,022.00 4,209,275.30 4,278,617.90 4,339,166.60 4,407,147.20 4,469,065.10 4,534,616.80 4,584,723.90 4,623,152.70125 End Reading 4,075,463.90 4,103,842.50 4,151,022.00 4,209,275.30 4,278,617.90 4,339,166.60 4,407,147.20 4,469,065.10 4,534,616.80 4,584,723.90 4,623,152.70 4,651,729.90126 Period Use in units = 1 x kWh 25,060 28,379 28,379 58,253 69,343 60,549 67,981 61,918 65,552 50,107 38,429 28,577 582,526127 NOTES:
128129130131 OTHER METERS (Paste Link)
132 FT_6120: Propane Gas Start Reading 12,095.33 12,095.33 12,095.33 12,095.33 12,095.33 12,095.33 12,095.33 12,095.33 12,095.33 12,095.33 12,095.33 12,095.33133 End Reading 12,095.33 12,095.33 12,095.33 12,095.33 12,095.33 12,095.33 12,095.33 12,095.33 12,095.33 12,095.33 12,095.33 12,095.33134 Period Use in units = 1,000 x SCFT 0.00 0.00 0.00 0.00 0.00 0.00 0.00 0.00 0.00 0.00 0.00 0.00 0135 Higher Heating Value in units = BTU/SCFT 2,520 2,520 2,520 2,520 2,520 2,520 2,520 2,520 2,520 2,520 2,520 2,521136 FIQY_3000: Stm Sendout Start Reading 2,995,612 3,009,792 3,027,162 3,048,991 3,084,379 3,128,115 3,176,693 3,234,851 3,287,767 3,344,279 3,379,424 3,407,576137 End Reading 3,009,792 3,027,162 3,048,991 3,084,379 3,128,115 3,176,693 3,234,851 3,287,767 3,344,279 3,379,424 3,407,576 3,429,139138 Period Use in units = 1 x MLB 14,180 17,370 21,829 35,388 43,736 48,578 58,158 52,916 56,512 35,145 28,152 21,563 433,527139 WQ_1800: CHW Sendout Start Reading 482,344,700 491,011,400 498,967,300 505,590,600 510,140,000 513,394,000 516,740,000 520,124,400 523,318,500 526,877,500 531,840,000 538,420,600140 End Reading 491,011,400 498,967,300 505,590,600 510,140,000 513,394,000 516,740,000 520,124,400 523,318,500 526,877,500 531,840,000 538,420,600 547,076,500141 Period Use in units = 1 x TON-HRS 8,666,700 8,182,000 6,623,300 4,843,979 3,406,109 3,346,000 3,384,400 3,194,100 3,559,000 4,962,500 6,580,600 8,655,900 65,404,588142 FT_8100: Cond. Return Start Reading 128,182,100 128,313,700 129,802,000 131,852,900 135,482,200 139,833,300 144,587,000 150,308,500 155,569,600 161,226,300 164,793,000 167,819,300143 End Reading 128,313,700 129,802,000 131,852,900 135,482,200 139,833,300 144,587,000 150,308,500 155,569,600 161,226,300 164,793,000 167,819,300 170,113,200144 Period Use in units = 1 x GALL 190,000 1,488,300 2,050,900 3,629,300 4,351,100 4,753,700 5,721,500 5,261,100 5,656,700 3,566,700 3,026,300 2,293,900 41,989,500145 WQ_8100: Cond. Return Start Reading 149,510 149,684 151,589 153,966 157,894 162,594 167,855 174,236 180,144 186,271 190,148 2,727

File: NDE FEA Reconciliation FY 12-13 - Copy Page 5 of 6 Printstamp: 9/26/2013 11:16 AM
1 s REV: 12 DATE: 09/26/133 NASHVILLE, TENNESSEE
4 CE INVOICE RECONCILIATION - FY 2012 - 2013146 End Reading 149,684 151,589 153,966 157,894 162,594 167,855 174,236 180,144 186,271 190,148 2,727 5,443147 Period Use in units = 1 x mmBtu 174 1,905 2,377 3,928 4,700 5,261 6,381 5,908 6,127 3,877 3,685 2,716 47,039148 Condensate Return Temp 144 °F 189 °F 144 °F 165 °F 164 °F 168 °F 169 °F 170 °F 165 °F 165 °F 181 °F 177 °F 168 °F149 FT_4500: MUW, Stm. Start Reading 85,275,280 86,918,990 87,709,390 88,287,580 89,026,780 90,168,240 91,555,970 93,229,870 94,653,480 96,095,100 96,867,660 97,273,250150 End Reading 86,918,990 87,709,390 88,287,580 89,026,780 90,168,240 91,555,970 93,229,870 94,653,480 96,095,100 96,867,660 97,273,250 97,610,400151 Period Use in units = 1 x GALL 1,643,710 790,400 578,190 739,200 1,141,460 1,387,730 1,673,900 1,423,610 1,441,620 772,560 405,590 337,150 12,335,120152 FT_4200: MUW, CW. Start Reading 850,827,000 867,972,000 883,543,000 896,033,000 903,977,000 909,345,000 914,259,000 918,971,000 923,116,000 928,092,000 936,182,000 947,151,000153 End Reading 867,972,000 883,543,000 896,033,000 903,977,000 909,345,000 914,259,000 918,971,000 923,116,000 928,092,000 936,182,000 947,151,000 962,162,000154 Period Use in units = 1 x GALL 17,145,000 15,571,000 12,490,000 7,944,000 5,368,000 4,914,000 4,712,000 4,145,000 4,976,000 8,090,000 10,969,000 15,011,000 111,335,000155 FT_4100: MUW, CHW. Start Reading 51,766,500 52,714,000 53,646,700 54,648,100 55,705,800 56,515,200 57,384,900 58,248,100 59,057,700 59,971,300 60,914,000 61,918,100156 End Reading 52,714,000 53,646,700 54,648,100 55,705,800 56,515,200 57,384,900 58,248,100 59,057,700 59,971,300 60,914,000 61,918,100 62,870,400157 Period Use in units = 1 x GALL 947,500 932,700 1,001,400 1,057,700 809,400 869,700 863,200 809,600 913,600 942,700 1,004,100 952,300 11,103,900158 2" PLANT WATER Start Reading in 10 x scft 28,612,300 28,869,200 29,166,500 29,444,100 29,707,200 29,954,700 30,214,300 30,482,200 30,723,300 30,831,000 31,086,500 31,301,000159 UTILITY METER Start Reading in 10 x scft 28,869,200 29,166,500 29,444,100 29,707,200 29,954,700 30,214,300 30,482,200 30,723,300 30,831,000 31,086,500 31,301,000 31,404,100160 Period Use in units = 1 x SCFT 256,900 297,300 277,600 263,100 247,500 259,600 267,900 241,100 107,700 255,500 214,500 103,100 2,791,800161 6" PLANT WATER Start Reading 120,844,500 123,221,000 125,270,500 126,904,000 127,973,500 128,734,000 129,466,500 130,204,000 130,880,000 131,771,000 132,847,000 134,308,500162 UTILITY METER End Reading 123,221,000 125,270,500 126,904,000 127,973,500 128,734,000 129,466,500 130,204,000 130,880,000 131,771,000 132,847,000 134,308,500 136,390,500163 Period Use in units = 1 x SCFT 2,376,500 2,049,500 1,633,500 1,069,500 760,500 732,500 737,500 676,000 891,000 1,076,000 1,461,500 2,082,000 15,546,000164 2" DOMESTIC WATER Start Reading 1,654,000.0 1,680,000.0 1,704,000.0 1,729,000.0 1,753,000.0 1,776,000.0 1,795,000.0 1,817,000.0 1,839,000.0 1,858,000.0 1,883,000.0 1,903,000.0165 UTILITY METER End Reading 1,680,000.0 1,704,000.0 1,729,000.0 1,753,000.0 1,776,000.0 1,795,000.0 1,817,000.0 1,839,000.0 1,858,000.0 1,883,000.0 1,903,000.0 1,926,000.0166 Period Use in units = 1 x SCFT 26,000 24,000 25,000 24,000 23,000 19,000 22,000 22,000 19,000 25,000 20,000 23,000 272,000167
168
169 PERFORMANCE CALCULATIONS170 Month 7 8 9 10 11 12 13 14 15 16 17 18 TOTAL
171 ELECTRIC-to-STEAM CONVERSION
172 Emainutility kWh 7,668,711 6,953,632 5,742,275 3,850,005 2,953,337 2,752,850 2,801,161 2,602,044 2,959,823 3,956,939 5,304,790 7,046,185 54,591,752
173 Echw,metered kWh 7,488,097 6,780,975 5,575,309 3,651,408 2,722,577 2,522,159 2,549,635 2,377,443 2,717,408 3,754,399 5,106,283 6,863,531 52,109,223
174 Esteam,metered kWh 47,726 50,100 32,978 74,528 105,726 109,901 125,380 114,775 122,528 85,014 67,599 52,747 989,001
175 Esteam,unmetered kWh 827 883 769 2,402 4,476 4,822 5,646 4,844 4,963 2,525 1,668 972 34,797
176 CAPACITY TEST ADJUSTMENT, kWh 0 0 0 0 0 0 0 0 0 0 0 0 0
177 Esteam,total kWh 48,553 50,983 33,747 76,930 110,202 114,723 131,026 119,619 127,491 87,539 69,267 53,719 1,023,798
178 Customer Steam, Sn+e lbs 7,535,349 10,311,710 16,235,962 29,975,979 39,751,080 44,119,574 54,441,523 49,875,549 52,735,178 30,485,383 22,914,596 15,984,243 374,366,126
179 nelec, actual kWh/klb 6.443 4.944 2.079 2.566 2.772 2.600 2.407 2.398 2.418 2.872 3.023 3.361 2.735
180 FUEL GAS-to-STEAM CONVERSION
181 Metered Plant Steam Send-out lbs 14,180,000 17,370,000 21,829,000 35,388,000 43,736,000 48,578,000 58,158,000 52,916,000 56,512,000 35,145,000 28,152,000 21,563,000 433,527,000
182 CAPACITY TEST ADJUSTMENT, lbs 0 0 0 0 0 0 0 0 0 0 0 0 0
183 ADJUSTED Plant Steam SO lbs 14,180,000 17,370,000 21,829,000 35,388,000 43,736,000 48,578,000 58,158,000 52,916,000 56,512,000 35,145,000 28,152,000 21,563,000 433,527,000
184 Natural Gas use, NG Dth 20,440.8 23,703.1 30,163.4 48,589.1 57,658.7 67,197.4 79,827.6 72,451.8 77,024.5 46,890.1 37,439.8 28,659.7 590,046.0
185 Propane Gas use, P scft 0 0 0 0 0 0 0 0 0 0 0 0 0
186 Dth 0 0 0 33 25 25 0 197 0 25 0 0 303.90
187 CAPACITY TEST ADJUSTMENT, Dth 0.0 0.0 0.0 0.0 0.0 0.0 0.0 0.0 0.0 0.0 0.0 0.0 0
188 TOTAL FUEL GAS USE Dth 20,440.8 23,703.1 30,163.4 48,621.9 57,683.3 67,222.0 79,827.6 72,648.8 77,024.5 46,915.1 37,439.8 28,659.7 590,349.9
189 nhhv,actual Dth/klb 1.442 1.365 1.382 1.374 1.319 1.384 1.373 1.373 1.363 1.335 1.330 1.329 1.3620
190 Condensate Return, CR gallon 190,000 1,488,300 2,050,900 3,629,300 4,351,100 4,753,700 5,721,500 5,261,100 5,656,700 3,566,700 3,026,300 2,293,900 41,989,500191 % of SO 10.93% 69.88% 76.63% 83.64% 81.14% 79.81% 80.24% 81.09% 81.64% 82.77% 87.67% 86.76% 78.99%192 Condensate Return Energy mmBtu 174 1,905 2,377 3,928 4,700 5,261 6,381 5,908 6,127 3,877 3,685 2,716 47,039193 Condensate Return Temperature avg 144 °F 189 °F 144 °F 165 °F 164 °F 168 °F 169 °F 170 °F 165 °F 165 °F 181 °F 177 °F 168 °F194 nhhv,guarantee Dth/klb GUARANTEED MAX RATE 1.684195 CES FEA RATE 1.596
196 WATER-to-STEAM CONVERSION
197 Metered Steam Makeup, MW Gallons 1,643,710 790,400 578,190 739,200 1,141,460 1,387,730 1,673,900 1,423,610 1,441,620 772,560 405,590 337,150 12,335,120198 CAPACITY TEST ADJUSTMENT, Gallons 0 0 0 0 0 0 0 0 0 0 0 0 0199 ADJUSTED Steam Makeup, MW Gallons 1,643,710 790,400 578,190 739,200 1,141,460 1,387,730 1,673,900 1,423,610 1,441,620 772,560 405,590 337,150 12,335,120200 Actual Steam Makeup, nwater Gallons 1,660,147 798,304 583,972 746,592 1,152,875 1,401,607 1,690,639 1,437,846 1,456,036 780,286 409,646 340,522 12,458,471201 Guarantee Steam Makeup, nguar. Gallons 1,780,924 737,679 719,421 816,122 1,163,146 1,382,893 1,620,732 1,411,054 1,463,161 853,848 489,274 402,464 12,840,719202 ELECTRICITY-to-CHW CONVERSION
203 Emainutility kWh 7,668,711 6,953,632 5,742,275 3,850,005 2,953,337 2,752,850 2,801,161 2,602,044 2,959,823 3,956,939 5,304,790 7,046,185 54,591,752204 CAPACITY TEST ADJUSTMENT, kWh 0 0 0 0 0 0 0 0 0 0 0 0 0205 Echw,metered kWh 7,488,097 6,780,975 5,575,309 3,651,408 2,722,577 2,522,159 2,549,635 2,377,443 2,717,408 3,754,399 5,106,283 6,863,531 52,109,223206 Esteam,total kWh 48,553 50,983 33,747 76,930 110,202 114,723 131,026 119,619 127,491 87,539 69,267 53,719 1,023,798207 Echw,unmetered kWh 132,061 121,674 133,220 121,667 120,558 115,968 120,501 104,982 114,924 115,001 129,240 128,935 1,458,731208 Echw,total kWh 7,620,158 6,902,649 5,708,528 3,773,075 2,843,135 2,638,127 2,670,135 2,482,425 2,832,332 3,869,400 5,235,523 6,992,466 53,567,954209 Customer CHW, CHWs+e Ton-hrs 8,397,398 7,770,111 6,543,832 4,551,105 3,315,824 3,189,266 3,199,667 2,969,072 3,328,335 4,687,794 6,327,422 8,257,774 62,537,600210 nelec, actual kWh/ton-hr 0.907 0.888 0.872 0.829 0.857 0.827 0.835 0.836 0.851 0.825 0.827 0.847 0.857
211 CW-to-CHW CONVERSION
212 Condenser Water Makeup, CM Gallons 17,145,000 15,571,000 12,490,000 7,944,000 5,368,000 4,914,000 4,712,000 4,145,000 4,976,000 8,090,000 10,969,000 15,011,000 111,335,000213 Customer CHW, CHWs+e Ton-hrs 8,397,398 7,770,111 6,543,832 4,551,105 3,315,824 3,189,266 3,199,667 2,969,072 3,328,335 4,687,794 6,327,422 8,257,774 62,537,600214 nwater,actual Gallons/ton-hr 2.0417 2.0040 1.9087 1.7455 1.6189 1.5408 1.4727 1.3961 1.4950 1.7258 1.7336 1.8178 1.7803
215

File: NDE FEA Reconciliation FY 12-13 - Copy Page 6 of 6 Printstamp: 9/26/2013 11:16 AM
1 s REV: 12 DATE: 09/26/133 NASHVILLE, TENNESSEE
4 CE INVOICE RECONCILIATION - FY 2012 - 2013216
217 METER CHECKS AND ESTIMATES218 WATER METER CHECKS 7 8 9 10 11 12 1 2 3 4 5 6 TOTAL
219 Utility Meters - Utility Dates gallons 18,061,956 18,756,100 18,254,940 10,782,420 9,512,316 7,999,112 6,829,988 7,902,620 6,734,992 7,537,596 10,119,692 14,722,884 137,214,616
220 Utility Meters - Customer Dates gallons 19,697,832 17,554,064 14,295,028 9,967,848 7,539,840 7,420,908 7,520,392 6,859,908 7,470,276 9,959,620 12,536,480 16,344,548 137,166,744
221 variance (line 184-line 183) gallons 1,635,876 -1,202,036 -3,959,912 -814,572 -1,972,476 -578,204 690,404 -1,042,712 735,284 2,422,024 2,416,788 1,621,664 -47,872
222 % of TOTAL (line 183) 9% -6% -22% -8% -21% -7% 10% -13% 11% 32% 24% 11% -0.03%
223 Plant Meters224 CHW gallons 947,500 932,700 1,001,400 1,057,700 809,400 869,700 863,200 809,600 913,600 942,700 1,004,100 952,300 11,103,900
225 CW gallons 17,145,000 15,571,000 12,490,000 7,944,000 5,368,000 4,914,000 4,712,000 4,145,000 4,976,000 8,090,000 10,969,000 15,011,000 111,335,000
226 STEAM gallons 1,643,710 790,400 578,190 739,200 1,141,460 1,387,730 1,673,900 1,423,610 1,441,620 772,560 405,590 337,150 12,335,120
227 TOTAL gallons 19,736,210 17,294,100 14,069,590 9,740,900 7,318,860 7,171,430 7,249,100 6,378,210 7,331,220 9,805,260 12,378,690 16,300,450 134,774,020
228 variance (line 191-line 184) gallons 38,378 -259,964 -225,438 -226,948 -220,980 -249,478 -271,292 -481,698 -139,056 -154,360 -157,790 -44,098 -2,392,724
229 % of TOTAL (line 184) 0% -1% -2% -2% -3% -3% -4% -7% -2% -2% -1% 0% -1.74%
230231 CW MUW CHECK 7 8 9 10 11 12 1 2 3 4 5 6 TOTAL
232 CHW Send-out ton-hrs 8,666,700 8,182,000 6,623,300 4,843,979 3,406,109 3,346,000 3,384,400 3,194,100 3,559,000 4,962,500 6,580,600 8,655,900 65,404,588
233 CW MUW Rate gall/ton-hr 1.978 1.903 1.886 1.640 1.576 1.469 1.392 1.298 1.398 1.630 1.667 1.734 1.702
234235 FINAL MAKEUP WATER RESULTS 7 8 9 10 11 12 1 2 3 4 5 6 TOTAL
236 CHW gallons 947,500 932,700 1,001,400 1,057,700 809,400 869,700 863,200 809,600 913,600 942,700 1,004,100 952,300 11,103,900
237 CW gallons 17,145,000 15,571,000 12,490,000 7,944,000 5,368,000 4,914,000 4,712,000 4,145,000 4,976,000 8,090,000 10,969,000 15,011,000 111,335,000
238 STEAM gallons 1,643,710 790,400 578,190 739,200 1,141,460 1,387,730 1,673,900 1,423,610 1,441,620 772,560 405,590 337,150 12,335,120
239 TOTAL gallons 19,736,210 17,294,100 14,069,590 9,740,900 7,318,860 7,171,430 7,249,100 6,378,210 7,331,220 9,805,260 12,378,690 16,300,450 134,774,020
240 variance gallons 38,378 -259,964 -225,438 -226,948 -220,980 -249,478 -271,292 -481,698 -139,056 -154,360 -157,790 -44,098 -2,392,724
241 % of TOTAL (line 184) 0% -1% -1% -2% -2% -3% -4% 0% 0% -2% -2% 0% -2%
242243 STEAM PLANT MASS BALANCE CK 7 8 9 10 11 12 1 2 3 4 5 6 TOTAL
244 STEAM SENDOUT klbs 14,180 17,370 21,829 35,388 43,736 48,578 58,158 52,916 56,512 35,145 28,152 21,563 433,527
245 STEAM PRODUCTION klbs 20,408 23,699 29,909 48,232 57,739 66,904 79,506 72,633 77,358 47,393 37,449 28,706 589,936
246 -6,228 -6,329 -8,080 -12,844 -14,003 -18,326 -21,348 -19,717 -20,846 -12,248 -9,297 -7,143247 CALC'D LOSSES248 BLOWDOW4% klbs 816 948 1,196 1,929 2,310 2,676 3,180 2,905 3,094 1,896 1,498 1,148 23,597
249 DEA VENT0.50% klbs 102 118 150 241 289 335 398 363 387 237 187 144 2,950
250 TOTAL CALC'D LOSSES klbs 918 1,066 1,346 2,170 2,598 3,011 3,578 3,268 3,481 2,133 1,685 1,292 26,547
251252 CONDENSATE RETURN gallons 190,000 1,488,300 2,050,900 3,629,300 4,351,100 4,753,700 5,721,500 5,261,100 5,656,700 3,566,700 3,026,300 2,293,900 41,989,500
253 8.15585 klbs 1,550 12,138 16,727 29,600 35,487 38,770 46,664 42,909 46,135 29,089 24,682 18,709 342,460
254 STEAM MUW 8.3453 klbs 13,717 6,596 4,825 6,169 9,526 11,581 13,969 11,880 12,031 6,447 3,385 2,814 102,940
255256 TOTAL LEAVING PLANT klbs 15,098 18,436 23,175 37,558 46,334 51,589 61,736 56,184 59,993 37,278 29,837 22,855 460,074
257 TOTAL ENTERING PLANT klbs 15,267 18,734 21,552 35,769 45,013 50,351 60,633 54,789 58,166 35,537 28,067 21,522 445,400
258 OVERAGE / SHORTFALL klbs 169 298 -1,623 -1,790 -1,322 -1,237 -1,103 -1,395 -1,827 -1,741 -1,770 -1,332 -14,674
259 1.1% 1.6% -7.0% -4.8% -2.9% -2.4% -1.8% -2.5% -3.0% -4.7% -5.9% -5.8% -3.19%
260 FINAL CONDENSATE RETURN CALCULATIONS
261 RECALC'D TOTAL ENTERING klbs 15,551 18,990 23,870 38,685 47,724 53,136 63,588 57,870 61,793 38,396 30,732 23,540262 RECALC'D COND. RETURN klbs 1,834 12,393 19,045 32,516 38,198 41,555 49,619 45,990 49,762 31,949 27,348 20,727263 gallons 224,876 1,519,575 2,335,132 3,986,874 4,683,565 5,095,155 6,083,810 5,638,844 6,101,406 3,917,283 3,353,121 2,541,341264

Exhibit 1

FILE: NDE FEA Reconciliation FY 12-13
PAGE 1 of 2 PRINTSTAMP: 7/31/2013 4:47 PM
NASHVILLE, TENNESSEEEXHIBIT 1 - CALCULATION DETAIL FOR PLANT PERFORMANCE PER APPENDIX 19
ELECTRICITY-TO-STEAM CONVERSION
(1) E (MainUtility) = total electric use per main utility meters 54,591,752 kWh(2) E (Steam,metered) = metered electric use for steam plant 989,001 kWh
MCC-3 406,475MCC-4 582,526
(3) E (CHW,metered) = metered electric use for chilled water plant 52,109,223 kWhSWGR-2A 8,881,230SWGR-2B 13,631,400SWGR-3A 8,463,700SWGR-3B 9,318,320SWGR-4A 2,533,898SWGR-4B 2,539,096SWGR-5A 2,105,313SWGR-5B 1,508,689MCC-1 1,691,372MCC-2 1,436,205
(4) Esteam,unmetered = un-metered electric use for steam plant = [ (2) / (1) ] x [ (1) - (2) - (3) ] 27,057 kWh *(5) Echw,unmetered = un-metered electric use for chilled water plant = (1) - (2) - (3) - (4) 1,466,471 kWh *(6) Esteam,total = total electric use for steam plant = (2) + (4) 1,016,058 kWh *(7) Customer Steam Sales, metered + unmetered 374,366,126 lbs
n (elec): Actual Steam Plant Electric Conversion = (6) / [ (7) x 0.001 ] = 2.714 kWh/klb
NATURAL GAS-TO-STEAM CONVERSION
(8) NG = Total Natural Gas Use per main utility meters 590,046.0 Dth(9) P = Total Propane Gas per plant meter 0 scft
Meter Reading at the beginning, n-1 12,095Meter Reading at the end, n 12,095Units of Measure 1,000 x SCFT
(10) HHV = Higher Heating Value of Propane 0.002520 Btu/scft(11) SO = Plant Steam Send Out 348,667,000 lbs
Meter Reading at the beginning, n-1 2,995,612Meter Reading at the end, n 3,344,279Units of Measure 1 x SCFT
n (HHV): Actual Plant Efficiency = [ (8) + (9) x (10) ] / [ (11) x 0.001) ] = 1.692 Dth/klb
(12) CR = Condensate Return per plant meter 41,989,500 gallons **Meter Reading at the beginning, n-1 128,182,100Meter Reading at the end, n 161,226,300Units of Measure 1 x SCFT
(13) H = Condensate Return energy 47,039 mmBtuMeter Reading at the beginning, n-1 149,510Meter Reading at the end, n 196,549Units of Measure 1 x MMBTU
T (cr,avg): Average Condensate Return Temperature = 169 °F

FILE: NDE FEA Reconciliation FY 12-13
PAGE 2 of 2 PRINTSTAMP: 7/31/2013 4:47 PM
NASHVILLE, TENNESSEEEXHIBIT 1 - CALCULATION DETAIL FOR PLANT PERFORMANCE PER APPENDIX 19
WATER-TO-STEAM CONVERSION
(14) MW = Steam system makeup water plant meter 12,335,120 gallonsMeter Reading at the beginning, n-1 85,275,280Meter Reading at the end, n 97,610,400Units of Measure 1 x SCFT
n (water): Actual steam plant water use = (14) * 1.01 = 12,458,471 gallons
G (water): Guaranteed steam plant water use = [ (11) / 8.15585 - (12) = 875,197 gallons
ELECTRICITY-TO-CHILLED WATER CONVERSION
(15) E (chw,total) = Total CHW Electric use = (3) + (5) = 53,575,694 kWh *(16) Customer CHW Sales, metered + unmetered 62,537,600 kWh
n (elec): Actual chilled water plant electric conversion = (15) / (16) = 0.857 kw/ton
CONDENSER WATER-TO-CHILLED WATER CONVERSION
(17) CM = Condenser water makeup plant meter 77,265,000 gallons **Meter Reading at the beginning, n-1 850,827,000Meter Reading at the end, n 928,092,000Units of Measure 1 x GALL
n (water): Actual chilled water plant conversion = (17) / (16) = 1.235 gal/ton-hr
NOTES: * - There is a 11,356 kWh variance from the FEA due to rounding errors resulting from monthly vs. annualsummation.
** - Estimated due to incorrect totalization resulting from "low flow cut-off".