Embed Size (px)
Citation preview

World Development Vol. 76, pp. 263–279, 20150305-750X/� 2015 Elsevier Ltd. All rights reserved.
www.elsevier.com/locate/worlddevhttp://dx.doi.org/10.1016/j.worlddev.2015.07.008
Fiscal Policy, Inequality, and the Ethnic Divide in Guatemala
MAYNOR CABRERA a, NORA LUSTIG b and HILCIAS E. MORAN c,*
a FEDES, Guatemalab Tulane University, USA
c ACEF, Guatemala
Summary. — Guatemala is among the most unequal countries in Latin America. It also has the highest incidence of poverty, especiallyfor the indigenous population. In this paper we do a fiscal incidence analysis using the 2009–10 household survey ENIGFAM. The re-sults show that fiscal policy does very little to reduce inequality and poverty overall and along ethnic lines. Persistently low tax revenuesare the main limiting factor. Even worse, tax revenues are not only low but also regressive and burdensome on the poor. Consumptiontaxes are high enough to offset the benefits of cash transfers: poverty after taxes and cash transfers is higher than market income poverty.� 2015 Elsevier Ltd. All rights reserved.
Key words — inequality, poverty, ethnic divide, fiscal incidence, taxes and social spending, Guatemala
* The study for Guatemala is part of the Commitment to Equity (CEQ)
project. Led by Nora Lustig since 2008, the CEQ is a joint initiative of the
Center for Inter-American Policy and the Department of Economics,
Tulane University and the Inter-American Dialogue. The study for
Guatemala has been partially funded by the Gender and Diversity
Division of the Inter-American Development Bank. For their very useful
comments, the authors are grateful to the anonymous reviewers and to the
participants of the conference “Commitment to Equity: Fiscal Policy and
Income Redistribution in Latin America” held at Tulane University,
October 17–18, 2013. Final revision accepted: July 9, 2015.
1. INTRODUCTION
Guatemala is a lower middle-income country with one of themost unequal distributions of income and one of the highestpoverty rates in Latin America. In 2011, while the(unweighted) average Gini coefficient for Latin America was0.487, the Gini for Guatemala was equal to 0.522 (Figure 1).Although over the last two decades poverty has declined, thepace was slow. 1 Moreover, since the mid-2000s, poverty rose:in 2011, the headcount ratio was 40.7%, up from 33.4% in2006. 2 According to UNDP (2014), the Human DevelopmentIndex in 2013 (0.628) was far below the Latin American andCaribbean average (0.74) and only above those of Haiti, Hon-duras, and Nicaragua. Guatemala had the lowest level in theHuman Opportunity Index from a sample of 19 countries inLatin America (De Barros, Ferreira, Molinas, & Saavedra,2009, p. 10). Sahn and Younger (2006) found that Guatemalahad the most unequal distribution of education and health of asample of six Latin American countries.
Poverty and low levels of human development are highlycorrelated with ethnicity: the indigenous population is muchpoorer and has much lower levels of human development thanthe nonindigenous group. With an incidence of poverty of58.6%, an indigenous individual is more than twice as likelyof being poor than a nonindigenous one. 3 Although theindigenous population represents around 40% of the totalpopulation, 60% of the extreme poor are indigenous. 4 PoorGuatemalan families are predominantly indigenous and haveexperienced centuries of exploitation and exclusion, with weakinfluence over local and national decision-making (de Ferrantiet al., 2003). The poverty gap between indigenous and non-indigenous individuals is highly correlated with the disparitiesin educational attainment by ethnicity. 5
The profound ethnic divide was a fundamental cause of along and protracted civil war that plagued Guatemala for36 years. In 1996 – after more than 200,000 deaths and “disap-pearances” and more than half a million displaced individuals– the Guatemalan Peace Accords were signed (Archdiocese ofGuatemala, 1999; Historical Clarification Commission, 1999).The Peace Accords committed the country to raise the taxburden by 50% – that is, to reach 13.2 of GDP – during1996–2002, and to gradually increase the tax burden furthersubsequently. Twenty years later, not even the initial goal
263
has been reached. In spite of the repeated attempts to intro-duce revenue raising tax reforms, the tax burden continuesto be one of the lowest in Latin America. While in LatinAmerica the average tax burden (including social security con-tributions) was around 24.7% in 2013, in Guatemala it wasonly 13.0% (ECLAC, 2015). In particular, personal incometaxes were a meager 0.4% of GDP in Guatemala while theaverage for Latin America equaled 2.5% in 2013.
Fiscal policy in Guatemala has been mainly concerned withmacroeconomic stability: fiscal deficits and public indebted-ness have been relatively and consistently low (about 2.5%of GDP and around 24 of GDP from 2010 to 2014, respec-tively, according to data of Ministry of Finance of Guate-mala). Social equity concerns, however, have fallen betweenthe cracks. While there have been occasional attempts toexpand social spending to benefit the most disadvantagedgroups – i.e., the rural and indigenous population, 6 resourcesdevoted to this end remain low. Social spending (includingcontributory pensions) is around 7.4 of GDP in Guatemala– one of the lowest in Latin America (ECLAC, 2015). Withsuch low levels of social spending and a high reliance on indi-rect taxes, tax-based redistribution in Guatemala is bound tobe limited.
In addition to low revenues, the government faces a series ofrigidities embedded in the Constitution or in its interpretationgiven by the justice system. These constraints make it very dif-ficult to increase social spending or to change its composition(Barreix, Bes, & Roca, 2009, p. 33). According to the Ministryof Finance, in 2014, about 88% of fiscal revenues werepre-committed to specific spending lines such as the public sec-tor wage bill, debt service, municipalities, the justice system,
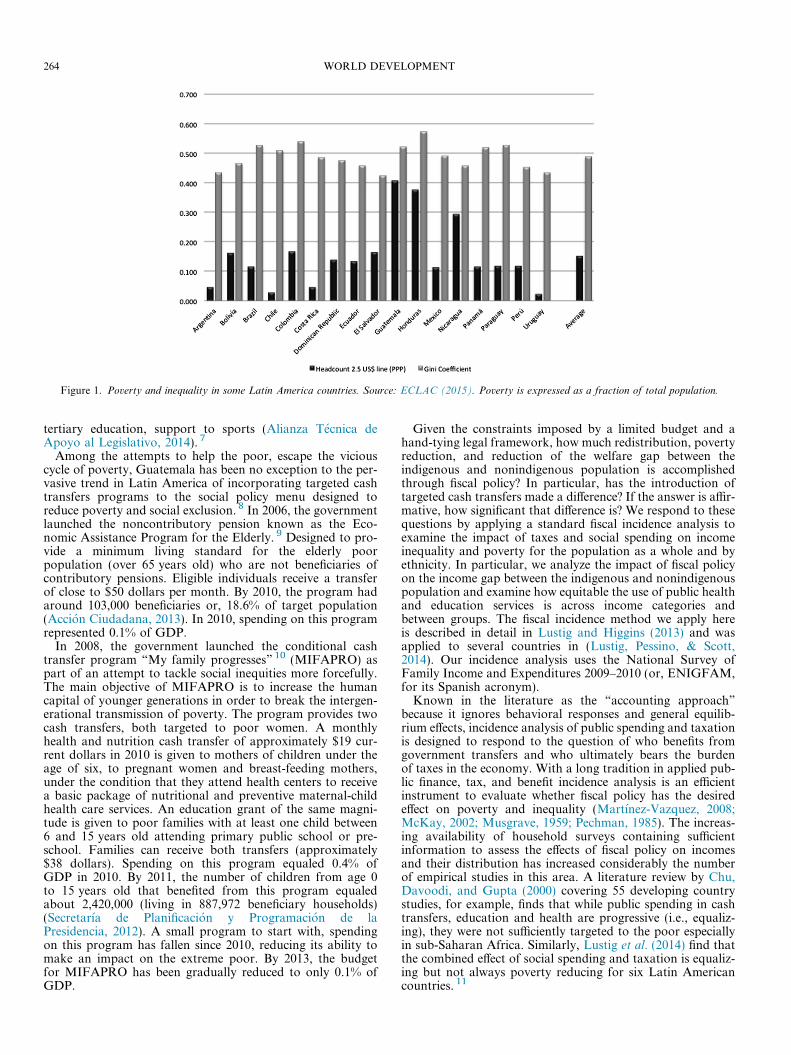
Figure 1. Poverty and inequality in some Latin America countries. Source: ECLAC (2015). Poverty is expressed as a fraction of total population.
264 WORLD DEVELOPMENT
tertiary education, support to sports (Alianza Tecnica deApoyo al Legislativo, 2014). 7
Among the attempts to help the poor, escape the viciouscycle of poverty, Guatemala has been no exception to the per-vasive trend in Latin America of incorporating targeted cashtransfers programs to the social policy menu designed toreduce poverty and social exclusion. 8 In 2006, the governmentlaunched the noncontributory pension known as the Eco-nomic Assistance Program for the Elderly. 9 Designed to pro-vide a minimum living standard for the elderly poorpopulation (over 65 years old) who are not beneficiaries ofcontributory pensions. Eligible individuals receive a transferof close to $50 dollars per month. By 2010, the program hadaround 103,000 beneficiaries or, 18.6% of target population(Accion Ciudadana, 2013). In 2010, spending on this programrepresented 0.1% of GDP.
In 2008, the government launched the conditional cashtransfer program “My family progresses” 10 (MIFAPRO) aspart of an attempt to tackle social inequities more forcefully.The main objective of MIFAPRO is to increase the humancapital of younger generations in order to break the intergen-erational transmission of poverty. The program provides twocash transfers, both targeted to poor women. A monthlyhealth and nutrition cash transfer of approximately $19 cur-rent dollars in 2010 is given to mothers of children under theage of six, to pregnant women and breast-feeding mothers,under the condition that they attend health centers to receivea basic package of nutritional and preventive maternal-childhealth care services. An education grant of the same magni-tude is given to poor families with at least one child between6 and 15 years old attending primary public school or pre-school. Families can receive both transfers (approximately$38 dollars). Spending on this program equaled 0.4% ofGDP in 2010. By 2011, the number of children from age 0to 15 years old that benefited from this program equaledabout 2,420,000 (living in 887,972 beneficiary households)(Secretarıa de Planificacion y Programacion de laPresidencia, 2012). A small program to start with, spendingon this program has fallen since 2010, reducing its ability tomake an impact on the extreme poor. By 2013, the budgetfor MIFAPRO has been gradually reduced to only 0.1% ofGDP.
Given the constraints imposed by a limited budget and ahand-tying legal framework, how much redistribution, povertyreduction, and reduction of the welfare gap between theindigenous and nonindigenous population is accomplishedthrough fiscal policy? In particular, has the introduction oftargeted cash transfers made a difference? If the answer is affir-mative, how significant that difference is? We respond to thesequestions by applying a standard fiscal incidence analysis toexamine the impact of taxes and social spending on incomeinequality and poverty for the population as a whole and byethnicity. In particular, we analyze the impact of fiscal policyon the income gap between the indigenous and nonindigenouspopulation and examine how equitable the use of public healthand education services is across income categories andbetween groups. The fiscal incidence method we apply hereis described in detail in Lustig and Higgins (2013) and wasapplied to several countries in (Lustig, Pessino, & Scott,2014). Our incidence analysis uses the National Survey ofFamily Income and Expenditures 2009–2010 (or, ENIGFAM,for its Spanish acronym).
Known in the literature as the “accounting approach”because it ignores behavioral responses and general equilib-rium effects, incidence analysis of public spending and taxationis designed to respond to the question of who benefits fromgovernment transfers and who ultimately bears the burdenof taxes in the economy. With a long tradition in applied pub-lic finance, tax, and benefit incidence analysis is an efficientinstrument to evaluate whether fiscal policy has the desiredeffect on poverty and inequality (Martınez-Vazquez, 2008;McKay, 2002; Musgrave, 1959; Pechman, 1985). The increas-ing availability of household surveys containing sufficientinformation to assess the effects of fiscal policy on incomesand their distribution has increased considerably the numberof empirical studies in this area. A literature review by Chu,Davoodi, and Gupta (2000) covering 55 developing countrystudies, for example, finds that while public spending in cashtransfers, education and health are progressive (i.e., equaliz-ing), they were not sufficiently targeted to the poor especiallyin sub-Saharan Africa. Similarly, Lustig et al. (2014) find thatthe combined effect of social spending and taxation is equaliz-ing but not always poverty reducing for six Latin Americancountries. 11
FISCAL POLICY, INEQUALITY, AND THE ETHNIC DIVIDE IN GUATEMALA 265
There are a few existing fiscal incidence studies that showresults for Guatemala. These include (in chronological orderby date of publication): Bahl, Wallace, andMartınez-Vazquez (1996), Hicks and Lee (1997), Lindert,Skoufias, and Shapiro (2006), Barreix et al. (2009), andCubero and Hollar (2010). The studies completed prior tothe 2000s are of little relevance for comparison purposes sincethey use information that is dated. In particular, they useinformation that does not incorporate the potential impactof the fiscal and social commitments stemming from the PeaceAccords. Of the three post-Peace Accords studies, Cubero andHollar (2010) rely on secondary sources that could not befound and, hence, we do not review the results here.
Lindert et al. (2006) measure the extent to which spendingon social assistance and social insurance, consumption subsi-dies and spending on education and health favor the poor ineight Latin America and the Caribbean (LAC) countries.For Guatemala, the paper uses the National Survey on LivingConditions (ENCOVI) for 2000. The main findings are as fol-lows. Guatemala is one of the countries with the lowest socialspending in their sample; coverage of social assistance pro-grams greatly favors the poor, but per capita benefits are verylow; coverage and per capita transfers for social insurance arelow overall, with benefits more concentrated in the top quin-tile; and, the combined effect of social assistance and socialinsurance transfers shows that per capita benefits are fairlyuniform across the distribution (i.e., the concentration coeffi-cient is close to zero).
The paper by Barreix et al. (2009) examines the impact offiscal policy (spending and taxation) on inequality. It is basedon a collection of studies for Central America and the Domini-can Republic written by different authors who followed a com-mon methodology. 12 As in the case of Lindert et al. (2006),the source used for the incidence analysis was ENCOVI2000. The incidence analysis covers direct and indirect taxesand spending on education and health on inequality but itdoes not include indirect subsidies. It does not include directcash transfers programs because they were nonexistent in2000. This study finds that fiscal policy, as a whole is equaliz-ing but not pro-poor: i.e., per capita benefits do not decreasewith income. Social spending – comprised mainly of education– is somewhat progressive. The tax system is slightly regres-sive, a result driven by the regressivity of the Value AddedTax. 13
In contrast to previous studies, since our incidence analysisuses the household survey ENIGFAM 2009–10, it incorpo-rates information on the impact after the two cash transfersprograms were put in place. Adding the effect of these targetedsocial programs in the fiscal incidence analysis is importantbecause their combined budget was equal to 0.5% of GDPin 2010, while it was zero pre-2006. Per our results summarizedbelow, these programs appear to have increased the redistribu-tive effect. Their impact, however, is too small to change thedaunting welfare gaps between the indigenous and nonindige-nous groups and the rural and urban population.
Although the data from ENIGFAM were collected in themidst of the global financial crisis (between July 2009 and June2010), total public spending and social spending in particularwere at their peak in 2010. Social spending (cash transfers,health and education without contributory pensions) as ashare of GDP increased from 5.1% in 2008 to 5.5% in 2010.The main cash transfers program (MIFAPRO) launched in2008 reached its peak in 2010 when spending on the programwas around 0.4% of GDP. Thus, we do not think that theonset of the global crisis affected the redistributive capacityof the state in any significant way. On the contrary, the fiscal
incidence results are probably a reflection of Guatemalanredistribution at its peak. More public spending combinedwith the drop of fiscal revenues increased the fiscal deficit dur-ing 2008–10 by almost two percentage points. The higher fiscaldeficit was financed through borrowing and the public debt toGDP ratio increased from 19.9% in 2008 to 24.0% in 2010.These developments curtailed the government’s fiscal spaceand have affected its redistributive capacity in the aftermathof the crisis. For example, spending on the CCT program“My Family Progresses” declined from about $142 milliondollars in 2010 to approximately $50 million dollars in 2013.
The main contribution of this paper is threefold. First, oursis the first comprehensive analysis of the impact of fiscal policyon the distribution of income that incorporates the effect of thetwo targeted cash transfer programs introduced to improvewelfare levels of the most disadvantaged groups – the indige-nous and rural population. Second, this is the first study forGuatemala that measures the impact of fiscal policy not onlyon inequality, but also on poverty. Third, because our analysisdistinguishes individuals by their ethnicity and location, wecan assess the impact of fiscal policy not only on inequalityand poverty overall but its effect on closing the indigenousvs. nonindigenous and rural vs. urban welfare gaps. In partic-ular, we assess the effect of direct taxes, cash transfers, con-sumption taxes and subsidies, and public education andhealth spending on inequality, poverty, and coverage of publicservices in education and health not only for the population asa whole but also for indigenous-nonindigenous and rural–ur-ban groups. Because we use a common methodology (Lustig& Higgins, 2013), we can compare the results for Guatemalawith those of countries with similar income per capita suchas Bolivia (Paz-Arauco et al., 2014) and El Salvador(Beneke, Lustig, & Oliva, 2015). 14
Unsurprisingly, given the small size of the social spendingbudget, we find that the tax and transfer system does littleto reduce inequality and the ethnic and rural–urban divide.The Gini coefficient after direct taxes and cash transfers decli-nes from 0.551 to 0.546, a mere 0.005 points. When the mon-etized value (at government cost) of education and healthservices are incorporated, the decline equals 0.024, still verysmall. The most recent comprehensive fiscal incidence studyon Guatemala by Barreix et al. (2009), however, found a con-siderably smaller reduction in the Gini coefficient: just of .0053points. This seems to indicate that fiscal policy became moreredistributive in 2010 than it was in 2000. The difference isprobably due to two main factors: the introduction of thetwo targeted cash transfers programs mentioned above andthe expansion of education and health services (and theirusage) to the indigenous and rural population. When com-pared to Bolivia and El Salvador, two countries whose incomeper capita is similar to that of Guatemala, the tax and trans-fers system is more redistributive in the first two. 15
Although direct taxes are somewhat progressive, theirimpact is very limited because the share of direct taxes toGDP is painstakingly low. In contrast, consumption taxesare outright regressive and income inequality after direct andconsumption taxes and direct transfers (which we callpost-fiscal income) is the same as market income inequality.Even worse, consumption taxes are so burdensome for thepoor that they more than offset the benefits of thewell-targeted cash transfers. As a result, the post-fiscal head-count ratio is practically the same as market income poverty.The headcount ratio for market income equals 40.3% (with theUS$2.50 ppp international poverty line). With cash transfers(and direct taxes), it declines to 39.1%. However, consumptiontaxes bring the incidence of poverty back to 40.9%.

266 WORLD DEVELOPMENT
The average market income per capita of the nonindigenouspopulation is more than twice as high as that for the indige-nous population. Taxes and transfers do almost nothing tochange this dramatic difference in average living standardsbetween the two ethnic groups. After all taxes and transfersare considered (including the monetized value of educationand health), the ratio of per capita income between nonindige-nous and indigenous individuals decreased from 2.13 to 2.03.While the conditional cash transfers program Mi Familia Pro-gresa is pro-poor and pro-indigenous, the size of the per capitatransfer is too small to make a significant difference. Educa-tion spending is not pro-poor or pro-indigenous enough andhealth spending reaches only a fraction of the poor. Inequalityof opportunity (i.e., inequality due to circumstances such asgender, ethnicity and location) is not reduced at all.
The paper is organized as follows. Section 2 briefly describesthe tax and transfer system. The methodology and data arediscussed in Section 3. Section 4 presents the main results.Conclusions are in Section 5.
2. GUATEMALA: PATTERNS OF GOVERNMENTSPENDING AND TAXATION
Tables 1 and 2 present public spending and tax revenues as ashare of GDP for 2010 – the year of the survey used in ourincidence analysis – and identify which taxes and transfer pro-grams were included in the incidence analysis (column “IA”).Measured by its budget, the size of Guatemala’s government isvery small. 16 In 2010, total primary government spending(excluding interest payments) is only 13.6% of GDP, the low-est in Latin America. 17 The tax burden (including social secu-rity contributions) in the same year is only 12.2%, again it is
Table 1. Guatemala: Government spending
Description
Gross National Income per capita (PPP US$)Total Government Spendingb
Primary Government Spendingc
Social Spending (including contributory pensions)d
Social Spending (w/o contributory pensions)e
Total Cash TransfersCash Transfers (excluding all Pensions)Noncontributory Pensionse
Total In-kind Transfersf
Educationof which tertiary education
HealthContributoryg
NoncontributoryOther Social Spendingf
Contributory PensionsNon-Social Spending
Indirect SubsidiesOther Non-Social Spendingi
Debt Servicing
Source: Ministerio de Finanzas Publicas, Superintendencia de AdministraciSeguridad Social and World Bank.aIn Incidence Analysis; bTotal Government Spending = Primary GovernmGovernment Spending = Social Spending with Contributory Pensions + Non-Cash Transfers + Total In-kind Transfers + Other Social Spending + ContribTransfers + Total In-kind Transfers + Other Social Spending; fOther Social Spthat were not possible identify and included in the analysis.
the lowest in Latin American and the Caribbean (ECLAC,2015). 18
(a) Social spending and subsidies
At 7.4% of GDP, social spending is one of the lowest in theregion. Total social spending includes direct cash transfers: theconditional cash transfer program MIFAPRO, noncontribu-tory pensions and a few other smaller programs. Altogether,direct cash transfers represent around 0.5% of GDP. 19
In-kind transfers include social spending on education andhealth and are equal to 5% of GDP. Contributory pensions(which are not included in social spending) equal 0.5% ofGDP. 20 Other social-spending, non-social spending, and debtservicing represent 1.4%, 6.1% and 1.5% of GDP, respectively.The fiscal incidence results presented here include direct cashtransfers, education, and health which together comprise5.5% of GDP.
(i) Direct transfers (social assistance)Spending on direct cash transfers (also called social assis-
tance) comprehends five main programs (in 2010): a condi-tional cash transfer (CCT) called Mi Familia Progresa(MIFAPRO), a noncontributory pension program called Eco-nomic Assistance Program for the Elderly (Programa deAporte Economico del Adulto Mayor), a food transfer programcalled Bolsa Solidaria, two educational scholarships programcalled Bolsa de estudio and Becas solidarias and a small cashtransfer for transportation called Bono de Transporte. Fromthis list, the most relevant programs are MIFAPRO and thenoncontributory pension. Together they represent 0.5% ofGDP; the rest are very small programs that altogether amountto 0.1% of GDP.
by category (2010) (as a% of GDP)
% of GDP
Total IAa
4,77315.013.67.4 6.06.9 5.50.5 0.50.4 0.40.1 0.15.0 5.02.6 2.60.3 0.32.4 2.41.1 1.11.3 1.31.4 0.00.5 0.54.2 0.30.3 0.33.9 0.01.5 0.0
on Tributaria (SAT), Banco de Guatemala, Instituto Guatemalteco de
ent Spending + Debt Services (interests and amortizations); cPrimarysocial Spending; dSocial Spending (including social contributions) = Totalutory Pensions; eSocial Spending (w/o social contributions) = Total Cashending includes a considerable number of small social assistance programs
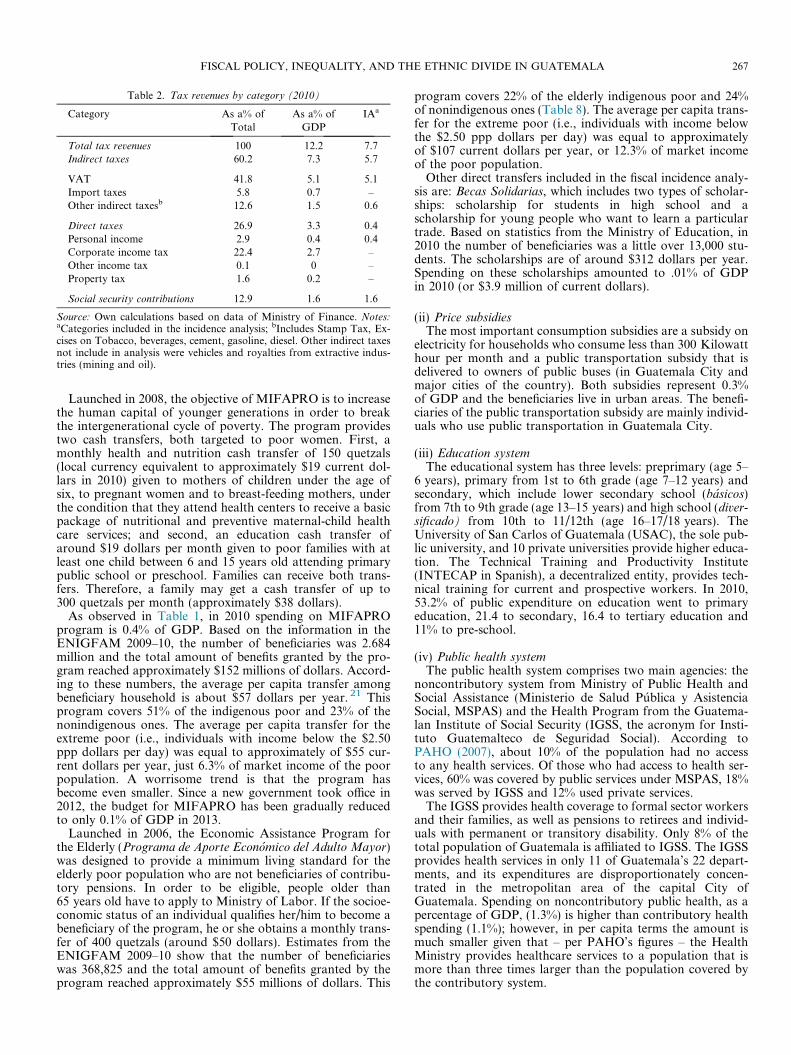
Table 2. Tax revenues by category (2010)
Category As a% of As a% of IAa
Total GDP
Total tax revenues 100 12.2 7.7Indirect taxes 60.2 7.3 5.7
VAT 41.8 5.1 5.1Import taxes 5.8 0.7 –Other indirect taxesb 12.6 1.5 0.6
Direct taxes 26.9 3.3 0.4Personal income 2.9 0.4 0.4Corporate income tax 22.4 2.7 –Other income tax 0.1 0 –Property tax 1.6 0.2 –
Social security contributions 12.9 1.6 1.6
Source: Own calculations based on data of Ministry of Finance. Notes:aCategories included in the incidence analysis; bIncludes Stamp Tax, Ex-cises on Tobacco, beverages, cement, gasoline, diesel. Other indirect taxesnot include in analysis were vehicles and royalties from extractive indus-tries (mining and oil).
FISCAL POLICY, INEQUALITY, AND THE ETHNIC DIVIDE IN GUATEMALA 267
Launched in 2008, the objective of MIFAPRO is to increasethe human capital of younger generations in order to breakthe intergenerational cycle of poverty. The program providestwo cash transfers, both targeted to poor women. First, amonthly health and nutrition cash transfer of 150 quetzals(local currency equivalent to approximately $19 current dol-lars in 2010) given to mothers of children under the age ofsix, to pregnant women and to breast-feeding mothers, underthe condition that they attend health centers to receive a basicpackage of nutritional and preventive maternal-child healthcare services; and second, an education cash transfer ofaround $19 dollars per month given to poor families with atleast one child between 6 and 15 years old attending primarypublic school or preschool. Families can receive both trans-fers. Therefore, a family may get a cash transfer of up to300 quetzals per month (approximately $38 dollars).
As observed in Table 1, in 2010 spending on MIFAPROprogram is 0.4% of GDP. Based on the information in theENIGFAM 2009–10, the number of beneficiaries was 2.684million and the total amount of benefits granted by the pro-gram reached approximately $152 millions of dollars. Accord-ing to these numbers, the average per capita transfer amongbeneficiary household is about $57 dollars per year. 21 Thisprogram covers 51% of the indigenous poor and 23% of thenonindigenous ones. The average per capita transfer for theextreme poor (i.e., individuals with income below the $2.50ppp dollars per day) was equal to approximately of $55 cur-rent dollars per year, just 6.3% of market income of the poorpopulation. A worrisome trend is that the program hasbecome even smaller. Since a new government took office in2012, the budget for MIFAPRO has been gradually reducedto only 0.1% of GDP in 2013.
Launched in 2006, the Economic Assistance Program forthe Elderly (Programa de Aporte Economico del Adulto Mayor)was designed to provide a minimum living standard for theelderly poor population who are not beneficiaries of contribu-tory pensions. In order to be eligible, people older than65 years old have to apply to Ministry of Labor. If the socioe-conomic status of an individual qualifies her/him to become abeneficiary of the program, he or she obtains a monthly trans-fer of 400 quetzals (around $50 dollars). Estimates from theENIGFAM 2009–10 show that the number of beneficiarieswas 368,825 and the total amount of benefits granted by theprogram reached approximately $55 millions of dollars. This
program covers 22% of the elderly indigenous poor and 24%of nonindigenous ones (Table 8). The average per capita trans-fer for the extreme poor (i.e., individuals with income belowthe $2.50 ppp dollars per day) was equal to approximatelyof $107 current dollars per year, or 12.3% of market incomeof the poor population.
Other direct transfers included in the fiscal incidence analy-sis are: Becas Solidarias, which includes two types of scholar-ships: scholarship for students in high school and ascholarship for young people who want to learn a particulartrade. Based on statistics from the Ministry of Education, in2010 the number of beneficiaries was a little over 13,000 stu-dents. The scholarships are of around $312 dollars per year.Spending on these scholarships amounted to .01% of GDPin 2010 (or $3.9 million of current dollars).
(ii) Price subsidiesThe most important consumption subsidies are a subsidy on
electricity for households who consume less than 300 Kilowatthour per month and a public transportation subsidy that isdelivered to owners of public buses (in Guatemala City andmajor cities of the country). Both subsidies represent 0.3%of GDP and the beneficiaries live in urban areas. The benefi-ciaries of the public transportation subsidy are mainly individ-uals who use public transportation in Guatemala City.
(iii) Education systemThe educational system has three levels: preprimary (age 5–
6 years), primary from 1st to 6th grade (age 7–12 years) andsecondary, which include lower secondary school (basicos)from 7th to 9th grade (age 13–15 years) and high school (diver-sificado) from 10th to 11/12th (age 16–17/18 years). TheUniversity of San Carlos of Guatemala (USAC), the sole pub-lic university, and 10 private universities provide higher educa-tion. The Technical Training and Productivity Institute(INTECAP in Spanish), a decentralized entity, provides tech-nical training for current and prospective workers. In 2010,53.2% of public expenditure on education went to primaryeducation, 21.4 to secondary, 16.4 to tertiary education and11% to pre-school.
(iv) Public health systemThe public health system comprises two main agencies: the
noncontributory system from Ministry of Public Health andSocial Assistance (Ministerio de Salud Publica y AsistenciaSocial, MSPAS) and the Health Program from the Guatema-lan Institute of Social Security (IGSS, the acronym for Insti-tuto Guatemalteco de Seguridad Social). According toPAHO (2007), about 10% of the population had no accessto any health services. Of those who had access to health ser-vices, 60% was covered by public services under MSPAS, 18%was served by IGSS and 12% used private services.
The IGSS provides health coverage to formal sector workersand their families, as well as pensions to retirees and individ-uals with permanent or transitory disability. Only 8% of thetotal population of Guatemala is affiliated to IGSS. The IGSSprovides health services in only 11 of Guatemala’s 22 depart-ments, and its expenditures are disproportionately concen-trated in the metropolitan area of the capital City ofGuatemala. Spending on noncontributory public health, as apercentage of GDP, (1.3%) is higher than contributory healthspending (1.1%); however, in per capita terms the amount ismuch smaller given that – per PAHO’s figures – the HealthMinistry provides healthcare services to a population that ismore than three times larger than the population covered bythe contributory system.

268 WORLD DEVELOPMENT
(v) Social security systemThe social security system comprises the majority of social
insurance programs in Guatemala, most of which are admin-istered by the Guatemalan Institute of Social Security (IGSS).The social security system under the IGSS includes two pro-grams: a health, maternity, and accidents insurance programcalled Sickness, Maternity and Accidents (or, EMA, the acro-nym for Enfermedad, Maternidad y Accidentes) and a pensionprogram for Disability, Old Age and Alimony (or, IVS, theacronym for Invalidez, Vejez y Sobrevivencia). As the socialsecurity system is based on contributions from formal employ-ees and employers, the majority of its affiliates are formalworkers. By 2011, approximately 25% of the economicallyactive population was a member of the social security system.
The public sector pension system (IGSS) is organized on apay-as-you-go basis. The contribution rates to the pensionprogram (IVS) are 1.83% from employees and 3.67% fromemployers. The contributions to the health program (EMA)are 3% from employees and 7% from employers. Overall, pub-lic and private institutions must contribute to the system at thesame contribution rates, but the government has not fulfilledall its liabilities for a long time. 22 However, revenues are stillabove expenditures and hence, the system is not (at least notyet) subsidized by general revenues from other sources. Thus,the system was assumed to be “actuarially fair” on averageand contributory pensions were treated as deferred incomerather than a transfer (and contributions to old age pensionsas mandatory savings and not a tax).
(b) Taxes
In spite of the efforts made by successive governments tointroduce revenue-raising tax reforms since the Peace Accordswere signed in 1996, one of the structural features of the Gua-temalan tax system is the low level of tax revenues. The taxstructure for 2010, the year of the survey is shown in Table 2.Total tax revenue as a percentage of GDP (including contribu-tions to the social security system) is only 12.2%. Direct taxescomprised almost 27% of the total, while indirect taxes littleover 60%. Of total direct taxes, personal income tax is only2.9%. 23 The VAT is over 40% of total tax revenues. TheVAT general rate is 12% and zero for exports. Generic medici-nes, certain financial services, education, low value sales offood bought in cantonal and municipal markets (value lessthan 100 quetzals, approximately $13 dollars) and resale ofreal estate property are exempt. Other indirect taxes, whichinclude excise taxes on consumption of gasoline and diesel,beverages, tobacco, stamp tax, and cement, amount to12.6% of total tax revenues.
3. METHODOLOGY, DATA AND ASSUMPTIONS
(a) Methodology
We estimate the impact of taxes and transfers on inequalityand poverty by using fiscal incidence analysis. As described inLustig and Higgins (2013), fiscal incidence analysis consists ofallocating taxes and government spending to households sothat one can compare incomes before taxes and transfers withincomes after taxes and transfers, where the latter may includethe monetized value of free public services. The most commonfiscal incidence analysis examines what is paid and receivedwithout assessing the behavioral responses that taxes and pub-lic spending may trigger. This is often referred to as theaccounting approach. Although not modeled, behavioral
responses can be taken into account by imbedding them inthe assumptions of who bear the burden of a tax or receivethe benefit of a transfer. Put simply, the accounting approachconsists of starting from a pre-fiscal income and, depending onthe fiscal intervention under study, allocating the properamount of a tax or a transfer to each household or individual.If the fiscal intervention is a direct tax (transfer) and one startsthe analysis from pre-tax (pre-transfer) income, the post-tax(post-transfer) income is calculated by subtracting (adding)the tax paid (transfer received).
More formally, let us define the before taxes and transfersincome of unit h as Ih, and net taxes of type i as Ti. Let usdefine the “allocator” of tax i to unit h as Sih (or the shareof net tax i borne by unit h).
Then, post-tax income of unit h, Yh, can be defined as:
Y h ¼ Ih �X
i
T iSih ð1Þ
Although the theory is quite straightforward, its applicationcan be fraught with complications. Most of the complicationsarise because actual incidence can be quite different fromstatutory incidence due to tax evasion or tax shifting and thedata to calculate the actual incidence is incomplete or absent(Lustig & Higgins, 2013).
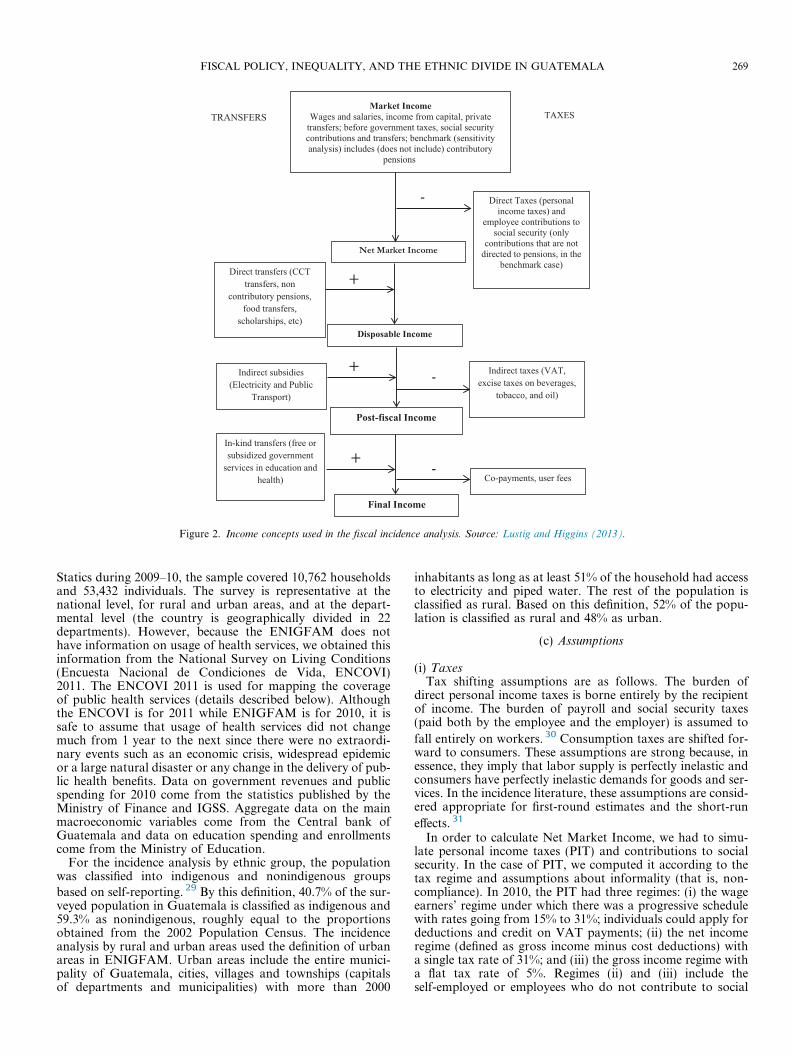
Following this approach, we constructed five income con-cepts that allow us to trace the incidence of the various taxes,transfers and subsidies: market, net market, disposable,post-fiscal, and final income (Figure 2). 24
Market income 25 is total current income before directtaxes, 26 equal to the sum of gross (pre-tax) wages and salariesin the formal and informal sectors (also known as earnedincome); income from capital (dividends, interest, profits,rents, etc.) in the formal and informal sectors (excludes capitalgains and gifts); auto consumption; imputed rent forowner-occupied housing; and, private transfers (remittancesand other private transfers such as alimony). In the fiscal inci-dence literature, pensions from contributory systems havebeen sometimes treated as part of market income and othertimes as government transfers. Arguments exist both for treat-ing contributory pensions as part of market income becausethey are deferred income, see Lustig and Higgins (2013) forreferences on both sides. Since this is an unresolved issue, inour study we defined a benchmark case in which contributorypensions are part of market income. We also performed a sen-sitivity analysis where pensions are classified under govern-ment transfers. We present results for both.
Net market income equals market income minus direct per-sonal income taxes on all income sources (included in marketincome) that are subject to taxation and all contributions tosocial security except for the portion going toward pensions. 27
Disposable income is equal to the sum of net market incomeplus direct government transfers (mainly cash transfers butcan include food transfers). Post-fiscal income is defined as dis-posable income plus indirect subsidies minus indirect taxes(e.g., value added tax, sales tax, etc.). Final income is definedas post-fiscal income plus the monetized value of governmentin-kind transfers in the form of free or subsidized services inprimarily education and health minus co-payments or userfees. 28
(b) Data
The income concepts are constructed using the 2009–10National Survey of Family Income and Expenditures (or,ENIGFAM, an acronym for Encuesta Nacional de Ingresosy Gastos Familiares). Collected by the National Institute of
Market Income Wages and salaries, income from capital, private
transfers; before government taxes, social security contributions and transfers; benchmark (sensitivity analysis) includes (does not include) contributory
pensions
TAXESTRANSFERS
Net Market Income
- Direct Taxes (personal income taxes) and
employee contributions to social security (only
contributions that are not directed to pensions, in the
benchmark case)
Disposable Income
Post-fiscal Income
Final Income
Direct transfers (CCT transfers, non
contributory pensions, food transfers,
scholarships, etc)
Indirect subsidies (Electricity and Public
Transport)
In-kind transfers (free or subsidized government
services in education and health)
+
+
+
Co-payments, user fees
Indirect taxes (VAT, excise taxes on beverages,
tobacco, and oil)
-
-
Figure 2. Income concepts used in the fiscal incidence analysis. Source: Lustig and Higgins (2013).
FISCAL POLICY, INEQUALITY, AND THE ETHNIC DIVIDE IN GUATEMALA 269
Statics during 2009–10, the sample covered 10,762 householdsand 53,432 individuals. The survey is representative at thenational level, for rural and urban areas, and at the depart-mental level (the country is geographically divided in 22departments). However, because the ENIGFAM does nothave information on usage of health services, we obtained thisinformation from the National Survey on Living Conditions(Encuesta Nacional de Condiciones de Vida, ENCOVI)2011. The ENCOVI 2011 is used for mapping the coverageof public health services (details described below). Althoughthe ENCOVI is for 2011 while ENIGFAM is for 2010, it issafe to assume that usage of health services did not changemuch from 1 year to the next since there were no extraordi-nary events such as an economic crisis, widespread epidemicor a large natural disaster or any change in the delivery of pub-lic health benefits. Data on government revenues and publicspending for 2010 come from the statistics published by theMinistry of Finance and IGSS. Aggregate data on the mainmacroeconomic variables come from the Central bank ofGuatemala and data on education spending and enrollmentscome from the Ministry of Education.
For the incidence analysis by ethnic group, the populationwas classified into indigenous and nonindigenous groupsbased on self-reporting. 29 By this definition, 40.7% of the sur-veyed population in Guatemala is classified as indigenous and59.3% as nonindigenous, roughly equal to the proportionsobtained from the 2002 Population Census. The incidenceanalysis by rural and urban areas used the definition of urbanareas in ENIGFAM. Urban areas include the entire munici-pality of Guatemala, cities, villages and townships (capitalsof departments and municipalities) with more than 2000
inhabitants as long as at least 51% of the household had accessto electricity and piped water. The rest of the population isclassified as rural. Based on this definition, 52% of the popu-lation is classified as rural and 48% as urban.
(c) Assumptions
(i) TaxesTax shifting assumptions are as follows. The burden of
direct personal income taxes is borne entirely by the recipientof income. The burden of payroll and social security taxes(paid both by the employee and the employer) is assumed to
fall entirely on workers. 30 Consumption taxes are shifted for-ward to consumers. These assumptions are strong because, inessence, they imply that labor supply is perfectly inelastic andconsumers have perfectly inelastic demands for goods and ser-vices. In the incidence literature, these assumptions are consid-ered appropriate for first-round estimates and the short-run
effects. 31
In order to calculate Net Market Income, we had to simu-late personal income taxes (PIT) and contributions to socialsecurity. In the case of PIT, we computed it according to thetax regime and assumptions about informality (that is, non-compliance). In 2010, the PIT had three regimes: (i) the wageearners’ regime under which there was a progressive schedulewith rates going from 15% to 31%; individuals could apply fordeductions and credit on VAT payments; (ii) the net incomeregime (defined as gross income minus cost deductions) witha single tax rate of 31%; and (iii) the gross income regime witha flat tax rate of 5%. Regimes (ii) and (iii) include theself-employed or employees who do not contribute to social
270 WORLD DEVELOPMENT
security (that is, those who work under “quasi-informal” con-ditions). 32 Based on the information in the survey, we identifyindividuals who belong to each regime and simulate taxes paidbased on but introducing some assumptions regarding infor-mality. In the case of wage earners, we assume that employeesand self-employed in firms with less than 10 workers do notpay PIT, unless they contributed to the social security sys-tem. 33 Also, we assumed that neither agricultural workershired on a daily basis (jornaleros) nor those underemployed(individuals who reported working less than 40 h per week)pay PIT.
In the case of social security contributions, we identify theindividuals who contribute to the social security systemdirectly from the survey and estimate the value of their contri-bution by applying the statutory rate to their labor income. 34
Estimates of employee contributions to social security wereobtained by simulation based on reported income in thehousehold survey and contributions established by Law.
In the case of the VAT, we calculated how much each house-hold paid by multiplying expenditures by the statutory rate. Ofcourse, we assume that goods that are exempt by law do notpay this tax. 35 We also assume that goods that more likelyto be sold in informal markets like unprocessed food (meat,vegetables, fruits, tortillas) in rural areas and in some smallstores in urban areas (e.g., community markets, street vendorsand local groceries) and some private services (i.e., gardeningand house repair) do not pay VAT. 36
Other indirect taxes included in the fiscal incidence analysisare excise taxes on tobacco, alcoholic beverages, nonalcoholicbeverages, petroleum derivatives, cement and stamps tax. Theincidence of excise taxes on tobacco, alcoholic and nonalco-holic beverages, and petroleum derivatives was calculated byapplying the statutory rate on the consumption of these goodsas they appear in the 2010 ENIGFAM. Fiscal stamps wereimputed to households who spent on legal services. The exciseon cement was allocated to households based on how muchthey spent on construction of new dwellings or refurbishingof existing one. As with VAT, we assumed that the burdenof excise taxes was shifted forward to consumers.
(ii) TransfersThe amount of direct transfers received by each household
from Mi Familia Progresa, non-contributory pensions, trans-portation and scholarships programs are directly reported inthe household survey. In-kind education benefits are equalto the average spending per student by level (pre-school, pri-mary, lower secondary, upper secondary, and tertiary), whichis obtained from data on government spending from the Min-istry of Finance and enrollment data from the administrativerecords of the Ministry of Education. 37 To estimate in-kindhealth benefits, first we split the public health services intotwo categories: health services provided by social securityfacilities and health services provided by public health facili-ties. In the first case, we divide the total expenditure in healthof the social security institute by the number of affiliates thatwere reported in the survey and then, we allocate this amountto each individual who lives in households that reported beingpart of the contributory health system. 38 In the second case,we estimate the in-kind benefits of health expenditure of theMinistry of Health in outpatient services and hospital servicesby using as a secondary source the 2011 ENCOVI survey. Toimpute the results from the 2011 ENCOVI survey, we calcu-late the average benefit for 20 income groups in each of theeight administrative regions of the country by residence (urbanor rural) and ethnic group (indigenous/nonindigenous). Thesevalues were imputed to equivalent population groups in the
ENIGFAM. With this method, we are able to distinguishbetween households who are beneficiaries of the contributoryhealth system, households who receive benefits from the non-contributory health system and households who do not receiveany health services from the public system (although we can-not distinguish which of the latter used private services or sim-ply did not need to use healthcare services).
We use imputation method to obtain the residential electric-ity subsidy and the urban transport subsidy. By using theprices of electricity in 2010 and the household electricityspending reported in the survey, we estimate the consumptionof kilowatt per hour and calculate the implicit subsidy. Theurban transport subsidy is imputed using the householdspending on public transportation as reported in the survey(only for the metropolitan area of Guatemala City – i.e., theDepartment of Guatemala).
In the fiscal incidence literature, pensions from contributorysystems have been sometimes treated as part of market incomeand other times as government transfers. Arguments existboth for treating contributory pensions as part of marketincome because they are deferred income, see Lustig andHiggins (2013) for references on both sides. Since this is anunresolved issue, in our study we defined a benchmark casein which contributory pensions are part of market incomeand contributions to the old-age component of the social secu-rity system are treated as mandatory savings. We also per-formed a sensitivity analysis where pensions are classifiedunder government transfers and contributions are treated asany other direct tax. We present results for both scenarios in
the discussion of results. 39
4. MAIN RESULTS
(a) Income inequality and poverty
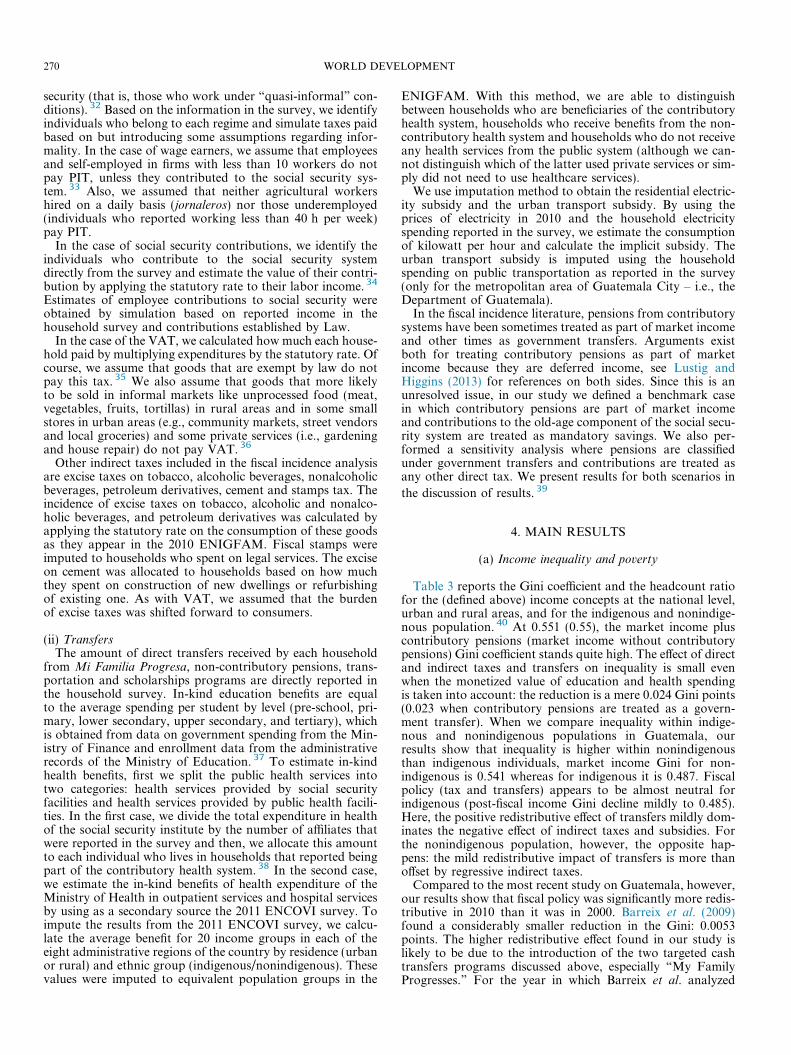
Table 3 reports the Gini coefficient and the headcount ratiofor the (defined above) income concepts at the national level,urban and rural areas, and for the indigenous and nonindige-nous population. 40 At 0.551 (0.55), the market income pluscontributory pensions (market income without contributorypensions) Gini coefficient stands quite high. The effect of directand indirect taxes and transfers on inequality is small evenwhen the monetized value of education and health spendingis taken into account: the reduction is a mere 0.024 Gini points(0.023 when contributory pensions are treated as a govern-ment transfer). When we compare inequality within indige-nous and nonindigenous populations in Guatemala, ourresults show that inequality is higher within nonindigenousthan indigenous individuals, market income Gini for non-indigenous is 0.541 whereas for indigenous it is 0.487. Fiscalpolicy (tax and transfers) appears to be almost neutral forindigenous (post-fiscal income Gini decline mildly to 0.485).Here, the positive redistributive effect of transfers mildly dom-inates the negative effect of indirect taxes and subsidies. Forthe nonindigenous population, however, the opposite hap-pens: the mild redistributive impact of transfers is more thanoffset by regressive indirect taxes.
Compared to the most recent study on Guatemala, however,our results show that fiscal policy was significantly more redis-tributive in 2010 than it was in 2000. Barreix et al. (2009)found a considerably smaller reduction in the Gini: 0.0053points. The higher redistributive effect found in our study islikely to be due to the introduction of the two targeted cashtransfers programs discussed above, especially “My FamilyProgresses.” For the year in which Barreix et al. analyzed
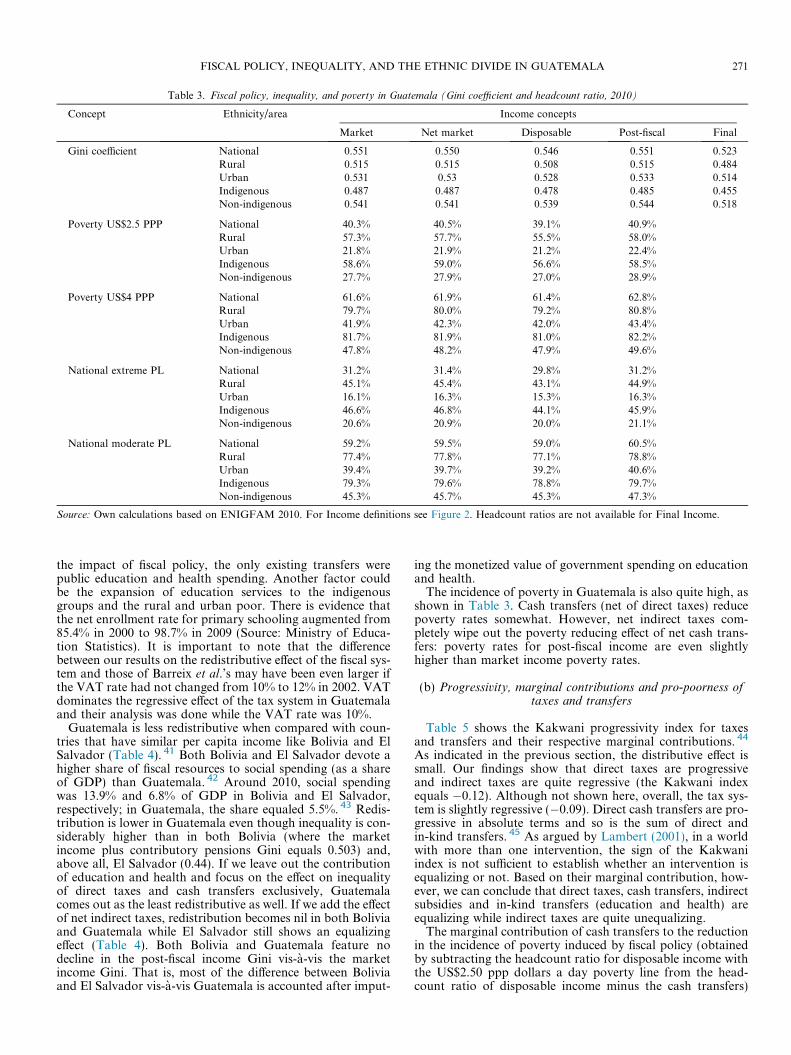
Table 3. Fiscal policy, inequality, and poverty in Guatemala (Gini coefficient and headcount ratio, 2010)
Concept Ethnicity/area Income concepts
Market Net market Disposable Post-fiscal Final
Gini coefficient National 0.551 0.550 0.546 0.551 0.523Rural 0.515 0.515 0.508 0.515 0.484Urban 0.531 0.53 0.528 0.533 0.514Indigenous 0.487 0.487 0.478 0.485 0.455Non-indigenous 0.541 0.541 0.539 0.544 0.518
Poverty US$2.5 PPP National 40.3% 40.5% 39.1% 40.9%Rural 57.3% 57.7% 55.5% 58.0%Urban 21.8% 21.9% 21.2% 22.4%Indigenous 58.6% 59.0% 56.6% 58.5%Non-indigenous 27.7% 27.9% 27.0% 28.9%
Poverty US$4 PPP National 61.6% 61.9% 61.4% 62.8%Rural 79.7% 80.0% 79.2% 80.8%Urban 41.9% 42.3% 42.0% 43.4%Indigenous 81.7% 81.9% 81.0% 82.2%Non-indigenous 47.8% 48.2% 47.9% 49.6%
National extreme PL National 31.2% 31.4% 29.8% 31.2%Rural 45.1% 45.4% 43.1% 44.9%Urban 16.1% 16.3% 15.3% 16.3%Indigenous 46.6% 46.8% 44.1% 45.9%Non-indigenous 20.6% 20.9% 20.0% 21.1%
National moderate PL National 59.2% 59.5% 59.0% 60.5%Rural 77.4% 77.8% 77.1% 78.8%Urban 39.4% 39.7% 39.2% 40.6%Indigenous 79.3% 79.6% 78.8% 79.7%Non-indigenous 45.3% 45.7% 45.3% 47.3%
Source: Own calculations based on ENIGFAM 2010. For Income definitions see Figure 2. Headcount ratios are not available for Final Income.
FISCAL POLICY, INEQUALITY, AND THE ETHNIC DIVIDE IN GUATEMALA 271
the impact of fiscal policy, the only existing transfers werepublic education and health spending. Another factor couldbe the expansion of education services to the indigenousgroups and the rural and urban poor. There is evidence thatthe net enrollment rate for primary schooling augmented from85.4% in 2000 to 98.7% in 2009 (Source: Ministry of Educa-tion Statistics). It is important to note that the differencebetween our results on the redistributive effect of the fiscal sys-tem and those of Barreix et al.’s may have been even larger ifthe VAT rate had not changed from 10% to 12% in 2002. VATdominates the regressive effect of the tax system in Guatemalaand their analysis was done while the VAT rate was 10%.
Guatemala is less redistributive when compared with coun-tries that have similar per capita income like Bolivia and ElSalvador (Table 4). 41 Both Bolivia and El Salvador devote ahigher share of fiscal resources to social spending (as a shareof GDP) than Guatemala. 42 Around 2010, social spendingwas 13.9% and 6.8% of GDP in Bolivia and El Salvador,respectively; in Guatemala, the share equaled 5.5%. 43 Redis-tribution is lower in Guatemala even though inequality is con-siderably higher than in both Bolivia (where the marketincome plus contributory pensions Gini equals 0.503) and,above all, El Salvador (0.44). If we leave out the contributionof education and health and focus on the effect on inequalityof direct taxes and cash transfers exclusively, Guatemalacomes out as the least redistributive as well. If we add the effectof net indirect taxes, redistribution becomes nil in both Boliviaand Guatemala while El Salvador still shows an equalizingeffect (Table 4). Both Bolivia and Guatemala feature nodecline in the post-fiscal income Gini vis-a-vis the marketincome Gini. That is, most of the difference between Boliviaand El Salvador vis-a-vis Guatemala is accounted after imput-
ing the monetized value of government spending on educationand health.
The incidence of poverty in Guatemala is also quite high, asshown in Table 3. Cash transfers (net of direct taxes) reducepoverty rates somewhat. However, net indirect taxes com-pletely wipe out the poverty reducing effect of net cash trans-fers: poverty rates for post-fiscal income are even slightlyhigher than market income poverty rates.
(b) Progressivity, marginal contributions and pro-poorness oftaxes and transfers
Table 5 shows the Kakwani progressivity index for taxesand transfers and their respective marginal contributions. 44
As indicated in the previous section, the distributive effect issmall. Our findings show that direct taxes are progressiveand indirect taxes are quite regressive (the Kakwani indexequals �0.12). Although not shown here, overall, the tax sys-tem is slightly regressive (�0.09). Direct cash transfers are pro-gressive in absolute terms and so is the sum of direct andin-kind transfers. 45 As argued by Lambert (2001), in a worldwith more than one intervention, the sign of the Kakwaniindex is not sufficient to establish whether an intervention isequalizing or not. Based on their marginal contribution, how-ever, we can conclude that direct taxes, cash transfers, indirectsubsidies and in-kind transfers (education and health) areequalizing while indirect taxes are quite unequalizing.
The marginal contribution of cash transfers to the reductionin the incidence of poverty induced by fiscal policy (obtainedby subtracting the headcount ratio for disposable income withthe US$2.50 ppp dollars a day poverty line from the head-count ratio of disposable income minus the cash transfers)
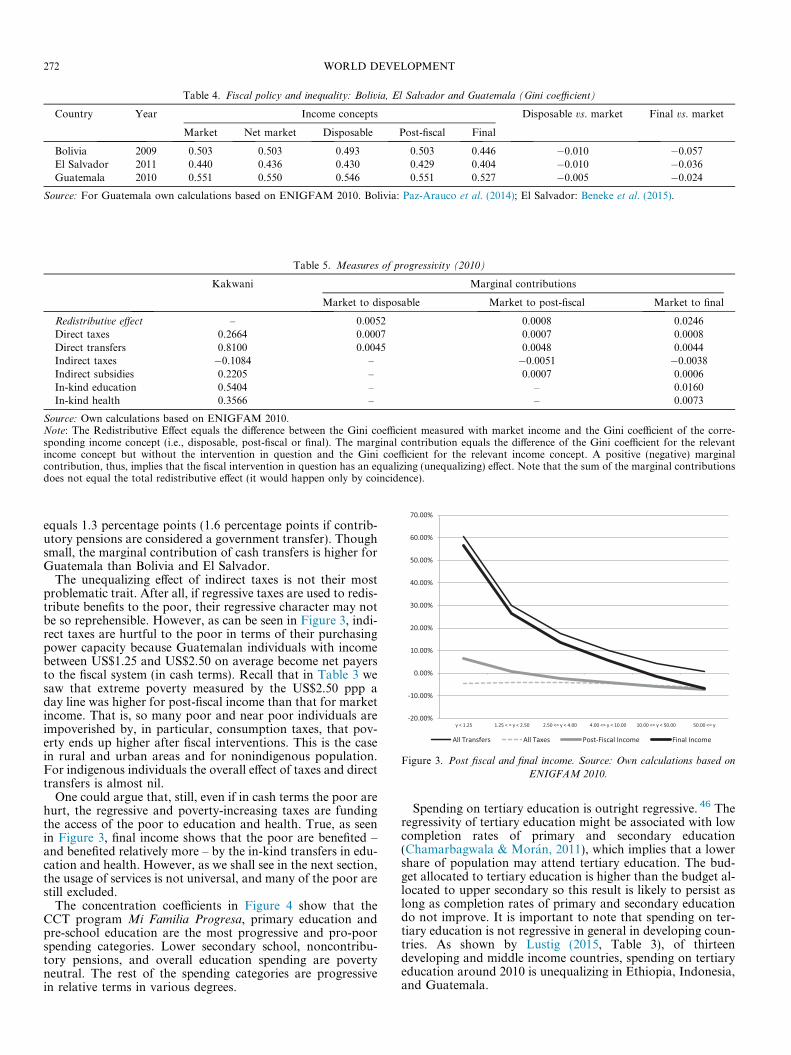
Table 4. Fiscal policy and inequality: Bolivia, El Salvador and Guatemala (Gini coefficient)
Country Year Income concepts Disposable vs. market Final vs. market
Market Net market Disposable Post-fiscal Final
Bolivia 2009 0.503 0.503 0.493 0.503 0.446 �0.010 �0.057El Salvador 2011 0.440 0.436 0.430 0.429 0.404 �0.010 �0.036Guatemala 2010 0.551 0.550 0.546 0.551 0.527 �0.005 �0.024
Source: For Guatemala own calculations based on ENIGFAM 2010. Bolivia: Paz-Arauco et al. (2014); El Salvador: Beneke et al. (2015).
Table 5. Measures of progressivity (2010)
Kakwani Marginal contributions
Market to disposable Market to post-fiscal Market to final
Redistributive effect – 0.0052 0.0008 0.0246Direct taxes 0.2664 0.0007 0.0007 0.0008Direct transfers 0.8100 0.0045 0.0048 0.0044Indirect taxes �0.1084 – �0.0051 �0.0038Indirect subsidies 0.2205 – 0.0007 0.0006In-kind education 0.5404 – – 0.0160In-kind health 0.3566 – – 0.0073
Source: Own calculations based on ENIGFAM 2010.Note: The Redistributive Effect equals the difference between the Gini coefficient measured with market income and the Gini coefficient of the corre-sponding income concept (i.e., disposable, post-fiscal or final). The marginal contribution equals the difference of the Gini coefficient for the relevantincome concept but without the intervention in question and the Gini coefficient for the relevant income concept. A positive (negative) marginalcontribution, thus, implies that the fiscal intervention in question has an equalizing (unequalizing) effect. Note that the sum of the marginal contributionsdoes not equal the total redistributive effect (it would happen only by coincidence).
-20.00%
-10.00%
0.00%
10.00%
20.00%
30.00%
40.00%
50.00%
60.00%
70.00%
y < 1.25 1.25 < = y < 2.50 2.50 <= y < 4.00 4.00 <= y < 10.00 10.00 <= y < 50.00 50.00 <= y
All Transfers All Taxes Post-Fiscal Income Final Income
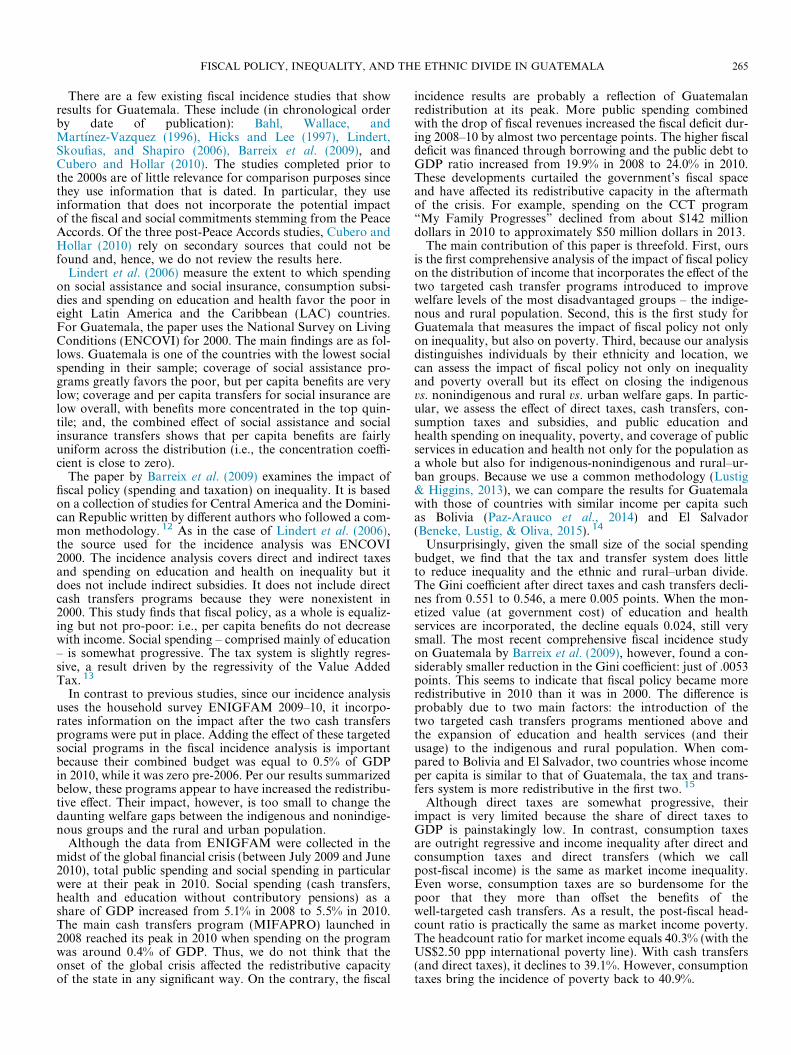
Figure 3. Post fiscal and final income. Source: Own calculations based on
ENIGFAM 2010.
272 WORLD DEVELOPMENT
equals 1.3 percentage points (1.6 percentage points if contrib-utory pensions are considered a government transfer). Thoughsmall, the marginal contribution of cash transfers is higher forGuatemala than Bolivia and El Salvador.
The unequalizing effect of indirect taxes is not their mostproblematic trait. After all, if regressive taxes are used to redis-tribute benefits to the poor, their regressive character may notbe so reprehensible. However, as can be seen in Figure 3, indi-rect taxes are hurtful to the poor in terms of their purchasingpower capacity because Guatemalan individuals with incomebetween US$1.25 and US$2.50 on average become net payersto the fiscal system (in cash terms). Recall that in Table 3 wesaw that extreme poverty measured by the US$2.50 ppp aday line was higher for post-fiscal income than that for marketincome. That is, so many poor and near poor individuals areimpoverished by, in particular, consumption taxes, that pov-erty ends up higher after fiscal interventions. This is the casein rural and urban areas and for nonindigenous population.For indigenous individuals the overall effect of taxes and directtransfers is almost nil.
One could argue that, still, even if in cash terms the poor arehurt, the regressive and poverty-increasing taxes are fundingthe access of the poor to education and health. True, as seenin Figure 3, final income shows that the poor are benefited –and benefited relatively more – by the in-kind transfers in edu-cation and health. However, as we shall see in the next section,the usage of services is not universal, and many of the poor arestill excluded.
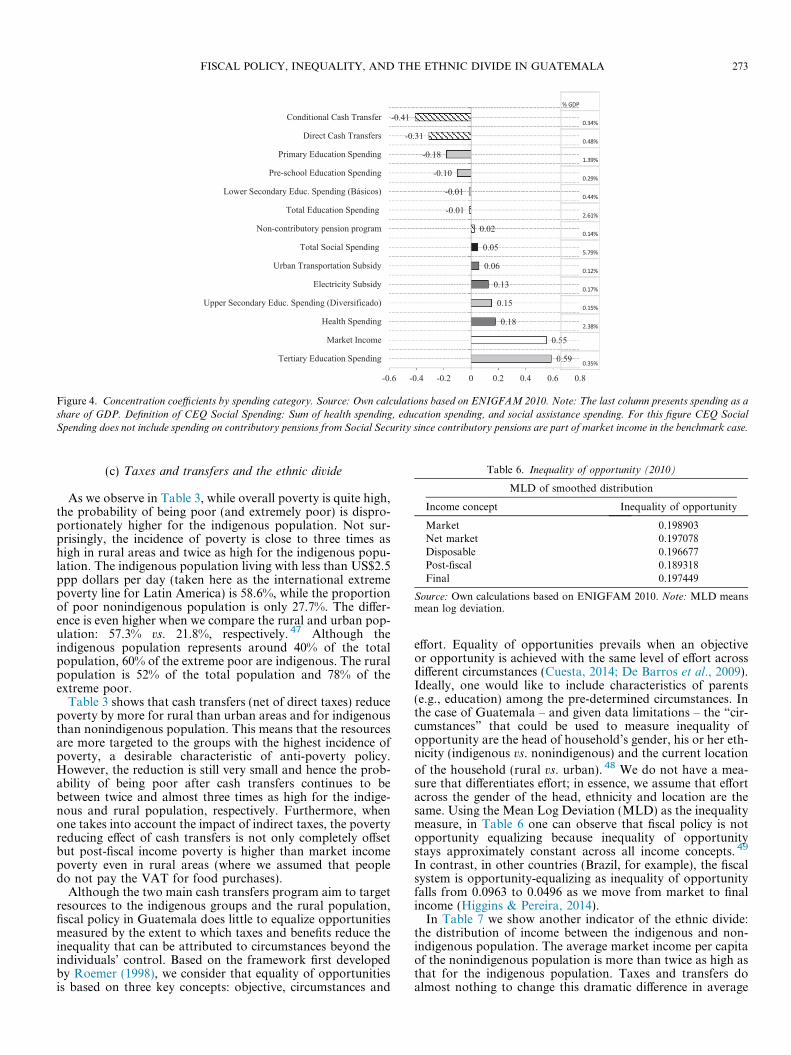
The concentration coefficients in Figure 4 show that theCCT program Mi Familia Progresa, primary education andpre-school education are the most progressive and pro-poorspending categories. Lower secondary school, noncontribu-tory pensions, and overall education spending are povertyneutral. The rest of the spending categories are progressivein relative terms in various degrees.
Spending on tertiary education is outright regressive. 46 Theregressivity of tertiary education might be associated with lowcompletion rates of primary and secondary education(Chamarbagwala & Moran, 2011), which implies that a lowershare of population may attend tertiary education. The bud-get allocated to tertiary education is higher than the budget al-located to upper secondary so this result is likely to persist aslong as completion rates of primary and secondary educationdo not improve. It is important to note that spending on ter-tiary education is not regressive in general in developing coun-tries. As shown by Lustig (2015, Table 3), of thirteendeveloping and middle income countries, spending on tertiaryeducation around 2010 is unequalizing in Ethiopia, Indonesia,and Guatemala.
0.59
0.55
0.18
0.15
0.13
0.06
0.05
0.02
-0.01
-0.01
-0.10
-0.18
-0.31
-0.41
-0.6 -0.4 -0.2 0 0.2 0.4 0.6 0.8
Tertiary Education Spending
Market Income
Health Spending
Upper Secondary Educ. Spending (Diversificado)
Electricity Subsidy
Urban Transportation Subsidy
Total Social Spending
Non-contributory pension program
Total Education Spending
Lower Secondary Educ. Spending (Básicos)
Pre-school Education Spending
Primary Education Spending
Direct Cash Transfers
Conditional Cash Transfer% GDP
0.34%
0.48%
1.39%
0.29%
0.44%
2.61%
0.14%
5.79%
0.12%
0.17%
0.15%
2.38%
0.00%
0.35%
Figure 4. Concentration coefficients by spending category. Source: Own calculations based on ENIGFAM 2010. Note: The last column presents spending as a
share of GDP. Definition of CEQ Social Spending: Sum of health spending, education spending, and social assistance spending. For this figure CEQ Social
Spending does not include spending on contributory pensions from Social Security since contributory pensions are part of market income in the benchmark case.
Table 6. Inequality of opportunity (2010)
MLD of smoothed distribution
Income concept Inequality of opportunity
Market 0.198903Net market 0.197078Disposable 0.196677Post-fiscal 0.189318Final 0.197449
Source: Own calculations based on ENIGFAM 2010. Note: MLD meansmean log deviation.
FISCAL POLICY, INEQUALITY, AND THE ETHNIC DIVIDE IN GUATEMALA 273
(c) Taxes and transfers and the ethnic divide
As we observe in Table 3, while overall poverty is quite high,the probability of being poor (and extremely poor) is dispro-portionately higher for the indigenous population. Not sur-prisingly, the incidence of poverty is close to three times ashigh in rural areas and twice as high for the indigenous popu-lation. The indigenous population living with less than US$2.5ppp dollars per day (taken here as the international extremepoverty line for Latin America) is 58.6%, while the proportionof poor nonindigenous population is only 27.7%. The differ-ence is even higher when we compare the rural and urban pop-ulation: 57.3% vs. 21.8%, respectively. 47 Although theindigenous population represents around 40% of the totalpopulation, 60% of the extreme poor are indigenous. The ruralpopulation is 52% of the total population and 78% of theextreme poor.
Table 3 shows that cash transfers (net of direct taxes) reducepoverty by more for rural than urban areas and for indigenousthan nonindigenous population. This means that the resourcesare more targeted to the groups with the highest incidence ofpoverty, a desirable characteristic of anti-poverty policy.However, the reduction is still very small and hence the prob-ability of being poor after cash transfers continues to bebetween twice and almost three times as high for the indige-nous and rural population, respectively. Furthermore, whenone takes into account the impact of indirect taxes, the povertyreducing effect of cash transfers is not only completely offsetbut post-fiscal income poverty is higher than market incomepoverty even in rural areas (where we assumed that peopledo not pay the VAT for food purchases).
Although the two main cash transfers program aim to targetresources to the indigenous groups and the rural population,fiscal policy in Guatemala does little to equalize opportunitiesmeasured by the extent to which taxes and benefits reduce theinequality that can be attributed to circumstances beyond theindividuals’ control. Based on the framework first developedby Roemer (1998), we consider that equality of opportunitiesis based on three key concepts: objective, circumstances and
effort. Equality of opportunities prevails when an objectiveor opportunity is achieved with the same level of effort acrossdifferent circumstances (Cuesta, 2014; De Barros et al., 2009).Ideally, one would like to include characteristics of parents(e.g., education) among the pre-determined circumstances. Inthe case of Guatemala – and given data limitations – the “cir-cumstances” that could be used to measure inequality ofopportunity are the head of household’s gender, his or her eth-nicity (indigenous vs. nonindigenous) and the current location
of the household (rural vs. urban). 48 We do not have a mea-sure that differentiates effort; in essence, we assume that effortacross the gender of the head, ethnicity and location are thesame. Using the Mean Log Deviation (MLD) as the inequalitymeasure, in Table 6 one can observe that fiscal policy is notopportunity equalizing because inequality of opportunitystays approximately constant across all income concepts. 49
In contrast, in other countries (Brazil, for example), the fiscalsystem is opportunity-equalizing as inequality of opportunityfalls from 0.0963 to 0.0496 as we move from market to finalincome (Higgins & Pereira, 2014).
In Table 7 we show another indicator of the ethnic divide:the distribution of income between the indigenous and non-indigenous population. The average market income per capitaof the nonindigenous population is more than twice as high asthat for the indigenous population. Taxes and transfers doalmost nothing to change this dramatic difference in average
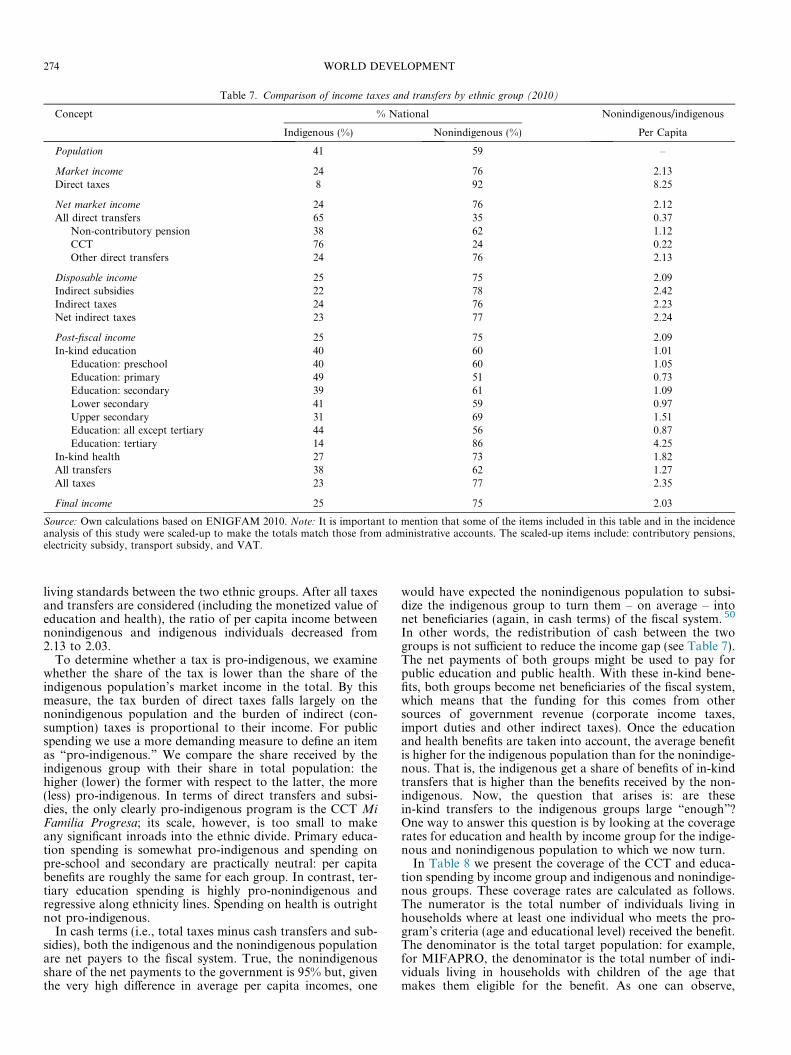
Table 7. Comparison of income taxes and transfers by ethnic group (2010)
Concept % National Nonindigenous/indigenous
Indigenous (%) Nonindigenous (%) Per Capita
Population 41 59 –
Market income 24 76 2.13Direct taxes 8 92 8.25
Net market income 24 76 2.12All direct transfers 65 35 0.37
Non-contributory pension 38 62 1.12CCT 76 24 0.22Other direct transfers 24 76 2.13
Disposable income 25 75 2.09Indirect subsidies 22 78 2.42Indirect taxes 24 76 2.23Net indirect taxes 23 77 2.24
Post-fiscal income 25 75 2.09In-kind education 40 60 1.01
Education: preschool 40 60 1.05Education: primary 49 51 0.73Education: secondary 39 61 1.09Lower secondary 41 59 0.97Upper secondary 31 69 1.51Education: all except tertiary 44 56 0.87Education: tertiary 14 86 4.25
In-kind health 27 73 1.82All transfers 38 62 1.27All taxes 23 77 2.35
Final income 25 75 2.03
Source: Own calculations based on ENIGFAM 2010. Note: It is important to mention that some of the items included in this table and in the incidenceanalysis of this study were scaled-up to make the totals match those from administrative accounts. The scaled-up items include: contributory pensions,electricity subsidy, transport subsidy, and VAT.
274 WORLD DEVELOPMENT
living standards between the two ethnic groups. After all taxesand transfers are considered (including the monetized value ofeducation and health), the ratio of per capita income betweennonindigenous and indigenous individuals decreased from2.13 to 2.03.
To determine whether a tax is pro-indigenous, we examinewhether the share of the tax is lower than the share of theindigenous population’s market income in the total. By thismeasure, the tax burden of direct taxes falls largely on thenonindigenous population and the burden of indirect (con-sumption) taxes is proportional to their income. For publicspending we use a more demanding measure to define an itemas “pro-indigenous.” We compare the share received by theindigenous group with their share in total population: thehigher (lower) the former with respect to the latter, the more(less) pro-indigenous. In terms of direct transfers and subsi-dies, the only clearly pro-indigenous program is the CCT MiFamilia Progresa; its scale, however, is too small to makeany significant inroads into the ethnic divide. Primary educa-tion spending is somewhat pro-indigenous and spending onpre-school and secondary are practically neutral: per capitabenefits are roughly the same for each group. In contrast, ter-tiary education spending is highly pro-nonindigenous andregressive along ethnicity lines. Spending on health is outrightnot pro-indigenous.
In cash terms (i.e., total taxes minus cash transfers and sub-sidies), both the indigenous and the nonindigenous populationare net payers to the fiscal system. True, the nonindigenousshare of the net payments to the government is 95% but, giventhe very high difference in average per capita incomes, one
would have expected the nonindigenous population to subsi-dize the indigenous group to turn them – on average – intonet beneficiaries (again, in cash terms) of the fiscal system. 50
In other words, the redistribution of cash between the twogroups is not sufficient to reduce the income gap (see Table 7).The net payments of both groups might be used to pay forpublic education and public health. With these in-kind bene-fits, both groups become net beneficiaries of the fiscal system,which means that the funding for this comes from othersources of government revenue (corporate income taxes,import duties and other indirect taxes). Once the educationand health benefits are taken into account, the average benefitis higher for the indigenous population than for the nonindige-nous. That is, the indigenous get a share of benefits of in-kindtransfers that is higher than the benefits received by the non-indigenous. Now, the question that arises is: are thesein-kind transfers to the indigenous groups large “enough”?One way to answer this question is by looking at the coveragerates for education and health by income group for the indige-nous and nonindigenous population to which we now turn.
In Table 8 we present the coverage of the CCT and educa-tion spending by income group and indigenous and nonindige-nous groups. These coverage rates are calculated as follows.The numerator is the total number of individuals living inhouseholds where at least one individual who meets the pro-gram’s criteria (age and educational level) received the benefit.The denominator is the total target population: for example,for MIFAPRO, the denominator is the total number of indi-viduals living in households with children of the age thatmakes them eligible for the benefit. As one can observe,
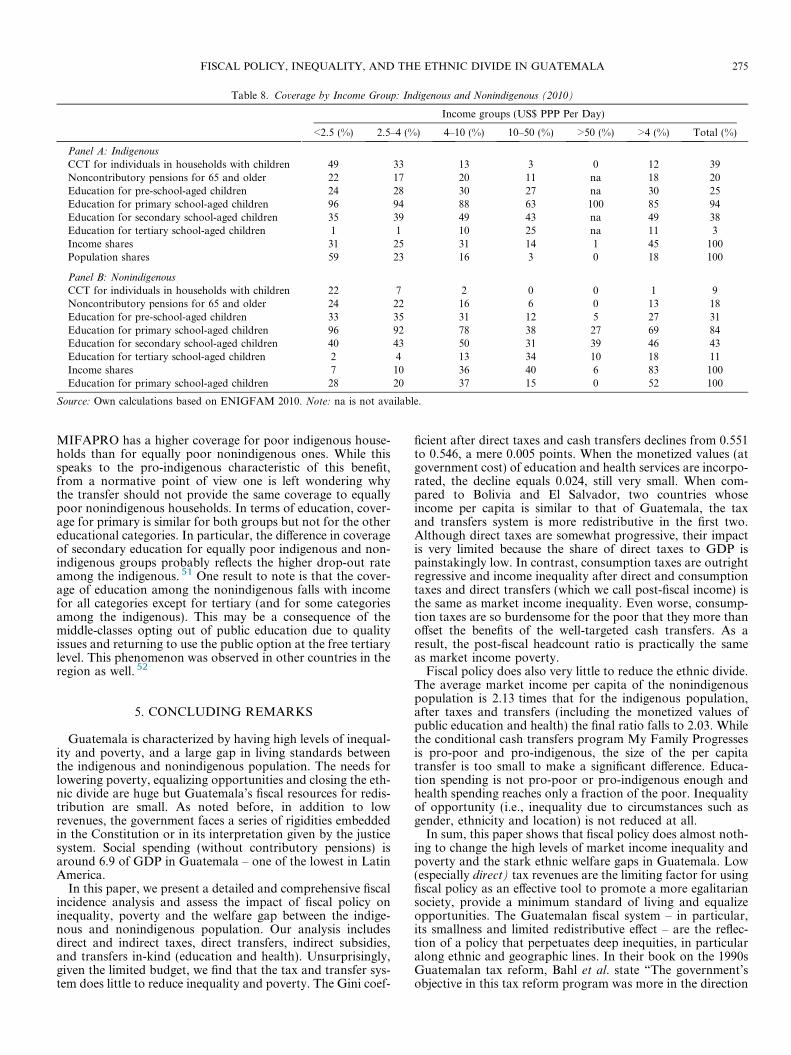
Table 8. Coverage by Income Group: Indigenous and Nonindigenous (2010)
Income groups (US$ PPP Per Day)
<2.5 (%) 2.5–4 (%) 4–10 (%) 10–50 (%) >50 (%) >4 (%) Total (%)
Panel A: Indigenous
CCT for individuals in households with children 49 33 13 3 0 12 39Noncontributory pensions for 65 and older 22 17 20 11 na 18 20Education for pre-school-aged children 24 28 30 27 na 30 25Education for primary school-aged children 96 94 88 63 100 85 94Education for secondary school-aged children 35 39 49 43 na 49 38Education for tertiary school-aged children 1 1 10 25 na 11 3Income shares 31 25 31 14 1 45 100Population shares 59 23 16 3 0 18 100
Panel B: Nonindigenous
CCT for individuals in households with children 22 7 2 0 0 1 9Noncontributory pensions for 65 and older 24 22 16 6 0 13 18Education for pre-school-aged children 33 35 31 12 5 27 31Education for primary school-aged children 96 92 78 38 27 69 84Education for secondary school-aged children 40 43 50 31 39 46 43Education for tertiary school-aged children 2 4 13 34 10 18 11Income shares 7 10 36 40 6 83 100Education for primary school-aged children 28 20 37 15 0 52 100
Source: Own calculations based on ENIGFAM 2010. Note: na is not available.
FISCAL POLICY, INEQUALITY, AND THE ETHNIC DIVIDE IN GUATEMALA 275
MIFAPRO has a higher coverage for poor indigenous house-holds than for equally poor nonindigenous ones. While thisspeaks to the pro-indigenous characteristic of this benefit,from a normative point of view one is left wondering whythe transfer should not provide the same coverage to equallypoor nonindigenous households. In terms of education, cover-age for primary is similar for both groups but not for the othereducational categories. In particular, the difference in coverageof secondary education for equally poor indigenous and non-indigenous groups probably reflects the higher drop-out rateamong the indigenous. 51 One result to note is that the cover-age of education among the nonindigenous falls with incomefor all categories except for tertiary (and for some categoriesamong the indigenous). This may be a consequence of themiddle-classes opting out of public education due to qualityissues and returning to use the public option at the free tertiarylevel. This phenomenon was observed in other countries in theregion as well. 52
5. CONCLUDING REMARKS
Guatemala is characterized by having high levels of inequal-ity and poverty, and a large gap in living standards betweenthe indigenous and nonindigenous population. The needs forlowering poverty, equalizing opportunities and closing the eth-nic divide are huge but Guatemala’s fiscal resources for redis-tribution are small. As noted before, in addition to lowrevenues, the government faces a series of rigidities embeddedin the Constitution or in its interpretation given by the justicesystem. Social spending (without contributory pensions) isaround 6.9 of GDP in Guatemala – one of the lowest in LatinAmerica.
In this paper, we present a detailed and comprehensive fiscalincidence analysis and assess the impact of fiscal policy oninequality, poverty and the welfare gap between the indige-nous and nonindigenous population. Our analysis includesdirect and indirect taxes, direct transfers, indirect subsidies,and transfers in-kind (education and health). Unsurprisingly,given the limited budget, we find that the tax and transfer sys-tem does little to reduce inequality and poverty. The Gini coef-
ficient after direct taxes and cash transfers declines from 0.551to 0.546, a mere 0.005 points. When the monetized values (atgovernment cost) of education and health services are incorpo-rated, the decline equals 0.024, still very small. When com-pared to Bolivia and El Salvador, two countries whoseincome per capita is similar to that of Guatemala, the taxand transfers system is more redistributive in the first two.Although direct taxes are somewhat progressive, their impactis very limited because the share of direct taxes to GDP ispainstakingly low. In contrast, consumption taxes are outrightregressive and income inequality after direct and consumptiontaxes and direct transfers (which we call post-fiscal income) isthe same as market income inequality. Even worse, consump-tion taxes are so burdensome for the poor that they more thanoffset the benefits of the well-targeted cash transfers. As aresult, the post-fiscal headcount ratio is practically the sameas market income poverty.
Fiscal policy does also very little to reduce the ethnic divide.The average market income per capita of the nonindigenouspopulation is 2.13 times that for the indigenous population,after taxes and transfers (including the monetized values ofpublic education and health) the final ratio falls to 2.03. Whilethe conditional cash transfers program My Family Progressesis pro-poor and pro-indigenous, the size of the per capitatransfer is too small to make a significant difference. Educa-tion spending is not pro-poor or pro-indigenous enough andhealth spending reaches only a fraction of the poor. Inequalityof opportunity (i.e., inequality due to circumstances such asgender, ethnicity and location) is not reduced at all.
In sum, this paper shows that fiscal policy does almost noth-ing to change the high levels of market income inequality andpoverty and the stark ethnic welfare gaps in Guatemala. Low(especially direct) tax revenues are the limiting factor for usingfiscal policy as an effective tool to promote a more egalitariansociety, provide a minimum standard of living and equalizeopportunities. The Guatemalan fiscal system – in particular,its smallness and limited redistributive effect – are the reflec-tion of a policy that perpetuates deep inequities, in particularalong ethnic and geographic lines. In their book on the 1990sGuatemalan tax reform, Bahl et al. state “The government’sobjective in this tax reform program was more in the direction
276 WORLD DEVELOPMENT
of investment enhancement and job creation than in establish-ing a large direct fiscal transfer of income to the poor. The neteffect of the tax system changes was consistent with this objec-tive” (Bahl et al., 1996, p. 142). Twenty years later, and judg-ing by the results discussed in this paper, the objective seems tohave remained unchanged. Guatemala is a textbook case ofthe power of elites to block pro-poor tax reforms. 53
Perhaps the one and only encouraging sign is that fiscal pol-icy became more redistributive in 2010 than it was in 2000. A
reduction of the Gini coefficient equal to .024 looks much bet-ter than the .0053 reduction found by Barreix et al. (2009). Theimprovement is probably due to two main factors: the intro-duction of the targeted cash transfers programs My FamilyProgresses and Economic Assistance Program for the Elderlyand the expansion of education and health services to theindigenous and rural population. In light of the cuts to the tar-geted cash transfers programs since 2010, this improvement inthe redistributive effect is likely to have been short-lived.
NOTES
1. Clearly, one of the key factors for the slow progress in reducingpoverty has been low economic growth: for the last 20 years, GDP percapita grew at an average of only 1% per year. Among the potential causesbehind this poor performance, low levels of investment in physical capitaland basic infrastructure and high levels of social conflict and crime standout. Guatemala ranks 142nd and 144th out of 144 countries in terms ofcosts of crime and organized crime, respectively (World EconomicForum’s Global Competitiveness Index Report 2014–2015).
2. Measured with the international poverty line of US$2.5 in purchasingpower parity per day. Guatemala’s data reported by CEDLAS and WorldBank (2015) are generated with the National Survey on Living Conditions(Encuesta Nacional de Condiciones de Vida, ENCOVI) 2011 while datafor this article are calculated with the National Survey of Family Incomeand Expenditures 2009–10 (ENIGFAM). This explains the difference inthe results. Measured with market income (i.e., before taxes andgovernment transfers), the Gini coefficient in our study equals 0.551 andthe incidence of extreme poverty 40.3% (for the US$2.50 ppp per dayinternational poverty line).
3. The incidence of poverty for the nonindigenous group is equal to27.7% (see Table 3, US$2.50 ppp per day international poverty line).
4. According to the 2002 National Population Census, more than 40% ofthe population is indigenous, a figure that is practically the same as thatobtained from the household survey used in this paper.
5. Whereas in 2002 the average years of schooling and educationalattainment (high school level) for nonindigenous were 5.39 and 0.19, thenumbers for indigenous groups were 2.24 and 0.04, respectively(Chamarbagwala & Moran, 2011). For an overview of welfare levels ofindigenous populations in Latin America including Guatemala, see Halland Patrinos (2012).
6. For example, the government of president Alvaro Colom (2008–11)created the Council of Social Cohesion and established several socialprograms such as “My family progresses” (MIFAPRO).
7. The Constitution has also been used to block revenue raising reforms:for example, the attempt to increase the VAT paid on alcoholic beverageswas struck down after the Constitutional Court declared the increase wasunconstitutional (see Fernandez & Naveda, 2011).
8. Throughout Latin America, conditional cash transfers (CCTs) andnoncontributory (or social) pensions have become quite generalized. Levyand Schady (2013) argue that the expansion of targeted cash transfers hasbeen driven by three main factors: first, the emergence of more democraticregimes in the 1990s renewed political pressures to respond tounacceptable levels of poverty and inequality; second, greatermacroeconomic stability facilitated growth, providing fiscal revenues toincrease spending; and third, a recognition that traditional socialprograms had had only limited success. The authors argue that in the
presence of high informal labor markets, contributory social insurancehad failed to protect the majority of households from risks. High-incomeinequality meant that higher income groups captured the bulk of pricesubsidies. To address these two fundamental limitations of social policy,most of Latin American governments replaced general price subsidies bytargeted cash transfer programs of two main kinds: conditional cashtransfer programs such Progresa in Mexico and noncontributory pensionprograms such Previdencia Rural in Brazil. As discussed by Lustig,Lopez-Calva, and Ortiz-Juarez (2013), more progressive governmenttransfers are one of the two key determinants behind the observedinequality decline (the other factor being the fall in the skills premium).
9. In Spanish, Programa de Aporte Economico del Adulto Mayor.
10. In Spanish, Mi Familia Progresa.
11. See special issue of Public Finance Review. Specifically, see Lustiget al. (2014) for an overview, Lustig and Pessino (2014) for Argentina,Paz-Arauco, Gray-Molina, Jimenez-Pozo, and Yanez-Aguilar (2014) forBolivia, Higgins and Pereira (2014) for Brazil, Scott (2014) for Mexico,Jaramillo (2014) for Peru, and Bucheli, Lustig, Rossi, and Amabile (2014)for Uruguay. A study by Devarajan and Hossain (1998) evaluates thecombined effect of taxes and government expenditure in the Philippines;the authors find that the combined effect of taxation and spending isprogressive.
12. For Guatemala’s analysis, the Central American Institute preparedtwo background studies for Fiscal Studies (ICEFI).
13. Cubero and Hollar (2010) base their analysis on secondary sources,so we decided not to review it here.
14. The common methodology is described in Lustig and Higgins (2013).
15. Our incidence analysis uses two scenarios. In the benchmarkscenario, contributory pensions are treated as part of market income(assuming they are part of an actuarially fair system). A sensitivity analysisis done with contributory pensions included with the rest of governmenttransfers. Qualitatively, the results with pensions as a transfer remainbroadly the same.
16. The fiscal data used in this study correspond to central governmentplus Social Security. Data on local governments include transfers fromCentral Government to Municipalities (in 2010 close to 45% of totalexpenditure of local governments, according to Ministry of Finance).Official Government Financial Statistics of Guatemala only coveredCentral Government.
17. For the share of primary spending in other countries in similar years,see Commitment to Equity/CEQ Standard Indicators (http://www.com-mitmentoequity.org/indicators.php). In countries like Brazil and Argen-

FISCAL POLICY, INEQUALITY, AND THE ETHNIC DIVIDE IN GUATEMALA 277
tina, which have the highest government expenditure, the primarygovernment expenditure reaches more than 40% of GDP (Lustig et al.,2014).
18. The difference between taxes and government expenditure is mostlyfinanced with domestic and external debt. According to the data publishedby Ministry of Finance, fiscal deficit of Central Government in 2010represented 3.3% of GDP.
19. Total cash transfers include other direct transfers, which are almostcero as a share of GDP.
20. Results with pensions included among the cash transfers are availableupon request.
21. Official data state that in 2011 the number of beneficiary householdswas equal to 887,972 and the population covered by the program wasroughly equal to 4.8 million (or, about a third of Guatemala’s totalpopulation of 14.7 million in 2011), of which about 2.42 million werechildren aged 0–15 years old (Secretarıa de Planificacion y Programacionde la Presidencia, 2012). Thus, the survey-based totals are different fromtotals in administrative records. Given the lack of transparency andreliability of administrative records, we decided to use the numbersrecorded in the survey.
22. Actually, the financial situation of the social security system isprecarious because the government has not paid its dues for more than10 years. According to a press release published in the newspaper SigloXXI on December 30th 2012, the debt accumulated by the governmentamounted $2.7 billion dollars by October 31st, 2012. This amount isequivalent to 6.5% of the 2012 GDP.
23. Import taxes (tariffs) have been reduced in recent years due to tradeliberalization. The Guatemala’s trade regime is essentially an open one.The average tariff fell from 21.7% in 1990 to 5.9% in 2007 (Barreix et al.,2009).
24. A detailed description of how each income concept was constructedfor Guatemala (that is, which method was used to allocate each tax andspending category) is available upon request.
25. Market income is sometimes also called primary income.
26. Taxes include all social security contributions except those forold-age pensions in the benchmark analysis and all social securitycontributions in the sensitivity analysis.
27. Since here we are treating contributory pensions as part of marketincome, the portion of the contributions to social security going towardpensions is treated as “saving”.
28. One may also include participation costs such as transportation costsor foregone incomes because of use of time in obtaining benefits. In ourstudy, they were not included.
29. The surveys ask the question: “To which indigenous group do youbelong? 1. K’iche’; 2. Q’eqchi’; 3. Kaqchikel; 4. Mam; 5. Q’anjob’;. . . 29.Nonindigenous; and 30. Foreigner.”
30. Since our incidence analysis starts with the reported labor marketincome before taxes and transfers, if employers transfer the burden of thiscontribution to the workers, this is captured implicitly as a lower marketlabor income received by employees. We do not include, however, anincidence analysis of the contributions paid by the employers and born bythe employees in the form of lower wages.
31. Some authors take a stronger view. For example, Martınez-Vazquez(2008, p. 123) argues that “the results obtained with more realistic andlaborious assumptions on elasticities tend to yield quite similar results”.
32. In some cases firms might belong to the formal sector, but someemployees may be hired under gross personal income tax regime. Hence,they are not covered by social security and other labor benefits received byregular employees.
33. It was necessary to make additional assumptions because inGuatemala some formal workers or independent high-skilled workerswho fall under the flat income tax regime do not pay social securitycontributions. In our incidence analysis we do assume that theseindividuals pay personal income tax.
34. Contributions by employees are 4.83% of wage income: 2.0% is forpensions and 2.83% for contributory health system.
35. The VAT rate is 12%; exempted goods of this tax are those goodsbought in cantonal markets (value less than $12.5 dollars), genericmedicines and education fees.
36. There are no published official estimates on evasion of VAT and PITfor the recent period. Pecho Trigueros, Pelaez Longinotti, and SanchezVecorena (2012) estimate that VAT evasion during 2001–10 was 34.2%.Our own estimate is around 37%. Thus, we think that our assumptionsabout tax evasion are reasonable.
37. Spending on education includes administrative and capital expendi-tures.
38. The method followed to compute the value of benefits for contrib-utory health services (known as “insurance value”) may underestimate thesize of the benefit received by individuals who actually use the healthservices provided by the contributory health system. This is because afraction of individuals who contribute to social security system notnecessarily use that health system. In some cases, when the individual hasprivate health insurance, they would rather to use private health services.At this way, the effect on final income is a lower bound for thoseindividuals that effectively use the contributive health services.
39. Although they are not shown in the tables and graphs, additionalresults for the case in which pensions are a transfer are available uponrequest.
40. Here we report the Gini coefficient and the headcount ratios. Othermeasures (such as the Theil index and quantile ratios; poverty gap andsquared poverty gap ratios, and, poverty measures for different povertylines) are available upon request.
41. Data for Bolivia are from Paz-Arauco et al. (2014)and for ElSalvador from Beneke et al. (2015). According to the World Bank WorldDevelopment Indicators, GNI per capita was US$3,919 ppp per year inBolivia (2009) and US$3,618 ppp in El Salvador (2011).
42. Lindert (2004) argues that one of the main drivers of tax-basedredistribution (measured by the share of GDP devoted to social spending)is the level of development measured by per capita income. The other twoare democratization and demographic structure. Determining the weightof each factor in explaining the differences across these three countries isbeyond this paper’s scope.
43. Social spending plus contributory pensions as a share of GDParound 2010 equaled 17.9% (Bolivia), 10.3% (El Salvador) and 7.4%(Guatemala).
278 WORLD DEVELOPMENT
44. The Kakwani index of tax (transfer) progressivity is twice the areabetween the market income Lorenz curve and the tax (transfer) concen-tration curve. If the tax (transfer) concentration curve is below (above) theLorenz curve, the Kakwani index will be positive, which indicates thattaxes (transfers) are progressive. If the tax (transfer) concentration curve isabove (below) the Lorenz curve, the Kakwani index will be negative,which indicates that taxes (transfers) are regressive.
45. Transfers are defined as progressive in absolute terms when the percapita benefit declines with income. Transfers that are progressive inabsolute terms are called “pro-poor” (Davoodi, Tiongson, &Asawanuchit, 2010). Transfers are defined as progressive in relativeterms when the benefit as a proportion of market income declines withincome (note that in this case the per capita benefit increases with income).When the per capita benefit is the same for everybody – a special case of atransfer that is progressive in relative terms – it is often called “povertyneutral.” Transfers are defined as regressive when the benefit as aproportion of market income increases with income.
46. This is a very general result in the literature on social public spendingincidence on inequality. Among others, see Barreix et al. (2009), Chu et al.(2000), Lindert et al. (2006).
47. The definition of urban and rural area in these surveys is based on thecriteria of the 2002 National Population Census. Urban areas includecities, villages and towns (capitals of departments and municipalities) aswell as places with the category of colonia or condominio and all placeswith more than 2000 habitants if in those places more than 51% of thehouseholds have electrical and piped water supply. Like in previouscensus, the whole territory of Guatemala City is considered as urban area.On the other hand, rural area is a residual area, defined as those places notincluded in the urban areas.
48. Inequality of opportunities, which create unfair differences at startingpoints, can be a serious social threat; particularly, if opportunities aresystematically denied to an ethnic or social group. In Guatemalaindigenous population have faced a systematic social exclusion, thechronic status quo of inequality and social exclusion again indigenouspopulation was inherited from the colonial period. Thus, in Guatemalaethnicity is a conditional factor to equality of opportunities.
49. Each individual is attributed the mean income of their circumstancesset, and this income distribution is called the smoothed income distribu-tion. Inequality is then measured over the smoothed income distributionfor each income concept using the mean log deviation, which gives themeasure of inequality of opportunity in levels by income concept. Notethat this measure of inequality of opportunity is different from Roemeret al. (2003) and De Barros et al. (2009). The Human Opportunity Indexdeveloped by Barros et al. measures the extent to which a societyprogresses toward universal access of basic opportunities. The indexsynthesizes in a single indicator how close a society is to universal coverageof a given opportunity and how equitably coverage of that opportunity isdistributed. An equitable policy ensures that a child’s chance of accessingthese key goods and services is not correlated with circumstances that arebeyond his or her control, such as gender, parental background, ethnicityor location.
50. The numbers for these calculations are not shown here but areavailable upon request.
51. These numbers are consistent with the disparities in educationattainment between nonindigenous and indigenous. According to datafrom the 2002 National Population Census, the average years of schoolingfor nonindigenous and indigenous populations are 5.39 and 2.24,respectively. As shown by Chamarbagwala and Moran (2011), amongindividuals born during 1920–83, only 18%, 7% and 4% of indigenousindividuals were able to complete primary, secondary and high school,respectively. In contrast, the proportions of nonindigenous that completedprimary, secondary and high school were 50%, 29% and 19%, respectively.In addition, when we compare urban and rural population the differencesare even more significant (for a complete data on education attainment bygender, region, sector and ethnicity see Table 2 in Chamarbagwala andMoran (2011, p. 44).
52. See, for example, Lustig et al. (2014).
53. See Sanchez (2009) for a discussion on the reasons behind the lack ofprogress on taxation reforms in Guatemala.
REFERENCES
Accion Ciudadana. (2013). Inventario de los Subsidios y Transferencias enel Gobierno Central de la Republica de Guatemala. Guatemala.
Alianza Tecnica de Apoyo al Legislativo. (2014). Analisis del proyecto depresupuesto general de ingresos y egresos del estado: ejercicio fiscal2014. Guatemala. Retrieved from <http://www.mejoremosguate.org/cms/content/files/que-estamos-haciendo/atal/Analisis_del_proyecto_de_presupuesto_ATAL_VF.pdf>.
Archdiocese of Guatemala. (1999). Guatemala Never Again! Guatemala.Bahl, R. W., Wallace, S., & Martınez-Vazquez, J. (1996). The Guatemalan
tax reform. Boulder, Colorado: Westview Press.Barreix, A. D., Bes, M., & Roca, J. (2009). Equidad fiscal en
Centroamerica, Panama y Republica Dominicana.Beneke, M., Lustig, N., & Oliva, J. A. (2015). El Impacto de los Impuestos
y el Gasto Social en la Desigualdad y la Pobreza en El Salvador.Retrieved from <http://www.commitmentoequity.org/publica-tions_files/ElSalvador/CEQWPNo26 ImpactoImpuestosGastoSo-cialElSalvador Marzo 2015.pdf>.
Bucheli, M., Lustig, N., Rossi, M., & Amabile, F. (2014). Social spending,taxes, and income redistribution in Uruguay. Public Finance Review,42(3), 413–433.
CEDLAS, & World Bank. (2015). Socio-economic database for LatinAmerica and the Caribbean.
Chamarbagwala, R., & Moran, H. E. (2011). The human capitalconsequences of civil war: Evidence from Guatemala. Journal ofDevelopment Economics, 94(1), 41–61.
Chu, K., Davoodi, H. R., & Gupta, S. (2000). Income distribution and taxand government social spending policies in developing countries. Inter-national Monetary Fund.
Cubero, R., & Hollar, I. V. (2010). Equity and fiscal policy: The incomedistribution effects of taxation and social spending in Central America(EPub). International Monetary Fund.
Cuesta, J. (2014). Social spending, distribution, and equality of opportu-nities: The opportunity incidence analysis. World Development, 62,106–124.
Davoodi, H. R., Tiongson, E. R., & Asawanuchit, S. S. (2010). Benefitincidence of public education and health spending worldwide:Evidence from a new database. Poverty & Public Policy, 2(2), 2–52.
De Barros, R., Ferreira, F., Molinas, J., & Saavedra, J. (2009). Measuringinequality of opportunities in Latin American and the Caribbean.Washington, DC: International Bank for Reconstruction and Devel-opment/World Bank.
de Ferranti, D., Perry, G., Ferreira, F., Walton, M., Coady, D.,Cunningham, W., et al. (2003). Inequality in Latin America and theCaribbean: Breaking with history. World Bank report.
Devarajan, S., & Hossain, S. I. (1998). The combined incidence of taxesand public expenditures in the Philippines. World Development, 26(6),963–977.
ECLAC. (2015). CEPALSTAT databases and statistical publications.Retrieved from <http://interwp.cepal.org/cepalstat/>, viewed April7th, 2015.
FISCAL POLICY, INEQUALITY, AND THE ETHNIC DIVIDE IN GUATEMALA 279
Fernandez, D., & Naveda, E. (2011). ¿Truco o trato? Mecanismos para laobstaculizacion de las reformas tributarias en Guatemala, 1985–2010.Retrieved from <http://www.estadonacion.or.cr/files/biblioteca_vir-tual/centroamerica/004/Fernandez_y_Naveda_2011.pdf>.
Hall, G. H., & Patrinos, H. A. (2012). Indigenous peoples, poverty, anddevelopment. Cambridge University Press.
Hicks, N. L., & Lee, H. (1997). The impact of fiscal policies on the poor inGuatemala. Journal of Public Budgeting Accounting and FinancialManagement, 9, 501–515.
Higgins, S., & Pereira, C. (2014). The effects of Brazil’s taxation and socialspending on the distribution of household income. Public FinanceReview, 42(3), 346–367.
Historical Clarification Commission. (1999). Guatemala: Memory ofsilence. Retrieved from <http://www.aaas.org/sites/default/files/mi-grate/uploads/mos_en.pdf>.
Jaramillo, M. (2014). The incidence of social spending and taxes in Peru.Public Finance Review, 42(3), 391–412.
Lambert, P. (2001). The distribution and redistribution of income. Manch-ester University Press.
Levy, S., & Schady, N. (2013). Latin America’s social policy challenge:Education, social insurance, redistribution. The Journal of EconomicPerspectives, 27(2), 193–218.
Lindert, P. H. (2004). Growing public: Social spending and economic growthsince the eighteenth century. Cambridge University Press.
Lindert, K., Skoufias, E., & Shapiro, J. (2006). Redistributing income tothe poor and the rich: Public transfers in Latin America and theCaribbean. Social Safety Nets Primer Series.
Lustig, N., & Higgins, S. (2013). Commitment to Equity Assessment(CEQ): Estimating the incidence of social spending, subsidies and taxes.Handbook. Retrieved from <http://www.commitmentoequity.org/pub-lications_files/Methodology/CEQWPNo1 Handbook Edition Sept2013.pdf>.
Lustig, N. (2015). The redistributive impact of government spending oneducation and health: Evidence from 13 developing countries in thecommitment to equity project. In B. Clements, R. De Mooij, S. Gupta,& M. Keen (Eds.), Inequality and the role of fiscal policy: Trends andpolicy options. Washington: International Monetary Fund.
Lustig, N., Lopez-Calva, L. F., & Ortiz-Juarez, E. (2013). Declininginequality in Latin America in the 2000s: The cases of Argentina,Brazil, and Mexico. World Development, 44, 129–141.
Lustig, N., & Pessino, C. (2014). Social spending and income redistribu-tion in Argentina during the 2000s the increasing role of noncontrib-utory pensions. Public Finance Review, 42(3), 304–325.
Lustig, N., Pessino, C., & Scott, J. (2014). The impact of taxes and socialspending on inequality and poverty in Argentina, Bolivia, Brazil,Mexico, Peru, and Uruguay. Introduction to the special issue. PublicFinance Review, 42(3), 287–303.
Martınez-Vazquez, J. (2008). The impact of budgets on the poor: Tax andexpenditure benefit incidence analysis. In B. Moreno-Dodson, & W.Quentin (Eds.), Public finance for poverty reduction: Concepts and casestudies from Africa and Latin America. Washington, DC: World Bank.
McKay, A. (2002). Assessing the impact of fiscal policy on poverty.WIDER discussion papers//World Institute for Development Eco-nomics (UNU-WIDER).
Musgrave, R. (1959). The theory of public finance. New York: McGraw-Hill.
PAHO. (2007). Health in the Americas 2007.Paz-Arauco, V., Gray-Molina, G., Jimenez-Pozo, W., & Yanez-Aguilar,
E. (2014). Explaining low redistributive impact in Bolivia. PublicFinance Review, 42(3), 326–345.
Pechman, J. A. (1985). Who paid the taxes, 1966–1985. Washington, DC:Brookings Institution.
Pecho Trigueros, M., Pelaez Longinotti, F., & Sanchez Vecorena, J.(2012). Estimacion del Incumplimiento Tributario en America Latina:2000–2010. Documento de Trabajo, 3–12.
Roemer, J. (1998). Equality of opportunity. Cambridge, MA: HarvardUniversity Press.
Roemer, J. E., Aaberge, R., Colombino, U., Fritzell, J., Jenkins, S. P.,Lefranc, A., et al. (2003). To what extent do fiscal regimes equalizeopportunities for income acquisition among citizens?. Journal of PublicEconomics, 87(3), 539–565.
Sahn, D. E., & Younger, S. D. (2006). Changes in inequality and povertyin Latin America: Looking beyond income to health and education.Journal of Applied Economics, 9(2), 215–233.
Sanchez, O. (2009). Tax reform paralysis in post-conflict Guatemala. NewPolitical Economy, 14(1), 101–131.
Scott, J. (2014). Redistributive impact and efficiency of Mexico’s fiscalsystem. Public Finance Review, 42(3), 368–390.
Secretarıa de Planificacion y Programacion de la Presidencia. (2012). IVInforme Presidencial y Memoria de Labores: 2008–2012. Guatemala.
UNDP. (2014). Human development report: Sustaining human progress,reducing vulnerabilities and building resilience.
ScienceDirectAvailable online at www.sciencedirect.com