Embed Size (px)
Citation preview
Journal of the Japanese and International Economies 16, 536–558 (2002)doi:10.1006/jjie.2002.0512
Fiscal Policy Effectiveness in Japan1
Kenneth N. Kuttner
Federal Reserve Bank of New York, New York
and
Adam S. Posen
Institute for International Economics, Washington, DC
Received January 18, 2002; revised August 30, 2002
Kuttner, Kenneth N., and Posen, Adam S.—Fiscal Policy Effectiveness in Japan
The effectiveness of fiscal policy in Japan over the past decade has been a matter of greatcontroversy. We investigate the effectiveness of Japanese fiscal policy over the 1976–1999period using a structural VAR analysis of real GDP, tax revenues, and public expenditures.We find that expansionary fiscal policy, whether in the form of tax cuts or of public worksspending, had significant stimulative effects. Using a new method of computing policymultipliers from structural VARs, we calculate that the multiplier on tax cuts is about 25%higher at a four-year horizon than that on public works spending, though both are wellin excess of one. A historical decomposition reveals that Japanese fiscal policy was con-tractionary over much of the 1990s, and a significant proportion of the variation in growthcan be attributed to fiscal policy shocks; accordingly, most of the run-up in public debtis attributable to declining tax revenues due to the recession. Examining savings behaviordirectly, we find limited evidence of Ricardian effects, insufficient to offset the short-term ef-fects of discretionary fiscal policy. J. Japan. Int. Econ., December 2002, 16(4), pp. 536–558.
1 Correspondence should be addressed to Adam Posen, Institute for International Economics, 1750Massachusetts Avenue N.W., Washington, D.C. 20036. Fax: 202-454-5432. E-mail: [email protected] earlier version was presented at the CEPR-NBER-TCER Conference on Issues in Fiscal Adjust-ment, December 13–14, 2001, Tokyo, Japan. We are grateful to Stanley Fischer, Fumio Hayashi,Takeo Hoshi, Richard Jerram, John Makin, George Perry, Mitsuru Taniuchi, and Tsutomu Watanabefor helpful comments and advice. Samantha Davis provided excellent research assistance duringthe revisions. The views expressed here and any errors are those of the authors, and not necessarilythose of Federal Reserve Bank of New York, the Federal Reserve System, or the IIE. ©c FederalReserve Bank of New York and Institute for International Economics. 2002.
536
0889-1583/02 $35.00c© 2002 Elsevier Science (USA)
All rights reserved.
FISCAL POLICY EFFECTIVENESS IN JAPAN 537
Federal Reserve Bank of New York, New York, and Institute for International Economics,Washington, DC. c© 2002 Elsevier Science (USA)
Journal of Economic Literature Classification Numbers: E62, E65, E21.
The effectiveness of fiscal policy in Japan in the 1990s has been at least ascontroversial as the currently more public disputes over monetary policy. Therehas been open debate over the degree to which expansionary fiscal policy haseven been tried, let alone whether it has been effective, along with widespreadassertions about the degree of forward-looking behavior by Japanese savers. Thehighly visible and rapid, more than doubling of Japanese public debt in less than adecade speaks for itself to a surprising number of observers: the fiscal deficit hasgrown sharply, yet the economy has continued to stagnate, so fiscal stabilizationfailed. No less an economist than Milton Friedman recently wrote, ”[D]oes fiscalstimulus stimulate? Japan’s experience in the ‘90s is dramatic evidence to thecontrary. Japan resorted repeatedly to large doeses of fiscal stimulus in the form ofextra government spending. . . . The result: stagnation at best, depression at worst,for most of the past decade.”2
But it is easy to demonstrate from just charting publicly available data that thebulk of the increase in Japanese public debt is due to a plateau in tax revenue ratherthan to increased public expenditure or even discretionary tax cuts. This of coursereflects the inverse cyclical relationship between output and tax revenue. If oneapplied a plausible tax elasticity of 1.25 to reasonable measures of the wideningoutput gap (e.g., those estimated in Kuttner and Posen (2001)), the result would bea much-reduced estimate of the structural budget deficit. In fact, using the measureof potential based on a constant productivity trend growth rate of 2.5% a year allbut eliminates the non-social security portion of the deficit. Moreover, as measuredby the fiscal shocks derived from our estimates in this paper, fiscal policy has beengenerally contractionary since 1997.
More tellingly, the massive increase in Japanese government debt outstandingover the period has had little apparent effect to date on either the level of long-terminterest rates or the steepness of the yield curve, or the yen–dollar exchange rate.This is commonly attributed to the passivity of Japanese savers, and there surelyhas been no sign of crowding out or of inflation fears. This fact has not goneunremarked upon in the financial press.3 Nevertheless, citing the eventual need topay obligations, including those off of the government balance sheet (such as pen-sions), the ratings agencies downgraded Japanese local currency sovereign debt to
2 Friedman, “No More Economic Stimulus Needed,” Wall Street Journal, October 10, 2001, p. A17.See also Ian Campbell, “Friedman Opposes Stimulus Package,” UPI Newswire, October 9, 2001.
3 The Economist observed, “[government bond yields] fell as the government pumped the economywith. . .fiscal stimulus, as the yen plummeted by 40% from its high in the middle of 1995, and even asthe government’s debt climbed to 100% of GDP. By late [1997] the Japanese government was able toborrow more cheaply than any other government in recorded history.” “Japanese Bonds: That SinkingFeeling,” The Economist, February 21, 1998, pp. 74–75.
538 KUTTNER AND POSEN
AA- (by Standard and Poor’s, April 15, 2002) and A2 (by Moody’s, May 30,2002).4 But with the exception of a brief panic-induced spike in rates in Jan-uary 1999, more than half of which was reversed within two months, holders ofJapanese government bonds have yet to take any significant capital losses.
Against this background of declining tax revenues and relatively stable long-term nominal interest rates, the actual course of Japanese fiscal policy has beenalmost tumultuous, rather than one of unremitting spend-spend-spend, as oftenassumed. The divergence of common perceptions from reality may be due in partto the fact that Japan has a centralized, if arcane, fiscal system.5 Every year since1994 has brought announcements of various tax reforms, but their actual impact isdifficult to ascertain.6 On the public spending side, estimating the mamizu (“truewater”) of any Japanese fiscal stimulus requires great care, given institutionalcomplications.7 Meanwhile, in terms of revenue collection, the Japanese tax baseis rather small by developed economy standards, especially on the household side,where salaried urban workers pay a disproportionate share of the taxes, and smallbusiness owners and rural residents pay almost none.8
The absence of obvious interest rate, inflation, or crowding out effects from thefiscal measures undertaken leads us to examine what really happened with fiscalpolicy in Japan in the 1990s. If standard theory tells us that expansionary fiscalpolicy drives up interest rates, limiting that policy’s effectiveness, then perhaps theabsence of an interest rate rise is indicative of the opposite. Our first considera-tion therefore is simply whether the fiscal impulses had Keynesian countercyclicalsigns and what impact those impulses had. As many observers have stressed, tra-ditional public works in Japan more closely approximate the building of pyramidsin hinterlands, famous to macroeconomics undergraduates, than do those in anyother OECD country.9 Some have indicated that they would expect the multiplieron such wasteful expenditures to be less than one.10 Of course, although Keynes
4 See Arkady Ostrovsky and Christopher Swann, “Japan hit by downgrade in credit rating,” FinancialTimes, April 16, 2002, p. 13, and David Ibison, “Japan’s sovereign debt rating downgraded,” FT.com,May 31, 2002.
5 See Ishi (2000) for a historical perspective; Balassa and Noland (1988), Bayoumi (1998), andOECD Economic Survey: Japan (1999), for institutional descriptions; and Schick (1996) for a com-parison of U.S. and Japanese budget processes. Tax Bureau (2000) gives the official account of the taxsystem.
6 See Watanabe et al. (2001) and Tax Bureau (2000).7 See Posen (1998).8 See Balassa and Noland (1988).9 Sixty percent of the Japanese coastline is today reportedly encased in concrete (Ian Buruma, “The
Japanese Malaise,” New York Review of Books, July 5, 2001, p. 5). Similar examples are easy to comeby: see, for example, Martin Wolf, “Japan’s Economic Black Holes,” Financial Times, January 17,2001, p. 21, and Bergsten, Ito, and Noland (2001, pp. 64–65).
10 In June 1998 the then—Vice Minister of Finance for International Affairs Eisuke Sakakibara(1999, p. 45), expressed a contrary point of view: “Concerning the current fiscal package, I knowthat there have been various criticisms of it, but I think there is now a wider acceptance, even in theinternational community, of public works as a more effective means than tax cuts. In addition, undercurrent circumstances, a strong multiplier effect can be expected. . . .”
FISCAL POLICY EFFECTIVENESS IN JAPAN 539
maintained that even overtly wasteful public works projects were an effectivesource of fiscal expansion, several observers have stressed that in the Japanesecontext tax cuts are likely to be more effective.
We then turn to historical decompositions of the effect of fiscal policy on theJapanese economy in the 1990s. The ample variation in Japanese fiscal policy, mov-ing from contractionary to expansionary and back to contractionary, with some taxmeasures temporary and others permanent, provides a rich basis for econometricinvestigation. Upon that investigation, it becomes clear that fiscal policy providesan apparent explanation for a surprisingly large amount of the variation in Japaneseeconomic growth over the period. Meanwhile, on the tax side, all tax cuts werepreceded and accompanied by loud declarations by government officials that even-tually taxes would have to go up—whether due to the looming demographic threat,to the unsustainability of Japanese public debt, or to the supposedly declining po-tential growth rate. Even though we find that these well-publicized dangers fromdebt did not have any obvious short-run effect on multipliers, we also directlyexamine the possibility of Ricardian equivalence. Finally, we conclude by consid-ering some of the questions raised by the apparent fiscal power granted throughsavers’ passivity in Japan.
The analysis here builds on earlier work applying a structural VAR approachto fiscal policy in Japan (Kuttner and Posen, 2001), but extends that paper’s in-vestigations in four important ways. First, impulse response functions and theirstandard errors are calculated, allowing a clear sense of the significance and inter-action of fiscal policy shocks. Second, fiscal shocks and their contributions to GDPgrowth in the 1990s are computed and plotted, yielding an analysis of the historicalrecord. Third, a new approach is introduced to compute “pure” policy multipliersfrom structural vector autoregressions (VARs) in order to give a clearer pictureof the effects of tax and expenditure changes in isolation. And fourth, throughoutthe paper, a variety of robustness checks are considered, especially with regard tothe results’ sensivity to the identifying assumptions.
1. THE SHORT-RUN EFFECTS OF FISCAL POLICY
To assess the impact of fiscal policy on the economy, we employ a structuralthree-variable VAR model adapted from Blanchard and Perotti (1999), which isdesigned to identify the impact of fiscal policy while explicitly allowing for con-temporaneous interdependence among output, taxes, and spending. The one-lagversion of the structural VAR can be expressed succinctly as
A0Yt = A1Yt−1 + Bεt , (1)
where Yt = (Tt , Et , Xt )′ is the vector of the logarithms of real tax revenue, realexpenditure, and real GDP, and εt is interpreted as a vector of mutually orthogonalshocks to the three jointly endogenous variables.
540 KUTTNER AND POSEN
Following Blanchard and Perotti, a key identifying assumption is that real GDP isallowed to have a contemporaneous effect on tax receipts, but not on expenditure.(As discussed below, however, plausible changes to this assumption make nosubstantive difference to the results.) The model also assumes that taxes do notdepend contemporaneously on expenditure (or vice versa) although tax shocks areallowed to affect spending within the year. This assumption reflects the institutionalsetup for fiscal policy in Japan, where taxes are mostly collected from withholdingand consumption, spending is mostly implemented with a lag, and both automaticstabilizers and the size of the public sector are limited. With these assumptionsimposed, the model can be written as
Tt = a130 Xt + a11
1 Tt−1 + a121 Et−1 + a13
1 Xt−1 + εTt
Et = a211 Tt−1 + a22
1 Et−1 + a231 Xt−1 + b21εT
t + εEt (2)
Xt = a310 Tt + a32
0 Et + a311 Tt−1 + a32
1 Et−1 + a331 Xt−1 + εX
t ,
where ai j0 , ai j
1 , and bi j represent the i, j th elements of the A0, A1, and B matrices.Thus a13
0 captures the within-period elasticity of tax receipts with respect to GDP,b21 is the effect of tax shocks on expenditure, and a31
0 and a320 allow taxes and
expenditure to affect real GDP contemporaneously.With seven parameters to estimate from the six unique elements of the covariance
matrix of reduced-form VAR residuals, the model in (2) is not identified, however.11
Our strategy, like that of Blanchard and Perotti, is to use independent informationon the elasticity of tax revenue with respect to real GDP (i.e., a13
0 ) to identifythe model. Drawing on Giorno et al. (1995), we set this parameter equal to 1.25,yielding an exactly identified model.
Reliable comprehensive quarterly fiscal data for Japan are not available to thepublic or to the international financial organizations, unfortunately, and so wefit the model instead to annual consolidated central, state, and local fiscal data,compiled by the IMF, spanning fiscal years 1976 through 1999.12 Tax receipts aredefined as direct and indirect tax revenue, excluding social security contributions.Expenditure corresponds to the sum of current and capital expenditure, less so-cial security and interest payments.13 The estimated model also includes a lineartrend and a trend interacted with a post-1990 dummy to capture the post-1990
11 See Hamilton (1994, chapter 11) for a complete discussion of identification and estimation ofstructural VARs.
12 This lack of timely higher frequency data is of course of policy significance, as well as presentinga difficulty for research. As Stanley Fischer (2001, p. 163) observes, “Indeed, there is a general problemof fiscal transparency in Japan. . .the key issues are lack of consolidation among different fiscal unitsand the absence of quarterly data, which means that fiscal information is on average about eight monthsout of date.”
13 As noted by Blanchard and Perotti (1999), estimating the third equation in the structural VAR isequivalent to using a measure of “cyclically adjusted” tax receipts (and a similarly adjusted measureof spending) as instruments for taxes and spending in a two-stage least squares regression.
FISCAL POLICY EFFECTIVENESS IN JAPAN 541
TABLE IThe Relationship between Taxes, Spending, and GDP: Estimated Parameters of the Structural VAR
Equation
Independent variable Lag Tax Expenditure GDP
Tax receipts t — — −0.03Expenditures t — — 0.17∗∗Real GDP t 1.25 — —Tax receipts t − 1 0.71∗∗∗ −0.12 −0.25∗∗Expenditures t − 1 0.03 0.78∗∗∗ 0.02Real GDP t − 1 −0.58∗∗ 0.66∗ 0.59∗∗∗Tax shock t — −0.03 —Trend −0.004 −0.002 0.033∗∗∗Trend × (t > 1990) −0.018 −0.010 −0.038∗∗∗Adjusted R2 0.996 0.995 0.997Durbin–Watson 1.66 2.30 1.85
Source. Authors’ calculations, based on trivariate structural VAR including real tax revenue, realgovernment expenditures and real GDP, estimated on 24 annual observations spanning fiscal years1976 through 1999.
Note. Asterisks indicate statistical signficance: ∗∗∗for 0.01, ∗∗for 0.05, and ∗for 0.10. The coefficientof 1.25 on real GDP in the tax equation is imposed a priori as an identifying assumption. The adjustedR-squared and Durbin–Watson statistics are from the reduced form VAR equations. Further details canbe found in the text.
slowdown in trend GDP growth.14 The estimated parameters are displayed inTable I. Interpreting individual coefficients of a simultaneous equation model isdifficult, of course, but it is worth noting that expenditures have a positive, statis-tically significant impact on real GDP.
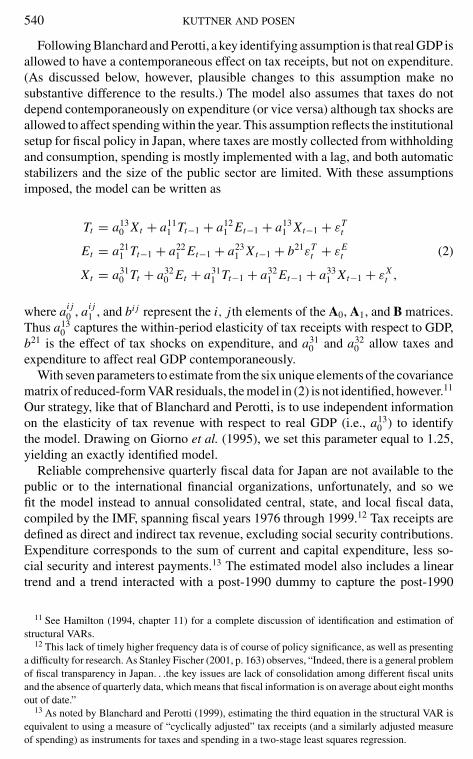
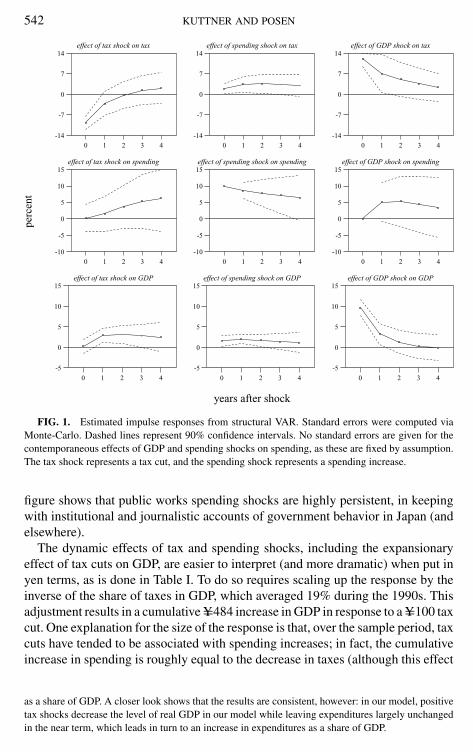
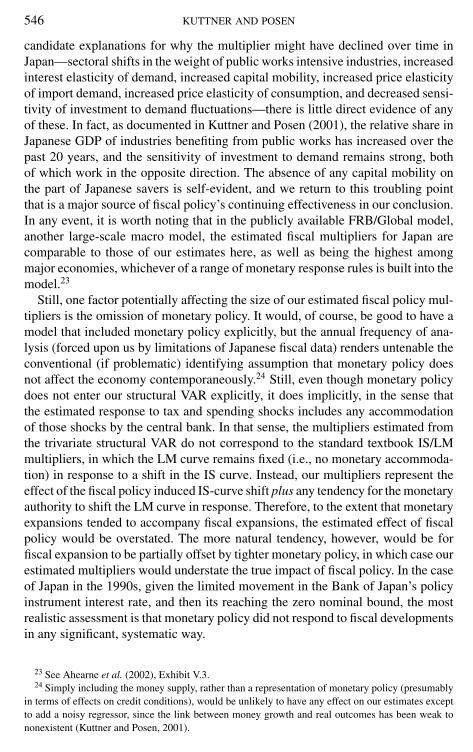
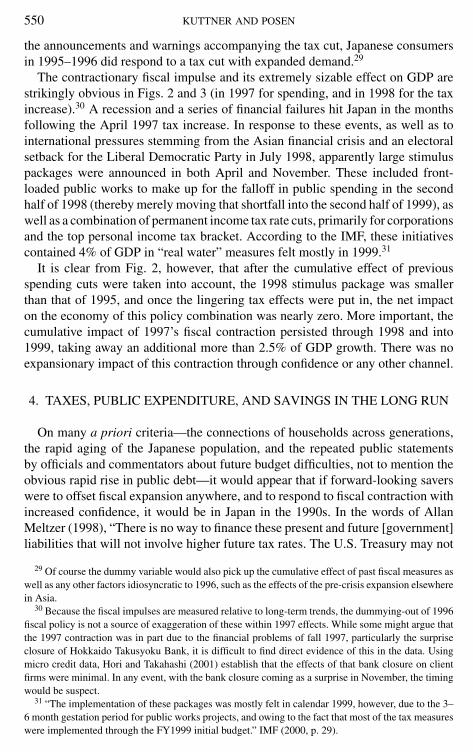
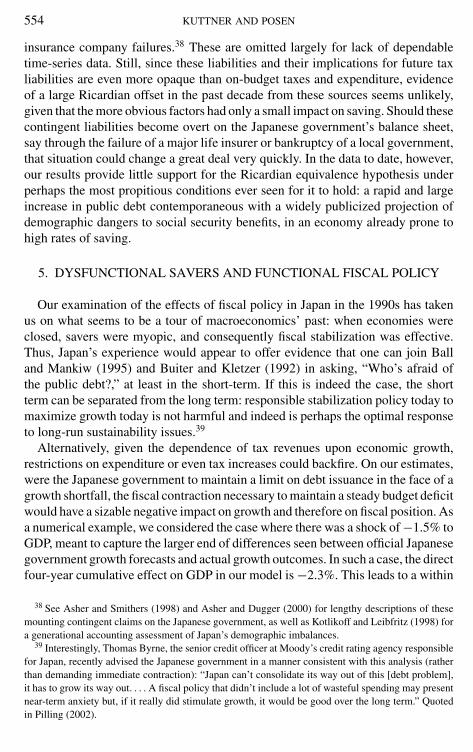
Figure 1 plots the impulse response functions for the four-year time-horizonrelevant for policy analysis, along with 90% confidence bands associated with theestimates. As shown in the first two panels of the last row of the figure, tax cutsand expenditure increases both have expansionary effects. Moreover, the estimatedeffects are statistically significant at a one- to two-year horizon, as well as for thecurrent year in the case of expenditure shocks. The estimated magnitudes of bothtax and expenditure effects are comparable as well. The upper left-hand panel ofFig. 1 shows that tax revenue shocks tend to be relatively transitory, effectivelyvanishing after one year, notwithstanding the characterization of most Japanesetax law changes as permanent in intent.15,16 In contrast, the center panel of the
14 The model makes no explicit distinction between temporary and permanent tax and expenditurechanges, in part because the temporary tax changes enacted in Japan have been much smaller inmagnitude than the permanent ones (see Watanabe et al., 2001). Many of the supposedly permanenttax changes were offset by subsequent tax legislation, however, and this pattern should be picked upby the model’s dynamics.
15 This pattern is documented in Watanabe et al. (2001). Because of the feedback between taxrevenues and GDP, and the greater-than-unit elasticity of tax revenue with respect to GDP, the impactof a 10% tax shock on tax revenue is slightly less than 10%.
16 The lack of a significant response of expenditures to tax shocks may appear at first to contradictthe results of Ihori et al. (2001), who found Granger causality from the taxes to expenditures, expressed
542 KUTTNER AND POSEN
years after shock
perc
ent
effect of tax shock on tax
0 1 2 3 4
-14
-7
0
7
14
effect of tax shock on spending
0 1 2 3 4
-10
-5
0
5
10
15
effect of tax shock on GDP
0 1 2 3 4
-5
0
5
10
15
effect of spending shock on tax
0 1 2 3 4
-14
-7
0
7
14
effect of spending shock on spending
0 1 2 3 4
-10
-5
0
5
10
15
effect of spending shock on GDP
0 1 2 3 4
-5
0
5
10
15
effect of GDP shock on tax
0 1 2 3 4
-14
-7
0
7
14
effect of GDP shock on spending
0 1 2 3 4
-10
-5
0
5
10
15
effect of GDP shock on GDP
0 1 2 3 4
-5
0
5
10
15
FIG. 1. Estimated impulse responses from structural VAR. Standard errors were computed viaMonte-Carlo. Dashed lines represent 90% confidence intervals. No standard errors are given for thecontemporaneous effects of GDP and spending shocks on spending, as these are fixed by assumption.The tax shock represents a tax cut, and the spending shock represents a spending increase.
figure shows that public works spending shocks are highly persistent, in keepingwith institutional and journalistic accounts of government behavior in Japan (andelsewhere).
The dynamic effects of tax and spending shocks, including the expansionaryeffect of tax cuts on GDP, are easier to interpret (and more dramatic) when put inyen terms, as is done in Table I. To do so requires scaling up the response by theinverse of the share of taxes in GDP, which averaged 19% during the 1990s. Thisadjustment results in a cumulative Y=484 increase in GDP in response to a Y=100 taxcut. One explanation for the size of the response is that, over the sample period, taxcuts have tended to be associated with spending increases; in fact, the cumulativeincrease in spending is roughly equal to the decrease in taxes (although this effect
as a share of GDP. A closer look shows that the results are consistent, however: in our model, positivetax shocks decrease the level of real GDP in our model while leaving expenditures largely unchangedin the near term, which leads in turn to an increase in expenditures as a share of GDP.
FISCAL POLICY EFFECTIVENESS IN JAPAN 543
is estimated rather imprecisely).17 Overall, GDP rises by more than twice the sumof the spending and tax effects.
The immediate impact of a 10% positive spending shock on GDP is 1.6%,however, which translates into Y=84 for a Y=100 spending increase, and the stimulusbuilds only slightly over time. One reason for the smaller estimated effect ofspending than of tax shocks is that taxes tend to rise in response to positive spendingshocks in this sample, partly offsetting the expansionary impact of the spendingincrease. This can be interpreted as evidence of the expensive maintenance ofunproductive Japanese public works projects. Overall, the increase in GDP isabout 1.75 times the net effect of the spending minus the tax increases—smallerthan the effect of tax shocks, but still a respectable economic impact.
Deriving a model with sufficient structure to assess the impact of fiscal pol-icy clearly requires a number of strong identifying assumptions. As noted above,three such assumptions are embedded in a Blanchard–Perotti framework: first, thatcurrent taxes do not depend directly on current expenditures; second, that currentexpenditures to not respond directly to current GDP; and third, that the within-year elasticity of tax revenues with respect to GDP is 1.25. Since the model isexactly identified, these restrictions are not formally testable, of course, but thereported results are robust to plausible changes in all three of these assumptions.18
In particular, allowing for a contemporaneous effect from spending shocks to taxrevenues (instead of the other way around) has virtually no effect on the results.The results are slightly more sensitive to changes to the assumed elasticity oftax revenues, but for plausible values of the parameter (i.e., ranging from 1.0 to1.5), the estimates are qualitatively similar to those reported above. And it turnsout that assuming a plausible, negative elasticity of expenditures with respect toGDP (reflecting a presumed countercyclical use of fiscal policy) actually increasesthe estimated effects of fiscal shocks. These robustness checks therefore indicatethat the findings are not merely an artifact of the model’s identifying assump-tions.
This analysis shows that, when it has been used, discretionary fiscal policy inJapan has in fact had the effects predicted in standard closed-economy macroe-conomic analyses. Both tax cuts and spending increases lead to higher real GDP,although the tendency for taxes and spending to move together has reduced theimpact of spending increases.19 The commonly held perception of fiscal policy’s
17 Blanchard and Perotti (1999) found a qualitatively similar pattern in the U.S. data.18 The full results obtained under these alternative assumptions are available from the authors upon
request.19 Further work is needed to reconcile our results on the sizable effects of fiscal policy in Japan
with the findings (using very different econometric approaches) of Bayoumi (2001) and Perri (1999)that fiscal policy had the expected sign but very small effects, and of Ramaswamy and Rendu (2000)that “public consumption had a dampening impact on activity in the 1990s.” A likely explanationis that these analyses did not take full account of the dynamic interactions among GDP, tax revenue,and expenditure in the way that we were able to.
544 KUTTNER AND POSEN
ineffectiveness in all likelihood stems from a failure to recognize the dependenceof tax receipts with respect to GDP: as GDP falls, tax revenue shrinks, but toconclude from this that changes in the deficit have not affected growth would beincorrect.
2. MULTIPLIERS ON TAX CUTS AND PUBLIC SPENDING
The difficulty in reading off a simple multiplier from our estimations is that inthe data (and therefore in Japanese reality over the period) tax cuts generally havebeen accompanied by spending increases; expenditure increases, on the other hand,have generally been accompanied by tax increases. So, for example, in Table II,where we list the Y=484 estimate of the effect on GDP of a Y=100 tax cut, weare actually reporting the four-year cumulative effect of the tax cut and of theaccompanying expenditure increase seen in the data. A fair comparison of theeffects of (or multiplier on) tax cuts and expenditure increases therefore requirestaking into account any correlation between taxes and expenditures.
To do this, we examine the responses to linear combinations of tax and spendingshocks calculated to generate a cumulative 1% change in the variable of interest,and a cumulative zero response to the other variable, measured at a four-year hori-zon. The response of GDP to this combination of shocks is then used to calculate a“pure” multiplier on tax or spending shocks. For example, a −0.66% (expansion-ary) tax shock combined with a −0.21% (contractionary) spending shock givesa 1% reduction in tax revenues over four years, with no cumulative impact onspending, and a net 0.47% increase in real GDP.
Scaling this response by the inverse of the share of taxes in GDP (using the1990–1999) average of 19%) yields a multiplier for tax cuts of 2.5; a similarcalculation for spending increases gives a multiplier of 2.0. As a result of thisdifference in magnitudes, the cumulative four-year gain to Japanese GDP froma revenue neutral shift of Y=100 from public works spending to tax cuts is Y=47.
TABLE IIThe Dynamic Impact of Fiscal Policy: Estimated Yen-Denominated Impulse Responses
(Effects of expansionary Y=100 shocks, in yen)
Impact of −Y=100 tax shock Impact of +Y=100 spending shock
Taxes Spending GDP Taxes Spending GDP
Year 0 −96 3 16 20 100 84Year 1 −32 16 158 34 87 105Year 2 0 36 168 37 77 89Four-year cumulative −111 104 484 127 332 353
Source. Authors’ calculations based on the estimated structural VAR.Note. The impact of Y=100 tax and spending shocks are computed assuming taxes and
spending represent 19% of GDP.
FISCAL POLICY EFFECTIVENESS IN JAPAN 545
These estimates also understate the beneficial effects of tax cuts, because theydo not directly capture the allocative efficiency gains from changes in Japanesetax code, just the immediate macroeconomic impact. Though such gains can beexaggerated, there is good reason to believe that such supply-side effects wouldbe large in Japan today.
These effects at first glance may seem rather large, relative to other publishedestimates; in fact they are quite close to comparably calculated multipliers for theUnited States, such as those of Blanchard and Perotti (1999). The “multipliers”reported there, however, are defined differently from those we calculate. Blanchardand Perotti reported multipliers defined as the ratio of the peak response of GDP tothe size of the initial shock to taxes or spending. That method can be misleading,however, as it fails to take into account either the dynamics of the response or thetendency for taxes and spending to move together.20 Using our method to calculatecomparable multipliers from Blanchard and Perotti’s trend-stationary estimates,we obtain a multiplier of roughly 4.0 for tax shocks—considerably larger thanour estimate for Japan. Our estimated spending multiplier for Japan is somewhathigher than the comparable multiplier for the United States calculated from theBlanchard–Perotti results, but quite close to similar calculations based on theirestimated response to military spending shocks.
In contrast to these results, the Economic Planning Agency (EPA) of the Japanesegovernment (now the Cabinet and Fiscal Office) has published declining esti-mates of the multiplier on fiscal policy for the past several years. In May 1995,the EPA World Economic Model 5th Version reported cumulative multipliers ongovernment investment of 1.32 in the first year, 1.75 in the second year, and 2.13in the third year (down from 1.39, 1.88, and 2.33 in the 4th Version), and far lowermultipliers on income tax reductions (0.46, 0.91, and 1.26, down from 0.53, 1.14,and 1.56 in the 4th Version).21 In October 2001, the EPA released the multipli-ers from the 1998 revised version of the model, with the cumulative multiplierson government investment declining to 1.12, 1.31, and 1.10, and on income taxreductions of 0.62, 0.59, and 0.05.22 Leaving aside the question of whether thesechanges represent statistically significant differences, given the difficulties of esti-mating these multipliers, it is worth considering the source of this divergence fromour results.
The difficulty in making a strict comparison lies in the unavailability (at leastpublicly, in English) of the details of the EPA’s large-scale macro model, partic-ularly with regard to the assumed response of monetary policy built in. As thediscussion in OECD (2000, pp. 60–64) makes clear, while there are a number of
20 Basing the multiplier on the peak response could, for example, yield a nonzero multiplier even ifthe effect on GDP were completely reversed in subsequent periods.
21 See “The EPA World Economic Model 5th Version: Basic Structure and Multipliers,” EconomicAnalysis Series 139, May, 1995, www.esri.cao.go.jp/en/archive/bun/abstract/139-e.html.
22 See “The ESRI Short-Run Macroeconometric Model of Japanese Economy: Basic Structure andMultipliers,” October 2001, www.esri.cao.go.jp/en/archive/e-dis/abstract/006-e.html.
546 KUTTNER AND POSEN
candidate explanations for why the multiplier might have declined over time inJapan—sectoral shifts in the weight of public works intensive industries, increasedinterest elasticity of demand, increased capital mobility, increased price elasticityof import demand, increased price elasticity of consumption, and decreased sensi-tivity of investment to demand fluctuations—there is little direct evidence of anyof these. In fact, as documented in Kuttner and Posen (2001), the relative share inJapanese GDP of industries benefiting from public works has increased over thepast 20 years, and the sensitivity of investment to demand remains strong, bothof which work in the opposite direction. The absence of any capital mobility onthe part of Japanese savers is self-evident, and we return to this troubling pointthat is a major source of fiscal policy’s continuing effectiveness in our conclusion.In any event, it is worth noting that in the publicly available FRB/Global model,another large-scale macro model, the estimated fiscal multipliers for Japan arecomparable to those of our estimates here, as well as being the highest amongmajor economies, whichever of a range of monetary response rules is built into themodel.23
Still, one factor potentially affecting the size of our estimated fiscal policy mul-tipliers is the omission of monetary policy. It would, of course, be good to have amodel that included monetary policy explicitly, but the annual frequency of ana-lysis (forced upon us by limitations of Japanese fiscal data) renders untenable theconventional (if problematic) identifying assumption that monetary policy doesnot affect the economy contemporaneously.24 Still, even though monetary policydoes not enter our structural VAR explicitly, it does implicitly, in the sense thatthe estimated response to tax and spending shocks includes any accommodationof those shocks by the central bank. In that sense, the multipliers estimated fromthe trivariate structural VAR do not correspond to the standard textbook IS/LMmultipliers, in which the LM curve remains fixed (i.e., no monetary accommoda-tion) in response to a shift in the IS curve. Instead, our multipliers represent theeffect of the fiscal policy induced IS-curve shift plus any tendency for the monetaryauthority to shift the LM curve in response. Therefore, to the extent that monetaryexpansions tended to accompany fiscal expansions, the estimated effect of fiscalpolicy would be overstated. The more natural tendency, however, would be forfiscal expansion to be partially offset by tighter monetary policy, in which case ourestimated multipliers would understate the true impact of fiscal policy. In the caseof Japan in the 1990s, given the limited movement in the Bank of Japan’s policyinstrument interest rate, and then its reaching the zero nominal bound, the mostrealistic assessment is that monetary policy did not respond to fiscal developmentsin any significant, systematic way.
23 See Ahearne et al. (2002), Exhibit V.3.24 Simply including the money supply, rather than a representation of monetary policy (presumably
in terms of effects on credit conditions), would be unlikely to have any effect on our estimates exceptto add a noisy regressor, since the link between money growth and real outcomes has been weak tononexistent (Kuttner and Posen, 2001).
FISCAL POLICY EFFECTIVENESS IN JAPAN 547
tax shocks spending shocks
perc
ent
1990 91 92 93 94 95 96 97 98 99-7.5
-5.0
-2.5
0.0
2.5
5.0
7.5
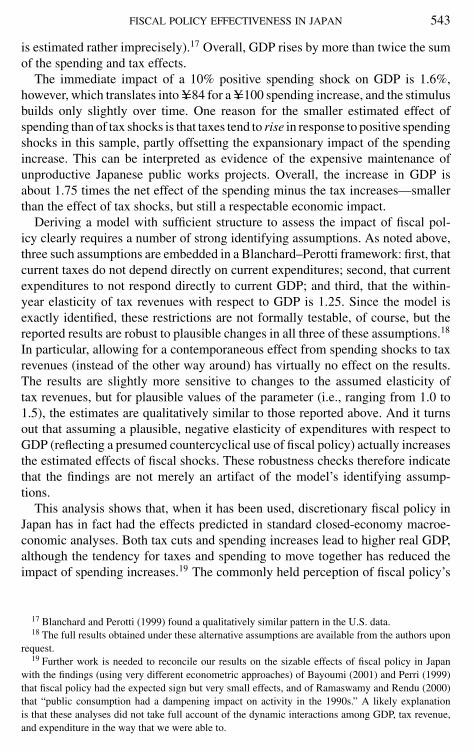
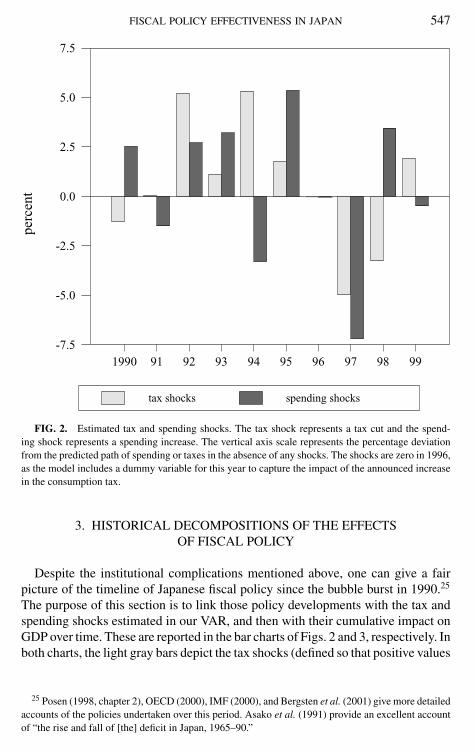
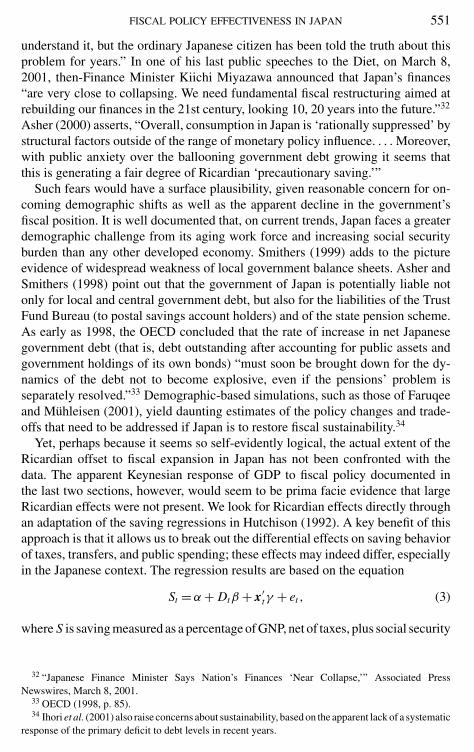
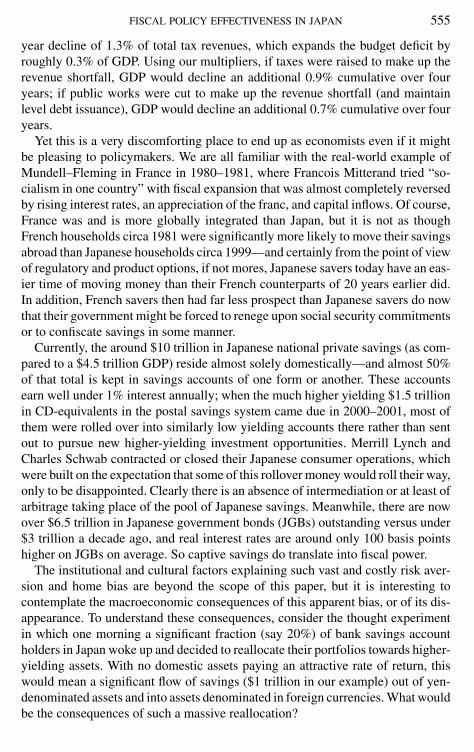
FIG. 2. Estimated tax and spending shocks. The tax shock represents a tax cut and the spend-ing shock represents a spending increase. The vertical axis scale represents the percentage deviationfrom the predicted path of spending or taxes in the absence of any shocks. The shocks are zero in 1996,as the model includes a dummy variable for this year to capture the impact of the announced increasein the consumption tax.
3. HISTORICAL DECOMPOSITIONS OF THE EFFECTSOF FISCAL POLICY
Despite the institutional complications mentioned above, one can give a fairpicture of the timeline of Japanese fiscal policy since the bubble burst in 1990.25
The purpose of this section is to link those policy developments with the tax andspending shocks estimated in our VAR, and then with their cumulative impact onGDP over time. These are reported in the bar charts of Figs. 2 and 3, respectively. Inboth charts, the light gray bars depict the tax shocks (defined so that positive values
25 Posen (1998, chapter 2), OECD (2000), IMF (2000), and Bergsten et al. (2001) give more detailedaccounts of the policies undertaken over this period. Asako et al. (1991) provide an excellent accountof “the rise and fall of [the] deficit in Japan, 1965–90.”
548 KUTTNER AND POSEN
effect of tax shocks effect of spending shocks
perc
ent
1990 91 92 93 94 95 96 97 98 99-2.0
-1.5
-1.0
-0.5
0.0
0.5
1.0
1.5
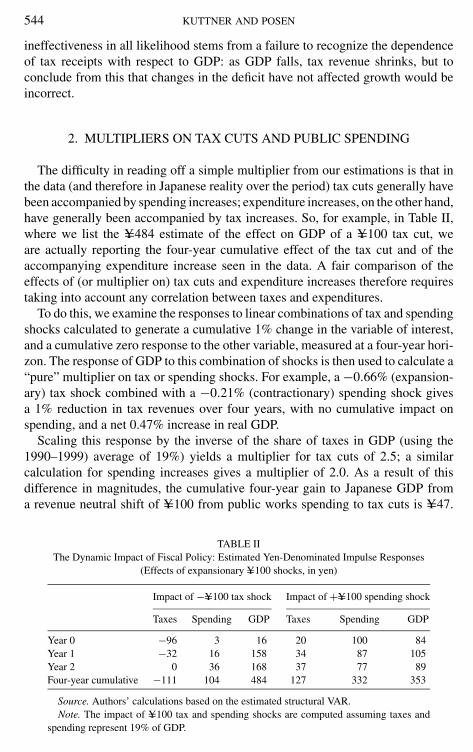
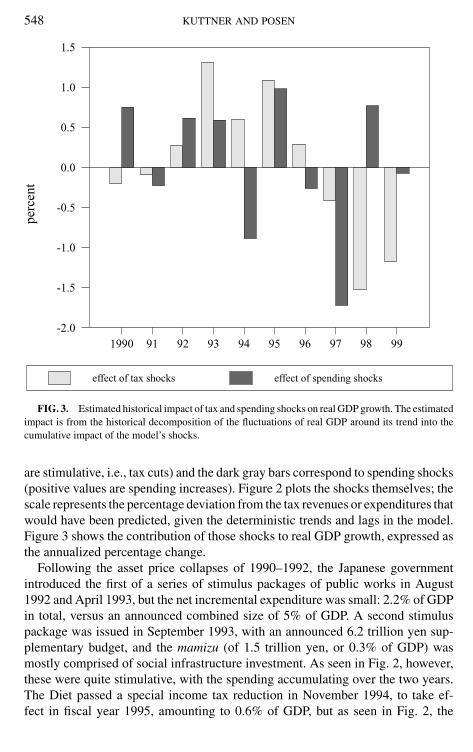
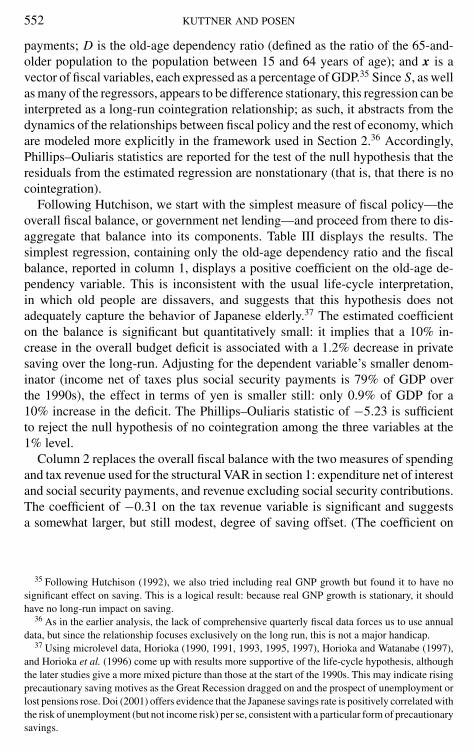
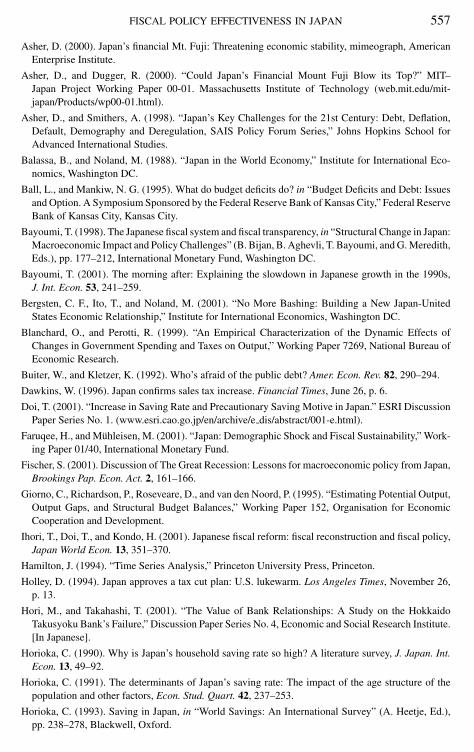
FIG. 3. Estimated historical impact of tax and spending shocks on real GDP growth. The estimatedimpact is from the historical decomposition of the fluctuations of real GDP around its trend into thecumulative impact of the model’s shocks.
are stimulative, i.e., tax cuts) and the dark gray bars correspond to spending shocks(positive values are spending increases). Figure 2 plots the shocks themselves; thescale represents the percentage deviation from the tax revenues or expenditures thatwould have been predicted, given the deterministic trends and lags in the model.Figure 3 shows the contribution of those shocks to real GDP growth, expressed asthe annualized percentage change.
Following the asset price collapses of 1990–1992, the Japanese governmentintroduced the first of a series of stimulus packages of public works in August1992 and April 1993, but the net incremental expenditure was small: 2.2% of GDPin total, versus an announced combined size of 5% of GDP. A second stimuluspackage was issued in September 1993, with an announced 6.2 trillion yen sup-plementary budget, and the mamizu (of 1.5 trillion yen, or 0.3% of GDP) wasmostly comprised of social infrastructure investment. As seen in Fig. 2, however,these were quite stimulative, with the spending accumulating over the two years.The Diet passed a special income tax reduction in November 1994, to take ef-fect in fiscal year 1995, amounting to 0.6% of GDP, but as seen in Fig. 2, the
FISCAL POLICY EFFECTIVENESS IN JAPAN 549
effects were felt already in 1994.26 Interestingly, this tax cut was accompanied byan almost offsetting spending cut. The effects on GDP growth of this sequencewere as to be expected, as shown in Fig. 3: the tax cuts were felt particularly in1993 and 1995, but with little persistent effect, while the effects of the spendingcut in 1994 was more than enough to offset the tax cut of that year. In 1995, theJapanese government implemented its first relatively large scale tax cut–publicspending combination, which had a double-barreled impact on GDP that year; thegreater multiplier on tax cuts, however, can be seen in the over 1.0% effect on GDPfrom the tax shock, despite that shock being smaller in initial magnitude than thespending increase.
As is now well known, from the time of its passage, the 1995 tax cut wassupposed to be reversed at the start of fiscal year 1997, and that tax increase wasto be accompanied then by an increase in the national consumption tax (a value-added tax) from 3 to 5%. At the time, Prime Minister Tomiichi Murayama andsenior budget officials cited concern about the looming demographic threat as theprimary reason for the tax consolidation and the shift to indirect taxes. Some beliefin the power of an expansionary consolidation, due to Japan’s debt situation, wasalso invoked as a reason for the planned tax increase.27 In June 1996 the TaxCommission (an advisory body to the prime minister) and then the Diet reaffirmedthe commitment to the tax increase. In April 1997 contribution rates to socialsecurity were increased along with the promised repeal of the temporary incometax cut and the implementation of the consumption tax increase. The tax burdenrose by nearly 2% of GDP, more mamizu of contraction than any of the fiscalstimulus packages implemented up to that time.
This sequence of measures would in principle have had two competing effects.The first would have been an increase in savings (for standard permanent-incomereasons), offsetting a tax cut which, because of the looming budget burden aswell as the government rhetoric about that burden, was certainly perceived astemporary. The second would have been an intertemporal substitution effect, withhouseholds moving purchases forward before the consumption tax increase tookeffect. Neither of these forward-looking effects can be measured directly in ourVAR by the fiscal components, so we include a dummy variable for the year 1996,where a positive effect on GDP would indicate a predominance of the intertemporalsubstitution effect.28 We find that there was a positive impact of the 1996 dummyon GDP, of about 3%, significant at the 10% level. Thus, it appears that despite
26 The Japanese government fiscal year runs from April 1 to March 31.27 See Holley (1994, p. D1); “Editorial: Drastic Reforms Must Be Carried out,” Daily Yomiuri,
June 21, 1996, p. 13; William Dawkins, “Japan Confirms Sales Tax Increase,” Financial Times, June 26,1996, p. 6; and the account in Posen (1998, p. 50).
28 The VAR used to generate the results in Sections 2 and 3 did not include the 1996 dummy variable,but its inclusion has little effect on the estimated coefficients or impulse response functions. The limitedavailability of Japanese fiscal data unfortunately does not allow us to match the dummy variable moreprecisely to the date of the measure’s introduction.
550 KUTTNER AND POSEN
the announcements and warnings accompanying the tax cut, Japanese consumersin 1995–1996 did respond to a tax cut with expanded demand.29
The contractionary fiscal impulse and its extremely sizable effect on GDP arestrikingly obvious in Figs. 2 and 3 (in 1997 for spending, and in 1998 for the taxincrease).30 A recession and a series of financial failures hit Japan in the monthsfollowing the April 1997 tax increase. In response to these events, as well as tointernational pressures stemming from the Asian financial crisis and an electoralsetback for the Liberal Democratic Party in July 1998, apparently large stimuluspackages were announced in both April and November. These included front-loaded public works to make up for the falloff in public spending in the secondhalf of 1998 (thereby merely moving that shortfall into the second half of 1999), aswell as a combination of permanent income tax rate cuts, primarily for corporationsand the top personal income tax bracket. According to the IMF, these initiativescontained 4% of GDP in “real water” measures felt mostly in 1999.31
It is clear from Fig. 2, however, that after the cumulative effect of previousspending cuts were taken into account, the 1998 stimulus package was smallerthan that of 1995, and once the lingering tax effects were put in, the net impacton the economy of this policy combination was nearly zero. More important, thecumulative impact of 1997’s fiscal contraction persisted through 1998 and into1999, taking away an additional more than 2.5% of GDP growth. There was noexpansionary impact of this contraction through confidence or any other channel.
4. TAXES, PUBLIC EXPENDITURE, AND SAVINGS IN THE LONG RUN
On many a priori criteria—the connections of households across generations,the rapid aging of the Japanese population, and the repeated public statementsby officials and commentators about future budget difficulties, not to mention theobvious rapid rise in public debt—it would appear that if forward-looking saverswere to offset fiscal expansion anywhere, and to respond to fiscal contraction withincreased confidence, it would be in Japan in the 1990s. In the words of AllanMeltzer (1998), “There is no way to finance these present and future [government]liabilities that will not involve higher future tax rates. The U.S. Treasury may not
29 Of course the dummy variable would also pick up the cumulative effect of past fiscal measures aswell as any other factors idiosyncratic to 1996, such as the effects of the pre-crisis expansion elsewherein Asia.
30 Because the fiscal impulses are measured relative to long-term trends, the dummying-out of 1996fiscal policy is not a source of exaggeration of these within 1997 effects. While some might argue thatthe 1997 contraction was in part due to the financial problems of fall 1997, particularly the surpriseclosure of Hokkaido Takusyoku Bank, it is difficult to find direct evidence of this in the data. Usingmicro credit data, Hori and Takahashi (2001) establish that the effects of that bank closure on clientfirms were minimal. In any event, with the bank closure coming as a surprise in November, the timingwould be suspect.
31 “The implementation of these packages was mostly felt in calendar 1999, however, due to the 3–6 month gestation period for public works projects, and owing to the fact that most of the tax measureswere implemented through the FY1999 initial budget.” IMF (2000, p. 29).
FISCAL POLICY EFFECTIVENESS IN JAPAN 551
understand it, but the ordinary Japanese citizen has been told the truth about thisproblem for years.” In one of his last public speeches to the Diet, on March 8,2001, then-Finance Minister Kiichi Miyazawa announced that Japan’s finances“are very close to collapsing. We need fundamental fiscal restructuring aimed atrebuilding our finances in the 21st century, looking 10, 20 years into the future.”32
Asher (2000) asserts, “Overall, consumption in Japan is ‘rationally suppressed’ bystructural factors outside of the range of monetary policy influence. . . . Moreover,with public anxiety over the ballooning government debt growing it seems thatthis is generating a fair degree of Ricardian ‘precautionary saving.’”
Such fears would have a surface plausibility, given reasonable concern for on-coming demographic shifts as well as the apparent decline in the government’sfiscal position. It is well documented that, on current trends, Japan faces a greaterdemographic challenge from its aging work force and increasing social securityburden than any other developed economy. Smithers (1999) adds to the pictureevidence of widespread weakness of local government balance sheets. Asher andSmithers (1998) point out that the government of Japan is potentially liable notonly for local and central government debt, but also for the liabilities of the TrustFund Bureau (to postal savings account holders) and of the state pension scheme.As early as 1998, the OECD concluded that the rate of increase in net Japanesegovernment debt (that is, debt outstanding after accounting for public assets andgovernment holdings of its own bonds) “must soon be brought down for the dy-namics of the debt not to become explosive, even if the pensions’ problem isseparately resolved.”33 Demographic-based simulations, such as those of Faruqeeand Muhleisen (2001), yield daunting estimates of the policy changes and trade-offs that need to be addressed if Japan is to restore fiscal sustainability.34
Yet, perhaps because it seems so self-evidently logical, the actual extent of theRicardian offset to fiscal expansion in Japan has not been confronted with thedata. The apparent Keynesian response of GDP to fiscal policy documented inthe last two sections, however, would seem to be prima facie evidence that largeRicardian effects were not present. We look for Ricardian effects directly throughan adaptation of the saving regressions in Hutchison (1992). A key benefit of thisapproach is that it allows us to break out the differential effects on saving behaviorof taxes, transfers, and public spending; these effects may indeed differ, especiallyin the Japanese context. The regression results are based on the equation
St = α + Dtβ + x′tγ + et , (3)
where S is saving measured as a percentage of GNP, net of taxes, plus social security
32 “Japanese Finance Minister Says Nation’s Finances ‘Near Collapse,’” Associated PressNewswires, March 8, 2001.
33 OECD (1998, p. 85).34 Ihori et al. (2001) also raise concerns about sustainability, based on the apparent lack of a systematic
response of the primary deficit to debt levels in recent years.
552 KUTTNER AND POSEN
payments; D is the old-age dependency ratio (defined as the ratio of the 65-and-older population to the population between 15 and 64 years of age); and x is avector of fiscal variables, each expressed as a percentage of GDP.35 Since S, as wellas many of the regressors, appears to be difference stationary, this regression can beinterpreted as a long-run cointegration relationship; as such, it abstracts from thedynamics of the relationships between fiscal policy and the rest of economy, whichare modeled more explicitly in the framework used in Section 2.36 Accordingly,Phillips–Ouliaris statistics are reported for the test of the null hypothesis that theresiduals from the estimated regression are nonstationary (that is, that there is nocointegration).
Following Hutchison, we start with the simplest measure of fiscal policy—theoverall fiscal balance, or government net lending—and proceed from there to dis-aggregate that balance into its components. Table III displays the results. Thesimplest regression, containing only the old-age dependency ratio and the fiscalbalance, reported in column 1, displays a positive coefficient on the old-age de-pendency variable. This is inconsistent with the usual life-cycle interpretation,in which old people are dissavers, and suggests that this hypothesis does notadequately capture the behavior of Japanese elderly.37 The estimated coefficienton the balance is significant but quantitatively small: it implies that a 10% in-crease in the overall budget deficit is associated with a 1.2% decrease in privatesaving over the long-run. Adjusting for the dependent variable’s smaller denom-inator (income net of taxes plus social security payments is 79% of GDP overthe 1990s), the effect in terms of yen is smaller still: only 0.9% of GDP for a10% increase in the deficit. The Phillips–Ouliaris statistic of −5.23 is sufficientto reject the null hypothesis of no cointegration among the three variables at the1% level.
Column 2 replaces the overall fiscal balance with the two measures of spendingand tax revenue used for the structural VAR in section 1: expenditure net of interestand social security payments, and revenue excluding social security contributions.The coefficient of −0.31 on the tax revenue variable is significant and suggestsa somewhat larger, but still modest, degree of saving offset. (The coefficient on
35 Following Hutchison (1992), we also tried including real GNP growth but found it to have nosignificant effect on saving. This is a logical result: because real GNP growth is stationary, it shouldhave no long-run impact on saving.
36 As in the earlier analysis, the lack of comprehensive quarterly fiscal data forces us to use annualdata, but since the relationship focuses exclusively on the long run, this is not a major handicap.
37 Using microlevel data, Horioka (1990, 1991, 1993, 1995, 1997), Horioka and Watanabe (1997),and Horioka et al. (1996) come up with results more supportive of the life-cycle hypothesis, althoughthe later studies give a more mixed picture than those at the start of the 1990s. This may indicate risingprecautionary saving motives as the Great Recession dragged on and the prospect of unemployment orlost pensions rose. Doi (2001) offers evidence that the Japanese savings rate is positively correlated withthe risk of unemployment (but not income risk) per se, consistent with a particular form of precautionarysavings.
FISCAL POLICY EFFECTIVENESS IN JAPAN 553
TABLE IIIThe Long-Run Relationship between Saving and Fiscal Policy: Results from Savings Rate Regressions
Equation
(1) (2) (3)
Constant 30.6∗∗∗ 38.4∗∗∗ 37.9∗∗∗(0.62) (4.98) (5.39)
Old age dependency ratio 0.11∗∗∗ 0.12∗∗∗ 0.17∗(0.036) (0.033) (0.096)
Fiscal balance (revenues-expenditures) −0.12∗∗ — —(0.045)
Tax revenue — −0.31∗∗ −0.32∗∗(0.113) (0.133)
Government expenditure — −0.10 −0.09(0.159) (0.172)
Social security balance — — 0.30(0.556)
Net interest expenditure — — 0.13(0.418)
Adjusted R2 0.481 0.578 0.585Durbin–Watson statistic 1.25 1.51 1.48Phillips–Ouliaris Zt test statistic −5.23∗∗∗ −5.46∗∗∗ −5.10∗∗
Note. The dependent variable is private saving, as a share of GNP net of taxes, plus social securitypayments. The old-age dependency ratio is defined as the above-65 population divided by the populationaged 15–64. Fiscal variables are expressed as a percentage of GNP. Estimation is by OLS on annualdata spanning fiscal years 1976 through 1999. Parentheses contain the coefficients’ standard errors.Asterisks indicate statistical signficance: ∗∗∗for 0.01, ∗∗for 0.05, and ∗for 0.10.
expenditure has the “wrong” sign but is statistically insignificant.) Adjusting forthe relative sizes of the variables’ denominators, the revenue coefficient implies aY=24 increase in saving in response to a Y=100 tax cut over the long run. (Giventhe de facto transitory nature of tax changes in Japan, some saving offset is tobe expected, concerns about demographics and future obligations aside.) There issome apparent tension between this long-run response and the short-run multiplieron tax cuts estimated in the previous analysis, but this should not be overdrawn.In essence, the results in Table I are net of these offsetting saving effects to thedegree they are incurred within the three-year horizon.
The final specification, in column 3, adds to the previous specification the tworemaining elements in the overall fiscal balance: the social security balance andnet interest expenditure. Collectively, these four variables make up the overallfiscal balance (except for a very small “other revenue” category, which is omitted).Neither the social security balance nor net interest seems to bear a systematicrelation to saving in Japan over the period: both are insignificant, and togetherthey increase the adjusted R2 only marginally.
One potential lacuna in this analysis is the failure to incorporate off-budgetliabilities, such as pension shortfalls, debts of semipublic institutions, and likely
554 KUTTNER AND POSEN
insurance company failures.38 These are omitted largely for lack of dependabletime-series data. Still, since these liabilities and their implications for future taxliabilities are even more opaque than on-budget taxes and expenditure, evidenceof a large Ricardian offset in the past decade from these sources seems unlikely,given that the more obvious factors had only a small impact on saving. Should thesecontingent liabilities become overt on the Japanese government’s balance sheet,say through the failure of a major life insurer or bankruptcy of a local government,that situation could change a great deal very quickly. In the data to date, however,our results provide little support for the Ricardian equivalence hypothesis underperhaps the most propitious conditions ever seen for it to hold: a rapid and largeincrease in public debt contemporaneous with a widely publicized projection ofdemographic dangers to social security benefits, in an economy already prone tohigh rates of saving.
5. DYSFUNCTIONAL SAVERS AND FUNCTIONAL FISCAL POLICY
Our examination of the effects of fiscal policy in Japan in the 1990s has takenus on what seems to be a tour of macroeconomics’ past: when economies wereclosed, savers were myopic, and consequently fiscal stabilization was effective.Thus, Japan’s experience would appear to offer evidence that one can join Balland Mankiw (1995) and Buiter and Kletzer (1992) in asking, “Who’s afraid ofthe public debt?,” at least in the short-term. If this is indeed the case, the shortterm can be separated from the long term: responsible stabilization policy today tomaximize growth today is not harmful and indeed is perhaps the optimal responseto long-run sustainability issues.39
Alternatively, given the dependence of tax revenues upon economic growth,restrictions on expenditure or even tax increases could backfire. On our estimates,were the Japanese government to maintain a limit on debt issuance in the face of agrowth shortfall, the fiscal contraction necessary to maintain a steady budget deficitwould have a sizable negative impact on growth and therefore on fiscal position. Asa numerical example, we considered the case where there was a shock of −1.5% toGDP, meant to capture the larger end of differences seen between official Japanesegovernment growth forecasts and actual growth outcomes. In such a case, the directfour-year cumulative effect on GDP in our model is −2.3%. This leads to a within
38 See Asher and Smithers (1998) and Asher and Dugger (2000) for lengthy descriptions of thesemounting contingent claims on the Japanese government, as well as Kotlikoff and Leibfritz (1998) fora generational accounting assessment of Japan’s demographic imbalances.
39 Interestingly, Thomas Byrne, the senior credit officer at Moody’s credit rating agency responsiblefor Japan, recently advised the Japanese government in a manner consistent with this analysis (ratherthan demanding immediate contraction): “Japan can’t consolidate its way out of this [debt problem],it has to grow its way out. . . . A fiscal policy that didn’t include a lot of wasteful spending may presentnear-term anxiety but, if it really did stimulate growth, it would be good over the long term.” Quotedin Pilling (2002).
FISCAL POLICY EFFECTIVENESS IN JAPAN 555
year decline of 1.3% of total tax revenues, which expands the budget deficit byroughly 0.3% of GDP. Using our multipliers, if taxes were raised to make up therevenue shortfall, GDP would decline an additional 0.9% cumulative over fouryears; if public works were cut to make up the revenue shortfall (and maintainlevel debt issuance), GDP would decline an additional 0.7% cumulative over fouryears.
Yet this is a very discomforting place to end up as economists even if it mightbe pleasing to policymakers. We are all familiar with the real-world example ofMundell–Fleming in France in 1980–1981, where Francois Mitterand tried “so-cialism in one country” with fiscal expansion that was almost completely reversedby rising interest rates, an appreciation of the franc, and capital inflows. Of course,France was and is more globally integrated than Japan, but it is not as thoughFrench households circa 1981 were significantly more likely to move their savingsabroad than Japanese households circa 1999—and certainly from the point of viewof regulatory and product options, if not mores, Japanese savers today have an eas-ier time of moving money than their French counterparts of 20 years earlier did.In addition, French savers then had far less prospect than Japanese savers do nowthat their government might be forced to renege upon social security commitmentsor to confiscate savings in some manner.
Currently, the around $10 trillion in Japanese national private savings (as com-pared to a $4.5 trillion GDP) reside almost solely domestically—and almost 50%of that total is kept in savings accounts of one form or another. These accountsearn well under 1% interest annually; when the much higher yielding $1.5 trillionin CD-equivalents in the postal savings system came due in 2000–2001, most ofthem were rolled over into similarly low yielding accounts there rather than sentout to pursue new higher-yielding investment opportunities. Merrill Lynch andCharles Schwab contracted or closed their Japanese consumer operations, whichwere built on the expectation that some of this rollover money would roll their way,only to be disappointed. Clearly there is an absence of intermediation or at least ofarbitrage taking place of the pool of Japanese savings. Meanwhile, there are nowover $6.5 trillion in Japanese government bonds (JGBs) outstanding versus under$3 trillion a decade ago, and real interest rates are around only 100 basis pointshigher on JGBs on average. So captive savings do translate into fiscal power.
The institutional and cultural factors explaining such vast and costly risk aver-sion and home bias are beyond the scope of this paper, but it is interesting tocontemplate the macroeconomic consequences of this apparent bias, or of its dis-appearance. To understand these consequences, consider the thought experimentin which one morning a significant fraction (say 20%) of bank savings accountholders in Japan woke up and decided to reallocate their portfolios towards higher-yielding assets. With no domestic assets paying an attractive rate of return, thiswould mean a significant flow of savings ($1 trillion in our example) out of yen-denominated assets and into assets denominated in foreign currencies. What wouldbe the consequences of such a massive reallocation?

556 KUTTNER AND POSEN
For the banks, at least on the first go around, this would make little difference:since they hold a large share of JGBs in their portfolios, the outflow of depositscan be accommodated by simply selling off some of those JGBs. The only costwould be from the loss of the (tiny) spread between the rate earned on JGBs andthe rate paid on deposits, and because JGBs have a zero risk weighting, the shiftwould leave banks’ Basle capital ratios unchanged.
But what happens to the $1 trillion worth of JGBs sold off by the banks? Thisis the point at which monetary policy comes into play. Absent any response by theBank of Japan, the shift out of yen-denominated assets would drive up domesticinterest rates: specifically, a higher interest rate would be required to find buyersfor the freed-up JGBs on the international market (or alternatively on a morecompetitive domestic market). Their interest rates would tend to rise toward thelevel of comparable assets, such as U.S. Treasury securities. (Of course, the outflowof capital from Japan would in part reduce interest rates in global markets, but thiseffect would be small relative to the increase in Japanese rates.) Another effect ofthe shift out of yen-denominated assets would be a depreciation in the yen, whichgoes hand-in-hand with the increase in the capital account deficit (which implies anincrease in the current account surplus). Thus, an increase in Japanese savers’ tastefor foreign assets would be something of a mixed blessing for aggregate demand,with higher interest rates offset by a weaker currency. Higher interest rates wouldexacerbate the fiscal sustainability problem, however.
An active response on the part of the Bank of Japan would significantly alterthis scenario. Faced with Japanese savers’ abandonment of the JGB market, andthe prospect of rising longer-term interest rates, the Bank of Japan could respondwith stepped-up purchases of JGBs—essentially monetizing the government’s out-standing debt. This would tend to keep nominal interest rates low, assuming noperfect Fisher effect, and there is no evidence in Japan (or elsewhere) for such aneffect. Furthermore, by increasing inflationary expectations, a monetary expansionwould in principle decrease real rates and lead to a further fall in the value of theyen. In other words, this particular outcome might be just the right policy to combatthe current deflationary environment.
The reservoir of captive domestic savings has therefore been one factor con-tributing to the continued efficacy of traditional fiscal policy measures in Japan(sustainability concerns notwithstanding). Ironically, however, this same sourceof low-cost funds to finance the government deficits may have let policymakers“get off easy,” in the sense that it has allowed them to defer the sort of aggressiveactions needed to break the deflationary spiral and pull the economy out of itsprolonged recession.
REFERENCES
Asako, K., Ito, T., and Sakaumoto, K. (1991). The rise and fall of deficit in Japan, 1965–1990, J. Japan.Int. Econ. 5, 451–472.
FISCAL POLICY EFFECTIVENESS IN JAPAN 557
Asher, D. (2000). Japan’s financial Mt. Fuji: Threatening economic stability, mimeograph, AmericanEnterprise Institute.
Asher, D., and Dugger, R. (2000). “Could Japan’s Financial Mount Fuji Blow its Top?” MIT–Japan Project Working Paper 00-01. Massachusetts Institute of Technology (web.mit.edu/mit-japan/Products/wp00-01.html).
Asher, D., and Smithers, A. (1998). “Japan’s Key Challenges for the 21st Century: Debt, Deflation,Default, Demography and Deregulation, SAIS Policy Forum Series,” Johns Hopkins School forAdvanced International Studies.
Balassa, B., and Noland, M. (1988). “Japan in the World Economy,” Institute for International Eco-nomics, Washington DC.
Ball, L., and Mankiw, N. G. (1995). What do budget deficits do? in “Budget Deficits and Debt: Issuesand Option. A Symposium Sponsored by the Federal Reserve Bank of Kansas City,” Federal ReserveBank of Kansas City, Kansas City.
Bayoumi, T. (1998). The Japanese fiscal system and fiscal transparency, in “Structural Change in Japan:Macroeconomic Impact and Policy Challenges” (B. Bijan, B. Aghevli, T. Bayoumi, and G. Meredith,Eds.), pp. 177–212, International Monetary Fund, Washington DC.
Bayoumi, T. (2001). The morning after: Explaining the slowdown in Japanese growth in the 1990s,J. Int. Econ. 53, 241–259.
Bergsten, C. F., Ito, T., and Noland, M. (2001). “No More Bashing: Building a New Japan-UnitedStates Economic Relationship,” Institute for International Economics, Washington DC.
Blanchard, O., and Perotti, R. (1999). “An Empirical Characterization of the Dynamic Effects ofChanges in Government Spending and Taxes on Output,” Working Paper 7269, National Bureau ofEconomic Research.
Buiter, W., and Kletzer, K. (1992). Who’s afraid of the public debt? Amer. Econ. Rev. 82, 290–294.
Dawkins, W. (1996). Japan confirms sales tax increase. Financial Times, June 26, p. 6.
Doi, T. (2001). “Increase in Saving Rate and Precautionary Saving Motive in Japan.” ESRI DiscussionPaper Series No. 1. (www.esri.cao.go.jp/en/archive/e dis/abstract/001-e.html).
Faruqee, H., and Muhleisen, M. (2001). “Japan: Demographic Shock and Fiscal Sustainability,” Work-ing Paper 01/40, International Monetary Fund.
Fischer, S. (2001). Discussion of The Great Recession: Lessons for macroeconomic policy from Japan,Brookings Pap. Econ. Act. 2, 161–166.
Giorno, C., Richardson, P., Roseveare, D., and van den Noord, P. (1995). “Estimating Potential Output,Output Gaps, and Structural Budget Balances,” Working Paper 152, Organisation for EconomicCooperation and Development.
Ihori, T., Doi, T., and Kondo, H. (2001). Japanese fiscal reform: fiscal reconstruction and fiscal policy,Japan World Econ. 13, 351–370.
Hamilton, J. (1994). “Time Series Analysis,” Princeton University Press, Princeton.
Holley, D. (1994). Japan approves a tax cut plan: U.S. lukewarm. Los Angeles Times, November 26,p. 13.
Hori, M., and Takahashi, T. (2001). “The Value of Bank Relationships: A Study on the HokkaidoTakusyoku Bank’s Failure,” Discussion Paper Series No. 4, Economic and Social Research Institute.[In Japanese].
Horioka, C. (1990). Why is Japan’s household saving rate so high? A literature survey, J. Japan. Int.Econ. 13, 49–92.
Horioka, C. (1991). The determinants of Japan’s saving rate: The impact of the age structure of thepopulation and other factors, Econ. Stud. Quart. 42, 237–253.
Horioka, C. (1993). Saving in Japan, in “World Savings: An International Survey” (A. Heetje, Ed.),pp. 238–278, Blackwell, Oxford.
558 KUTTNER AND POSEN
Horioka, C. (1995). Is Japan’s household saving rate really high? Rev. Income Wealth 41, 373–397.
Horioka, C. (1997). A cointegration analysis of the impact of the age structure of the population on thehousehold saving rate in Japan, Rev. Econ. Statist. 79, 511–516.
Horioka, C., and Watanabe, W. (1997). Why do people save? A micro-analysis of motives for householdsaving in Japan, Econ. J. 107, 537–552.
Horioka, C., Kasuga, N., Yamazaki, K., and Watanabe, W. (1996). “Do the aged dissave in Japan?Evidence from micro data,” J. Japan. Int. Econ. 10, 295–311, doi:10.1006/jjie.1996.0016.
Hutchison, M. (1992). “Budget Policy and the Decline of National Saving Revisited,” EconomicPaper 33, Bank for International Settlements.
International Monetary Fund (2000). “Japan: Selected Issues,” IMF Staff Country Report 00/144,International Monetary Fund, Washington DC.
Ishi, H. (2000). “Making Fiscal Policy in Japan: Economic Effects and Institutional Settings,” OxfordUniversity Press, Oxford.
Kotlikoff, L., and Leibfritz, W. (1998). “An International Comparison of Generational Accounts,”Working Paper 6447, National Bureau of Economic Research.
Kuttner, K., and Posen, A. (2001). The Great Recession: Lessons for macroeconomic policy fromJapan, Brookings Pap. Econ. Act. 2, 93–160.
Meltzer, A. (1998). “Time for Japan to Print Money,” American Enterprise Institute Policy Brief,American Enterprise Institute, Washington DC.
Organisation for Economic Co-operation and Development (OECD). (1998). “OECD EconomicSurveys: Japan,” Organisation for Economic Co-operation and Development, Paris.
Organisation for Economic Co-operation and Development (OECD). (1999). “OECD EconomicSurveys: Japan,” Organisation for Economic Co-operation and Development, Paris.
Organisation for Economic Co-operation and Development (OECD). (2000). “OECD EconomicSurveys: Japan,” Organisation for Economic Co-operation and Development, Paris.
Perri, F. (1999). “The Role of Fiscal Policy in Japan: A Quantitative Study,” Working Paper 99-16,Leonard N. Stern School of Business.
Pilling, D. (2002). Japan braced for a rating downgrade as economy dips, Financial Times March 9,p. 4.
Posen, A. (1998). “Restoring Japan’s Economic Growth,” Institute for International Economics,Washington DC.
Ramaswamy, R., and Rendu, C. (2000). Identifying the shocks: Japan’s economic performance in the1990s, in “Post-Bubble Blues: How Japan Responded to Asset Price Collapse” (T. Bayoumi andC. Collyns, Eds.), International Monetary Fund, Washington DC.
Sakakibara, E. (1999). “Revitalization of the Japanese Economy and the Future of Asia,” OccasionalPaper 6, Institute for International Monetary Affairs.
Schick, A. (1996). “Fiscal Externalities in U.S. and Japanese budget policies,” Maryland/TsukubaPapers on US-Japan Relations.
Smithers, A. (1999). “Government Debt and the Yen,” Report 135, Andrew Smithers & Co.
Tax Bureau. (2000). “An Outline of Japanese Taxes: 2000 Edition,” Ministry of Finance, Tokyo.
Watanabe, K., Watanabe, T., and Watanabe, T. (2001). Tax policy and consumer spending: Evidencefrom Japanese fiscal experiments, J. Int. Econ. 53, 261–281.


![Fiscal Policy Effectiveness and Inequality: … · NIPFP Working paper series Fiscal Policy Effectiveness and Inequality: )J½GEG]SJ+IRHIV&YHKIXMRKMR%WME4EGM½G No. 224 March 08,](https://img.pdfslide.us/doc/110x75/5b83c7b97f8b9adc698dd37c/fiscal-policy-effectiveness-and-inequality-nipfp-working-paper-series-fiscal.jpg)