Embed Size (px)
Citation preview

8/8/2019 Japan Fiscal Condition - FY2011
http://slidepdf.com/reader/full/japan-fiscal-condition-fy2011 1/15
Japan's Fiscal Condition
December 2010
Ministry of Finance
Provisional translation
8/8/2019 Japan Fiscal Condition - FY2011
http://slidepdf.com/reader/full/japan-fiscal-condition-fy2011 2/15
Table of Contents
(1) Fiscal Condition・・・・・・・・・・・・・・・・・・・・・・・・・・・・・・・・・・・・・・・・・・・・・・・・・・・・・・・・・・・・・・・・ 1
(2) Trends in General Account Tax Revenues, Total Expenditures and Government Bond Issues・・ 2
(3) Government Bond Issues and Bond Dependency Ratio・・・・・・・・・・・・・・・・・・・・・・・・・・・・・・・・・ 3
(4) Accumulated Government Bonds Outstanding・・・・・・・・・・・・・・・・・・・・・・・・・・・・・・・・・・・・・・・・ 4
(5) Long-Term Debt Outstanding of Central and Local Governments・・・・・・・・・・・・・・・・・・・・ 5
(6) Trends in Interest Payments and Interest Rate・・・・・・・・・・・・・・・・・・・・・・・・・・・・・・・・・・・・・・・・・ 6
(7) Ratio of Major Expenditure Items in the General Account・・・・・・・・・・・・・・・・・・・・・・・・・・・・・・・ 7
(8) Trends of Major Expenditures in the General Account・・・・・・・・・・・・・・・・・・・・・・・・・・・・・・・・・・ 8
(9) General Account Revenues・・・・・・・・・・・・・・・・・・・・・・・・・・・・・・・・・・・・・・・・・・・・・・・・・・・・・・・ 9
(10) General Account Expenditure ・・・・・・・・・・・・・・・・・・・・・・・・・・・・・・・・・・・・・・・・・・・・・・・・・・・ 10
(Reference 1) General Government Financial Balances (International Comparison)・・・・・・・・・・・・・・・・ 11
(Reference 2) General Government Gross Debt (International Comparison)・・・・・・・・・・・・・・・・・・・・・ 12
(Reference 3) General Government Net Debt (International Comparison)・・・・・・・・・・・・・・・・・・・・・・・ 13
8/8/2019 Japan Fiscal Condition - FY2011
http://slidepdf.com/reader/full/japan-fiscal-condition-fy2011 3/15
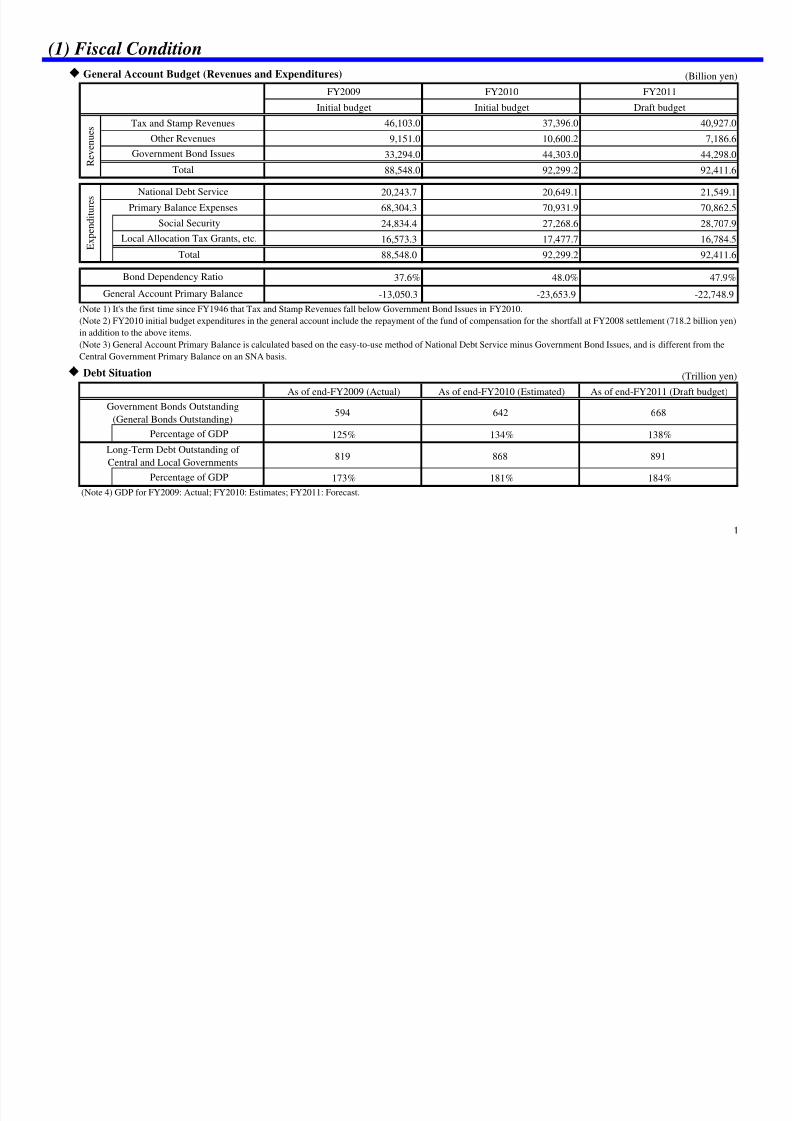
◆ General Account Budget (Revenues and Expenditures)
FY2009 FY2010 FY2011
Initial budget Initial budget Draft budget
46,103.0 37,396.0 40,927.0
9,151.0 10,600.2 7,186.6
33,294.0 44,303.0 44,298.0
88,548.0 92,299.2 92,411.6
20,243.7 20,649.1 21,549.168,304.3 70,931.9 70,862.5
24,834.4 27,268.6 28,707.9
16,573.3 17,477.7 16,784.5
88,548.0 92,299.2 92,411.6
37.6% 48.0% 47.9%
-13,050.3 -23,653.9 -22,748.9
◆ Debt Situation
As of end-FY2009 (Actual) As of end-FY2010 (Estimated) As of end-FY2011 (Draft budget)
594 642 668
125% 134% 138%
819 868 891
173% 181% 184%Percentage of GDP
Percentage of GDP
Long-Term Debt Outstanding of
Central and Local Governments
Bond Dependency Ratio
Government Bonds Outstanding
(General Bonds Outstanding)
General Account Primary Balance
E x p e n d i t u r e s
Local Allocation Tax Grants, etc.
Total
National Debt ServicePrimary Balance Expenses
Social Security
R e v e n u e s
Tax and Stamp Revenues
Other Revenues
Government Bond Issues
Total
(1) Fiscal Condition
(Note 1) It's the first time since FY1946 that Tax and Stamp Revenues fall below Government Bond Issues in FY2010.
(Note 2) FY2010 initial budget expenditures in the general account include the repayment of the fund of compensation for the shortfall at FY2008 settlement (718.2 billion yen)
in addition to the above items.
(Note 3) General Account Primary Balance is calculated based on the easy-to-use method of National Debt Service minus Government Bond Issues, and is different from the
Central Government Primary Balance on an SNA basis.
(Trillion yen)
(Note 4) GDP for FY2009: Actual; FY2010: Estimates; FY2011: Forecast.
(Billion yen)
1
8/8/2019 Japan Fiscal Condition - FY2011
http://slidepdf.com/reader/full/japan-fiscal-condition-fy2011 4/15
2.1 3.5 4.5 4.36.3 7.2 5.9 7.0 6.7 6.4 6.0 5.0
2.5 1.0 0.24.1 4.8
11.08.5
24.321.9 20.9
25.828.7
26.823.5
21.1 19.3
26.2
36.9 36.7 38.2
3.23.7
5.0 6.3
7.1 7.07.0
7.0 6.8 6.4 6.36.2
6.96.2 6.4 6.3 6.7
9.5
16.212.3
16.410.7
9.9
17.0
13.2
11.19.1
9.16.7 8.7
7.8
6.46.0
7.0
17.0
6.17.6
15.0
1.0
13.8 15.7
17.3
21.9 23.7
26.9 29.0
30.5 32.4
34.9
38.2
41.9
46.8
50.8
54.9
60.1 59.8
54.4 54.1
51.0 51.9 52.1
53.9
49.4 47.2
50.7
47.9
43.8 43.3 45.6
49.1 49.1 51.0
20.9
24.5
29.1
34.1
38.8
43.4 46.9
47.2
50.6 51.5 53.0 53.6
57.7
61.5
65.9
69.3 70.5 70.5
75.1 73.6
75.9
78.8 78.5
84.4
89.0 89.3
84.8 83.7
82.4
84.9 85.5
81.4 81.8
92.4
5.37.2
9.610.7
13.5
14.2
12.914.0
13.5 12.8 12.3 11.39.4
7.2 6.6 6.7
9.5
16.2 16.5
21.2 21.7
18.5
34.0
37.5
33.0
30.0
35.0 35.3 35.5
31.3
27.525.4
33.2
52.0
44.3 44.3
40.9
44.3
38.7 39.6
84.7
96.7
101.0
7.3
0
20
40
60
80
100
120
75 76 77 78 79 80 81 82 83 84 85 86 87 88 89 90 91 92 93 94 95 96 97 98 99 00 01 02 03 04 05 06 07 08 09 10 11
(FY)
(Trillion yen)
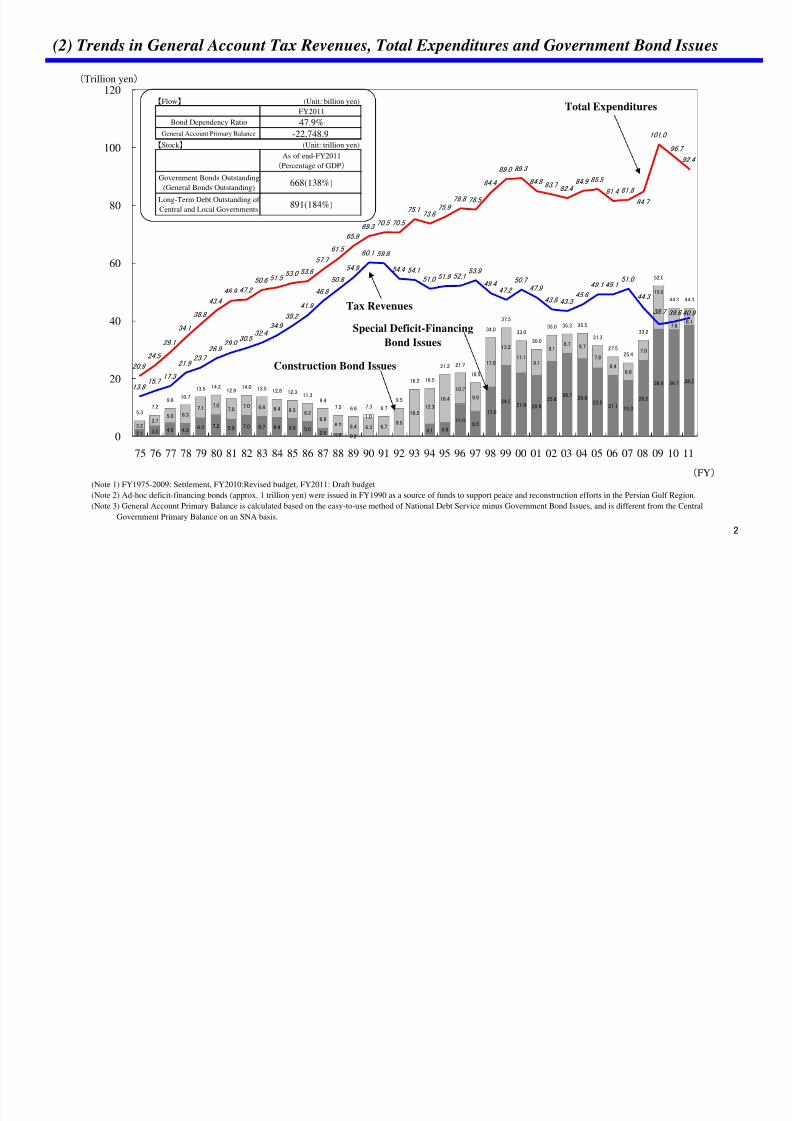
Total Expenditures
Tax Revenues
Construction Bond Issues
Special Deficit-Financing
Bond Issues
(Note 1) FY1975-2009: Settlement, FY2010:Revised budget, FY2011: Draft budget(Note 2) Ad-hoc deficit-financing bonds (approx. 1 trillion yen) were issued in FY1990 as a source of funds to support peace and reconstruction efforts in the Persian Gulf Region.
(Note 3) General Account Primary Balance is calculated based on the easy-to-use method of National Debt Service minus Government Bond Issues, and is different from the Central
Government Primary Balance on an SNA basis.
(2) Trends in General Account Tax Revenues, Total Expenditures and Government Bond Issues
【Flow】 (Unit: billion yen)
【Stock 】 (Unit: trillion yen)
FY2011
Bond Dependency Ratio 47.9%General Account Primary Balance -22,748.9
As of end-FY2011
(Percentage of GDP)
Government Bonds Outstanding
(General Bonds Outstanding)668(138%)
Long-Term Debt Outstanding of
Central and Local Governments891(184%)
2

8/8/2019 Japan Fiscal Condition - FY2011
http://slidepdf.com/reader/full/japan-fiscal-condition-fy2011 5/15
2.13.5 4.5 4.3
6.3 7.25.9
7.0 6.7 6.4 6.0 5.02.5
1.0
4.1 4.8
11.08.5
24.3
21.9 20.9
25.828.7
36.738.2
3.2
3.7
5.0 6.3
7.1 7.07.0
7.0 6.8 6.4 6.36.2
6.9
6.26.4 6.3 6.7
9.5
16.2
12.3
16.4
10.7
9.9
17.0
13.2
11.19.1
9.1
6.78.7
7.8
6.4
6.0
7.0
15.0
7.66.1
17.0
36.9
26.2
21.1
26.8
23.5
19.3
0.2
1.0
32.6
26.6
24.8
23.2
21.0
47.9 45.8
16.3
25.3
32.9
31.3
34.7
39.2
31.0
41.8 41.8
42.9
36.9
23.5
27.6 28.0
11.6
10.1 10.6
9.5
13.5
21.5
22.4
40.3
35.4
36.6
33.7
27.5
29.7
42.1
51.5
29.4
5.3
7.29.6
10.7
13.514.2
12.914.0 13.5
12.8 12.311.3
9.4
7.2 6.6 6.7
9.5
16.2 16.5
21.2 21.7
18.5
37.5
33.0
30.0
35.0
33.2
44.344.3
34.0
52.0
25.4
31.3
35.3 35.5
27.5
7.3
0
10
20
30
40
50
60
75 76 77 78 79 80 81 82 83 84 85 86 87 88 89 90 91 92 93 94 95 96 97 98 99 00 01 02 03 04 05 06 07 08 09 10 11
(FY)
(Trillion yen)
0
10
20
30
40
50
60
(%)
Ad-Hoc Deficit-Financing Bonds
Construction Bonds
Special Deficit-Financing Bonds
(3) Government Bond Issues and Bond Dependency Ratio
(Note) FY1975-2009: Settlement, FY2010: Revised budget, FY2011: Draft budget
Bond Dependency Ratio (right axis)
Government Bond Issues (left axis)
3

8/8/2019 Japan Fiscal Condition - FY2011
http://slidepdf.com/reader/full/japan-fiscal-condition-fy2011 6/15
28 3340 47 53 59 64 65 65 64 65 64 63 61 64 67
77 83
108134
158
176
199
231
258
280288
305321
356
394
421
2835
4249
5663
69 75
81 87 91 97 102 108116
131142
158
168175
187
197
209
216
222
226
241
247 243237 225
238
248
247
1052
15 211317 220 1 2 2 2 3 4 6 8 10 1522
3243
5671
82
110122
134145 152 157 161 166 172
178193
207
225
245258
295
332
368
392
421
457
499
527 532541 546
594
642
668
96
0
50
100
150
200
250
300
350
400
450
500
550
600
650
700
65 66 67 68 69 70 71 72 73 74 75 76 77 78 79 80 81 82 83 84 85 86 87 88 89 90 91 92 93 94 95 96 97 98 99 00 01 02 03 04 05 06 07 08 09 10 11
(As of the end of the FY)
(Trillion yen)
(4) Accumulated Government Bonds Outstanding
(Note 1) FY1965-2009: Actual, FY2010: Estimates, FY2011: Draft budget
(Note 2) Special deficit-financing bonds outstanding include refunding bonds for long-term debts transferred from JNR Settlement Corporation, the National Forest Service, etc.
(Note 3) The estimate of FY2011 excluding front-loading issuance of refunding bonds is approximately 656 trillion yen.
Special Deficit-Financing Bonds
Construction Bonds
Equivalent to approx. 16 years of General Account Tax Revenues
Tax Revenues in FY2011 General Account Budget: Approx. \41 trillion
FY2011 Government Bonds Outstanding
Approx. \668 trillion (projection)
↓
Approx. \5.24 million per person
Approx. \20.94 million per family of 4
Average disposable income of a working family
Approx. \5.13 million
(Average family size: 3.43)
(Note) Disposable income and family size are based on the
"FY2009 Survey of Household Economy" by the Ministry of
Internal Affairs and Communications
For reference
4
8/8/2019 Japan Fiscal Condition - FY2011
http://slidepdf.com/reader/full/japan-fiscal-condition-fy2011 7/15
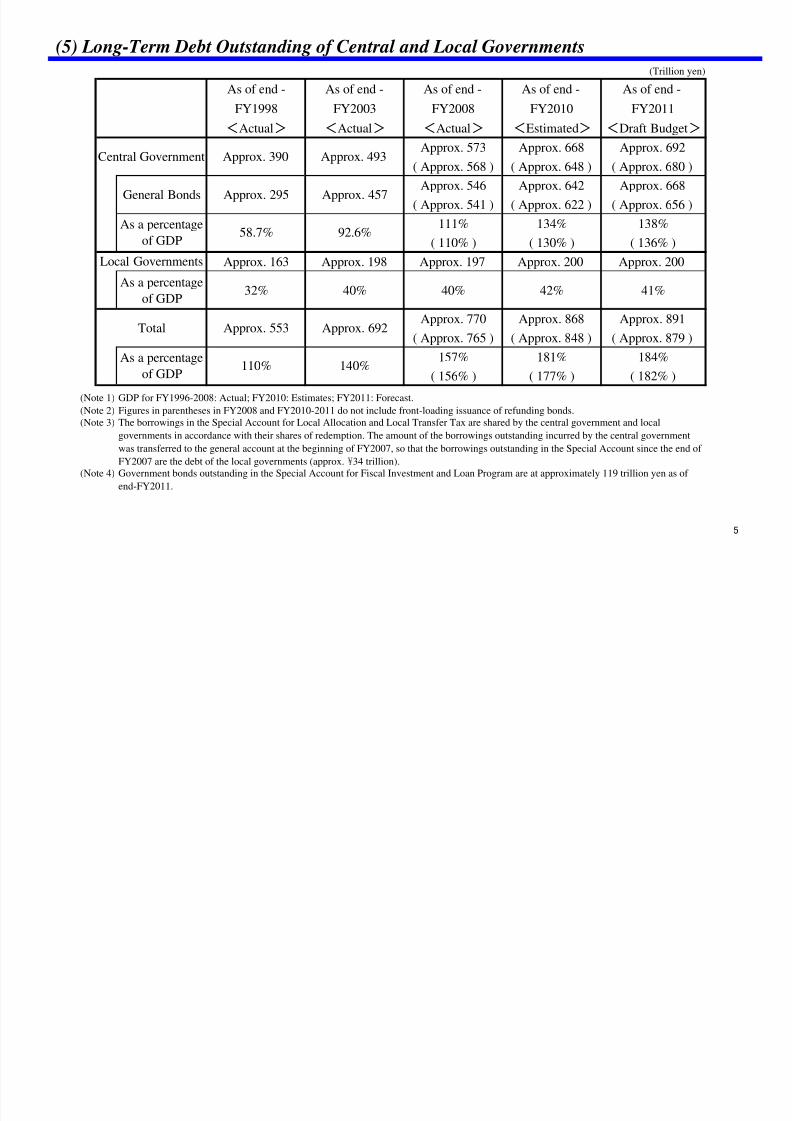
As of end - As of end - As of end - As of end - As of end -
FY1998 FY2003 FY2008 FY2010 FY2011
<Actual> <Actual> <Actual> <Estimated> <Draft Budget>
Approx. 573 Approx. 668 Approx. 692
( Approx. 568 ) ( Approx. 648 ) ( Approx. 680 )
Approx. 546 Approx. 642 Approx. 668
( Approx. 541 ) ( Approx. 622 ) ( Approx. 656 )
111% 134% 138%
( 110% ) ( 130% ) ( 136% )
Approx. 163 Approx. 198 Approx. 197 Approx. 200 Approx. 200
As a percentage
of GDP 32% 40% 40% 42% 41%
Approx. 770 Approx. 868 Approx. 891
( Approx. 765 ) ( Approx. 848 ) ( Approx. 879 )
157% 181% 184%
( 156% ) ( 177% ) ( 182% )
(Note 1)
(Note 2)
(Note 3)
(Note 4)
Approx. 457Approx. 295
Approx. 692Approx. 553
92.6%58.7%
Figures in parentheses in FY2008 and FY2010-2011 do not include front-loading issuance of refunding bonds.
The borrowings in the Special Account for Local Allocation and Local Transfer Tax are shared by the central government and local
governments in accordance with their shares of redemption. The amount of the borrowings outstanding incurred by the central government
was transferred to the general account at the beginning of FY2007, so that the borrowings outstanding in the Special Account since the end of
FY2007 are the debt of the local governments (approx. \34 trillion).
Government bonds outstanding in the Special Account for Fiscal Investment and Loan Program are at approximately 119 trillion yen as of
end-FY2011.
As a percentage
of GDP110% 140%
GDP for FY1996-2008: Actual; FY2010: Estimates; FY2011: Forecast.
Local Governments
Total
General Bonds
As a percentage
of GDP
Central Government Approx. 390 Approx. 493
(5) Long-Term Debt Outstanding of Central and Local Governments
(Trillion yen)
5

8/8/2019 Japan Fiscal Condition - FY2011
http://slidepdf.com/reader/full/japan-fiscal-condition-fy2011 8/15
22 32 4356
7182
110122
134145152157
161166172178
193207
225
245
332
368
392
421
457
499
527532541546
594
642
668
295
96
15
258
0.81.3
1.92.6 3.3
4.4
5.6
6.6
7.7
8.7
9.7 10.2 10.5
10.8 10.8 10.7 10.710.610.8
8.6
7.88.5
9.9
9.410.0
10.5
10.710.611.0
10.610.4
7.67.47.37.0 7.0
7.7
1.4
4.0
1.4
1.7
2.0
2.3
2.7
3.1
3.5 4.3
4.6
5.1
5.4
5.8
6.1 6.1 6.2 6.3
6.5
6.8
7.2 7.4
7.5 7.6 7.5 7.4
7.2 7.1
7.4 7.4
1.5 1.4 1.4
7.6
1.4
75 76 77 78 79 80 81 82 83 84 85 86 87 88 89 90 91 92 93 94 95 96 97 98 99 00 01 02 03 04 05 06 07 08 09 10 11
(FY)
(Trillion yen)
0
100
200
300
400
500
600
700
800
(Trillion yen)
10% 25
8% 20
6% 15
4% 10
2% 5
0% 0
(6) Trends in Interest Payments and Interest Rate
Interest payments (left scale)
Government bonds
outstanding (right scale)
Interest rate (left scale)
FY2011 Interest Payments in the General
AccountApprox. \9.9 trillion
Approx. \27.2 billion per day
Approx. \1.1 billion per hour
Approx. \18.88 million per minute
(Note 1) Interest Payments for FY1975-2009: Settlement; FY2010: Revised budget; FY2011: Draft budget.
(Note 2) Government bonds outstanding for FY1975-2009: Actual; FY2010: Estimates; FY2011: Draft budget.
6
8/8/2019 Japan Fiscal Condition - FY2011
http://slidepdf.com/reader/full/japan-fiscal-condition-fy2011 9/15
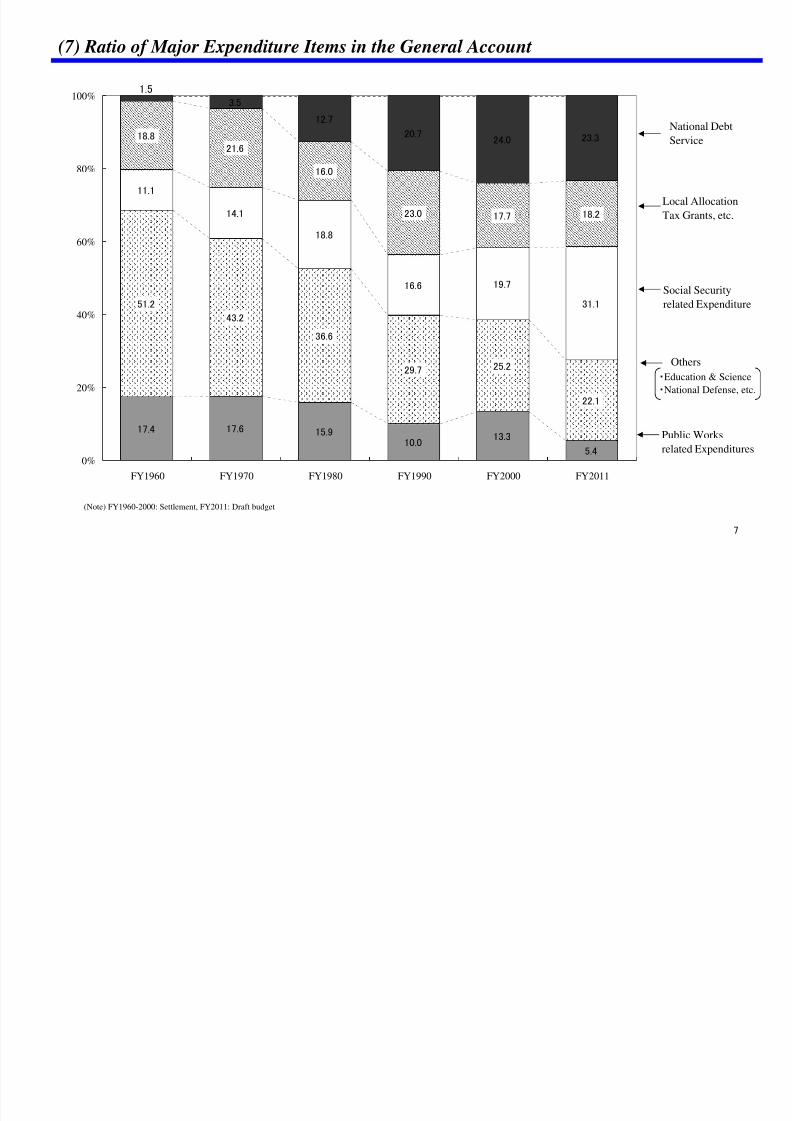
17.4 17.6 15.910.0
13.3
5.4
51.2
43.2
36.6
29.7 25.2
22.1
11.1
14.1
18.8
16.6 19.7
31.1
18.8
21.6
16.0
23.0 17.7 18.2
3.5
12.7
20.724.0 23.3
1.5
0%
20%
40%
60%
80%
100%
FY1960 FY1970 FY1980 FY1990 FY2000 FY2011
(7) Ratio of Major Expenditure Items in the General Account
(Note) FY1960-2000: Settlement, FY2011: Draft budget
National Debt
Service
Local Allocation
Tax Grants, etc.
Social Securityrelated Expenditure
Others
Public Works
related Expenditures
・Education & Science
・National Defense, etc.
7
8/8/2019 Japan Fiscal Condition - FY2011
http://slidepdf.com/reader/full/japan-fiscal-condition-fy2011 10/15
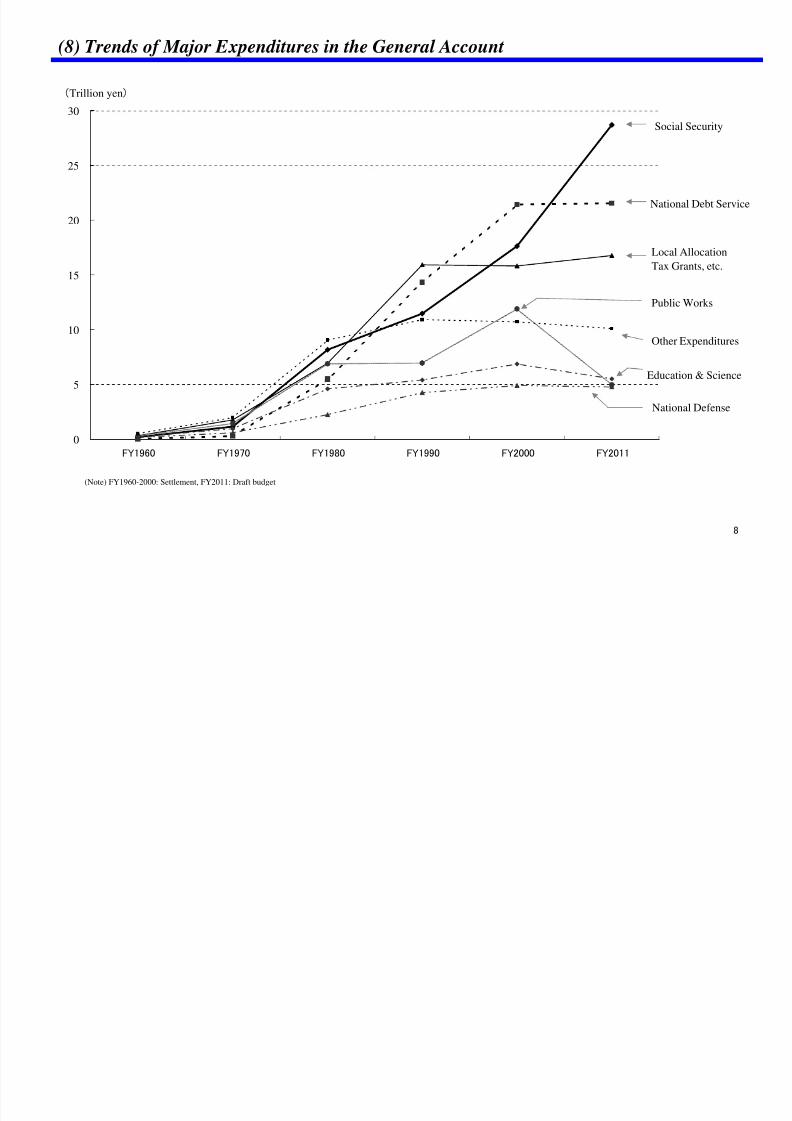
0
5
10
15
20
25
30
FY1960 FY1970 FY1980 FY1990 FY2000 FY2011
(Trillion yen)
(8) Trends of Major Expenditures in the General Account
(Note) FY1960-2000: Settlement, FY2011: Draft budget
Education & Science
National Defense
Public Works
Other Expenditures
Local Allocation
Tax Grants, etc.
National Debt Service
Social Security
8
8/8/2019 Japan Fiscal Condition - FY2011
http://slidepdf.com/reader/full/japan-fiscal-condition-fy2011 11/15

8/8/2019 Japan Fiscal Condition - FY2011
http://slidepdf.com/reader/full/japan-fiscal-condition-fy2011 12/15
8/8/2019 Japan Fiscal Condition - FY2011
http://slidepdf.com/reader/full/japan-fiscal-condition-fy2011 13/15
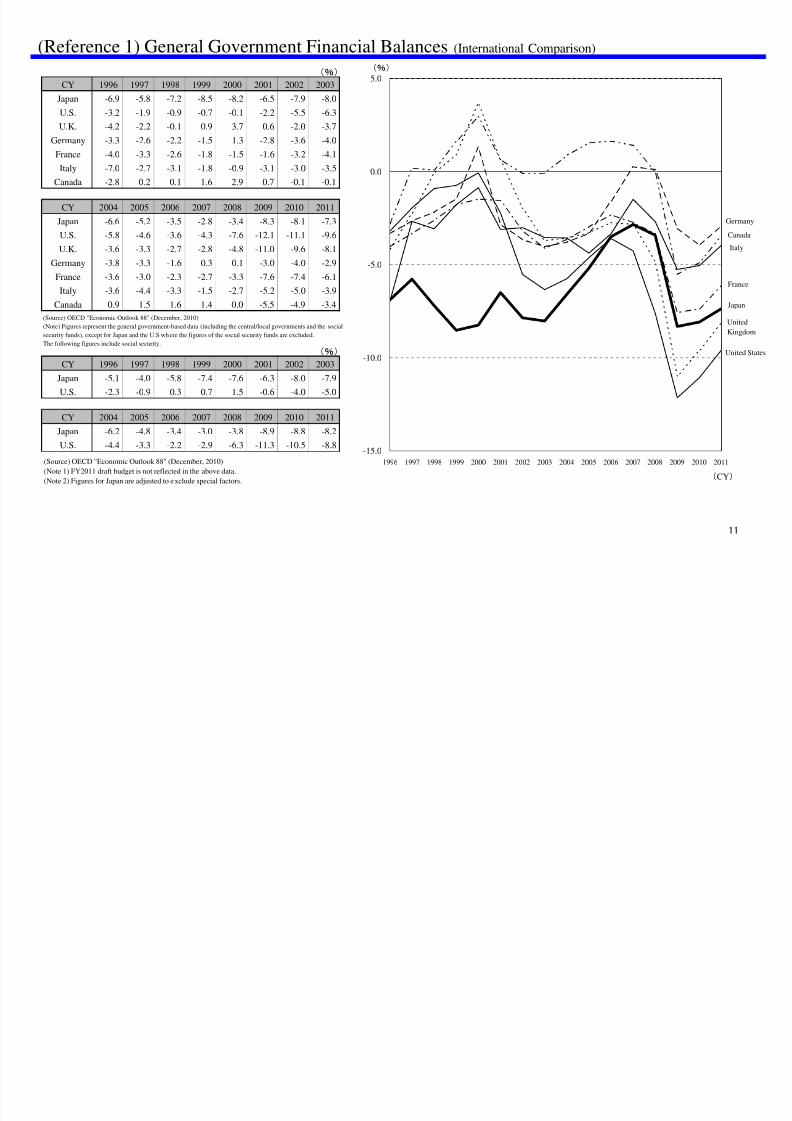
(%)
CY 1996 1997 1998 1999 2000 2001 2002 2003
Japan -6.9 -5.8 -7.2 -8.5 -8.2 -6.5 -7.9 -8.0U.S. -3.2 -1.9 -0.9 -0.7 -0.1 -2.2 -5.5 -6.3
U.K. -4.2 -2.2 -0.1 0.9 3.7 0.6 -2.0 -3.7
Germany -3.3 -2.6 -2.2 -1.5 1.3 -2.8 -3.6 -4.0
France -4.0 -3.3 -2.6 -1.8 -1.5 -1.6 -3.2 -4.1
Italy -7.0 -2.7 -3.1 -1.8 -0.9 -3.1 -3.0 -3.5
Canada -2.8 0.2 0.1 1.6 2.9 0.7 -0.1 -0.1
CY 2004 2005 2006 2007 2008 2009 2010 2011
Japan -6.6 -5.2 -3.5 -2.8 -3.4 -8.3 -8.1 -7.3
U.S. -5.8 -4.6 -3.6 -4.3 -7.6 -12.1 -11.1 -9.6
U.K. -3.6 -3.3 -2.7 -2.8 -4.8 -11.0 -9.6 -8.1
Germany -3.8 -3.3 -1.6 0.3 0.1 -3.0 -4.0 -2.9
France -3.6 -3.0 -2.3 -2.7 -3.3 -7.6 -7.4 -6.1
Italy -3.6 -4.4 -3.3 -1.5 -2.7 -5.2 -5.0 -3.9Canada 0.9 1.5 1.6 1.4 0.0 -5.5 -4.9 -3.4
(%)
CY 1996 1997 1998 1999 2000 2001 2002 2003
Japan -5.1 -4.0 -5.8 -7.4 -7.6 -6.3 -8.0 -7.9
U.S. -2.3 -0.9 0.3 0.7 1.5 -0.6 -4.0 -5.0
CY 2004 2005 2006 2007 2008 2009 2010 2011
Japan -6.2 -4.8 -3.4 -3.0 -3.8 -8.9 -8.8 -8.2
U.S. -4.4 -3.3 -2.2 -2.9 -6.3 -11.3 -10.5 -8.8-15.0
-10.0
-5.0
0.0
5.0
1996 1997 1998 1999 2000 2001 2002 2003 2004 2005 2006 2007 2008 2009 2010 2011
(CY)
(%)
(Source) OECD "Economic Outlook 88" (December, 2010)
(Note 1) FY2011 draft budget is not reflected in the above data.
(Note 2) Figures for Japan are adjusted to exclude special factors.
(Reference 1) General Government Financial Balances (International Comparison)
Japan
France
United States
Canada
United
Kingdom
Germany
Italy
(Source) OECD "Economic Outlook 88" (December, 2010)
(Note) Figures represent the general government-based data (including the central/local governments and the social
security funds), except for Japan and the U.S where the figures of the social security funds are excluded.
The following figures include social security.
11

8/8/2019 Japan Fiscal Condition - FY2011
http://slidepdf.com/reader/full/japan-fiscal-condition-fy2011 14/15
(%)
CY 1996 1997 1998 1999 2000 2001 2002 2003
Japan 93.8 100.5 113.2 127.1 135.4 143.7 152.3 158.0U.S. 69.9 67.4 64.2 60.5 54.5 54.4 56.8 60.2
U.K. 51.2 52.0 52.5 47.4 45.1 40.4 40.8 41.5
Germany 58.8 60.3 62.2 61.5 60.4 59.8 62.2 65.4
France 66.3 68.8 70.3 66.8 65.6 64.3 67.3 71.4
Italy 128.9 130.3 132.6 126.4 121.6 120.8 119.4 116.8
Canada 101.7 96.3 95.2 91.4 82.1 82.7 80.6 76.6
CY 2004 2005 2006 2007 2008 2009 2010 2011
Japan 165.5 175.3 172.2 167.1 173.9 192.8 198.4 204.2
U.S. 61.2 61.4 60.9 62.0 71.1 84.4 92.8 98.5
U.K. 43.8 46.4 46.1 47.2 57.0 72.4 81.3 88.6
Germany 68.8 71.2 69.3 65.3 69.4 76.5 79.9 81.3
France 73.9 75.7 70.9 70.0 75.9 87.1 92.4 97.1
Italy 117.3 119.9 117.2 112.7 115.1 127.7 131.3 132.7Canada 72.6 71.6 70.3 66.5 71.3 83.4 84.4 85.5
0
30
60
90
120
150
180
210
1996 1997 1998 1999 2000 2001 2002 2003 2004 2005 2006 2007 2008 2009 2010 2011
(CY)
(%)
(Reference 2) General Government Gross Debt (International Comparison)
(Source) OECD "Economic Outlook 88" (December, 2010)
(Note 1) Figures represent the general government-based data (including the central/local
governments and the social security funds).
(Note 2) FY2010 draft budget is not reflected in the above data.
Japan
Italy
FranceUnited States
Germany
United KingdomCanada
12

8/8/2019 Japan Fiscal Condition - FY2011
http://slidepdf.com/reader/full/japan-fiscal-condition-fy2011 15/15
(%)
CY 1996 1997 1998 1999 2000 2001 2002 2003
Japan 29.2 34.8 46.2 53.8 60.4 66.3 72.6 76.5U.S. 51.9 48.8 44.9 40.2 35.3 34.6 37.2 40.5
U.K. 27.9 30.6 32.6 29.0 26.8 23.2 23.7 23.9
Germany 32.7 32.4 36.2 34.7 34.0 36.3 40.4 43.2
France 41.8 42.3 40.5 33.5 35.1 36.7 41.8 44.2
Italy 104.5 104.6 107.0 101.1 95.6 96.3 95.7 92.7
Canada 70.0 64.7 60.8 55.8 46.2 44.3 42.6 38.7
CY 2004 2005 2006 2007 2008 2009 2010 2011
Japan 82.7 84.6 84.3 81.5 94.9 108.2 114.0 120.4
U.S. 42.1 42.5 41.7 42.4 48.3 59.7 67.8 74.3
U.K. 25.9 27.1 27.5 28.5 33.0 43.8 51.3 57.6
Germany 47.2 49.5 47.5 42.2 44.0 48.5 50.5 51.6
France 45.3 43.2 37.2 33.8 43.4 50.8 57.1 61.8
Italy92.5 93.7 90.5 87.0 89.7 100.0 103.3 104.7
Canada 35.2 31.0 26.3 22.9 22.4 28.4 31.4 33.7
0
25
50
75
100
125
1996 1997 1998 1999 2000 2001 2002 2003 2004 2005 2006 2007 2008 2009 2010 2011
(CY)
(%)
(Reference 3) General Government Net Debt (International Comparison)
Japan
Italy
France
Canada
United Kingdom
Germany
United States
(Source) OECD "Economic Outlook 88" (December, 2010)
(Note 1) Figures represent the general government-based data (including the central/local
governments and the social security funds).
(Note 2) FY2010 draft budget is not reflected in the above data.
13