Embed Size (px)
Citation preview

FISCAL POLICIES FOR OIL AND GAS INDUSTRY IN INDONESIA
1
Fiscal Policy Office, Ministry of Finance of Republic of Indonesia
US ENERGY INVESTMENT ROUNTABLE Jakarta, 6‐7 FEBRUARY 2012

Outline

Recent Economic Development: Global and Indonesia
3

4
• Global Economic Growth 2012 getting slowdown.
o IMF has revised world economic growth forecasting for 2011 and 2012 to 3.8%
and 3,3%. While
OECD and World Bank Forecasting of 2012 is lower.
• United States Economy getting better in end year of 2011
o U.S. Unemployment level is decrease from 9% (Nov 2011)
to 8,6% (Dec
2011).
o U.S. Consumer Confidence Index has improved to the highest level
since April 2011. The index
increase from 55,2 (Nov 2011) to 64,5 (Dec
2011).
o U.S. Economic Growth both in 2011 dan 2012 is forecasted to 1,8% (IMF)
• European Union Economy still faces crisis risk.
o Some European countries have suffered debt downgrades and investor confidence. Austerity
budget pressures will slow economic growth.
o IMF
estimates that Europe growth in 2011
by 1,6% and would face a contraction 0,5% in 2012.
• Negative impact on Asian economies, particularly China, India, and Japan
o During 2011, China's trade surplus declined from U.S. $ 183 billion in 2010 to U.S. $ 160 billion.
o For the first time in 30 years, Japan announced a trade deficit.
In 2011, Japan's trade deficit
reached 2.49 trillion yen, or about U.S. $ 32 billion. Japanese imports increased 12% yoy while
exports declined 2.7% yoy.
o Growth of ASEAN‐5 in 2011 and 2012 respectively by 4.8% and 5.2%.
Global Economic

‐0,62
3,74
3,92
4,08
4,19
5,95
7,31
7,86
9,76
11,94
‐8,00 0,00 8,00 16,00
Amerika
Indonesia
Malaysia
Thailand
Singapura
Philipina
India
Korea
Inggris
Jepang
‐0,20
0,93
0,93
1,54
1,84
2,27
2,32
3,65
4,02
‐4,00 0,00 4,00 8,00
China
Jepang
Indonesia
Euro
Thailand
Philipina
Korea
Singapura
Malaysia
Regional exchange rate movements
show
a
fluctuations
but now
tend
to
streghthen
against
the U.S.dollar,
including Rupiah.
Stock Index also
tend
to
rise
...
source: Bloomberg
Exchange rate Feb 1st, 2012 (%ytd) Stock Index Feb 1st, 2012 (%ytd)
8400
8600
8800
9000
9200
9400
2000
2500
3000
3500
4000
4500
Jan-10 Apr-10 Jul-10 Oct-10 Jan-11 Apr-11 Jul-11 Oct-11 Jan-12
JCI IDR(RHS)
JCI 01/02/123965
IDR 01/02/12Rp8.985/USD
Domestic Indonesia’s Goverment Bond Yield 10Y
and
Indonesia’s Global
Bond
Yield 10Y decreasing…
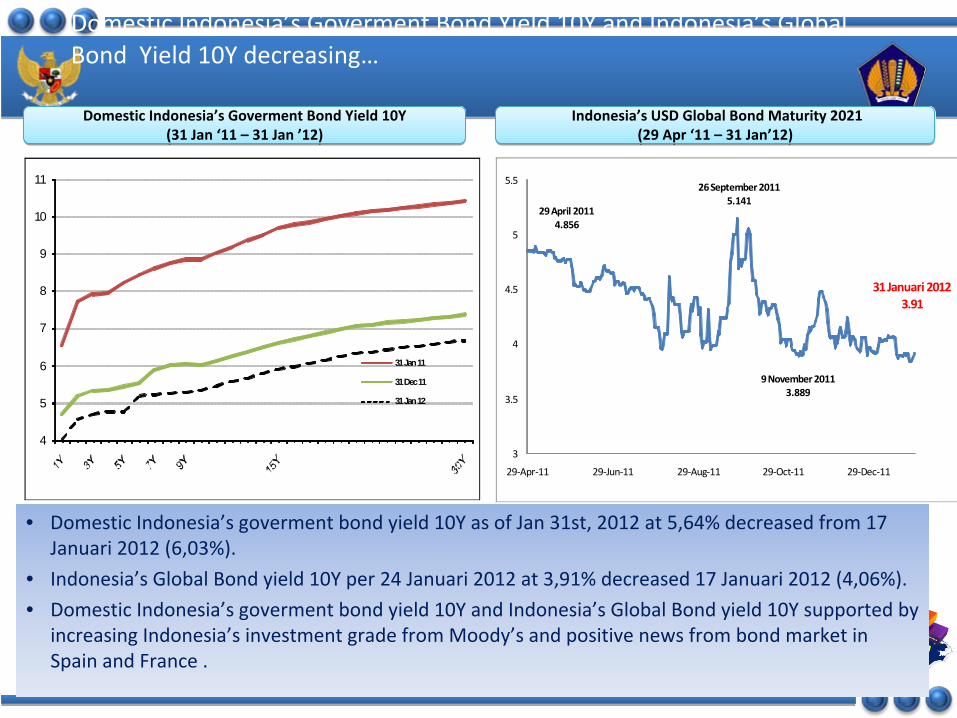
• Domestic Indonesia’s goverment bond yield 10Y
as of
Jan 31st, 2012 at 5,64% decreased from 17
Januari 2012 (6,03%).
• Indonesia’s
Global Bond
yield
10Y per 24 Januari 2012 at 3,91% decreased 17 Januari 2012 (4,06%).
• Domestic Indonesia’s goverment bond yield 10Y and Indonesia’s
Global Bond
yield
10Y supported by
increasing Indonesia’s investment grade from Moody’s and positive news from bond market in
Spain and France .
Indonesia’s USD Global Bond
Maturity 2021(29 Apr ‘11 –
31
Jan’12)Indonesia’s USD Global Bond
Maturity 2021(29 Apr ‘11 –
31
Jan’12)Domestic Indonesia’s Goverment Bond Yield 10Y
(31
Jan ‘11 – 31 Jan ’12)Domestic Indonesia’s Goverment Bond Yield 10Y
(31
Jan ‘11 – 31 Jan ’12)
4
5
6
7
8
9
10
11
31 Jan 11
31 Dec 11
31 Jan 12
29 April 2011 4.856
26 September 20115.141
9 November 20113.889
31 Januari 20123.91
3
3.5
4
4.5
5
5.5
29‐Apr‐11 29‐Jun‐11 29‐Aug‐11 29‐Oct‐11 29‐Dec‐11

After 14 years, Indonesia regain the Investment Grade...
Source: Moody’s, S&P, Fitch
20082007
2006
2005
2004
2003
2009
2010
Ba3B1 Ba3
B2 B1
B2
B2
B3 B2
Ba3 Ba2
BB‐
B+ BB‐B+
B‐ B
BB‐
B B+
BB‐ BBBB‐
B B+
BB‐
BB‐ BB
BB‐
B+ BB‐
B+
BB BB+
Ba2 BB BB+
7
“…
momentum in the economy is
expected to be sustained by steady
domestic demand, a reasonable pace
and sequencing of policy and structural
reforms, and rising foreign direct
investment. Furthermore, the country's
debt position and reserve adequacy
remain on an improving trajectory
relative to most of its ratings peers,"
“.. The rating upgrade reflects
continuing improvements in the
government'sbalance sheet and external liquidity,
against a backdrop of a resilienteconomic performance and cautious
fiscal management.”
"The upgrades reflect the country's
strong and resilient economic growth,
low and declining public debt ratios,
strengthened external liquidity and a
prudent overall macro policy
framework …. “
Moody’s(Baa3
Stable Outlook)S&P
(BB+ Positive Outlook)
Fitch
(BBB‐
Stable
Outlook)
Ba2 BB BB+
2011
INVESTMENT GRADEINVESTMENT GRADE
Sumber: BPS
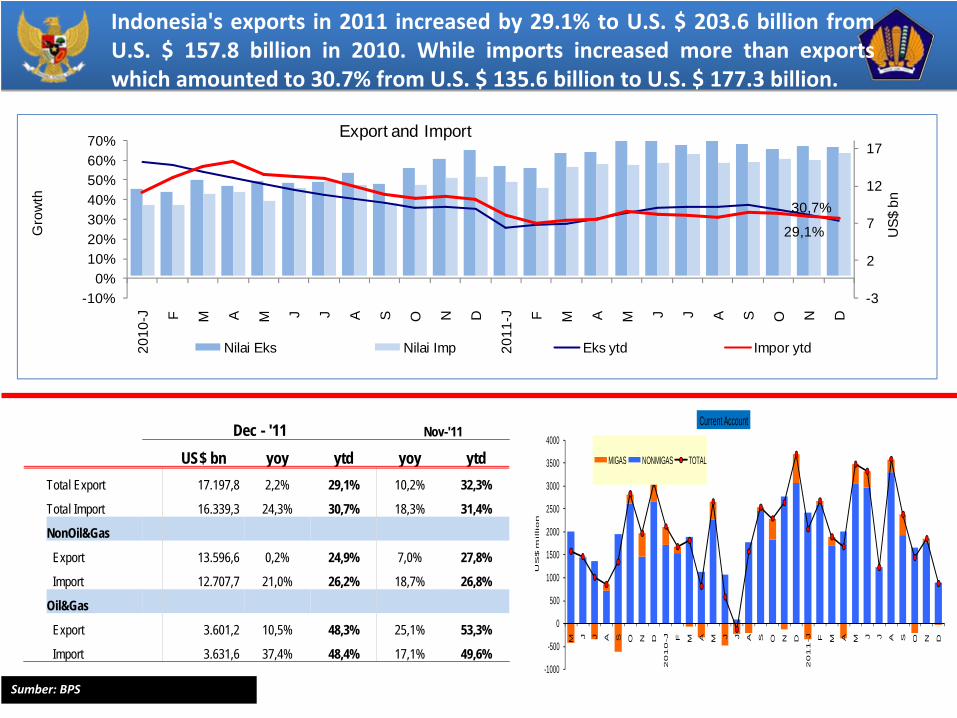
Indonesia's
exports
in
2011
increased
by
29.1%
to
U.S.
$
203.6
billion
from
U.S.
$
157.8
billion
in
2010.
While
imports
increased
more
than
exports
which amounted to 30.7% from U.S. $ 135.6 billion to U.S. $ 177.3 billion.
29,1%
30,7%
-3
2
7
12
17
-10%0%
10%20%30%40%50%60%70%
2010
-J F M A M J J A S O N D
2011
-J F M A M J J A S O N D
US$
bn
Gro
wth
Export and Import
Nilai Eks Nilai Imp Eks ytd Impor ytd
Dec - '11 Nov-'11
US$ bn yoy ytd yoy ytdTotal Export 17.197,8 2,2% 29,1% 10,2% 32,3%
Total Import 16.339,3 24,3% 30,7% 18,3% 31,4%
NonOil&Gas
Export 13.596,6 0,2% 24,9% 7,0% 27,8%
Import 12.707,7 21,0% 26,2% 18,7% 26,8%
Oil&Gas
Export 3.601,2 10,5% 48,3% 25,1% 53,3%
Import 3.631,6 37,4% 48,4% 17,1% 49,6%-1000
-500
0
500
1000
1500
2000
2500
3000
3500
4000
M J J A S O N D
20
10
-J F M A M J J A S O N D
20
11
-J F M A M J J A S O N D
US
$ m
illio
n
Current Account
MIGAS NONMIGAS TOTAL

Economic growth
during
Q1,
Q2
and
Q3
respectively
grew
6.5%(YoY),
and is
expected to
grow by
6.5 (YoY) in 2011.
•Private consumption
is quite
strong
and
continues to increase throughout the
year
2011 (Q1:
4.5%,
Q2:
4.6%,
and
Q3:
4.8%)
•Private consumption is quite strong and getting improve on 2011 (Q1:4,5%,
Q2:4,6% and Q3:4,8%)
•Government spending is growing up to 3,0% on Q1, 4,5% on Q2, 2,5% on Q3
and on Q4 is expected increase in line with increasing of central budget
realization.
•Investment is growing quite strong (Q1:7,3%, Q2: 9,2%, Q3:7,1% and Q4 is
expected improve) in line with increasing Credit rating to Investment Grade
level.
•Exports continued to increase in line with increasing commodity prices (Q1:
12.3%, Q2: 17.4% and Q3: 18.5%)
•Growth of Industrial sector increased rapidly (Q1: 5%, Q2: 6.1% and Q3: 6.6%)
Facing
global
economic
uncertainties,
domestic
economy
grow
consistently over
the year 2011
9

• Supporting factors for the stable inflation for 2011:
Sustainable food production and distribution;Optimization of government policy on price (administered prices), especially in energy‐related policies;Inflation expectations are maintained, particularly in the second semester 2011 along with the availability of food supplies;;The exchange rate relatively stable and able to reduce imported inflation with the trend of rising energy and food prices on international markets.
The inflation rate continued to decline from 7.02% (YoY) in January 2011 to 3.79% (YoY) in December 2011.
10

Exchange rate fluctuation are managed to avoid a high volatility. •The exchange rate is able to maintain the competitiveness of national products•The exchange rate is not cause a high pressure of imported inflation, and shortages of raw materials imported
Economic stability was maintained by average exchange rate in 2011
Rp8.779 per US$
11

1212
The SBI‐3 months rate has replaced by SPN‐3 months rate with the average
4,84%
in 2011. On Jan,
26th, 2012,
SPN‐3 months rate
falls to 1,92%
which
reflects increased investor confidence.
SPN 3 Months Rate (%)

Average oil price in 2011 reached US$111.54 / barrel and lifting 2011 at 898 thousand barrels / day
Oil Lifting(thousand
Barrel/day)Oil Lifting
(thousand
Barrel/day)
ICP (US$/barrel)ICP (US$/barrel)
In the next years, oil lifting will be
influenced by:•The new investment
results and
optimization of
oil existing
sources;•The Government
will also seek
to
minimize
the occurrence
of
unplanned
termination,improve
operating
efficiencies,
and
optimizing
production
facil
ities.
International Oil Price–
WTI (US$/barrel)International Oil Price–
WTI (US$/barrel)
13

Source: Ministry of Finance*) Up to Q III 2011 (Statistic Office)
Macroeconomic Indicators
2011 2012
Budget‐R Real Budget
Growth (%) 6.5 6.5*) 6.7
Inflation (%) 5.65 3.79 5.3
SPN 3 month for 2012 (%) 5.6 4.84 6.0
Exchange Rate (RP/US$) 8,700 8,779 8,800
ICP (US$/bbl) 95 111.5 90
Lifting (MCBD) 0.945 0.898 0.950
2012 Macroeconomic Assumptions
14

Indonesia’s Fiscal and Development Policies
15

4 pillars of development:
1. PRO GROWTH: encourage
quality economic growth, inclusive, and equitable2. PRO‐JOB: create
employment opportunities and reduce unemployment level
to 6.4‐6.6 %3. PRO‐POOR: target to reduce poverty rate to 10.5‐11.0 percent.4. PRO ENVIRONMENT: support natural and environmental protection
National Development Priorities:
Indonesia’s Fiscal Policy
1. Bureaucratic Reform and Governance 7. Investment and Business Climate
2. Education 8. Energy
3. Health 9. Environment and Disaster Management
4. Poverty 10. Regions, Lead, Outermost, and Post‐Conflict
5. Food Security 11. Culture, Creativity, and Technological
6. Infrastructure Innovation16

2011
A. STATE REVENUE AND GRANT 1,169.9 1,292.9 1,311.4 18.5 141.5I. DOMESTIC REVENUE 1,165.3 1,292.1 1,310.6 18.5 145.3
1. TAX REVENUE 878.7 1,013.9 1,032.6 13.2 153.9Tax Ratio (% to GDP (CPI)) 12.2 12.6 12.7 0.2 0.6
2. NON‐TAX REVENUE 286.6 272.7 278.0 5.3 (8.6)II. GRANT 4.7 0.8 0.8 0.0 (3.8)
B. EXPENDITURE 1,320.8 1,418.5 1,432.4 16.9 114.7I. CENTRAL GOVERNMENT EXPENDITURE 908.2 954.1 965.0 10.9 56.8
A. LINE MINISTRIES 461.5 476.6 508.4 31.7 46.9B. NON‐LINE MINISTRIES 446.7 477.5 456.6 (20.9) 9.9
Additional Budget 0.0 0.0 12.5 12.5 12.5‐ Non‐Education 0.0 0.0 9.1 9.1 9.1‐ Education in line ministry 0.0 0.0 3.4 3.4 3.4
II. TRANSFER TO REGION 412.5 464.4 470.4 6.0 57.91. Balanced Fund 347.5 394.1 400.0 5.8 52.4
a. Revenue Sharing Fund 96.8 98.5 100.1 1.6 3.3b. General Allocation Fund 225.5 269.5 273.8 4.3 48.3
2. Special Autonomy and Adjusment Fund 65.0 70.2 70.4 0.2 5.5C. BUDGET DEFICIT (A‐B) (150.8) (125.6) (124.0) 1.6 26.8
% Deficit to GDP‐CPI (2.10) (1.55) (1.53) 0.02 0.56D. FINANCING (I+II) 150.8 125.6 124.0 (1.6) (26.8)
I. DOMESTIC FINANCING 153.6 125.9 125.9 0.0 (27.7)II. FOREIGN FINANCEING (NETTO) (2.8) (0.3) (1.9) (1.6) 0.9
1. Gross Drawing 56.2 56.0 54.3 (1.7) (1.9)i.e. Program Loan 19.2 16.9 15.3 (1.6) (3.9)
2. Amortization (47.2) (47.3) (47.3) 0.0 0.0SURPLUS/(DEFICIT) FINANCING 0.0 0.0 0.0 0.0 0.0
DescriptionAPBN‐P
Difference to RAPBN
Difference to APBN 2011
2012
APBNRAPBN
Budget Summary 2012
17
Trillion rupiah

Share of Tax Revenue
(2000‐2012)
:
•Non Oil and Gas Income
Tax increase : 68,1%79,5%•Custom and Excise
decrease : 15,8%
13,1%•Oil and Gas Income Tax
decrease: 16,1% 7,4%
Share of Tax Revenue
(2000‐2012)
:•Non Oil and Gas Income Tax increase : 68,1%79,5%•Custom and Excise decrease : 15,8%
13,1%•Oil and Gas Income Tax decrease: 16,1% 7,4%
Tax
and Non‐Tax
Revenue Shares
18
Domestic Revenues Composition
Tax Revenue Composition
Share of Domestic Revenue
(2000‐2012) :
•Tax revenue increase :
56,5% 75,4%
•Non‐tax Revenue decrease
:
43,5% 24,6%
Share of Domestic Revenue
(2000‐2012) :
•Tax revenue increase :56,5% 75,4%
•Non‐tax Revenue decrease : 43,5% 24,6%
Non-Oil and Gas Income Tax

National tax census;
Improved tax services and dissemination to enhance voluntary compliance;
Fiscal incentives and/or tax holiday to support revenue optimization and economic activities/stimulation;
Law enforcement for non‐compliant taxpayers;
Third party data utilization to improve tax revenue performance;
Optimization in custom and excise tax sector, including improving tariff policies;
Better supervision and internal control in customs and excise tax administration.
2012 Tax Initiatives
19
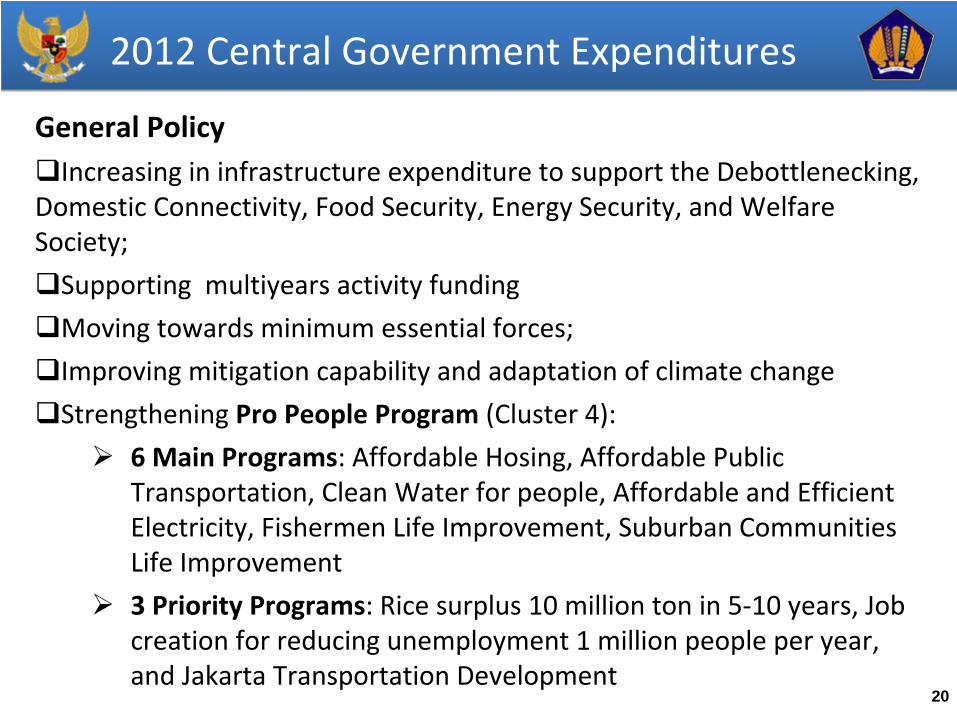
2012 Central Government Expenditures
General PolicyIncreasing in infrastructure expenditure to support the Debottlenecking,
Domestic Connectivity, Food Security, Energy Security, and Welfare Society;
Supporting multiyears activity funding
Moving towards minimum essential forces;
Improving mitigation capability and adaptation of climate change
Strengthening Pro People Program (Cluster 4):
6 Main Programs: Affordable Hosing, Affordable Public Transportation, Clean Water for people, Affordable and Efficient Electricity, Fishermen Life Improvement, Suburban Communities Life Improvement
3 Priority Programs: Rice surplus 10 million ton in 5‐10 years, Job creation for reducing unemployment 1 million people per year, and Jakarta Transportation Development
20

Central Government Expenditure Composition
Since 2005, the percentage of subsidy expenditure decreased, while capital expenditure increased
21

Policies on Energy Subsidies 2012
Fuel
Subsidies
Rp 123,6 T
Policies 2012:1.
Allocating
the
subsidized
fuel
more
targeted
with
the
restriction
of
subsidized
fuel
(gasoline) consumption for the private cars in Java and Bali Region starting in April 2012;
2.
Continuing the conversion Program of Kerosene to LPG;3.
Increasing
the
utilization
of
alternative
energy
(biofuel
and
biogas)
and
renewable
energy;
4.
Improving
the
tighter
oversight
of
the
subsidized
fuel
volume
distributed
to
the
public
and
setting
the
fuel
trade
system
as
well
as
prosecution
and
prevention
of
subsidized
fuel misuse;
5.
Completing the regulation policy.
Policies 2012 :
1.
Providing margin 7% to fulfill investment financing requirements
for PT PLN;
2.
Decreasing the losses of electricity;
3.
Increasing
the
natural
gas
supply
and
the
coal
usage
as
the
energy
input
for
electricity generator;
4.
Assuming
tariff
of
electricity
increases
by
10
%
in
the
1st
April,
2012
exclude
customer
450VA
(the policy
of
the
electricity
tariff
will
be
discussed
by
GOI
and
Commission VII Parliament).
Electricity
Subsidies
Rp 44,96 T
22

Energy
Subsidy
and Domestic Fuel Consumption
*) Anaudited 23

Composition of Subsidized Fuel Consumption
24
Premium= 60%
M. Tanah= 6%
M. Solar= 34%
Gasoline Consumption (Land
Transportation)
Clusters of Consumers
Gasoline Consumption (by Region)
Type of Subsidized Fuel
Source : Ministry of Energy and Mineral Resources
Gasoline
Kerosene
Diesel

25
Lower volume of subsidized fuelsMinimum subsidy on fuelsNon-fuel diversified renewable energy sources
Decreasing energy intensityProvision of sufficient infrastructure and transport of fuelAlleviating fuel subsidy along with compensating variationEnergy diversification
Rising fuel consumption Fuel prices increasesBottleneck domestic refineriesRestricting domestic fuel stockInsufficient infrastructure of publictransportationLess consumption on non-fuel subsidy
Fuel Subsidy
Alleviation
Target Condition
Strategy
Current Condition
Policy Framework for Phasing Out Fuel Subsidy

• Budget deficit
during 2005 to
2011
is fluctuated
below 3%
of GDP;• Deficit target
2012 is 1.5%
of GDP
(above deficit 2011, 1.3%
of GDP);• Budget
deficit
policy
is based
on:State revenue limitation;Expansion budget policy to achieve development targets through four track strategy (pro‐growth, pro jobs, pro poor, pro‐environment);Financing budget deficit from low‐risk instrument.
Budget Deficit Controllable (<3% GDP)
Average 1,0%
27

Infrastructure Development Policy
Policy Direction TARGET
Provide basic infrastructure to increase
social welfare
INCREASE INFRASTRUCTURE DEVELOPMENT
Ensure the continuity of goods, services,
and information distribution, and boost
national product competitiveness.
ENHANCE REAL SECTOR COMPETITIVENESS
Develop infrastructure which can cover
cost recovery through tariff structure
considering socio‐economic aspect
STRENGTHEN PUBLIC AND PRIVATE
PARTNERSHIP
1.
National Food
Security
1.
National Food
Security
2.
Physical
connectivity
2.
Physical
connectivity
3.
Domestic e‐connectivity
(Indonesia
connected)
3.
Domestic e‐connectivity
(Indonesia
connected)
4.
Affordable
housing and
sanitation
4.
Affordable
housing and
sanitation
5.
National Energy
Security
5.
National Energy
Security
Irrigational service expansion up to 3.34 million hectare
Increase roads capacity 2.830 Km
Develop Tg.Priok and Belawan Port, and 7 others
Telecommunication access in 33,259 villages
Internet in 5,748 districts
Regional Internet Exchange in 10 cities
Community Access Point in 222 districts
Develop 170 affordable apartment (rusunawa) ; subsidy for 92,927 house units
Develop off‐site and on‐site waste system for 1.11 million people
Increasing electrification ratio to 69,5% and utilizing renewable energy 10,23%
6.
Potable water
and flood
control
6.
Potable water
and flood
control
Provide potable water(187 L/sec for 63 million people)
Increase drinking water service 5.89 m3/sec
28

Issues Targets
1. Engaging Stakeholders Private, state‐owned, Government (Central & Local), Public Private
Partnership
2. Overcoming Debottlenecking
improvements Investment
Climate
‐
Revise legislation (Oil & Gas, Mineral & Coal, Labor, PPP)
‐
Develop Regulations (provision of land for development purposes,
Tax Holiday, Tax Allowance)
‐
Eliminate the overlap between existing legislation in both the
central and local levels, as well as between sectors and agencies
‐
Speed up and simplify the licensing process and provide certainty
3. Promoting an integrated
infrastructure development
(Domestic Connectivity)
Roads, Railway and Port, Power & Energy, Telematic, others
4. Based on the potential of each area (Natural and Human Resources)
Strategic Master Plan for Acceleration and
Expansion of Indonesia Development (2011‐2025)
29

Tax Incentives
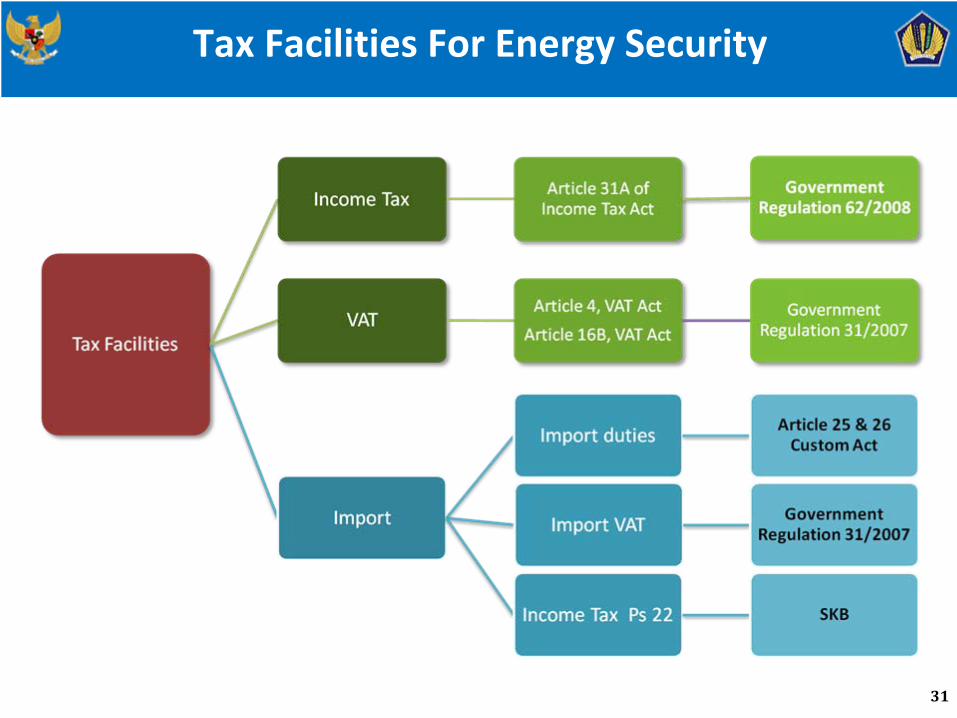
Tax Facilities For Energy Security
31

Incentives on Budget
Billion of Rp
taxes paid by the government 2008 2009 2010 2011 2012
1. Income Tax
(PPh) 500 800 724 1,000 1,200
a. Income Tax on geothermal commodities 500 800 624 1,000 1,200
b. Income Tax on Biofuel (BBN) ‐ ‐ 100 ‐ ‐
2. Value Added Tax(PPN) 16,800 5,700 8,398 ‐ ‐
a. VAT on fuel, bio‐fuel, and 3 kg LPG subsidy 9,000 3,000 5,898 ‐ ‐
b. VAT on oil and gas exploration 7,800 2,500 2,500 ‐ ‐
c. VAT on bio‐fuel ‐ 200 ‐ ‐
3. Import Duties
(beyond
PMK176/2009) 2,000 2,500 2,000 500 1,000
Total DTP 19,300 9,000 11,122 1,500 2,200
32

Tax Incentives (1)
The regulation applies to Permanent Establishment (BUT) investing in sectors or regions qualified as national priority;
Capital investment includes start‐ups, expansion, and quality improvement, unless covered by any other tax incentives;
Applied for industries such as: textile and clothes, pulp, chemistries, rubber, and basic metal industries (including oil and gas industries)
Income tax facilities are as follows:
Income tax deduction in the sum of 30% capital investment over six years;
Accelerated amortization and depreciation
10% tax on dividend or lower according to tax treaty;
Extended tax loss carry forwards up to 10 years
Income Tax Facilities for Particular Sectors and Regions (Government Regulation No.52/2011)
33

Tax Incentives (2)
For pioneer industry: industry that has wide linkage, value added and positive externalities.
Eligible Industries:
1.
Basic metal industry
2.
Oil Refinery and organic basic chemical industry derived from oil
and gas
3.
Machinery industry
4.
Industry for Renewable energy
5.
Telecommunication equipment industry
Income tax facilities are as follows:
Tax exemption is given for 5‐10 years
Another 50% deduction for two years after the tax exemption period is over
Tax Holiday for Specific New Industries (Ministry of Finance Regulation No. 130/2011)
34

Conclusions
Continued growth driven by robust domestic consumption and a diversified domestic economy
Positive fiscal story with a sound debt management strategy firmly in place
Strong track‐record of prudent expenditure management
Focused on enhancing tax collections and government spending on infrastructure and social programs.
Reduction in subsidies allow for greater investments towards infrastructure spending.
Various tax incentives to further stimulate economy and attract investment, especially in the oil and gas industry
Indonesian economy is expected to outperform its peers in
2012
35