Embed Size (px)
Citation preview
Fiscal and pricing policies to improve public health: a review of the evidence
Fiscal and pricing policies to improve public health
2
About Public Health England
Public Health England exists to protect and improve the nation’s health and wellbeing,
and reduce health inequalities. We do this through world-leading science, knowledge
and intelligence, advocacy, partnerships and the delivery of specialist public health
services. We are an executive agency of the Department of Health and Social Care,
and a distinct delivery organisation with operational autonomy. We provide
government, local government, the NHS, Parliament, industry and the public with
evidence-based professional, scientific and delivery expertise and support.
Public Health England | Wellington House | 133-155 Waterloo Road | London SE1 8UG
Tel: 020 7654 8000 | www.gov.uk/phe
Twitter: @PHE_uk
Facebook: www.facebook.com/PublicHealthEngland
Prepared by: UK Health Forum
For queries relating to this document, please contact: [email protected]
© Crown copyright 2018
You may re-use this information (excluding logos) free of charge in any format or
medium, under the terms of the Open Government Licence v3.0. To view this licence,
visit OGL. Where we have identified any third party copyright information you will need
to obtain permission from the copyright holders concerned.
Published September 2018
PHE publications PHE supports the UN
gateway number: 2018464 Sustainable Development Goals
Fiscal and pricing policies to improve public health
3
Authors
Laura Pimpin 1, Franco Sassi 2, Emily Corbould 1, Rocco Friebel 3, Laura Webber 1
Additional contributors
Hannah Graff 1
Chris Brookes 1
Modi Mwatsama 1
Abbygail Jaccard 1
1 UK Health Forum
2 Imperial College London
3 London School of Economics
This report was prepared in conjunction with the Health Economics Team in PHE.
Acknowledgements
We would like to thank every member of the Steering Group who guided us in the
evidence collection and development of the final deliverables (framework and report):
Emily Green (PHE), Annalisa Belloni (PHE), Brian Ferguson (PHE), Natalie Gold
(PHE), Helen Clark (PHE), Victoria Targett (PHE), Jamie Blackshaw (PHE), Emma
Pawson (PHE), John Henderson (DHSC), Geoff Wootton (DHSC), Joy Townsend
(LSHTM) and Malcolm Clark (CRUK). Many thanks also to Nicola Pearce-Smith from
the PHE Library service and David Buck (King’s Fund) for his steer on this project, as
well as all the external contacts who very kindly provided references and further
sources for the review.
Fiscal and pricing policies to improve public health
4
Contents
About Public Health England 2
Authors 3
Acknowledgements 3
Contents 4
Executive summary 6
Glossary 11
Introduction 13
Methods 15
Objectives 15
Approach 15 Search strategy 16
Eligibility criteria 18 Contacting experts 19
Review process 20 Framework design 20
Policy description 20 Policy outcomes 21
Policy context/other 21 Data extraction and use of the framework 21
Results 23
Obesity and diet policy area 26 Physical activity policy area 29 Environment policy area 32
Housing policy area 34
Gambling policy area 36
Healthy workplace policy area 38 Secondary prevention policy area 40
Targeted searches for tobacco and alcohol policies 42 Tobacco 42 Alcohol 46
Discussion 51
Summary of findings 53 Inequalities 55
Conclusions 56
Health improvement 56
Revenue raising 59
Reducing health inequalities 61 Potential trade-offs between fiscal policy goals 61 Other issues 62
Evidence gaps 63
Fiscal and pricing policies to improve public health
5
References 65
Appendices 80
Appendix A. Template of the framework 80 Appendix B. List of sources searched and detailed search strategies 82
PubMed strategy 82 EconLit 85
Google Scholar 88 Grey literature 88 Tobacco specific searches 89 Alcohol specific searches 90
Appendix C. Summary of external contacts responses 91 Appendix D. Framework user guide 91
Fiscal and pricing policies to improve public health
6
Executive summary
Fiscal and pricing policies have been shown to be effective in promoting healthy
behaviours, as exemplified by the widespread use of commodity taxation on alcoholic
beverages and tobacco, and increasingly on sugar-sweetened beverages, in many
countries at all levels of income and development (1). Most fiscal policies have the
potential to change individual patterns of consumption, and some of them can do it in a
targeted way, for instance by altering the prices of specific products at the point of
consumption through excise or sales taxes, or through product subsidies. Similar
impacts can be achieved with regulatory policies affecting product prices (alcohol
minimum pricing is an example). For this reason, certain fiscal policies and pricing
policies have been viewed as potential public health interventions and some of them
are being used extensively and predominantly for that purpose at the present time (2).
In England, fiscal policies that have a potential to improve health include alcohol and
tobacco, betting and gambling duties, vehicle and air passenger duty (3) but there is
scope for further fiscal and pricing policy action to improve public health.
Reviewing the evidence on existing and modelled fiscal or pricing intervention for
health purposes in other countries may help inform policy makers and government in
England on the best opportunities to shape the environment and the population’s
health-related behaviours.
This report summarises the findings from a review of published and grey literature on
fiscal or pricing policies that had an impact on health, or a health-related proxy outcome
in OECD countries. Information on relevant policies was extracted into a pre-
determined framework to enable comparisons across policy areas, populations and
target commodities. The nine policy areas of interest consisted of
Diet and obesity
Physical activity
Environment
Housing
Gambling
Fiscal and pricing policies to improve public health
7
Healthy workplaces
Secondary prevention activities such as attending health screens, uptake of
immunisations and prenatal care services
However, incentives that target healthcare providers, such as pay-for-performance and
other incentive schemes were not in the scope of this review.
Given the large body of work and the recent reviews in the field of fiscal and pricing
policy for tobacco and alcohol (4, 5), the conclusions of which still hold, it was not
necessary to replicate searches, therefore searches have been conducted on specific
policies of interest:
Tobacco:
o Taxation of e-cigarettes (with a focus on VAT reduction as an incentive to
switch)
o Minimum unit pricing for cigarettes/packs
o Incentives to promote smoking cessation in pregnancy / in low socio-
economic populations
o Hypothecation of a tobacco industry levy for smoking cessation activities
(with a special focus on France and USA where this is known to have
recently been implemented)
Alcohol:
o Fiscal and pricing policies to promote consumption of lower-strength
alcohol (ie volumetric taxation)
o Evidence of alcohol duty policy outside of the EU
o Experience of minimum unit pricing outside the UK (after 2016)
From 10,114 unique abstracts and information sources, we identified 261 publications
providing information on 234 fiscal and pricing policies or interventions. Of these:
117 covered diet and obesity (of which 9 overlapped with healthy workplace
policies)
29 were aimed at promoting physical activity (of which 2 overlapped with
environmental policies and 5 overlapped with healthy workplace policies)
14 were environmental policies (2 of which overlapped with physical activity
policies)
15 aimed at improving housing conditions
4 were policies on gambling
Fiscal and pricing policies to improve public health
8
24 were policies promoting healthy workplaces (5 overlapping with physical activity,
2 with secondary prevention activities and 9 overlapping with diet and obesity
policies)
18 promoting secondary prevention activities (2 overlapping with healthy workplace
policies).
the targeted tobacco and alcohol searches yielded 13 reports on tobacco policies
and 18 reports on alcohol policies
The type of fiscal or pricing policy varied across policy areas: where overconsumption
of an unhealthy commodity (such as tobacco, alcohol and a less healthy diet) is the
cause of ill-health, fiscal strategies were used as disincentives for consumption through
taxation and in a few cases included regulations that would result in price increases. In
other policy areas, the focus was largely on subsidies and incentives to promote the
uptake of healthier behaviours (for example for physical activity, healthy workplaces,
and secondary prevention) or exposure to healthier environments (such as for the
environment or housing policy areas).
The policies that provided a strong indication of an impact on health were mainly
taxation policies in the field of diet and obesity or alcohol, or subsidies for housing.
Far fewer studies in the environment and physical activity fields reporting health
impacts. In contrast, only one or two studies from the fields of gambling, healthy
workplaces, secondary prevention activities and tobacco provided any direct health
impacts, instead focussing on outcomes such as changes in physical activity levels,
dietary intake, smoking rates, or other proximal outcomes. In the case of the gambling
literature, the outcomes were indeed very distally related to health, as no impacts on
mental health were reported, and instead the only impacts recorded were changes to
betting behaviour and value and frequency of gambling, making it very difficult to draw
any strong conclusions in this field.
Less than a third of intervention studies reported health impacts for the policies
examined, including numbers of disease cases or deaths avoided, quality-adjusted life
years, disability-adjusted life years (66/234). The remainder only reported on
intermediate outcomes, which were on the pathway to health.
Fiscal and pricing policies to improve public health
9
The majority of intervention studies/policies which reported a health impact consisted of
taxation, with 15 consisting of subsidies, while only a few considered joint taxation and
subsidies, or financial incentives. Almost all analyses of financial incentives reported
proxy outcomes. It should be noted that when a health impact was reported, it was
almost always a significant, positive impact on health. Of note also is that, the vast
majority of the health impacts reported came from modelling studies. This is likely
because health impacts take time to manifest, and modelling studies consider longer
timeframes, but also integrate the impact on health of observed changes in behaviour
as a result of policies. However, robust modelling studies, of which there were many,
are useful to add to the case for taxation policies.
The goals of fiscal and pricing policies examined here can largely be categorised into
three aims: to have a positive impact on health, to raise revenue or to reduce
inequalities.
Key conditions for fiscal and price policies to generate further significant health impacts
are as follows:
the risks associated with harmful consumption behaviours should be significant and
widespread;
it should be possible to alter prices by a relatively large margin, or consumption
should be very responsive to price changes (elastic demand);
there should be significant scope for an expansion of existing fiscal and price
policies or for introduction of new ones
Tax policies targeting specific forms of consumption can generate significant additional
revenues when the following conditions occur:
the taxed products are widely consumed;
the prices of taxed products are high (for ad valorem taxes), or it is possible to set
large ad quantum taxes;
the consumption of the taxed products is not very responsive to price changes
(inelastic demand), or it is possible to limit opportunities for substitutions by
consumers;
in addition, there should be significant scope for an expansion of existing fiscal and
price policies or for the introduction of new ones (assuming that only soft
earmarking is considered, as discussed above).
Fiscal and pricing policies to improve public health
10
Fiscal and price policies tend to have progressive health impacts because the
consumption of unhealthy products tends to be more concentrated in disadvantaged
socioeconomic groups, and because the latter groups tend to be more responsive to
financial incentives (1). However, the use of fiscal and price measures aiming at
increasing the price of commodities has always found a limit in the potential for
regressive financial impacts.
Depending on the goal or goals of interest, different policy strategies may be more
successful, and in some cases the goals and strategies to achieve these will be in
conflict with one another, with some trade-offs required to achieve multiple goals with
the same policy.
Fiscal and pricing policies to improve public health
11
Glossary
Ad valorem tax The amount of tax paid is proportionate to the value of the asset being
taxed
Ad quantum tax A fixed amount of tax is levied per unit of the product, which means that this
is a tax on the volume of sales
Deadweight loss
of taxation
A measurement of how far taxes reduce the standard of living among the
taxed population
Fiscal policies Policies which include both revenue raising measures (typically indirect
taxes) and expenditure measures (product subsidies) that may alter the
prices of products or services whose consumption has an impact (positive
or negative) on the health of consumers
Pricing policies Policies that alter the prices of products
Price elasticity Measure of the responsiveness of demand after a change in a product's
own price. If the demand of a product/service is elastic, it means that a
price change will lead to a more than proportional change in demand. If the
demand of a product/service is inelastic, it means that a price change will
lead to a less than proportional change in demand.
Cross-price
elasticity
Measure of the responsiveness of demand for one product/service after a
change in the price of another product/service
AUD Australian dollar
CFTC Canadian Children’s Fitness Tax Credit
DALYS Disability-adjusted life years
F&V Fruit and vegetables
GINA Global database on the Implementation of Nutrition Action
HALY Health-adjusted life expectancy
MUP Minimum unit pricing (a direct price control set by government aimed at
preventing the sale of alcohol below a certain price)
NCD Non-communicable disease
OECD Organisation for Economic Co-operation and Development
PM2.5 Particulate matter of diameter size < 2.5 µm
QALYS Quality-adjusted life years
Fiscal and pricing policies to improve public health
12
RCT Randomised controlled trial
SDIL Soft Drinks Industry Levy
SES Socio-economic status
SSB Sugar-sweetened beverage
VAT Value-added tax
WCRF World Cancer Research Fund
Fiscal and pricing policies to improve public health
13
Introduction
Non-communicable diseases (NCDs) have risen significantly over the past decade.
They are associated with unhealthy behaviours and environmental risk factors and can
have a substantial impact on the welfare of individuals, as well as causing a large
economic burden through loss in productivity and high levels of healthcare and social
care expenditure. However, NCDs can be avoided or delayed through early intervention
and population wide approaches.
Fiscal and pricing policies have been adopted globally to provide financial incentives
aimed at promoting healthy behaviours, and/or discouraging unhealthy ones. Fiscal
policies are defined in the report to include both revenue raising measures (typically
indirect taxes) and expenditure measures (product subsidies) that may alter the prices
of products or services whose consumption has an impact (positive or negative) on the
health of consumers. In addition to using fiscal levers, governments can use regulation
to alter the prices of such products, which is what we identify in this report as pricing
policies. Strong evidence now points at the effectiveness of influencing people’s
behavioural choices by using financial incentives (6-10). Fiscal and pricing policies can
have a range of beneficial impacts. For example, they can signal the healthiness of a
behaviour, and can modify individual behaviour, like encouraging the uptake of greater
levels of physical activity, the consumption of a healthier diet, or a reduction in smoking.
In the case of taxes, fiscal policies can generate revenue, which can be allocated to
fund public health activities. In addition, fiscal and pricing policies can affect the
population’s health by encouraging consumer and industry action and product
modification, which ultimately can influence a population’s exposure to a risk factor, see
for instance the industry reformulation in response to the recently implemented Soft
Drinks Industry Levy (SDIL) in the UK (11).
Many countries and other geographical locations have implemented fiscal and pricing
interventions in the past, with varying levels of success in changing behaviour and
improving population health. This report aims to provide a comprehensive review of the
available evidence and experience of fiscal and pricing policies aimed at improving
health across OECD countries (inclusive of England/ the United Kingdom). A specific
Fiscal and pricing policies to improve public health
14
focus is placed on nine policy areas which are all linked to NCDs: i) diet and obesity, ii)
physical activity; iii) environment; iv) housing; v) gambling; vi) healthy workplace; vii)
secondary prevention; viii) tobacco; and ix) alcohol. For each policy area, findings from
the literature review are summarised within a predetermined framework and
accompanied by a case study that provides in-depth insights into one particular
policy/intervention.
This report comes at a time that sees the United Kingdom working towards withdrawing
from the European Union. This means there may be the opportunity to amend some
policies that were previously restricted by EU legislation, and provide an opportunity for
strong public health policy, following a Health In All Policies approach (12). Therefore,
this report can provide a useful guide in supporting policy-makers to improve population
health.
Fiscal and pricing policies to improve public health
15
Methods
Objectives
The aim of this project was to identify and assess potential fiscal or pricing policies
implemented and modelled both in the UK and other OECD countries that could be
implemented on different types of goods and services, and ultimately improve health
outcomes in England. The review planned to collect literature from modelling studies,
empirical and qualitative evidence. This would then highlight where there is potential to
improve health through fiscal or pricing policies, while considering the policies’ potential
impacts on other areas, such as inequalities, government revenues etc. Policies in the
scope of the review include both taxation and incentive levers, as well as policies that
regulate the price of a good or service.
Approach
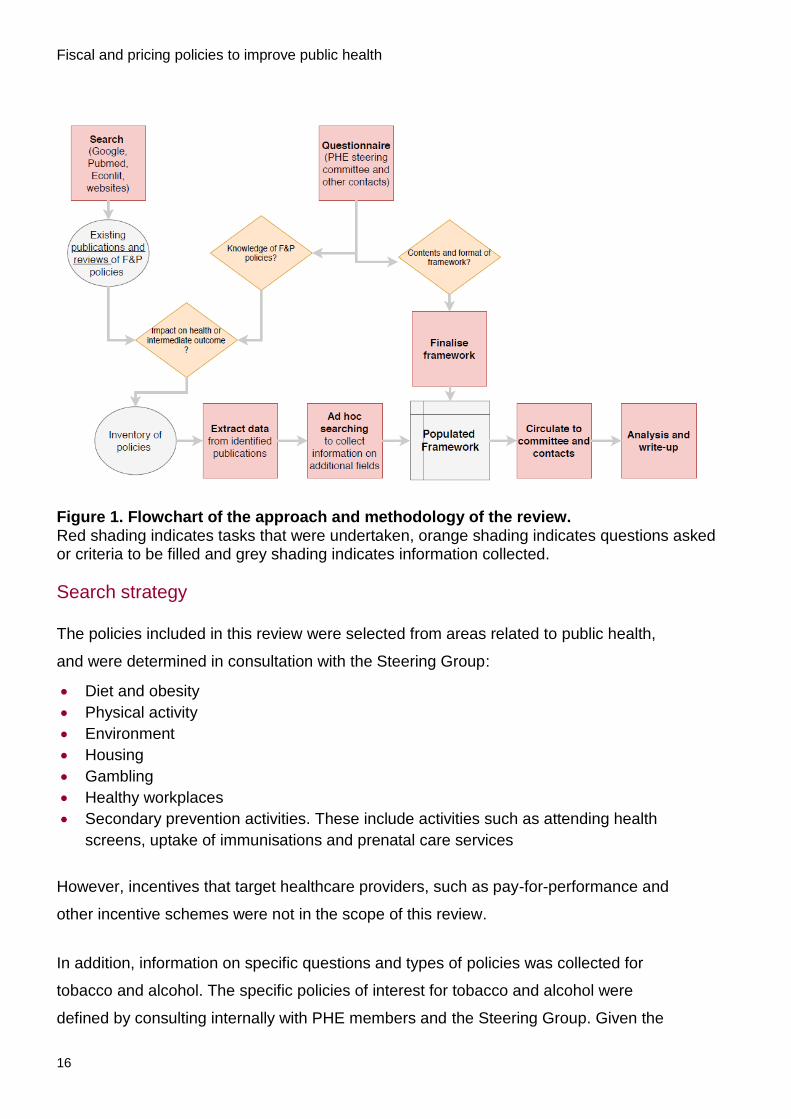
The approach to this work is summarised in Figure 1 and described below. Briefly, it
consisted of collecting evidence through a review of grey and peer-reviewed literature
and through contact with national and international public health policy experts. All
sources and references were screened for relevance to the project. A framework was
designed with the guidance of the project Steering Group to structure the collection of
information for each fiscal and pricing policy, and this was created in MS Excel, see
Appendix A for an example of the format and fields included. Information from each
relevant policy was extracted into the relevant field of the framework, to allow cross-
policy comparison and analysis. For each policy area, the information on policies was
compared and summarised according to policy type, policy target, population targeted
and impacts reported (eg the impact on population health, health inequalities and
revenues).
Fiscal and pricing policies to improve public health
16
Figure 1. Flowchart of the approach and methodology of the review. Red shading indicates tasks that were undertaken, orange shading indicates questions asked or criteria to be filled and grey shading indicates information collected.
Search strategy
The policies included in this review were selected from areas related to public health,
and were determined in consultation with the Steering Group:
Diet and obesity
Physical activity
Environment
Housing
Gambling
Healthy workplaces
Secondary prevention activities. These include activities such as attending health
screens, uptake of immunisations and prenatal care services
However, incentives that target healthcare providers, such as pay-for-performance and
other incentive schemes were not in the scope of this review.
In addition, information on specific questions and types of policies was collected for
tobacco and alcohol. The specific policies of interest for tobacco and alcohol were
defined by consulting internally with PHE members and the Steering Group. Given the
Fiscal and pricing policies to improve public health
17
large body of work and the recent reviews in the field of fiscal and pricing policy for
tobacco and alcohol (4, 5) it was not necessary to replicate these searches.
Furthermore, the conclusions from previous reviews on fiscal and pricing strategies
available for the control of tobacco and alcohol consumption still hold, so there is little
value in repeating these in this review.
The specific topics of interest in tobacco and alcohol fiscal and pricing policies were:
Tobacco:
Taxation of e-cigarettes (with a focus on VAT reduction as an incentive to switch)
Minimum unit pricing for cigarettes/packs
Incentives to promote smoking cessation in pregnancy / in low socio-economic
populations
Hypothecation of a tobacco industry levy for smoking cessation activities (with a
special focus on France and USA where this is known to have recently been
implemented)
Alcohol:
Fiscal and pricing policies to promote consumption of lower-strength alcohol (ie
volumetric taxation)
Evidence of alcohol duty policy outside of the EU
Experience of minimum unit pricing outside the UK (after 2016)
The searches for information on relevant fiscal and pricing policies were conducted
separately for each policy area, resulting in seven separate literature and evidence
searches, along with two more targeted searches for specific questions in relation to
tobacco and alcohol fiscal and pricing policies. These reviews followed the same
method as outlined for the policies above, but were specifically targeted to answer
questions of interest internally to PHE and the Steering Group (see inclusion criteria and
exceptions fields in particular for these).
Searches on Medline via PubMed and Econlit for peer-reviewed literature were
conducted on all policy areas. National and international websites and databases were
also searched for grey literature and further information. See Appendix B for a list of
sources searched and detailed search strategies. All search results were imported into
a reference manager to automatically de-duplicate and facilitate screening. When ad-
Fiscal and pricing policies to improve public health
18
hoc web-searches were performed for included policies or studies revealed additional
sources of information, these were added to the reference manager database, and
screened through the same process as other references (checked for an existing
duplicate, examined for relevance and data extracted into the framework). Similarly, the
publications provided by the external contacts were also included into the reference
manager database, and considered for eligibility like any other reference.
Eligibility criteria
Sources of information on policies, and policies described were considered eligible and
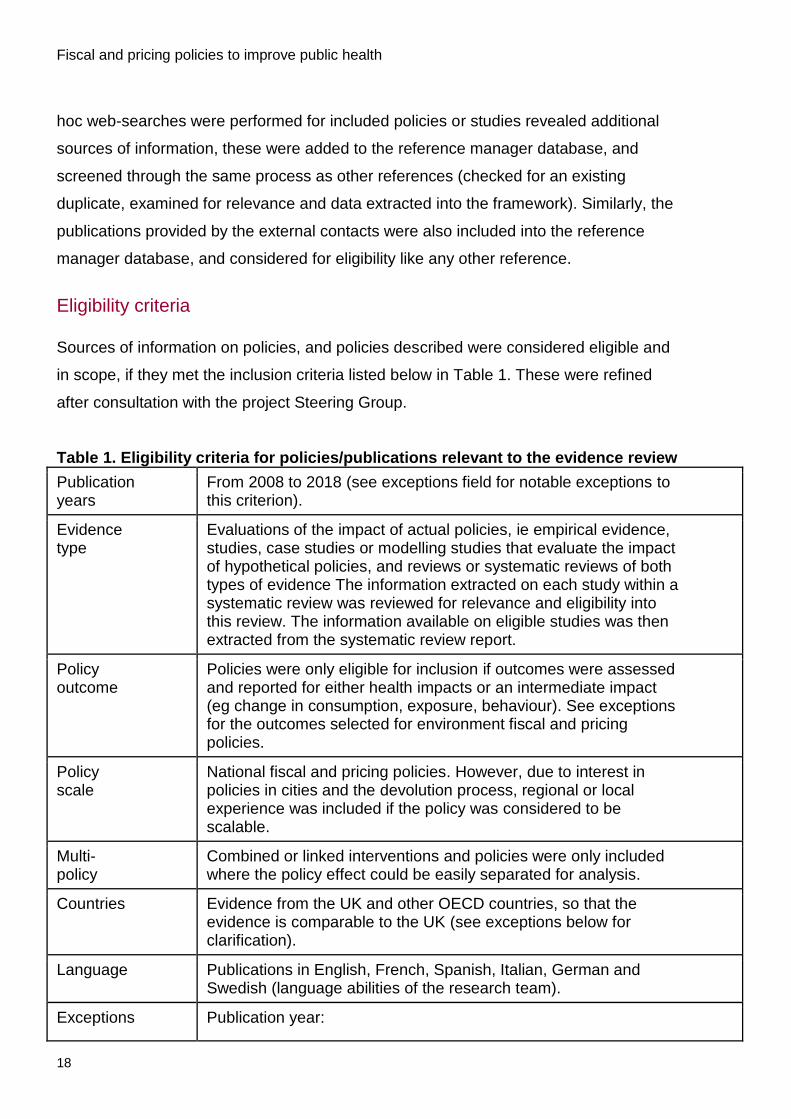
in scope, if they met the inclusion criteria listed below in Table 1. These were refined
after consultation with the project Steering Group.
Table 1. Eligibility criteria for policies/publications relevant to the evidence review
Publication years
From 2008 to 2018 (see exceptions field for notable exceptions to this criterion).
Evidence type
Evaluations of the impact of actual policies, ie empirical evidence, studies, case studies or modelling studies that evaluate the impact of hypothetical policies, and reviews or systematic reviews of both types of evidence The information extracted on each study within a systematic review was reviewed for relevance and eligibility into this review. The information available on eligible studies was then extracted from the systematic review report.
Policy outcome
Policies were only eligible for inclusion if outcomes were assessed and reported for either health impacts or an intermediate impact (eg change in consumption, exposure, behaviour). See exceptions for the outcomes selected for environment fiscal and pricing policies.
Policy scale
National fiscal and pricing policies. However, due to interest in policies in cities and the devolution process, regional or local experience was included if the policy was considered to be scalable.
Multi-policy
Combined or linked interventions and policies were only included where the policy effect could be easily separated for analysis.
Countries Evidence from the UK and other OECD countries, so that the evidence is comparable to the UK (see exceptions below for clarification).
Language Publications in English, French, Spanish, Italian, German and Swedish (language abilities of the research team).
Exceptions Publication year:
Fiscal and pricing policies to improve public health
19
Publications on sugar sweetened beverage (SSB) taxation
were only included if published from 2016 onwards, so as
not to replicate work from the PHE evidence review on fiscal
measures published in 2015 (7, 8).
Similarly, publications on Minimum Unit Pricing (MUP) for
alcohol beyond the UK were restricted to 2016 onwards, so
as not to duplicate and repeat much of the evidence that
has gone into the MUP decision in Scotland. Other alcohol
policy searches included literature from 2008 onwards.
Searches for the targeted tobacco policies were conducted
from 2010 onwards – this was based on the evidence
having been reviewed in 2010.
Due to small numbers of publications identified, the search
for fiscal and pricing gambling policies was extended back
to 2000
Countries:
Evidence on the tobacco industry levy experience was
limited to the USA and French context, as these were of
particular interest to PHE
While OECD countries were a criterion for inclusion, a few
select policies identified in non-OECD countries were
included as their specific policy settings were relevant to the
UK context. For example, experiences in Brazil were
considered comparable to other experiences in Mexico and
Chile and were therefore included.
Policy outcome:
For environment policies, policies on air pollution were only
eligible for inclusion if they focused on pollutants with
proximal impact on health. Policies focussing on
greenhouse gas emissions or carbon pricing were therefore
excluded.
Contacting experts
Experts in the field of fiscal and pricing policies for the improvement of health were a
secondary source of data collection. We contacted relevant national and international
individuals including in academia, policy and government, and authors of relevant
reports and publications with a request to circulate any published or unpublished
information, reports, or other contacts that might support the review. See Appendix C for
a short summary of the results of this contacting exercise.
Fiscal and pricing policies to improve public health
20
Review process
Titles and abstracts of all sources and references identified were screened by one
reviewer, to exclude any obviously irrelevant publications and materials. All relevant
sources were then screened in full-text by one reviewer for eligibility for this review.
Information was extracted from included publications or other information sources into
the framework, using MS Excel, and ad-hoc internet searching was conducted to
identify any additional information, in particular about the policy’s context.
Framework design
The framework was designed to help collect, standardise, organise and analyse
information on the relevant fiscal and pricing policies designed to improve public health.
Consensus on the contents of the framework was obtained through consultation with
health economists, policy analysts or advocates and members of the project steering
committee who could be potential users of such a framework.
The dimensions of the framework were split into three sections: policy description,
policy outcomes and policy context (see Appendix A for a full template of the
framework).
Policy description
the policy name (if named),
the type of evidence (either modelling study, randomised control trial or
implemented policy assessment),
the policy owner,
the type of fiscal or pricing mechanism (price increase such as a tax, or price
decrease such as a subsidy)
further details of the intended mechanism and the target risk factor or commodity of
the policy.
additional information was collected to describe the policy, such as implementation
year, the target geography and population, the timeline to achieve impacts (short,
mid or long term elasticities), the timeline of the evaluation/outcome measurement,
and any details on the logistics of implementing or passing the policy (eg cost).
Fiscal and pricing policies to improve public health
21
Policy outcomes
The second section of the framework collects information on any impacts of the direct
health impacts of the policy such as cases of disease or deaths avoided, quality
adjusted life years (QALYs) or disability-adjusted life years (DALYs) gained. We also
collected information on impacts that were not directly related to health, but that were on
the pathway to health. These intermediate, health-related proxy impacts included, for
example, dietary intake of nutrients or foods, minutes of physical activity reported, air
pollutant emissions, uptake of immunisation, smoking cessation rates. This list is not
prescriptive as the impacts reported varied by study. In addition, information on cost-
effectiveness and any information on inequality/distributional effects as well as non-
health related impacts such as revenue, and societal impacts such as school
attendance were collected.
Policy context/other
To better understand the impact of policies already implemented we collected available
information on the context around these policies including:
anecdotal (often subjective) political acceptability of the policy at the time
the main proponents or opponents of the policy
any resulting changes in public perception
what tools and building blocks were used to influence public perception and the
implementation of the policy
The framework was structured as a database in MS Excel, so that each policy was
entered as a row, and the framework fields listed as columns.
Data extraction and use of the framework
Data entry was standardised as much as possible using drop-down options, so the
framework database is searchable using filters applied on one or a combination of
fields. When a source or publication provided information on the impact and outcomes
separately for several policies (eg separate scenarios in a modelling study, examples of
the same policy in a different country or different treatment arms in an RCT) these were
extracted into the framework into different rows, and treated as separate policies or
studies.
Fiscal and pricing policies to improve public health
22
When a policy reported outcomes that related to two separate policy areas (one
example being environmental policies that influenced physical activity), the policy was
included in both areas, and was marked as such in the framework.
Policies were collected from a range of countries and years, and costs were reported
into the framework as they were, to allow conversion in the future if needed. However,
costs reported in this report were converted to GBP using the CCEMG - EPPI-Centre
Cost Converter (13) in the original cost year, but the original cost is still reported to allow
different conversions if required, or updating to a different year if necessary.
There are three main ways to analyse the data collected in the framework (see
Appendix D for a detailed user guide):
1 Look across all policy areas and examine the impact of a specific fiscal and pricing
policy type and mechanism (eg the impact of all forms of taxation across policy
areas).
2 Focus on a policy area with a specific target commodity or behaviour (eg
diet/obesity, tobacco, alcohol, gambling) and look through the various policies that
work in each one, across all types of fiscal policies.
3 Look within a specific field (housing, prevention, workplace) and look at the impact
of fiscal and pricing policies on a range of target commodities and behaviours.
The overall yield of this scoping review is summarised below, broken down by the
numbers of publications and studies identified for each policy area, the type of evidence
(implemented policy assessment, RCT, modelling study) and the countries studied. The
type of policies (taxes, subsidies, price changes) and policy targets across all policy
areas are described. In further sections, evidence for each policy area is available
separately, and illustrates the type of evidence of each one using a short summary of
one policy selected as a case study to exemplify the types of policies in each area, and
provide some insights into policies that may be of interest in the UK context.
Fiscal and pricing policies to improve public health
23
Results
From 10,114 unique abstracts and information sources, we identified 261 publications
providing information on 234 unique fiscal and pricing policies or interventions (Figure 2).
Of these:
117 covered diet and obesity (of which 9 overlapped with healthy workplace policies)
29 were aimed at promoting physical activity (of which 2 overlapped with
environmental policies and 5 overlapped with healthy workplace policies)
14 were environmental policies (2 of which overlapped with physical activity policies)
15 aimed at improving housing conditions
4 were policies on gambling
24 were policies promoting healthy workplaces (5 overlapping with physical activity, 2
with secondary prevention activities and 9 overlapping with diet and obesity policies)
18 promoting secondary prevention activities (2 overlapping with healthy workplace
policies)
the targeted tobacco and alcohol searches yielded 13 reports on tobacco policies and
18 reports on alcohol policies
While this section provides an overall summary of the evidence identified in this review,
more detail around the study design and results of each study/intervention can be found in
the framework that accompanies this report.
The majority of policies identified were based in the USA (86/234 (37%), with the remaining
policies identified from a range of countries: 48/234 (21%) from Australia/New Zealand,
37/234 (16%) from the UK, and a smaller numbers of studies and policies each located in
Canada, Western European countries, and other countries such as Mexico, Brazil and
Singapore.
Across all policy areas, taxation was the most common type of policy (77/234 reports),
followed by subsidies (73/234) and financial incentives (50/234), along with less common
types of policies or combinations (such as combined taxation on some unhealthy products
and subsidies for healthy products), or price increases such as minimum unit pricing and
congestion charging.
Fiscal and pricing policies to improve public health
24
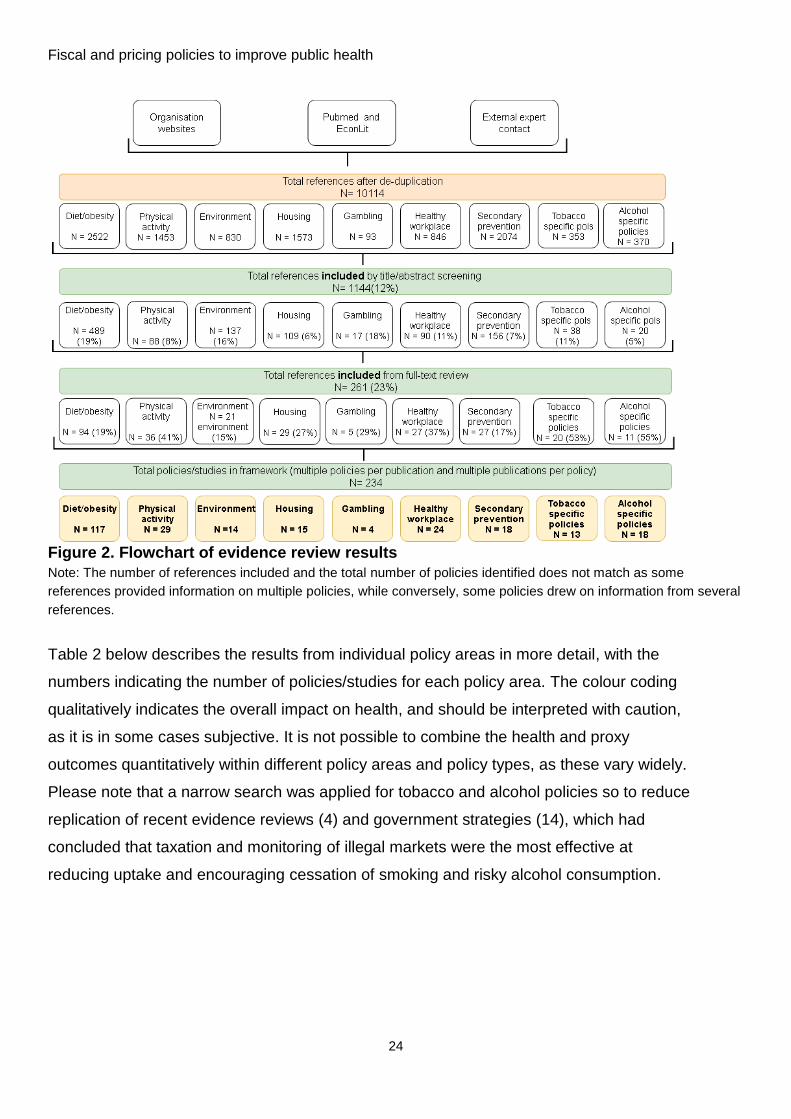
Figure 2. Flowchart of evidence review results
Note: The number of references included and the total number of policies identified does not match as some
references provided information on multiple policies, while conversely, some policies drew on information from several
references.
Table 2 below describes the results from individual policy areas in more detail, with the
numbers indicating the number of policies/studies for each policy area. The colour coding
qualitatively indicates the overall impact on health, and should be interpreted with caution,
as it is in some cases subjective. It is not possible to combine the health and proxy
outcomes quantitatively within different policy areas and policy types, as these vary widely.
Please note that a narrow search was applied for tobacco and alcohol policies so to reduce
replication of recent evidence reviews (4) and government strategies (14), which had
concluded that taxation and monitoring of illegal markets were the most effective at
reducing uptake and encouraging cessation of smoking and risky alcohol consumption.
Fiscal and pricing policies to improve public health
25
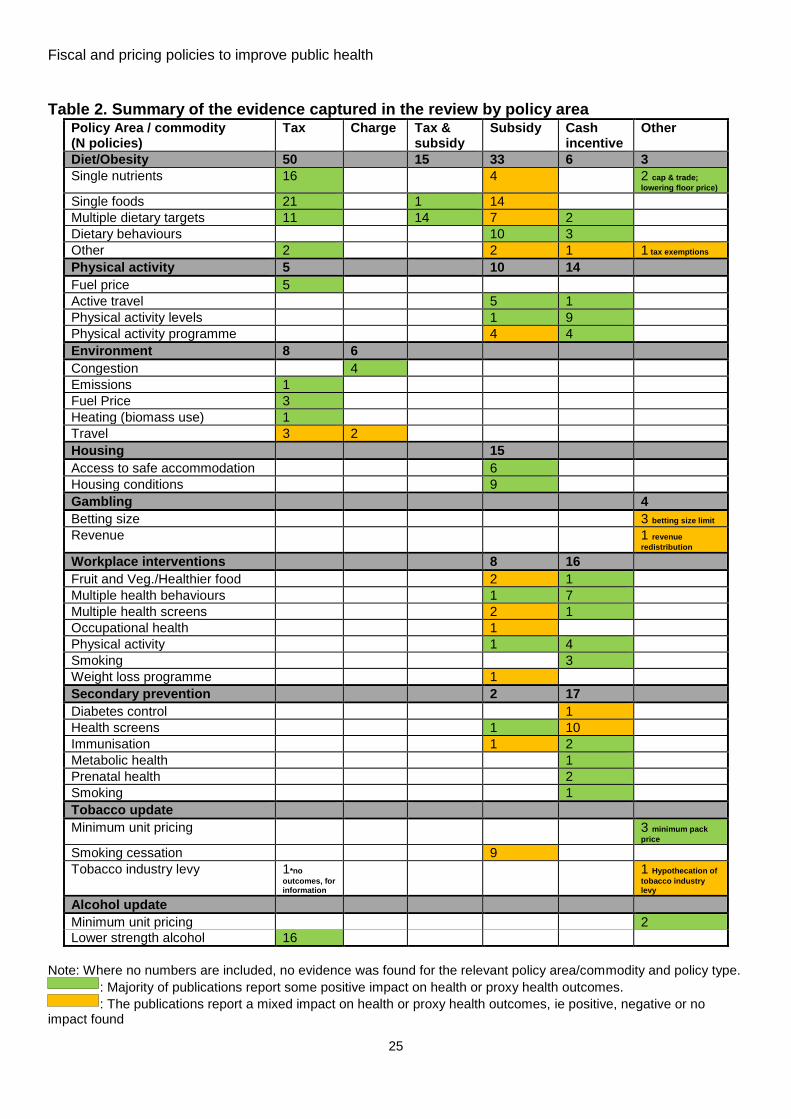
Table 2. Summary of the evidence captured in the review by policy area Policy Area / commodity (N policies)
Tax Charge Tax & subsidy
Subsidy Cash incentive
Other
Diet/Obesity 50 15 33 6 3
Single nutrients 16 4 2 cap & trade;
lowering floor price)
Single foods 21 1 14
Multiple dietary targets 11 14 7 2
Dietary behaviours 10 3
Other 2 2 1 1 tax exemptions
Physical activity 5 10 14
Fuel price 5
Active travel 5 1
Physical activity levels 1 9
Physical activity programme 4 4
Environment 8 6
Congestion 4
Emissions 1
Fuel Price 3
Heating (biomass use) 1
Travel 3 2
Housing 15
Access to safe accommodation 6
Housing conditions 9
Gambling 4
Betting size 3 betting size limit
Revenue 1 revenue
redistribution
Workplace interventions 8 16
Fruit and Veg./Healthier food 2 1
Multiple health behaviours 1 7
Multiple health screens 2 1
Occupational health 1
Physical activity 1 4
Smoking 3
Weight loss programme 1
Secondary prevention 2 17
Diabetes control 1
Health screens 1 10
Immunisation 1 2
Metabolic health 1
Prenatal health 2
Smoking 1
Tobacco update
Minimum unit pricing 3 minimum pack
price Smoking cessation 9
Tobacco industry levy 1*no
outcomes, for information
1 Hypothecation of
tobacco industry levy
Alcohol update
Minimum unit pricing 2
Lower strength alcohol 16
Note: Where no numbers are included, no evidence was found for the relevant policy area/commodity and policy type.
: Majority of publications report some positive impact on health or proxy health outcomes.
: The publications report a mixed impact on health or proxy health outcomes, ie positive, negative or no impact found
Fiscal and pricing policies to improve public health
26
Obesity and diet policy area
We extracted 117 separate policies (9 of which overlapped with healthy workplace
policies (15-23)) from 94 papers in the field of diet and obesity (15-109). The majority of
studies and policies identified were based in the USA (37/117), followed by
Australia/New Zealand (20/117) and the UK (16/117). Other countries with multiple
studies included France, Brazil, Mexico, the Nordic countries, while individual studies
were from countries such as Barbados, South Africa, India (not OECD countries but
interesting examples of policies) and Western European countries. The majority of
policies and studies were set at the national level (91/117) and the remainder where set
at either the regional or local level.
These can be broadly categorised into 50 policies increasing prices (taxes) and 47
decreasing prices (37 reporting on subsidies and 10 on incentives), as well as 15
publications combining both taxation and subsidies for different commodities in an effort
to promote a healthier diet. Three separate publications reported on alternative fiscal
policies, including one which models the impact of a cap and trade approach
(comparable to emissions trading in the environment field aimed, at reducing added
sugars in the US food supply); another report examined the impact of lowering the floor
price (government-imposed price limit on how low a price can be charged) for sugar and
another examined the impact of supermarket tax exemptions.
The commodities and behaviours targeted ranged from individual nutrients (eg sugar,
fat, sodium), individual foods (eg fruit and vegetables, sugar-sweetened beverages,
milk) to combinations of both (eg sugar taxation combined with fruit and vegetable
subsidies) and more broadly targeting specific dietary behaviours (school breakfast and
lunch, healthier/less-healthy dietary patterns, and weight loss directly). Broadly
speaking, nutrients, foods and behaviours considered less healthy (eg sugar, fat, sugar-
sweetened beverages and so called “junk foods”) were targeted through taxes, while
healthier foods and broader dietary patterns (eg fruit and vegetables, whole grains)
were promoted using subsidies, with two studies providing information on the impact of
sugar price reduction.
Fiscal and pricing policies to improve public health
27
The majority of studies were modelling studies of hypothetical policies (74/117) with the
rest being impact assessments of existing policies (29/117) using epidemiological and
econometric methods, and fewer reports of smaller scale RCTs (9) focussing primarily
on supermarket-based subsidies and school breakfast subsidies.
Overall, policies involving taxation of less healthy nutrients or foods showed more
consistent, positive outcomes, however, most studies reported proxy/intermediary
outcomes (eg consumption of ‘unhealthy’ food) (77/117) while only a small proportion
reported health outcomes (eg, disease cases or deaths avoided, DALYs). Of the
policies reporting a direct health impact, the majority (32/38) were positive, while two
found negative impacts on health, and the rest (6) found null or mixed health impacts. It
should be noted, however, that the majority of reports of direct health impacts came
from modelling studies and these are subject to a range of potential biases: modelling
studies are limited by the model structure, the input data and parameters and the
assumptions made. However, they are able to link to theoretical longer-term health
outcomes due to indirect assumptions of the impact of behaviour on health, and the
longer modelling timeframes, compared with RCTs or observational studies of existing
studies, which usually report proxy outcomes, rather than health.
These study designs, however, are also limited by the potential for responder bias,
shorter time frames, methodological and collection differences and smaller samples
representing the results. Empirical evidence such as this came in large part from
econometric analysis of sales, as well as small scale studies which sampled a very
distinct population to look at the longitudinal impact of a policy on proxy or health
outcomes (for example, the many studies conducted to evaluate the impact of the
Supplemental Nutrition Assistance Program (SNAP, also commonly known as food
stamps) and Women, Infants, and Children (WIC) programmes in the USA.
The vast majority of studies assessing nutrient, food and behavioural taxes (which
consistently showed a positive impact on health or a proxy outcome) used modelling
approaches, with a select number of reports presenting empirical impact assessments
of taxes implemented in countries, for example, the Danish fat tax (which was only
implemented for a short period of time), the Hungarian “junk food tax” and the Mexican
Fiscal and pricing policies to improve public health
28
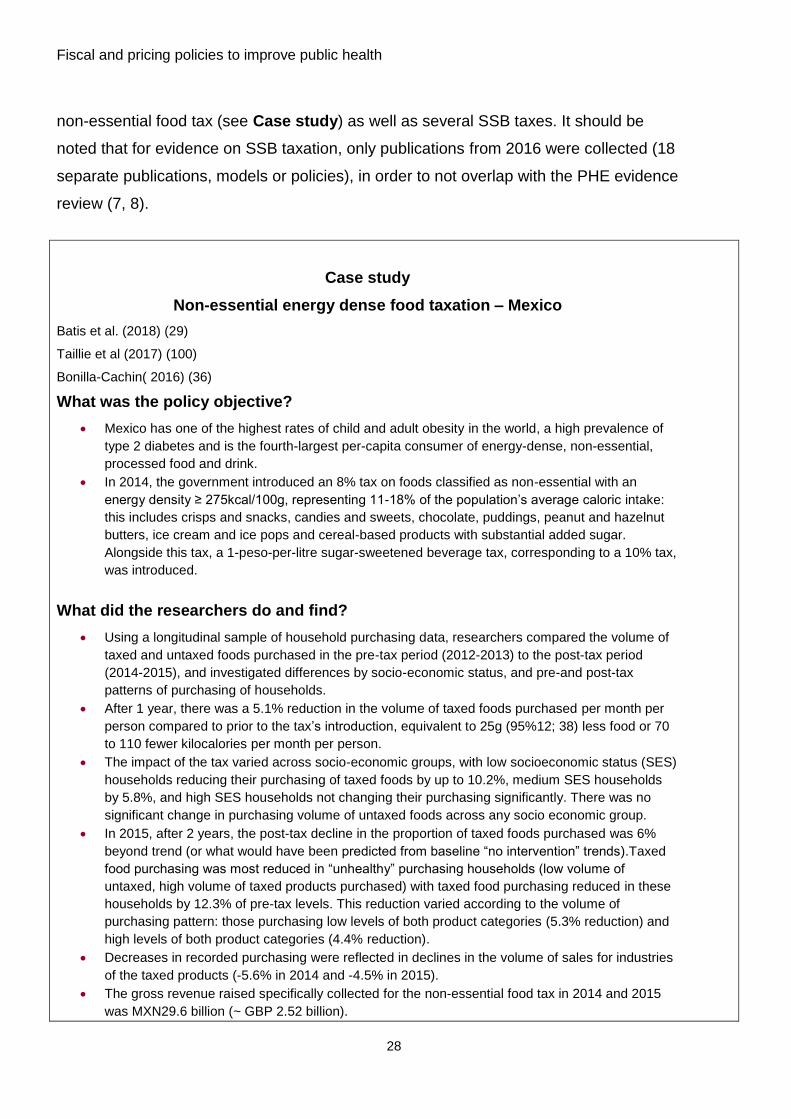
non-essential food tax (see Case study) as well as several SSB taxes. It should be
noted that for evidence on SSB taxation, only publications from 2016 were collected (18
separate publications, models or policies), in order to not overlap with the PHE evidence
review (7, 8).
Case study
Non-essential energy dense food taxation – Mexico
Batis et al. (2018) (29)
Taillie et al (2017) (100)
Bonilla-Cachin( 2016) (36)
What was the policy objective?
Mexico has one of the highest rates of child and adult obesity in the world, a high prevalence of
type 2 diabetes and is the fourth-largest per-capita consumer of energy-dense, non-essential,
processed food and drink.
In 2014, the government introduced an 8% tax on foods classified as non-essential with an
energy density ≥ 275kcal/100g, representing 11-18% of the population’s average caloric intake:
this includes crisps and snacks, candies and sweets, chocolate, puddings, peanut and hazelnut
butters, ice cream and ice pops and cereal-based products with substantial added sugar.
Alongside this tax, a 1-peso-per-litre sugar-sweetened beverage tax, corresponding to a 10% tax,
was introduced.
What did the researchers do and find?
Using a longitudinal sample of household purchasing data, researchers compared the volume of
taxed and untaxed foods purchased in the pre-tax period (2012-2013) to the post-tax period
(2014-2015), and investigated differences by socio-economic status, and pre-and post-tax
patterns of purchasing of households.
After 1 year, there was a 5.1% reduction in the volume of taxed foods purchased per month per
person compared to prior to the tax’s introduction, equivalent to 25g (95%12; 38) less food or 70
to 110 fewer kilocalories per month per person.
The impact of the tax varied across socio-economic groups, with low socioeconomic status (SES)
households reducing their purchasing of taxed foods by up to 10.2%, medium SES households
by 5.8%, and high SES households not changing their purchasing significantly. There was no
significant change in purchasing volume of untaxed foods across any socio economic group.
In 2015, after 2 years, the post-tax decline in the proportion of taxed foods purchased was 6%
beyond trend (or what would have been predicted from baseline “no intervention” trends).Taxed
food purchasing was most reduced in “unhealthy” purchasing households (low volume of
untaxed, high volume of taxed products purchased) with taxed food purchasing reduced in these
households by 12.3% of pre-tax levels. This reduction varied according to the volume of
purchasing pattern: those purchasing low levels of both product categories (5.3% reduction) and
high levels of both product categories (4.4% reduction).
Decreases in recorded purchasing were reflected in declines in the volume of sales for industries
of the taxed products (-5.6% in 2014 and -4.5% in 2015).
The gross revenue raised specifically collected for the non-essential food tax in 2014 and 2015
was MXN29.6 billion (~ GBP 2.52 billion).
Fiscal and pricing policies to improve public health
29
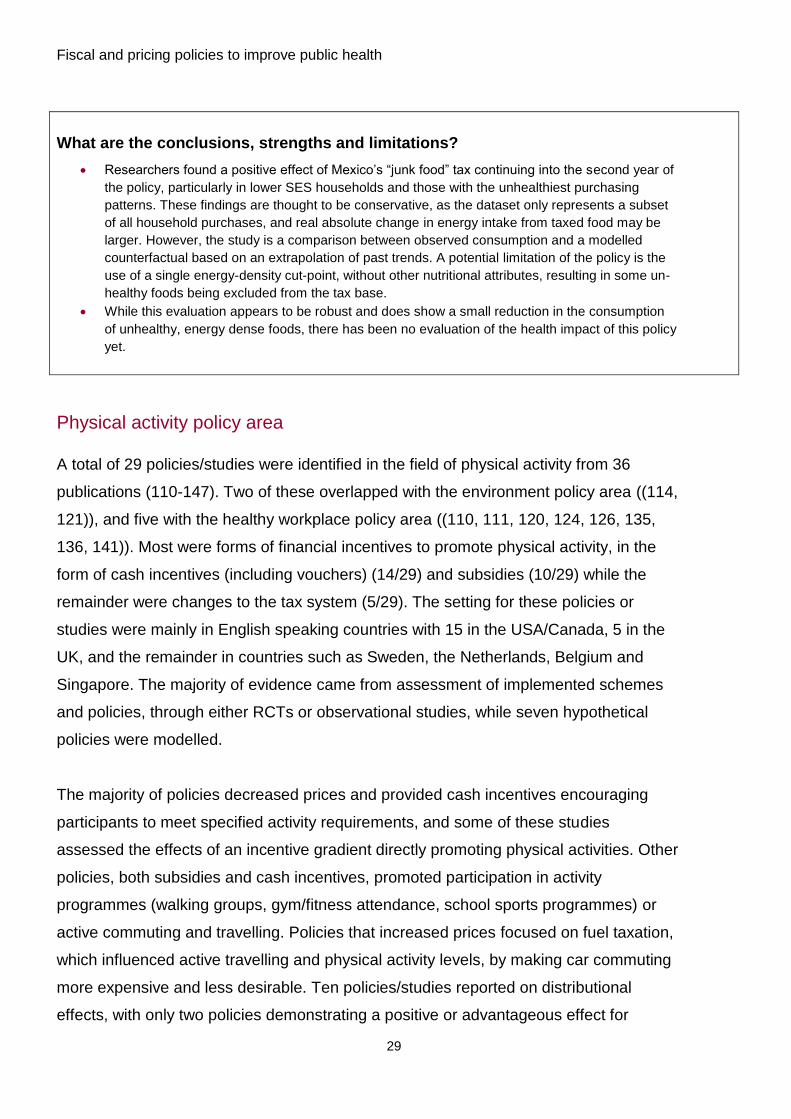
What are the conclusions, strengths and limitations?
Researchers found a positive effect of Mexico’s “junk food” tax continuing into the second year of
the policy, particularly in lower SES households and those with the unhealthiest purchasing
patterns. These findings are thought to be conservative, as the dataset only represents a subset
of all household purchases, and real absolute change in energy intake from taxed food may be
larger. However, the study is a comparison between observed consumption and a modelled
counterfactual based on an extrapolation of past trends. A potential limitation of the policy is the
use of a single energy-density cut-point, without other nutritional attributes, resulting in some un-
healthy foods being excluded from the tax base.
While this evaluation appears to be robust and does show a small reduction in the consumption
of unhealthy, energy dense foods, there has been no evaluation of the health impact of this policy
yet.
Physical activity policy area
A total of 29 policies/studies were identified in the field of physical activity from 36
publications (110-147). Two of these overlapped with the environment policy area ((114,
121)), and five with the healthy workplace policy area ((110, 111, 120, 124, 126, 135,
136, 141)). Most were forms of financial incentives to promote physical activity, in the
form of cash incentives (including vouchers) (14/29) and subsidies (10/29) while the
remainder were changes to the tax system (5/29). The setting for these policies or
studies were mainly in English speaking countries with 15 in the USA/Canada, 5 in the
UK, and the remainder in countries such as Sweden, the Netherlands, Belgium and
Singapore. The majority of evidence came from assessment of implemented schemes
and policies, through either RCTs or observational studies, while seven hypothetical
policies were modelled.
The majority of policies decreased prices and provided cash incentives encouraging
participants to meet specified activity requirements, and some of these studies
assessed the effects of an incentive gradient directly promoting physical activities. Other
policies, both subsidies and cash incentives, promoted participation in activity
programmes (walking groups, gym/fitness attendance, school sports programmes) or
active commuting and travelling. Policies that increased prices focused on fuel taxation,
which influenced active travelling and physical activity levels, by making car commuting
more expensive and less desirable. Ten policies/studies reported on distributional
effects, with only two policies demonstrating a positive or advantageous effect for
Fiscal and pricing policies to improve public health
30
disadvantaged groups. The other policies either showed no health impact for different
social groups or showed that advantaged socio-economic groups were benefiting from
the policy more the disadvantaged socio-economic groups.
The majority of policies identified reported a positive impact on health or proxy outcome
(22/29). It is difficult to identify trends in these impacts on health however, as the policy
mechanisms and targets varied across the field of physical activity, from increases in
walking associated with bus pass ownership (119, 147), to increase in physical activity
levels due to financial incentives for gym attendance (120, 123, 124). In addition, only
11 of the 29 policies were either implemented or modelled on a national scale, making
strong conclusions on their larger scale impact difficult. However, overall, the evidence
of an impact on health and health-related intermediate outcomes like physical activity
levels was strongest for taxation policies and cash incentives. The impact of subsidies
to promote the participation in physical activity programmes was more varied,
particularly for programmes aimed at children’s physical activity, see Case Study.
As the majority of the sources on incentives for increasing physical activity were trials,
information on how these polices could be scaled up and implemented nationally in a
publicly acceptable and cost efficient way is limited. Incentivising physical activity has
been shown to improve physical activity levels; however, there are conflicting results on
how long increased levels of physical activity can be maintained. Most studies are
small-scale cash or voucher programmes, which would need further research to
consider how these interventions could be scaled up to the regional or even national
level. However, the tax programmes allow analysis at a national level and present
considerations based on socio-economic status.
The overlap between physical activity policies and policies related to the environment
and healthy workplaces provides support for cross-policy area learning and could
strengthen the case for future policies, if positive health and proxy impacts can be
demonstrated for more than one area.
Fiscal and pricing policies to improve public health
31
Case study
Children’s Fitness Tax credit – Canada
Von Tigerstrom et al. (2011) (146)
Nguyen and Grootendorst (2012) (137)
Spence et al. (2010) (143)
Government of Canada. Children’s Fitness and Arts Tax Credit. 1 April 2016 (127)
What was the policy objective?
The Canadian Children’s Fitness Tax Credit (CFTC) is a national programme aimed at increasing
levels of physical activity in Canada’s youth, through a refundable tax credit for child enrolment in
physical activity programmes. The national programme grew from provincial policies and was
active between 2007 and 2016. The programme allowed a maximum claim of CAD 500 (~ GBP
287) for organised physical activity programmes for children aged less than 16 years (under 18 if
the child has a disability). The policy aimed to improve children’s participation in sport. However,
there was mounting evidence that the policy was ineffective and may have contributed to
widening the inequality gap.
What did the researchers do and find?
The researchers surveyed parents to understand their use or awareness of the CFTC and found
that among eligible respondents over half (55%) were aware of the tax credit and a third (33%)
planned to claim it in the next tax year.
28% of parents from the lowest income quartile had claimed the CFTC in 2007 while 55% of
parents from the highest income quartile claimed the credit. There were differences between
provinces on what could be claimed, which may have limited participation.
They analysed individual-level data from the Canadian Community Health Survey (2003- 2011)
using time varying effects regression analysis.
The impact of the policy on physical activity levels was positive in the first year after
implementation; however, the magnitude was small, suggesting that the CFTC raised physical
activity participation amongst children by only 2 percentage points.
Finally a difference in differences analysis was conducted confirming that the trend in sports
participations between the age groups were similar over time, and the CFTC had no impact in
preventing the decline of children’s participation in sport over time.
Research suggests that approximately 1.4 million people used the CFCT and it costs the federal
government about CAD 100 million (~ GBP 57 million) in forgone tax revenue annually.
What are the conclusions, strengths and limitations?
The main findings from the CFTC analysis was that it was ineffective in increasing children’s
physical activity and that it had a distributional effect. It appears that the tax primarily benefits
those who can afford to pay the cost of the physical activity programme up front.
This tax was implemented in a comparable country to the UK and was long lasting (over 9 years).
However, the policy never achieved its aim of improving child physical activity participation and
ultimately contributed to inequality due to the rebate nature of the tax credit.
Fiscal and pricing policies to improve public health
32
Environment policy area
A total of 14 environment studies were identified from 21 publications (114, 121, 148-
166). Two of these overlapped with the field of physical activity((114, 121)). Eight were
forms of financial or pricing measures to promote uptake of more sustainable
environment activities through taxation and the others were pricing policies/charges.
The targeted activities varied across policies and studies, but can broadly be
categorised into polices aimed at reducing congestion (4/14), taxing emissions or fuel
directly (5/14) or promoting more active methods of travel/lifestyle (5/14). Half of the
studies were hypothetical modelling studies and half were assessments of real
economic events or historical changes. Four policies were set in the UK, two in the USA
and Portugal, and a heavy focus on western European countries for the remainder of
the policies. Half of the reports focused on the national level, and the rest were local or
regional interventions and policies.
Only four studies reported direct health impacts (see Case study) while the rest
reported intermediary outcomes such as reduced emissions. Several examples of
congestion charge schemes report significant reductions in vehicle circulation and
pollutant concentrations (152-154, 161, 164). However, a lack of direct reference to the
specific health impacts of environment policies is a gap in the literature and could be a
powerful tool for future policy evaluations (163). The lack of knowledge about how
environment fiscal and pricing policies directly influence health and the limited
information available on the scalability, acceptability, or challenges of implementing
such schemes at a national level limit our conclusions from these studies. Environment
polices often have a wide scale impact and reflecting the multiple stakeholders in impact
reviews/ the academic literature is very important.
Case study
Modelling the cost-effectiveness of fuel taxation – Australia
Brown et al (2017) (114)
What was the policy objective?
Excise duty is levied on fuel and petroleum products produced or manufactured in Australia, but
the country has one of the lowest automotive fuel prices among OECD countries.
Limited evidence currently exists on the effect of fuel taxation on active transport (increased
Fiscal and pricing policies to improve public health
33
walking, cycling and use of public transport) and its potential downstream effects on health.
Researchers aimed to estimate the health and economic impacts and cost-effectiveness of an
intervention to increase fuel excise taxation in Australia.
What did the researchers do and find?
The literature on the associations between obesity, physical activity, walking or cycling and fuel
price or taxation was reviewed.
Based on the parameters extracted from this scoping review and publically available data on
population, diseases and transport, the authors used Markov modelling to estimate the cost-
effectiveness of an increase in fuel tax in Australia.
The intervention modelled was an AUD 0.10 per litre increase (~ GBP 0.05) to the 2010 national
fuel excise tax of AUD 0.38 per litre (~ GBP 0.18), which would be applied prior to the addition of
the 10% Goods and Services Tax. This higher tax would increase the proportional amount of tax
levied as a percentage of total fuel price, but would still put the Australian fuel taxation below that
of countries such as Switzerland, and the United Kingdom.
The impact on mortality and obesity-physical activity-related morbidity was modelled over the life
course of the 2010 working age population.
The implementation cost of this hypothetical increase in fuel taxation was regarded as minimal
given current taxation administration and compliance in Australia.
Over the lifetime, 237 (95% CI 138; 351) health-adjusted life years (HALYs) would be gained, due
to fewer road deaths resulting from reduced traffic.
AUD 2.6 million (95%CI 1.3; 3.9) in healthcare costs would be averted with the new tax increase
(~ GBP 1.2 million (95%CI 0.6; 1.8)).
The intervention would be cost-effective over the lifetime, with a median incremental cost-
effectiveness ratio (ICER) of AUD 7,702 (95% CI 1,366; 22,125) cost for every HALY saved (~
GBP 3,540 (95%CI 628; 10,170)). The probability of the intervention being dominant (cost saving)
however was only 0.8%.
Raising the fuel tax to AUD 0.48/L in this intervention would increase walking to access public
transport for commuting purposes by an average 90mins per week per person.
This policy would be revenue generating, with the Australian government standing to collect
around AUD 1.7 billion annually in revenue from an AUD 0.10 increase to the national fuel tax.
The range of results using less conservative but still credible inputs suggests the potential for
much larger population health gains (under a ‘plausible scenario’ 3,181 HALYS gained and AUD
34.2 million (~ GBP 15.7 million) in healthcare cost offsets.
Authors mention that there could be some distributional effects with lower and middle-income
households experiencing greater financial impact.
What are the conclusions, strengths and limitations?
The increase to Australia’s national fuel tax was cost effective and would increase active
transport. Reducing the number of cars would also have intermediate health effects, such as
reducing air pollution related diseases that were not discussed in the study.
It is likely that any such intervention would be both politically and socially sensitive so a fuel
excise intervention designed to increase rates of active transport would have to overcome
significant equity and acceptability challenges. This could occur through reinvestment of taxation
revenues into initiatives such as better provision of alternative modes of transport.
These findings highlight the fact that more research into potential health impacts in the transport
planning and policy agenda is required in order for public health considerations to be more
comprehensively considered
Fiscal and pricing policies to improve public health
34
Housing policy area
A total of 15 policies/studies were identified in the field of housing from 29 publications
(167-195). All were forms of financial subsidies. The targets were either to improve
housing conditions (9/15), such as increase access to fuel in winter, or facilitate
refurbishments to improve heating and housing insulation or to facilitate access to safer
or higher quality housing (6/15).
Six studies were based in the USA, with four in the UK, three in Australia/New Zealand,
one in Canada and one in Spain. The majority of the studies assessed the impact of
existing local schemes (9/15) such as the Moving to Opportunity voucher programme in
Georgia, USA (184), while others assessed national or regional schemes (6/15) such as
Warm up New Zealand: Heat Smart subsidy (see Case Study).
Subsidies to improve the quality of housing were generally associated with
improvements in health and health-related outcomes. Subsidies to improve access to
safe housing (for example, in safer areas, or to areas with a higher quality of living than
those currently experienced) showed less evidence of a robust effect on health. Some
studies showed that being subsidised to move to higher quality areas and housing did
little to improve families’ nutritional status, or to reduce temporary homelessness and
drug use. The outcomes reported ranged widely, from disease and hospitalisation rates,
including mental and psychological outcomes (eg reduced stress, depression scores),
to QALY gains, through to more specific health-related outcomes such as increases in
immunisation rates, nutrition status or risk behaviours (eg unsafe sex, alcohol
consumption).
Case study
Evaluation of the Warm up New Zealand: Heat Smart – New Zealand
Healthy Housing He Kainga Oranga “Evaluation of Warm Up New Zealand: Heat Smart (195)
Howden-Chapman et al. (2012) (194)
Grimes et al. (2012) (193)
Healthy Housing He Kainga Oranga (2011) (192)
What was the policy objective?
New Zealand housing has been widely described as “old and cold”. An estimated 84% of
dwellings have inadequate insulation. Respiratory and circulatory health conditions make up the
bulk of excess winter mortality and hospitalisation and these conditions are closely linked with low
Fiscal and pricing policies to improve public health
35
environmental temperature and high humidity.
Warm Up New Zealand: Heat Smart is a national subsidy programme started in 2009 to
encourage insulation and heating improvements to houses built prior to 2000. The interventions
including retrofitting ceiling insulation and/or underfloor insulation or moisture barrier. Other
measures include draught proofing, hot water cylinder wraps, and pipe lagging; funding for a
clean heating device) (such as a heat pump, a wood pellet burner, a modern wood burner or a
flued gas heater). Depending on existing characteristics of the house, applications may be for
funding for 1) insulation and clean heat, 2) insulation only, or 3) clean heat only. Most houses
were eligible for 33% of the total cost up to NZD 1,300 (~ GBP 580) of insulation and NZD 500 (~
GBP 223) for clean heating, except houses where inhabitants were on low incomes or state
benefits, in which case up to 60% of the total cost of insulation and up to NZD 1,200 (~ GBP 536)
for clean heating were available.
Up to May 2010, 46,655 dwellings were treated under the programme. Funding ceased in June
2013. The Ministry of Economic Development commissioned a full and independent evaluation
into the health impacts and cost-effectiveness of the scheme.
What did the researchers do and find?
Health impacts were determined from a retrospective cohort study. Reduced mortality is the
largest benefit of the intervention. The scheme prevented about 18 (95%CI 0; 45) deaths among
those aged 65 and over who had previously been hospitalised with circulatory disease. This is
equivalent to an annual reduction of 0.852 deaths per 1000 households, or at NZD 440 per year
per treated household by valuing life years gained using a figure of NZD 150,000 for the value of
a life year. This equates to ~ GBP 179, using a figure of ~ GBP 67,000.
No impact on mortality after hospitalisation with respiratory conditions was identified. However,
small but statistically significant lower hospitalisation costs for both respiratory and circulatory
conditions were incurred.
Researchers found an annual overall benefit per household of NZD 563 (~ GBP 251) for
retrofitted insulation and only NZD 4.64 (~ GBP 2.1) for improved heating, with a higher figure for
those receiving the scheme as low-income households. This was calculated by combining the
change in total hospitalisations and total pharmaceuticals with reductions in mortality and benefits
imputed from previous studies (including reduced frequency of GP visits, reduced days off work
and reduced days off school).
Cost-effectiveness analyses found a net benefit of NZD 0.95 billion (~ GBP 0.42 billion), using the
estimated benefits for the programme of NZD 1.28 billion (~ GBP 0.57 billion) compared with an
intervention cost of NZD 0.33 billion (~ GBP 0.15 billion). When health and energy results were
combined with an analysis of industry impacts and employment changes, results of the cost
benefit analysis were still highly favourable. The preferred scenario estimated that the
programme will have a highly favourable benefit cost ratio of 3.9:1.
What are the conclusions, strengths and limitations?
Retrofitted insulation delivered through the Warm Up New Zealand: Heat Smart Programme had
a significant impact on reducing hospitalisation and pharmaceutical costs for occupants of houses
that had been remediated compared to those living in matched houses in the area, who had not
received insulation or heating as part of the Programme.
This study is observational, rather than experimental, and this leads to the possibility for
confounding where the self-selecting treatment group differs systematically from the matched
control group. This issue could be potentially biasing the results, either upwards or downwards.
It is important to note that these benefits do not include any improvements in comfort, which are
separate from health-related benefits, and so these calculated benefits are conservative.
Fiscal and pricing policies to improve public health
36
Gambling policy area
A total of four policies were identified in the field of gambling from five publications (196-
200). None of the policies was directly aimed at improving health as a primary outcome,
but they possibly had an impact on health indirectly. These indirectly targeted gambling
frequency and gambling expenditure as key risk factors, mostly through restrictions on
bets, note input (for example by reconfiguring note acceptors to allow only bets of
smaller monetary value) and maximum wins, and reductions in reel speed. These all act
to set a maximum limit on the price of each instance of gambling, thereby modifying the
price per “unit” of gambling. One publication assessed the possible impact of
redistribution of gambling revenue to fund public health services and improve
community health status in a county in Mississippi, USA and so was included despite
not directly representing a fiscal or pricing policy.
Three identified interventions were introduced in Australia at the local-level (ie clubs and
hotels in the metropolitan and rural areas of New South Wales) in 2000 and at a
regional level (ie Tasmania) in 2008. In Europe, one policy was introduced at a national
level in Norway in 2006. It remains unclear whether these polices had any measurable
impacts on health, but overall, the policies focused on minimising bet size and gambling
expenditure did result in reduced overall betting behaviours and the overall value of the
bets during betting.
Despite the rapid growth of the gambling industry across the world, only a few countries
have studied the impact of any pricing measures to promote a reduction in gambling on
health impacts of gamblers. Gambling has been linked to declines in mental health and
well-being, in particular in young people, (201-203) so there is a real need for more
evaluation of policies to curb gambling behaviour in a range of populations.
All identified policies were introduced in the 2000s, with a focus on the physical features
of electronic gambling machines. Given the market trend to shift towards online betting
systems in the past decade, any of the mentioned physical interventions may not be
sufficient to target the growing number of online gamblers. However, there might be
some lessons that could be learnt and incorporated into an online regulatory framework.
Overall, studies exploring possible regulations of online betting places are required to
identify meaningful interventions that could be adopted more widely.
Fiscal and pricing policies to improve public health
37
Case study
Limiting cash flow on slot machines – Norway
Hansen and Rossow (2010) (200)
What was the policy objective?
Research has pointed at the addictive nature of gambling on slot machines which may be linked
to the rapid event frequency, short period between stake and pay out or loss, reinforcing sounds
and colours, as well as the risk for loss of control over spending. However, the past decades
have seen substantial rises in this form of gambling across the world, and in Norway slot
machines were found to be the most dominant form of gambling in both adults and adolescents.
From July 2006, all slot machines in Norway were modified by replacing bank note acceptors with
coin slots. This led to a reduction in the highest betting stake from 25 EUR to 2.50 EUR.
What did the researchers do and find?
Despite a minimum gambling age of 18 years in Norway, enforcement of age restrictions were
found to be difficult. The aim of this study was to investigate the impact of a modification of slot
machines on youth gambling, particularly to assess changes in gambling frequency, gambling
expenditures and problem gambling in adolescents.
The authors used data from the Norwegian school survey with a representative sample size of
20,703 students in 2004 and 21,295 in 2005 (pre-intervention), and 20,695 in 2006 (post-
intervention).
The policy intervention led to a significant 26% reduction in weekly gambling frequency amongst
adolescents, and the overall gambling frequency was reduced by 10%. In the post-policy period,
participants were 27% less likely to have gambled more than 63 EUR on slot machines the
following week. Moreover, the proportion of problem gamblers as measured using a
questionnaire was reduced by 20% as a result of the policy when controlling for person-level
confounders.
What are the conclusions, strengths and limitations?
The modification of slot machines that led to the removal of note acceptors was associated with
significant decreases in gambling frequency, gambling expenditure, and problem gambling
amongst adolescents. Previous research has shown that coinless machines can speed up
gambling games by 15%, with the removal of notes acceptors facilitating a break up of sessions,
which might reduce the likelihood of rapid and continuous gambling. Breaks might also help the
gambler to reconsider whether any gambling activity should be continued.
There are several limitations to this study. The authors investigated a short follow-up period,
which may not be sufficiently long enough to assess the full impact of any policy implementation.
Any observed changes were believed to be associated with the change in slot machines;
however, it is possible that other secular trends, such as a change in social norms, contributed to
the reduction in gambling frequency and problem gambling. The key strength of this study is the
relatively large sample size and high response rate amongst students.
Fiscal and pricing policies to improve public health
38
Healthy workplace policy area
A total of 24 policies/studies were identified in the field of healthy workplace from 27
sources (15-23, 109-111, 120, 124, 126, 135, 136, 141, 204-212), with five overlapping
with the physical activity policy area (110, 111, 120, 124, 126, 135, 136, 141), two
overlapping with the policy area of secondary prevention (210, 212) and 9 overlapping
with diet and obesity (15-19, 21-23). All were forms of financial incentives to promote
health-improving behaviour, for example, an initiative aimed at increasing activity
through increasing steps taken in a working day amongst employees, or subsidising
healthy food from the office canteen. This included direct financial incentives (16/24)
and subsidies in the form of tax credits (8/24). The majority of identified interventions
aimed at increasing a range of health behaviours, with the most frequent being
increasing levels of physical activity, followed by incentivising a healthier diet, which
includes increasing the consumption of foods such as fruit and vegetables. While most
interventions targeted the general workforce population, some policies were directed
towards specific risk groups, for example workers suffering from diabetes (2/24),
smokers (2/24), or those classified as being obese (2/24).
The majority of identified interventions were policies and programmes implemented
within workplaces and assessed using RCTs or observational studies, while one source
modelled potential policies. Most interventions took place in English speaking countries,
such as the United States (17/24) with two each in the UK and Korea and one each for
Australia, Singapore and Sweden.
Twenty-two studies reported direct impacts on indicators of workers’ health, whereas
two studies introduced policies that are associated with indirect improvements in health.
This included enrolment in health risk assessments, and increased health insurance
coverage. The majority of studies found significant results, leading to improvements in
workers’ health, such as reductions in weight, smoking cessation, healthier eating by
opting for foods with greater nutritional value (as defined in the papers included) at the
workplace cafeteria, and higher levels of physical activity, for example through using the
staircase more often.
Fiscal and pricing policies to improve public health
39
Because most interventions were introduced at a small-scale in a company setting and
with voluntary participation, there is little information to infer scalability, acceptability,
costs or potential revenues if rolled out at a national level. Moreover, little is known
about the long-term impact of these interventions, particularly in the absence of financial
incentives once the policy has terminated. In most included interventions, authors
evaluated policy effects over a short follow-up period (often less than one year).
Because most interventions were implemented in a company setting, with the overall
objective to improve workers health to lower rates of absenteeism and increase
productivity, it remains questionable to what extent governments could adopt any of the
incentives to derive the same benefits for the general workforce. Finally, most
interventions relied on voluntary participation, and it is unclear whether compulsory
enrolment into health improvement schemes would yield similar effects.
Case study
Financial incentive for achieving target weight in obese workers – USA
Kullgren et al. (2013) (18)
What was the policy objective?
People suffering from obesity are more likely to die prematurely, often suffer from multi-morbidity,
are costly for employers because of productivity losses and to the taxpayer, or insurers due to
higher health care costs.
Previous research has shown that financial incentives can lead to short-term reductions in weight,
however little was known about the impact of financial incentives within a group, a setting
commonly found in the workplace.
What did the researchers do and find?
Researchers recruited 105 employees based at the Children’s Hospital of Philadelphia, all with a
BMI in the range of 30 to 40. The target aim of the intervention was to lose 24 pounds over a 24-
week intervention period.
A randomized controlled trial was used to assess the impact of financial incentives for two
groups:
a) individual arm, where employees receiving USD100 for achieving a monthly weight loss target,
and
b) group-based, where employees receiving USD100 for achieving their monthly weight loss
target, but with an additional cash prize at the end of the 4-month period if all assigned group
members reached a weight below the target.
The researchers found that participants who were part of the group-based intervention arm lost
significantly more weight over the observation period compared with participants who were
allocated to the individual arm. Moreover, group-based weight loss was sustained for longer, with
the mean reported weight loss of 6.5 pounds at twelve weeks after the financial incentive ended.
Fiscal and pricing policies to improve public health
40
What are the conclusions, strengths and limitations?
Using financial incentives in combination with peer-pressure can lead to a significant reduction in
weight for people classified as obese. This mechanism is particularly important since many large
companies were found to operate some incentive scheme to reduce weight in the workforce, but
mostly aimed at the individual level. Harnessing social structures in the workplace can help
reduce costs associated with introducing financial incentives by introducing lower incentives that
have similar benefits to incentives in individuals alone.
The study had a short follow-up period to assess the long-term sustainability of the achieved
weight loss. The motivation to achieve large weight loss goals may not have been sustainable
over a longer intervention period.
Secondary prevention policy area
A total of 18 policies/studies were identified in the field of secondary prevention from 27
publications (18, 57, 109, 125, 145, 207, 210, 213-232). Two of these overlapped with
the field of healthy workplace policies ((210, 212). Sixteen were forms of financial
incentives to promote uptake of secondary prevention activities, in the form of cash
transfers while two were direct subsidies. The target secondary prevention activities
varied across policies and studies, but can broadly be categorised into promotion of
health screens for a range of diseases, such as cardiovascular disease, diabetes,
colorectal cancer and sexual health (10/18), promotion of uptake of immunisation (2/18),
and six related to the promotion of healthy activities such as physical activity, diabetes
control, multiple disease prevention(eg for CVD and diabetes and kidney disease at the
same time), prenatal care and smoking cessation.
The majority of the studies were either observational or RCTs studies assessing
existing programmes and policies (17/18). The setting for these policies or studies were
mainly in English speaking countries with 10 in the USA/Canada, 4 in Australia, 3 in the
UK and 1 in Mexico.
Only one policy of prenatal subsidies in Canada reported direct impacts on health (see
Case study), while the rest reported intermediary outcomes on the pathway to health.
The majority of these policies and studies incentivising secondary prevention activities
found significant results, although two studies incentivising colorectal cancer screening
through either Faecal Immunochemical Test or Faecal Occult Blood testing did not
show a significant impact in uptake of testing.
Fiscal and pricing policies to improve public health
41
As the majority of the sources on incentives for secondary prevention activities were
small-scale randomised trials, there is little information available on the scalability,
acceptability, costs or potential revenues of implementing such schemes at a national
level. Policies that have been implemented and evaluated have shown health impacts
and impacts on intermediate health outcomes, but these effects remain small, with little
information on long-term changes. Further research would need to be undertaken to
consider how these interventions can be developed to regional or even national level,
and more in depth analysis of the equity considerations for such policies would be
needed, as well as more consideration of long-term effects.
Case study
Incentive for perinatal health outcomes – the Health Baby Prenatal Benefit–
Canada
Brownell et al. (2016)(225)
Brownell et al. (2015) (226)
What was the policy objective?
Perinatal outcomes are known to influence health status of children throughout their life course,
women living in poverty are more likely to be exposed to high levels of stress, have inadequate
nutritional intake and smoke and/or drink during pregnancy and are more likely to give birth to
preterm or low or high birth weight infants.
Through universal healthcare in Canada, prenatal care is already provided free of cost, but the
Canadian province of Manitoba introduced the Health Baby Prenatal Benefit (HBPB) to improve
prenatal health and birth outcomes for women in their second and third trimester of pregnancy on
very low income (annual income below CAD 32,000 , equivalent to GBP 17,557)
HBPB prenatal income support of up to CAD81 (GBP45) per month to eligible pregnant women
(representing an almost 10% increase in monthly income) to be used with no conditional
requirement.
What did the researchers do and find?
Using a range of regional population, health and medical databases for 2003 to 2010, they
compared multiple birth and early life outcomes between mother-infant pairs who received the
HBPB and a comparison group of comparable pregnant women receiving welfare.
Receipt of the HBPB resulted in higher rates of breastfeeding initiation (6%), a decreased length
of stay in hospital after uncomplicated vaginal birth, lower odds of a low birth weight, pre-term,
small for gestational age and greater odds of a large for gestational baby (13%), and up to 20%
greater odds of complete immunisation records for the child at two years old.
What are the conclusions, strengths and limitations?
Imposing conditions on incentives such as income supplements may not be necessary to achieve
a number of positive prenatal and perinatal health outcomes
Fiscal and pricing policies to improve public health
42
This study used administrative databases, which provided rarely available risk factor data, and
avoids the problem of reporting and bias in participant’s recall.
Comparability of income between exposed and unexposed may not have ensured total
comparability of the population, and only limits conclusions to very-low income women.
It was not possible to determine why the HBPB made the difference. Further research is needed
to ascertain if this was through reduced stress, through on time payment of rent, or better
nutrition, for instance.
Targeted searches for tobacco and alcohol policies
Tobacco
The use of taxation on tobacco to promote reduction in consumption is long standing
and has been implemented by many governments, in a range of countries globally
(233). The body of evidence on such policies for tobacco and reviews of the
effectiveness of this strategy is large (5, 10, 234). Reviews conclude that traditional
taxes on tobacco products represent one of the most effective means of tobacco control
(235), and these conclusions still hold. It was therefore not necessary to review the
whole body of literature on these overall fiscal policies for tobacco control. Instead, the
focus was on collecting evidence to answer targeted questions of interest. Evidence
was included if published after 2010, the date of collection of data for the International
Agency for Research on Cancer review (235).
The specific fiscal and pricing policy areas of interest in the field of tobacco were:
1. Taxation of e-cigarettes (with a focus on VAT reduction as an incentive to switch)
2. Minimum unit pricing for cigarettes/packs
3. Incentives to promote smoking cessation in pregnancy/in low socio-economic
populations
4. Hypothecation of a tobacco industry levy for smoking cessation activities (special
focus on this policy in France and USA)
Findings from the individual reviews are described below: 1 Taxation of e-cigarettes (with a focus on VAT reduction as an incentive to switch)
The revised European Union Tobacco Products Directive is now fully operational in
England, transposed into UK law through the UK Tobacco and Related Products
Fiscal and pricing policies to improve public health
43
Regulations 2016, and covers e-cigarettes and nicotine-containing e-liquids that do not
have a medicinal licence. Alongside products regulated in line with the EU Tobacco
Products Directive, manufacturers can also apply for medicinal licensing from
the Medicines and Healthcare products Regulatory Agency. However, no licensed e-
cigarette has yet been marketed. No study or report on the impact of e-cigarette
taxation on health or health related outcomes was identified. It may be too early for
estimates, but any study on this should be included in the framework as the evidence
emerges over time.
2 Minimum unit pricing for cigarettes/packs
One USA study (236) was included which examined the impact of three federal level
minimum cigarette pack prices on sales and numbers of smokers, and estimated that a
USD 10 minimum pack price would result in 5.7 billion fewer packs being bought per
year nationally, corresponding to an approximate 41.0% reduction in sales and 10.7
million fewer smokers due to cessation .
3 Incentives to promote smoking cessation in pregnancy/in low socio-economic
populations
Several studies and systematic reviews assessed the impact of financial incentives to
promote smoking cessation in pregnant women, and these were mainly RCTs
comparing usual care to vouchers or cash contingent on the rate of pregnant women
quitting smoking and remaining a non-smoker which was assessed biochemically in
most studies (237-248). These studies found mixed evidence of effectiveness, and
effects appeared to wane over time, which is common to all stop-smoking interventions.
Two reports were included on a trial and a scheme implemented since the Cochrane
review (238) in the North of England, which have shown a significant impact in quit rate.
The size of the incentive in these England-based interventions was similar to that
offered in the trials included in the aforementioned Cochrane Review, which overall
reported significant effects on abstinence: in a single arm intervention study which in
Derbyshire provided vouchers worth GBP8 to GBP 32 over up to 32 visits pre and
postpartum, contingent on smoking abstinence assessed by monoxide testing, 60% of
239 participants enrolled in a scheme attempted quitting during pregnancy, with 20%
being confirmed quitters at delivery and 10% 6 months post-partum (240). In a scheme
Fiscal and pricing policies to improve public health
44
rolled out and assessed during 2012-2013 in the North of England, quasi-financial
incentives in the form of vouchers that could be spent at a range of high street shops
were used as an incentive. Each woman was eligible to receive a maximum of £260
worth of vouchers - if she was recruited in the early weeks of pregnancy and remained
smoke free at the 12-week post- partum point. Out of the 403 women recruited to the
scheme 69% set a quit date and achieved a four-week quit, 71% (n=200) of those went
on to be still quit at time of delivery, and 51% (n=142) were still not smoking at 12
weeks post-partum. This scheme has been extended to other regions of the UK since.
For a more in-depth description of one of these intervention trials in Scotland, see the
Case Study below.
4 Hypothecation of a tobacco industry levy for smoking cessation activities (special
focus on this policy in France and USA).
In 2017, France passed legislation to levy a 5.6% tax on producers and suppliers of
tobacco. By taxing suppliers, the government targets the largest supplier of tobacco in
France – Logista that accounts for 98% of sales revenue from tobacco product. The
government anticipates that Logista will pass this new charge on to the big tobacco
companies whose products they distribute. A key feature of this new tax is that all the
money will be devoted to government anti-tobacco initiatives. The government agency
normally responsible for tobacco control in France is the Health Department. However,
because the new tax measure was included in the law that governs universal health
insurance, the new tobacco control funds will be administered by a national health
insurance agency, which is used to administering health insurance claims, but has little
experience in tobacco control. Tobacco industry estimates that this new tax will increase
a 20 pack of cigarettes by 15 cents to EUR6.50; and will increase the price of a 30g
pack of rolling tobacco by 15 cents to EUR 7.40; and increase a pack of 20 cigarillos by
35 cents to EUR 7 (249-255).
No information was identified on the impact of recent earmarking policies of a tobacco
industry levy implemented in some states in the USA towards tobacco cessation
activities. It may be too early for any health impact to be evaluated for these policies.
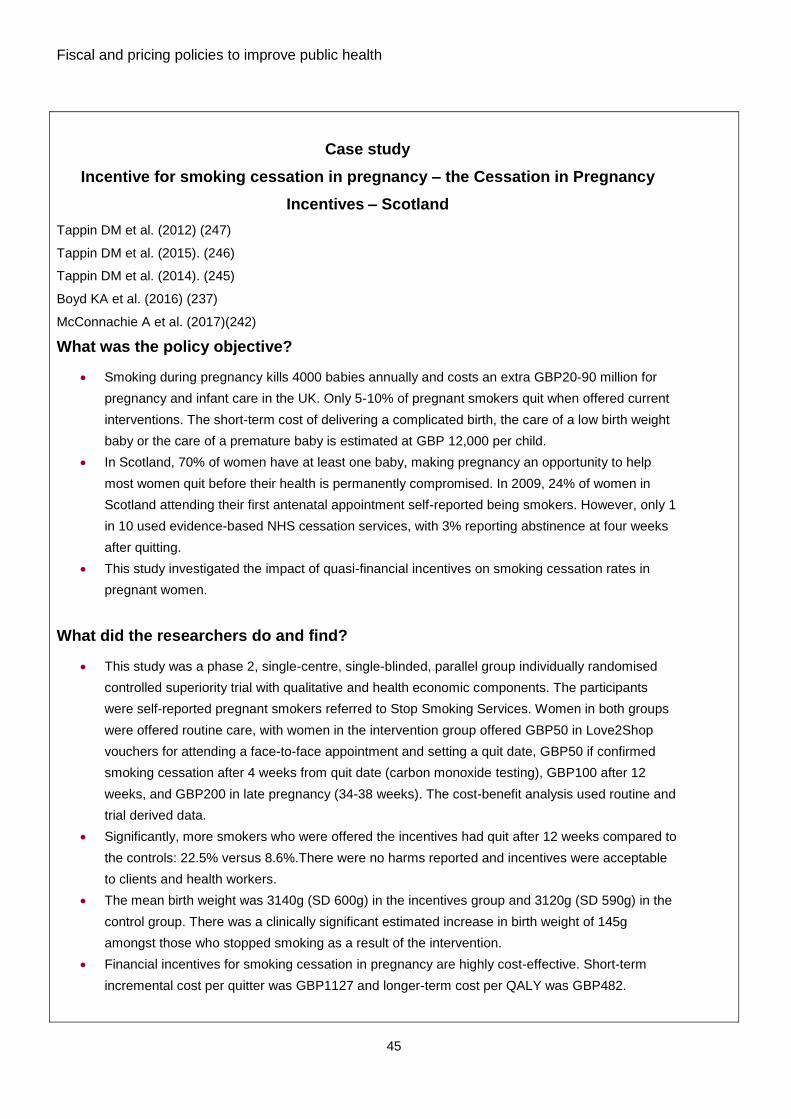
Fiscal and pricing policies to improve public health
45
Case study
Incentive for smoking cessation in pregnancy – the Cessation in Pregnancy
Incentives – Scotland
Tappin DM et al. (2012) (247)
Tappin DM et al. (2015). (246)
Tappin DM et al. (2014). (245)
Boyd KA et al. (2016) (237)
McConnachie A et al. (2017)(242)
What was the policy objective?
Smoking during pregnancy kills 4000 babies annually and costs an extra GBP20-90 million for
pregnancy and infant care in the UK. Only 5-10% of pregnant smokers quit when offered current
interventions. The short-term cost of delivering a complicated birth, the care of a low birth weight
baby or the care of a premature baby is estimated at GBP 12,000 per child.
In Scotland, 70% of women have at least one baby, making pregnancy an opportunity to help
most women quit before their health is permanently compromised. In 2009, 24% of women in
Scotland attending their first antenatal appointment self-reported being smokers. However, only 1
in 10 used evidence-based NHS cessation services, with 3% reporting abstinence at four weeks
after quitting.
This study investigated the impact of quasi-financial incentives on smoking cessation rates in
pregnant women.
What did the researchers do and find?
This study was a phase 2, single-centre, single-blinded, parallel group individually randomised
controlled superiority trial with qualitative and health economic components. The participants
were self-reported pregnant smokers referred to Stop Smoking Services. Women in both groups
were offered routine care, with women in the intervention group offered GBP50 in Love2Shop
vouchers for attending a face-to-face appointment and setting a quit date, GBP50 if confirmed
smoking cessation after 4 weeks from quit date (carbon monoxide testing), GBP100 after 12
weeks, and GBP200 in late pregnancy (34-38 weeks). The cost-benefit analysis used routine and
trial derived data.
Significantly, more smokers who were offered the incentives had quit after 12 weeks compared to
the controls: 22.5% versus 8.6%.There were no harms reported and incentives were acceptable
to clients and health workers.
The mean birth weight was 3140g (SD 600g) in the incentives group and 3120g (SD 590g) in the
control group. There was a clinically significant estimated increase in birth weight of 145g
amongst those who stopped smoking as a result of the intervention.
Financial incentives for smoking cessation in pregnancy are highly cost-effective. Short-term
incremental cost per quitter was GBP1127 and longer-term cost per QALY was GBP482.
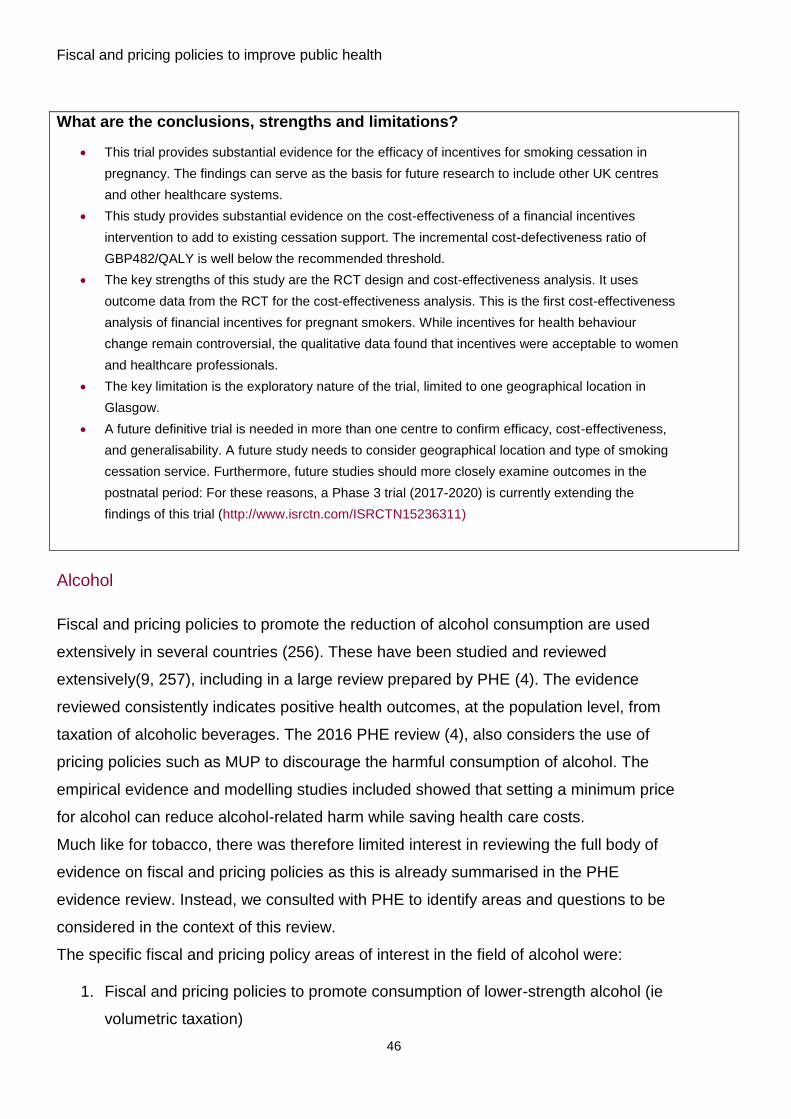
Fiscal and pricing policies to improve public health
46
What are the conclusions, strengths and limitations?
This trial provides substantial evidence for the efficacy of incentives for smoking cessation in
pregnancy. The findings can serve as the basis for future research to include other UK centres
and other healthcare systems.
This study provides substantial evidence on the cost-effectiveness of a financial incentives
intervention to add to existing cessation support. The incremental cost-defectiveness ratio of
GBP482/QALY is well below the recommended threshold.
The key strengths of this study are the RCT design and cost-effectiveness analysis. It uses
outcome data from the RCT for the cost-effectiveness analysis. This is the first cost-effectiveness
analysis of financial incentives for pregnant smokers. While incentives for health behaviour
change remain controversial, the qualitative data found that incentives were acceptable to women
and healthcare professionals.
The key limitation is the exploratory nature of the trial, limited to one geographical location in
Glasgow.
A future definitive trial is needed in more than one centre to confirm efficacy, cost-effectiveness,
and generalisability. A future study needs to consider geographical location and type of smoking
cessation service. Furthermore, future studies should more closely examine outcomes in the
postnatal period: For these reasons, a Phase 3 trial (2017-2020) is currently extending the
findings of this trial (http://www.isrctn.com/ISRCTN15236311)
Alcohol
Fiscal and pricing policies to promote the reduction of alcohol consumption are used
extensively in several countries (256). These have been studied and reviewed
extensively(9, 257), including in a large review prepared by PHE (4). The evidence
reviewed consistently indicates positive health outcomes, at the population level, from
taxation of alcoholic beverages. The 2016 PHE review (4), also considers the use of
pricing policies such as MUP to discourage the harmful consumption of alcohol. The
empirical evidence and modelling studies included showed that setting a minimum price
for alcohol can reduce alcohol-related harm while saving health care costs.
Much like for tobacco, there was therefore limited interest in reviewing the full body of
evidence on fiscal and pricing policies as this is already summarised in the PHE
evidence review. Instead, we consulted with PHE to identify areas and questions to be
considered in the context of this review.
The specific fiscal and pricing policy areas of interest in the field of alcohol were:
1. Fiscal and pricing policies to promote consumption of lower-strength alcohol (ie
volumetric taxation)
Fiscal and pricing policies to improve public health
47
2. Evidence of alcohol duty policy implemented, not modelled outside of the EU
3. Experience of minimum unit pricing outside the UK. (While the other publications
followed the general review inclusion criteria, the evidence of health impacts of
minimum unit pricing policies outside of the UK were limited to publications after
2016. This is due to the publication of the PHE evidence review in 2016.
Findings from the individual reviews are described below:
1 Fiscal and pricing policies to promote consumption of lower-strength alcohol (ie
volumetric taxation)
Out of seven publications identified (258-264), 16 different models of volumetric taxation
were included in the framework. The majority of publications focused on modelling the
impact of different volumetric taxation schemes in Australia (see the Case study
section for more details on these modelled scenarios), and one study modelled the
potential for volumetric alcohol taxation in the UK (264). Outcomes reported in these
modelling studies included deaths avoided and DALYs gained. Conclusions based on
these publications are limited by the inherent limitations of modelling studies, but
nevertheless offer consistent evidence of a positive impact on health of volumetric
taxation of alcohol. For example, the UK study identified that a volumetric taxation that
could match the estimated impact of a £0.50 minimum unit price policy currently
implemented in parts of the UK would mean replacing the current excise duty with a
duty of £0.22 per unit for all beverage types on top of the current system of excise duty
and value added tax (VAT) in England with no change to any taxes in the rest of the
supply chain, either at the production or wholesale stages, would result in a 4.3%
reduction in number of deaths per year in the total drinking population compared to
baseline, corresponding to 530 fewer deaths per year (264).
2 Evidence of alcohol duty policy implemented, not modelled outside of the EU
There was no information found on health impact assessments of alcohol duty policies
implemented in countries outside the EU. This might be because of a lack of focus on
assessing existing policies, with more focus in the literature on modelling modifications
to existing or new policies.
Fiscal and pricing policies to improve public health
48
3 Experience of minimum unit pricing outside the UK (after 2016)
The evidence on minimum unit pricing policies reviewed was limited to evidence from
2016 onwards, and from outside of the UK. This was to both avoid duplication with the
PHE 2016 report on the topic and avoid repeating information on MUP studies in the
UK, which have been discussed at length and in part contributed to the implementation
of £0.50 MUP in Scotland.
The PHE reviewed empirical and modelling studies of MUP, and concludes, “empirical
evidence and modelling studies have shown that setting a minimum price for alcohol
can reduce alcohol-related harm while saving health-care costs”.(4) We considered
additional evidence from 2016 onwards, outside the UK, and identified two publications
which added to the outcomes of policies included in the PHE review.
One publication was an assessment of the impact of MUP in Saskatchewan on acute
hospital admissions (265). The Canadian province of Saskatchewan implemented a set
of minimum prices across multiple beverage categories in 2010, and these price limits
were made partially ‘alcohol volumetric’, applying both to sales in liquor stores and to
prices paid by owners of bars and restaurants. In the latest 2017 publication on this
policy, there was an observed 40% reduction in motor vehicle collision-related
emergency department visits for women aged 26 and over only, six months after the
policy intervention. However, no impact on other age groups or men was detected.
The other publication was a 2016 modelling exercise considering a mandatory MUP of
AUD$1.00 per standard drink measure in Australia (258). This report was based on
previous work on MUP (266) (included in the PHE review), but this recent report
included in the framework presents findings on the regressively of such a policy in
Australia. A MUP was found to be largely regressive, with overall spending of beer, wine
and spirits combined representing 2.7% of income for lowest income quintile
consumers, compared to 0.3% in the highest quintile consumers. This distributional
impact however, translates into 11.5 fewer standard drinks consumed per week in the
lowest-income wine consumers, compared to only 2.5 fewer standard drinks per week
less in highest income wine consumers. The predicted impact on consumption of beer
was not as different across income quintiles (5.7 standard drinks for lowest and 5.4
standard drinks lower in the highest income group).
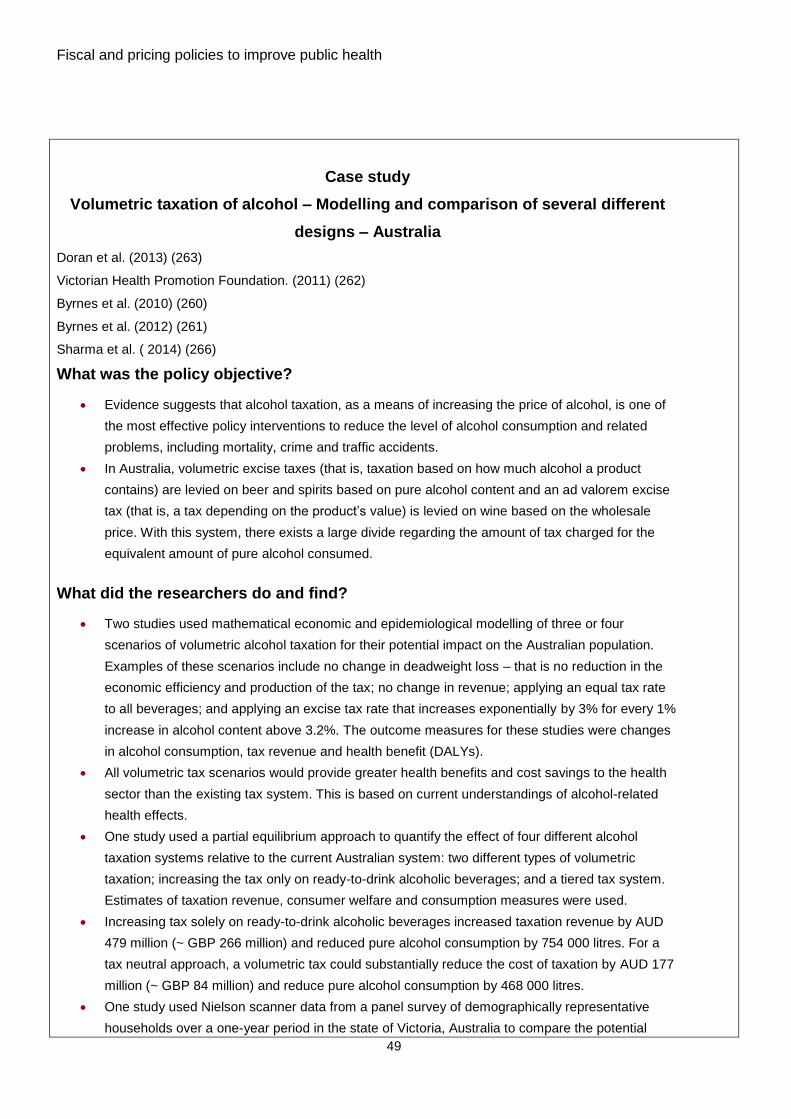
Fiscal and pricing policies to improve public health
49
Case study
Volumetric taxation of alcohol – Modelling and comparison of several different
designs – Australia
Doran et al. (2013) (263)
Victorian Health Promotion Foundation. (2011) (262)
Byrnes et al. (2010) (260)
Byrnes et al. (2012) (261)
Sharma et al. ( 2014) (266)
What was the policy objective?
Evidence suggests that alcohol taxation, as a means of increasing the price of alcohol, is one of
the most effective policy interventions to reduce the level of alcohol consumption and related
problems, including mortality, crime and traffic accidents.
In Australia, volumetric excise taxes (that is, taxation based on how much alcohol a product
contains) are levied on beer and spirits based on pure alcohol content and an ad valorem excise
tax (that is, a tax depending on the product’s value) is levied on wine based on the wholesale
price. With this system, there exists a large divide regarding the amount of tax charged for the
equivalent amount of pure alcohol consumed.
What did the researchers do and find?
Two studies used mathematical economic and epidemiological modelling of three or four
scenarios of volumetric alcohol taxation for their potential impact on the Australian population.
Examples of these scenarios include no change in deadweight loss – that is no reduction in the
economic efficiency and production of the tax; no change in revenue; applying an equal tax rate
to all beverages; and applying an excise tax rate that increases exponentially by 3% for every 1%
increase in alcohol content above 3.2%. The outcome measures for these studies were changes
in alcohol consumption, tax revenue and health benefit (DALYs).
All volumetric tax scenarios would provide greater health benefits and cost savings to the health
sector than the existing tax system. This is based on current understandings of alcohol-related
health effects.
One study used a partial equilibrium approach to quantify the effect of four different alcohol
taxation systems relative to the current Australian system: two different types of volumetric
taxation; increasing the tax only on ready-to-drink alcoholic beverages; and a tiered tax system.
Estimates of taxation revenue, consumer welfare and consumption measures were used.
Increasing tax solely on ready-to-drink alcoholic beverages increased taxation revenue by AUD
479 million (~ GBP 266 million) and reduced pure alcohol consumption by 754 000 litres. For a
tax neutral approach, a volumetric tax could substantially reduce the cost of taxation by AUD 177
million (~ GBP 84 million) and reduce pure alcohol consumption by 468 000 litres.
One study used Nielson scanner data from a panel survey of demographically representative
households over a one-year period in the state of Victoria, Australia to compare the potential
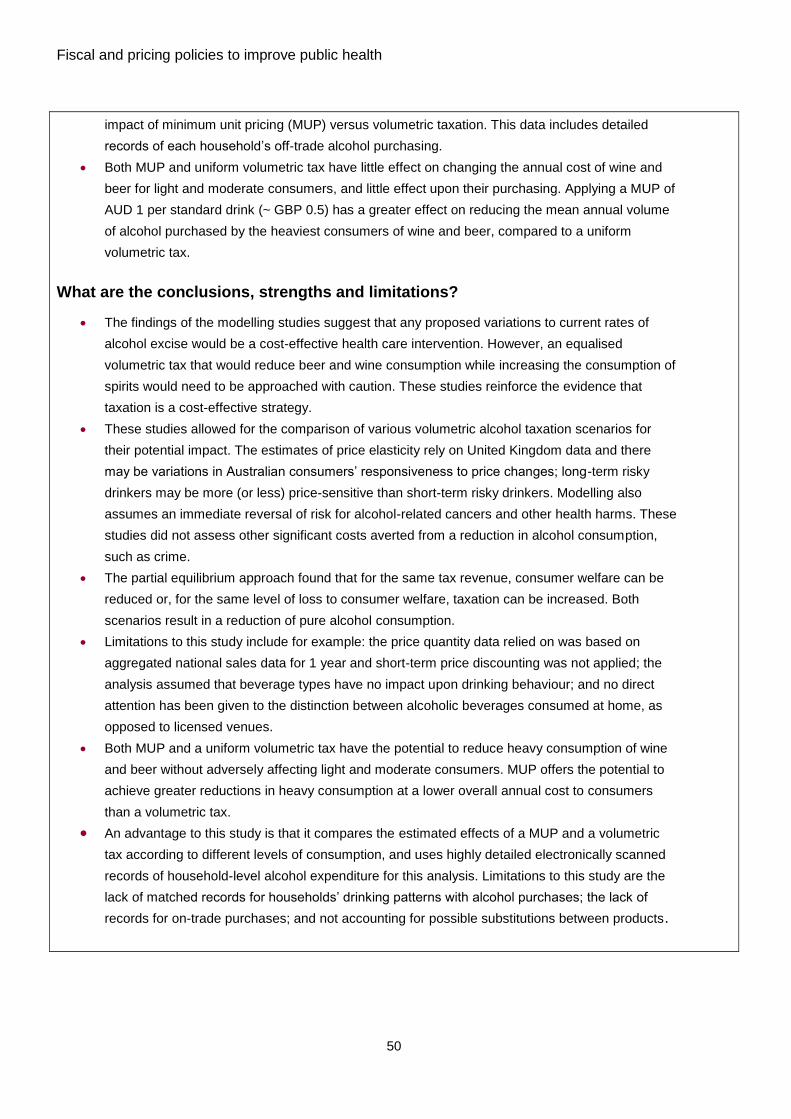
Fiscal and pricing policies to improve public health
50
impact of minimum unit pricing (MUP) versus volumetric taxation. This data includes detailed
records of each household’s off-trade alcohol purchasing.
Both MUP and uniform volumetric tax have little effect on changing the annual cost of wine and
beer for light and moderate consumers, and little effect upon their purchasing. Applying a MUP of
AUD 1 per standard drink (~ GBP 0.5) has a greater effect on reducing the mean annual volume
of alcohol purchased by the heaviest consumers of wine and beer, compared to a uniform
volumetric tax.
What are the conclusions, strengths and limitations?
The findings of the modelling studies suggest that any proposed variations to current rates of
alcohol excise would be a cost-effective health care intervention. However, an equalised
volumetric tax that would reduce beer and wine consumption while increasing the consumption of
spirits would need to be approached with caution. These studies reinforce the evidence that
taxation is a cost-effective strategy.
These studies allowed for the comparison of various volumetric alcohol taxation scenarios for
their potential impact. The estimates of price elasticity rely on United Kingdom data and there
may be variations in Australian consumers’ responsiveness to price changes; long-term risky
drinkers may be more (or less) price-sensitive than short-term risky drinkers. Modelling also
assumes an immediate reversal of risk for alcohol-related cancers and other health harms. These
studies did not assess other significant costs averted from a reduction in alcohol consumption,
such as crime.
The partial equilibrium approach found that for the same tax revenue, consumer welfare can be
reduced or, for the same level of loss to consumer welfare, taxation can be increased. Both
scenarios result in a reduction of pure alcohol consumption.
Limitations to this study include for example: the price quantity data relied on was based on
aggregated national sales data for 1 year and short-term price discounting was not applied; the
analysis assumed that beverage types have no impact upon drinking behaviour; and no direct
attention has been given to the distinction between alcoholic beverages consumed at home, as
opposed to licensed venues.
Both MUP and a uniform volumetric tax have the potential to reduce heavy consumption of wine
and beer without adversely affecting light and moderate consumers. MUP offers the potential to
achieve greater reductions in heavy consumption at a lower overall annual cost to consumers
than a volumetric tax.
An advantage to this study is that it compares the estimated effects of a MUP and a volumetric
tax according to different levels of consumption, and uses highly detailed electronically scanned
records of household-level alcohol expenditure for this analysis. Limitations to this study are the
lack of matched records for households’ drinking patterns with alcohol purchases; the lack of
records for on-trade purchases; and not accounting for possible substitutions between products.
Fiscal and pricing policies to improve public health
51
Discussion
As evidence has emerged of links between certain types of consumption and adverse
health outcomes, particularly in connection with chronic non-communicable diseases,
curbing those types of consumption by making them less affordable has become an
increasingly important goal of public health policies.
Public health has found key allies in finance ministries and tax policy makers especially,
but not exclusively, in areas in which products that can harm human health also have
important negative impacts on people who do not directly consume those products
(externalities). These products are typically viewed as primary candidates for taxation,
particularly excise taxation, as a way to make consumers pay for the social costs
generated by their consumption. The case for taxation is also strong when the demand
for the products concerned is not very responsive to price hikes (inelastic demand),
which means that significant revenues can be raised by taxing those products.
Therefore, products like alcoholic beverages and manufactured tobacco products have
been taxed in many jurisdictions long before the public health community started
viewing taxation as an integral component of its policy toolkit.
Once it has been established that altering market prices through taxation can change
consumption behaviours and generate beneficial health outcomes, public health has
progressively expanded its focus on price measures as a way to deter harmful
consumption. This has included broadening the scope of excise taxation to areas not
traditionally considered by tax policy makers (sugar-sweetened beverages being the
most prominent example), considering the use of other indirect taxes (eg VAT) to
modulate the prices of healthier and less healthy products, and also promoting
administrative price regulation measures. While the latter are not fiscal measures and
do not involve the collection (or expenditure) of financial revenues by governments, they
have been viewed in some cases as more flexible price incentives that can be better
targeted to the least healthy types of consumption. Minimum alcohol prices are an
important example of price regulation aimed at curbing the most harmful types of
alcohol consumption.
Fiscal and pricing policies to improve public health
52
Increasingly, public health policy makers have also been exploring opportunities to use
the price lever to incentivise forms of consumption that are conducive to beneficial
health outcomes, both through fiscal (eg product subsidies) and regulatory price
measures.
The evidence base on the impacts, including health impacts, of alcohol and tobacco
taxes is extensive, and a significant body of evidence is also building up on sugar-
sweetened beverage taxes. Less is known about the health impacts, actual or potential,
of fiscal and price measures in other areas, including in areas in which the use of fiscal
policies is well established, such as the reduction of polluting emissions, probably
because the focus on the health outcomes of fiscal and price policies is a relatively
recent one. Nevertheless, evaluating health outcomes is also difficult, because in many
cases these emerge only with a significant delay relative to the point of purchase and
consumption of the products concerned. This may be due in part to NCDs taking many
years to manifest themselves and also that they are multifactorial and do not just rely on
the consumption of different commodities or substances. Health outcomes are also
difficult to identify because many studies are either short term and/or are modelling
studies; therefore assessing the precise magnitude and causal nature of the effect of
price changes on those remote health outcomes involves important methodological
challenges.
This report presents a review of the evidence available to date on the health impacts of
fiscal and price policies across, as well as within, a range of policy areas. The review,
designed primarily as a scoping exercise, aimed at mapping areas in which the
evidence base is more robust and areas in which it is weaker or lacking. While there is a
large body of literature on many policies, improved health is often not the main aim of
the policies, while revenue raising or targeting proxy health outcomes can be the main
focus. However, a few areas have been assessed explicitly for an impact on health or
health-related behaviours/proxy outcomes. The work was undertaken within a tight
timeframe and resource constraints, therefore a number of exclusions were made in the
scope of the review, as discussed in the previous sections. While the approach was
systematic, this review should not be considered comprehensive, and serves to
illustrate but not quantify the existing evidence. In addition, significant effort was put into
Fiscal and pricing policies to improve public health
53
developing an extensive and useful framework, but the information captured within it
may be incomplete and certain elements of policy analysis, including collecting
information on context, which is not readily available in most scientific reports, may be
missing.
The results presented in this report must be read as complementary to those of existing
reviews and compendia of fiscal and price policies, such as:
Public Health England. Sugar reduction: from evidence into action, Annexe 2: A
mixed method review of behaviour changes resulting from experimental studies that
examine the effect of fiscal measures targeted at high sugar food and non-alcoholic
drink London: 2015.(7)
Public Health England. The Public Health Burden of Alcohol and the Effectiveness
and Cost-Effectiveness of Alcohol Control Policies. An evidence review. 2016. (4)
World Health Organization. Promoting Health, Preventing Disease The Economic
Case: The Economic Case: OECD Publishing; 2015. (267)
OECD Database on Policy Instruments for the Environment:
https://pinedatabase.oecd.org/
Global database on the Implementation of Nutrition Action (GINA):
http://www.who.int/nutrition/gina/en/
WRCF NOURISHING policy framework: https://www.wcrf.org/int/policy/nourishing-
database
This review provides some important indications on areas in which the use of fiscal and
price policies could potentially be expanded in order to improve health outcomes in
England. However, these indications are only preliminary and more analysis is required
to determine whether the evidence of health impacts generated by the studies reviewed
in this report is representative of the impacts that similar policies would achieve if
applied on a large scale in England.
Summary of findings
As would be expected, where harm is largely due to overconsumption of an unhealthy
commodity (eg tobacco, alcohol and a less healthy diet), fiscal strategies were used as
disincentives for consumption through taxation and in a few cases included price
increases or regulations that would result in price increases. For example cap and trade
for sugar where the food industry has a cap on the amount of sugar it can produce,
similar to emissions trading environment policies, and minimum pack price for smoking.
Fiscal and pricing policies to improve public health
54
In other policy areas, the focus was largely on subsidies and incentives to promote the
uptake of healthier behaviours (physical activity, healthy workplaces, and secondary
prevention) or exposure to healthier environments such as for the environment or
housing policy areas.
The majority of fiscal and pricing policies were identified in the diet and obesity field,
although most of the papers included are modelling studies rather than intervention
studies, while evidence for the public health impact of policies for gambling, housing
and the environment was limited, and often based on smaller scale studies of local-level
evidence. There were a number of policies identified focussing on the impact of financial
subsidies and incentives to promote physical activity, healthy behaviours within the
workplace as well as the uptake of secondary prevention activities.
The overlap between both fiscal and pricing strategies and target behaviours across
policy fields clearly outlines opportunities for cross learning across different areas, and
even the potential for combining incentives for multiple health behaviours. For instance,
the role of subsidies to influence healthy diets was examined both in the general
population and in a more targeted environment such as the workplace. Similarly,
environmental policies which aim to reduce travel by car to reduce emission, may
promote active travel, and such policies may therefore provide a ‘double win’.
Less than a third of intervention studies reported health impacts for the policies
examined, including numbers of disease cases or deaths avoided, quality-adjusted life
years, disability-adjusted life years (66/234). The remainder only reported on
intermediate outcomes, which were on the pathway to health, such as consumption of
certain products or reduction of certain behaviours.
The majority of direct health impacts were reported in the field of diet and obesity,
mainly through the use of modelling, so these impacts remain theoretical. Other fields
which reported health impacts include housing and alcohol, with far fewer studies in the
environment and physical activity fields reporting these. In contrast, only one or two
studies from the fields of gambling, healthy workplaces, secondary prevention activities
and tobacco provided any direct health impacts, instead focussing on outcomes such as
Fiscal and pricing policies to improve public health
55
changes in physical activity levels, dietary intake, smoking rates, or other proximal
outcomes. In the case of the gambling literature, the outcomes were indeed very distally
related to health, as no impacts on mental health were reported, and instead the only
impacts recorded were changes to betting behaviour and value and frequency of
gambling, making it very difficult to draw any strong conclusions in this field.
The majority (39/66) of intervention studies/policies which reported a health impact
consisted of taxation, with 15 being subsidies, while only a few considered joint taxation
and subsidies, or financial incentives. Almost all analyses of financial incentives
reported proxy outcomes. It should be noted that when a health impact was reported, it
was almost always (53/66) a significant, positive impact on health.
In summary, the policies that provided a strong indication of a direct impact on health
were mainly taxation policies in the field of diet and obesity or alcohol, or subsidies for
housing. However, the vast majority of the health impacts reported came from modelling
studies. This is likely because health impacts take time to manifest, and modelling
studies consider longer timeframes, but also integrate the impact on health of observed
changes in behaviour as a result of policies. However, robust modelling studies, of
which there were many, are useful to add to the case for taxation policies.
Inequalities
There is evidence that more established fiscal policies on commodities related to health
have a distributional impact. For example, a USA state-wide tax on tobacco has been
shown to impact behaviour, as the majority of smokers, and particularly low-SES
smokers, report behavioural steps toward quitting or achieving sustained tobacco
cessation in response to cigarette taxes(268). Only a limited number of policies (21%)
reported distributional effects and these could be financial or sometimes health
inequalities. Over half found the policies investigated to be progressive (that is, the
effect of the policy was more pronounced in lower socio-economic groups with regards
to health or income); a third to be regressive and the rest either found no evidence of a
distributional impact, or provided too little information to classify. There was no clear
trend in the type of policies or the policy areas that showed either progressive or
regressive impacts, however, whether policies are regressive depends on consumption
Fiscal and pricing policies to improve public health
56
patterns and demand elasticities that vary across countries and products (269). Diet and
obesity was strongly represented in both groups, but this is likely due to the higher
volume of literature in this policy area. It should be noted that there might be a reporting
bias effect in the publications collected, whereby studies that find a positive, progressive
impact of policies are more likely to report this finding.
Conclusions
The findings of this review provide a number of indications about potential new ways
and areas in which fiscal and pricing policies could be used as public health measures
in England. This potential is largely dependent on the goals of public health policies to
which fiscal and price policies are designed to contribute. These goals may range from
health improvement (either in the population at large or in high-risk individuals), to
revenue generation (if this can be at least partly directed to the financing of public health
or health care measures), to the reduction of health inequalities. Some of the indications
emerging from this work are discussed below in connection with the three policy goals
listed above.
Health improvement
Key conditions for fiscal and price policies to generate further significant health impacts
are as follows:
the risks associated with harmful consumption behaviours should be significant and
widespread;
it should be possible to alter prices by a relatively large margin, or consumption
should be very responsive to price changes (elastic demand);
there should be significant scope for an expansion of existing fiscal and price
policies or for introduction of new ones
Much of the evidence reviewed in this report shows fiscal and price policies do have the
potential to improve health outcomes but, per se, they are not sufficient to reverse or
contain major health risks. They need to be combined with the implementation of other
policies with which they may act synergistically in curbing the relevant risks.
Diet is an area that offers major potential for health improvement, but the second
condition above (that potential price changes should be quite large, or that the demand
Fiscal and pricing policies to improve public health
57
should be elastic) can hardly be met in this area – eg because of the risk of regressive
financial impacts – unless a mix of price-increasing and price-decreasing measures is
adopted. Moreover, in order to maximise the impact on health, taxes should be
designed so as to cover potentially unhealthy substitutes, identified through a detailed
assessment of cross-price elasticities. Taxation can also provide an incentive for
reformulation, especially when demand is more elastic, which could thus lead to overall
reduced consumption of the unhealthy commodity. However, this latter impact would not
be detected if focussing on purchases, as many publications in this report do.
The studies reviewed in this report provide evidence that both price increasing and price
decreasing measures are effective in improving health, and using them in combination
might lead to healthier diets and improvements in a range of long-term chronic disease
outcomes. In fact, previous reviews have concluded that taxes on foods and non-
alcoholic beverages work best when associated with subsidies on healthier options (49,
102, 177, 270). However, much of the latter evidence is based on simulations of the
combined effects of individually assessed fiscal or pricing measures. Empirical analyses
of existing policies that combine price-increasing and price-decreasing measures are
lacking and the prospect of “engineering” healthier diets through comprehensive price
incentives remains largely hypothetical at this stage. The use of fiscal approaches
based on some form of nutrient profiling, that is the classification of various food and
beverages depending on their nutritional composition for reasons related to preventing
disease and promoting health, requires further significant consideration before any
assessment was undertaken. We note that in Chapter 2 of the Childhood obesity: a plan
for action document, the government may consider further use of the tax system to
promote healthy food if the voluntary sugar reduction programme does not deliver
sufficient progress (271).
This review also points to environmental policy as having potential for health
improvement, although evaluations that account for the health benefits of emission
reduction policies are still limited. However, exposures to polluting emissions are
widespread, the health and health care impacts of such exposures are now well
established, and there is at this moment significant scope and momentum for expanding
measures to control emissions, including by making consumption behaviours that
Fiscal and pricing policies to improve public health
58
generate pollution less affordable. The opportunity to combine environmental and health
benefits (co-benefits), as well as the externalities involved, make the case for that
expansion especially strong. Like with diet, a mix of price-increasing and price-
decreasing measures can, and probably should, be adopted to maximise opportunities
for health improvement. Existing studies provide evidence that both can be effective.
A third area in which this review shows potential for health improvement is healthy
workplace measures. Through workplaces, especially larger ones, public health
measures can reach very large numbers of people at an important stage in their life
course, potentially modifying a number of exposures and behaviours that are key in
determining the risk of leading chronic non-communicable diseases. The evidence
available in this area tends to be from small-scale studies involving voluntary
participation and relatively short-term outcomes, but the findings are consistently
favourable, which suggests that there is scope for a more detailed and rigorous
assessment of the health improvement potential of fiscal and price policies aimed at
making workplaces healthier.
There are, of course, opportunities for meaningful further health impacts from fiscal and
price policies in the areas of tobacco and alcohol consumption, although these two
policy areas are quite mature and a major reform of existing policies may involve
technical as well as political challenges, which means that changes tend to happen
incrementally in these areas.
For instance, the affordability of alcohol has increased in the UK due to various tax
freezes and duty escalator removals, and so alcohol taxation remains the most cost-
effective intervention to reduce alcohol consumption and harm, as summarised in the
PHE evidence review(4). Regulating the prices of alcohol products (eg as Scotland has
done with the introduction of minimum unit pricing) has the potential to provide
additional benefits over and above those so far achieved with taxation, with an improved
targeting of the highest-risk alcohol consumption behaviours.
Price regulation of tobacco products has so far been prevented by EU legislation (272),
but there is at least some (relatively crude) evidence that minimum prices would be
effective in curbing tobacco smoking further, and this policy might become legally viable
Fiscal and pricing policies to improve public health
59
once the UK leaves the EU. Similarly, further benefits may derive from an improved
targeting of alcohol taxation to higher-risk drinkers. The evidence presented in this
review is mainly in connection with volumetric taxation, and this provides encouraging
results relative to the impacts of the current alcohol taxation system in the United
Kingdom, which involves relatively high tax rates, but is less well targeted to heavy
individual consumption, and may be legally viable once the UK leaves the EU. The
findings of this review suggest that there is scope for a detailed assessment of the
potential large-scale impacts of a volumetric taxation system, of the transferability of the
evidence available from other countries, and of the implementation challenges involved
in reforming the existing taxation system.
Revenue raising
Raising fiscal revenues is not a public health goal per se, of course, but it can become
one if the revenues generated by a tax can be directed, wholly or in part, to the funding
of public health or health care programmes. Public health advocates increasingly call for
the hypothecation, or earmarking, of taxes raised on unhealthy consumption, but
governments (finance ministries) typically use tax hypothecation sparingly, if at all. The
introduction of a new tax, or a tax hike, can be combined with the announcement of new
or increased public expenditures, but without a tight link between revenues and
expenditures. In the United Kingdom, this has happened for instance during the second
Blair government, when a major boost in NHS spending, designed to bring this in line
with that of other EU countries, was purportedly funded by a 1% increase in National
Insurance contributions introduced at the same time. A further example is the recently
established Soft Drinks Industry Levy (sugar-sweetened beverage tax), whose revenues
will be used to fund physical activity programmes in schools. These types of “soft”
earmarking of tax revenues are more common and can prove very helpful in gaining
public support for new fiscal measures, or justifying increased spending in certain areas.
However, price regulation measures, and fiscal policies on the expenditure side (eg
subsidies), clearly fall outside the scope of revenue raising policies.
Tax policies targeting specific forms of consumption can generate significant additional
revenues when the following conditions occur:
Fiscal and pricing policies to improve public health
60
the taxed products are widely consumed
the prices of taxed products are high (for ad valorem taxes), or it is possible to
set large ad quantum taxes
the consumption of the taxed products is not very responsive to price changes
(inelastic demand), or it is possible to limit opportunities for substitutions by
consumers
in addition, there should be significant scope for an expansion of existing fiscal
and price policies or for the introduction of new ones (assuming that only soft
earmarking is considered, as discussed above)
The taxation of alcohol and tobacco products meets many of the above conditions and
is a major source of fiscal revenues in most countries. However, its revenue raising
potential is already largely tapped into in England. While further increases are possible
at the margin, it is unclear how tax hikes or even substantial reforms, would significantly
increase the revenues raised by these forms of taxation. One estimate from the Office
for Budget Responsibility puts the public costings of the cumulative loss to the
Exchequer from the successive alcohol duty freezes and cuts from financial year 2013-
14 to the current financial year 2018-19 to be around £4.0 billion (273).
A move towards volumetric alcohol taxation may be designed to increase revenues, as
higher price products and less price-responsive consumers would be more heavily
targeted as a result. However, the precise extent to which a similar reform may increase
fiscal revenues, as well as its distributional and public health effects, would require a
detailed estimation through sound simulations of relevant scenarios.
Fewer of the above conditions are met in the case of food and non-alcoholic beverages,
especially if fiscal and price policies in this area evolved towards a mix of negative and
positive price incentives. Starting from current levels of taxation, there is scope for
marginal improvements based on evidence reviewed in this report. In particular, the tax
base for the Soft Drinks Industry Levy is relatively narrow at present. As evidence of
possible substitutions will emerge from early evaluations of the levy, expansions of the
tax base may be considered to include some of the unwarranted substitutes or to make
the aggregate demand for the taxed products less elastic (which would increase
revenues).
Fiscal and pricing policies to improve public health
61
In the case of environment taxes, the potential for further revenue raising is significant,
even in the presence of parallel use of fiscal measures to incentivise environment-
friendly (and healthy) consumption. However, if hypothecation, even of the soft form,
were possible, this might not be primarily or exclusively to the benefit of public health or
health care.
Reducing health inequalities
Fiscal and price policies tend to have progressive health impacts because the
consumption of unhealthy products tends to be more concentrated in disadvantaged
socioeconomic groups, and because the latter groups tend to be more responsive to
financial incentives (1). However, the use of fiscal and price measures for distributional
purposes has always found a limit in the potential for regressive financial impacts.
Fiscal and price policies on alcohol beverages are the ones that are least likely to
generate regressive financial impacts, although some low-income heavy consumers
may be a cause for concern. Moving towards volumetric taxation would most likely
improve alcohol-related health inequalities to a significant extent, without necessarily
being a financially regressive policy change.
Tobacco smoking continues to be a major source of health inequalities and the potential
to redress some of these through fiscal and price policies is definitely there. Incremental
changes in the existing taxation system, as well as the possible introduction of minimum
prices, would be beneficial measures in this direction in terms of health inequalities, but
would remain financially regressive measures.
Significant inequalities in obesity, especially among children, also mean that expanding
the scope for fiscal and price policies on food and non-alcoholic beverages may bring
about meaningful reductions in health inequalities.
Potential trade-offs between fiscal policy goals
The discussion above highlights some potential trade-offs between goals, which may
compound the design of fiscal and price policies. One such trade-off may occur
between health promotion and revenue raising. The latter is unlikely to be the exclusive
Fiscal and pricing policies to improve public health
62
goal of policies designed to improve population health, and in most cases will be
combined with (direct) health improvement goals. An effective revenue raising measure
should ideally target consumption that is not very responsive to price changes (inelastic
demand), however, a limited response by consumers means a limited health benefit.
The correct policy response to this trade-off does not necessarily involve targeting
consumption that is more responsive to price changes (most of the consumption we
would want to reduce for health reasons is not very responsive to prices anyway).
Rather, the policy can engineer a larger response by consumers by inducing larger
price changes. In other words, a large tax on a product whose demand is relatively
inelastic would allow the policy to achieve good results on both the health improvement
and the revenue raising sides.
Of course, the above could potentially trigger a new trade-off, between health gain and
financial equity impacts, because a large tax may represent a significant financial
burden for the less well off, and therefore may be undesirable from a broader welfare
perspective. This means that each policy requires careful design to ensure any potential
trade-offs are adequately addressed and unwarranted impacts are prevented.
Other issues
The government labelling the UK sugar-sweetened beverage tax as an “industry levy”
has generated a debate around the appropriate tax point for taxes on health-related
consumption, as if this was a way to shift the tax burden between suppliers and
consumers. However, the government’s ability to determine who eventually bears the
tax burden is very limited, regardless of the tax point. In the case of the Soft Drinks
Industry Levy, it was always clear from both theory and previous experiences, including
those reviewed in this report, that the tax would be largely passed on to consumers
(which, of course, is a concern for industry, but it means that the tax is not simply an
“industry levy”). Whether taxes can primarily, or exclusively, affect industry profitability
depends, above all, on market structure and consumers’ price-responsiveness, but also
on the fact that food prices vary sometimes significantly for a host of reasons, for
instance by shop type. This could happen in a competitive market for products whose
demand is very price-elastic, and the latter condition is not typically met in the case of
health-related products.
Fiscal and pricing policies to improve public health
63
In conclusion, taxes will inevitably affect both industry and consumers’ behaviours and
place some financial burden on both of these actors, either through the need for
reformulation or an impact on purchasing directly. While the government may want to
emphasise impacts on industry to increase acceptability by the public, it will always
have limited control over how the tax burden is apportioned.
Evidence gaps
In-depth case studies of policies applicable to the UK and of particular interest to PHE
could build the evidence on the health impact collected so far. In particular, interviews
with key policy makers and other stakeholders could provide more contextual
information and other types of evidence (aside from traditional peer-reviewed papers
and reports) to help the development of further policies, as well as the interpretation of
existing policies.
Public health modelling work would add further insight to this work: either by forecasting
and predicting the impact of a specific fiscal or pricing policy in the UK context, by
building on existing modelling work to strengthen the case for the re-design of existing
policies or by allowing the evaluation of existing policies including cost-benefit analysis
to help prioritisation, where the evidence is still lacking, based on this report. Extending
the identified, existing modelling studies to simulate the larger system will help produce
predictions about how difference policies interact with one another at a population level.
The findings from this study and the framework could provide the basis to institute a
national commission on health promoting fiscal policies to look into this further.
One interesting aspect would be to collaborate with behavioural insights researchers to
further unpick the mechanisms by which these policies may be successful at changing
behaviours and having a positive impact on health.
Another interesting developmental piece of work would be to develop guidelines for
publications reporting on policies, in order to strengthen the evaluation and
comparability of results.
Fiscal and pricing policies to improve public health
64
This work only focused on nine policy areas, so further work could extend this to an
even wider set of policy areas to provide evidence for a health in all policies approach.
Fiscal and pricing policies to improve public health
65
References
1. Sassi F, Belloni A, Mirelman AJ, Suhrcke M, Thomas A, Salti N, et al. Equity impacts of price policies to promote healthy behaviours. The Lancet. 2018. 2. Gillingham R. Fiscal Policy for Health Policy Makers. 2014. 3. Institute for Fiscal Studies. A survey of the UK tax system. 2016. 4. Public Health England. The Public Health Burden of Alcohol and the Effectiveness and Cost-Effectiveness of Alcohol Control Policies. An evidence review. 2016. 5. US National Cancer Institute and World Health Organization. Monograph 21: the economics of tobacco and tobacco control. 2016. 6. NICE Citizens Council. The Use of Incentives to Improve Health. 2010. 7. Public Health England. Sugar reduction: from evidence into action. London: 2015. 8. Public Health England. Sugar reduction: from evidence into action. Annexe 2: A mixed method review of behaviour changes resulting from experimental studies that examine the effect of fiscal measures targeted at high sugar food and non-alcoholic drink London2015. Available from: https://assets.publishing.service.gov.uk/government/uploads/system/uploads/attachment_data/file/470173/Annexe_2._Fiscal_evidence_review.pdf. 9. Sassi F, Belloni A. Fiscal incentives, behavior change and health promotion: what place in the health-in-all-policies toolkit? Health promotion international. 2014;29(suppl_1):i103-i12. 10. Sassi F, Belloni A, Capobianco C. The Role of Fiscal Policies in Health Promotion. Paris: OECD Publishing, 2013. 11. Public Health England. Sugar reduction: report on first year progress. 2018. 12. Local Government Association. Health in All Policies, a manual for local government. 2016. 13. University College London EPPI-Centre. CCEMG - EPPI-Centre Cost Converter 2016. Available from: http://eppi.ioe.ac.uk/costconversion/default.aspx. 14. Health Do. Towards a Smokefree Generation - A Tobacco Control Plan for England. UK: 2017 July. Report No. 15. Fu PL, Bradley KL, Viswanathan S, Chan JM, Stampfer M. Trends in biometric health indices within an employer-sponsored wellness program with outcome-based incentives. American Journal of Health Promotion. 2016;30(6):453-7. 16. Hwang G, Yoon C, Jung H, Kim Y. Evaluation of an incentive-based obesity management program in a workplace. International Journal of Occupational Safety and Ergonomics. 2011;17(2):147-54. 17. John LK, Troxel AB, Yancy Jr WS, Friedman J, Zhu J, Yang L, et al. The Effect of Cost Sharing on an Employee Weight Loss Program: A Randomized Trial. American Journal of Health Promotion. 2018;32(1):170-6. 18. Kullgren JT, Troxel AB, Loewenstein G, Asch DA, Norton LA, Wesby L, et al. Individual-versus group-based financial incentives for weight loss: a randomized, controlled trial. Annals of internal medicine. 2013;158(7):505-14. 19. Mackison D, Mooney J, Macleod M, Anderson A. Lessons learnt from a feasibility study on price incentivised healthy eating promotions in workplace catering establishments. Journal of human nutrition and dietetics. 2016;29(1):86-94. 20. Patsch AJ, Smith JH, Liebert ML, Behrens TK, Charles T. Improving healthy eating and the bottom line: impact of a price incentive program in 2 hospital cafeterias. American Journal of Health Promotion. 2016;30(6):425-32.
Fiscal and pricing policies to improve public health
66
21. Sepúlveda M-J, Lu C, Sill S, Young JM, Edington DW. An observational study of an employer intervention for children's healthy weight behaviors. Pediatrics. 2010:peds. 2009-3210. 22. Thorndike AN, Riis J, Levy DE. Social norms and financial incentives to promote employees' healthy food choices: A randomized controlled trial. Preventive medicine. 2016;86:12-8. 23. Weerasekara YK, Roberts SB, Kahn MA, LaVertu AE, Hoffman B, Das SK. Effectiveness of workplace weight management interventions: a systematic review. Current obesity reports. 2016;5(2):298-306. 24. Allais O, Etile F, Lecocq S. Mandatory labels, taxes and market forces: An empirical evaluation of fat policies. J Health Econ. 2015;43:27-44. 25. Alvarado M, Kostova D, Suhrcke M, Hambleton I, Hassell T, Samuels TA, et al. Trends in beverage prices following the introduction of a tax on sugar-sweetened beverages in Barbados. Preventive medicine. 2017;105:S23-S5. 26. Barrientos-Gutierrez T, Zepeda-Tello R, Rodrigues ER, Colchero-Aragonés A, Rojas-Martínez R, Lazcano-Ponce E, et al. Expected population weight and diabetes impact of the 1-peso-per-litre tax to sugar sweetened beverages in Mexico. PloS one. 2017;12(5):e0176336. 27. Basu S, Babiarz KS, Ebrahim S, Vellakkal S, Stuckler D, Goldhaber-Fiebert JD. Palm oil taxes and cardiovascular disease mortality in India: economic-epidemiologic model. BMJ. 2013;347:f6048. 28. Basu S, Lewis K. Reducing added sugars in the food supply through a cap-and-trade approach. American journal of public health. 2014;104(12):2432-8. 29. Batis C, Rivera JA, Popkin BM, Taillie LS. First-year evaluation of Mexico’s tax on nonessential energy-dense foods: an observational study. PLoS medicine. 2016;13(7):e1002057. 30. Berardi N, Sevestre P, Tepaut M, Vigneron A. The impact of a ‘soda tax’on prices: evidence from French micro data. Applied Economics. 2016;48(41):3976-94. 31. Bíró A. Did the junk food tax make the Hungarians eat healthier? Food Policy. 2015;54:107-15. 32. Black AP, Vally H, Morris P, Daniel M, Esterman A, Karschimkus CS, et al. Nutritional impacts of a fruit and vegetable subsidy programme for disadvantaged Australian Aboriginal children. British Journal of Nutrition. 2013;110(12):2309-17. 33. Black AP, Vally H, Morris PS, Daniel M, Esterman AJ, Smith FE, et al. Health outcomes of a subsidised fruit and vegetable program for Aboriginal children in northern New South Wales. Med J Aust. 2013;199(1):46-50. 34. Bødker M, Pisinger C, Toft U, Jørgensen T. The Danish fat tax—Effects on consumption patterns and risk of ischaemic heart disease. Preventive medicine. 2015;77:200-3. 35. Bødker M, Pisinger C, Toft U, Jørgensen T. The rise and fall of the world's first fat tax. Health policy. 2015;119(6):737-42. 36. Bonilla-Chacín ME, Iglesias R, Suaya A, Trezza C, Macías C. Learning from the Mexican Experience with Taxes on Sugar-Sweetened Beverages and Energy-dense Foods of Low Nutritional Value: Poverty and Social Impact Analysis: World Bank; 2016. 37. Bonnet C, Requillart V. Does the EU sugar policy reform increase added sugar consumption? An empirical evidence on the soft drink market. Health Econ. 2010;20:1012-24. 38. Briggs AD, Mytton OT, Kehlbacher A, Tiffin R, Elhussein A, Rayner M, et al. Health impact assessment of the UK soft drinks industry levy: a comparative risk assessment modelling study. The Lancet Public Health. 2017;2(1):e15-e22. 39. Brimblecombe J, Ferguson M, Chatfield MD, Liberato SC, Gunther A, Ball K, et al. Effect of a price discount and consumer education strategy on food and beverage purchases in
Fiscal and pricing policies to improve public health
67
remote Indigenous Australia: a stepped-wedge randomised controlled trial. The Lancet Public Health. 2017;2(2):e82-e95. 40. Brimblecombe J, Ferguson M, Liberato SC, Ball K, Moodie ML, Magnus A, et al. Stores Healthy Options Project in Remote Indigenous Communities (SHOP@ RIC): a protocol of a randomised trial promoting healthy food and beverage purchases through price discounts and in-store nutrition education. BMC Public Health. 2013;13(1):744. 41. Brunello G, De Paola M, Labartino G. More apples fewer chips? The effect of school fruit schemes on the consumption of junk food. Health policy. 2014;118(1):114-26. 42. Cabral CS, Lopes AG, Lopes JM, Vianna RPdT. Food security, income, and the Bolsa Família program: a cohort study of municipalities in Paraíba State, Brazil, 2005-2011. Cadernos de saude publica. 2014;30(2):393-402. 43. Carlson S, Neuberger Z. WIC works: Addressing the nutrition and health needs of low-income families for 40 years. Center on Budget and Policy Priorities, May. 2015. 44. Caro JC, Ng SW, Bonilla R, Tovar J, Popkin BM. Sugary drinks taxation, projected consumption and fiscal revenues in Colombia: Evidence from a QUAIDS model. PloS one. 2017;12(12):e0189026. 45. Caro JC, Ng SW, Taillie LS, Popkin BM. Designing a tax to discourage unhealthy food and beverage purchases: The case of Chile. Food Policy. 2017;71:86-100. 46. Castelló JV, Lopez Casasnovas G. Impact of Ssb Taxes on Consumption. CRES-UPFWorkingPaper#201804-110. 2018.
47. Cawley J, Frisvold DE. The Pass‐Through of Taxes on Sugar‐Sweetened Beverages to Retail Prices: The Case of Berkeley, California. Journal of Policy Analysis and Management. 2017;36(2):303-26. 48. Center for Global Development. CASE 9: Improving the health of the poor in Mexico. Available from: https://www.cgdev.org/doc/millions/MS_case_9.pdf. 49. Cobiac LJ, Tam K, Veerman L, Blakely T. Taxes and subsidies for improving diet and population health in Australia: a cost-effectiveness modelling study. PLoS medicine. 2017;14(2):e1002232. 50. Colchero MA, Molina M, Guerrero-Lopez CM. After Mexico Implemented a Tax, Purchases of Sugar-Sweetened Beverages Decreased and Water Increased: Difference by Place of Residence, Household Composition, and Income Level. J Nutr. 2017;147:1552-7. 51. Colchero MA, Popkin BM, Rivera JA, Ng SW. Beverage purchases from stores in Mexico under the excise tax on sugar sweetened beverages: observational study. bmj. 2016;352:h6704. 52. Colchero MA, Rivera-Dommarco J, Popkin BM, Ng SW. In Mexico, evidence of sustained consumer response two years after implementing a sugar-sweetened beverage tax. Health Affairs. 2017;36(3):564-71. 53. Colman S, Nichols-Barrer IP, Redline JE, Devaney BL, Ansell SV. Nutrition Assistance Program Report Series Effects of the Special Supplemental Nutrition Program for Women, Infants, and Children (WIC): A Review of Recent Research. 2012. 54. Corcoran SP, Elbel B, Schwartz AE. The effect of breakfast in the classroom on obesity and academic performance: Evidence from New York City. Journal of Policy Analysis and Management. 2016;35(3):509-32. 55. Crawford C, Edwards A, Farquharson C, Greaves E, Trevelyan G, Wallace E, et al., editors. Magic Breakfast - Evaluation report and executive summary2016; London. 56. Dallongeville J, Dauchet L, de Mouzon O, Requillart V, Soler L-G. Increasing fruit and vegetable consumption: a cost-effectiveness analysis of public policies. European Journal of Public Health. 2010;21(1):69-73. 57. Darney BG, Weaver MR, Sosa-Rubi SG, Walker D, Servan-Mori E, Prager S, et al. The oportunidades conditional cash transfer program: effects on pregnancy and contraceptive use
Fiscal and pricing policies to improve public health
68
among young rural women in Mexico. International perspectives on sexual and reproductive health. 2013;39(4):205. 58. ECORYS. Food taxes and their impact on competitiveness in the agri-food sector - Final report. Ref Ares(2014)2365745. 2014:1-82. 59. Elbel B, Moran A, Dixon LB, Kiszko K, Cantor J, Abrams C, et al. Assessment of a government-subsidized supermarket in a high-need area on household food availability and children’s dietary intakes. Public health nutrition. 2015;18(15):2881-90. 60. Falbe J, Thompson HR, Becker CM, Rojas N, McCulloch CE, Madsen KA. Impact of the Berkeley excise tax on sugar-sweetened beverage consumption. American journal of public health. 2016;106(10):1865-71. 61. Ferguson M, O'dea K, Holden S, Miles E, Brimblecombe J. Food and beverage price discounts to improve health in remote Aboriginal communities: mixed method evaluation of a natural experiment. Australian and New Zealand journal of public health. 2017;41(1):32-7. 62. Fernald LC, Gertler PJ, Neufeld LM. 10-year effect of Oportunidades, Mexico's conditional cash transfer programme, on child growth, cognition, language, and behaviour: a longitudinal follow-up study. The Lancet. 2009;374(9706):1997-2005. 63. Fernald LC, Hou X, Gertler PJ. Oportunidades program participation and body mass index, blood pressure, and self-reported health in Mexican adults. Prev Chronic Dis. 2008;5(3):A81. 64. Flores M, Rivas J. Cash incentives and unhealthy food consumption. Bulletin of Economic Research. 2017;69(1):42-56. 65. Fox MK, Hamilton W, Lin B-H. Effects of food assistance and nutrition programs on nutrition and health. Food Assistance and Nutrition Research Report. 2004;19(3). 66. Holm AL, Laursen M-B, Koch M, Jensen JD, Diderichsen F. The health benefits of selective taxation as an economic instrument in relation to IHD and nutrition-related cancers. Public health nutrition. 2013;16(12):2124-31. 67. Howard LL, Prakash N. Do school lunch subsidies change the dietary patterns of
children from low‐income households? Contemporary Economic Policy. 2012;30(3):362-81. 68. Huang J, Barnidge E. Low-income Children's participation in the National School Lunch Program and household food insufficiency. Social Science & Medicine. 2016;150:8-14. 69. Jensen JD, Smed S. The Danish tax on saturated fat–short run effects on consumption, substitution patterns and consumer prices of fats. Food Policy. 2013;42:18-31. 70. Lal A, Mantilla-Herrera AM, Veerman L, Backholer K, Sacks G, Moodie M, et al. Modelled health benefits of a sugar-sweetened beverage tax across different socioeconomic groups in Australia: A cost-effectiveness and equity analysis. PLoS medicine. 2017;14(6):e1002326. 71. Leifert RM, Lucinda CR. Linear Symmetric “Fat Taxes”: Evidence from Brazil. Applied Economic Perspectives and Policy. 2015;37(4):634-66. 72. Leroy JL, Gadsden P, Rodriguez-Ramirez S, De Cossío TG. Cash and In-Kind Transfers in Poor Rural Communities in Mexico Increase Household Fruit, Vegetable, and Micronutrient Consumption but Also Lead to Excess Energy Consumption–3. The Journal of nutrition. 2010;140(3):612-7. 73. Manyema M, Veerman LJ, Tugendhaft A, Labadarios D, Hofman KJ. Modelling the potential impact of a sugar-sweetened beverage tax on stroke mortality, costs and health-adjusted life years in South Africa. BMC public health. 2016;16(1):405. 74. Marette S, Roosen J, Blanchemanche S. Taxes and subsidies to change eating habits when information is not enough: an application to fish consumption. Journal of Regulatory Economics. 2008;34(2):119-43. 75. McFadden A, Green JM, Williams V, McLeish J, McCormick F, Fox-Rushby J, et al. Can food vouchers improve nutrition and reduce health inequalities in low-income mothers and
Fiscal and pricing policies to improve public health
69
young children: A multi-method evaluation of the experiences of beneficiaries and practitioners of the Healthy Start programme in England. BMC public health. 2014;14(1):148. 76. Mhurchu CN, Eyles H, Genc M, Scarborough P, Rayner M, Mizdrak A, et al. Effects of health-related food taxes and subsidies on mortality from diet-related disease in New Zealand: an econometric-epidemiologic modelling study. PLoS One. 2015;10(7):e0128477. 77. Mhurchu CN, Turley M, Gorton D, Jiang Y, Michie J, Maddison R, et al. Effects of a free school breakfast programme on school attendance, achievement, psychosocial function, and nutrition: a stepped wedge cluster randomised trial. BMC Public Health. 2010;10(1):738. 78. Moore GF, Murphy S, Chaplin K, Lyons RA, Atkinson M, Moore L. Impacts of the Primary School Free Breakfast Initiative on socio-economic inequalities in breakfast consumption among 9–11-year-old schoolchildren in Wales. Public health nutrition. 2014;17(6):1280-9. 79. Nestle M. Food Politics. Food Politics. 2018. 80. New Zealand Ministry of Health. Mexican Sugar Tax - Evidence of Impact 2015. Health Report Number: 20151086]. 81. Newcommer AJ. The Long-Term Effects of Conditional Cash Transfer Programs on Health: An Analysis of Mexico’s Oportunidades: University of Pittsburgh; 2017. 82. Nomaguchi T, Cunich M, Zapata-Diomedi B, Veerman JL. The impact on productivity of a hypothetical tax on sugar-sweetened beverages. Health Policy. 2017;121(6):715-25. 83. Nordström J, Thunström L. The impact of tax reforms designed to encourage healthier grain consumption. Journal of health economics. 2009;28(3):622-34. 84. Olsho LE, Klerman JA, Ritchie L, Wakimoto P, Webb KL, Bartlett S. Increasing child fruit and vegetable intake: findings from the US Department of Agriculture Fresh Fruit and Vegetable Program. Journal of the Academy of Nutrition and Dietetics. 2015;115(8):1283-90. 85. Parker SW. Mexico’s Oportunidades Program. Shanghai Poverty Conference. 2004;50:1-3. 86. Pearson-Stuttard J, Bandosz P, Rehm CD, Penalvo J, Whitsel L, Gaziano T, et al. Reducing US cardiovascular disease burden and disparities through national and targeted dietary policies: A modelling study. PLoS medicine. 2017;14(6):e1002311. 87. Peñalvo JL, Cudhea F, Micha R, Rehm CD, Afshin A, Whitsel L, et al. The potential impact of food taxes and subsidies on cardiovascular disease and diabetes burden and disparities in the United States. BMC medicine. 2017;15(1):208. 88. Quirmbach D, Cornelsen L, Jebb SA, Marteau T, Smith R. Effect of increasing the price of sugar-sweetened beverages on alcoholic beverage purchases: an economic analysis of sales data. J Epidemiol Community Health. 2018:jech-2017-209791. 89. Relton C, Strong M, Li J. The ‘Pounds for Pounds’ weight loss financial incentive scheme: an evaluation of a pilot in NHS Eastern and Coastal Kent. Journal of Public Health. 2011;33(4):536-42. 90. Sacks G, Veerman JL, Moodie M, Swinburn B. ‘Traffic-light’nutrition labelling and ‘junk-food’tax: a modelled comparison of cost-effectiveness for obesity prevention. International journal of obesity. 2011;35(7):1001. 91. Sánchez-Romero LM, Penko J, Coxson PG, Fernández A, Mason A, Moran AE, et al. Projected impact of Mexico’s sugar-sweetened beverage tax policy on diabetes and cardiovascular disease: a modeling study. PLoS medicine. 2016;13(11):e1002158. 92. Schwendicke F, Stolpe M. Taxing sugar-sweetened beverages: impact on overweight and obesity in Germany. BMC public health. 2017;17(1):88. 93. Schwendicke F, Thomson W, Broadbent J, Stolpe M. Effects of taxing sugar-sweetened beverages on caries and treatment costs. Journal of dental research. 2016;95(12):1327-32. 94. Silver LD, Ng SW, Ryan-Ibarra S, Taillie LS, Induni M, Miles DR, et al. Changes in prices, sales, consumer spending, and beverage consumption one year after a tax on sugar-
Fiscal and pricing policies to improve public health
70
sweetened beverages in Berkeley, California, US: A before-and-after study. PLoS medicine. 2017;14(4):e1002283. 95. Smed S, Scarborough P, Rayner M, Jensen JD. The effects of the Danish saturated fat tax on food and nutrient intake and modelled health outcomes: an econometric and comparative risk assessment evaluation. European journal of clinical nutrition. 2016;70(6):681. 96. Smith C, Parnell WR, Brown RC, Gray AR. Providing additional money to food-insecure households and its effect on food expenditure: a randomized controlled trial. Public health nutrition. 2013;16(8):1507-15. 97. Smith-Spangler CM, Juusola JL, Enns EA, Owens DK, Garber AM. Population strategies to decrease sodium intake and the burden of cardiovascular disease: a cost-effectiveness analysis. Annals of internal medicine. 2010;152(8):481-7. 98. Sonneville KR, Long MW, Ward ZJ, Resch SC, Wang YC, Pomeranz JL, et al. BMI and healthcare cost impact of eliminating tax subsidy for advertising unhealthy food to youth. American journal of preventive medicine. 2015;49(1):124-34. 99. Sturm R, An R, Segal D, Patel D. A cash-back rebate program for healthy food purchases in South Africa: results from scanner data. American journal of preventive medicine. 2013;44(6):567-72. 100. Taillie LS, Rivera JA, Popkin BM, Batis C. Do high vs. low purchasers respond differently to a nonessential energy-dense food tax? Two-year evaluation of Mexico's 8% nonessential food tax. Preventive medicine. 2017;105:S37-S42. 101. The World Bank. A Model from Mexico for the World 2014. Available from: http://www.worldbank.org/en/news/feature/2014/11/19/un-modelo-de-mexico-para-el-mundo. 102. Thow AM, Downs S, Jan S. A systematic review of the effectiveness of food taxes and subsidies to improve diets: understanding the recent evidence. Nutrition reviews. 2014;72(9):551-65. 103. USDA, editor Evaluation of the Healthy Incentives Pilot (HIP): Data Collection Instruments:2010. 104. Vallgårda S, Holm L, Jensen JD. The Danish tax on saturated fat: why it did not survive. European journal of clinical nutrition. 2015;69(2):223. 105. Veerman JL, Sacks G, Antonopoulos N, Martin J. The impact of a tax on sugar-sweetened beverages on health and health care costs: a modelling study. PloS one. 2016;11(4):e0151460. 106. Washio Y, Humphreys M, Colchado E, Sierra-Ortiz M, Zhang Z, Collins BN, et al. Incentive-based intervention to maintain breastfeeding among low-income Puerto Rican mothers. Pediatrics. 2017:e20163119. 107. WHO Europe. Assessment of the impact of a public health product tax. Final report. 2016:30. 108. Xiang D. Estimating the Impact of Behaviour Altering Taxes on Household Consumption. University of Manitoba; 2015. 109. Misra-Hebert AD, Hu B, Taksler G, Zimmerman R, Rothberg MB. Financial incentives and diabetes disease control in employees: a retrospective cohort analysis. Journal of general internal medicine. 2016;31(8):871-7. 110. Basu S, Kiernan M. A simulation modeling framework to optimize programs using financial incentives to motivate health behavior change. Medical Decision Making. 2016;36(1):48-58. 111. Bauman AE, Rissel C, Garrard J, Ker I, Speidel R, Fishman E. Cycling: Getting Australia Moving: Barriers, facilitators and interventions to get more Australians physically active through cycling: Cycling Promotion Fund Melbourne; 2008.
Fiscal and pricing policies to improve public health
71
112. Bliemer M, Dicke-Ogenia M, Ettema D, editors. Rewarding for avoiding the peak period: A synthesis of three studies in the Netherlands. European Transport Conference 2009; 2009: Citeseer. 113. Brown DS, Finkelstein EA, Brown DR, Buchner DM, Johnson FR. Estimating older adults' preferences for walking programs via conjoint analysis. American Journal of Preventive Medicine. 2009;36(3):201-7. e4. 114. Brown V, Moodie M, Cobiac L, Herrera AM, Carter R. Obesity-related health impacts of fuel excise taxation-an evidence review and cost-effectiveness study. BMC public health. 2017;17(1):359. 115. Caperchione C, Mummery WK, Joyner K. WALK Community Grants Scheme: lessons learned in developing and administering a health promotion microgrants program. Health promotion practice. 2010;11(5):637-44. 116. Carrera M, Royer H, Stehr M, Sydnor J. Can financial incentives help people trying to establish new habits? Experimental evidence with new gym members. Journal of health economics. 2018;58:202-14. 117. Charness G, Gneezy U. Incentives to exercise. Econometrica. 2009;77(3):909-31. 118. Christian D, Todd C, Hill R, Rance J, Mackintosh K, Stratton G, et al. Active children through incentive vouchers–evaluation (ACTIVE): a mixed-method feasibility study. BMC public health. 2016;16(1):890. 119. Coronini-Cronberg S, Millett C, Laverty AA, Webb E. The impact of a free older persons’ bus pass on active travel and regular walking in England. American Journal of Public Health. 2012;102(11):2141-8. 120. Dallat MAT, Hunter RF, Tully MA, Cairns KJ, Kee F. A lesson in business: cost-effectiveness analysis of a novel financial incentive intervention for increasing physical activity in the workplace. BMC Public Health. 2013;13(1):953. 121. Dhondt S, Kochan B, Beckx C, Lefebvre W, Pirdavani A, Degraeuwe B, et al. Integrated health impact assessment of travel behaviour: model exploration and application to a fuel price increase. Environment international. 2013;51:45-58. 122. Dunton G, Ebin VJ, Efrat MW, Efrat R, Lane CJ, Plunkett S. The use of refundable tax credits to increase low-income children’s after-school physical activity level. Journal of Physical Activity and Health. 2015;12(6):840-53. 123. Finkelstein EA, Brown DS, Brown DR, Buchner DM. A randomized study of financial incentives to increase physical activity among sedentary older adults. Preventive medicine. 2008;47(2):182-7. 124. Finkelstein EA, Haaland BA, Bilger M, Sahasranaman A, Sloan RA, Nang EEK, et al. Effectiveness of activity trackers with and without incentives to increase physical activity (TRIPPA): a randomised controlled trial. The lancet Diabetes & endocrinology. 2016;4(12):983-95. 125. Giles EL, Robalino S, McColl E, Sniehotta FF, Adams J. The effectiveness of financial incentives for health behaviour change: systematic review and meta-analysis. PloS one. 2014;9(3):e90347. 126. Gold Coast City Council. Health & Physical Benefits of Cycling Available from: http://www.goldcoast.qld.gov.au/documents/bf/bnop-report_section2.pdf. 127. Government of Canada. Children’s Fitness and Arts Tax Credit 2016. Available from: https://www.canada.ca/en/revenue-agency/programs/about-canada-revenue-agency-cra/federal-government-budgets/budget-2016-growing-middle-class/childrens-fitness-arts-tax-credits.html. 128. Hemmingsson E, Udden J, Neovius M, Ekelund U, Rössner S. Increased physical activity in abdominally obese women through support for changed commuting habits: a randomized clinical trial. International journal of obesity. 2009;33(6):645.
Fiscal and pricing policies to improve public health
72
129. Hou N, Popkin BM, Jacobs Jr DR, Song Y, Guilkey DK, He K, et al. Longitudinal trends in gasoline price and physical activity: the CARDIA study. Preventive medicine. 2011;52(5):365-9. 130. Hunter RF, Brennan SF, Tang J, Smith OJ, Murray J, Tully MA, et al. Effectiveness and cost-effectiveness of a physical activity loyalty scheme for behaviour change maintenance: a cluster randomised controlled trial. BMC public health. 2016;16(1):618. 131. Hunter RF, Tully MA, Davis M, Stevenson M, Kee F. Physical activity loyalty cards for behavior change: a quasi-experimental study. American journal of preventive medicine. 2013;45(1):56-63. 132. Jones A, Steinbach R, Roberts H, Goodman A, Green J. Rethinking passive transport: bus fare exemptions and young people's wellbeing. Health & place. 2012;18(3):605-12. 133. Lachapelle U, Frank LD. Transit and health: mode of transport, employer-sponsored public transit pass programs, and physical activity. Journal of public health policy. 2009;30(1):S73-S94. 134. Laine B, Van Steenbergen A. Working Paper 11-16-Commuting subsidies in Belgium-Implementation in the PLANET model. 2016. 135. Marshall G, Booth J. The Western Australian Cycling 100 Project. 136. Martin A, Suhrcke M, Ogilvie D. Financial incentives to promote active travel: an evidence review and economic framework. American journal of preventive medicine. 2012;43(6):e45-e57. 137. Nguyen HV, Grootendorst P. Does Child Fitness Tax Credit Program Make Children More Active? : Citeseer; 2012. 138. Patel MS, Asch DA, Rosin R, Small DS, Bellamy SL, Eberbach K, et al. Individual versus team-based financial incentives to increase physical activity: a randomized, controlled trial. Journal of general internal medicine. 2016;31(7):746-54. 139. Pope L, Harvey J. The efficacy of incentives to motivate continued fitness-center attendance in college first-year students: a randomized controlled trial. Journal of American College Health. 2014;62(2):81-90. 140. Pope L, Harvey J. The impact of incentives on intrinsic and extrinsic motives for fitness-center attendance in college first-year students. American Journal of Health Promotion. 2015;29(3):192-9. 141. Schumacher JE, Utley J, Sutton L, Horton T, Hamer T, You Z, et al. Boosting workplace stair utilization: a study of incremental reinforcement. Rehabilitation psychology. 2013;58(1):81. 142. Sen B. Is There an Association Between Gasoline Prices and Physical Activity? Evidence from A merican Time Use Data. Journal of Policy Analysis and Management. 2012;31(2):338-66. 143. Spence JC, Holt NL, Dutove JK, Carson V. Uptake and effectiveness of the Children's Fitness Tax Credit in Canada: the rich get richer. BMC Public Health. 2010;10(1):356. 144. Strohacker K, Galarraga O, Williams DM. The impact of incentives on exercise behavior: a systematic review of randomized controlled trials. Annals of Behavioral Medicine. 2013;48(1):92-9. 145. Tambor M, Pavlova M, Golinowska S, Arsenijevic J, Groot W. Financial incentives for a healthy life style and disease prevention among older people: a systematic literature review. BMC health services research. 2016;16(5):426. 146. Von Tigerstrom B, Larre T, Sauder J. Using the tax system to promote physical activity: critical analysis of Canadian initiatives. American Journal of Public Health. 2011;101(8):e10-e6. 147. Webb E, Netuveli G, Millett C. Free bus passes, use of public transport and obesity among older people in England. Journal of Epidemiology & Community Health. 2011:jech. 2011.133165.
Fiscal and pricing policies to improve public health
73
148. Tscharaktschiew S, Hirte G. Should subsidies to urban passenger transport be increased? A spatial CGE analysis for a German metropolitan area. Transportation Research Part A: Policy and Practice. 2012;46(2):285-309. 149. Transport for London. Freedom of Information request detail - Request ID: FOI-2271-1617 2017. Available from: https://tfl.gov.uk/corporate/transparency/freedom-of-information/foi-request-detail?referenceId=FOI-2271-1617. 150. Tonne C, Beevers S, Armstrong BG, Kelly F, Wilkinson P. Air pollution and mortality benefits of the London Congestion Charge: spatial and socioeconomic inequalities. Occupational and Environmental Medicine. 2008. 151. Sarigiannis DΑ, Karakitsios SP, Kermenidou MV. Health impact and monetary cost of exposure to particulate matter emitted from biomass burning in large cities. Science of The Total Environment. 2015;524:319-30. 152. Rotaris L, Danielis R, Marcucci E, Massiani J. The urban road pricing scheme to curb pollution in Milan, Italy: Description, impacts and preliminary cost–benefit analysis assessment. Transportation Research Part A: Policy and Practice. 2010;44(5):359-75. 153. Percoco M. Is road pricing effective in abating pollution? Evidence from Milan. Transportation Research Part D: Transport and Environment. 2013;25:112-8. 154. Namdeo A, Mitchell G. An empirical study of estimating vehicle emissions under cordon and distance based road user charging in Leeds, UK. Environmental monitoring and assessment. 2008;136(1-3):45-51. 155. Leigh JP, Geraghty EM. High gasoline prices and mortality from motor vehicle crashes and air pollution. Journal of Occupational and Environmental Medicine. 2008;50(3):249-54. 156. Leicester A. Environmental taxes: economic principles and the UK experience. 2013. 157. Johansson C, Burman L, Forsberg B. The effects of congestions tax on air quality and health. Atmospheric Environment. 2009;43(31):4843-54. 158. Goodkind AL. Economics of air pollution: policy, mortality concentration-response, and increasing marginal benefits of abatement. 2014. 159. Fontes T, Pereira S. Impact assessment of road fleet transitions on emissions: The case study of a medium European size country. Energy Policy. 2014;72:175-85. 160. Burman L, Johansson C. The effects of the congestion tax on emissions and air quality: evaluation until, and including, the year 2008. SLB. 2010. 161. Brown V, Moodie M, Carter R. Congestion pricing and active transport–evidence from five opportunities for natural experiment. Journal of Transport & Health. 2015;2(4):568-79. 162. Atkinson RW, Barratt B, Armstrong B, Anderson HR, Beevers SD, Mudway IS, et al. The impact of the congestion charging scheme on ambient air pollution concentrations in London. Atmospheric Environment. 2009;43(34):5493-500. 163. de Preux Gallone LB, Sassi F. Chief Medical Officer annual report 2017. Chapter 5 Economics of Pollution Interventions: health impacts of all pollution; what do we know? Department of Health and Social Care, 2018. 164. Fontes T, Pereira S, Bandeira J, Coelho M. Assessment of the effectiveness of fuel and toll pricing policies in motorway emissions: An ex-post analysis. Research in Transportation Economics. 2015;51:83-93. 165. Transport for London. Central London Congestion Charging: Impacts Monitoring: Sixth Annual Report, July 2008: Transport for London; 2008. 166. HM Treasury. Impact Assessment of reforms to the Vehicle Excise Duty rules on refunds and six month licences 2009. Available from: https://www.legislation.gov.uk/ukia/2009/115/pdfs/ukia_20090115_en.pdf. 167. Walker JJ, Mitchell RJ, Petticrew M, Platt SD. The effects on health of a publicly-funded domestic heating programme: a prospective controlled study. Journal of Epidemiology & Community Health. 2008:jech. 2008.074096.
Fiscal and pricing policies to improve public health
74
168. Edwards RT, Neal RD, Linck P, Bruce N, Mullock L, Nelhans N, et al. Enhancing ventilation in homes of children with asthma: cost-effectiveness study alongside randomised controlled trial. Br J Gen Pract. 2011;61(592):e733-e41. 169. Thomson H, Thomas S, Sellstrom E, Petticrew M. Housing improvements for health and associated socio-economic outcomes. Cochrane database of systematic reviews. 2013;2(2):CD008657. 170. Crossley TF, Zilio F. The health benefits of a targeted cash transfer: The UK Winter Fuel Payment. Health economics. 2017. 171. Wilson N, Kvizhinadze G, Pega F, Nair N, Blakely T. Home modification to reduce falls at a health district level: Modeling health gain, health inequalities and health costs. PloS one. 2017;12(9):e0184538. 172. Kessler RC, Duncan GJ, Gennetian LA, Katz LF, Kling JR, Sampson NA, et al. Associations of housing mobility interventions for children in high-poverty neighborhoods with subsequent mental disorders during adolescence. Jama. 2014;311(9):937-47. 173. Ludwig J, Duncan GJ, Gennetian LA, Katz LF, Kessler RC, Kling JR, et al. Neighborhood effects on the long-term well-being of low-income adults. Science. 2012;337(6101):1505-10. 174. Ludwig J, Sanbonmatsu L, Gennetian L, Adam E, Duncan GJ, Katz LF, et al. Neighborhoods, obesity, and diabetes—a randomized social experiment. New England journal of medicine. 2011;365(16):1509-19. 175. Schmidt NM, Glymour MM, Osypuk TL. Adolescence is a sensitive period for housing mobility to influence risky behaviors: an experimental design. Journal of Adolescent Health. 2017;60(4):431-7. 176. Glymour MM, Nguyen Q, Matsouaka R, Tchetgen EJT, Schmidt NM, Osypuk TL. Does mother know best? Treatment adherence as a function of anticipated treatment benefit. Epidemiology (Cambridge, Mass). 2016;27(2):265. 177. Leventhal T, Dupéré V. Moving to Opportunity: Does long-term exposure to ‘low-poverty’neighborhoods make a difference for adolescents? Social science & medicine. 2011;73(5):737-43. 178. Chetty R, Hendren N, Katz LF. The effects of exposure to better neighborhoods on children: New evidence from the Moving to Opportunity experiment. American Economic Review. 2016;106(4):855-902. 179. Gennetian LA, Sanbonmatsu L, Ludwig J. An overview of moving to opportunity: A random assignment housing mobility study in five US cities. Neighborhood and life chances: How place matters in modern America. 2011:163. 180. Schmidt NM, Lincoln AK, Nguyen QC, Acevedo-Garcia D, Osypuk TL. Examining mediators of housing mobility on adolescent asthma: results from a housing voucher experiment. Social Science & Medicine. 2014;107:136-44. 181. Sanbonmatsu L, Katz LF, Ludwig J, Gennetian LA, Duncan GJ, Kessler RC, et al. Moving to opportunity for fair housing demonstration program: Final impacts evaluation. 2011. 182. Hudgins R, Erickson S, Walker D. Everyone deserves a second chance: A decade of supports for teenage mothers. Health & social work. 2014;39(2):101-8. 183. O'Connell MJ, Kasprow WJ, Rosenheck RA. Differential impact of supported housing on selected subgroups of homeless veterans with substance abuse histories. Psychiatric Services. 2012;63(12):1195-205. 184. Cooper HL, Hunter-Jones J, Kelley ME, Karnes C, Haley DF, Ross Z, et al. The aftermath of public housing relocations: relationships between changes in local socioeconomic conditions and depressive symptoms in a cohort of adult relocaters. Journal of urban health. 2014;91(2):223-41.
Fiscal and pricing policies to improve public health
75
185. Reeves A, Clair A, McKee M, Stuckler D. Reductions in the United Kingdom's government housing benefit and symptoms of depression in low-income households. American journal of epidemiology. 2016;184(6):421-9. 186. Jackson G, Thornley S, Woolston J, Papa D, Bernacchi A, Moore T. Reduced acute hospitalisation with the healthy housing programme. Journal of Epidemiology & Community Health. 2011;65(7):588-93. 187. Novoa AM, Amat J, Malmusi D, Díaz F, Darnell M, Trilla C, et al. Changes in health following housing improvement in a vulnerable population in spain: a follow-up study. International Journal of Health Services. 2017;47(1):83-107. 188. Fenelon A, Mayne P, Simon AE, Rossen LM, Helms V, Lloyd P, et al. Housing assistance programs and adult health in the United States. American journal of public health. 2017;107(4):571-8. 189. Lindberg RA, Shenassa ED, Acevedo-Garcia D, Popkin SJ, Villaveces A, Morley RL. Housing interventions at the neighborhood level and health: a review of the evidence. Journal of Public Health Management and Practice. 2010;16(5):S44-S52. 190. Meyers A, Cutts D, Frank DA, Levenson S, Skalicky A, Heeren T, et al. Subsidized housing and children's nutritional status: data from a multisite surveillance study. Archives of pediatrics & adolescent medicine. 2005;159(6):551-6. 191. Kirkpatrick SI, Tarasuk V. Housing circumstances are associated with household food access among low-income urban families. Journal of urban health. 2011;88(2):284-96. 192. He Kainga Oranga. The impact of retrofitted insulation and new heaters on health services utilisation and costs, pharmaceutical costs and mortality. 2011. 193. Grimes A, Denne T, Howden-Chapman P, Arnold R, Telfar-Barnard L, Preval N, et al. Cost benefit analysis of the warm up new zealand: Heat smart programme. Wellington: University of Wellington. 2012. 194. Howden-Chapman P, Viggers H, Chapman R, O’Sullivan K, Barnard LT, Lloyd B. Tackling cold housing and fuel poverty in New Zealand: a review of policies, research, and health impacts. Energy Policy. 2012;49:134-42. 195. Healthy Housing He Kainga Oranga. Evaluation of Warm Up New Zealand: Heat Smart. Available from: http://www.healthyhousing.org.nz/research/past-research/evaluation-of-warm-up-new-zealand-heat-smart. 196. The Allen Consulting Group. Social and Economic Impact Study of Gambling in Tasmania. Final report to the Tasmanian Government Department of Treasury and Finance. 2011. 197. Blaszczynski A, Walker M, Sharpe L. The assessment of the impact of the reconfiguration on electronic gaming machines as harm minimisation strategies for problem gambling: University of Sydney Gambling Research Unit Sydney; 2001. 198. Sharpe L, Walker M, Coughlan M-J, Enersen K, Blaszczynski A. Structural changes to electronic gaming machines as effective harm minimization strategies for non-problem and problem gamblers. Journal of Gambling Studies. 2005;21(4):503-20. 199. Honoré PA, Simoes EJ, Moonesinghe R, Wang X, Brown L. Evaluating the ecological association of casino industry economic development on community health status: A natural experiment in the Mississippi delta region. Journal of Public Health Management and Practice. 2007;13(2):214-22. 200. Hansen M, Rossow I. Limited cash flow on slot machines: Effects of prohibition of note acceptors on adolescent gambling behaviour. International Journal of Mental Health and Addiction. 2010;8(1):70-81. 201. Gainsbury SM, Blankers M, Wilkinson C, Schelleman-Offermans K, Cousijn J. Recommendations for international gambling harm-minimisation guidelines: comparison with effective public health policy. J Gambl Stud. 2014;30(4):771-88.
Fiscal and pricing policies to improve public health
76
202. Geisner IM, Bowen S, Lostutter TW, Cronce JM, Granato H, Larimer ME. Gambling-Related Problems as a Mediator Between Treatment and Mental Health with At-Risk College Student Gamblers. J Gambl Stud. 2015;31(3):1005-13. 203. Rasanen T, Lintonen T, Joronen K, Konu A. Girls and boys gambling with health and well-being in Finland. J Sch Health. 2015;85(4):214-22. 204. Volpp KG, Troxel AB, Pauly MV, Glick HA, Puig A, Asch DA, et al. A randomized, controlled trial of financial incentives for smoking cessation. New England Journal of Medicine. 2009;360(7):699-709. 205. Yeo CD, Lee HY, Ha JH, Kang HH, Kang JY, Kim SK, et al. Efficacy of team-based financial incentives for smoking cessation in the workplace. Yonsei medical journal. 2015;56(1):295-9. 206. Ståhl C, Toomingas A, Åborg C, Ekberg K, Kjellberg K. Promoting occupational health interventions in early return to work by implementing financial subsidies: a Swedish case study. BMC public health. 2013;13(1):310. 207. Merrill RM, Hyatt B, Aldana SG, Kinnersley D. Lowering employee health care costs through the healthy lifestyle incentive program. Journal of Public Health Management and Practice. 2011;17(3):225-32. 208. Kogut SJ, Johnson S, Higgins T, Quilliam BJ. Evaluation of a program to improve diabetes care through intensified care management activities and diabetes medication copayment reduction. Journal of Managed Care Pharmacy. 2012;18(4):297-310. 209. Kim AE, Towers A, Renaud J, Zhu J, Shea JA, Galvin R, et al. Application of the RE-AIM framework to evaluate the impact of a worksite-based financial incentive intervention for smoking cessation. Journal of occupational and environmental medicine. 2012;54(5):610-4. 210. Haisley E, Volpp KG, Pellathy T, Loewenstein G. The impact of alternative incentive schemes on completion of health risk assessments. American Journal of Health Promotion. 2012;26(3):184-8. 211. Gingerich SB, Anderson DR, Koland H. Impact of financial incentives on behavior change program participation and risk reduction in worksite health promotion. American Journal of Health Promotion. 2012;27(2):119-22. 212. Fronstin P, Roebuck MC. Financial incentives, workplace wellness program participation, and utilization of health care services and spending. 2015. 213. Paxton GA, Tyrrell L, Oldfield SB, Kiang K, Danchin MH. No Jab, No Pay—no planning for migrant children. Med J Aust. 2016;205(7):296-8. 214. Nowalk MP, Lin CJ, Toback SL, Rousculp MD, Eby C, Raymund M, et al. Improving influenza vaccination rates in the workplace: a randomized trial. American journal of preventive medicine. 2010;38(3):237-46. 215. National Centre for Immunisation Research and Surveillance. No Jab No Play, No Jab No Pay Policies 2017. Available from: http://www.ncirs.edu.au/consumer-resources/no-jab-no-play-no-jab-no-pay-policies/. 216. McDermott L, Wright AJ, Cornelius V, Burgess C, Forster AS, Ashworth M, et al. Enhanced invitation methods and uptake of health checks in primary care. Rapid randomised controlled trial using electronic health records. Health Technology Assessment. 2016;20(84):385. 217. Judah G, Vlaev I, Gunn L, King D, King D, Valabhji J, et al. Incentives in Diabetic Eye Assessment by Screening (IDEAS): study protocol of a three-arm randomized controlled trial using financial incentives to increase screening uptake in London. BMC ophthalmology. 2016;16(1):28. 218. Judah G, Darzi A, Vlaev I, Gunn L, King D, King D, et al. Incentives in Diabetic Eye Assessment by Screening (IDEAS) trial: a three-armed randomised controlled trial of financial incentives. 2017.
Fiscal and pricing policies to improve public health
77
219. Gupta S, Miller S, Koch M, Berry E, Anderson P, Pruitt SL, et al. Financial incentives for promoting colorectal cancer screening: a randomized, comparative effectiveness trial. The American journal of gastroenterology. 2016;111(11):1630. 220. Forster AS, Burgess C, McDermott L, Wright AJ, Dodhia H, Conner M, et al. Enhanced invitation methods to increase uptake of NHS health checks: study protocol for a randomized controlled trial. Trials. 2014;15(1):342. 221. Fielding JE, Bolam B, Danchin MH. Immunisation coverage and socioeconomic status–questioning inequity in the ‘No Jab, No Pay’policy. Australian and New Zealand journal of public health. 2017;41(5):455-7. 222. Downing SG, Cashman C, McNamee H, Penney D, Russell DB, Hellard ME. Increasing chlamydia test of re-infection rates using SMS reminders and incentives. Sex Transm Infect. 2013;89(1):16-9. 223. Dolan P, Rudisill C. The effect of financial incentives on Chlamydia testing rates: evidence from a randomized experiment. Social Science & Medicine. 2014;105:140-8. 224. Currie MJ, Schmidt M, Davis BK, Baynes AM, O’Keefe EJ, Bavinton TP, et al. ‘Show me the money’: financial incentives increase chlamydia screening rates among tertiary students: a pilot study. Sexual health. 2010;7(1):60-5. 225. Brownell MD, Chartier MJ, Nickel NC, Chateau D, Martens PJ, Sarkar J, et al. Unconditional prenatal income supplement and birth outcomes. Pediatrics. 2016;137(6):e20152992. 226. Brownell MD. Impact of the Healthy Baby Prenatal Benefit on Perinatal Outcomes : A PATHS Equity for Children Project. 2015. Available from: https://www.cahspr.ca/en/presentation/55745db937dee82b15501956. 227. Bowden FJ, Currie MJ, Todkill M, Schmidt M, Webeck S, Del Rosario R, et al. A pragmatic assessment of the relative efficiency of outreach chlamydia screening events conducted in non-clinical settings. BMC public health. 2012;12(1):341. 228. Beard FH, Leask J, McIntyre PB. No jab, no pay and vaccine refusal in Australia: the jury is out. Med J Aust. 2017;206(9):381-3. 229. Austin S, Wolfe BL. The effect of patient reminders and gas station gift cards on patient adherence to testing guidelines for diabetes. WMJ. 2011;110(3):132-7. 230. Adler J, Dominitz JA. Financial Incentives to Improve Colorectal Cancer Screening: Does it Make Cents? The American journal of gastroenterology. 2016;111(11):1637. 231. JOINT MEDIA RELEASE, Further Strengthening No Jab, No Pay [press release]. Monday, 1st May 2017. 232. ABC News. 'Don't punish children for decisions of parents': Researcher urges rethink of no jab no play policy. 2018. 233. World Health Organization. WHO report on the global tobacco epidemic. Geneva: 2017. 234. Scotland N. Impact of tobacco pricing on smoking prevalence. 2018. 235. International Agency for Research on Cancer. IARC handbooks of cancer prevention volume 14: tobacco control: effectiveness of tax and price policies for tobacco control. Lyon, France: 2011. 236. Doogan NJ, Wewers ME, Berman M. The impact of a federal cigarette minimum pack price policy on cigarette use in the USA. Tob Control. 2018;27(2):203-8. 237. Boyd KA, Briggs AH, Bauld L, Sinclair L, Tappin D. Are financial incentives cost-effective to support smoking cessation during pregnancy? Addiction. 2016;111(2):360-70. 238. Cahill K, Hartmann-Boyce J, Perera R. Incentives for smoking cessation. Cochrane Database Syst Rev. 2015(5):CD004307. 239. Heil SH, Higgins ST, Bernstein IM, Solomon LJ, Rogers RE, Thomas CS, et al. Effects
of voucher‐based incentives on abstinence from cigarette smoking and fetal growth among pregnant women. Addiction. 2008;103(6):1009-18.
Fiscal and pricing policies to improve public health
78
240. Ierfino D, Mantzari E, Hirst J, Jones T, Aveyard P, Marteau TM. Financial incentives for
smoking cessation in pregnancy: A single‐arm intervention study assessing cessation and gaming. Addiction. 2015;110(4):680-8. 241. Kendzor DE, Businelle MS, Poonawalla IB, Cuate EL, Kesh A, Rios DM, et al. Financial incentives for abstinence among socioeconomically disadvantaged individuals in smoking cessation treatment. American journal of public health. 2015;105(6):1198-205. 242. McConnachie A, Haig C, Sinclair L, Bauld L, Tappin DM. Birth weight differences between those offered financial voucher incentives for verified smoking cessation and control participants enrolled in the Cessation in Pregnancy Incentives Trial (CPIT), employing an intuitive approach and a Complier Average Causal Effects (CACE) analysis. Trials. 2017;18(1):337. 243. Ondersma SJ, Svikis DS, Lam PK, Connors-Burge VS, Ledgerwood DM, Hopper JA. A randomized trial of computer-delivered brief intervention and low-intensity contingency management for smoking during pregnancy. Nicotine & tobacco research. 2011;14(3):351-60. 244. Radley A, Ballard P, Eadie D, MacAskill S, Donnelly L, Tappin D. Give It Up For Baby: outcomes and factors influencing uptake of a pilot smoking cessation incentive scheme for pregnant women. BMC Public Health. 2013;13:343. 245. Tappin D, Bauld L, Purves D, Boyd K, Sinclair L, MacAskill S, et al. Financial incentives for smoking cessation during pregnancy: a randomised controlled trial. The Lancet. 2014;384:S4. 246. Tappin D, Bauld L, Purves D, Boyd K, Sinclair L, MacAskill S, et al. Financial incentives for smoking cessation in pregnancy: randomised controlled trial. BMJ. 2015;350:h134. 247. Tappin DM, Bauld L, Tannahill C, de Caestecker L, Radley A, McConnachie A, et al. The cessation in pregnancy incentives trial (CPIT): study protocol for a randomized controlled trial. Trials. 2012;13:113. 248. Tobacco Free Futures. Supporting a Smokefree Pregnancy Scheme: A Success Story. An independent report written by Jon Dawson Associates Ltd for Tobacco Free Futures. 2014. 249. Physicians for a smoke free Canada 2017. Available from: http://smoke-free-canada.blogspot.com/2017/02/france-leads-way-with-four-and-counting.html. 250. Article 28 LOI n° 2016-1827 du 23 décembre 2016 de financement de la sécurité sociale pour 2017 (1) (2017). 251. Décret no 2016-1671 du 5 décembre 2016 portant création d’un fonds de lutte contre le tabac (2016). 252. Ministère des affaires sociales et de la santé. Fonds de lutte contre le tabac 2018. Available from: http://solidarites-sante.gouv.fr/prevention-en-sante/addictions/article/fonds-de-lutte-contre-le-tabac. 253. Marita Hefler. France: breaking new ground in tobacco control 2017. Available from: https://blogs.bmj.com/tc/2017/03/02/france-breaking-new-ground-in-tobacco-control/. 254. French Government. Projet de loi de financement de la sécurité sociale pour 2018. Article 12. 2017. Available from: https://www.nosdeputes.fr/15/seance/588#table_686. 255. Le Monde du Tabac. Nouvelles taxes sur le tabac : des motifs bien alambiqués 2016. Available from: http://www.lemondedutabac.com/nouvelles-taxes-sur-le-tabac-des-motifs-bien-alambiques/. 256. OECD. Consumption tax trends 2016: VAT/GST and excise rates, trends and policy issues. Paris: 2016. 257. Wagenaar AC, Tobler AL, Komro KA. Effects of alcohol tax and price policies on morbidity and mortality: a systematic review. American journal of public health. 2010;100(11):2270-8.
Fiscal and pricing policies to improve public health
79
258. Vandenberg B, Sharma A. Are Alcohol Taxation and Pricing Policies Regressive? Product-Level Effects of a Specific Tax and a Minimum Unit Price for Alcohol. Alcohol Alcohol. 2016;51(4):493-502.
259. Cobiac L, Vos T, Doran C, Wallace A. Cost‐effectiveness of interventions to prevent alcohol‐related disease and injury in Australia. Addiction. 2009;104(10):1646-55. 260. Byrnes JM, Cobiac LJ, Doran CM, Vos T, Shakeshaft AP. Cost-effectiveness of volumetric alcohol taxation in Australia. Med J Aust. 2010;192(8):439-43. 261. Byrnes J, Petrie DJ, Doran CM, Shakeshaft A. The efficiency of a volumetric alcohol tax in Australia. Applied health economics and health policy. 2012;10(1):37-49. 262. Victorian Health Promotion Foundation (VicHealth). Strengthening the evidence base for volumetric taxation of alcohol. The health
and economic impacts of alternative alcohol taxation regimes in Australia. Carlton, Australia: 2011. 263. Doran CM, Byrnes JM, Cobiac LJ, Vandenberg B, Vos T. Estimated impacts of alternative Australian alcohol taxation structures on consumption, public health and government revenues. Med J Aust. 2013;199(9):619-22. 264. Meier PS, Holmes J, Angus C, Ally AK, Meng Y, Brennan A. Estimated effects of different alcohol taxation and price policies on health inequalities: a mathematical modelling study. PLoS medicine. 2016;13(2):e1001963. 265. Sherk A, Stockwell T, Callaghan RC. The effect on emergency department visits of raised alcohol minimum prices in Saskatchewan, Canada. Drug Alcohol Rev. 2018;37 Suppl 1:S357-S65. 266. Sharma A, Vandenberg B, Hollingsworth B. Minimum pricing of alcohol versus volumetric taxation: which policy will reduce heavy consumption without adversely affecting light and moderate consumers? PLoS One. 2014;9(1):e80936. 267. World Health Organization. Promoting Health, Preventing Disease The Economic Case: The Economic Case: OECD Publishing; 2015. 268. Parks MJ, Kingsbury JH, Boyle RG, Choi K. Behavioral change in response to a statewide tobacco tax increase and differences across socioeconomic status. Addictive behaviors. 2017;73:209-15. 269. Summers LH. Taxes for health: evidence clears the air. The Lancet. 2018;391(10134):1974-6. 270. Organization WH. Promoting Health, Preventing Disease The Economic Case: The Economic Case: OECD Publishing; 2015. 271. Department of Health and Social Care. Childhood obesity: a plan for action, chapter 2 2018. Available from: https://www.gov.uk/government/publications/childhood-obesity-a-plan-for-action-chapter-2. 272. OPINION OF ADVOCATE GENERAL KOKOTT delivered on 22 October 2009. Case
C‑197/08, Commission of the European Communities v French Republic, and Case C‑198/08 Commission of the European Communities v Republic of Austria and Case C‑221/08 Commission of the European Communities v Ireland, (Minimum prices – Tobacco products – Directive 95/59/EC – Health protection)
Available from: http://curia.europa.eu/juris/document/document.jsf?text=&docid=72507&pageIndex=0&doclang=EN&mode=lst&dir=&occ=first&part=1&cid=391064. 273. UK Parliament. Alcoholic Drinks: Excise Duties: Written question - 161163 2018. Available from: https://www.parliament.uk/business/publications/written-questions-answers-statements/written-question/Commons/2018-07-05/161163/.
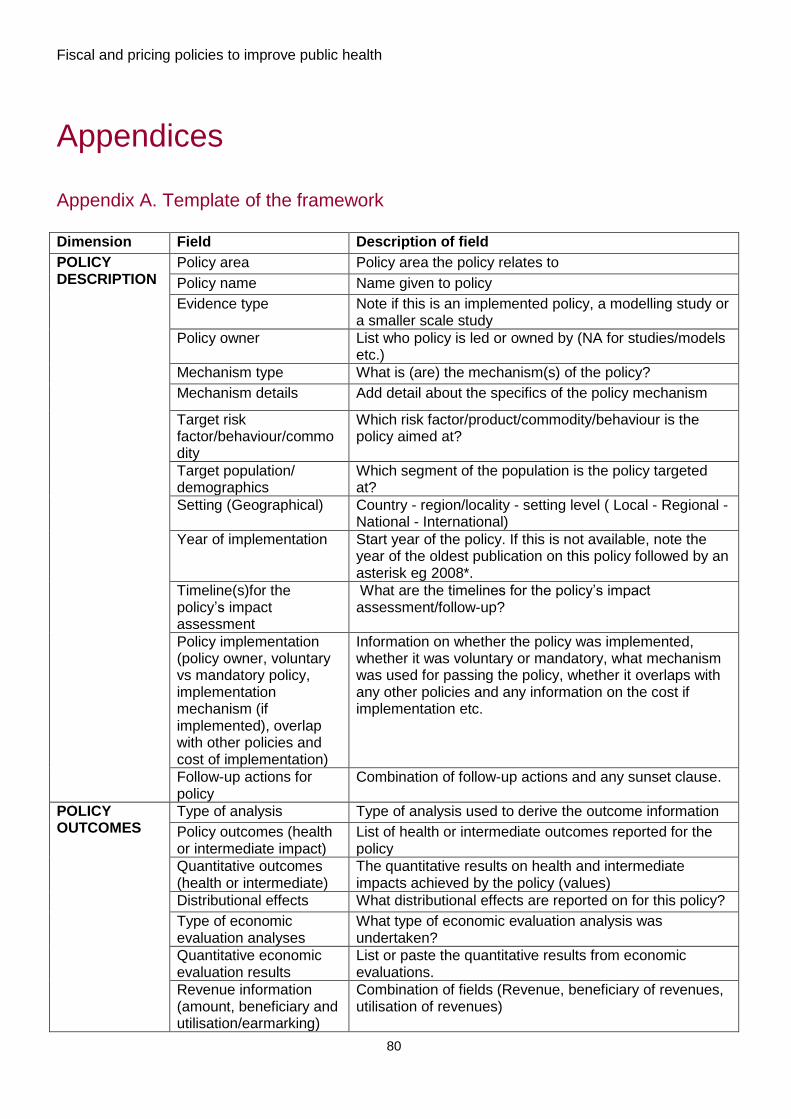
Fiscal and pricing policies to improve public health
80
Appendices
Appendix A. Template of the framework
Dimension Field Description of field
POLICY DESCRIPTION
Policy area Policy area the policy relates to
Policy name Name given to policy
Evidence type Note if this is an implemented policy, a modelling study or a smaller scale study
Policy owner List who policy is led or owned by (NA for studies/models etc.)
Mechanism type What is (are) the mechanism(s) of the policy?
Mechanism details Add detail about the specifics of the policy mechanism
Target risk factor/behaviour/commodity
Which risk factor/product/commodity/behaviour is the policy aimed at?
Target population/ demographics
Which segment of the population is the policy targeted at?
Setting (Geographical) Country - region/locality - setting level ( Local - Regional - National - International)
Year of implementation Start year of the policy. If this is not available, note the year of the oldest publication on this policy followed by an asterisk eg 2008*.
Timeline(s)for the policy’s impact assessment
What are the timelines for the policy’s impact assessment/follow-up?
Policy implementation (policy owner, voluntary vs mandatory policy, implementation mechanism (if implemented), overlap with other policies and cost of implementation)
Information on whether the policy was implemented, whether it was voluntary or mandatory, what mechanism was used for passing the policy, whether it overlaps with any other policies and any information on the cost if implementation etc.
Follow-up actions for policy
Combination of follow-up actions and any sunset clause.
POLICY OUTCOMES
Type of analysis Type of analysis used to derive the outcome information
Policy outcomes (health or intermediate impact)
List of health or intermediate outcomes reported for the policy
Quantitative outcomes (health or intermediate)
The quantitative results on health and intermediate impacts achieved by the policy (values)
Distributional effects What distributional effects are reported on for this policy?
Type of economic evaluation analyses
What type of economic evaluation analysis was undertaken?
Quantitative economic evaluation results
List or paste the quantitative results from economic evaluations.
Revenue information (amount, beneficiary and utilisation/earmarking)
Combination of fields (Revenue, beneficiary of revenues, utilisation of revenues)
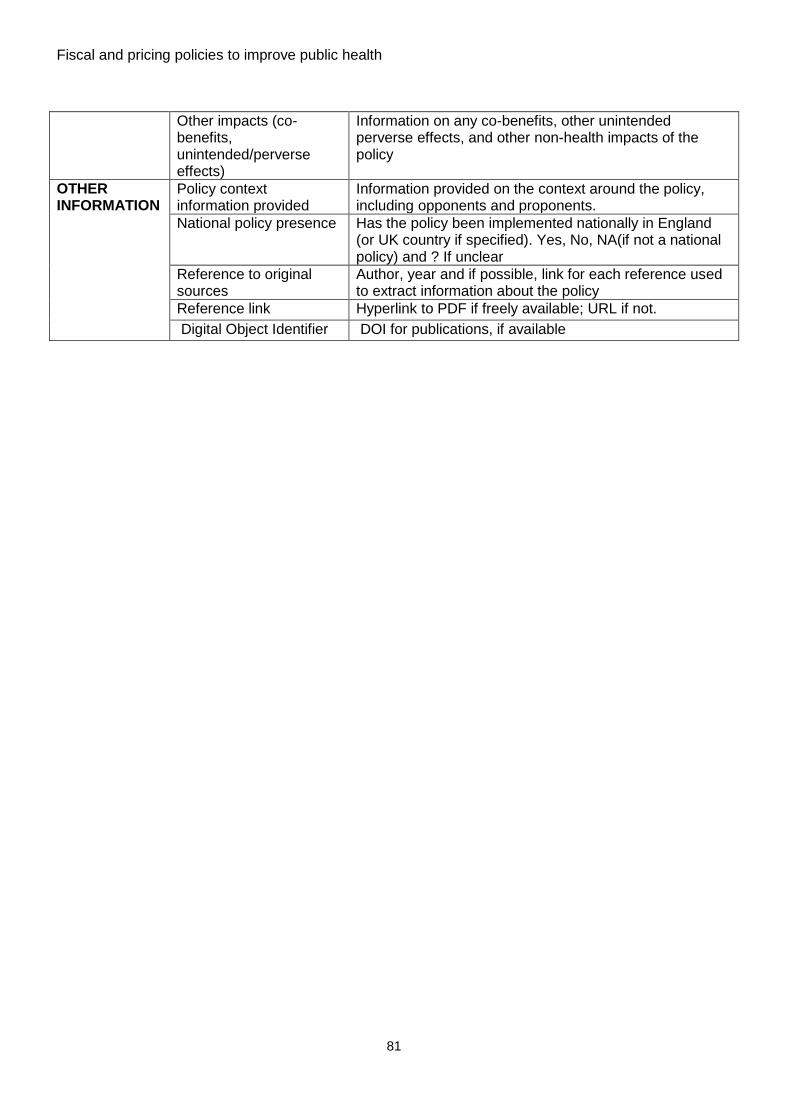
Fiscal and pricing policies to improve public health
81
Other impacts (co-benefits, unintended/perverse effects)
Information on any co-benefits, other unintended perverse effects, and other non-health impacts of the policy
OTHER INFORMATION
Policy context information provided
Information provided on the context around the policy, including opponents and proponents.
National policy presence Has the policy been implemented nationally in England (or UK country if specified). Yes, No, NA(if not a national policy) and ? If unclear
Reference to original sources
Author, year and if possible, link for each reference used to extract information about the policy
Reference link Hyperlink to PDF if freely available; URL if not.
Digital Object Identifier DOI for publications, if available
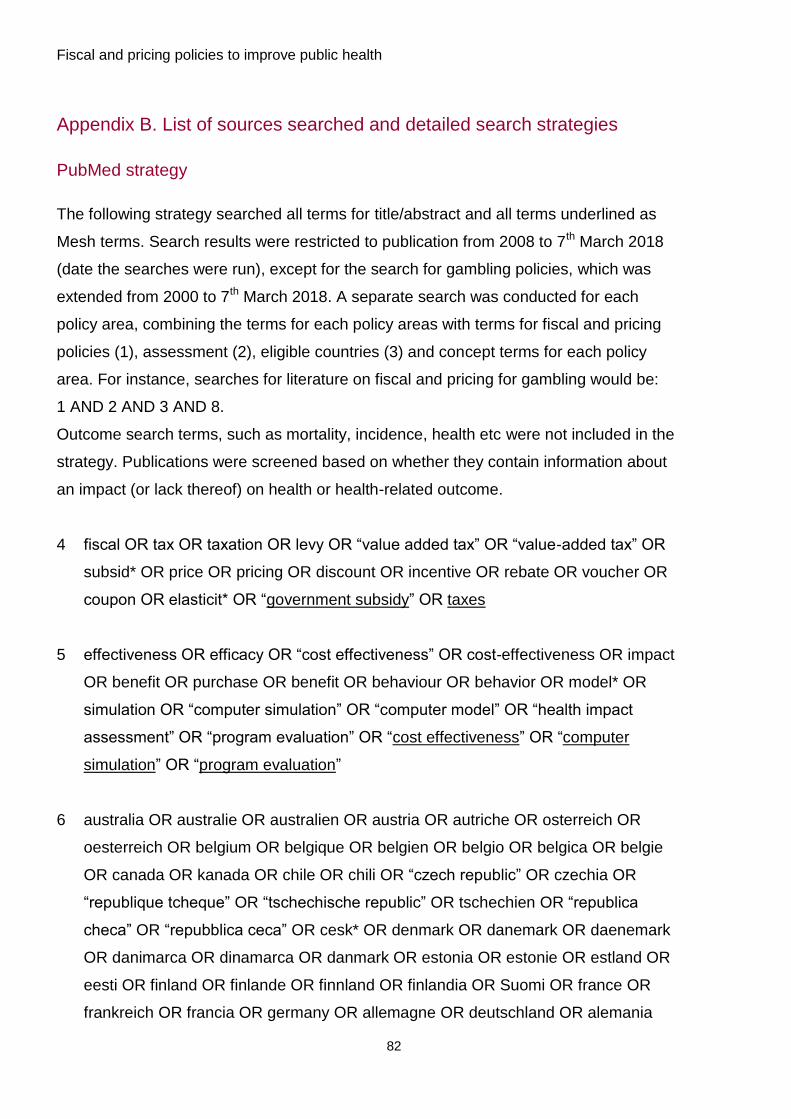
Fiscal and pricing policies to improve public health
82
Appendix B. List of sources searched and detailed search strategies
PubMed strategy
The following strategy searched all terms for title/abstract and all terms underlined as
Mesh terms. Search results were restricted to publication from 2008 to 7th March 2018
(date the searches were run), except for the search for gambling policies, which was
extended from 2000 to 7th March 2018. A separate search was conducted for each
policy area, combining the terms for each policy areas with terms for fiscal and pricing
policies (1), assessment (2), eligible countries (3) and concept terms for each policy
area. For instance, searches for literature on fiscal and pricing for gambling would be:
1 AND 2 AND 3 AND 8.
Outcome search terms, such as mortality, incidence, health etc were not included in the
strategy. Publications were screened based on whether they contain information about
an impact (or lack thereof) on health or health-related outcome.
4 fiscal OR tax OR taxation OR levy OR “value added tax” OR “value-added tax” OR
subsid* OR price OR pricing OR discount OR incentive OR rebate OR voucher OR
coupon OR elasticit* OR “government subsidy” OR taxes
5 effectiveness OR efficacy OR “cost effectiveness” OR cost-effectiveness OR impact
OR benefit OR purchase OR benefit OR behaviour OR behavior OR model* OR
simulation OR “computer simulation” OR “computer model” OR “health impact
assessment” OR “program evaluation” OR “cost effectiveness” OR “computer
simulation” OR “program evaluation”
6 australia OR australie OR australien OR austria OR autriche OR osterreich OR
oesterreich OR belgium OR belgique OR belgien OR belgio OR belgica OR belgie
OR canada OR kanada OR chile OR chili OR “czech republic” OR czechia OR
“republique tcheque” OR “tschechische republic” OR tschechien OR “republica
checa” OR “repubblica ceca” OR cesk* OR denmark OR danemark OR daenemark
OR danimarca OR dinamarca OR danmark OR estonia OR estonie OR estland OR
eesti OR finland OR finlande OR finnland OR finlandia OR Suomi OR france OR
frankreich OR francia OR germany OR allemagne OR deutschland OR alemania
Fiscal and pricing policies to improve public health
83
OR Germania OR greece OR grece OR grecia OR griechenland OR hungary OR
hongrie OR ungarn OR “ungarischen republic” OR hungria OR hungar OR
“repubblica ungherese” OR iceland OR islande OR island OR islandia OR islanda
OR ireland OR irlande OR irland OR irlanda OR israel OR israele OR italy OR italie
OR italien OR italia OR japan OR japon OR janpanien OR giappone OR korea OR
coree OR corea OR latvia OR lettonie OR lettland OR letonia OR lettonia OR latvija
OR luxembourg OR luxemburg OR luxemburgo OR lussemburgo OR mexico OR
mexique OR mexiko OR mejico OR messico OR netherlands OR “pays-bas” OR
niederlande OR olanda OR “paesi bassi” OR “paises bajos” OR nederland OR “new
Zealand” OR “nouvelle zelande” OR neuseeland OR “nueva zelanda” OR “nuova
zelanda” OR norway OR norvege OR norwegen OR noruega OR norvegia OR
norge OR poland OR pologne OR polen OR polonia OR polska OR portugal OR
portogallo OR slovakia OR “slovak republic” OR slovaquie OR “republique
slovaque” OR slovensk* OR slowakei OR “slowakische republic” OR eslovaquia OR
“republica eslovaca” OR slovacchia OR “repubblica slovacca” OR slovenia OR
slovenie OR slowenien OR slovenia OR eslovenia OR slovenija OR spain OR
espagne OR spanien OR espana OR spagna OR sweden OR suede OR schweden
OR suecia OR svezia OR sverige OR switzerland OR suisse OR schweiz OR suiza
OR svizzera OR turkey OR turquie OR turkei OR turchia OR turquia OR uk OR
“united kingdom” OR “royaume uni” OR “vereinigtes koenigreich“ OR “reino unido”
OR “regno unito” OR “great britain” OR “grande bretagne” OR “gross britannien” OR
grossbritannien OR “gran bretana” OR “gran bretagna” OR england OR angleterre
OR inglaterra OR inghilterra OR scotland OR ecosse OR schottland OR escocia OR
scozia OR wales OR “pays de galles” OR gales OR galles OR usa OR “united
states” OR “etats-unis” OR “vereinigte staaten” OR “estados unidos” OR “stati uniti”
OR “developed countries” OR “developed economies” OR
“industrialized countr*”OR “industrialised countr*” OR “europe” OR “america” OR
oecd OR brazil OR fiji OR Caribbean
7 Diet and obesity terms: “food and beverage” OR fruit OR vegetables OR fat OR
fats OR “sugar-sweetened beverage” OR “sugar sweetened drink*” OR soda OR
“soft drink” OR “carbonated drink*” OR beverage OR meat OR dairy OR candy OR
sugar* OR sucrose OR sweet* OR snack* OR fastfood* OR “fast food*” OR
Fiscal and pricing policies to improve public health
84
junkfood OR “junk food*” OR calorie OR calorie* OR “vending machine*” OR
“takeaway” OR sodium OR “food and beverages” OR fruit OR vegetables OR
snacks OR "sodium, dietary" OR eating OR diet OR “food intake” OR “food
consumption” OR intake OR “dietary behaviour” OR “dietary behavior” OR “dietary
intake” OR “eating behaviour” OR “eating behavior” OR eating OR diet OR “food
intake” OR “Diet, Food, and Nutrition” OR BMI OR "body weight" OR “body mass
index” OR “adiposity” OR overweight OR obesity OR obese OR ”body mass index”
OR adiposity OR overweight OR obesity
8 Physical activity terms: “physical activity” OR “physical fitness” OR “active
lifestyle” OR moving OR move* OR walking OR sport* OR exercis* OR biking OR
bike* OR bicycl* OR cycling OR walk* OR dancing OR “active transport*” OR “active
travel” OR “active commut*” OR physical inactivity fitness OR “physical exertion” OR
“exercise”
9 Environment terms: “ambient air pollution” OR “indoor air pollution” OR “particulate
matter” OR “PM2.5” OR “black carbon” OR “PM10” OR “nitrogen dioxide” OR NO2
OR “sulfur dioxide” OR SO2 OR ozone OR O3 OR “carbon monoxide” OR emission
OR “volatile organic compounds” OR emission OR “air pollution”
10 Housing terms: housing OR house OR home OR “living standards” OR “living
conditions” OR housing OR “public housing”
11 Gambling terms: gambl* OR betting OR gambling OR lottery OR lotto
12 Healthy workplace terms: (staff or personnel or employe* or profession* or
workplace* or worksite OR “health personnel” OR “workplace” OR Workplace) AND
(intervent* or promot* or initiativ* or program* or scheme*) AND (health OR healthy
OR wellness OR wellbeing OR “well-being” OR “mental health” OR exercise* OR
food* OR diet* OR alcohol* OR smok* OR leisure OR fit* OR stress* OR depress*
OR activ*) OR Employee Incentive Plans
Fiscal and pricing policies to improve public health
85
13 Secondary prevention activities terms: screening OR diagnosis OR “prevention
services” OR “secondary prevention” OR “vaccin*” OR “health check” OR “Mass
Screening”
EconLit
The strategy for Econlit is similar to that used for Pubmed, with a title/abstract search for
all terms, but MeSH terms were not used and the term “policy” was added to the fiscal
and pricing terms. Search results were restricted to publication from 2008 to 7th March
2018 (date the searches were run), except for the search for gambling policies, which
was extended from 2000 to 7th March 2018
An example of a search for gambling would be 1 AND 2 AND 3 AND 8 AND “policy”
1 (fiscal OR tax OR taxation OR levy OR “value added tax” OR value-added tax” OR
VAT OR subsid* OR price OR pricing OR discount OR incentive OR rebate OR
voucher OR coupon OR elasticit* OR “government subsidy” OR taxes) AND policy
2 effectiveness OR efficacy OR “cost effectiveness” OR cost-effectiveness OR impact
OR benefit OR purchase OR behaviour OR behavior OR model* OR simulation OR
“computer simulation” OR “computer model” OR “health impact assessment” OR
“program evaluation” OR “cost effectiveness” OR “computer simulation” OR
“program evaluation”
3 australia OR australie OR australien OR austria OR autriche OR osterreich OR
oesterreich OR belgium OR belgique OR belgien OR belgio OR belgica OR belgie
OR canada OR kanada OR chile OR chili OR “czech republic” OR czechia OR
“republique tcheque” OR “tschechische republic” OR tschechien OR “republica
checa” OR “repubblica ceca” OR cesk* OR denmark OR danemark OR daenemark
OR danimarca OR dinamarca OR danmark OR estonia OR estonie OR estland OR
eesti OR finland OR finlande OR finnland OR finlandia OR Suomi OR france OR
frankreich OR francia OR germany OR allemagne OR deutschland OR alemania
OR Germania OR greece OR grece OR grecia OR griechenland OR hungary OR
hongrie OR ungarn OR “ungarischen republic” OR hungria OR hungar OR
“repubblica ungherese” OR iceland OR islande OR island OR islandia OR islanda
OR ireland OR irlande OR irland OR irlanda OR israel OR israele OR italy OR italie
Fiscal and pricing policies to improve public health
86
OR italien OR italia OR japan OR japon OR janpanien OR giappone OR korea OR
coree OR corea OR latvia OR lettonie OR lettland OR letonia OR lettonia OR latvija
OR luxembourg OR luxemburg OR luxemburgo OR lussemburgo OR mexico OR
mexique OR mexiko OR mejico OR messico OR netherlands OR “pays-bas” OR
niederlande OR olanda OR “paesi bassi” OR “paises bajos” OR nederland OR “new
Zealand” OR “nouvelle zelande” OR neuseeland OR “nueva zelanda” OR “nuova
zelanda” OR norway OR norvege OR norwegen OR noruega OR norvegia OR
norge OR poland OR pologne OR polen OR polonia OR polska OR portugal OR
portogallo OR slovakia OR “slovak republic” OR slovaquie OR “republique
slovaque” OR slovensk* OR slowakei OR “slowakische republic” OR eslovaquia OR
“republica eslovaca” OR slovacchia OR “repubblica slovacca” OR slovenia OR
slovenie OR slowenien OR slovenia OR eslovenia OR slovenija OR spain OR
espagne OR spanien OR espana OR spagna OR sweden OR suede OR schweden
OR suecia OR svezia OR sverige OR switzerland OR suisse OR schweiz OR suiza
OR svizzera OR turkey OR turquie OR turkei OR turchia OR turquia OR uk OR
“united kingdom” OR “royaume uni” OR “vereinigtes koenigreich“ OR “reino unido”
OR “regno unito” OR “great britain” OR “grande bretagne” OR “gross britannien” OR
grossbritannien OR “gran bretana” OR “gran bretagna” OR england OR angleterre
OR inglaterra OR inghilterra OR scotland OR ecosse OR schottland OR escocia OR
scozia OR wales OR “pays de galles” OR gales OR galles OR usa OR “united
states” OR “etats-unis” OR “vereinigte staaten” OR “estados unidos” OR “stati uniti”
OR “developed countries” OR “developed economies” OR
“industrialized countr*”OR “industrialised countr*” OR “europe” OR “america” OR
oecd OR brazil OR fiji OR Caribbean
4 Diet and obiesty terms: “food and beverage” OR fruit OR fruit OR vegetables OR fat
OR fats OR “sugar-sweetened beverage” OR “sugar sweetened drink*” OR soda
OR “soft drink” OR “carbonated drink*” OR beverage OR meat OR dairy OR candy
OR sugar* OR sucrose OR sweet* OR snack* OR fastfood* OR “fast food*” OR
junkfood OR “junk food*” OR calorie OR calorie* OR “vending machine*” OR
“takeaway” OR sodium OR “food and beverages” OR fruit OR vegetables OR
snacks OR "sodium, dietary" OR Eating OR diet OR “food intake” OR “food
consumption” OR OR intake OR “dietary behaviour” OR “dietary behavior” OR
Fiscal and pricing policies to improve public health
87
“dietary intake” OR “eating behaviour” OR “eating behavior” OR eating OR diet OR
“food intake” OR “Diet, Food, and Nutrition” OR BMI OR "body weight" OR “body
mass index” OR “adiposity” OR overweight OR obesity OR obese OR body mass
index” OR adiposity OR overweight OR obesity OR consumption
5 Physical activity terms:“physical activity” OR “physical fitness” OR “active
lifestyle” OR moving OR move* OR sport* OR exercis* OR biking OR bike* OR
bicycl* OR cycling OR walk* OR dancing OR “active transport*” OR “active travel”
OR “active commut*” OR physical inactivity fitness OR “physical exertion”
6 Environment terms: “ambient air pollution” OR “indoor air pollution” OR “particulate
matter” OR “black carbon” OR “nitrogen dioxide” OR “sulfur dioxide” OR ozone OR
“carbon monoxide” OR “volatile organic compounds” OR “air pollution” OR emission
7 Housing terms: housing OR house OR home OR “living standards” OR “living
conditions” OR “public housing”
8 Gambling terms: gambl* OR betting OR lottery OR lotto
9 Healthy workplace terms: ((staff or personnel or employe* or profession* or
workplace* or worksite OR “health personnel” OR “workplace” OR workplace ) AND
(intervent* or promot* or initiativ* or program* or scheme*) AND (health OR healthy
OR wellness OR wellbeing OR “well-being” OR “mental health” OR exercise* OR
food* OR diet* OR alcohol* OR smok* OR leisure OR fit* OR stress* OR depress*
OR activ*)) OR “Employee Incentive Plans”
10 Secondary prevention activities terms: screening OR diagnosis OR “prevention
services” OR “secondary prevention” OR “vaccin*” OR “health check” OR “mass
Screening”
Fiscal and pricing policies to improve public health
88
Google Scholar
A more succinct combination of terms was searched for each policy areas, filtered for
2008-2018 (2000 for gambling policies). Hits were sorted by relevance and the first 3
pages of hits were be screened and relevant references included
1 ("fiscal policy" OR "fiscal policies" OR taxes OR subsidy) AND (diet OR obesity OR
overweight OR food OR fat)
2 "fiscal policy" OR "fiscal policies" OR taxes OR subsidy) AND (“physical activity” OR
transport”)
3 "fiscal policy" OR "fiscal policies" OR taxes OR subsidy) AND (environment OR
pollution)
4 "fiscal policy" OR "fiscal policies" OR taxes OR subsidy) AND (housing)
5 "fiscal policy" OR "fiscal policies" OR taxes OR subsidy) AND (gambling)
6 "fiscal policy" OR "fiscal policies" OR taxes OR subsidy) AND (health) AND
(“workplace” OR “employee)
7 "fiscal policy" OR "fiscal policies" OR taxes OR subsidy) AND (health) AND
(prevention OR screening)
Grey literature
In addition to peer-reviewed literature, we searched Google using the same keyword
search strategy as for Google Scholar and searched international organisation websites
including OECD, World Bank, WHO, IMF, IFS for further sources of information. We
searched these organisational websites in two ways, once by browsing them individually
for relevant publications and we ran the Google keyword searches for each policy area,
using the site filter function in Google. Eg to search the World Health Organisation, we
ran the separate policy area searches, adding “site:who.int”.
In addition, we searched the following websites:
For tobacco and alcohol, specific topics of interest were searched, and therefore
specific literature search strategies were devised and used across PubMed, EconLit
and Google Scholar.
Fiscal and pricing policies to improve public health
89
Tobacco specific searches
E-cigarette taxation strategy
8 e-cig* OR electr* cigar* OR “electronic nicotine” OR vape or vaper or vapers or
vaping
9 fiscal OR tax OR taxation OR levy OR “value added tax” OR “value-added tax” OR
subsid* OR price OR pricing OR discount OR incentive OR rebate OR voucher OR
coupon OR elasticit* OR “government subsidy” OR taxes
10 11 AND 12 AND 3 [ limited to 2008 onwards]
Minimum unit pricing for tobacco products 11 "minimum unit pricing" OR "minimum unit price" OR "minimum pricing" OR
"minimum price" OR "floor price" OR "floor pricing" OR “Pack price’” OR “stick”
12 smoking OR cigarette OR tobacco OR smok* OR nicotine OR smoking OR tobacco
13 14 AND 15 AND 3 [ limited to 2008 onwards]
Tobacco levy experience in the USA and France 14 levy[Title/Abstract])
15 smoking OR cigarette OR tobacco OR smok* OR nicotine OR smoking OR tobacco
16 14 AND 15 AND “france OR frankreich OR francia OR usa OR “united states” OR
“etats-unis” OR “vereinigte staaten” OR “estados unidos” OR “stati uniti” ) [ limited to
2008 onwards]
Incentives for smoking cessation in pregnancy 17 pregnan* OR antenatal* OR gestation* OR pregnancy OR "socio-economic status"
OR "socio economic status" OR “socioeconomic factors” OR “social class” OR
“educational status” OR “educational level” OR “socioeconomic condition” OR
“socioeconomic level“ OR “socioeconomic determinant” OR “social determinant” OR
income OR poverty OR “occupational class”
18 smoking OR cigarette OR tobacco OR smok* OR nicotine OR smoking OR tobacco
19 subsid* OR price OR pricing OR discount OR incentive OR rebate OR voucher OR
coupon OR elasticit* OR “government subsidy”
20 20 AND 21 AND 22 AND 3 [ limited to 2008 onwards]
Fiscal and pricing policies to improve public health
90
Alcohol specific searches
Drink – drinking : incentives for drinking lower strength alcohol 21 “Automobile Driving” OR “Motor Vehicles” OR Automobiles OR “Accidents, Traffic’”
OR car or cars or automobile* or auto-mobile* or auto mobile* or automot* or auto-
mot* or auto mot* or motor* or vehicle* OR driv* OR passenger* OR (traffic* or
road* or street* or highway* or motorway*) and (accident* or safe* or crash* or injur*
or death* or mortal* or fatal*)
22 “Drinking Behavior” OR “Alcoholic Beverages” OR Ethanol OR Alcoholism OR
“Alcoholic Intoxication” OR ethanol* OR alcohol* OR drink* OR intoxicat* OR
inebriat* or inebriet* OR impair* OR drunk*
23 subsid* OR price OR pricing OR discount OR incentive OR rebate OR voucher OR
coupon OR elasticit* OR “government subsidy”
24 24 AND 25 AND 26 AND 3 [ limited to 2008 onwards]
Evidence from outside EU on a more rational approach to alcohol duty 25 duty OR levy OR tariff OR excise OR fiscal OR tax OR taxation OR levy OR “value
added tax” OR “value-added tax” OR VAT
26 alcohol* OR spirits OR beer OR wine OR cider OR drink OR liquor OR Alcohol
Drinking
27 evaluation OR implementation
28 non EU OECD countries from 3
29 28 AND 29 AND 30 AND 31 [ limited to 2008 onwards]
Fiscal and pricing policies to improve public health
91
Appendix C. Summary of external contacts responses
A total of 74 national and international experts from academia, international health
organisations and ministries of health and finance were contacted. Twenty one
responded and 14 provided documentation or signposted to references that might be of
interest, resulting in a total of 98 documents. The majority (63) were general tobacco
taxation documentation, 18 referred to the diet and obesity, 4 were alcohol policy
related and 3 related to the environment, while 10 encompassed more than one policy
area.
Appendix D. Framework user guide
This framework contains an Introduction tab which links to the report for additional
information on the methodology for this framework, as well as a User Guide tab, and 10
tabs which contain the extracted information on all policies combined, and then
separately by policy area.
The format of each of these frameworks is identical and is set up so that each row
represents a policy result, and each column represents a dimension of the policy that
was extracted from the publications and reports. These dimensions or columns are split
into 3 sections (See Appendix A): The first set of columns describe the policy, the
second describe the outcomes of the policy and the final set provide additional
information on the context external to the policy, as well as the references and links to
publications from which the information was extracted.
There are three main ways in which this framework can be queried: The framework in
MS Excel is designed to be searched using the filtering options available for each
column.
One option is to focus on results within a particular policy area and sort on a specific
policy type using the filter option in the Mechanism type field, and selecting one subset
of fiscal and pricing policies (eg Financial incentives). This will narrow the results down
to only financial incentive policies. Further filtering can then be applied, for example, to
the Target risk factor/behaviour/commodity (eg Health screens) to focus on a
specific subset of financial incentives. It is also possible to filter on the Target
Fiscal and pricing policies to improve public health
92
Population/ demographics field, or the Setting (Geographical) to further refine the
subset of financial incentive policies.
Conversely, it is possible to filter firstly on the Target risk
factor/behaviour/commodity and look through the evidence for all types of policies
aimed at a specific commodity (eg all policies targeting F&V (Fruit and Vegetables).
One further option is to apply the same methods but to the All Areas Combined tab to
look through the evidence across policy areas, in the same ways as the example above.
The last two columns provide the reference and links to the full-text articles and sources
of information used for each policy extracted.