Embed Size (px)
Citation preview

©The Pakistan Development Review
51:3 (Autumn 2012) pp. 173–195
Fiscal Decentralisation and Economic Growth:
Role of Democratic Institutions
NASIR IQBAL, MUSLEH UD DIN, and EJAZ GHANI*
This study attempts to analyse the impact of fiscal decentralisation on economic growth.
It also examines the complementarity between fiscal decentralisation and democratic
institutions in promoting growth. The modelling framework is the endogenous growth model
augmented with measures of fiscal decentralisation through democratic institutions. To capture
the multidimensionality, three different measures of fiscal decentralisation are used. The
overall analysis shows that revenue decentralisation promotes economic growth while
expenditure decentralisation retards economic growth. Composite decentralisation positively
influences economic growth implying that simultaneous decentralisation of revenue and
expenditure reinforce each other to promote economic growth. Analysis also shows that
democratic institutions play a significant role in realising the benefits of fiscal decentralisation.
Various policy implications emerge from this study.
JEL Classification: C26, E02, H11, H72, O11
Keywords: Fiscal Decentralisation, Democracy, Economic Growth, Pakistan
1. INTRODUCTION
Over the past three decades, there has been a growing tendency towards fiscal
decentralisation (FD) in emerging and developing economies. FD occurs through
devolution of fiscal responsibilities for public spending and revenue generation or
collection from the central government to the provincial or local governments. FD is an
effective strategy to promote economic growth by increasing the efficiency of the public
sector. FD promotes sound macroeconomic management through: (i) efforts that
streamline public sector activities, (ii) reducing operational and informational costs of
service delivery, and (iii) increasing competition among sub-national governments in
providing public services. This process strengthens government accountability towards its
citizens by involving them in monitoring its performance and demanding corrective
measures. This process also makes governments responsive and accountable, leading to
curbing corruption and improving delivery of public services.
The implicit assumption behind the positive contribution of FD is the existence of
a well-defined institutional mechanism. This increases the accountability and
Nasir Iqbal<[email protected]> is Staff Economist, Pakistan Institute of Development Economics
(PIDE), Islamabad. Musleh ud Din <[email protected]> is Joint Director, Pakistan Institute of
Development Economics (PIDE), Islamabad. Ejaz Ghani <[email protected]> is Dean Faculty of Economics,
Pakistan Institute of Development Economics (PIDE), Islamabad.
Authors’ Note: This paper is heavily drawn from PhD Thesis entitled “Fiscal Decentralisation,
Macroeconomic Stability and Economic Growth”. The authors are grateful for the comments received from the
seminar participants at PIDE.

174 Iqbal, Din, and Ghani
transparency in the political system and hence lowering corruption. That ultimately leads
to efficient allocation of public resources and hence economic growth. The recent
advancement in the field of FD strengthens this assumption and gives a role to
institutions in the theorem of fiscal decentralisation.
The government of Pakistan has taken various steps towards strengthening the
process of FD. The process of revenue sharing started right from the inception of
Pakistan. Since independence, the Niemeyer Award 1947, the Raisman Award 1952, the
One Unit Formula 1961 and 1965 and seven NFC awards based on the 1973 Constitution
for revenue sharing have been announced. Recently, government of Pakistan has
undertaken two major developments by signing the 7th National Finance Commission
(NFC) award (through which a bulk of resources has been transferred to the provinces)
and by passing the 18th Constitutional Amendment (through which a wide range of fiscal
responsibilities have been shifted from the centre to the provinces). These developments
would result in a fundamental shift in the division of powers between the centre and the
provinces. The latter would have more autonomy in performing various functions like the
provision of public goods and services, and macroeconomic management.
Consequently, various questions arise: What would be the effect of implementing
FD in Pakistan? Can Pakistan, with a weak institutional framework, attain its objective of
bringing prosperity to Pakistani people through FD? Can each province with its particular
local receipts generate and expand the economy? Malik, et al. (2007) and Faridi (2011)
investigate the growth effects of FD in Pakistan and find positive contributions of FD.
However, these studies suffer from various shortcomings. Firstly the studies ignore the
possibility of reverse causality and endogeneity among fiscal variables as pointed out in
the literature [see e.g. Zhang and Zou (1998); Xie, et al. (1999); Thiessen (2003); Jin, et
al. (2005); Iimi (2005)]. Secondly, the studies ignore the multidimensional perspectives
of FD [see e.g. Martinez-Vazquez and McNab (2003)]. Thirdly, the studies ignore the
potential role of democratic institutions in making FD process effective and growth
enhancing [see e.g. Iimi (2005); Neyapti (2010)].
This study offers an empirical assessment of the growth effects of fiscal
decentralisation using various measures of decentralisation. Secondly, the role of democratic
institutions in explaining the growth effects of fiscal decentralisation is examined. To the best
of our knowledge, no study to date has investigated the role of democratic institutions in
explaining the growth process of fiscal decentralisation. This study’s modelling framework is
the endogenous growth model augmented with the measures of fiscal decentralisation and
democratic institutions. The possibility of reverse causality and endogeneity among fiscal
measures leads to the use of a GMM approach to estimation.
The rest of this paper is structured as follows: Section 2 summarises the existing
literature concerned with the growth effects of FD; Section 3 provides an overview of the
FD process in Pakistan; the modelling framework and the data and econometric issues are
explained in Section 4 and Section 5 respectively; Section 6 presents the results of this
study and Section 7 the conclusion.
2. LITERATURE REVIEW: THEORETICAL AND EMPIRICAL
Before proceeding with this study, it is important to have a broad idea of the
current developments in the theoretical and empirical literature on FD.

Fiscal Decentralisation and Economic Growth 175
The impact of FD on economic growth is derived from the traditional theory of
fiscal federalism which presents a general normative framework for the assignment of
functions to different levels of governments. Under the traditional theory, the process of
FD may generate greater economic efficiency in the allocation of resources in the public
sector.1 There are various theoretical explanations available in the literature that spell out
how FD generates economic efficiency in public sectors.
First, economic efficiency can be generated through resource mobilisation which
occurs through FD. FD grants greater autonomy and funds to the sub-national
governments. With the availability of more funds and autonomy in decision making
process, sub-national governments are compelled into mobilising the available resources
in their own jurisdictions, rather than waiting for the provision of public goods and
services to come from the central government. This leads to greater emphasis on
economic efficiency across jurisdictions within a country and also to tapping into what
otherwise may have been untapped potential [Rodriguez-Pose and Ezcurra (2010)].
Second, the “Theorem of Decentralisation” provides a well-known mechanism
through which FD may lead to greater economic efficiency. According to this theorem,
the preferences for public goods and services differ across individuals and regions. The
level of welfare achieved by a national government through providing uniform public
goods and services is always inferior to that which can be achieved by providing public
goods and services in a decentralised setup which allows for provision of goods and
services across the different regions [Oates (1972)]. It is because the sub-national
governments are better informed about the preferences of citizens than the national
government. Therefore, sub-national governments always perform better in providing
public goods and services according to the needs of local communities.
Similarly economic efficiency can be enhanced if the citizens are mobile so that
they can locate themselves to the jurisdictions that best match their preferences [Tiebout
(1956)]. Oates (1993) argues that expenditures for social and infrastructure sectors are
likely to be more growth enhancing if carried out by sub-national governments than the
central government which may ignore the differences in preference. The growth
enhancing advantages linked with the FD process are more visible in larger and more
heterogeneous countries. In a small country with homogenous characteristics the
informational advantages of implementing policies and providing different public goods
and services at the regional or local level may be limited. The benefits of FD increase
because internal heterogeneity causes the preferences of individuals to be more diverse.
Hence the benefits of FD can only be realised beyond a certain threshold of country size
[Rodriguez-Pose and Ezcurra (2010)].
Third, the competition among the jurisdictions is seen as an important mechanism
to encourage efficiency in taxation, regulation and supply of goods and services [Tiebout
(1956); Brennan and Buchanan (1980)]. In the Public Choice Approach, FD may lead to
competition among the jurisdictions for mobile factors of productions. This forces
discipline upon public officials who tend to pursue their own interest and seek to
maximise their revenues. Similarly, fiscal competition among different levels of
government leads to a market-preserving federalism which minimises the extent of
government interventions, hence maintaining market efficiency [Weingast (1995)].
1According to Giugale and Webb (2000) efficiency means satisfying the needs and preferences of
taxpayers at the lowest possible cost.
176 Iqbal, Din, and Ghani
The positive impact of FD has been challenged in the previous literature [see for
example Prud’homme (1995); Tanzi (1996)]. The critiques are based on the assumptions
that underlie the decentralisation models and the problems faced by local governments.
The proponents of decentralisation claim that local governments have an informational
advantage over the central government. However, this assumption can be challenged on
the grounds that central governments can and do assign government officials to local
offices. Apparently there is no compelling reason to believe that the information obtained
by these representatives will be less accurate than the ones gathered by the local
governments [Tanzi (1996)]. Similarly, it is also argued that local governments take into
account the needs and preferences of the local population and provide public goods and
services accordingly. Tanzi (1996) criticizes this assumption by saying that the local
populations may not have the power to actually influence the actions of the local
officials. This may result in local goods being produced without taking into account the
needs and preferences of the local population. This is because local democracy is
relatively weak and ineffective especially in developing countries. Prud’homme (1995)
also argues that local preferences are complex and manifold. They cannot be expressed
in a single vote. The outcomes of local elections generally depend on personal and/or
political loyalties and rarely reflect the preferences of the local population.
The opponents of decentralisation argue that there is a lack of capacity to execute
the responsibility for public services at sub-national levels. The sub-national governments
are usually less efficient than the national government and this may undermine the
benefits of decentralisation [Tanzi (1996)]. There are problems like low investment in
technology and innovation because of the limited capacity, both financially and
technically, of the sub-national governments [Prud’homme (1995)]. Due to the
inefficiency of local bureaucracies, local governments often lack good public expenditure
management systems to assist them in their tax and budget choice [Tanzi (1996)].
Another potential problem usually associated with FD is the raiding of the fiscal
commons by the local governments due to the presence of a soft-budget constraint.2 In
the case of a decentralised system, sub-national governments may expect that their fiscal
deficits are covered by the central government. This in turn undermines the incentive for
sub-national governments to behave responsibly in handling finances. The soft budget
constraints have “a multiplicity of sources that are associated with the prevailing fiscal
institutions, with the existing political structure, the weakness or even absence of various
important markets, and more importantly, the historical background of intergovernmental
fiscal affairs in the country” [Rodden, et al. (2003)].
Most of the criticism against decentralisation does not dismiss the idea of
decentralisation per se, but is rather meant to highlight the need for augmenting the
decentralisation process with certain types of institutions. According to the critics, only
when these institutions are present does decentralisation bear the fruits that are promised
by its proponents. The benefits of decentralisation largely depend on institutional
arrangements that govern the design and implementation of decentralisation.
2The idea of soft budget constraint was introduced by Kornai (1979) to analyse the behaviour of state
owned firms. The SBC is used in a decentralisation system to refer to lower level governments that look to a
higher level government to recover or bailout their excessive deficits. The term bailout refers to the additional
funding that the higher level government provides the lower level governments when it would otherwise be
unable to service its obligations. On the other hand, hard budget constraint (HBC) implies that lower level
governments have to face the full costs of their expenditure decisions.

Fiscal Decentralisation and Economic Growth 177
Given the lack of theoretical consensus on the impact of FD, numerous studies
have empirically examined the impact of FD on economic growth.There are numerous
studies that find a positive and significant relationship between FD and economic growth
[Oates (1995); Yilmaz (1999); Thiessen (2003); Iimi (2005)]. However, various other
studies, have found a negative or even no relationship between FD and economic growth
[Oates (1972, 1985); Davoodi and Zou (1998); Woller and Phillips (1998); Martinez-
Vazquez and McNab (2006); Thornton (2007); Baskaran and Feld (2012); Rodriguez-
Pose and Ezcurra (2010)].
There are at least five possible reasons why the studies have failed to come up with
conclusive results on the role of FD. First, the differences in the outcomes of these
studies may be because different studies have employed different measures of FD. The
literature indicates that it is difficult to measure the allocation of authority with precision.
If ambiguous or inappropriate measures of FD are employed, wrong judgments about the
growth effects of FD can be made [Ebel and Yilmaz (2003)]. Akai and Sakata (2002)
argue that studies which find a negative association between FD and economic growth
employ incorrect measures of FD. Second, the differences in the outcome of empirical
studies that are based on a cross-country analysis may be due to the differences in the
economic, cultural, geographical and institutional set-ups. In order to overcome these
difficulties, single-country studies have also been conducted. However, the outcome of
these studies is still inconclusive: some find a positive and significant association [see
e.g. Akai and Sakata (2002); Malik, et al. (2007); Carrion-i-Silvestre, et al. (2008);
Samimi, et al. (2010); Nguygen and Anwar (2011)] while others find a negative or even
no relationship between FD and economic growth [see e.g. Xie, et al. (1999)]. Third,
different countries have different levels of FD, making it difficult to get consistent and
robust estimates based on a cross-country analysis. Fourth, the literature identifies the
possibility of reverse causality and endogeneity among FD and economic growth [see e.g.
Zhang and Zou (1998); Xie, et al. (1999); Lin and Liu (2000); Thiessen (2003); Jin, et al.
(2005)]. Martinez-Vazquez and McNab (2003) argue that reverse causality occurs
because efficiency gains from FD emerge as the economy’s growth or more
decentralisation is demanded at relatively higher level of development. However, existing
literature does not control endogeneity due to small sample sizes or the difficulty in
finding valid instruments with the only exception of Iimi (2005). Last, existing literature
mainly ignores the role of democratic institutions in making the FD process effective
with a few exceptions. For example, Iimi (2005) incorporates the role of political
institutions in analysing the role of FD. That study finds that political institutions and FD
complement each other in promoting economic growth.
There is thus a clear need to re-examine the growth effects of FD, especially at the
country level using appropriate estimation methodology and measures of FD.
3. FISCAL DECENTRALISATION IN PAKISTAN: AN OVERVIEW
The need for FD arose due to the mismatch between expenditure requirements and
the revenue generation capacity. This mismatch necessitates the inter-governmental
transfer among the federation and provinces which is a vital part of the decentralisation
process. The horizontal as well as vertical mismatch between revenue and expenditure
requires legislative arrangement on financial transfers among different levels of

178 Iqbal, Din, and Ghani
government. In both developed and developing countries, the difference between revenue
generation and actual expenditure across national and sub-national governments is
commonly observed. Cross-country data on revenue and expenditure shows that there is a
huge mismatch between the revenue generation capacity of the national government and
the sub-national governments. A similar mismatch is observed between national and sub-
national government from the point of view of expenditures. In the case of Pakistan, there
is a serious imbalance in the sub-national expenditures and revenue generation. The
statistics indicate that the revenue generation capacity of provincial governments is
nearly 13 percent of the total revenue. On the other hand, the expenditure needs of
provincial governments are approximately 28 percent of the total expenditure (Table 1).
Table 1
National vs. Sub-National Revenue and Expenditure Shares:
International Comparison
Country
Revenue Share Expenditure Share
National Sub-National National Sub-National
Australia 69 31 54 46
Brazil 69 31 54 46
Canada 44 56 37 63
India 66 34 45 55
South Korea 95 05 50 50
Pakistan 92 08 72 28
Source: Watt (2005).
These imbalances between expenditure obligations and revenue among federal and
provincial governments leads to a large amount of transfers of financial resources from
the former to the latter level. Such transfers and sharing of resources are embedded
within the constitution and supported by a series of legislative rules and regulations.
Inter-governmental transfers typically include revenue shares, grants, straight transfers,
loans and provincial revenues collected by federal government and transferred to
provinces after deducting collection charges (e.g. royalties on gas and crude oil). There is
a well-defined mechanism for the distribution of resources from the federation to the
provinces in Pakistan. The resources are transferred from the federal to the provincial
level through the National Finance Commission (NFC). NFC is an autonomous body
established under the Constitution of Pakistan for the re-distribution of resources from the
federation to the provinces. The resources are collected by the federal government and
distributed among the provinces according to their needs.
The amount of resources transferred from the central government to the lower
level government is determined on the basis of a certain agreed formula. In Pakistan, the
only criterion for resource distribution has been the population since independence up to
2009. For the first time a new criterion was designed for resource distribution among the
provinces in the 7th NFC award. In this award, four different indicators are used to define
the share of each province in the total share to provinces, including (i) population, (ii)
backwardness/poverty, (iii) revenue generation/collection capacity, and (iv) inverse
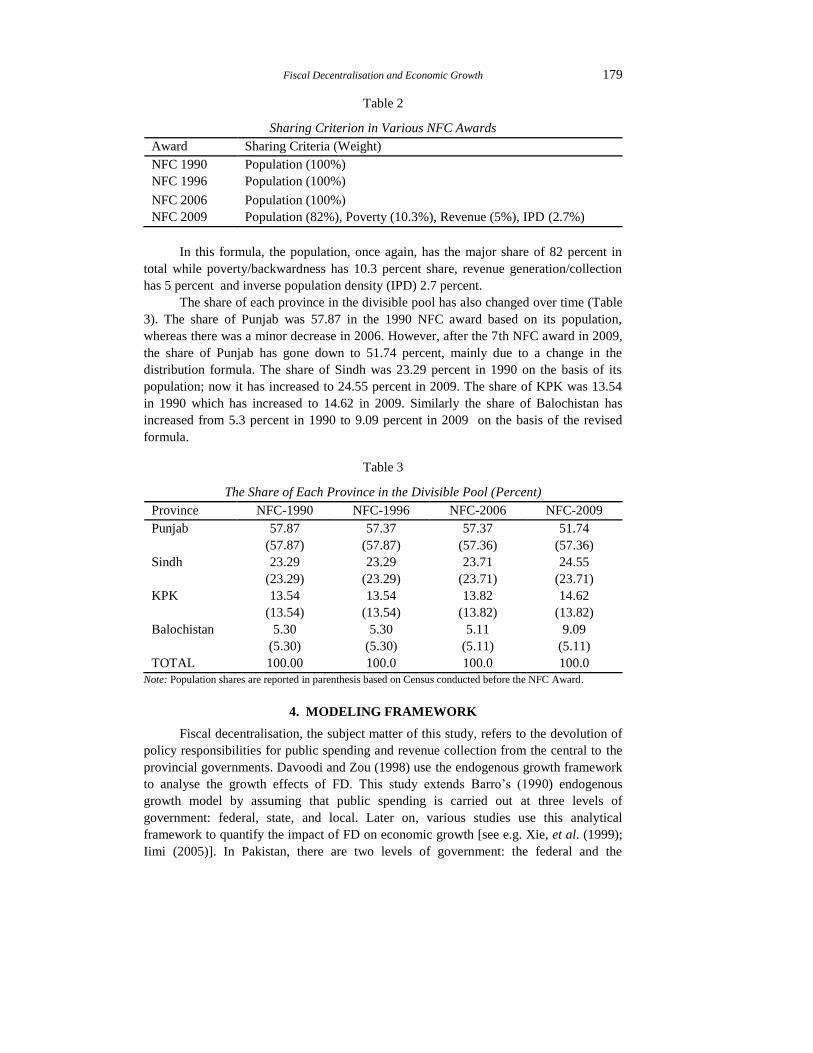
population density (IPD) (Table 2).
Fiscal Decentralisation and Economic Growth 179
Table 2
Sharing Criterion in Various NFC Awards
Award Sharing Criteria (Weight)
NFC 1990 Population (100%)
NFC 1996 Population (100%)
NFC 2006 Population (100%)
NFC 2009 Population (82%), Poverty (10.3%), Revenue (5%), IPD (2.7%)
In this formula, the population, once again, has the major share of 82 percent in
total while poverty/backwardness has 10.3 percent share, revenue generation/collection
has 5 percent and inverse population density (IPD) 2.7 percent.
The share of each province in the divisible pool has also changed over time (Table
3). The share of Punjab was 57.87 in the 1990 NFC award based on its population,
whereas there was a minor decrease in 2006. However, after the 7th NFC award in 2009,
the share of Punjab has gone down to 51.74 percent, mainly due to a change in the
distribution formula. The share of Sindh was 23.29 percent in 1990 on the basis of its
population; now it has increased to 24.55 percent in 2009. The share of KPK was 13.54
in 1990 which has increased to 14.62 in 2009. Similarly the share of Balochistan has
increased from 5.3 percent in 1990 to 9.09 percent in 2009 on the basis of the revised
formula.
Table 3
The Share of Each Province in the Divisible Pool (Percent)
Province NFC-1990 NFC-1996 NFC-2006 NFC-2009
Punjab 57.87
(57.87)
57.37
(57.87)
57.37
(57.36)
51.74
(57.36)
Sindh 23.29
(23.29)
23.29
(23.29)
23.71
(23.71)
24.55
(23.71)
KPK 13.54
(13.54)
13.54
(13.54)
13.82
(13.82)
14.62
(13.82)
Balochistan 5.30
(5.30)
5.30
(5.30)
5.11
(5.11)
9.09
(5.11)
TOTAL 100.00 100.0 100.0 100.0
Note: Population shares are reported in parenthesis based on Census conducted before the NFC Award.
4. MODELING FRAMEWORK
Fiscal decentralisation, the subject matter of this study, refers to the devolution of
policy responsibilities for public spending and revenue collection from the central to the
provincial governments. Davoodi and Zou (1998) use the endogenous growth framework
to analyse the growth effects of FD. This study extends Barro’s (1990) endogenous
growth model by assuming that public spending is carried out at three levels of
government: federal, state, and local. Later on, various studies use this analytical
framework to quantify the impact of FD on economic growth [see e.g. Xie, et al. (1999);
Iimi (2005)]. In Pakistan, there are two levels of government: the federal and the

180 Iqbal, Din, and Ghani
provincial which carry out public spending. Thus total government spending is divided
into two components: federal level and provincial level government spending.
The benefits of FD can only be realised if the process is complemented with good
institutions which enhance the efficiency of the public goods and services by meeting the
preferred needs of the local citizen; by increasing competition among provincial
governments; by reducing corruption and by enhancing accountability The role of
institutions is very crucial in making the theorem of decentralisation applicable. Iimi
(2005) further extends this framework by incorporating the interactive term of FD and
political institutions in the model. Following Iimi (2005), the following model is defined
to capture the link among FD, democratic institutions and economic growth:
GDPgt = 0+ 1,t +2FDt + 3INSt + +4FDt*INSt+
Where GDPg is the per capita output growth rate, is the tax rate, FD is the measure of
fiscal decentralisation, INS represents democratic institutions, X is the vector of control
variables, is the disturbance term that is assumed to be serially uncorrelated and
orthogonal to the explanatory variables and t (=1,2… … … .N). 0, 1,2,3 and 4 are the
scalar parameters while is the vector of parameters to be estimated. The vector X
consists of control variables that have frequently been used in growth literature as
identified by Mankiw, et al. (1992), Levine and Renelt (1992), Barro and Lee (1996) and
Sala-i-Martin (1997).
In this model, the interaction term, FD * INS should be of particular interest since
it allows us to test the hypothesis of FD and democratic institutions being
complementary. Based on this model, we aim to empirically examine the following
hypotheses:
(i) Fiscal decentralisation influences the evolution of per capita output.
(ii) Fiscal decentralisation and democratic institutions are complementary.
5. DATA AND ECONOMETRIC ISSUES
Our empirical analysis is based on time series data covering the period 1972-2010.
Data on fiscal decentralisation variables is collected from the Fifty Year Economy of
Pakistan and various annual reports published by the State Bank of Pakistan. Data on
other economic variables is mainly taken from the Economic Survey of Pakistan (various
issues). Data on human capital is taken from the Barro and Lee Dataset 2011 and data on
democratic institutions is taken from the Polity IV Dataset.
5.1. Fiscal Decentralisation Measures
To empirically examine the role of FD, it is necessary to develop measures of
FD. There are two widely used measures of fiscal decentralisation, namely the revenue
decentralisation and the expenditure decentralisation based on ‘Budget Data’. Revenue
decentralisation (RD) is measured as a ratio of the sub-national government’s revenue
to the total government revenue (national plus sub-national). Expenditure
decentralisation (ED) is measured as a ratio of sub-national government’s expenditures
to the total government expenditures (national plus sub-national). Oates (1972) defines
expenditure centralisation as the share of the central government spending in the total

Fiscal Decentralisation and Economic Growth 181
public spending and revenue centralisation as the share of central government revenue
in the total revenue. Woller and Phillips (1998) re-define fiscal decentralisation
measures after making a few adjustments. First, in measuring revenue decentralisation,
they subtract the grant-in-aid given to sub-national government from the total revenue
and treat it as an expense to avoid double counting. Second, in measuring expenditure
decentralisation, they exclude social security and defence spending from the total
public spending as these are considered to be the main parts of the non-decentralised
government spending.
These standard indicators have been used in a number of studies to quantify the
impact of FD.3 However, the approaches to measure the degree of FD and the reliability
of the data have long been debated in theoretical as well as in empirical literature. The
data for FD measures are obtained from the Government Finance Statistics (GFS) of the
International Monetary Fund (IMF). Ebel and Yilmaz (2003) identify three major issues
with GFS data. First, it is not possible to identify the degree of local expenditure
autonomy because the expenditures are reported at the level of government that receives
the amount. In this way, the local spending that is directed by the central government is
added in the sub-national spending. Second, it is not possible to identify the main source
of revenues of the sub-national government, whether collected through shared taxes, own
taxes or piggybacked taxes. Third, GFS does not distinguish between the different types
of intergovernmental transfers, whether these are conditional or distributed according to
some criteria. Therefore, the GFS data ignores the degree of control of the central
government over the revenues and expenditure of the sub-national governments. These
shortcomings considerably overestimate the degree of FD [Stegarescu (2005)].
According to Martinez-Vazquez and McNab (2003), these measures are defined on
the basis of a single dimension of FD—expenditures going through the sub-national
budgets or revenue generated by the sub-national governments. FD, however, is a
multidimensional phenomenon and it requires multidimensional measures to depict a true
picture of decentralisation. Martinez-Vazquez and Timofeev (2010) develop a composite
indicator of FD that captures the multidimensionality nature of the FD process. The
‘Composite Ratio’, developed by Martinez-Vazquez and Timofeev (2010), essentially
combines the information contained in expenditure and revenue ratios. Taking into
account the existing literature and availability of data, three indicators are constructed to
measure the level of FD for Pakistan.4
Revenue Decentralisation (RD)
The revenue decentralisation (RD) is measured as the ratio of the provincial
government’s revenue to the total government revenue (federal plus provincial)
3See for example [Oates (1995); Zhang and Zou (1998); Xie, et al. (1998); Yilmaz (1999); Lin and Liu
(2000); Thiessen (2003); Akai and Sakata (2002); Eller (2004); Iimi (2005); Feltensteina and Iwata (2005);
Cantarero and Gonzalez (2009); Neyapti (2010)]. 4Due to unavailability of fiscal data at local level, this analysis only focuses at aggregate level using
time series data. This analysis also ignores the other dimension of decentralisation namely administrative and
political dimensions of the decentralisation because of the same reason.

182 Iqbal, Din, and Ghani
Where RD, PR and FR are the ‘Revenue Decentralisation’, ‘Provincial Revenue’ and
‘Federal Revenue’ respectively. Figure 1 shows the trend in revenue decentralisation in
Pakistan. The share of provincial government revenue in total government revenue ranges
from 10 to 25 percent. The share of provincial governments’ revenue was 15 percent in
total government revenue in 1980, thereafter showing an increasing trend to reach 23
percent in 1987. After this period, there is a decreasing trend in revenue decentralisation
whereby provincial revenue share in total government revenue reaches 10 percent in
2010.
Fig. 1.Revenue Decentralisation in Pakistan
Source: Author’s own calculation.
Expenditure Decentralisation (ED)
The expenditure decentralisation (ED) is defined as the ratio of provincial
government expenditures to the total government expenditures (federal plus provincial)
less the defence expenditures and interest payments on debt. These expenditures are
mainly considered to be part of the non-decentralised government expenditures.
Where ED, PE and FE are the ‘Expenditure Decentralisation’, ‘Provincial Expenditure’
and ‘Federal Expenditure’ respectively. While DE and IE are defence expenditure and
interest payments respectively. Figure 2 represents the historical trend in expenditure
decentralisation in Pakistan. The share of provincial government expenditure in total
government expenditure ranges from 30 to 60 percent during the last three decades. After
reaching 50 percent in 1982, the share of provincial government expenditure shows a
declining trend reaching 39 percent in 1989. For the greater part of the 1990s,
expenditure decentralisation shows an increasing trend. However, after 1998 once again,
provincial shares in total expenditure show a decreasing trend, declining from 55 percent
in 1998 to 35 percent in 2010.
FY80 FY80 FY90 FY95 FY00 FY05 FY10

Fiscal Decentralisation and Economic Growth 183
Fig. 2.Expenditure Decentralisation in Pakistan
Source: Author’s own calculation.
Composite Decentralisation (CD)
Composite decentralisation is measured using both revenue decentralisation and
expenditures decentralisation. It is more useful in terms of analysing the impact of FD on
economic growth.
Where CD, RD and ED are the ‘Composite Decentralisation’, ‘Revenue Decentralisation’
and ‘Expenditure Decentralisation’ respectively. Figure 3 shows the composite of
revenue and expenditure decentralisation in Pakistan. This represents the combined
outcome of both processes. The trend shows that the ‘Composite Decentralisation’
measure ranges from 13 to 40 percent.
Fig. 3.Composite Decentralisation in Pakistan
Source: Author’s own calculation.

184 Iqbal, Din, and Ghani
5.2. Other Control Variables
The dependent variable is GDP per capita growth rate. Descriptive statistics
show that the average GDP per capita is 451 US$ at constant 2000 prices. The
average growth rate of GDP per capita is 2.234. Human capital (HC) is measured
using total secondary school enrolment without considering age and gender
composition. The average human capital is 20.02 and it moves from 7.1 in 1972 to
34.6 in 2010. Openness (OPN) is defined as the ratio of total trade (imports plus
exports) as percent of GDP. Trade openness varies from 27 percent to 42 percent
with the average of 34 percent. Tax to GDP ratio is measured as the ratio of the total
consolidated tax receipts of government to GDP. The average tax to GDP ratio is 12
percent with the range of 9 to 15 percent. The contribution of taxes in economic
growth crucially depends upon the structure of the taxes. The impact of taxation on
economic growth is positive if private capital is less productive than public capital
and is negative if additional taxation is very expensive (Iimi, 2005). Inflation is
measured as the growth rate of CPI. The average inflation rate is 9.6 varying from
3.1 percent to 30 percent. The overall budget deficit (BD) fluctuates between 2.3 and
10.2. On average the overall budget deficit is 6.5 in Pakistan. Democracy is used as a
proxy for measuring the quality of institutions in Pakistan. The data on democracy is
taken from the Polity IV dataset published by Marshall and Jaggers (2011). The
democracy index ranges from +10 (full democracy) to -10 (full autocracy). The
descriptive statistics show that the average quality of institution is 0.85 with the
range of -7 to +8 in Pakistan.
Table 4
Descriptive Statistics
Variables Obs. Mean Std. Dev Min Max
Revenue Decentralisation (RD) 39 0.130 0.041 0.071 0.221
Expenditure Decentralisation (ED) 39 0.465 0.067 0.336 0.686
Composite Decentralisation (CD) 39 0.247 0.089 0.129 0.494
Inflation (INF) 39 9.587 5.748 03.10 30.00
Budget Deficit (BD) 39 6.464 1.805 02.30 10.20
GDP per Capita (Constant 2000 US$) 39 451.7 113.3 279.1 668.6
GDP per Capita Growth Rate 39 2.234 2.002 -1.950 6.570
Human Capital (HC) 39 20.02 7.111 10.54 34.60
Openness (OPN) 39 0.338 0.037 0.273 0.432
Tax to GDP Ratio (T/GDP) 39 0.123 0.015 0.095 0.145
Democratic Institution (INS) 39 0.846 6.745 -7.000 8.000
There are several studies that have used the Ordinary Least Squares (OLS)
estimation technique to empirically investigate the impact of FD on economic growth. A
number of studies identify the possibility of reverse causality and endogeneity among FD
and economic growth [see e.g. Zhang and Zou (1998); Xie, et al. (1999); Lin and Liu
(2000); Thiessen (2003); Jin, et al. (2005)]. Martinez-Vazquez and McNab (2003) argue
that reverse causality exists because efficiency gains from FD emerge as economies grow
or more decentralisation is demanded at relatively higher levels of development.
However, the existing literature does not control endogeneity due to small sample sizes or

Fiscal Decentralisation and Economic Growth 185
the difficulty in finding valid instruments with the only exception of Iimi (2005). Under
this situation, OLS estimates become biased and inconsistent. To tackle endogeneity, the
instrumental variables (IV) methods are used in the empirical estimations. The IV
methods are used to solve the problems of simultaneity bias between explanatory
variables, the dependent variable and the error measurement.
The application of the generalised method of moments (GMM) can be considered
as an extension of the IV estimation method. The main advantage of the GMM estimation
method is that the model need not be serially independent and homoscedastic. Another
benefit of the GMM estimation technique is that it generates parameters through
maximising the objective function which includes the moment restrictions in which
correlation between the lagged regressor and the error term is zero. Keeping the
advantages of the GMM estimation technique to overcome endogeneity and omitted
variable bias, the GMM estimation procedure developed by Arellano and Bond (1991),
Arellano and Bover (1995) has been applied to estimate growth and stability equations
using lagged values of the variables as instruments. The STATA v11 has been used for
estimation.
The standard approach to determine the stationarity of the time series data is
checking the existence of unit roots in the given series. The most commonly
employed test for unit root analysis is called Augmented Dickey Fuller (ADF) test
[Dickey and Fuller (1981)]. The results of the ADF test are reported in Table 5. The
test statistics indicate that inflation, budget deficit, GDP per capita growth rate,
openness and M2 to GDP ratio are stationary at level. While revenue
decentralisation, expenditure decentralisation, composite decentralisation,
macroeconomic instability index, human capital, capital stock per worker, tax to
GDP ratio and democratic institutions are non-stationary at level and become
stationary at first difference which implies that these variables are difference
stationary with one order of integration.
Table 5
Unit Root Test (ADF Test)
Variables
Level First Difference
No
Trend
With
Trend
Result No
Trend
With
Trend
Result
Revenue Decentralisation (RD) –2.13 –3.24 NS –4.63 –4.56 S
Expenditure Decentralisation (ED) –1.72 –2.48 NS –7.19 –7.02 S
Composite Decentralisation (CD) –1.69 –3.41 NS –5.49 –5.43 S
Inflation (INF) –4.02 –3.62 S
Budget Deficit (BD) –2.95 –3.77 S
GDP per Capita Growth Rate –5.72 –5.63 S
Human Capital (HC) 1.29 –2.26 NS –4.19 –5.23 S
Openness (OPN) –2.93 –3.56 S
Tax to GDP Ratio (T/GDP) –1.32 –2.02 NS –5.12 –5.71 S
Democratic Institution (INS) –1.97 –1.91 NS –5.71 –5.76 S
Note: 5 percent critical value is –2.87 for the case of no-trend, and –3.42 when a trend is included. AIC is used
for lag selection. S stands for stationary series and NS stands for non-stationary series.

186 Iqbal, Din, and Ghani
6. EMPIRICAL RESULTS
This study has estimated the impact of various dimensions of FD on economic
growth. In Table 6, the impact of revenue decentralisation on economic growth is shown.
Various specifications to test the robustness of results have been used.
Revenue decentralisation has a positive and significant impact on economic
growth in all specifications which are consistent with the theory of decentralisation. This
positive association indicates that the higher the level of decentralisation on revenue side,
the higher the GDP per capita. The transfer of revenue enhancing responsibilities to
provincial governments is conducive for economic growth in Pakistan. As shown in table
6, this result is robust, regardless of the inclusion of other control variables; the estimated
impact of revenue decentralisation on economic growth remains positive and significant.
Table 6
The GMM Estimates: Dependent Variable (GDP per Capita Growth)
Variables (1) (2) (3) (4) (5)
RD 0.0206* 0.0455*** 0.0461*** 0.0487*** 0.0530***
(0.0120) (0.0167) (0.0176) (0.0160) (0.0173)
OPN 0.0414** 0.0705** 0.0625* 0.0245
(0.0204) (0.0327) (0.0337) (0.0317)
T/GDP 0.0475* 0.0592* 0.0675** 0.0808**
(0.0274) (0.0312) (0.0276) (0.0348)
HC 0.0505*** 0.0515*** 0.0381** 0.0426**
(0.0159) (0.0190) (0.0157) (0.0185)
INF –0.00966* –0.00687*
(0.00529) (0.00399)
BD –0.0292*** –0.0337***
(0.00852) (0.00939)
Constant 0.0658** 0.113* 0.112* 0.243*** 0.251***
(0.0263) (0.0642) (0.0640) (0.0690) (0.0698)
Observations 37 37 37 37 37
R-squared 0.247 0.409 0.408 0.532 0.546
Wald Chi2 Test 3.92 10.31 11.67 31.41 36.38
Normality Test 0.97(0.61) 0.70(0.71) 0.71(0.70) 0.77(0.68) 0.88(0.64)
Endogeneity Test 0.0685 0.0885 0.0711 0.0625 0.0305
Over Identification test 0.7070 0.9423 0.9638 0.5625 0.6446
D. W. Test 1.89 2.42 2.43 2.59 2.71
Robust standard errors in parentheses.
*** p<0.01, ** p<0.05, * p<0.1.
The impact of expenditure decentralisation on economic growth is measured using
five different specifications and results are reported in Table 7. Expenditure
decentralisation has a negative and significant impact on economic growth in all
specifications.5 As shown in Table 7, these results are robust, regardless of the inclusion
of other control variables; the estimated impact of ED on economic growth remains
negative and significant. The negative association between ED and economic growth
implies that ED has growth retarding effects in Pakistan. These results are in contrast to
5In terms of the negative association of expenditure decentralisation with economic growth, our
findings are in line with the findings of other empirical studies such as Davoodi and Zou (1998), Zhang and Zou
(2001), Rodriguez-Pose and Kroijer (2009) and Nguygen and Anwar (2011).

Fiscal Decentralisation and Economic Growth 187
the theory of decentralisation. Davoodi and Zou (1998) find similar results for developing
countries. There are several justifications that explain the negative association of
expenditure decentralisation with economic growth in Pakistan.
First, the composition of public spending carried out by provincial governments
may explain the growth retarding effects of ED. The expenditure decentralisation
measure in this dissertation does not indicate the composition of the public spending of
the provincial governments. Provincial governments generally allocate excessive
amounts to current expenditure instead of capital and infrastructure spending. The
literature suggests that the growth effects of capital and infrastructure spending are
positive and that of current spending are negative.
Second, the institutional weaknesses at the provincial level may lead to more
corruption and hence lower economic growth. The third reason may be the lack of
autonomy in decision making by the provincial governments that in turn can lead to
inefficient outcome. The process of FD may not materialise in its true sense because the
decisions by provincial governments may still be influenced by the federal government.
Fourth, the provincial governments may be unable to execute proficient policies and
organise efficient governance due to lack of human as well physical resources. Fifth, the
provincial government may not be able to achieve economies of scale for the reason that
they may be too small to efficiently carry large scale infrastructure development projects.
Finally, the provincial governments often lack the institutional framework that is required
to gain the benefits of FD. The lack of institutional framework can contribute to more
corruption, less accountability and inefficiency in the policy making processes, causing a
slowdown in the growth process. Similar arguments are put forward by Martinez-
Vazquez and McNab (2006) to explain the negative relationship between expenditure
decentralisation and economic growth for developing countries.
Table 7
The GMM Estimates: Dependent Variable (GDP per Capita Growth)
Variables (1) (2) (3) (4) (5)
ED –0.0922** –0.116*** –0.129*** –0.115*** –0.122***
(0.0400) (0.0392) (0.0317) (0.0341) (0.0338)
OPN 0.0385* 0.0274* 0.0251* 0.0238* (0.0215) (0.0162) (0.0135) (0.0127)
T/GDP 0.0371* 0.0387* 0.0497* 0.0498*
(0.0196) (0.0201) (0.0285) (0.0291) HC 0.0241* 0.0183* 0.0266* 0.0279*
(0.0128) (0.0103) (0.0144) (0.0149) INF –0.00980* –0.00598*
(0.00577) (0.00332)
BD –0.0368*** –0.0346*** (0.0118) (0.0130)
Constant –0.0509* 0.0289* 0.0547 0.190*** 0.194***
(0.0300) (0.0171) (0.0581) (0.0552) (0.0555) Observations 37 37 37 37 37
R-squared 0.207 0.421 0.493 0.451 0.537
Wald Chi2 Test 5.32 11.54 27.28 19.73 25.22 Normality Test 0.31(0.85) 0.67(0.72) 0.37(0.70) 0.24(0.88) 0.16(0.92)
Endogeneity Test 0.0395 0.0154 0.0265 0.0495 0.0028
Over Identification test 0.6341 0.6149 0.5225 0.7243 0.7903 D.W Test 2.29 2.52 2.54 2.68 2.65
Robust standard errors in parentheses.
*** p<0.01, ** p<0.05, * p<0.1.
188 Iqbal, Din, and Ghani
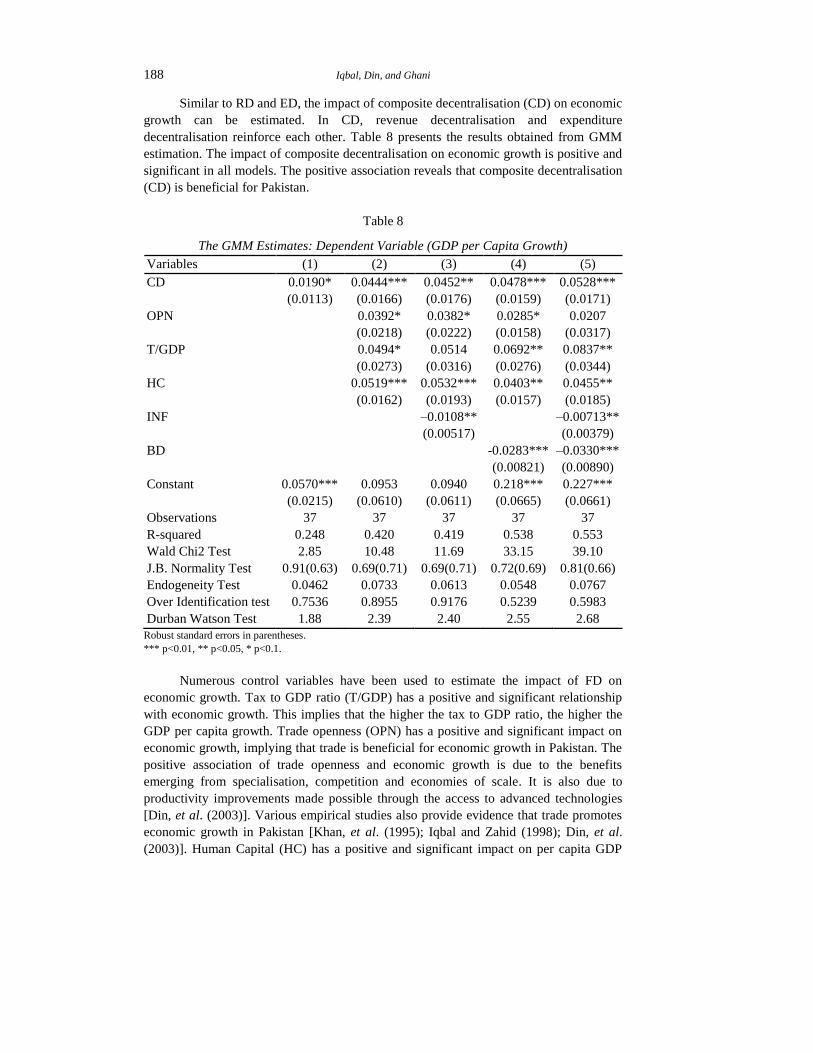
Similar to RD and ED, the impact of composite decentralisation (CD) on economic
growth can be estimated. In CD, revenue decentralisation and expenditure
decentralisation reinforce each other. Table 8 presents the results obtained from GMM
estimation. The impact of composite decentralisation on economic growth is positive and
significant in all models. The positive association reveals that composite decentralisation
(CD) is beneficial for Pakistan.
Table 8
The GMM Estimates: Dependent Variable (GDP per Capita Growth)
Variables (1) (2) (3) (4) (5)
CD 0.0190* 0.0444*** 0.0452** 0.0478*** 0.0528***
(0.0113) (0.0166) (0.0176) (0.0159) (0.0171)
OPN 0.0392* 0.0382* 0.0285* 0.0207
(0.0218) (0.0222) (0.0158) (0.0317)
T/GDP 0.0494* 0.0514 0.0692** 0.0837**
(0.0273) (0.0316) (0.0276) (0.0344)
HC 0.0519*** 0.0532*** 0.0403** 0.0455**
(0.0162) (0.0193) (0.0157) (0.0185)
INF –0.0108** –0.00713**
(0.00517) (0.00379)
BD -0.0283*** –0.0330***
(0.00821) (0.00890)
Constant 0.0570*** 0.0953 0.0940 0.218*** 0.227***
(0.0215) (0.0610) (0.0611) (0.0665) (0.0661)
Observations 37 37 37 37 37
R-squared 0.248 0.420 0.419 0.538 0.553
Wald Chi2 Test 2.85 10.48 11.69 33.15 39.10
J.B. Normality Test 0.91(0.63) 0.69(0.71) 0.69(0.71) 0.72(0.69) 0.81(0.66)
Endogeneity Test 0.0462 0.0733 0.0613 0.0548 0.0767
Over Identification test 0.7536 0.8955 0.9176 0.5239 0.5983
Durban Watson Test 1.88 2.39 2.40 2.55 2.68
Robust standard errors in parentheses.
*** p<0.01, ** p<0.05, * p<0.1.
Numerous control variables have been used to estimate the impact of FD on
economic growth. Tax to GDP ratio (T/GDP) has a positive and significant relationship
with economic growth. This implies that the higher the tax to GDP ratio, the higher the
GDP per capita growth. Trade openness (OPN) has a positive and significant impact on
economic growth, implying that trade is beneficial for economic growth in Pakistan. The
positive association of trade openness and economic growth is due to the benefits
emerging from specialisation, competition and economies of scale. It is also due to
productivity improvements made possible through the access to advanced technologies
[Din, et al. (2003)]. Various empirical studies also provide evidence that trade promotes
economic growth in Pakistan [Khan, et al. (1995); Iqbal and Zahid (1998); Din, et al.
(2003)]. Human Capital (HC) has a positive and significant impact on per capita GDP

Fiscal Decentralisation and Economic Growth 189
growth, implying that Pakistan could increase its per capita growth rate by investing more
in human capital. This finding confirms the traditional view that the countries that invest
more in their human capital do better in terms of economic growth. These results are
broadly in line with the other studies that have found a positive association between
human capital and economic growth in Pakistan [Abbas (2001); Abbas and Foreman-
Peek (2008); Qadri and Waheed (2011)]. Inflation has a negative and significant impact
on economic growth, implying that inflation hurts the growth process. A negative and
significant relationship between budget deficit and economic growth has been found.
6.1. Role of Democratic Institutions
The literature suggests that FD may positively affect economic growth in the
presence of strong democratic institutions. In order to check the role of institutions in FD
process, the interactive term of democratic institutions is added. Neyapti (2004, 2010)
similarly suggests the use of expenditure decentralisation with other institutions, such as
central bank independence, local accountability, and governance quality, to test for the
effectiveness of expenditure decentralisation. In Table 9, democratic institutions and
interactive term of democratic institutions is added with FD.
Table 9
The GMM Estimates: Dependent Variable (GDP per Capita Growth)
(1) (2) (3) (4)
RD 0.00426 0.0271
(0.0117) (0.0194)
ED –0.117*** –0.151***
(0.0305) (0.0387)
INS 0.00117** 0.00150* 0.000813* 0.00162*
(0.000491) (0.000836) (0.000492) (0.000894)
RD*INS 0.0132*** 0.00914**
(0.00330) (0.00412)
ED*INS 0.0449*** 0.0446***
(0.0129) (0.0156)
OPN 0.0463 0.00304
(0.0369) (0.0506)
T/GDP 0.0409* 0.0205
(0.0246) (0.0268)
HC 0.0397** –0.0150
(0.0164) (0.0138)
Constant 0.0450* –0.0546** 0.108* 0.00899
(0.0231) (0.0245) (0.0614) (0.0606)
Observations 37 37 37 37
R-squared 0.250 0.240 0.318 0.224
Wald Chi2 Test 29.18 33.54 51.22 29.00
J.B. Normality Test 1.02(0.60) 0.17(0.91) 0.45(0.80) 0.23(0.89)
Endogeneity Test 0.0376 0.0064 0.0144 0.0012
Over Identification test 0.6695 0.8442 0.6302 0.5745
Durban Watson Test 1.93 2.24 2.36 2.29
Robust standard errors in parentheses.
*** p<0.01, ** p<0.05, * p<0.1.

190 Iqbal, Din, and Ghani
The interactive term of revenue decentralisation and expenditure decentralisation
with democratic institutions has a positive and significant impact on economic growth
implying that FD and democratic institutions are complemented by each other. However,
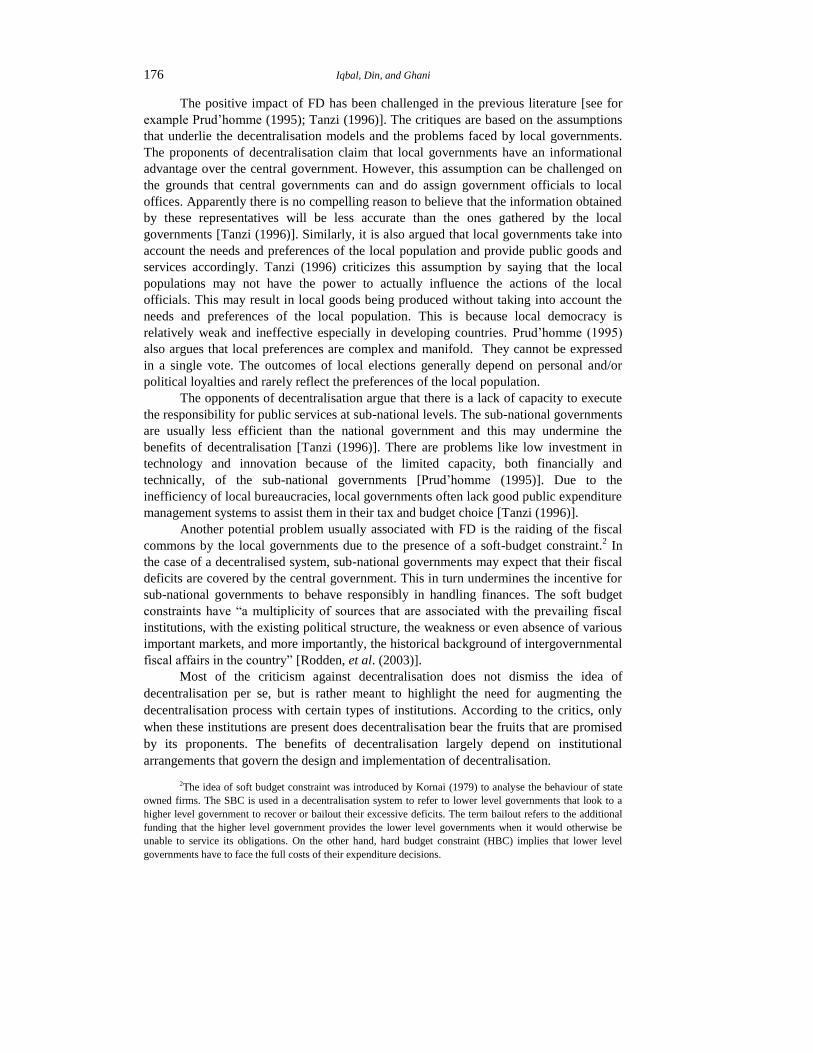
Brambor, et al. (2006) shows that it is incorrect to decide on the inclusion of the
interactive term simply by looking at the significance of the coefficient of the interactive
variable. The marginal effect of FD on economic growth should be observed by
constructing confidence intervals for the estimates of coefficient of ED and interactive
term of ED and institutions over the possible values of the institutions. Similarly for RD,
if the interval lies above the zero line, then the effect is significantly positive and vice
versa. Through this, the range of institutional values for which the effect of RD and ED
can be said to be significant, can be found.
Fig. 4. Determining the Range of Significance of the Marginal Effect of
RD*INS (Dashed lines show the 95 percent confidence band)
Figure 5 shows that with the low quality of institutions, the growth effect of
expenditure decentralisation is negative. However, as the quality of institutions improves,
the expenditure decentralisation exerts a positive impact on economic growth. The
institutional school of thought argues that the quality of institutions increases the
efficiency of the economic factors of production. It reduces the level of corruption and
enhances the accountability of the governments.6
Fig. 5. Determining the Range of Significance of the Marginal Effect of
ED*INS (Dashed lines show the 95 percent confidence band)
6See North (1981) for further elaboration on the role of institutions in economic growth.
.2
.15
.1
.05
0
Mar
gin
al E
ffec
t of
Rev
enue
Dec
entr
alis
atio
n
0 2 4 6 8 10
Institutions

Fiscal Decentralisation and Economic Growth 191
7. CONCLUDING REMARKS AND POLICY IMPLICATIONS
In this study, the growth effects of fiscal decentralisation in Pakistan over the
period 1972-2010 using the GMM estimation procedure have been analysed. The
empirical analysis shows that revenue decentralisation is growth enhancing in Pakistan.
Decentralisation of revenue generation responsibilities generates positive externalities
which increase the per capita income of the country. On the other hand, it is found that
expenditure decentralisation has a negative association with the growth rate of per capita
income. This is mainly due to the low institutional quality which may increase the
corruption level and make public officials less accountable. Lack of human and physical
infrastructure may also lead to inefficient outcome of expenditure decentralisation in
Pakistan. Composite decentralisation also has a positive association with growth mainly
due to the positive effect of revenue decentralisation. This implies that if Pakistan focuses
simultaneously on both types of decentralisation then it will be helpful in enhancing the
per capita income. Only expenditure decentralisation is not helpful in achieving high and
sustainable economic growth. The empirical analysis also reveals that the tax to GDP
ratio has a positive association with economic growth. Trade openness has positive
linkages with the growth rate of per capita income in Pakistan. Human capital also
positively influences economic growth. Analysis reveals that FD becomes effective in the
growth process if it is complemented with good quality institutions. It is observed that the
interaction of expenditure decentralisation and revenue decentralisation with democratic
institutions has a positive impact on economic growth.
Few policy implications emerge from the empirical analysis:
(i) The tax to GDP ratio has a positive association with economic growth. This
finding has important implications for Pakistan. In Pakistan the tax to GDP
ratio is very low as compared to other developed and developing countries.
Due to a low tax base, Pakistan is consistently facing the problem of a high
budget deficit. Increasing the tax to GDP ratio has two advantages: firstly, it
directly contributes to economic growth and, secondly, it mitigates the negative
impact of budget deficit on economic growth through reducing budget deficit.
In Pakistan the main source of tax is the general sales tax on goods and
services (GST) which is non-distortionary in nature. Taking into account the
growth and stability effect of taxation, there is a need to further broaden the tax
base and tax rates. To widen the tax base, all sources of income—including
services, real estate and agriculture—must be brought under the tax net. The
implementation of the Reformed General Sales Tax (RGST) can be an option
for increasing the tax base and tax revenue. Implementation of RGST is
essential to fully tap the revenue generation capacity as well as to help the
documentation process in the economy.
(ii) The process of fiscal decentralisation, especially revenue decentralisation, is
beneficial for the economy of Pakistan. To achieve long term economic
growth, revenue decentralisation should be better streamlined through making
the provinces more reliant on their own resources. The positive association of
revenue decentralisation with economic growth has an important implication
for the design of fiscal decentralisation in Pakistan because the process of
restructuring government (which began with the passage of 7th NFC ward and

192 Iqbal, Din, and Ghani
18th Constitutional Amendment) is in the early stage. This requires a serious
effort both in terms of strengthening the institutions and promoting fiscal
decentralisation to achieve the objective of better economic growth. The
benefits of fiscal decentralisation can only accrue when provincial
governments have a real fiscal autonomy, adequate accountability and
sufficient capacity to respond to the local requirements.
(iii) Expenditure decentralisation can only be effective when the provinces have
sufficient administrative capacity and have been made accountable and
transparent through good institutions. The expenditure decentralisation can
make positive contribution to economic growth if steps are taken to improve
the administrative capacity of the provincial governments. This requires
initiating programmes that provide technical and administrative skills to the
public officials at the provincial level. These programmes are more likely to
enhance the spending management skills of the provincial governments.
(iv) The present initiatives taken by the government in strengthening the provinces
through providing more autonomy and resources have a clear implication for
Pakistan’s long term economic prosperity and macroeconomic stability.
However, the outcome of these reforms crucially depends upon the
institutional framework of the country. Strengthening of democracy is a pre-
requisite for achieving the fruits of fiscal decentralisation.
REFERENCES
Abbas, Q. (2001) Endogenous Growth and Human Capital: A Comparative Study of
Pakistan and Sri Lanka. The Pakistan Development Review 40:4, 987–1007.
Abbas, Q. and J. Foreman-Peck (2008) The Mincer Human Capital Model in Pakistan:
Implications for Education Policy. South Asia Economic Journal 9:2, 435–462.
Akai, N. and M. Sakata (2002) Fiscal Decentralisation Contributes to Economic Growth:
Evidence from State-Level Cross-Section Data for the United States. Journal of
Urban Economics 52, 93–108.
Arellano, M. and O. Bover (1995) Another Look at the Instrumental Variables Estimation
of Error-components Models. The Journal of Econometrics 68:1, 29–51.
Arellano, M. and S. Bond (1991) Some Tests of Specification for Panel Data: Monte
Carlo Evidence and an Application to Employment Equations. Review of Economic
Studies 58:2, 277–297.
Barro, R. J. (1990) Government Spending in a Simple Model of Endogenous Growth.
Journal of Political Economy 98:5, 108–125.
Barro, R. J. and J. W. Lee (1996) International Measures of Schooling Years and
Schooling Quality. American Economic Review 86:2, 218–223.
Baskaran, T. and L. P. Feld (2012) Fiscal Decentralisation and Economic Growth in
OECD Countries; Is there a Relationship? Public Finance Review doi:
10.1177/1091142112463726.
Brambor, T., W. R. Clark, and M. Golder (2006) Understanding Interaction Models:
Improving Empirical Analysis. Political Analysis 14:1, 63–82.
Brennan, G. and J. M. Buchanan (1980) The Power to Tax—Analytical Foundation of a
Fiscal Constitutions. Cambridge: Cambridge University Press.

Fiscal Decentralisation and Economic Growth 193
Cantarero, D. and P. P. Gonzalez (2009) Fiscal Decentralisation and Economic Growth:
Evidence from Spanish Regions. Public Budgeting and Finance 29:4, 24–44.
Carrion-iSilvestre, J. L., M. Espasa, and T. Mora (2008) Fiscal Decentralisation and
Economic Growth in Spain. Public Finance Review 36:2, 194–218.
Davoodi, H. and H. Zou (1998) Fiscal Decentralisation and Economic Growth: A Cross-
country Study. Journal of Urban Economics 43, 224–257.
Dickey, D. A. and W. A. Fuller (1981) Likelihood Ratio Statistics for Autoregressive
Time Series with a Unit Root. Econometrica 49:4, 1057–1072.
Din, M., E. Ghani, and O. Siddique (2003) Openness and Economic Growth in Pakistan.
The Pakistan Development Review 42:4, 795–807.
Ebel. R. D. and S. Yilmaz (2003) On the Measurement and Impact of Fiscal
Decentralisation. In Jorge Martinez-Vazquez and James Alm (eds.) Public Finance in
Developing and Transitional Countries. Cheltenham: Edward Elgar.
Eller, M. (2004) The Determinants of Fiscal Decentralisation and Its Impact on Economic
Growth: Empirical Evidence from a Penal of OECD Countries, Diploma in
Economics, Vienna University of Economics and Business Administration.
Faridi, M. Z. (2011) Contribution of Fiscal Decentralisation to Economic Growth:
Evidence from Pakistan. Pakistan Journal of Social Science 31:1, 1–13.
Feltenstein, A. and S. Iwata (2005) Decentralisation and Macroeconomic Performance in
China: Regional Autonomy has Its Costs. Journal of Development Economics 76:2,
481–501.
Giugale, M. and S. B. Webb (2000) Achievements and Challenges of Fiscal
Decentralisation: Lessons from Mexico. World Bank Publications.
Iimi, A. (2005) Decentralisation and Economic Growth Revisited: An Empirical Note.
Journal of Urban Economics 57:3, 449–461.
Iqbal, Z. and G. M. Zahid (1998) Macroeconomic Determinants of Economic Growth in
Pakistan. The Pakistan Development Review 37:2, 125–148.
Jin, H., Y. Quian, and B. Weingast (2005) Regional Decentralisation and Fiscal
Incentives: Federalism, Chinese Style. Journal of Public Economics 89:9-10, 1719–
1742.
Khan, A. H., A. Malik, and L. Hasan (1995) Exports, Growth and Causality: An
Application of Co-integration and Error-correction Modelling. The Pakistan
Development Review 34:4, 1001–1012.
Kornai, J. (1979) Resource-constrained versus Demand-constrained System. Econometrica
47:4, 801–819.
Levine, R. and D. Renelt (1992) A Sensitivity Analysis of Cross Country Growth
Regressions. American Economic Review 82:4, 942–963.
Lin, J. Y. and Z. Liu (2000) Fiscal Decentralisation and Economic Growth in China.
Economic Development and Cultural Change 49:1, 1–21.
Malik, S., M. Hassan, and S. Hussain (2006) Fiscal Decentralisation and Economic
Growth in Pakistan. The Pakistan Development Review 45:4, 845–854.
Mankiw, G. N., D. Romer, and D. N. Weil (1992) A Contribution to the Empirics of
Economic Growth. Quarterly Journal of Economics 107:2, 407–437.
Marshall, M., T. Gurr, and K. Jaggers (2013) Polity IV: Political Regime Characteristics
and Transactions, 1800–2012. Centre for Systematic Peace, Polity IV.

194 Iqbal, Din, and Ghani
Martinez-Vazquez, J. and A. Timofeev (2010) Decentralisation Measures Revisited.
Public Finance and Management 10:1.
Martinez-Vazquez, J. and R. M. McNab (2003) Fiscal Decentralisation and Economic
Growth. World Development 39, 1597–1661.
Martinez-Vazquez, J. and R. M. McNab (2006) Fiscal Decentralisation, Macrostability
and Growth. Hacienda Publica Espanola/Revista de EconomiaPublica 179:4, 25–49.
Neyapti, B. (2004) Fiscal Decentralisation, Central Bank Independence and Inflation: A
Panel Investigation. Economics Letters 82:2, 227–230.
Neyapti, B. (2006) Revenue Decentralisation and Income Distribution.Economics Letters
92:2, 409–416.
Neyapti, B. (2010) Fiscal Decentralisation and Deficit: International Evidence. European
Journal of Political Economy 26:2, 155–166.
Nguyen, L. P. and S. Anwar (2011) Fiscal Decentralisation and Economic Growth in
Vietnam.Journal of the Asia Pacific Economy 16:1, 3–14.
North, D. C. (1981) Structure and Change in Economic History. New York: Norton and
Co.
Oates, W. E. (1972) Fiscal Federalism. New York: Harcourt Brace Jovanovich.
Oates, W. E. (1985) Searching for Leviathan: An Empirical Study. American Economic
Review 75:4, 748–757.
Oates, W. E. (1993) Fiscal Decentralisation and Economic Development. National Tax
Journal 46:2, 237–243.
Oates, W. E. (1995) Comment on ‘Conflict and Dilemmas of Decentralisation’ by Rudolf
Hommes.In M. Bruni and B. Pleskovic (eds.) Annual World Bank Conference on
Development Economics. 351–353.
Oates, W. E. (2005) Toward a Second-Generation Theory of Fiscal Federalism. Journal
of International Tax and Public Finance 12:4, 349–373.
Prud’homme, R. (1995) On Danger of Decentralisation. World Bank Research Observer
10:2, 201–220.
Qadri, F. S. and A. Waheed (2011) Human Capital and Economic Growth: Time Series
Evidence from Pakistan. Pakistan Business Review 12:4, 815–833.
Rodden, J., G. S. Eskeland, and J. Litvack (2003) Fiscal Decentralisation and the
Challenges of Hard Budget Constraints. Cambridge and London: MIT Press.
Rodriguez-Pose, A. and A. Kroijer (2009) Fiscal Decentralisation and Economic Growth
in Central and Eastern Europe. Growth and Change 40:3, 387–417.
Rodriguez-Pose, A. and R. Ezcurra (2010) Is Fiscal Decentralisation Harmful for
Economic Growth? Evidence from the OECD Countries. Journal of Economic
Geography 11:4, 619–644.
Sala-i-Martin, X. (1997) I Just Ran Two Million Regressions. American Economic
Review 87:2, 178–183.
Samimi, A. J., S. K. P. Lar, G. K. Haddad, and M. Alizadeh (2010) Fiscal
Decentralisation and Economic Growth in Iran, Australian. Journal of Basic and
Applied Sciences 4:11, 5490–5495.
Stegarescu, D. (2005) Public Sector Decentralisation: Measurement Concepts and Recent
International Trends. Fiscal Studies 26:3, 301–333.
Tanzi, V. (1996) Fiscal Federalism and Decentralisation: A Review of Some Efficiency
and Macroeconomic Aspects. In M. Bruno and B. Pleskovic (eds.) (1995) Annual

Fiscal Decentralisation and Economic Growth 195
World Bank Conference on Development Economics. Washington, DC: World Bank.
295–316.
Thiessen, U. (2003) Fiscal Decentralisation and Economic Growth in High Income
OECD Countries. Fiscal Studies 24, 237–274.
Thornton, J. (2007) Fiscal Decentralisation and Economic Growth Reconsidered. Journal
of Urban Economics 61:1, 64–70.
Tiebout, C. M. (1956) A Pure Theory of Local Expenditures. Journal of Political
Economy 64:5, 416–424.
Treisman, D. (2000) Decentralisation and Inflation: Commitment, Collective Action, or
Continuity. American Political Science Review 94:4, 837–857.
Weingast, B. R. (1995) The Economic Role of Political Institutions: Market-preserving
Federalism and Economic Development. Journal of Law, Economics and
Organisations 15:1, 1–31.
Woller, G. M. and K. Phillips (1998) Fiscal Decentralisation and LDC Economic
Growth: An Empirical Investigation. Journal of Development Studies 43, 139–148.
Xie, D., H. Zou, and H. Davoodi (1999) Fiscal Decentralisation and Economic Growth in
the United States. Journal of Urban Economics 45, 228–239.
Yilmaz (1999) The Impact of Fiscal Decentralisation on Macroeconomic Performance,
National Tax Association. Proceedings of the 92nd Annual Conference on Taxation,
US. 251–260.
Zhang, T. and H. Zou (1998) Fiscal Decentralisation, Public Spending and Economic
Growth in China. Journal of Public Economics 67:2, 221–240.