Embed Size (px)
Citation preview
Fiscal 2005
BUDGET IN
BRIEF
James E. McGreevey, Governor
John E. McCormac, CPA State Treasurer
Charlene M. Holzbaur Robert L. Peden Director Deputy Director Gary J. Brune Jacki L. Stevens Associate Director Assistant Director
Office of Management and Budget
February 24, 2004
OVERVIEW Following two of the most challenging years in New Jersey history, Governor James E. McGreevey proposes a $26.3 billion Fiscal 2005 Budget for New Jersey that shows how sacrifices and tough budgetary decisions can pay rewards in the form of more fiscal resources for the priorities of education, children, property tax relief, health and public safety. Since rising to an all-time high of $7.9 billion in fiscal 2001, New Jersey’s top revenue source – the Gross Income Tax – fell in actual collections in both fiscal 2002 and fiscal 2003. That revenue slide ended in fiscal 2004, and all major taxes rebounded to exceed projections for the fiscal year. The reversal signals that the State is once again recording strong, sustained growth from an improving economy. The McGreevey Administration’s Budget for fiscal 2005 balances the dividends from a new and improved fiscal picture with a measured approach to funding priorities and a vigilant watch over spending on the operations of State government. As in the previous two fiscal years, the Budget process was guided first and foremost by a line-by-line, department-by-department scrutiny of operational spending and program priorities. As a result, the budget for the vast majority of operating departments was reduced for the third consecutive fiscal year. Small increases were provided for the Department of Human Services ($92 million, mostly for the Division of Youth and Family Services), the Department of Corrections ($22.8 million), the Department of Health and Senior Services ($9.3 million) and the Department of Military and Veterans Affairs ($2.4 million). Fully 72% of the total State Budget, or $19 billion, is recommended as State Aid or Grants-In-Aid, reflecting the Governor's commitment to assisting school districts and municipalities and in providing direct property tax relief to New Jersey residents. With continued emphasis on belt tightening in spending on the State bureaucracy, and fiscal pressure relief provided by improving revenues, the Administration’s Budget for fiscal 2005 will help build a better New Jersey by providing:
• $445 million in additional aid to school districts, including $190 million in formula and supplemental assistance and $45 million for increased school construction debt service costs;
• $32 million increase in municipal aid programs for local property tax relief;
• Preservation of the direct property tax relief programs, providing NJ SAVER checks averaging $250 and Homestead Rebate checks up to $775; and $25 million in additional funding to restore the benefits not provided in the Fiscal 2004 Budget for approximately 80,000 recipients of Property Tax Reimbursement checks as well as new PTR “Senior Freeze” applicants who did not receive program benefits last year;
• Continued support for Governor McGreevey’s high priority programs such as Cancer Research, Early Childhood Education, Literacy and Homeland Security.
The groundwork for the Fiscal 2005 Budget was laid by difficult decisions and sacrifices over the two previous years on both the revenue and appropriations sides of the budget. When combined with improving revenues from a stronger economy, the McGreevey Administration has built a more stable and reliable base budget on which to fund New Jersey’s priorities. The Administration has invested further in this fiscal stability, by establishing a budget surplus of $400 million for fiscal 2005, up significantly from a surplus of $100 million in its first budget in fiscal 2003.
Fiscal 2004 – Managing the Current Budget Within 13 days of taking office in fiscal 2002, this Administration announced a $2.9 billion shortfall ($2.4 billion in reduced revenues and $500 million in increased spending) and proceeded to close that gap in the remaining five months of the fiscal year. Upon receiving final tax revenues in May, 2002, the shortfall increased by $628 million and additional emergency steps were taken to close that new gap. In fiscal 2003, a shortfall in revenues occurred during the year again due to lower than anticipated tax revenues and emergent actions were taken to handle the reduction. In a break from the past, revenue growth in fiscal 2004 has been stronger than anticipated, triggered both by a
BUDGET HIGHLIGHTS
1
rebounding economy and the Governor’s key economic development initiatives such as aggressive school construction, increased road construction, improved brownfield redevelopment initiatives, reform of business incentive grants, and targeted investments in all parts of the state, including the Meadowlands and Camden. As a result, the Fiscal 2004 Budget will accommodate an estimated $539 million in supplemental appropriations without the need for mid-year spending constraints or hiring freezes which disrupt operational planning and service delivery. This stands in marked contrast to the experience of several other states. As noted in a February report published by the National Conference of State Legislatures, 18 states are projecting current year deficits totaling $2.5 billion. The situation is certainly not as dire as in February of 2003, when 36 states projected current year deficits totaling nearly $26 billion, however it is clearly a positive for New Jersey to be counted among those who have managed to restore fiscal stability in the intervening months. Some of the larger supplemental appropriations projected for fiscal 2004 are summarized below. Of the total of $539 million, $246 million or more than 45% relate to shortfalls in federal funding or uncertainty over federal approvals for certain waivers requested by the State:
• $138 million – State’s Pharmacy Plus Waiver, which involves the Pharmaceutical Assistance for the Aged and Disabled program is likely not to be approved by the federal government;
• $89 million - Supplemental Aid to Abbott school districts mandated by court decisions and based on final awards;
• $51 million – The Nursing Home Provider Tax Assessment may not be approved by the federal government;
• $32 million – Lower than expected federal funding for nursing homes from the Intergovernmental Transfer program and the Medicaid match on federal stimulus aid;
• $25 million – Children’s Behavioral Health Services supplemental due to shortfall in available federal balances;
• $20 million – Snow removal; • $15 million – Child Welfare Reform, which
presumes enactment of a legislative supplemental for the Division of Youth and Family Services to satisfy the settlement of a civil rights class action lawsuit.
Fiscal 2005 Budget Governor McGreevey’s proposed Fiscal 2005 Budget of $26.3 billion represents an increase of $1.7 billion above the adjusted appropriation of $24.5 billion. This increase is composed of three categories:
• $600 million is attributable to the General Fund’s assumption of costs that were “off budget” in fiscal 2004;
• $900 million is due to mandated or
uncontrollable costs such as Medicaid ($122 million), employee benefits and salary increases ($308 million), and post-retirement medical benefits ($153 million) for State, college and local employees, Abbott school aid ($140 million), debt service (unrelated to the Transportation Trust Fund, $57 million) and other mandated costs;
• $200 million (net) in discretionary spending
increases for areas such as Child Welfare Reform ($125 million), school aid to non-Abbott districts ($105 million), and a variety of other programs.
Some of the major spending increases in the proposed budget include:
• $205 million increase in direct aid to all school districts;
• $113 million increase for higher education, including $10 million for a new tuition assistance program for community colleges entitled NJ STARS and a $20 million increase for Tuition Aid Grant (TAG) programs;
• $125 million increase for Child Welfare Reform;
• $85 million increase for New Jersey Transit to avoid any fare increase;
• $25 million increase to fund the Senior Property Tax Freeze, ensuring that 130,000 eligible seniors will receive benefit from this program;
• $24.4 million increase to programs that support the developmentally disabled;
• $21 million increase to provide a 1% COLA to community provider organizations;
• $20 million increase for enhancement to the 911 systems;
• $18 million increase in various health care programs;
• $15 million for the first year of the NJ After 3 program that will provide structured after-
2
school care for 20,000 children in the 2004-2005 school year;
• $15 million for the first year of the Early Launch to Learning Initiative (ELLI) that will provide increased access to high quality preschool for four year-olds in non-Abbott school districts;
• $15 million increase in Charity Care payments to hospitals;
• $11.2 million increase in support of the arts, history and tourism from the hotel/motel revenue dedication;
• $6.6 million increase in community alternatives to prison and drug court programs;
• $5.9 million increase for State Police vehicles and the training of 200 more State troopers;
• $4 million increase in capital funds for State parks;
• $3.3 million increase for operating support and capital funding for veterans’ homes and;
• $2.7 million increase in cancer screening programs.
On the revenue side, the $26.3 billion budget is supported by base revenues totaling $23.7 billion and revenue enhancements of $2.6 billion. The most prominent revenue enhancements are summarized below:
• $1.52 billion from the securitization of motor vehicles surcharges and new revenue from a 45 cent increase in the cigarette tax;
• $275 million from extending the suspension of the Corporation Business Tax – Net Operating Loss (NOL) provision for an additional two-year period, from January, 2004 to December, 2005;
• $199 million package of surcharges on pollution-related sources, including a new Petro-Chemical Environmental Impact Fee that will raise $150 million, as well as an increase in the Spill Compensation Fund ($20 million) and surcharges on the sale of new tires ($12 million), disposal of hazardous waste at New Jersey facilities ($11 million) and on air toxic emissions ($6 million), the latter of which are suspected carcinogens;
• $135 million from a 45 cent increase in the cigarette tax, from the current $2.05 to $2.50 per pack;
• $115 million from a new funding package related to Charity Care. The new proposal includes an assessment on ambulatory medical facilities ($31 million) and adds a new $5 charge on hospital outpatient visits ($34
million). It also raises the existing hospital assessment from .53% of annual revenues to .70% ($50 million); however, funding to hospitals will actually increase due to increases in recommended State funding and matching federal funds;
• $90 million from the pre-payment of four years worth of registration fees on new car purchases, the same as the inspection period for new cars, with leased vehicles paying in accordance with the term of the particular lease;
• $70 million from an increase in the Realty Transfer Tax based on a three-tiered structure tied to the sale price of eligible or deeded sales, including residential and commercial property (no home valued at below $150,000 would be affected);
• $54 million by maintaining the Transitional Energy Facilities Assessment at its current level through fiscal 2005;
• $50 million from a new surcharge on unsafe driving and an increase in the existing surcharge for accumulating at least six points from motor vehicle violations;
• $33 million from a tax on wireless telephone towers to provide enhanced 911 service as well as security and counter-terrorism investments;
• $25 million from a tax enforcement package, including upfront withholding on the sale of real estate by non-residents and on the activities of out-of-state contractors operating in New Jersey;
• $24 million from an assessment of 1% on home sales valued in excess of $1 million, paid by the purchaser.
In addition, $253.5 million in trust fund balances are recommended for transfer to the General Fund. Key initiatives include:
• $110 million from the State Disability Benefits (TDI) Fund;
• $100 million from the Unemployment Insurance Fund to offset the cost of Charity Care and Medicaid;
• $35.5 million from the Workforce Development Fund to provide ongoing job training services to welfare clients;
• $8 million from the Supplemental Workforce Fund for Basic Skills to support remedial courses at the State’s county colleges.
(See Revenue Forecast and Initiatives section for further details on revenue-related items.)
3
Fiscal 2005 Budget Compared to Fiscal 2004 Budget When viewed by category of funding, the recommended Fiscal 2005 Budget is allocated as follows:
• $19 billion (72.3%) is either State Aid ($10.6 billion, 40.2%) or Grants ($8.4 billion, 32.1%);
• Direct State Services (DSS) totals $5.7 billion (21.6%). When adjusted for the increase provided to the Division of Youth and Family Services (DYFS) to improve child protection services, the DSS recommendation for Executive Branch departments (i.e., without Interdepartmental, Judiciary, and the Legislature) declines by approximately $31 million or about 1%;
• State Aid increases by $505 million (5%); • Grants increase by $907 million (12%); • General obligation debt service increases by $3
million. (See the Summary of Major Increases and Decreases in the Financial Summaries section for a full listing of the recommendations in the Fiscal 2005 Budget.) GOVERNOR McGREEVEY’S PRIORITIES
Education
The Preschool Advantage
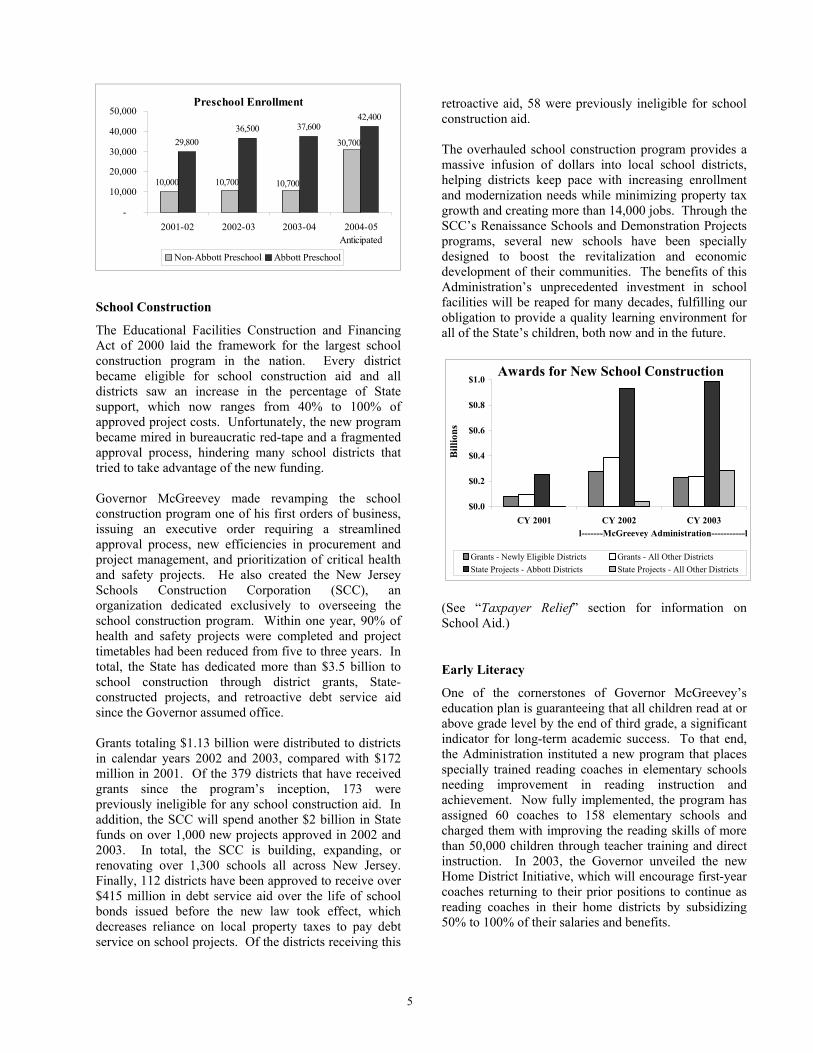
Recognizing the significance of recent research that has established the importance of a quality education during a child’s early years, Governor McGreevey has made a firm commitment to expand and enhance preschool for New Jersey’s children. The National Institute for Early Education Research recently ranked New Jersey first in the nation in preschool quality and funding. The Administration’s approach to early childhood education is comprehensive, involving both the Departments of Education and Human Services. It integrates educational, social, and family programs to promote the academic and social development needed for kindergarten, higher grades, and beyond. The Department of Education expects preschool enrollment in the Abbott districts to grow to over 42,000 for the 2004-2005 school year, an increase of more than
42% since Governor McGreevey assumed office two years ago. If these enrollment levels are achieved, approximately 77% of all 3 and 4 year-olds in the Abbott districts will be enrolled in a high quality preschool program, compared with only 55% two years ago. The Administration has also worked to continuously improve preschool quality while promoting fiscal accountability. Accomplishments include new summer enrichment programs to ensure school year gains are sustained; the development of research-based program guidelines to encourage consistency across providers; and an expanded compliance program that will audit 25% of providers each year and provide new fiscal specialists in each district. In fiscal 2003, Governor McGreevey created a new form of State aid to fund the dramatic increase in preschool enrollment in the Abbott districts. The Fiscal 2005 Budget recommendation includes $182.4 million for Abbott Preschool Expansion Aid, as well as $97.4 million in Department of Human Services funding for programs offered before- and after-school for Abbott preschoolers. The Department of Human Services will be redesigning their program to save an estimated $17.1 million from the fiscal 2004 appropriated level. A second form of State preschool aid—Early Childhood Program Aid—supports an additional 43,454 preschoolers and kindergartners in 132 high poverty districts around the State. The Fiscal 2005 Budget recommends $330.6 million for this program. Governor McGreevey has proposed a new category of early childhood State aid for fiscal 2005. The Early Launch to Learning Initiative (ELLI) will increase access to high quality preschool for four year-olds by approximately 20,000 children in the 2004-2005 school year. The number of participating districts, as well as State funding, will increase until all interested districts are included in future years. The initial State appropriation of $15 million will support low-income children outside Abbott districts and substantially offset the cost of offering preschool to all eligible children in participating districts. In the first year, ELLI will increase the percentage of four year-olds in New Jersey with access to high-quality preschool to over 52% of the total population. The percentage of low-income four year-olds with access to high-quality, State-funded preschool will increase to over 70%.
4
School Construction
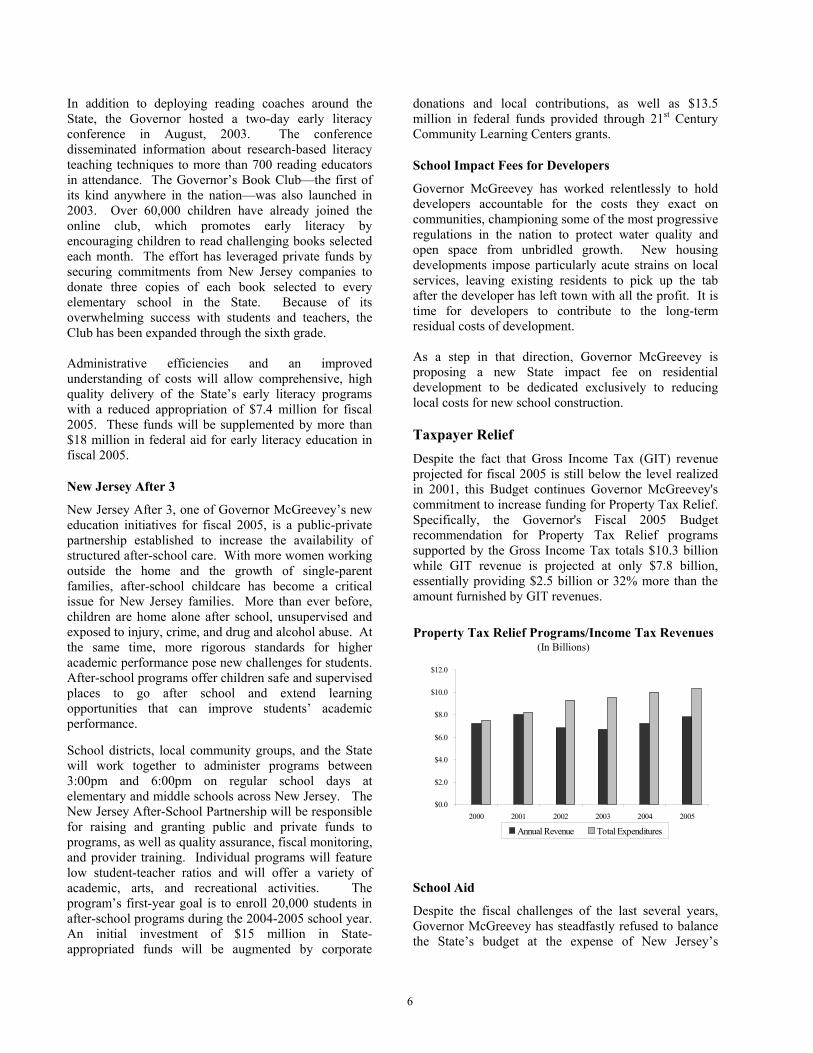
The Educational Facilities Construction and Financing Act of 2000 laid the framework for the largest school construction program in the nation. Every district became eligible for school construction aid and all districts saw an increase in the percentage of State support, which now ranges from 40% to 100% of approved project costs. Unfortunately, the new program became mired in bureaucratic red-tape and a fragmented approval process, hindering many school districts that tried to take advantage of the new funding. Governor McGreevey made revamping the school construction program one of his first orders of business, issuing an executive order requiring a streamlined approval process, new efficiencies in procurement and project management, and prioritization of critical health and safety projects. He also created the New Jersey Schools Construction Corporation (SCC), an organization dedicated exclusively to overseeing the school construction program. Within one year, 90% of health and safety projects were completed and project timetables had been reduced from five to three years. In total, the State has dedicated more than $3.5 billion to school construction through district grants, State-constructed projects, and retroactive debt service aid since the Governor assumed office. Grants totaling $1.13 billion were distributed to districts in calendar years 2002 and 2003, compared with $172 million in 2001. Of the 379 districts that have received grants since the program’s inception, 173 were previously ineligible for any school construction aid. In addition, the SCC will spend another $2 billion in State funds on over 1,000 new projects approved in 2002 and 2003. In total, the SCC is building, expanding, or renovating over 1,300 schools all across New Jersey. Finally, 112 districts have been approved to receive over $415 million in debt service aid over the life of school bonds issued before the new law took effect, which decreases reliance on local property taxes to pay debt service on school projects. Of the districts receiving this
retroactive aid, 58 were previously ineligible for school construction aid. The overhauled school construction program provides a massive infusion of dollars into local school districts, helping districts keep pace with increasing enrollment and modernization needs while minimizing property tax growth and creating more than 14,000 jobs. Through the SCC’s Renaissance Schools and Demonstration Projects programs, several new schools have been specially designed to boost the revitalization and economic development of their communities. The benefits of this Administration’s unprecedented investment in school facilities will be reaped for many decades, fulfilling our obligation to provide a quality learning environment for all of the State’s children, both now and in the future.
Awards for New School Construction
$0.0
$0.2
$0.4
$0.6
$0.8
$1.0
CY 2001 CY 2002 CY 2003l-------McGreevey Administration-----------l
Bill
ions
Grants - Newly Eligible Districts Grants - All Other DistrictsState Projects - Abbott Districts State Projects - All Other Districts
(See “Taxpayer Relief” section for information on School Aid.)
Early Literacy
One of the cornerstones of Governor McGreevey’s education plan is guaranteeing that all children read at or above grade level by the end of third grade, a significant indicator for long-term academic success. To that end, the Administration instituted a new program that places specially trained reading coaches in elementary schools needing improvement in reading instruction and achievement. Now fully implemented, the program has assigned 60 coaches to 158 elementary schools and charged them with improving the reading skills of more than 50,000 children through teacher training and direct instruction. In 2003, the Governor unveiled the new Home District Initiative, which will encourage first-year coaches returning to their prior positions to continue as reading coaches in their home districts by subsidizing 50% to 100% of their salaries and benefits.
Preschool Enrollment
29,80036,500 37,600
42,400
30,700
10,70010,70010,000
-
10,000
20,000
30,000
40,000
50,000
2001-02 2002-03 2003-04 2004-05Anticipated
Non-Abbott Preschool Abbott Preschool
5
In addition to deploying reading coaches around the State, the Governor hosted a two-day early literacy conference in August, 2003. The conference disseminated information about research-based literacy teaching techniques to more than 700 reading educators in attendance. The Governor’s Book Club—the first of its kind anywhere in the nation—was also launched in 2003. Over 60,000 children have already joined the online club, which promotes early literacy by encouraging children to read challenging books selected each month. The effort has leveraged private funds by securing commitments from New Jersey companies to donate three copies of each book selected to every elementary school in the State. Because of its overwhelming success with students and teachers, the Club has been expanded through the sixth grade. Administrative efficiencies and an improved understanding of costs will allow comprehensive, high quality delivery of the State’s early literacy programs with a reduced appropriation of $7.4 million for fiscal 2005. These funds will be supplemented by more than $18 million in federal aid for early literacy education in fiscal 2005.
New Jersey After 3
New Jersey After 3, one of Governor McGreevey’s new education initiatives for fiscal 2005, is a public-private partnership established to increase the availability of structured after-school care. With more women working outside the home and the growth of single-parent families, after-school childcare has become a critical issue for New Jersey families. More than ever before, children are home alone after school, unsupervised and exposed to injury, crime, and drug and alcohol abuse. At the same time, more rigorous standards for higher academic performance pose new challenges for students. After-school programs offer children safe and supervised places to go after school and extend learning opportunities that can improve students’ academic performance.
School districts, local community groups, and the State will work together to administer programs between 3:00pm and 6:00pm on regular school days at elementary and middle schools across New Jersey. The New Jersey After-School Partnership will be responsible for raising and granting public and private funds to programs, as well as quality assurance, fiscal monitoring, and provider training. Individual programs will feature low student-teacher ratios and will offer a variety of academic, arts, and recreational activities. The program’s first-year goal is to enroll 20,000 students in after-school programs during the 2004-2005 school year. An initial investment of $15 million in State-appropriated funds will be augmented by corporate
donations and local contributions, as well as $13.5 million in federal funds provided through 21st Century Community Learning Centers grants.
School Impact Fees for Developers
Governor McGreevey has worked relentlessly to hold developers accountable for the costs they exact on communities, championing some of the most progressive regulations in the nation to protect water quality and open space from unbridled growth. New housing developments impose particularly acute strains on local services, leaving existing residents to pick up the tab after the developer has left town with all the profit. It is time for developers to contribute to the long-term residual costs of development. As a step in that direction, Governor McGreevey is proposing a new State impact fee on residential development to be dedicated exclusively to reducing local costs for new school construction.
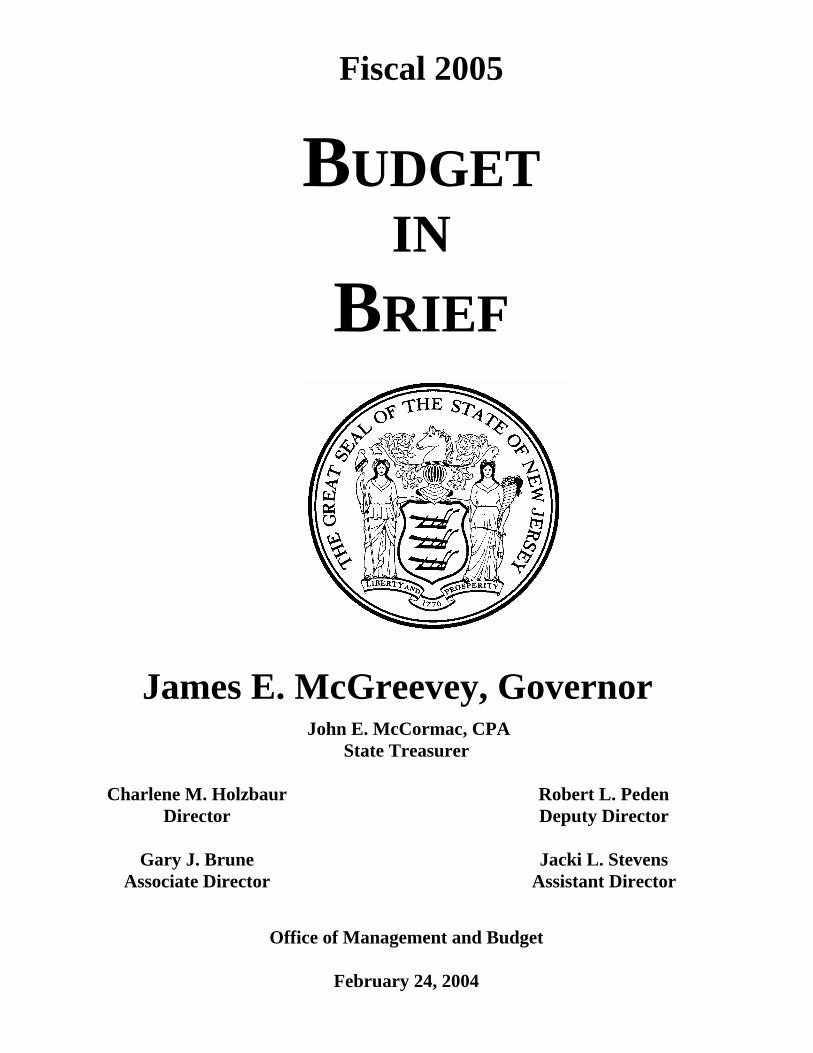
Taxpayer Relief Despite the fact that Gross Income Tax (GIT) revenue projected for fiscal 2005 is still below the level realized in 2001, this Budget continues Governor McGreevey's commitment to increase funding for Property Tax Relief. Specifically, the Governor's Fiscal 2005 Budget recommendation for Property Tax Relief programs supported by the Gross Income Tax totals $10.3 billion while GIT revenue is projected at only $7.8 billion, essentially providing $2.5 billion or 32% more than the amount furnished by GIT revenues.
School Aid
Despite the fiscal challenges of the last several years, Governor McGreevey has steadfastly refused to balance the State’s budget at the expense of New Jersey’s
Property Tax Relief Programs/Income Tax Revenues(In Billions)
$0.0
$2.0
$4.0
$6.0
$8.0
$10.0
$12.0
2000 2001 2002 2003 2004 2005
Annual Revenue Total Expenditures
6
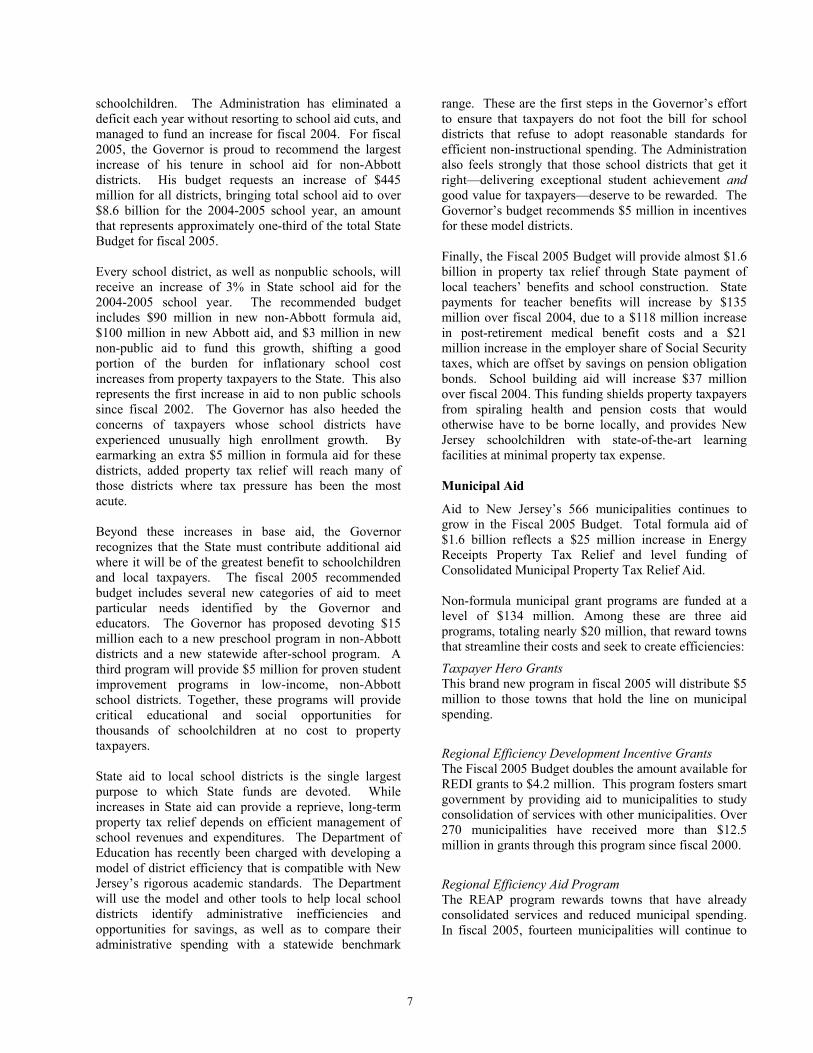
schoolchildren. The Administration has eliminated a deficit each year without resorting to school aid cuts, and managed to fund an increase for fiscal 2004. For fiscal 2005, the Governor is proud to recommend the largest increase of his tenure in school aid for non-Abbott districts. His budget requests an increase of $445 million for all districts, bringing total school aid to over $8.6 billion for the 2004-2005 school year, an amount that represents approximately one-third of the total State Budget for fiscal 2005. Every school district, as well as nonpublic schools, will receive an increase of 3% in State school aid for the 2004-2005 school year. The recommended budget includes $90 million in new non-Abbott formula aid, $100 million in new Abbott aid, and $3 million in new non-public aid to fund this growth, shifting a good portion of the burden for inflationary school cost increases from property taxpayers to the State. This also represents the first increase in aid to non public schools since fiscal 2002. The Governor has also heeded the concerns of taxpayers whose school districts have experienced unusually high enrollment growth. By earmarking an extra $5 million in formula aid for these districts, added property tax relief will reach many of those districts where tax pressure has been the most acute. Beyond these increases in base aid, the Governor recognizes that the State must contribute additional aid where it will be of the greatest benefit to schoolchildren and local taxpayers. The fiscal 2005 recommended budget includes several new categories of aid to meet particular needs identified by the Governor and educators. The Governor has proposed devoting $15 million each to a new preschool program in non-Abbott districts and a new statewide after-school program. A third program will provide $5 million for proven student improvement programs in low-income, non-Abbott school districts. Together, these programs will provide critical educational and social opportunities for thousands of schoolchildren at no cost to property taxpayers. State aid to local school districts is the single largest purpose to which State funds are devoted. While increases in State aid can provide a reprieve, long-term property tax relief depends on efficient management of school revenues and expenditures. The Department of Education has recently been charged with developing a model of district efficiency that is compatible with New Jersey’s rigorous academic standards. The Department will use the model and other tools to help local school districts identify administrative inefficiencies and opportunities for savings, as well as to compare their administrative spending with a statewide benchmark
range. These are the first steps in the Governor’s effort to ensure that taxpayers do not foot the bill for school districts that refuse to adopt reasonable standards for efficient non-instructional spending. The Administration also feels strongly that those school districts that get it right—delivering exceptional student achievement and good value for taxpayers—deserve to be rewarded. The Governor’s budget recommends $5 million in incentives for these model districts. Finally, the Fiscal 2005 Budget will provide almost $1.6 billion in property tax relief through State payment of local teachers’ benefits and school construction. State payments for teacher benefits will increase by $135 million over fiscal 2004, due to a $118 million increase in post-retirement medical benefit costs and a $21 million increase in the employer share of Social Security taxes, which are offset by savings on pension obligation bonds. School building aid will increase $37 million over fiscal 2004. This funding shields property taxpayers from spiraling health and pension costs that would otherwise have to be borne locally, and provides New Jersey schoolchildren with state-of-the-art learning facilities at minimal property tax expense. Municipal Aid
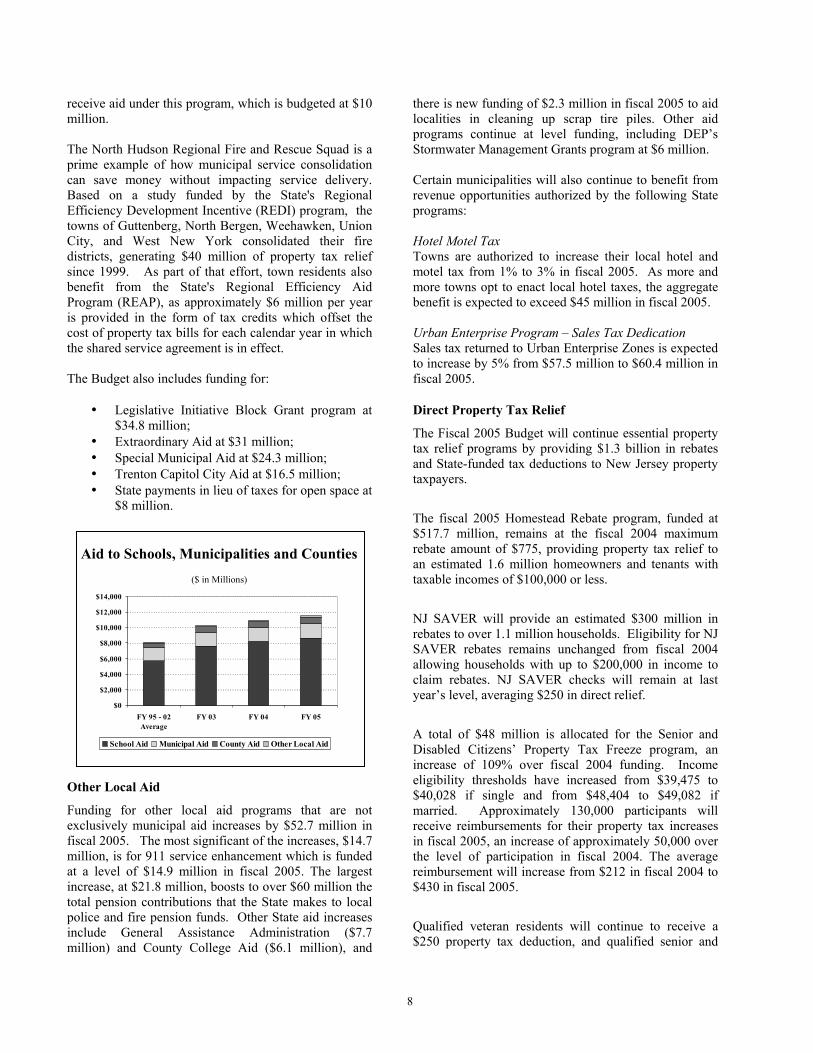
Aid to New Jersey’s 566 municipalities continues to grow in the Fiscal 2005 Budget. Total formula aid of $1.6 billion reflects a $25 million increase in Energy Receipts Property Tax Relief and level funding of Consolidated Municipal Property Tax Relief Aid. Non-formula municipal grant programs are funded at a level of $134 million. Among these are three aid programs, totaling nearly $20 million, that reward towns that streamline their costs and seek to create efficiencies:
Taxpayer Hero Grants This brand new program in fiscal 2005 will distribute $5 million to those towns that hold the line on municipal spending.
Regional Efficiency Development Incentive Grants The Fiscal 2005 Budget doubles the amount available for REDI grants to $4.2 million. This program fosters smart government by providing aid to municipalities to study consolidation of services with other municipalities. Over 270 municipalities have received more than $12.5 million in grants through this program since fiscal 2000.
Regional Efficiency Aid Program The REAP program rewards towns that have already consolidated services and reduced municipal spending. In fiscal 2005, fourteen municipalities will continue to
7
receive aid under this program, which is budgeted at $10 million. The North Hudson Regional Fire and Rescue Squad is a prime example of how municipal service consolidation can save money without impacting service delivery. Based on a study funded by the State's Regional Efficiency Development Incentive (REDI) program, the towns of Guttenberg, North Bergen, Weehawken, Union City, and West New York consolidated their fire districts, generating $40 million of property tax relief since 1999. As part of that effort, town residents also benefit from the State's Regional Efficiency Aid Program (REAP), as approximately $6 million per year is provided in the form of tax credits which offset the cost of property tax bills for each calendar year in which the shared service agreement is in effect. The Budget also includes funding for:
• Legislative Initiative Block Grant program at $34.8 million;
• Extraordinary Aid at $31 million; • Special Municipal Aid at $24.3 million; • Trenton Capitol City Aid at $16.5 million; • State payments in lieu of taxes for open space at
$8 million.
Other Local Aid
Funding for other local aid programs that are not exclusively municipal aid increases by $52.7 million in fiscal 2005. The most significant of the increases, $14.7 million, is for 911 service enhancement which is funded at a level of $14.9 million in fiscal 2005. The largest increase, at $21.8 million, boosts to over $60 million the total pension contributions that the State makes to local police and fire pension funds. Other State aid increases include General Assistance Administration ($7.7 million) and County College Aid ($6.1 million), and
there is new funding of $2.3 million in fiscal 2005 to aid localities in cleaning up scrap tire piles. Other aid programs continue at level funding, including DEP’s Stormwater Management Grants program at $6 million. Certain municipalities will also continue to benefit from revenue opportunities authorized by the following State programs: Hotel Motel Tax Towns are authorized to increase their local hotel and motel tax from 1% to 3% in fiscal 2005. As more and more towns opt to enact local hotel taxes, the aggregate benefit is expected to exceed $45 million in fiscal 2005. Urban Enterprise Program – Sales Tax Dedication Sales tax returned to Urban Enterprise Zones is expected to increase by 5% from $57.5 million to $60.4 million in fiscal 2005.
Direct Property Tax Relief
The Fiscal 2005 Budget will continue essential property tax relief programs by providing $1.3 billion in rebates and State-funded tax deductions to New Jersey property taxpayers.
The fiscal 2005 Homestead Rebate program, funded at $517.7 million, remains at the fiscal 2004 maximum rebate amount of $775, providing property tax relief to an estimated 1.6 million homeowners and tenants with taxable incomes of $100,000 or less.
NJ SAVER will provide an estimated $300 million in rebates to over 1.1 million households. Eligibility for NJ SAVER rebates remains unchanged from fiscal 2004 allowing households with up to $200,000 in income to claim rebates. NJ SAVER checks will remain at last year’s level, averaging $250 in direct relief.
A total of $48 million is allocated for the Senior and Disabled Citizens’ Property Tax Freeze program, an increase of 109% over fiscal 2004 funding. Income eligibility thresholds have increased from $39,475 to $40,028 if single and from $48,404 to $49,082 if married. Approximately 130,000 participants will receive reimbursements for their property tax increases in fiscal 2005, an increase of approximately 50,000 over the level of participation in fiscal 2004. The average reimbursement will increase from $212 in fiscal 2004 to $430 in fiscal 2005.
Qualified veteran residents will continue to receive a $250 property tax deduction, and qualified senior and
Aid to Schools, Municipalities and Counties($ in Millions)
$0
$2,000
$4,000
$6,000
$8,000
$10,000
$12,000
$14,000
FY 95 - 02Average
FY 03 FY 04 FY 05
School Aid Municipal Aid County Aid Other Local Aid
8
disabled residents will continue to receive a $250 property tax deduction. This is a total of $109 million in the State’s reimbursements to municipalities for the estimated 427,000 veterans, seniors and disabled residents expected to apply for this deduction in fiscal 2005.
The property tax deduction will save property tax owners $361 million against their State income tax liability in fiscal 2005, an increase of approximately $20 million or 6%. The New Jersey Earned Income Tax Credit (EITC) program provides families with 20% of their federal EITC benefit. In fiscal 2005, this benefit is estimated at $100 million, of which $18.4 million will be paid from the federal welfare block grant.
Smart Growth and the Environment
Parks Capital
To begin to address the long-standing lack of capital funds required for the State’s park system, an appropriation of $4 million is proposed for fiscal 2005. Some of the high priority projects that may benefit in whole or in part from this funding increase include Rockingham ($2 million - visitor center, restroom, and other renovations), Batsto Mansion ($700,000), Princeton Battlefield Monument Restoration ($200,000), and Atsion Mansion Restoration ($1 million).
Environmental Infrastructure Investments
With key support from Governor McGreevey, the voters approved three important environmental initiatives at the ballot in the fall of 2003, including two new bond issues, that collectively provide a total of nearly $400 million. Each of these measures addresses a key environmental issue for New Jersey.
The Dam, Lake, Stream, Flood Control, Water Resources, and Wastewater Treatment Project Bond Act of 2003 provides a total of $200 million in new project funding, including $95 million to reconstruct private dams, $15 million to repair or refurbish State-owned dams, $25 million for state flood control projects, $15 million for dredging , stream cleaning and de-snagging, and $50 million for water resource projects, improvements to water supply facilities and costs of wastewater treatment system improvements. Project selection will be determined through specific appropriations made by the Legislature.
Voters also approved more than $100 million for open space purchases and community park improvements. The constitutional amendment will increase the bonding capacity of the Garden State Preservation Trust by $150
million, from the $1 billion that voters approved in 1998 to $1.15 billion. The increased capacity will place no additional tax burden on New Jersey taxpayers, however. The sales tax dedicated in 1998 to pay off Garden State Preservation Trust bonds will cover these additional bonds, which will take advantage of today’s lower interest rates.
Finally, voters approved the reallocation of approximately $60 million of funds previously appropriated for private underground storage tank remediation through the existing Corporation Business Tax (CBT) dedication to DEP. Due to slack demand, a significant balance had amassed in the Underground Storage Tank Fund. The $60 million will be used by the Economic Development Authority (EDA) for loans and grants for site remediation or brownfields projects. Prospectively, 50% of the annual CBT allocation to private underground storage tank projects will also be redirected to EDA’s account for this same purpose. Rather than let funds sit idle, they will be put to active use in restoring contaminated property, providing a key economic boost to the towns affected. Corporation Business Tax (CBT) Dedication
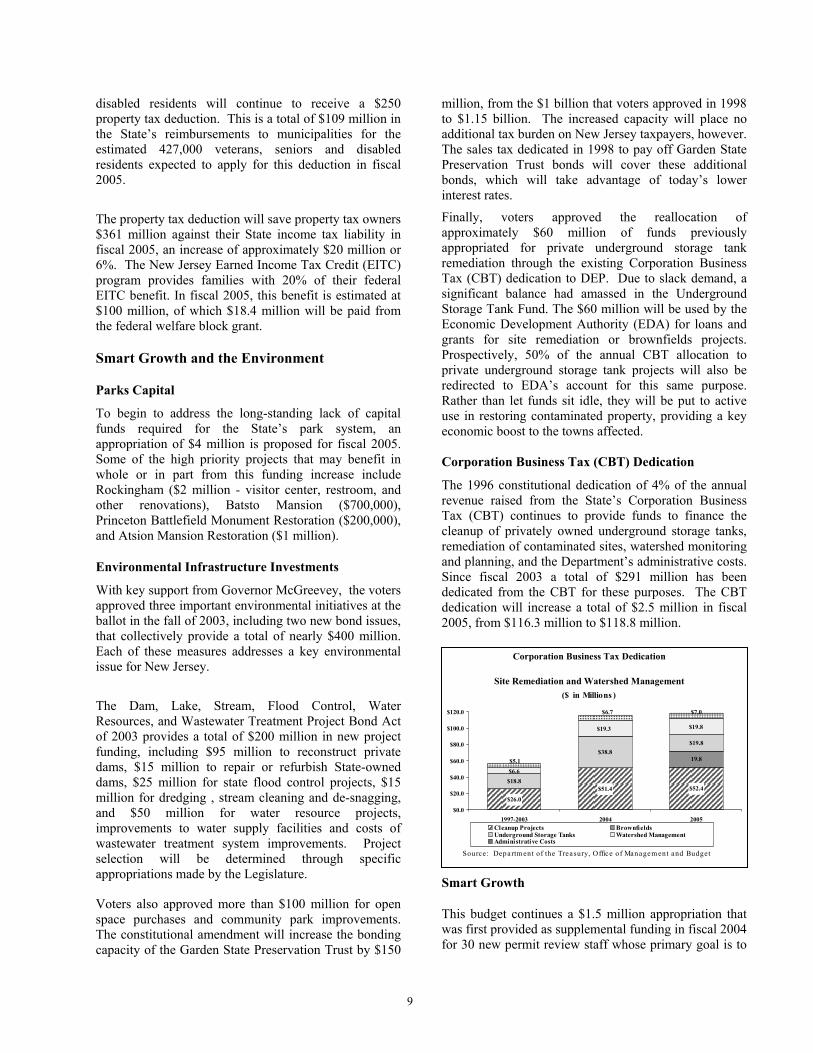
The 1996 constitutional dedication of 4% of the annual revenue raised from the State’s Corporation Business Tax (CBT) continues to provide funds to finance the cleanup of privately owned underground storage tanks, remediation of contaminated sites, watershed monitoring and planning, and the Department’s administrative costs. Since fiscal 2003 a total of $291 million has been dedicated from the CBT for these purposes. The CBT dedication will increase a total of $2.5 million in fiscal 2005, from $116.3 million to $118.8 million.
Smart Growth
This budget continues a $1.5 million appropriation that was first provided as supplemental funding in fiscal 2004 for 30 new permit review staff whose primary goal is to
Corporation Business Tax Dedication
Site Remediation and Watershed Management($ in Millions )
$52.4
19.8
$18.8
$38.8$19.8
$51.4
$26.0
$19.8$19.3
$6.6$5.1
$7.0$6.7
$0.0
$20.0
$40.0
$60.0
$80.0
$100.0
$120.0
1997-2003 2004 2005Cleanup Projects BrownfieldsUnderground Storage Tanks Watershed ManagementAdministrative Costs
Source: Departm ent of the Treasury, Office of Managem ent and Budget
9
protect New Jersey's water, air and other natural resources from unrestrained, haphazard growth. These staff, most of whom are located in DEP’s Land Use Regulation (12), Water Supply (7), and Safe Drinking Water (5) programs, will concentrate on development projects that affect multiple programs, thus ensuring a coordinated review. The Department is also focusing on the cross acceptance aspects of these permits and on expediting projects in areas that have been approved for growth. The State’s Office of Smart Growth, located in the Department of Community Affairs, is funded at a continuation level of $1.5 million in fiscal 2005. Smart Growth Planning grants also remain unchanged at $2.7 million.
Regulatory Initiatives
Governor McGreevey has also exercised bold leadership in the area of environmental regulation, placing New Jersey as a national leader on several issues. DEP recently unveiled several ground-breaking regulatory initiatives, all of which have a significant, beneficial impact on the environment and public health but require little or no additional State funds to implement:
• Announced the most comprehensive set of stormwater control regulations in the country, including the establishment of 300 foot buffers around more than 6,000 miles of our highest-quality waterways both to prevent degradation of drinking water and to ensure the water recharge into underground aquifers. No other state has required 300 foot buffers, which will provide a key tool in the fight against sprawl;
• Effective in 2006, the standard for arsenic in drinking water would be reduced to half the level deemed acceptable by the federal government. No other state has adopted a standard for arsenic, a known carcinogen, as low as the 5 parts per billion measure that New Jersey will use;
• By 2007, mercury emissions from New Jersey’s 10 coal-fired power plants will be reduced by 90%. This initiative will also constrain emissions at iron and steel smelters and waste incinerators throughout New Jersey.
The Governor also signed into law the “Clean Car Act,” adopting the stricter California Clean Car emissions standards on automobiles sold in New Jersey. Since cars are responsible for approximately 40% of the in-state air pollution, this represents a critical first step toward the Governor’s goal of reducing air pollution emissions in New Jersey by 20% over the next 10 years. Adopting
the California standard is expected to reduce air toxins by as much as 20% beyond the federal standard and, when combined with the promotion of cleaner vehicles, to reduce smog by 19% by the year 2020.
Motor Vehicles Commission On January 28, 2003, Governor McGreevey signed “The Motor Vehicle Security and Customer Service Act” creating the New Jersey Motor Vehicle Commission (NJMVC). NJMVC’s accomplishments over the past year have included:
• As a public convenience measure, expanded service to Saturdays;
• Created enhanced business accessibility with online services;
• Increased customer satisfaction by providing intensive customer service training to staff;
• Reduced document processing time by revamping an antiquated mainframe system;
• Improved security by implementing new digitized driver licenses and by installing cameras and locks, upgrading safes, and providing a police presence at each agency.
To implement these initiatives, this Commission was provided dedicated resources of $234 million in fiscal 2004. NJMVC will also have access to $42 million from two new service charges implemented in calendar year 2003: a $6 increase on all license renewals and a $7 increase on vehicle registrations. For fiscal 2005, the Commission will receive an overall sum of $278 million. Health and Welfare Child Welfare Reform
In the most comprehensive, far-reaching vision ever for children’s services, proposed fiscal 2004 supplemental funding and the Fiscal 2005 Budget provides $140 million of new funding to implement an historic rebuilding plan. Entitled “A New Beginning: The Future of Child Welfare in New Jersey,” the plan is offered as part of the June, 2003 court settlement of a class action suit filed on behalf of foster children by Children’s Rights Inc. in 1999. Under a plan submitted by the Department of Human Services to the New Jersey Child Welfare Panel, caseloads of Division of Youth and Family Services (DYFS) workers would be dramatically reduced to among the lowest in the nation. In addition, the monthly reimbursement rate for foster parents would be increased by nearly 25%, investigators trained in forensics will respond to all allegations of abuse or neglect within 24
10
hours, and substantial funding will be provided for the creation of a vast array of local support services for at-risk families. DYFS will be completely re-engineered so that it concentrates only on the safety, well-being and permanency of children who have been abused and neglected. Two separate divisions will be created to focus on children’s mental health services and child abuse prevention. Moreover, the plan calls for an unprecedented level of cooperation and partnership with local communities to lift up struggling families before they become part of the DYFS caseload.
To accomplish the ambitious goals set forth in the plan, the Department of Human Services would add nearly 1,500 new staff at DYFS over two and one half years, including 1,100 in fiscal 2005. Funding is provided to the Department of Law & Public Safety and the Office of Public Defender for more than 220 positions to speed children’s cases to court, protecting their safety while ensuring all parties’ rights. Moreover, the Department would load substantial funding into community-based substance abuse, mental health, domestic violence, housing services, and other programs aimed at protecting New Jersey’s children.
Charity Care
The mix of funding for Charity Care assistance to state hospitals is recommended to change considerably in fiscal 2005, due largely to the fact that revenue from the State’s Unemployment Insurance diversion will decline from $275 million in fiscal 2004 to $50 million in fiscal 2005. To help replace these revenues, it is proposed that a fee on ambulatory medical facilities be assessed to generate $31 million and a new $5 charge on hospital outpatient visits be assessed to raise $34 million. While
hospitals are required by State law to provide charity care services to those in need, medical facilities such as Magnetic Resonance Imaging (MRI) or dialysis centers and ambulatory surgery facilities are not so compelled. The $5 charge per outpatient visit, which would be paid to the State by insurers, will not be assessed on Medicare cases but would generate federal matching funds under Medicaid. These revenues and additional resources from the General Fund and the $135 million increase in cigarette taxes will increase Charity Care payments in fiscal 2005 by $30 million (half State, half federal).
In addition to the funding noted above, hospitals may also take advantage of the existing Bad Debt Collection program, which was authorized in fiscal 2004 as a means of recouping a portion of the estimated $1 billion in patient charges that hospitals bill but do not collect each year. Using the Department of Treasury’s existing Setoff of Individual Liability (SOIL) program, hospital debt records are matched against the Division of Taxation’s files to intercept checks for NJSAVER, Homestead Rebates, or income tax refunds and the proceeds are gainshared on a 50/50 basis. In the interest of increasing participation by the hospitals, program regulations were recently changed to broaden the age of the debt that may be submitted from the original two years to five years from date of service. Cancer Research
This Administration has allocated more funding for the development of innovative cancer research, treatment, and public education than any in New Jersey history. From fiscal 2003 through 2005, a total of over $105 million in State funds was appropriated as Governor McGreevey made this a top priority despite a difficult budget environment. Nearly 70% of these funds ($71 million) were provided to the Cancer Institute of New Jersey (CINJ), including $56 million over the three-year period for operating costs and $15 million in capital for facility expansion. CINJ received the prestigious designation as a Comprehensive Cancer Center, the highest recognition afforded by the National Cancer Institute (NCI), and thus is one of only 39 such centers in the nation and the only one in New Jersey. In addition, a website has been developed entitled NJ Cancer Trials Connect (www.njctc.org) to provide current information about clinical trials, thereby greatly increasing patients’ access to the leading edge in cancer research and treatment. In October, 2003, this effort was expanded into South Jersey as the Cancer Institute of New Jersey at Cooper Hospital in Camden was established. That center is supported by a $5 million appropriation that continues in fiscal 2005. As a result, South Jersey residents no longer
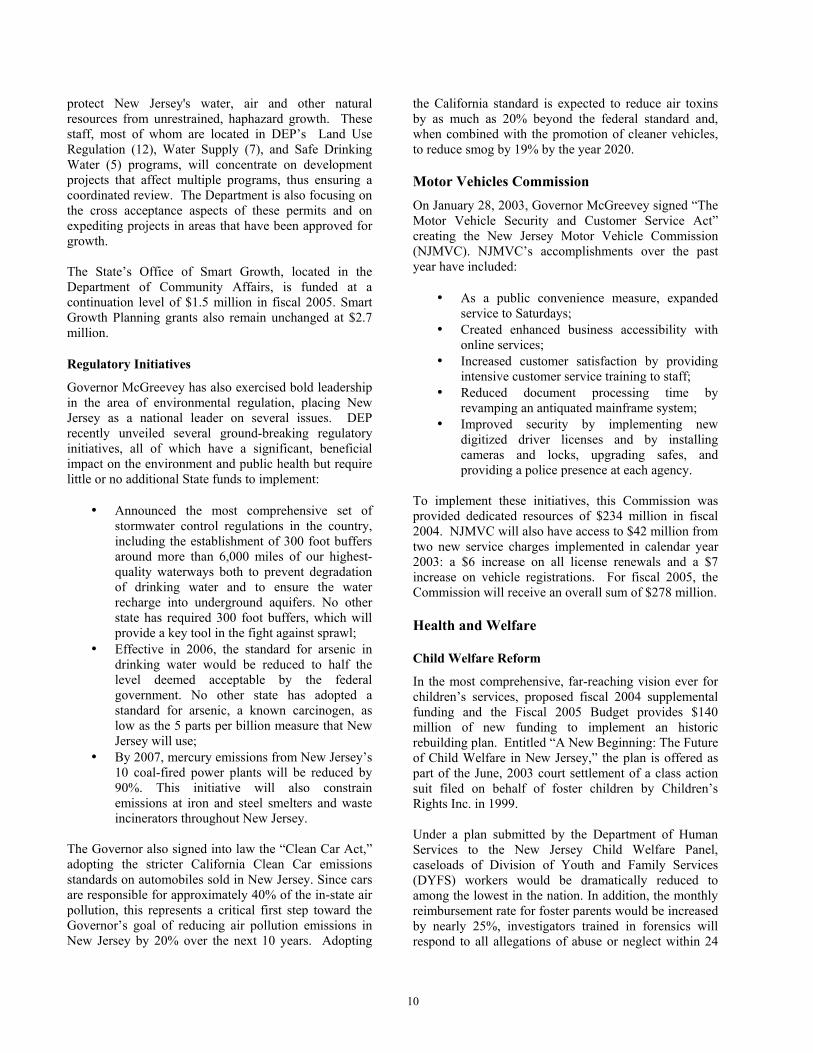
Protecting Children: Total Expenditures Fiscal 1996 - 2005
($ in thousands)
$435,867 $406,011$466,607
$1,058,177
$798,554
$681,426
$565,596$478,829
$420,347
$553,972
$-
$200,000
$400,000
$600,000
$800,000
$1,000,000
$1,200,000
1996 1997 1998 1999 2000 2001 2002 2003 2004 2005
Expenditures data includes all funds for the Division for Youth and Family Services; Partnership for Children; Office of the Child Advocate; Division of Law, Office of Child Welfare; and Office of Public Defender, LawGuardian Kinship Care.
11
have to travel to Philadelphia for quality cancer services and treatment. In addition, the New Jersey Cancer Education and Early Detection Program (NJCEED) is a statewide effort whose goal is to increase the awareness of each person’s risk for breast, cervical, prostate and/or colorectal cancer and encourage them to use screening services for early detection. During fiscal 2004, NJCEED received $2.7 million in State funding and the program is recommended to double in size in fiscal 2005 to $5.4 million. Despite its initial success, many of the women who are eligible for the program remain unscreened. Specifically, only 14% of the eligible women with low incomes and 11% of those lacking insurance were screened between 1996 and 2004. The fiscal 2005 funding increase will provide cancer screening to 20,000 women as well as additional diagnostic procedures for women that are suspected of having breast or cervical cancer.
Prescription Drugs – PAAD/Senior Gold
The federal government enacted Medicare legislation on December 8, 2003. Medicare will offer a discount card which provides a $600 subsidy for low income seniors. This initiative will offset approximately $90 million of the cost of the State’s Pharmaceutical Assistance to the Aged and Disabled (PAAD) program. The Fiscal 2005 Budget does not propose any changes in benefits or eligibility for the 220,000 seniors who receive PAAD/Senior Gold prescription drug coverage. Long Term Care Caregivers
A new program entitled New Jersey Caring for Caregivers is recommended to receive $2 million in funding in fiscal 2005, providing new services to the people who make it possible for aging seniors to live in their own homes. It is estimated that approximately 800,000 adults provide some type of caregiving service to elderly or disabled adults. The need for such care is expected to increase significantly in the future due to the gradual increase in our elderly population, particularly the age 85+ cohort which is expected to rise by over 50% by the year 2010. Given the shortage of home care workers, there is a pressing need to help caregivers balance their caregiving responsibilities with employment and normal, daily chores. This type of care is constant and, at times, overwhelming. By restoring a degree of flexibility and control over their lives, caregivers will be better equipped to cope with the physical and emotional distress of their responsibilities.
This proposal will allocate $1.6 million to fund 14 county offices around New Jersey. These offices will provide services in caregivers’ homes, including mental health counseling, volunteer support assistance, and stipends to purchase help with daily tasks such as shopping. In the first year, an estimated 1,000 caregivers will be served. Another $400,000 will support 70 caregiving families in a consumer-directed pilot program in seven counties (i.e., $55,000 per county office). This particular program will provide respite services or special equipment based on the specific needs of the caregiver.
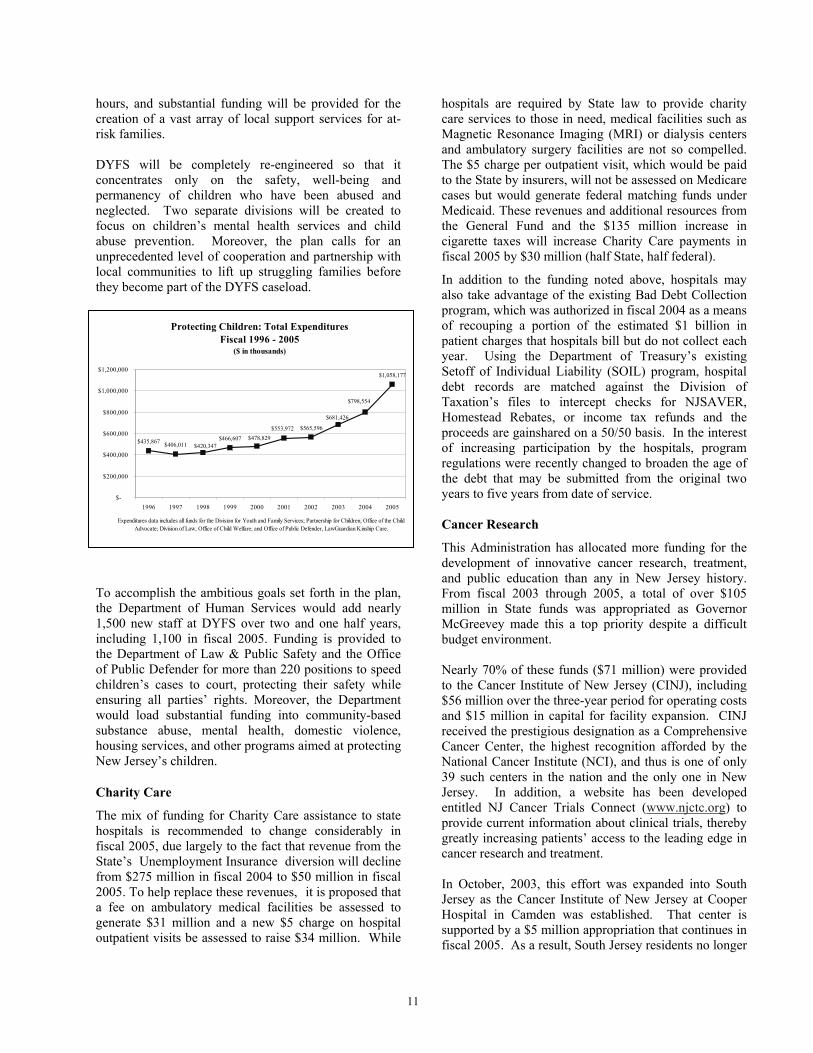
Assisted Living
The Budget supports an additional 750 slots for the Assisted Living program, which provides a cost effective, community-based alternative to nursing home care for the Medicaid population. The program combines housing, personalized support, and health care services to those who need help with the daily activities but do not require nursing home care. As a result, a savings of $9.3 million is anticipated in nursing home costs. As noted in the chart below, Governor McGreevey has more than doubled the number of Assisted Living slots, increasing program capacity by 1,700 or 113% from 1,500 in fiscal 2002 to a projected 3,200 in fiscal 2005.
Global Budget
This year's Budget for senior services has been designed to provide enhanced flexibility to allow people residing in nursing homes to be supported in less costly, more appropriate home and community-based services - or avoid institutional placement altogether. The intent of this initiative is to move the Department of Health and Senior Services towards a "global budget" for long-term care services.
Assisted Living
1,5001,875
2,450
3,200
0500
1,0001,5002,0002,5003,0003,5004,000
2002 2003 2004 2005Fiscal Year
Ava
ilabl
e Sl
ots
12
Nursing Homes and Alternatives
The Budget includes a number of changes that would affect Medicaid reimbursements for nursing homes:
• Nursing home rates will not be re-based in
fiscal 2005 or adjusted for inflation. Estimated savings are $31.5 million;
• Reduce the funding recognized by the Medicaid nursing home rates to cover nursing costs. This was previously paid out of federal Intergovernmental Transfer (IGT) funds which have been greatly reduced since fiscal 2003. Estimated savings are $10 million;
• Reduce the reimbursement for nursing home holding beds for residents who leave temporarily from 90% to 50% of the facility rate. Estimated savings are $5.2 million;
• Additional staff has been added to handle nursing home rate setting and recovery of overpayments in a more timely manner, generating a savings of $500,000;
• Enrollment enforcement savings will be achieved by performing prior authorization in the Medical Day Care program. This will ensure that only clients who have a medical necessity receive the services offered. Estimated savings are $10.9 million;
• A rate freeze in the Medical Day Care program will be implemented, keeping rates at the fiscal 2004 level. Estimated savings are $1.8 million.
If the federal government approves New Jersey's pending initiative for a Nursing Home Provider Tax Assessment, the savings actions noted above for not re-basing nursing home rates in fiscal 2005 ($31.5 million), reducing funds recognized by Medicaid for nursing home costs ($10 million), and lowering the reimbursement for nursing home holding beds ($5.2 million) will be reversed.
Cardiovascular Care
Cardiovascular disease (primarily heart disease and stroke) is the leading cause of death in New Jersey and throughout the United States. In addition, in New Jersey and across the country, significant disparities in cardiovascular health and health care exist. The Budget includes a new appropriation of $2 million for a Cardiovascular program in the Department of Health and Senior Services. Funding will be used to promote awareness of the risks and manifestations of heart disease, its prevention, effective diagnostic and therapeutic interventions, and available resources within the State. In addition, the Department will develop and
implement initiatives to reduce the risk of heart attack, stroke, and cardiovascular mortality for the residents of New Jersey, and will target communities at highest risk. Medicaid/Family Care – Preserving Services Funded through the Division of Medical Assistance and Health Services (DMAHS), the Medicaid/NJ FamilyCare programs pay for medical goods and services to New Jersey residents determined eligible for financial assistance. The State’s portion of the Human Services’ Medicaid/NJ FamilyCare programs is projected to increase 7.7% from $2 billion to $2.15 billion in fiscal 2005. Natural enrollment growth and inflationary pressures are the primary factors driving this budgetary growth. The number of individuals who are eligible for services is projected to rise by approximately 15,000 from the current 935,000 to more than 950,000, an increase of 1.7%.
Operational Efficiencies
Because of the scale of the Medicaid programs, it is imperative that costs be controlled in order to preserve the basic level of services during times of fiscal constraint. The Fiscal 2005 Budget includes new initiatives whose primary objective is to identify cost savings through efficiencies in operations and program effectiveness.
The following cost-control strategies are projected to generate savings of $20.5 million in 2005:
• Save $5.5 million by increasing data mining projects, which are technology-based solutions used to research data and provide ideas for efficiency and effectiveness. One example would be to review the beneficiary eligibility file by using a data model process to identify beneficiaries who may not be eligible;
• Save $5 million by identifying Medicaid managed care beneficiaries who are found to have duplicate coverage under commercial or Medicare managed care plans and disenroll them from Medicaid. The alternative health care plan would become the primary payer and wrap-around services will be extended to disenrolled beneficiaries to maintain the Medicaid level-of-care;
• Save $5 million by improving the administrative coordination of health benefits (i.e., medical costs), and increasing third-party recoveries from other insurance companies, such as Medicare and commercial plans;
• Save $2.5 million by improving the point-of-sale coordination of pharmacy benefits (i.e.,
13
prescription drugs) with third party insurance companies, such as Medicare and commercial plans;
• Save $2.5 million by adopting the edits used by retail pharmacists (e.g., no early refills, concurrent duplicate medications, incompatible polypharmacy medications) into the long-term care drug system, including nursing homes.
Optional Services
Under federal regulations, states are given flexibility in providing certain optional services. During the past few years, some states have experienced budget shortfalls as a result of declining revenues due to the poor economy. Faced with limited fiscal resources, nearly half of the states have been compelled to eliminate or limit the provision of these optional services.
In 2005, New Jersey will continue to provide one of the richest benefit packages in the nation to more than 950,000 of its most vulnerable citizens.
The Governor’s Budget maintains the same level of optional services as had been provided to beneficiaries in fiscal 2004, such as dental services, optometry, optical appliances, podiatrists, chiropractic, psychiatrist services, hearing aids, prosthetics, orthotics, durable medical equipment, medical supplies, residential treatment centers, intermediate care facilities, non-federally qualified health centers (FQHC) clinic services, personal care services, medical day care, and hospice.
Prescription Drugs
New Jersey provides and finances generic and brand-name prescription drug benefits for most of its Medicaid/NJ Family Care program enrollees. Many of the Medicaid/NJ FamilyCare beneficiaries take multiple prescriptions for several conditions. The State does not require a drug formulary, nor does it legislate the price structure for these drugs, although it has taken steps to make full use of less-expensive generic drugs, thus encouraging physicians to prescribe lower-cost versions whenever medically possible.
Faced with increased utilization and rising drug costs, the Medicaid/NJ FamilyCare programs have been challenged to identify ways to curb growing expenditures. Medicaid alone projects to spend more than $1 billion for fee-for-service retail and long-term care prescription drugs in fiscal 2005, not including prescriptions provided through the managed care initiative or NJ FamilyCare.
In an effort to better control drug utilization and help offset cost increases, adult beneficiaries will begin to share the costs for their prescriptions in fiscal 2005 to save $8.1 million. Pregnant women and children will not be subject to the nominal $2 co-payments to be collected from adult beneficiaries at the retail point-of-sale. Each person’s financial responsibility will be capped at $10 per month.
Finally, $10 million in cost savings from operational efficiencies are projected.
Managed Care
In addition to the traditional fee-for-service health insurance program, in which healthcare providers bill the program directly, New Jersey also extends managed care to some beneficiaries. Health Maintenance Organizations (HMOs) manage the healthcare for these beneficiaries and offer special services in addition to a wide array of benefits to which beneficiaries are entitled. As of January 1, 2004, 640,000 beneficiaries were enrolled in managed care, which is 78% of the Medicaid/NJ FamilyCare population who are eligible for such enrollment. The remaining recipients are covered by traditional fee-for-service providers.
The Fiscal 2005 Budget provides $525 million for the Managed Care Initiative, including an increase in premium rates of $36 million to maintain the managed care network of services – ensuring that these beneficiaries continue to receive the best healthcare possible.
KidCare, FamilyCare, and General Assistance
New Jersey’s KidCare program is a federal and State-funded children’s health insurance program created in 1998 to help uninsured children have affordable health coverage. The program covers children in New Jersey up to 350% of poverty – $65,975 annually for a family of four. Currently, nearly 98,000 children (January 1, 2004 enrollment) are enrolled in NJ KidCare.
The Fiscal 2005 Budget provides $49.8 million in State government funds for the NJ KidCare program. The federal government is projected to also provide $92.6 million in State Children’s Health Insurance program (SCHIP) funding.
New Jersey’s FamilyCare program was enacted on July 13, 2000. Current highlights of the program include:
14
• Within the $121 million NJ FamilyCare recommendation, a $2.6 million increase will cover rate increases and caseload changes;
• The enrollment of single adults and couples without children into the NJ FamilyCare program was frozen in September 2001; and in June 2002, adult parent enrollment was stopped as well. Additionally, limitations have been placed on the benefits these adults receive through this program;
• Current enrollment of NJ FamilyCare adult parents with family incomes up to 200% of the federal poverty level ($37,700 annually for a family of four) is 89,240 (January 1, 2004 enrollment). The program will also provide State-only funds to maintain coverage for 10,661 adults (January 1, 2004 enrollment).
The General Assistance medical program is recommended to increase $10.4 million to support healthcare services for this population.
Children’s Behavioral Health Services
In addition to programs for medical goods and services, the DMAHS assists in the administration of the Children’s Behavioral Health Services program, previously named the Partnership for Children, and originally begun under an initiative for a Children’s System of Care for behavioral health.
Entering its fifth year of operation, the Children's Behavioral Health Services program offers behavioral rehabilitative services targeted to children up to 18 years of age, as well as youth 18-21 years of age who are transitioning to the adult system.
In fiscal 2005, $171 million is recommended to support services that are community-based, child-centered, and family-focused, representing a $37 million increase over fiscal 2004. This initiative has been highly successful in leveraging federal funds in order to fuel its continued growth.
Developmentally Disabled-Community Programs
As part of the Division of Developmental Disabilities’ (DDD) ongoing Community Service Waiting List initiative, funding will be available to place 200 people from the existing Community Services Waiting List and Community Transition in fiscal 2005. One hundred people will be placed in group homes, 24 in supervised
apartments and 76 in existing vacancies. The total cost for development of 50 homes, new placements and full year funding for costs deferred from fiscal 2004 is $13.1 million. Real Life Choices, a new program that was recently implemented within DDD, will provide in-home/respite services for people on the waiting list and for people living at home with parents or guardians. This program began serving developmentally disabled individuals in fiscal 2004 and will increase services to 550 individuals in fiscal 2005. In addition, Developmental Center Enhancement funding of $4.9 million is recommended to prevent the developmental centers from losing federal certification/funding. These funds will also be used to encourage the recruitment of nurses, update equipment, purchase additional vehicles, and provide community placements and work programs. Mental Health Community Programs
As part of the ongoing Redirection II program, the Division focused on placing patients into the least restrictive environment possible during fiscal 2004. As a result, full year deferred costs of $3.4 million must be funded in fiscal 2005. Another $4 million was added to control and manage state psychiatric hospital census/average daily populations or ADPs. This is done by increasing the number of Programs for Assertive Community Treatment (PACT) teams, Integrated Case Management Services (ICMS), and increasing crisis/respite services. Homeland Security From fiscal 2003 through 2005, Governor McGreevey has provided nearly $248 million in State funds for Homeland Security, clearly making it a top priority of his Administration. Each year, the amount of support has increased, as a growing mix of funding sources has been put in place. In fiscal 2005, a total $94 million in State Funds are recommended, including $26.8 million from the existing car rental surcharge, $34.3 million from the General Fund and $33 million from a proposed surcharge on wireless telecommunications (see below). This commitment has leveraged over $386 million in federal funds during the three-year period. About 65% of these funds are administered by the Department of Law and Public Safety, much of which (50 to 80%) is forwarded to local governments for equipment and training for first responders or for infrastructure protection.
15
The remaining federal funds are allocated to the Department of Health and Senior Services (DHSS) for bioterrorism. The Department has upgraded the Local Information Network and Communications System (LINCS) to provide a robust, regional public health response capability that is an absolute necessity for dealing with threats of bioterror. In addition, a Pharmaceutical Stockpile Access and Distribution Plan is now in place, with over 400 sites identified for mass distribution of medications or vaccinations. Similarly, preparedness and response plans were also created for smallpox and SARS. Finally, testing services at the State lab have been augmented to enable DHSS to handle surge capacity for rapid analysis of specimens associated with chemical or biological attacks.
Wireless Telecommunications/Cell Tower Assessment
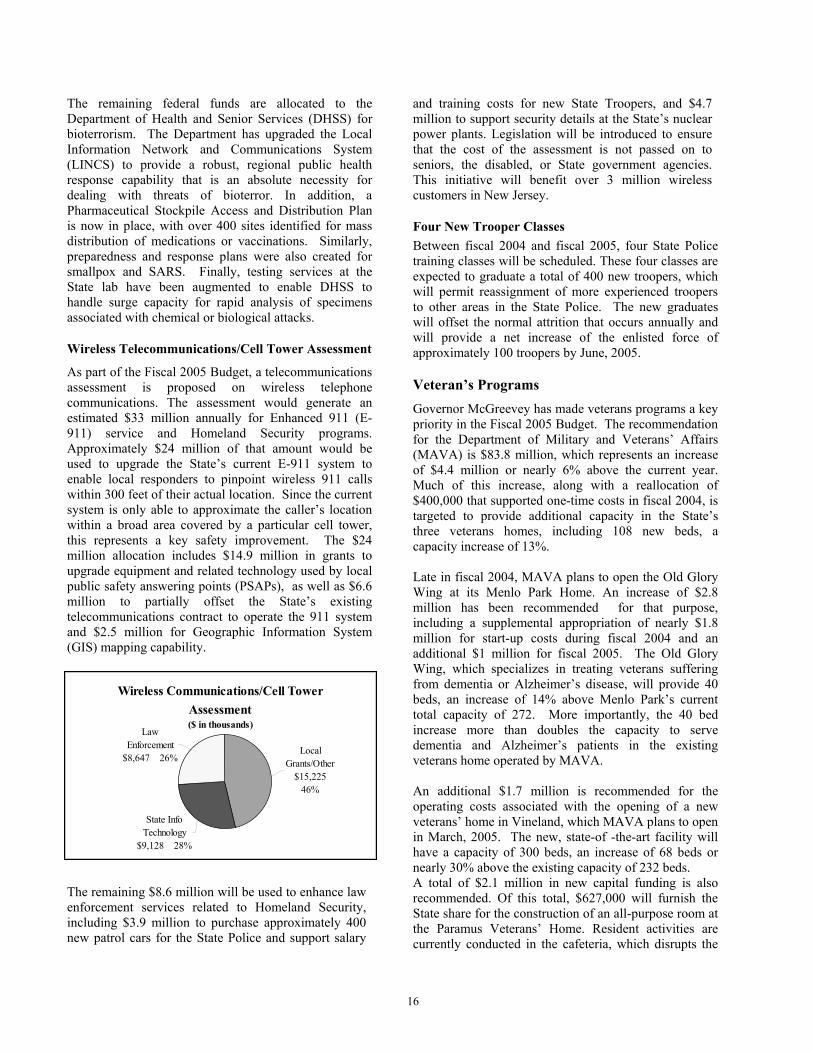
As part of the Fiscal 2005 Budget, a telecommunications assessment is proposed on wireless telephone communications. The assessment would generate an estimated $33 million annually for Enhanced 911 (E-911) service and Homeland Security programs. Approximately $24 million of that amount would be used to upgrade the State’s current E-911 system to enable local responders to pinpoint wireless 911 calls within 300 feet of their actual location. Since the current system is only able to approximate the caller’s location within a broad area covered by a particular cell tower, this represents a key safety improvement. The $24 million allocation includes $14.9 million in grants to upgrade equipment and related technology used by local public safety answering points (PSAPs), as well as $6.6 million to partially offset the State’s existing telecommunications contract to operate the 911 system and $2.5 million for Geographic Information System (GIS) mapping capability.
The remaining $8.6 million will be used to enhance law enforcement services related to Homeland Security, including $3.9 million to purchase approximately 400 new patrol cars for the State Police and support salary
and training costs for new State Troopers, and $4.7 million to support security details at the State’s nuclear power plants. Legislation will be introduced to ensure that the cost of the assessment is not passed on to seniors, the disabled, or State government agencies. This initiative will benefit over 3 million wireless customers in New Jersey.
Four New Trooper Classes Between fiscal 2004 and fiscal 2005, four State Police training classes will be scheduled. These four classes are expected to graduate a total of 400 new troopers, which will permit reassignment of more experienced troopers to other areas in the State Police. The new graduates will offset the normal attrition that occurs annually and will provide a net increase of the enlisted force of approximately 100 troopers by June, 2005.
Veteran’s Programs Governor McGreevey has made veterans programs a key priority in the Fiscal 2005 Budget. The recommendation for the Department of Military and Veterans’ Affairs (MAVA) is $83.8 million, which represents an increase of $4.4 million or nearly 6% above the current year. Much of this increase, along with a reallocation of $400,000 that supported one-time costs in fiscal 2004, is targeted to provide additional capacity in the State’s three veterans homes, including 108 new beds, a capacity increase of 13%. Late in fiscal 2004, MAVA plans to open the Old Glory Wing at its Menlo Park Home. An increase of $2.8 million has been recommended for that purpose, including a supplemental appropriation of nearly $1.8 million for start-up costs during fiscal 2004 and an additional $1 million for fiscal 2005. The Old Glory Wing, which specializes in treating veterans suffering from dementia or Alzheimer’s disease, will provide 40 beds, an increase of 14% above Menlo Park’s current total capacity of 272. More importantly, the 40 bed increase more than doubles the capacity to serve dementia and Alzheimer’s patients in the existing veterans home operated by MAVA. An additional $1.7 million is recommended for the operating costs associated with the opening of a new veterans’ home in Vineland, which MAVA plans to open in March, 2005. The new, state-of -the-art facility will have a capacity of 300 beds, an increase of 68 beds or nearly 30% above the existing capacity of 232 beds. A total of $2.1 million in new capital funding is also recommended. Of this total, $627,000 will furnish the State share for the construction of an all-purpose room at the Paramus Veterans’ Home. Resident activities are currently conducted in the cafeteria, which disrupts the
Wireless Communications/Cell Tower Assessment($ in thousands)
Local Grants/Other
$15,225 46%
State Info Technology
$9,128 28%
Law Enforcement
$8,647 26%
16
scheduling of meals. The all purpose room will provide a separate and dedicated area for social gatherings and volunteer work, and will greatly enhance the quality of life for residents. This investment will leverage a considerable amount of non-State funds, including a 65% share ($1.4 million) from the federal Veterans Administration and a $135,000 pledge from a local non-profit organization. In addition, $1.5 million is recommended for the construction of a World War II memorial to honor and recognize those who served our state and our country during that conflict.
With a veteran population ranked as the ninth largest and the oldest in the country, these investments will help ensure that MAVA continues to provide the best possible service to a group that richly deserves it.
Arts, History and Tourism
An $11.2 million increase in funding for arts, history, and tourism in fiscal 2005 is offset by revenues derived from P. L. 2003, c.114, the State hotel and motel occupancy fee and includes the following:
• The New Jersey Cultural Trust has a fiscal 2005 appropriation of $720,000, which is an increase of $220,000, or 44% over the fiscal 2004 appropriation of $500,000;
• The New Jersey Historical Commission is recommended to receive a fiscal 2005 appropriation of $4.6 million in grants, of which $3.8 million will fund the New Jersey Historical Commission's agency grants with revenue derived from the State hotel and motel occupancy fee. This represents an increase of $1.1 million or 41% over the fiscal 2004 appropriation of $2.7 million;
• In fiscal 2005, the Council on the Arts will receive an appropriation of $22.7 million, which is an increase of $6.7 million, or 42%, over the fiscal 2004 appropriation of $16 million. Of this amount, $1.5 million has been recommended for the Battleship NJ in fiscal 2005;
• Finally, the Commerce Commission’s Travel and Tourism Budget will increase by $3.2 million (33%) solely attributable to the revenue derived from the hotel/motel tax.
Economic Development New Jersey’s improved fiscal and economic picture has coincided with implementation of Governor
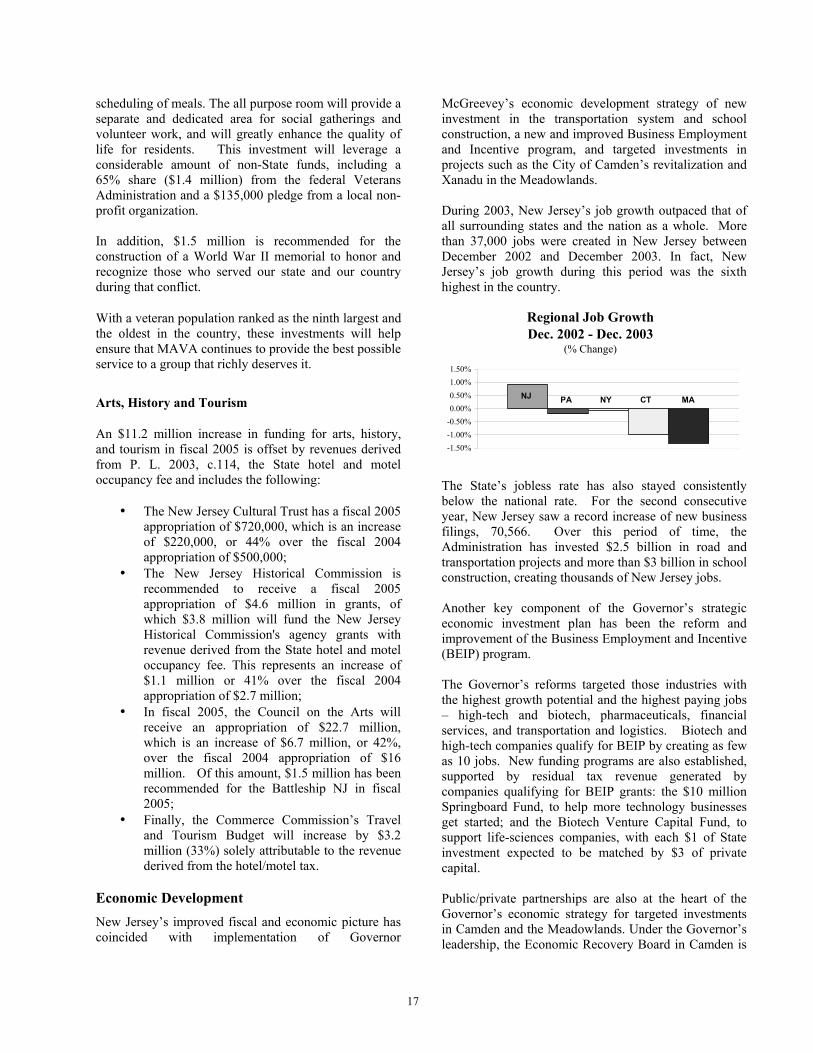
McGreevey’s economic development strategy of new investment in the transportation system and school construction, a new and improved Business Employment and Incentive program, and targeted investments in projects such as the City of Camden’s revitalization and Xanadu in the Meadowlands. During 2003, New Jersey’s job growth outpaced that of all surrounding states and the nation as a whole. More than 37,000 jobs were created in New Jersey between December 2002 and December 2003. In fact, New Jersey’s job growth during this period was the sixth highest in the country.
The State’s jobless rate has also stayed consistently below the national rate. For the second consecutive year, New Jersey saw a record increase of new business filings, 70,566. Over this period of time, the Administration has invested $2.5 billion in road and transportation projects and more than $3 billion in school construction, creating thousands of New Jersey jobs. Another key component of the Governor’s strategic economic investment plan has been the reform and improvement of the Business Employment and Incentive (BEIP) program. The Governor’s reforms targeted those industries with the highest growth potential and the highest paying jobs – high-tech and biotech, pharmaceuticals, financial services, and transportation and logistics. Biotech and high-tech companies qualify for BEIP by creating as few as 10 jobs. New funding programs are also established, supported by residual tax revenue generated by companies qualifying for BEIP grants: the $10 million Springboard Fund, to help more technology businesses get started; and the Biotech Venture Capital Fund, to support life-sciences companies, with each $1 of State investment expected to be matched by $3 of private capital. Public/private partnerships are also at the heart of the Governor’s economic strategy for targeted investments in Camden and the Meadowlands. Under the Governor’s leadership, the Economic Recovery Board in Camden is
Regional Job GrowthDec. 2002 - Dec. 2003
(% Change)
-1.50%-1.00%-0.50%0.00%0.50%1.00%1.50%
NJ PA NY CT MA
17
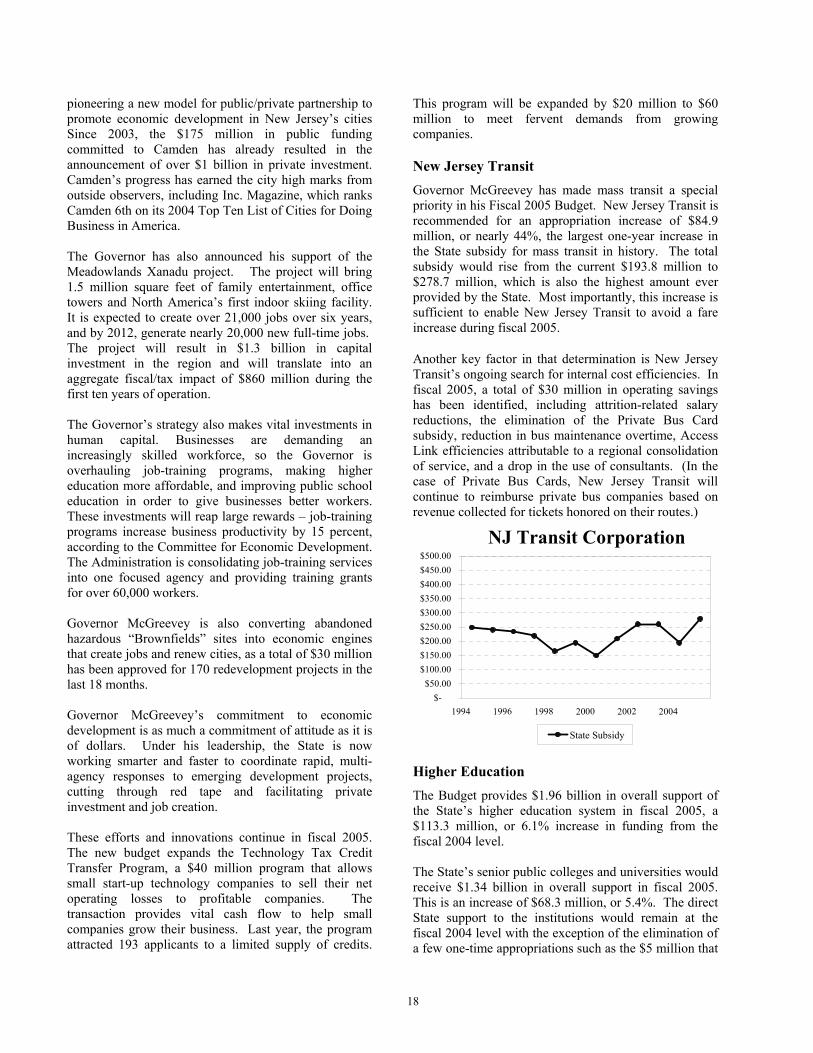
pioneering a new model for public/private partnership to promote economic development in New Jersey’s cities Since 2003, the $175 million in public funding committed to Camden has already resulted in the announcement of over $1 billion in private investment. Camden’s progress has earned the city high marks from outside observers, including Inc. Magazine, which ranks Camden 6th on its 2004 Top Ten List of Cities for Doing Business in America. The Governor has also announced his support of the Meadowlands Xanadu project. The project will bring 1.5 million square feet of family entertainment, office towers and North America’s first indoor skiing facility. It is expected to create over 21,000 jobs over six years, and by 2012, generate nearly 20,000 new full-time jobs. The project will result in $1.3 billion in capital investment in the region and will translate into an aggregate fiscal/tax impact of $860 million during the first ten years of operation. The Governor’s strategy also makes vital investments in human capital. Businesses are demanding an increasingly skilled workforce, so the Governor is overhauling job-training programs, making higher education more affordable, and improving public school education in order to give businesses better workers. These investments will reap large rewards – job-training programs increase business productivity by 15 percent, according to the Committee for Economic Development. The Administration is consolidating job-training services into one focused agency and providing training grants for over 60,000 workers. Governor McGreevey is also converting abandoned hazardous “Brownfields” sites into economic engines that create jobs and renew cities, as a total of $30 million has been approved for 170 redevelopment projects in the last 18 months. Governor McGreevey’s commitment to economic development is as much a commitment of attitude as it is of dollars. Under his leadership, the State is now working smarter and faster to coordinate rapid, multi-agency responses to emerging development projects, cutting through red tape and facilitating private investment and job creation. These efforts and innovations continue in fiscal 2005. The new budget expands the Technology Tax Credit Transfer Program, a $40 million program that allows small start-up technology companies to sell their net operating losses to profitable companies. The transaction provides vital cash flow to help small companies grow their business. Last year, the program attracted 193 applicants to a limited supply of credits.
This program will be expanded by $20 million to $60 million to meet fervent demands from growing companies.
New Jersey Transit Governor McGreevey has made mass transit a special priority in his Fiscal 2005 Budget. New Jersey Transit is recommended for an appropriation increase of $84.9 million, or nearly 44%, the largest one-year increase in the State subsidy for mass transit in history. The total subsidy would rise from the current $193.8 million to $278.7 million, which is also the highest amount ever provided by the State. Most importantly, this increase is sufficient to enable New Jersey Transit to avoid a fare increase during fiscal 2005.
Another key factor in that determination is New Jersey Transit’s ongoing search for internal cost efficiencies. In fiscal 2005, a total of $30 million in operating savings has been identified, including attrition-related salary reductions, the elimination of the Private Bus Card subsidy, reduction in bus maintenance overtime, Access Link efficiencies attributable to a regional consolidation of service, and a drop in the use of consultants. (In the case of Private Bus Cards, New Jersey Transit will continue to reimburse private bus companies based on revenue collected for tickets honored on their routes.)
Higher Education The Budget provides $1.96 billion in overall support of the State’s higher education system in fiscal 2005, a $113.3 million, or 6.1% increase in funding from the fiscal 2004 level. The State’s senior public colleges and universities would receive $1.34 billion in overall support in fiscal 2005. This is an increase of $68.3 million, or 5.4%. The direct State support to the institutions would remain at the fiscal 2004 level with the exception of the elimination of a few one-time appropriations such as the $5 million that
NJ Transit Corporation
$-$50.00
$100.00$150.00$200.00$250.00$300.00$350.00$400.00$450.00$500.00
1994 1996 1998 2000 2002 2004
State Subsidy
18
was appropriated to Rutgers in fiscal 2004 for costs associated with the proposed merger of Rutgers, UMDNJ and NJIT. Direct operating support for these institutions will total $814.3 million in fiscal 2005. The Budget provides an increase of nearly $43 million in indirect support to these institutions through the continued payment of the fringe benefit costs for institutional personnel. In fiscal 2005, the State budget will provide a total of nearly $500 million for fringe benefits costs. The Budget also provides $31.2 million to fund a significant portion of the negotiated cost-of-living increases (COLAs) for institutional personnel. Funding for these COLAs has not been provided to the institutions since fiscal 2002. The Budget provides $220 million in support for the State’s county colleges, an increase of $6.1 million. This increased State support provides operational assistance to maintain the county colleges as an affordable avenue for higher education as well as providing property tax relief. The increased State appropriations would fund increased costs for debt service and fringe benefits. The operating aid to the county colleges would be funded at $2 million above the current levels. The Administration also supports a $200 million increase in the cap on total Chapter 12 borrowing, from $330 million to $530 million, which will be split evenly between the State ($100 million) and the counties($100 million). This increased funding will provide resources to expand and renovate county collegefacilities in support of opportunities for economic development and the consolidation of job trainingprograms provided by the State and these colleges. Despite the difficult budget climate, the Budget increases the funding level for the State’s 14 independent colleges and universities by $500,000. These institutions serve an important role in providing higher education for 24,000 New Jersey residents.
Student Financial Assistance
The Budget provides $270.5 million for the various student financial assistance programs, including the Tuition Aid Grant program, Educational Opportunity Fund programs and the new NJ STARS program. This is an increase of $30.5 million, or 12.7%, from the current level.
Tuition Aid Grants The Budget provides $198 million for the Tuition Aid Grant (TAG) program for full-time students, an increase of $19.3 million. This increase will allow 2,000 more students to receive grants in fiscal 2005. In total, 55,500 students will receive TAG support in fiscal 2005. In addition, the Budget provides $4.2 million for the part-time TAG program for county college students that was initiated in fiscal 2004. The $700,000 increase in the program will increase the number of recipients from 6,800 to 8,200 in fiscal 2005.
New Jersey Educational Opportunity Fund (EOF)
The New Jersey Educational Opportunity Fund (EOF) was created by law in 1968 to ensure meaningful access to higher education for those who come from backgrounds of economic and educational disadvantage. EOF funding, totaling $35.1 million in fiscal 2005, will assist low-income New Jersey residents who are capable and motivated but lack adequate preparation for college study through a variety of programs such as Opportunity Program Grants, Supplementary Education Program Grants, the C. Clyde Ferguson Law Scholarship, and the Martin Luther King Physician-Dentist Scholarship.
NJ STARS Program
Due to the increasing cost of college, not all of New Jersey’s top performing high school graduates are able to capitalize on their academic success. Some of these students are forced to make a decision between taking out thousands of dollars in student loans or forgoing higher education altogether. Missing out on college significantly hampers their earning power, as students who obtain an associate degree will earn $400,000 more in additional lifetime income over the course of their careers, or 37% more than those with only a high school diploma. 1 To ensure that New Jersey’s most academically talented students are not denied the opportunity to attend college, Governor McGreevey is creating the New Jersey STARS (Student Tuition Assistance Reward Scholarship) program. NJ STARS will guarantee that every New Jersey high school student who graduates in the top 20% of his or her high school class and wants to go to a New Jersey
1 and 2 NJ Council of County Colleges report, Socio-economic Benefits Generated by NJ’s Community Colleges
19
community college will have tuition and fees covered for two years. To be eligible, a student must:
• Attend at least the full senior year and graduate from a New Jersey high school;
• Graduate in the top 20% of his or her high school class;
• Enroll as a full-time student at one of New Jersey’s 19 community colleges within two years following high school graduation;
• File the Free Application for Federal Student Aid (FAFSA) to apply for all need-based federal and state financial aid grants for which he or she may be eligible, including Pell Grants and Tuition Aid Grants (TAG);
• Apply for all merit-based state financial aid grants for which he or she may be eligible, including the Edward J. Bloustein Distinguished Scholars and Urban Scholars programs;
• Maintain full-time enrollment status at a New Jersey community college and make satisfactory academic progress while receiving this scholarship.
NJ STARS will give every student who excels in high school the opportunity to succeed in college, but the program will do more than simply help students. Ninety-five percent of community college students stay in New Jersey and join the workforce after leaving college, and the state's annual workforce earnings are $6.3 billion greater (an equivalent of 135,000 jobs) due to community colleges.2 By helping New Jersey’s brightest students, NJ STARS will make our state’s workforce outshine the competition.
New Jersey Stem Cell Institute Initiative
On January 4, 2004, Governor McGreevey signed New Jersey’s Stem Cell Bill making New Jersey the second state in the nation to legalize groundbreaking stem cell research. This important step builds on Governor McGreevey’s vision to make New Jersey a leader in medical research and medical care.
Stem Cell research offers real hope for those with debilitating diseases:
• According to the National Institutes of Health, stem cell research offers the possibility of treatment for those with Parkinson's and Alzheimer's diseases, spinal cord injury, stroke, heart disease, diabetes, and many other
diseases, providing hope to hundreds of thousands of families affected by chronic and life-threatening disease.
New Jersey welcomes the use of all stems cells to promote cures for debilitating diseases:
• New Jersey’s new Stem Cell law allows life science companies and universities to openly pursue new medical treatments using stem cells;
• New Jersey’s new Stem Cell law allows research on stem cells which cannot be performed with federal funds.
Key Components of the New Jersey Stem Cell Institute:
• The New Jersey Stem Cell Institute will be jointly operated by the University of Medicine and Dentistry of New Jersey and Rutgers University based in a new facility to be built in New Brunswick;
• A public-private partnership will be created to oversee the development of the Institute, which is expected to be a more than $50 million initiative over the next five years. At the direction of the Governor, the Commission on Science and Technology will convene a working group to pursue the Institute’s development;
• An initial $10 million public-private Stem Cell Fund will be created this year that will include Governor McGreevey’s commitment of $6.5 million, which includes $4 million in prior year balances, to begin planning and recruitment of top researchers from around the world. The remaining $3.5 million will be funded through a variety of sources, such as the National Institutes of Health and private grants from corporations;
• The Institute will be one of the first of its kind in the country, and certainly the first to form a real partnership between research universities, a medical school, and private interests;
• Background information on Stem Cells, including a primer and glossary, can be found at http://stemcells.nih.gov/.
Capital Grants and Facility Support
Finally, the Budget provides $84.3 million in State support for various bond issues that have provided capital grants and facilities support for the higher education institutions. This is an increase of $5.3
20
million, or 6.7%. Among these programs is the Dormitory Safety Trust Fund, P.L. 2000, c. 56, which mandates the installation of automatic fire suppression systems in every residence hall on New Jersey college campuses by the summer of 2004. Many institutions have completed this important work ahead of the statutory deadline, and every college is on target to achieve 100% compliance before the start of the fall semester.
Employee Benefits All State employees and most local employees are members of one of the seven State retirement systems: the Public Employees' Retirement System (PERS), the Teachers' Pension and Annuity Fund (TPAF), the Police and Firemen's Retirement System (PFRS), Consolidated Police and Firemen's Pension Fund, State Police Retirement System, Judicial Retirement System, and Prison Officer's Pension Fund. The law subjects all defined benefit pension plans to an actuarial valuation every year and actuarial experience studies every three years. The fiscal 2005 recommended amount for State PERS and TPAF is $412.4 million, which includes $192 million of post-retirement medical costs, $9.8 million of post-retirement costs for TPAF, $21.9 million of pension contribution costs for PFRS, $116.1 million of pension contribution costs for the Alternate Benefits Program, and $6.1 million of pension contribution costs for the Judicial Retirement System. Another $3.8 million is appropriated for pension funds and other specially legislated retirement provisions. Recommended appropriations for debt service payments on the pension obligation bonds total $62.7 million in fiscal 2005. The cost for health benefits, including medical, prescription drug, dental, and vision, for State and higher education employees in fiscal 2005 is projected at $964.9 million. This is a net increase of $64.4 million, or approximately 7.2%, above the fiscal 2004 adjusted appropriation of $900.5 million. This growth reflects anticipated rate increases for all State health plans, due in large part to continued cost escalation in the health care industry. Salary Program In fiscal 2005, $157.8 million is recommended for Salary Increases and Other Benefits to cover fiscal 2005 employee increments, progressions and across-the-board raises for all eligible employees, along with any deferred costs for the same contracts.
Other Key Initiatives
Cost-of-Living Increase – Third Party Providers
The Budget includes a recommendation to provide a third party Cost-of-Living (COLA) of 1%, totaling $21.4 million, to nonprofit entities contracting with the Departments of Human Services ($18.6 million), Health and Senior Services ($2.5 million), Labor ($200,000), and the Juvenile Justice Commission ($200,000). These funds will allow providers to furnish the same level of service to their clients as in fiscal 2004.
State Commission on Investigation
The Fiscal 2005 Budget provides $4.4 million to the State Commission on Investigation, which is a $588,000 or 15% increase over the fiscal 2004 appropriation of $3.8 million. This increased support provides the Commission the opportunity to further accomplish its mission to attack organized crime and political corruption, root out waste, fraud and abuse of taxpayers’ dollars, shed light on matters that subvert public justice and public safety, and to recommend appropriate reforms and improvements in laws and in the operations of government. Office of Faith Based Initiatives
The fiscal 2005 appropriation for the Office of Faith Based Initiatives is $3 million, which is an increase of $1 million or 50% over the fiscal 2004 appropriation of $2 million. This increase will allow the Office of Faith Based Initiatives to expand its current grant programs. In fiscal 2004, funding was made available to 26 faith-based organizations to provide health, transportation, and job training services for youth, elderly, and ex-offenders.
School Breakfast
Research indicates that eating breakfast helps children perform better scholastically and helps to combat poor nutrition and obesity. Under P.L. 2003, c. 4, which was enacted in January 2003, the State joined 25 other states in mandating that certain schools provide breakfast services to students. The program is scheduled for a two-year phase-in beginning September 2004. To accomplish this, a new appropriation of $1.3 million is recommended in fiscal 2005 as incentive payments to approximately 318 schools where 20% or more of the students are eligible for a free or reduced price meal. An increase in participation of over 145,000 eligible students is expected during fiscal 2005. State support for school breakfasts leverages federal funds through the U.S. Department of Agriculture, generating a total of $19 million on an annual basis to support the program.
21
Lead Poisoning
On January 20, 2004, Governor McGreevey signed into law the "Lead Hazard Control Assistance Act," thereby establishing a comprehensive program to help eradicate lead contamination in residential housing. As a followup to that Act, the Budget includes $9 million in new funding to address the risks of lead-based paint, including $7 million to the Department of Community Affairs and $2 million to the Department of Health and Senior Services. Children who are exposed to lead-based paint when they are very young are at risk of brain and central nervous system damage, lower intelligence, hyperactivity, attention deficit disorder, and possibly seizures, mental retardation, coma or even death. In New Jersey, at total of 5,230 children tested positive for lead-based paint exposure in 2003. Currently, State resources are focused on screening children for lead poisoning and abatement, strategies that are intended to identify children who have been exposed to lead-based paint and to remove the source of the lead. To significantly reduce the number of children who are lead poisoned, however, the State must also focus on prevention. Testing for the presence of lead-based paint in the home before a young child is exposed is a particularly effective method, especially in the homes of expectant mothers.
As a first step, DHSS will provide every expectant mother in New Jersey with a lead contamination sampling kit. The kit is designed for consumers, and contains all the supplies and instructions (including a pre-paid postage envelope to send the samples for testing) necessary to collect dust, paint, or soil samples. The kit will also include instructions for how parents can locate lead abatement and lead control information and resources.
In the Department of Community Affairs budget, $7 million from the sales tax on paint is recommended for the Lead Hazard Control Assistance Fund. Beginning in fiscal 2005, 50 cents of the State sales tax on each container of paint will be set aside for this new Fund. The Lead Hazard Control Assistance Fund will provide loans and grants to homeowners for lead hazard control work, associated lead evaluation costs, and temporary relocation assistance. The Fund will also provide for public education on the prevention of lead poisoning.
State Legal Services An increase of $2 million is recommended for the State Legal Services Office in fiscal 2005, providing 17% more than the fiscal 2004 grant appropriation of $12 million. Due to a decline in trust fund-related resources
attributable to the drop in interest rates, this increase is necessary to maintain staff and civil legal services for approximately 50,000 low income New Jersey residents.
Sports Authority
By controlling its expenses and expanding the schedule of popular performers, the New Jersey Sports and Exposition Authority (NJSEA) has offset the need for any additional State funding for operating costs in fiscal 2005. In fact, fiscal 2005 will be the second consecutive year that no operating subsidy will be required, a trend that contrasts markedly with the $11 to $15 million annual appropriation formerly provided for this purpose from fiscal 1999 through fiscal 2002. The Authority fully expects to continue this practice in the future, due in part to the aggressive pursuit of additional revenue opportunities, including the Xanadu redevelopment project at the Meadowlands Sports Complex. In addition to creating thousands of jobs, Xanadu will provide property tax relief to the people who live in the Meadowlands District. The Authority is also in the process of implementing a master plan for horse racing at the Meadowlands to encourage the growth of that vital industry.
Women’s Programs
The Department of Community Affairs' fiscal 2005 recommendation includes a number of increases to Women’s programs, including Rape Prevention ($500,000), Displaced Homemakers ($300,000), the Office of the Prevention of Violence Against Women ($200,000), and the Hispanic Women's Resource Center ($100,000). In sum, this provides an increase totaling $1.1 million for Women’s programs in the department. In the Department of Health and Senior Services, a new appropriation of $5 million is recommended for Women's Health Awareness. These funds will be used to provide and coordinate outreach and education on the importance of primary and preventive care with particular emphasis on cancer, HIV/AIDS, autoimmune diseases, osteoporosis, arthritis, and heart disease. These education and outreach efforts will also focus on providing information about the diseases and access points for health care. Records Management
The New Jersey Public Records Preservation account was established within the Department of Treasury in accordance with P. L. 2003, c. 117. Monies received from county clerks that are attributable solely to the statutory increases to recording fees (e.g., $5 per
22
document or per page) are deposited in this account. Highlights include:
• Projected annual revenue for fiscal 2004 is $70 million and the same amount is projected for fiscal 2005. Collections through the end of 2003 total $36.5 million;
• Funding may be used by State or local government agencies to support the management, storage, and preservation of public records. Distribution will begin in fiscal 2005, by which time the Department of State’s Division of Archives and Records Management (DARM) will have developed grant guidelines to govern this process;
• In fiscal 2005, DARM will receive an appropriation of $2.1 million from this account, an increase of $500k over its fiscal 2004 appropriation of $1.6 million. An additional amount will be added through budget language, not to exceed $3 million.
Management Efficiencies This Budget recommends a number of re-engineering projects with the primary goal of improving service delivery and constraining costs. Workers’ Compensation
Authorizing language has been recommended in the Fiscal 2005 Budget establishing a gainsharing program in which the largest generators of workers’ compensation claims among state agencies, namely the Departments of Human Services, Corrections, Law and Public Safety, and Transportation, would be given an opportunity to retain savings realized below the amount spent in fiscal 2004. This recommendation was derived based on a study by the Office of Management and Budget which concluded that a gainsharing approach, once combined with other management reforms, could help arrest the growth in claims and program costs in this area. The only stipulation on the use of any savings would be that they be applied for the purpose of improving worker safety and reducing workers’ compensation costs. Local Savings – Energy Aggregation
Occasionally, a "good government" story at the State level can be expanded to drive down the cost of local government. Specifically, the State is uniquely positioned to help localities reduce the cost of power for government operations in our deregulated energy market. In recent years, the State successfully
consolidated its own energy needs with that of New Jersey Transit, public colleges, and the toll road authorities to achieve the best possible price. The New Jersey Consolidated Energy Savings program locked in significant cost savings and long-term price predictability, with cost avoidance ranging up to 20 percent for electricity and up to 50% for natural gas during peak periods. Pending legislation would authorize the State to extend this savings opportunity to counties and localities, who would participate on a voluntary basis in either an existing State contract or a separate energy aggregation. By aggregating energy on behalf of localities, the State would enable towns to reduce their costs for energy consultants while benefiting from the State's existing energy expertise. By using the State as a rallying point, localities would wield far greater negotiating power, securing price concessions that they could never achieve individually.
Job Training Consolidation
On January 13, 2004, Governor McGreevey issued Reorganization Plan Number 001-2004 entitled, "A Plan For the Transfer, Consolidation and Reorganization of the State's Workforce Development System Into the Department of Labor." This consolidation, which will now be considered by the Legislature, will restructure workforce development in New Jersey by consolidating the responsibility for all employment-directed and workforce development activities from the Departments of Human Services and Education to the Department of Labor. Pursuant to this consolidation and in separate legislation, the Department will seek to change its name and become the Department of Labor and Workforce Development. The Plan, which furthers ongoing efforts to improve services, increase efficiencies and meet today's workforce challenges, is not reflected in the Fiscal 2005 Budget as presented. The consolidation includes all employment-directed and workforce development programs and activities of the Work First New Jersey Program (WFNJ) and Food Stamp Act (FSA), Adult Basic Education/English as a Second Language (ABE/ESL), Private Vocational School Approval, Apprenticeship Program, (including the Youth Transitions to Work Partnership Act (YTTWA) and the Youth Corps Program. Addiction Services Consolidation On February 5, 2004, the Governor issued Reorganization Plan Number 002-2004 entitled “A Plan for the Transfer, Consolidation and Reorganization of the Division of Addiction Services into the Department of Human Services”. The plan will provide increased
23
efficiency, coordination and integration of the State’s addiction prevention and treatment functions by transferring the Division of Addiction Services from the Department of Health and Senior Services to the Department of Human Services. Pending approval by the Legislature, however, funding for the Division of Addiction Services remains under the Department of Health and Senior Services in the Fiscal 2005 Budget. Vocational Rehabilitation - Federal Waiver
As a result of a concerted effort by the Departments of Human Services, Labor, and Treasury, the federal government recently approved a Community Care Waiver that will provide an additional $2 million in federal funds during fiscal 2005 for Vocational Rehabilitation in the Department of Labor. Many of Labor’s Vocational Rehabilitation clients would be eligible for federal funding if they were served instead within Human Services’ program for the disabled, a process that necessitated interagency coordination to pursue federal approval of this waiver. These new funds will be used to serve an additional 163 clients, an increase of 6% over the current 2,699 program slots, and to raise the cost reimbursement to third party providers. Shared Services
To help constrain administrative costs, including human resource needs, the Shared Services program will be expanded to additional departments in fiscal 2005. By consolidating administrative overhead, a savings of $500,000 is anticipated.
Parole Board – Community Placement
By expanding the use of alternative parole programs, a savings of $3.1 million will be achieved in the Department of Corrections’ budget in fiscal 2005. Alternative parole programs are designed to allow certain offenders, with the appropriate safeguards, an opportunity to be paroled in an environment which would concentrate services in the areas of the offenders’ highest needs. The number of slots in the Day Reporting program will increase by 100 (nearly 30%) from the current 350 to 450. Halfway Back program slots will increase by 10% or 45 slots, from 450 to 495 slots, and the Re-Entry Substance Abuse program will increase over 38% (42 slots) from the current 110 to 152. Drug Court Program
In fiscal 2005, the Judiciary will expand the Drug Court program by $2.2 million, or 11.6%, from the fiscal 2004 adjusted appropriation of $19 million to $21.2 million. The increase is comprised of $1.5 million for drug
treatment services and $700,000 for operational needs such as drug testing kits and supplies. Drug courts provide an alternative to incarceration through court-supervised treatment for carefully screened, non-violent offenders with addictions. The program is designed to break the cycle of drug-driven crime through treatment and close supervision of eligible offenders. Early performance data indicates that it is successful in reducing drug use and drug-driven crime. Intensive probation supervision, judicial monitoring, frequent drug testing and effective drug treatment all combine to break the cycle of drugs and crime for the offenders that participate. Currently, 10 of New Jersey’s 15 court vicinages operate a drug court program, providing a capacity of 321 beds. The increase noted above will enable the Judiciary to expand the capacity of this innovative program. Paperless Forms
The Division of Taxation within the Department of Treasury anticipates a savings of nearly $2 million in fiscal 2005 by accelerating its ongoing effort to convert to a “paperless” tax filing system. Improvements in technology and computer programming will provide alternate means of filing, resulting in reduced printing, postage, and processing costs. New regulations mandate web/electronic filing and payment of Quarterly Employer (Form NJ-927) forms, as well as Business Entity reports. Electronic filing thresholds will be lowered for the Wage Report (Form WR-30), from 50 employees to 5 employees, and the threshold to pay taxes by electronic fund transfer will be lowered from $20,000 to $10,000. Due to the widespread availability of tax completion software, there is a diminished need for a full NJ-1040 packet, therefore the mailing of about 2.7 million postcards used to provide mailing labels and PIN numbers is eliminated. Due in part to the use of bar code processing, the annual mailing of 400,000 Corporation Business Tax booklets will be entirely eliminated, and the creation of a telefile system will enable the State to phase-out the annual mailing of sales tax returns and booklets.
24
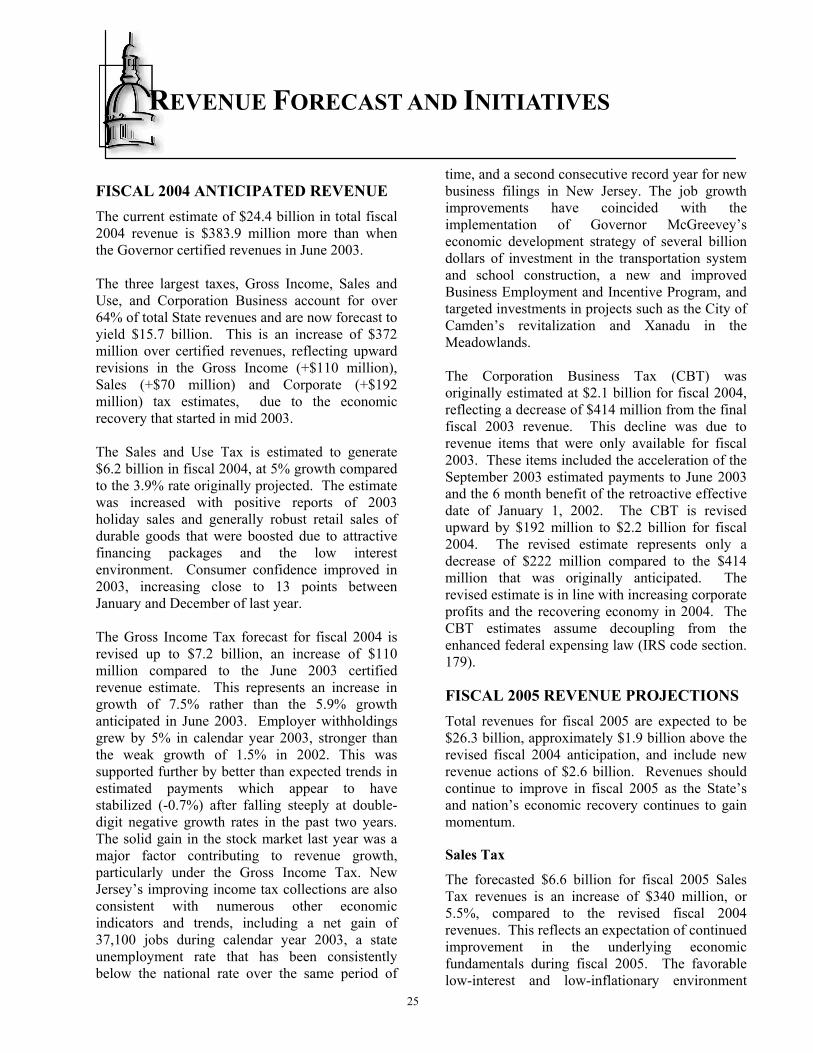
FISCAL 2004 ANTICIPATED REVENUE The current estimate of $24.4 billion in total fiscal 2004 revenue is $383.9 million more than when the Governor certified revenues in June 2003. The three largest taxes, Gross Income, Sales and Use, and Corporation Business account for over 64% of total State revenues and are now forecast to yield $15.7 billion. This is an increase of $372 million over certified revenues, reflecting upward revisions in the Gross Income (+$110 million), Sales (+$70 million) and Corporate (+$192 million) tax estimates, due to the economic recovery that started in mid 2003. The Sales and Use Tax is estimated to generate $6.2 billion in fiscal 2004, at 5% growth compared to the 3.9% rate originally projected. The estimate was increased with positive reports of 2003 holiday sales and generally robust retail sales of durable goods that were boosted due to attractive financing packages and the low interest environment. Consumer confidence improved in 2003, increasing close to 13 points between January and December of last year. The Gross Income Tax forecast for fiscal 2004 is revised up to $7.2 billion, an increase of $110 million compared to the June 2003 certified revenue estimate. This represents an increase in growth of 7.5% rather than the 5.9% growth anticipated in June 2003. Employer withholdings grew by 5% in calendar year 2003, stronger than the weak growth of 1.5% in 2002. This was supported further by better than expected trends in estimated payments which appear to have stabilized (-0.7%) after falling steeply at double-digit negative growth rates in the past two years. The solid gain in the stock market last year was a major factor contributing to revenue growth, particularly under the Gross Income Tax. New Jersey’s improving income tax collections are also consistent with numerous other economic indicators and trends, including a net gain of 37,100 jobs during calendar year 2003, a state unemployment rate that has been consistently below the national rate over the same period of
time, and a second consecutive record year for new business filings in New Jersey. The job growth improvements have coincided with the implementation of Governor McGreevey’s economic development strategy of several billion dollars of investment in the transportation system and school construction, a new and improved Business Employment and Incentive Program, and targeted investments in projects such as the City of Camden’s revitalization and Xanadu in the Meadowlands. The Corporation Business Tax (CBT) was originally estimated at $2.1 billion for fiscal 2004, reflecting a decrease of $414 million from the final fiscal 2003 revenue. This decline was due to revenue items that were only available for fiscal 2003. These items included the acceleration of the September 2003 estimated payments to June 2003 and the 6 month benefit of the retroactive effective date of January 1, 2002. The CBT is revised upward by $192 million to $2.2 billion for fiscal 2004. The revised estimate represents only a decrease of $222 million compared to the $414 million that was originally anticipated. The revised estimate is in line with increasing corporate profits and the recovering economy in 2004. The CBT estimates assume decoupling from the enhanced federal expensing law (IRS code section. 179).
FISCAL 2005 REVENUE PROJECTIONS Total revenues for fiscal 2005 are expected to be $26.3 billion, approximately $1.9 billion above the revised fiscal 2004 anticipation, and include new revenue actions of $2.6 billion. Revenues should continue to improve in fiscal 2005 as the State’s and nation’s economic recovery continues to gain momentum.
Sales Tax
The forecasted $6.6 billion for fiscal 2005 Sales Tax revenues is an increase of $340 million, or 5.5%, compared to the revised fiscal 2004 revenues. This reflects an expectation of continued improvement in the underlying economic fundamentals during fiscal 2005. The favorable low-interest and low-inflationary environment
REVENUE FORECAST AND INITIATIVES
25
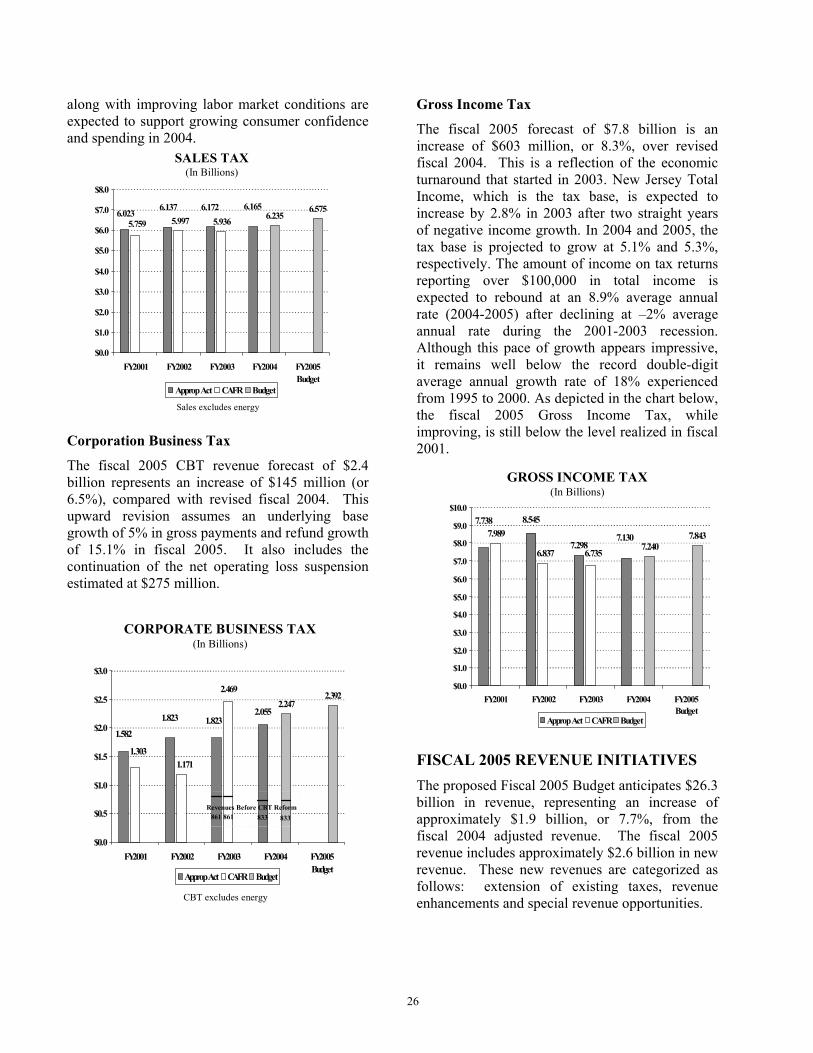
along with improving labor market conditions are expected to support growing consumer confidence and spending in 2004.
Corporation Business Tax
The fiscal 2005 CBT revenue forecast of $2.4 billion represents an increase of $145 million (or 6.5%), compared with revised fiscal 2004. This upward revision assumes an underlying base growth of 5% in gross payments and refund growth of 15.1% in fiscal 2005. It also includes the continuation of the net operating loss suspension estimated at $275 million.
Gross Income Tax
The fiscal 2005 forecast of $7.8 billion is an increase of $603 million, or 8.3%, over revised fiscal 2004. This is a reflection of the economic turnaround that started in 2003. New Jersey Total Income, which is the tax base, is expected to increase by 2.8% in 2003 after two straight years of negative income growth. In 2004 and 2005, the tax base is projected to grow at 5.1% and 5.3%, respectively. The amount of income on tax returns reporting over $100,000 in total income is expected to rebound at an 8.9% average annual rate (2004-2005) after declining at –2% average annual rate during the 2001-2003 recession. Although this pace of growth appears impressive, it remains well below the record double-digit average annual growth rate of 18% experienced from 1995 to 2000. As depicted in the chart below, the fiscal 2005 Gross Income Tax, while improving, is still below the level realized in fiscal 2001.
FISCAL 2005 REVENUE INITIATIVES The proposed Fiscal 2005 Budget anticipates $26.3 billion in revenue, representing an increase of approximately $1.9 billion, or 7.7%, from the fiscal 2004 adjusted revenue. The fiscal 2005 revenue includes approximately $2.6 billion in new revenue. These new revenues are categorized as follows: extension of existing taxes, revenue enhancements and special revenue opportunities.
2.2472.392
1.8231.823 2.055
1.582
1.171
2.469
1.303
$0.0
$0.5
$1.0
$1.5
$2.0
$2.5
$3.0
FY2001 FY2002 FY2003 FY2004 FY2005Budget
Approp Act CAFR Budget
CORPORATE BUSINESS TAX(In Billions)
CBT excludes energy
861 861 833 833Revenues Before CBT Reform
7.298 7.2407.843
8.5457.738
7.1307.989
6.837 6.735
$0.0
$1.0
$2.0
$3.0
$4.0
$5.0
$6.0
$7.0
$8.0
$9.0
$10.0
FY2001 FY2002 FY2003 FY2004 FY2005Budget
Approp Act CAFR Budget
GROSS INCOME TAX(In Billions)
6.2356.5756.1726.137 6.165
6.0235.997 5.9365.759
$0.0
$1.0
$2.0
$3.0
$4.0
$5.0
$6.0
$7.0
$8.0
FY2001 FY2002 FY2003 FY2004 FY2005Budget
Approp Act CAFR Budget
SALES TAX(In Billions)
Sales excludes energy
26
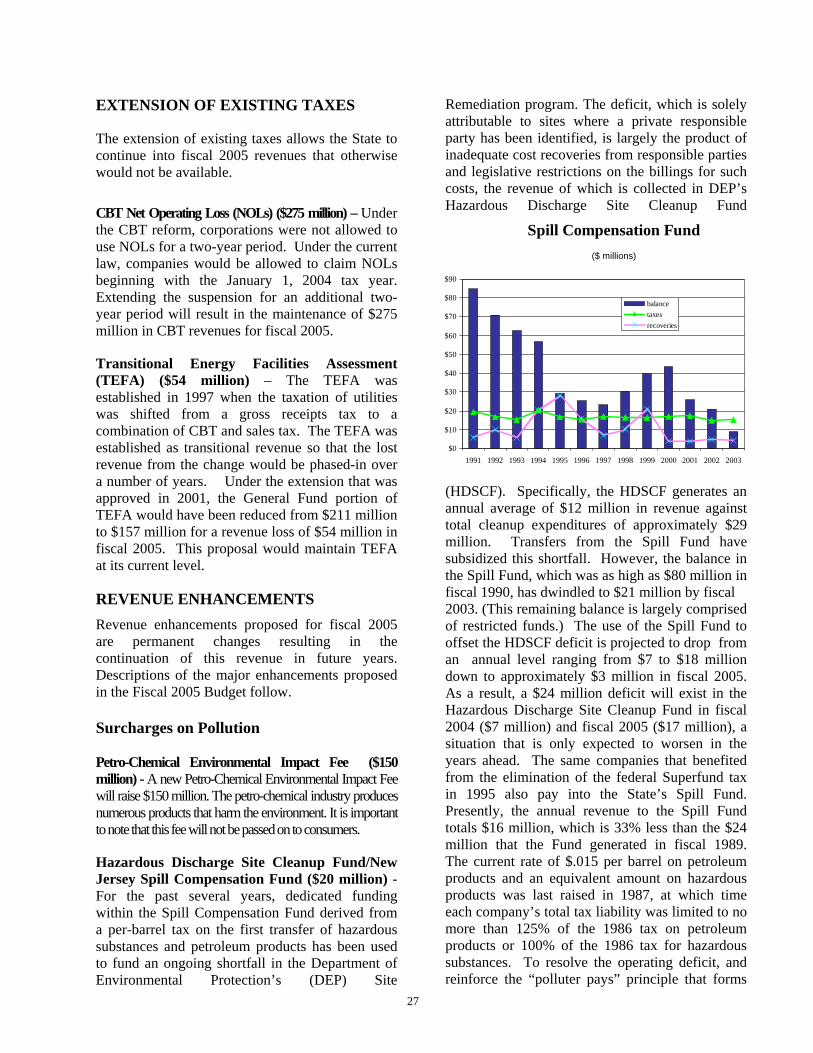
EXTENSION OF EXISTING TAXES
The extension of existing taxes allows the State to continue into fiscal 2005 revenues that otherwise would not be available.
CBT Net Operating Loss (NOLs) ($275 million) – Under the CBT reform, corporations were not allowed to use NOLs for a two-year period. Under the current law, companies would be allowed to claim NOLs beginning with the January 1, 2004 tax year. Extending the suspension for an additional two-year period will result in the maintenance of $275 million in CBT revenues for fiscal 2005.
Transitional Energy Facilities Assessment (TEFA) ($54 million) – The TEFA was established in 1997 when the taxation of utilities was shifted from a gross receipts tax to a combination of CBT and sales tax. The TEFA was established as transitional revenue so that the lost revenue from the change would be phased-in over a number of years. Under the extension that was approved in 2001, the General Fund portion of TEFA would have been reduced from $211 million to $157 million for a revenue loss of $54 million in fiscal 2005. This proposal would maintain TEFA at its current level.
REVENUE ENHANCEMENTS Revenue enhancements proposed for fiscal 2005 are permanent changes resulting in the continuation of this revenue in future years. Descriptions of the major enhancements proposed in the Fiscal 2005 Budget follow. Surcharges on Pollution Petro-Chemical Environmental Impact Fee ($150 million) - A new Petro-Chemical Environmental Impact Fee will raise $150 million. The petro-chemical industry produces numerous products that harm the environment. It is important to note that this fee will not be passed on to consumers.
Hazardous Discharge Site Cleanup Fund/New Jersey Spill Compensation Fund ($20 million) - For the past several years, dedicated funding within the Spill Compensation Fund derived from a per-barrel tax on the first transfer of hazardous substances and petroleum products has been used to fund an ongoing shortfall in the Department of Environmental Protection’s (DEP) Site
Remediation program. The deficit, which is solely attributable to sites where a private responsible party has been identified, is largely the product of inadequate cost recoveries from responsible parties and legislative restrictions on the billings for such costs, the revenue of which is collected in DEP’s Hazardous Discharge Site Cleanup Fund
(HDSCF). Specifically, the HDSCF generates an annual average of $12 million in revenue against total cleanup expenditures of approximately $29 million. Transfers from the Spill Fund have subsidized this shortfall. However, the balance in the Spill Fund, which was as high as $80 million in fiscal 1990, has dwindled to $21 million by fiscal
Spill Compensation Fund($ millions)
$0
$10
$20
$30
$40
$50
$60
$70
$80
$90
1991 1992 1993 1994 1995 1996 1997 1998 1999 2000 2001 2002 2003
balancetaxesrecoveries
2003. (This remaining balance is largely comprised of restricted funds.) The use of the Spill Fund to offset the HDSCF deficit is projected to drop from an annual level ranging from $7 to $18 million down to approximately $3 million in fiscal 2005. As a result, a $24 million deficit will exist in the Hazardous Discharge Site Cleanup Fund in fiscal 2004 ($7 million) and fiscal 2005 ($17 million), a situation that is only expected to worsen in the years ahead. The same companies that benefited from the elimination of the federal Superfund tax in 1995 also pay into the State’s Spill Fund. Presently, the annual revenue to the Spill Fund totals $16 million, which is 33% less than the $24 million that the Fund generated in fiscal 1989. The current rate of $.015 per barrel on petroleum products and an equivalent amount on hazardous products was last raised in 1987, at which time each company’s total tax liability was limited to no more than 125% of the 1986 tax on petroleum products or 100% of the 1986 tax for hazardous substances. To resolve the operating deficit, and reinforce the “polluter pays” principle that forms
27
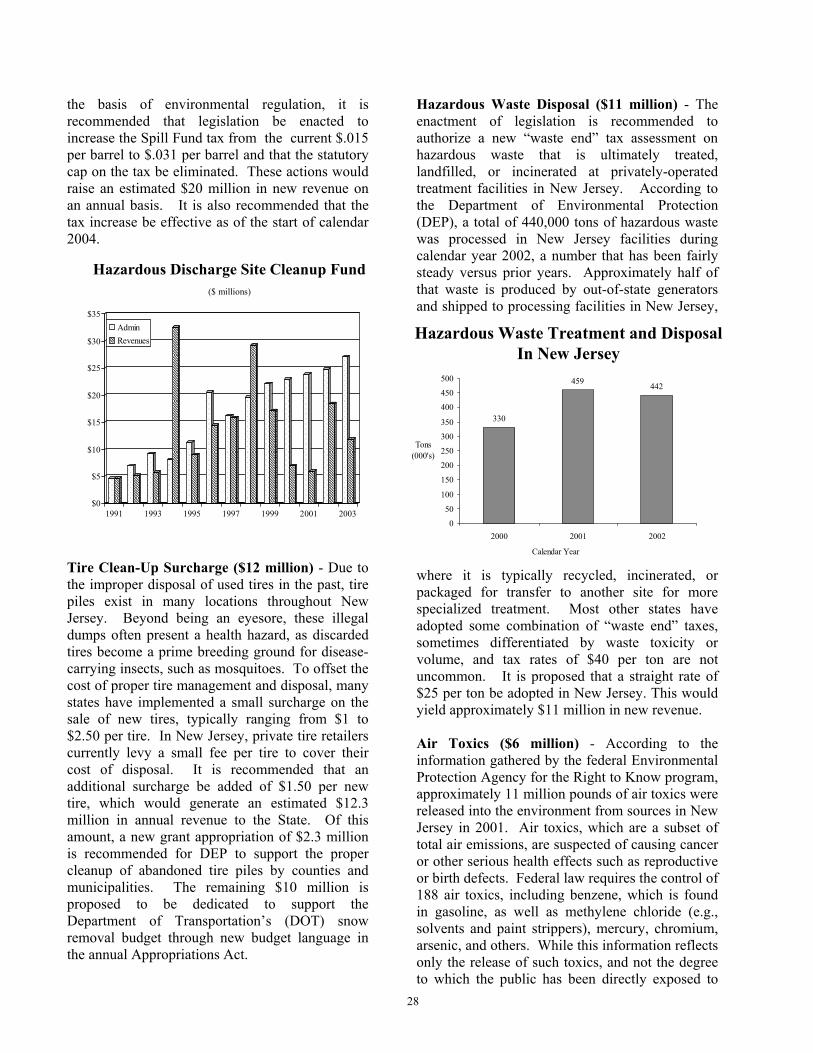
the basis of environmental regulation, it is recommended that legislation be enacted to increase the Spill Fund tax from the current $.015 per barrel to $.031 per barrel and that the statutory cap on the tax be eliminated. These actions would raise an estimated $20 million in new revenue on an annual basis. It is also recommended that the tax increase be effective as of the start of calendar 2004.
Tire Clean-Up Surcharge ($12 million) - Due to the improper disposal of used tires in the past, tire piles exist in many locations throughout New Jersey. Beyond being an eyesore, these illegal dumps often present a health hazard, as discarded tires become a prime breeding ground for disease-carrying insects, such as mosquitoes. To offset the cost of proper tire management and disposal, many states have implemented a small surcharge on the sale of new tires, typically ranging from $1 to $2.50 per tire. In New Jersey, private tire retailers currently levy a small fee per tire to cover their cost of disposal. It is recommended that an additional surcharge be added of $1.50 per new tire, which would generate an estimated $12.3 million in annual revenue to the State. Of this amount, a new grant appropriation of $2.3 million is recommended for DEP to support the proper cleanup of abandoned tire piles by counties and municipalities. The remaining $10 million is proposed to be dedicated to support the Department of Transportation’s (DOT) snow removal budget through new budget language in the annual Appropriations Act.
Hazardous Waste Disposal ($11 million) - The enactment of legislation is recommended to authorize a new “waste end” tax assessment on hazardous waste that is ultimately treated, landfilled, or incinerated at privately-operated treatment facilities in New Jersey. According to the Department of Environmental Protection (DEP), a total of 440,000 tons of hazardous waste was processed in New Jersey facilities during calendar year 2002, a number that has been fairly steady versus prior years. Approximately half of that waste is produced by out-of-state generators and shipped to processing facilities in New Jersey,
where it is typically recycled, incinerated, or packaged for transfer to another site for more specialized treatment. Most other states have adopted some combination of “waste end” taxes, sometimes differentiated by waste toxicity or volume, and tax rates of $40 per ton are not uncommon. It is proposed that a straight rate of $25 per ton be adopted in New Jersey. This would yield approximately $11 million in new revenue. Air Toxics ($6 million) - According to the information gathered by the federal Environmental Protection Agency for the Right to Know program, approximately 11 million pounds of air toxics were released into the environment from sources in New Jersey in 2001. Air toxics, which are a subset of total air emissions, are suspected of causing cancer or other serious health effects such as reproductive or birth defects. Federal law requires the control of 188 air toxics, including benzene, which is found in gasoline, as well as methylene chloride (e.g., solvents and paint strippers), mercury, chromium, arsenic, and others. While this information reflects only the release of such toxics, and not the degree to which the public has been directly exposed to
Hazardous Discharge Site Cleanup Fund($ millions)
$0
$5
$10
$15
$20
$25
$30
$35
1991 1993 1995 1997 1999 2001 2003
Admin Revenues Hazardous Waste Treatment and Disposal
In New Jersey
330
459 442
0
50
100
150
200
250
300
350
400
450
500
2000 2001 2002
Calendar Year
Tons(000's)
28
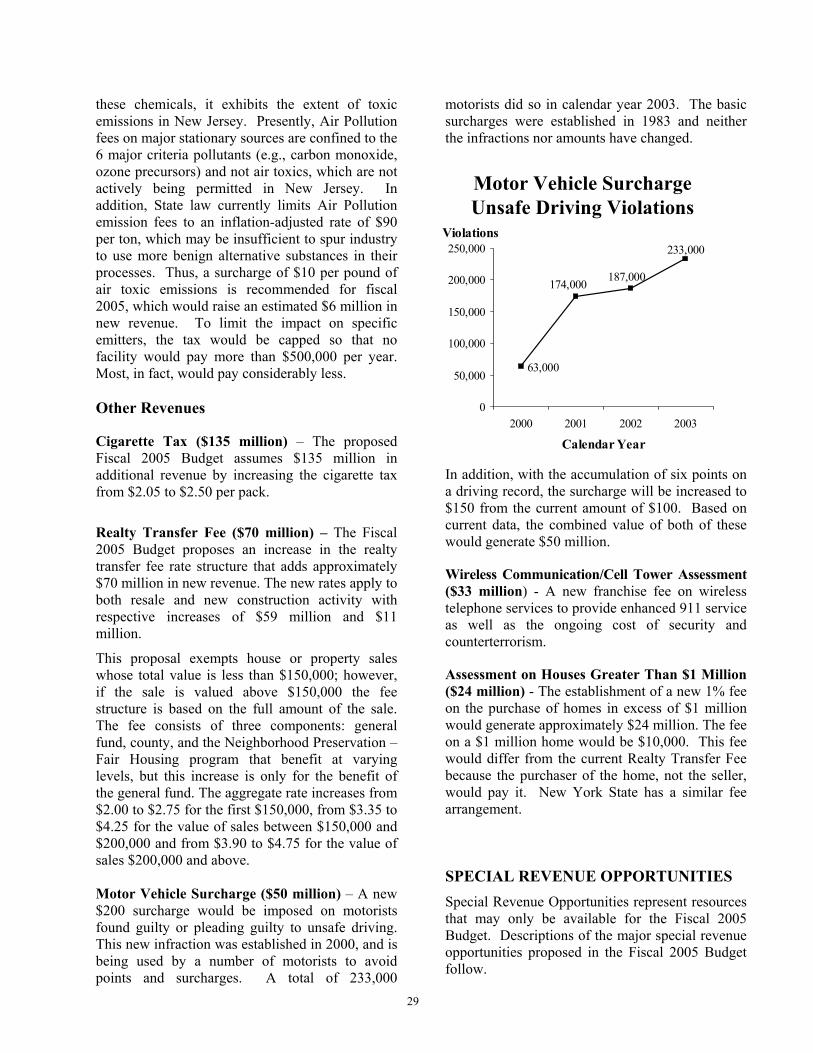
these chemicals, it exhibits the extent of toxic emissions in New Jersey. Presently, Air Pollution fees on major stationary sources are confined to the 6 major criteria pollutants (e.g., carbon monoxide, ozone precursors) and not air toxics, which are not actively being permitted in New Jersey. In addition, State law currently limits Air Pollution emission fees to an inflation-adjusted rate of $90 per ton, which may be insufficient to spur industry to use more benign alternative substances in their processes. Thus, a surcharge of $10 per pound of air toxic emissions is recommended for fiscal 2005, which would raise an estimated $6 million in new revenue. To limit the impact on specific emitters, the tax would be capped so that no facility would pay more than $500,000 per year. Most, in fact, would pay considerably less. Other Revenues
Cigarette Tax ($135 million) – The proposed Fiscal 2005 Budget assumes $135 million in additional revenue by increasing the cigarette tax from $2.05 to $2.50 per pack.
Realty Transfer Fee ($70 million) – The Fiscal 2005 Budget proposes an increase in the realty transfer fee rate structure that adds approximately $70 million in new revenue. The new rates apply to both resale and new construction activity with respective increases of $59 million and $11 million.
This proposal exempts house or property sales whose total value is less than $150,000; however, if the sale is valued above $150,000 the fee structure is based on the full amount of the sale. The fee consists of three components: general fund, county, and the Neighborhood Preservation – Fair Housing program that benefit at varying levels, but this increase is only for the benefit of the general fund. The aggregate rate increases from $2.00 to $2.75 for the first $150,000, from $3.35 to $4.25 for the value of sales between $150,000 and $200,000 and from $3.90 to $4.75 for the value of sales $200,000 and above. Motor Vehicle Surcharge ($50 million) – A new $200 surcharge would be imposed on motorists found guilty or pleading guilty to unsafe driving. This new infraction was established in 2000, and is being used by a number of motorists to avoid points and surcharges. A total of 233,000
motorists did so in calendar year 2003. The basic surcharges were established in 1983 and neither the infractions nor amounts have changed.
In addition, with the accumulation of six points on a driving record, the surcharge will be increased to $150 from the current amount of $100. Based on current data, the combined value of both of these would generate $50 million.
Wireless Communication/Cell Tower Assessment ($33 million) - A new franchise fee on wireless telephone services to provide enhanced 911 service as well as the ongoing cost of security and counterterrorism.
Assessment on Houses Greater Than $1 Million ($24 million) - The establishment of a new 1% fee on the purchase of homes in excess of $1 million would generate approximately $24 million. The fee on a $1 million home would be $10,000. This fee would differ from the current Realty Transfer Fee because the purchaser of the home, not the seller, would pay it. New York State has a similar fee arrangement.
SPECIAL REVENUE OPPORTUNITIES Special Revenue Opportunities represent resources that may only be available for the Fiscal 2005 Budget. Descriptions of the major special revenue opportunities proposed in the Fiscal 2005 Budget follow.
Motor Vehicle SurchargeUnsafe Driving Violations
63,000
174,000 187,000
233,000
0
50,000
100,000
150,000
200,000
250,000
2000 2001 2002 2003
Calendar Year
Violations
29
New Revenue Securitizations ($1.52 billion) – Revenue from the cigarette tax increase and the additional funds raised through the new $200 motor vehicle surcharge and the change in surcharges on the accumulation of points would be securitized to generate approximately $1.52 billion in revenue for fiscal 2005. The proposed surcharge securitizations would be somewhat similar to efforts in the past, such as the Joint Underwriting Association (JUA)/Market Transition Facility (MTF), which utilized motor vehicle surcharge revenue from the years 1991-2011, as did the recent securitization for the Motor Vehicles Commission (i.e, surcharges from 2012 to 2015).
State Disability Fund ($110 million) – The budget assumes an additional diversion of $110 million from the State Disability Fund. The redirection of these monies to the General Fund will not adversely impact the payment of disability benefits to claimants nor will it trigger any increase in tax rates.
Motor Vehicle Fee Acceleration ($90 million) – Currently vehicle registrations are paid on an annual basis. A change to require new vehicles to be registered for four years would generate $90 million in fiscal 2005. Leased vehicles would pre-pay the car registration fee based on the length of the lease. The payment of registration for four years would mirror the inspection period for new vehicles. Under current law, new vehicles do not have to be inspected for four years. The accelerated payment of the registration fee would mean that a person who purchases a new vehicle would not have to visit the Motor Vehicle Commission for four years for either registrations or inspections. Enhanced Enforcement ($25 million) – A package of initiatives is recommended to bolster the State’s ability to collect outstanding debt, expand collections to include out-of-state taxpayers operating in New Jersey, or improve enforcement of existing tax law, all of which are estimated to generate a total of $25 million in new revenue during fiscal 2005. o Withholding on Real Estate Capital Gains
by Non-Residents - State tax withholding on capital gains by non-residents on real estate transactions would be required. An analysis
by the Division of Taxation of non-resident real estate sales finalized during fiscal 2001 concluded that approximately 70% of the sellers were listed in the Division’s tax files but did not have a 2000 or 2001 corporate or gross income tax return. For another 21% of the transactions, there was no evidence of a taxpayer registered under the owner's name. This suggests that, in the vast majority of the cases, any potential capital gain is not being reported. Other states such as New York have recently enacted laws to implement this change.
o Use Tax Agreements for Out-of-state
Vendors - To combat the underreporting of the use tax, several other states (e.g., Indiana, Virginia, North Carolina) have considered or adopted legislation requiring out-of-state vendors to sign use tax agreements on all of their transactions within that state as a condition of continuing to do business with state government. This particularly applies to providers of large equipment who presently do not have a general use tax agreement with New Jersey. Analysis suggests that out-of-state vendors sell at least $182 million in tangible goods such as computers, furniture, and equipment to the State of New Jersey. For the largest non-state vendors, the threat of losing the State as a customer may be compelling enough for them to collect the use tax on the remainder of their New Jersey-related business transactions. Though this measure is difficult to quantify, it should be noted that Virginia, a similarly-sized state, recently estimated an annual revenue gain of $5 million.
o Upfront Withholding on Out-of-state
Contractors - To ensure that the proper tax liability is paid to the State, out-of-state contractors operating in New Jersey would pay an upfront withholding.
o Expansion of SOIL Program - The Setoff of
Individual Liability (SOIL) program operated by the Division of Taxation will be expanded to include bad debt owed to municipal courts, New Jersey Transit debts, motor vehicle surcharges held by Division of Law, or debts owed to the Department of Community Affair’s Housing Inspection program. Most recently, the majority of the county colleges
30
have expressed interest in using SOIL. Aggressively pursuing outstanding debt through the SOIL program will enable them to increase financial support for ongoing operations.
o Tax Clearance to Renew Professional
Licenses - To obtain a professional license or certification from State government, applicants would be required to obtain a tax clearance or proof of tax payment. This program, which would be coordinated with the Division of Taxation’s existing SOIL program, would provide another means of collecting on outstanding debt. For applicants who owe money to the State, licenses and certifications would be suppressed until payment is made or a payment plan is arranged. Maryland implemented a similar provision and raised $10 million.
o Streamlined Bank Attachment Process –
New legislation is recommended to require banks to provide a list of all account holders to the State. The list would include name, social security number, and account balance and that information would be used by the Division of Taxation to levy the accounts. The state of Maryland has estimated they will generate $10 million from this initiative. In conjunction with this, Maryland also enacted a streamlining to their bank attachment process. New Jersey would implement a similar program.
Unclaimed Personal Property ($8 million) – New legislation would expand the unclaimed property law to include gift cards, gift certificates and other similar instruments. When unclaimed by the owner for more than three years, they would be presumed to be abandoned and would escheat to the State. Escheating property to the State gives the public the potential availability of discovering and recovering their funds on a timelier basis. Institutions, as the custodian, frequently impose fees that erode the balances, whereas, the State does not. Charity Care ($115 million) – In order to offset the reduction in the Unemployment Insurance Fund diversion that supports Charity Care, these revenue solutions are recommended:
The new proposal is for an annual assessment on ambulatory medical facilities ($31 million) and a new $5 charge on hospital outpatient visits ($34 million). It also raises the existing hospital assessment from .53% of annual revenues to .70% ($50 million); however, funding to hospitals will actually increase due to increases in recommended State funding and matching federal funds.
31
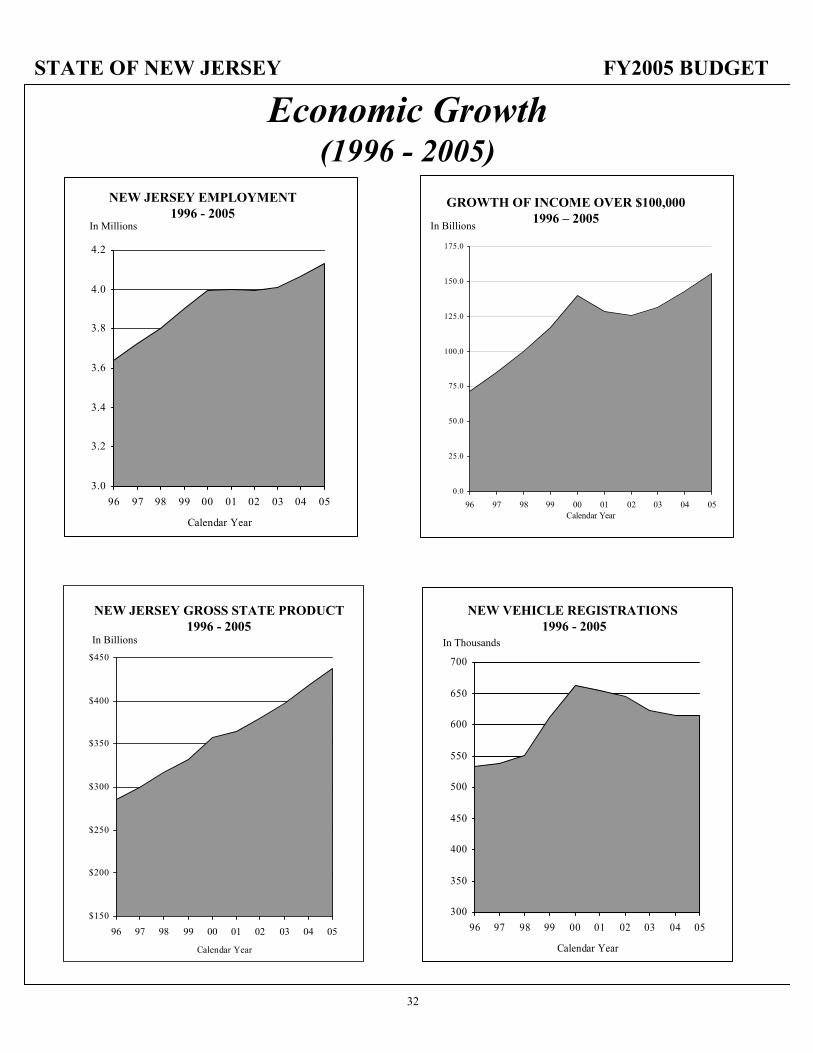
STATE OF NEW JERSEY FY2005 BUDGET
$150
$200
$250
$300
$350
$400
$450
96 97 98 99 00 01 02 03 04 05
Calendar Year
3.0
3.2
3.4
3.6
3.8
4.0
4.2
96 97 98 99 00 01 02 03 04 05
Calendar Year
In Millions
NEW JERSEY EMPLOYMENT1996 - 2005
NEW JERSEY GROSS STATE PRODUCT1996 - 2005
In Billions
300
350
400
450
500
550
600
650
700
96 97 98 99 00 01 02 03 04 05
Calendar Year
NEW VEHICLE REGISTRATIONS1996 - 2005
In Thousands
Economic Growth(1996 - 2005)
0.0
25.0
50.0
75.0
100.0
125.0
150.0
175.0
96 97 98 99 00 01 02 03 04 05Calendar Year
In Billions
GROWTH OF INCOME OVER $100,0001996 – 2005
32
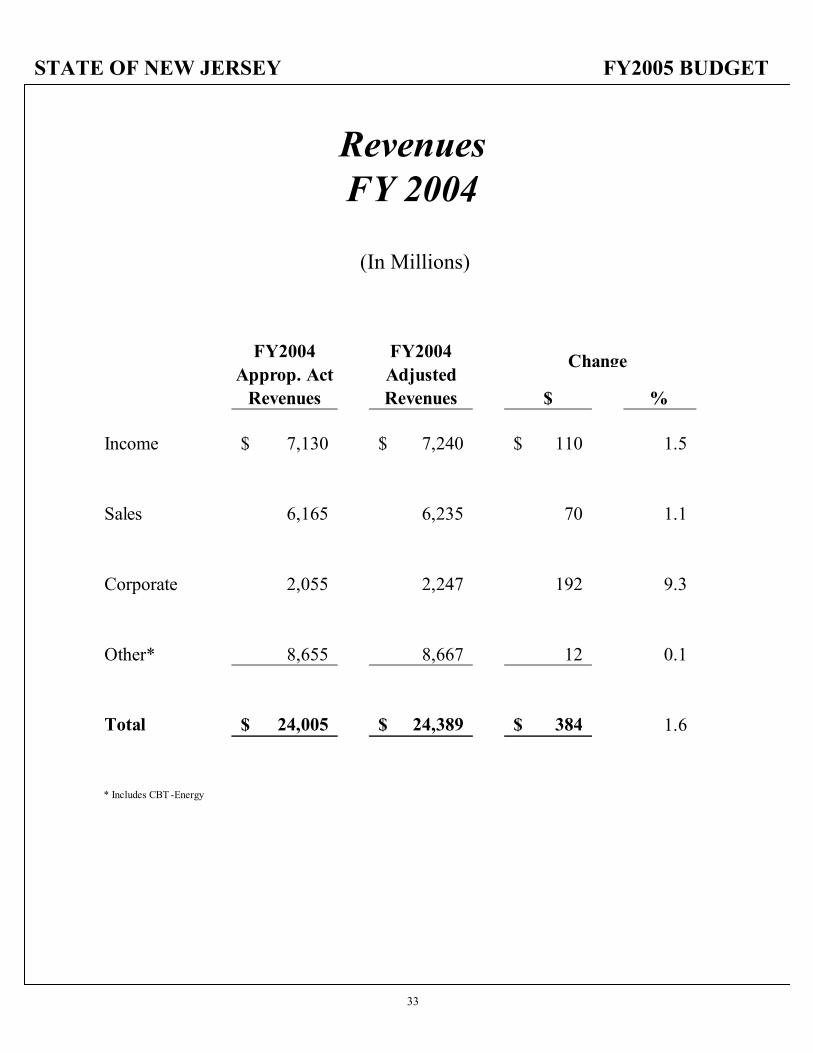
STATE OF NEW JERSEY FY2005 BUDGET
(In Millions)
RevenuesFY 2004
FY2004 Approp. Act
Revenues
FY2004 Adjusted Revenues $ %
Income 7,130$ 7,240$ 110$ 1.5
Sales 6,165 6,235 70 1.1
Corporate 2,055 2,247 192 9.3
Other* 8,655 8,667 12 0.1
Total 24,005$ 24,389$ 384$ 1.6
* Includes CBT -Energy
Change
33
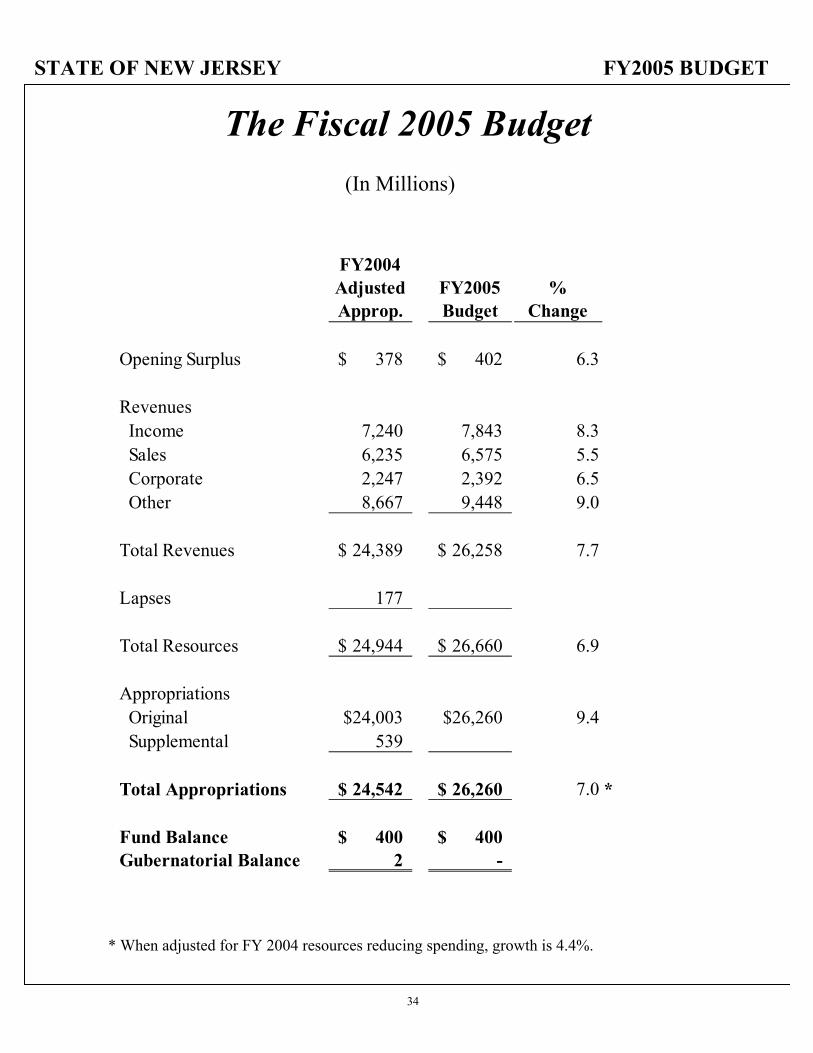
STATE OF NEW JERSEY FY2005 BUDGET
The Fiscal 2005 Budget(In Millions)
FY2004 Adjusted Approp.
FY2005 Budget
% Change
Opening Surplus 378$ 402$ 6.3
Revenues Income 7,240 7,843 8.3 Sales 6,235 6,575 5.5 Corporate 2,247 2,392 6.5 Other 8,667 9,448 9.0
Total Revenues 24,389$ 26,258$ 7.7
Lapses 177
Total Resources 24,944$ 26,660$ 6.9
Appropriations Original $24,003 $26,260 9.4 Supplemental 539
Total Appropriations 24,542$ 26,260$ 7.0 *
Fund Balance 400$ 400$ Gubernatorial Balance 2 -
* When adjusted for FY 2004 resources reducing spending, growth is 4.4%.
34
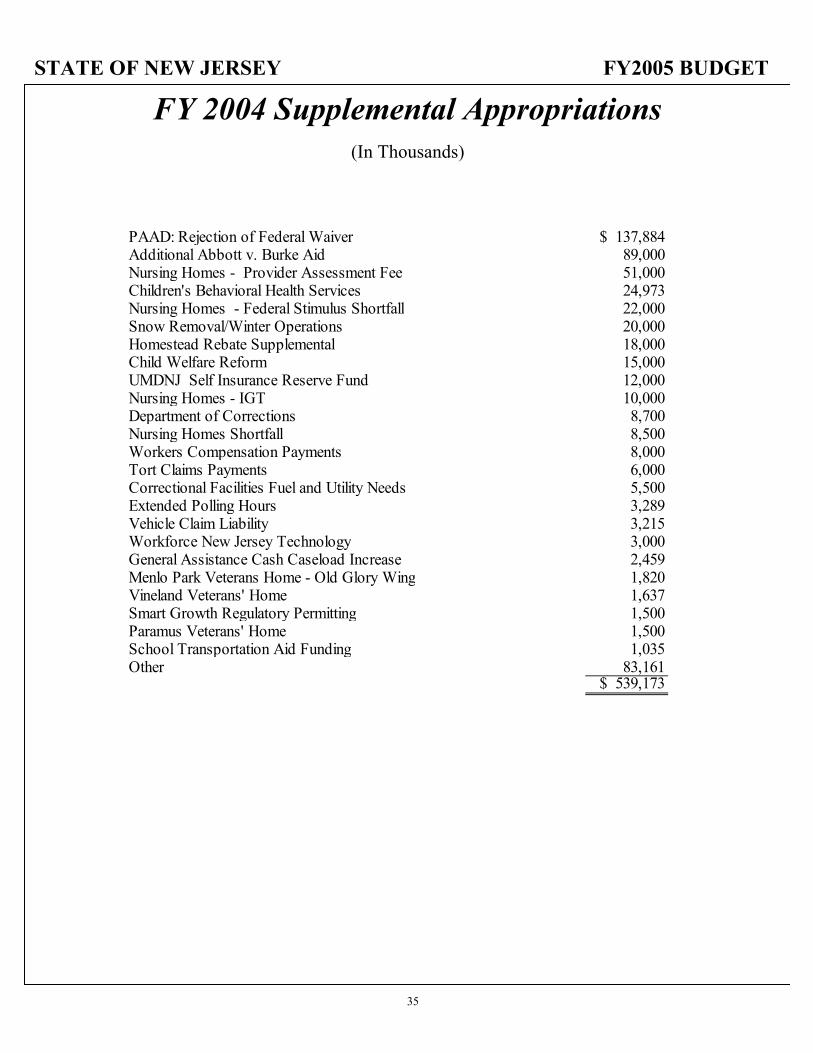
STATE OF NEW JERSEY FY2005 BUDGET
PAAD: Rejection of Federal Waiver $ 137,884 Additional Abbott v. Burke Aid 89,000 Nursing Homes - Provider Assessment Fee 51,000 Children's Behavioral Health Services 24,973 Nursing Homes - Federal Stimulus Shortfall 22,000 Snow Removal/Winter Operations 20,000 Homestead Rebate Supplemental 18,000 Child Welfare Reform 15,000 UMDNJ Self Insurance Reserve Fund 12,000 Nursing Homes - IGT 10,000 Department of Corrections 8,700 Nursing Homes Shortfall 8,500 Workers Compensation Payments 8,000 Tort Claims Payments 6,000 Correctional Facilities Fuel and Utility Needs 5,500 Extended Polling Hours 3,289 Vehicle Claim Liability 3,215 Workforce New Jersey Technology 3,000 General Assistance Cash Caseload Increase 2,459 Menlo Park Veterans Home - Old Glory Wing 1,820 Vineland Veterans' Home 1,637 Smart Growth Regulatory Permitting 1,500 Paramus Veterans' Home 1,500 School Transportation Aid Funding 1,035 Other 83,161
$ 539,173
FY 2004 Supplemental Appropriations(In Thousands)
35
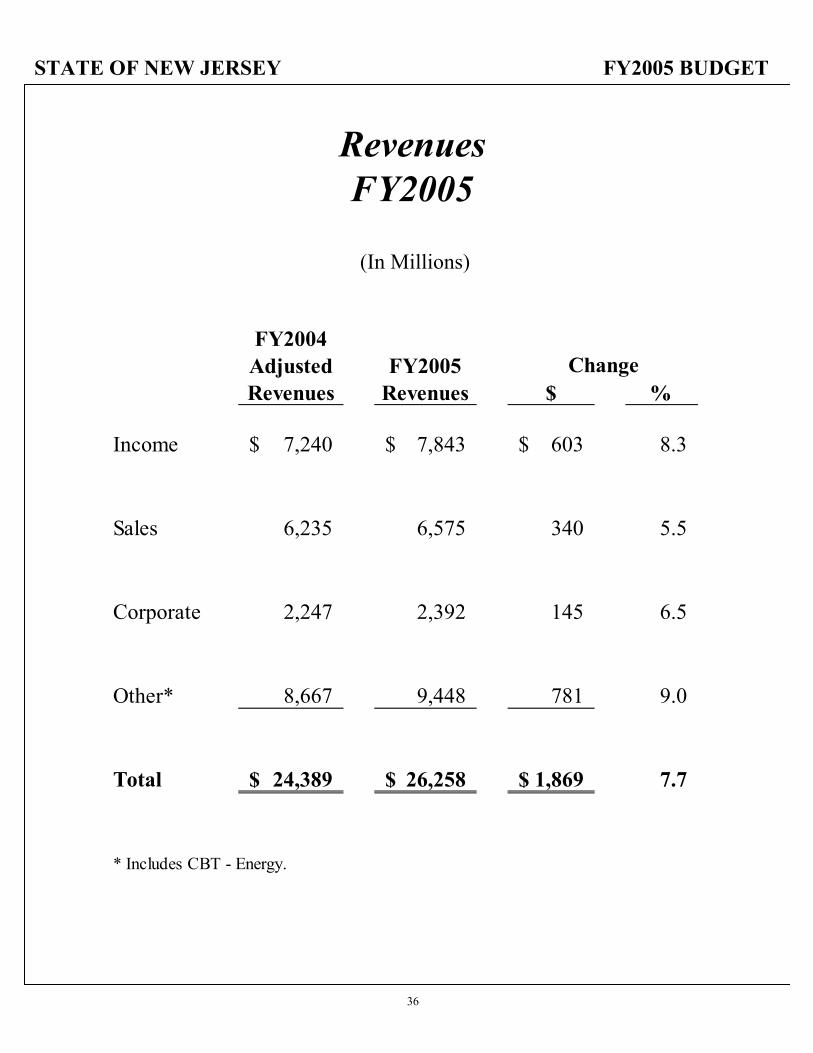
STATE OF NEW JERSEY FY2005 BUDGET
(In Millions)
RevenuesFY2005
FY2004 Adjusted Revenues
FY2005 Revenues $ %
Income 7,240$ 7,843$ 603$ 8.3
Sales 6,235 6,575 340 5.5
Corporate 2,247 2,392 145 6.5
Other* 8,667 9,448 781 9.0
Total 24,389$ 26,258$ 1,869$ 7.7
* Includes CBT - Energy.
Change
36
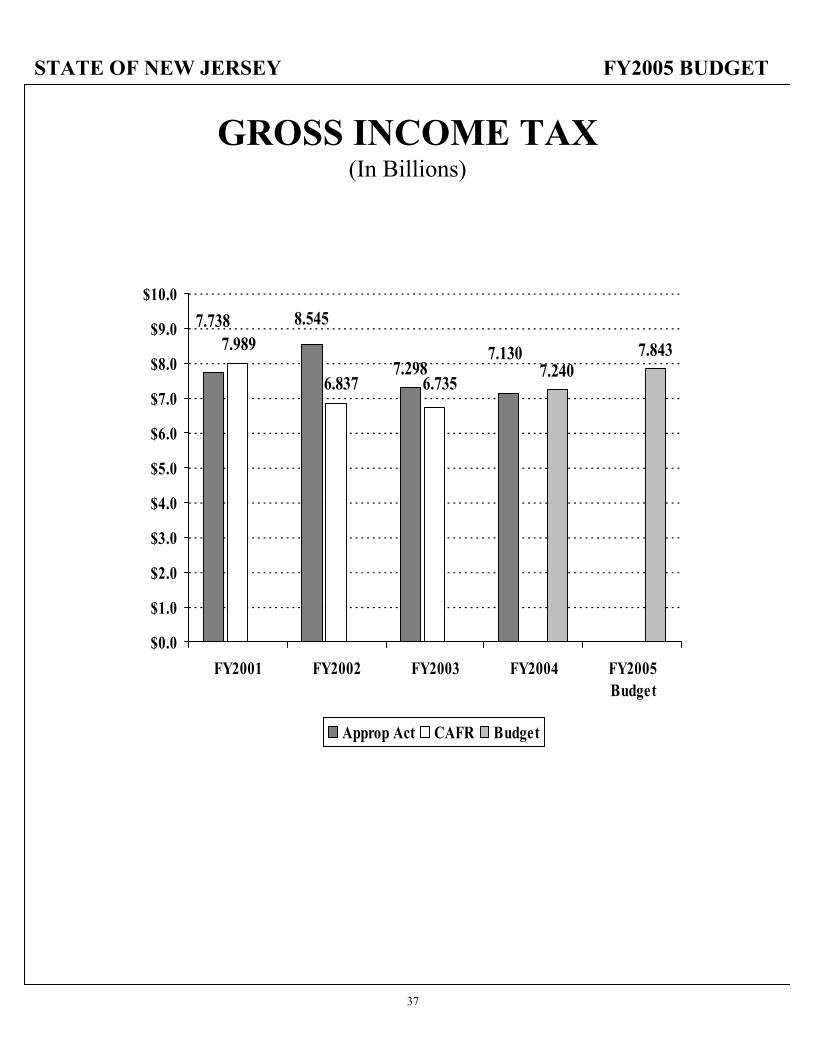
STATE OF NEW JERSEY FY2005 BUDGET
7.298 7.2407.843
8.5457.738
7.1307.989
6.837 6.735
$0.0
$1.0
$2.0
$3.0
$4.0
$5.0
$6.0
$7.0
$8.0
$9.0
$10.0
FY2001 FY2002 FY2003 FY2004 FY2005Budget
Approp Act CAFR Budget
GROSS INCOME TAX(In Billions)
37
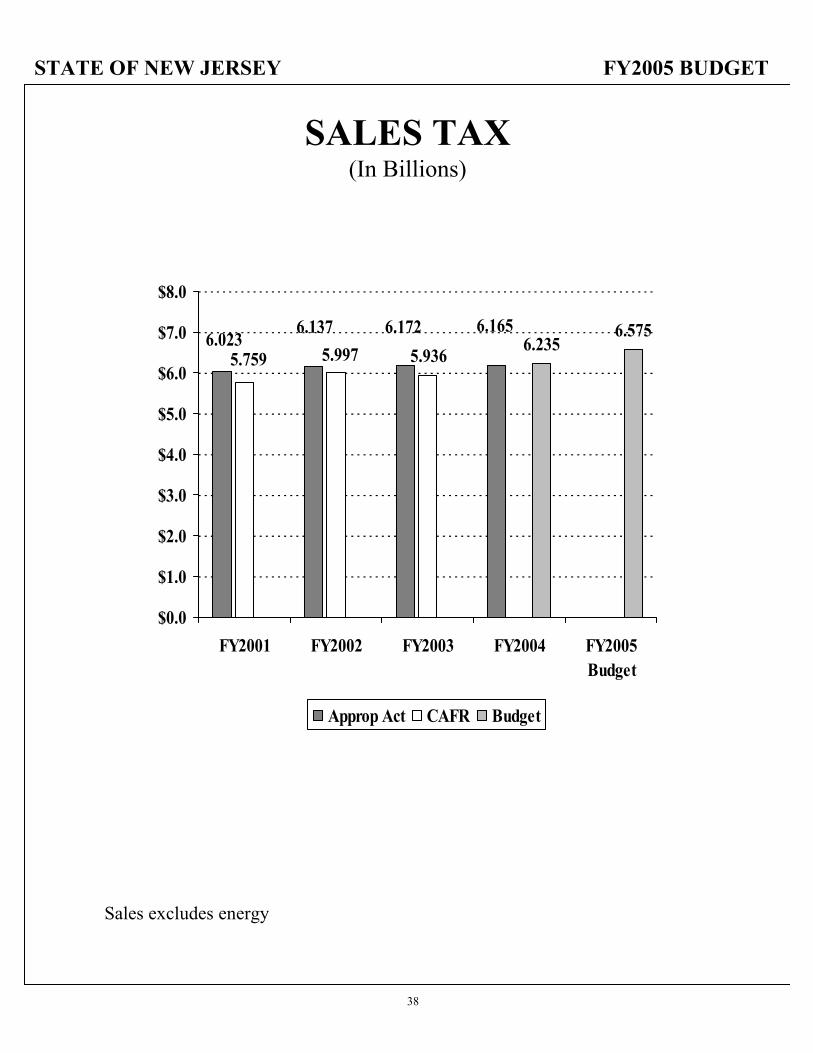
STATE OF NEW JERSEY FY2005 BUDGET
6.2356.5756.1726.137 6.165
6.0235.997 5.9365.759
$0.0
$1.0
$2.0
$3.0
$4.0
$5.0
$6.0
$7.0
$8.0
FY2001 FY2002 FY2003 FY2004 FY2005Budget
Approp Act CAFR Budget
SALES TAX(In Billions)
Sales excludes energy
38
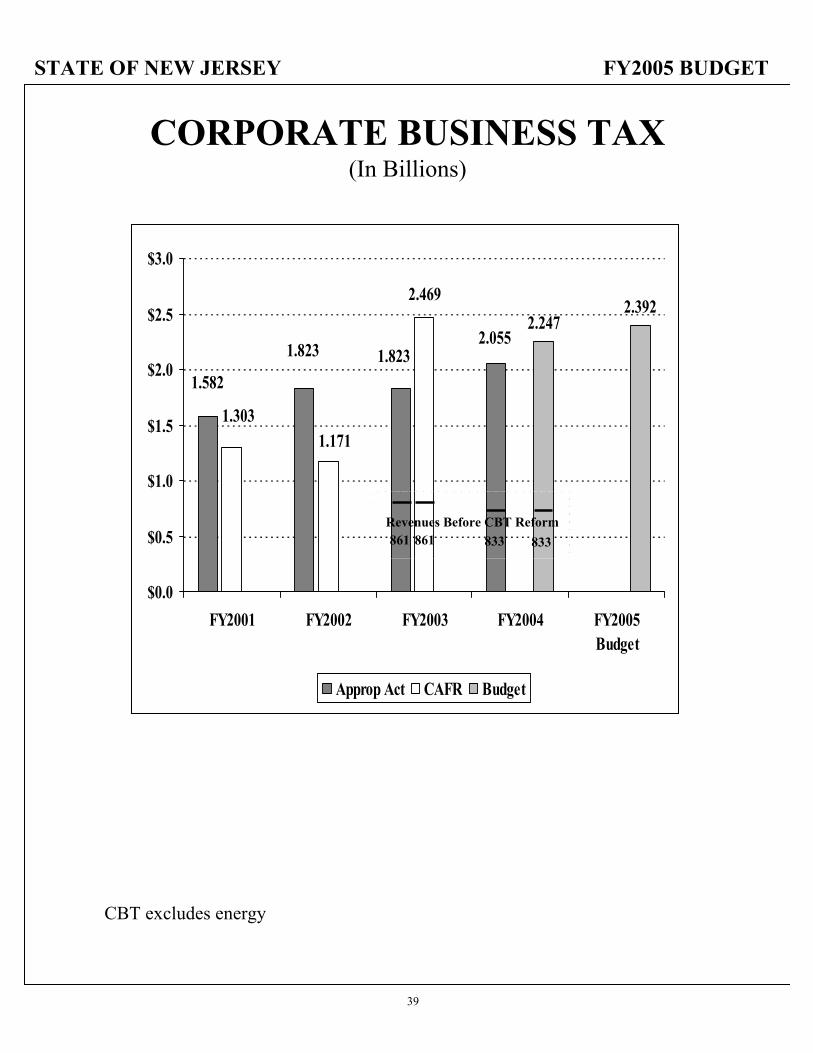
STATE OF NEW JERSEY FY2005 BUDGET
2.2472.392
1.8231.8232.055
1.582
1.171
2.469
1.303
$0.0
$0.5
$1.0
$1.5
$2.0
$2.5
$3.0
FY2001 FY2002 FY2003 FY2004 FY2005Budget
Approp Act CAFR Budget
CORPORATE BUSINESS TAX(In Billions)
CBT excludes energy
861 861 833 833Revenues Before CBT Reform
39
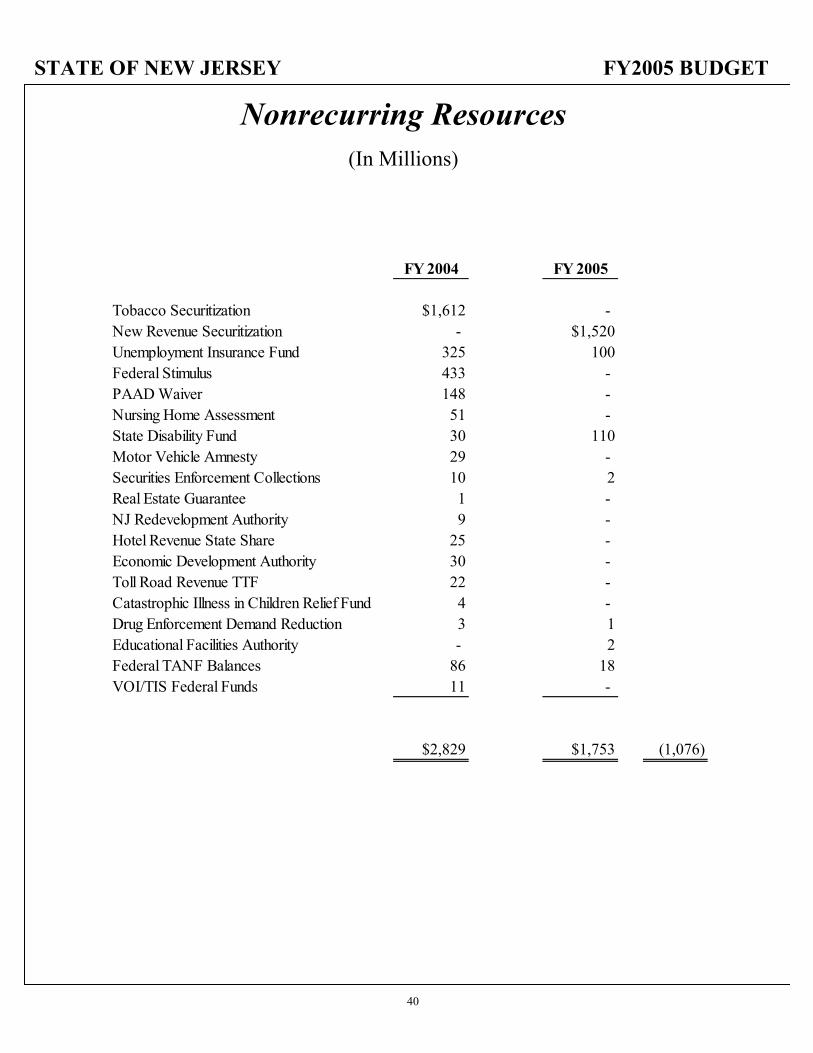
STATE OF NEW JERSEY FY2005 BUDGET
Nonrecurring Resources(In Millions)
FY 2004 FY 2005
Tobacco Securitization $1,612 - New Revenue Securitization - $1,520Unemployment Insurance Fund 325 100Federal Stimulus 433 - PAAD Waiver 148 - Nursing Home Assessment 51 - State Disability Fund 30 110Motor Vehicle Amnesty 29 - Securities Enforcement Collections 10 2Real Estate Guarantee 1 - NJ Redevelopment Authority 9 - Hotel Revenue State Share 25 - Economic Development Authority 30 - Toll Road Revenue TTF 22 - Catastrophic Illness in Children Relief Fund 4 - Drug Enforcement Demand Reduction 3 1Educational Facilities Authority - 2Federal TANF Balances 86 18VOI/TIS Federal Funds 11 -
$2,829 $1,753 (1,076)
40
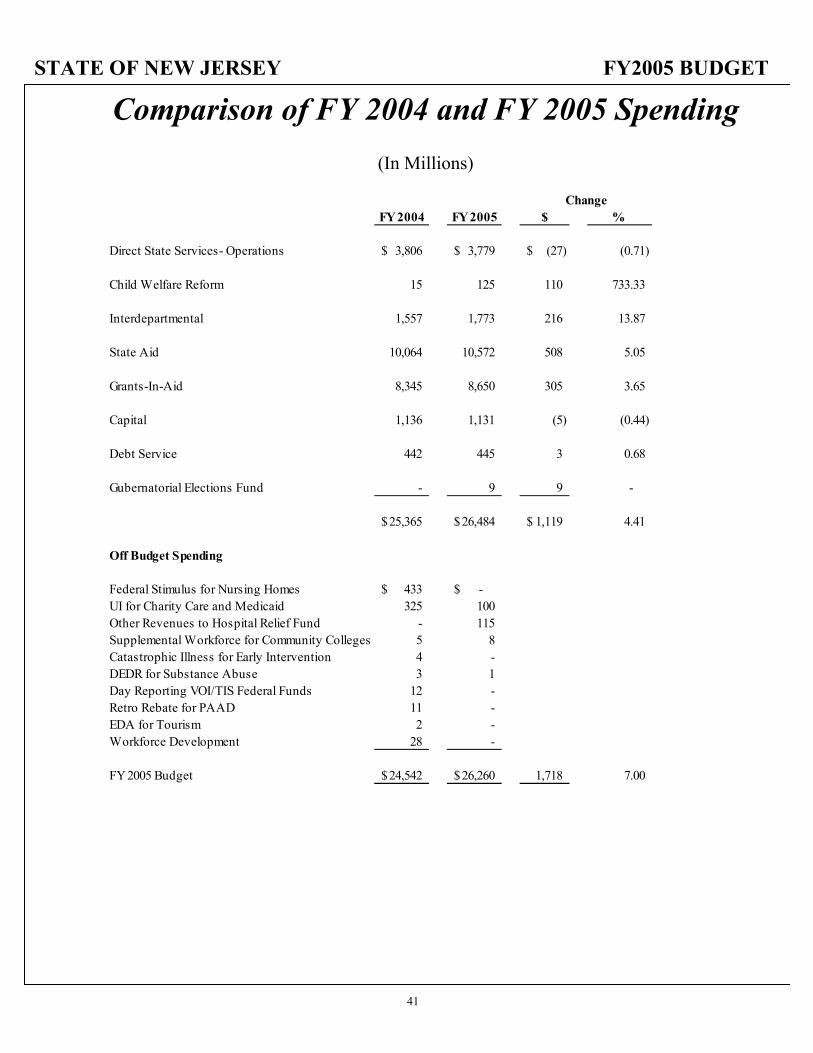
STATE OF NEW JERSEY FY2005 BUDGET
FY 2004 FY 2005 $ %
Direct State Services- Operations 3,806$ 3,779$ (27)$ (0.71)
Child Welfare Reform 15 125 110 733.33
Interdepartmental 1,557 1,773 216 13.87
State Aid 10,064 10,572 508 5.05
Grants-In-Aid 8,345 8,650 305 3.65
Capital 1,136 1,131 (5) (0.44)
Debt Service 442 445 3 0.68
Gubernatorial Elections Fund - 9 9 -
25,365$ 26,484$ 1,119$ 4.41
Federal Stimulus for Nursing Homes 433$ -$ UI for Charity Care and Medicaid 325 100 Other Revenues to Hospital Relief Fund - 115 Supplemental Workforce for Community Colleges 5 8 Catastrophic Illness for Early Intervention 4 - DEDR for Substance Abuse 3 1 Day Reporting VOI/TIS Federal Funds 12 - Retro Rebate for PAAD 11 - EDA for Tourism 2 - Workforce Development 28 -
FY 2005 Budget 24,542$ 26,260$ 1,718 7.00
Off Budget Spending
Change
Comparison of FY 2004 and FY 2005 Spending(In Millions)
41
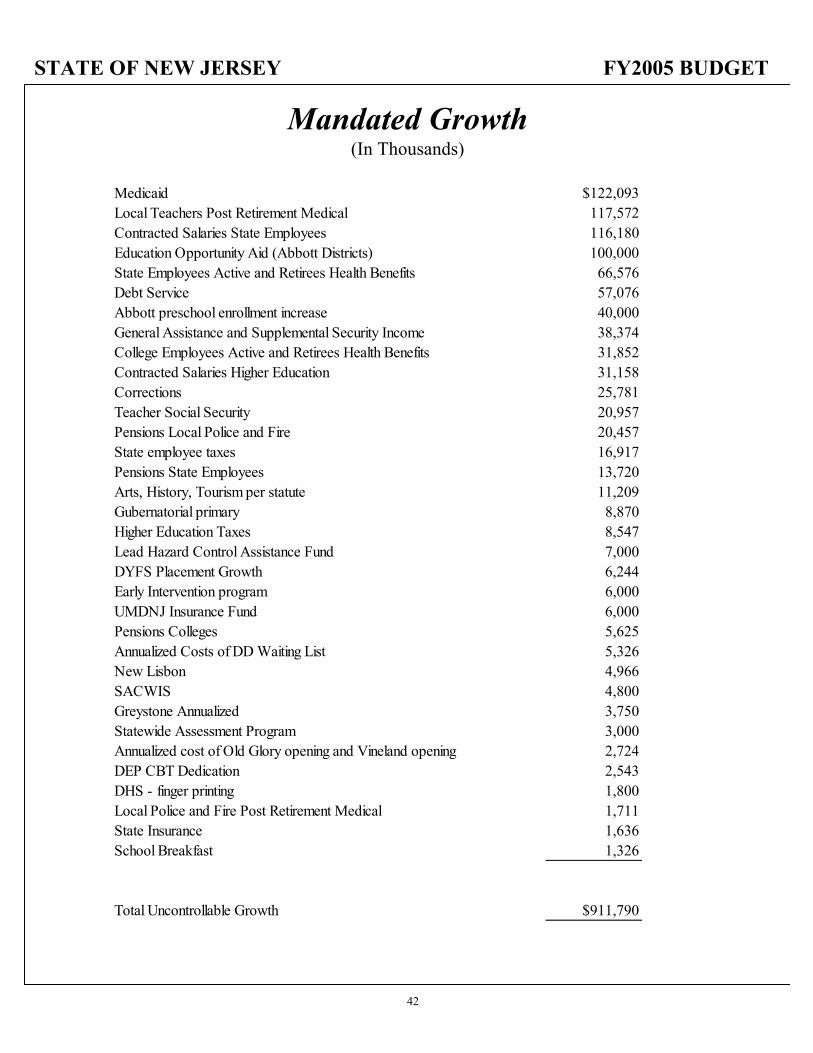
STATE OF NEW JERSEY FY2005 BUDGET
Medicaid $122,093Local Teachers Post Retirement Medical 117,572Contracted Salaries State Employees 116,180Education Opportunity Aid (Abbott Districts) 100,000State Employees Active and Retirees Health Benefits 66,576Debt Service 57,076Abbott preschool enrollment increase 40,000General Assistance and Supplemental Security Income 38,374College Employees Active and Retirees Health Benefits 31,852Contracted Salaries Higher Education 31,158Corrections 25,781Teacher Social Security 20,957Pensions Local Police and Fire 20,457State employee taxes 16,917Pensions State Employees 13,720Arts, History, Tourism per statute 11,209Gubernatorial primary 8,870Higher Education Taxes 8,547Lead Hazard Control Assistance Fund 7,000DYFS Placement Growth 6,244Early Intervention program 6,000UMDNJ Insurance Fund 6,000Pensions Colleges 5,625Annualized Costs of DD Waiting List 5,326New Lisbon 4,966SACWIS 4,800Greystone Annualized 3,750Statewide Assessment Program 3,000Annualized cost of Old Glory opening and Vineland opening 2,724DEP CBT Dedication 2,543DHS - finger printing 1,800Local Police and Fire Post Retirement Medical 1,711State Insurance 1,636School Breakfast 1,326
Total Uncontrollable Growth $911,790
Mandated Growth(In Thousands)
42
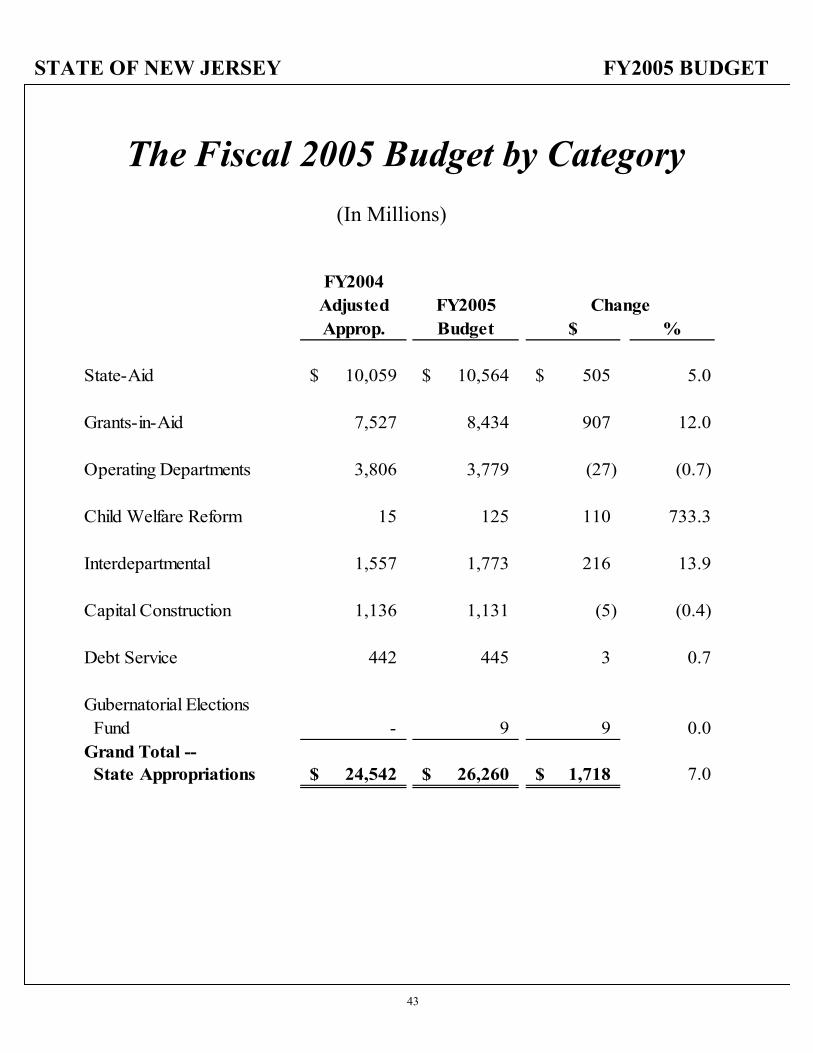
STATE OF NEW JERSEY FY2005 BUDGET
FY2004Adjusted FY2005Approp. Budget $ %
State-Aid 10,059$ 10,564$ 505$ 5.0
Grants-in-Aid 7,527 8,434 907 12.0
Operating Departments 3,806 3,779 (27) (0.7)
Child Welfare Reform 15 125 110 733.3
Interdepartmental 1,557 1,773 216 13.9
Capital Construction 1,136 1,131 (5) (0.4)
Debt Service 442 445 3 0.7
Gubernatorial Elections Fund - 9 9 0.0Grand Total -- State Appropriations 24,542$ 26,260$ 1,718$ 7.0
Change
The Fiscal 2005 Budget by Category(In Millions)
43
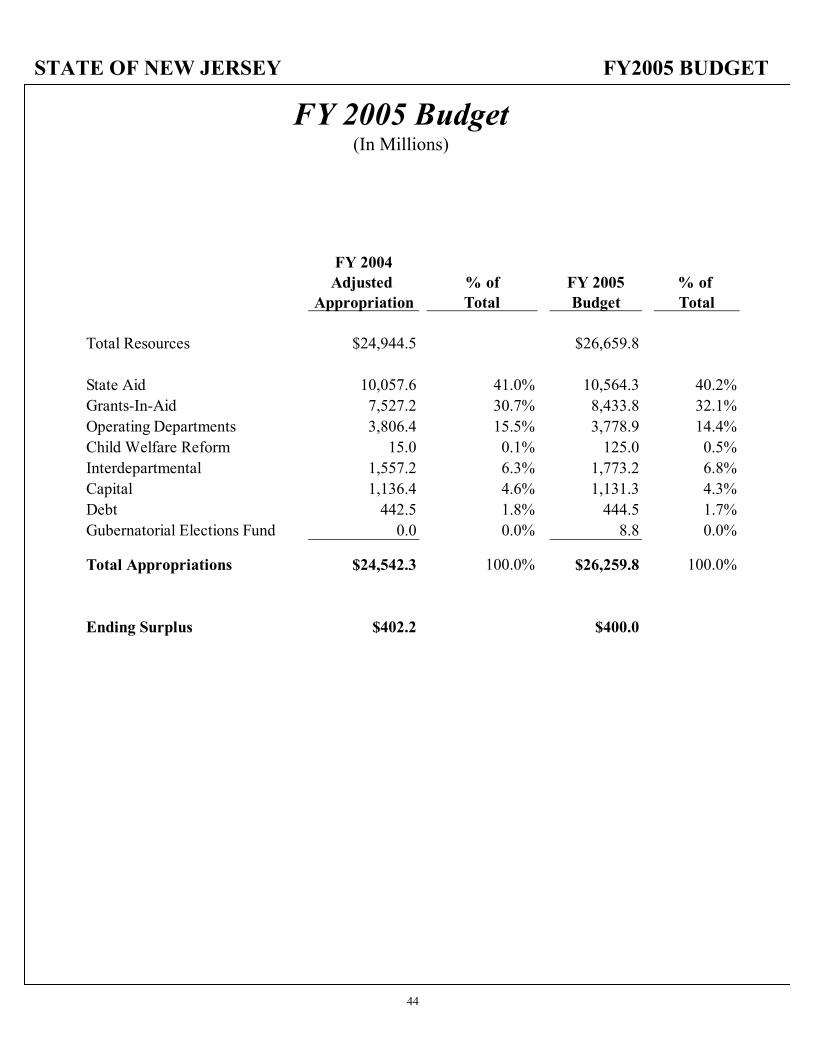
STATE OF NEW JERSEY FY2005 BUDGET
FY 2004Adjusted % of FY 2005 % of
Appropriation Total Budget Total
Total Resources $24,944.5 $26,659.8
State Aid 10,057.6 41.0% 10,564.3 40.2%Grants-In-Aid 7,527.2 30.7% 8,433.8 32.1%Operating Departments 3,806.4 15.5% 3,778.9 14.4%Child Welfare Reform 15.0 0.1% 125.0 0.5%Interdepartmental 1,557.2 6.3% 1,773.2 6.8%Capital 1,136.4 4.6% 1,131.3 4.3%Debt 442.5 1.8% 444.5 1.7%Gubernatorial Elections Fund 0.0 0.0% 8.8 0.0%
Total Appropriations $24,542.3 100.0% $26,259.8 100.0%
Ending Surplus $402.2 $400.0
FY 2005 Budget(In Millions)
44
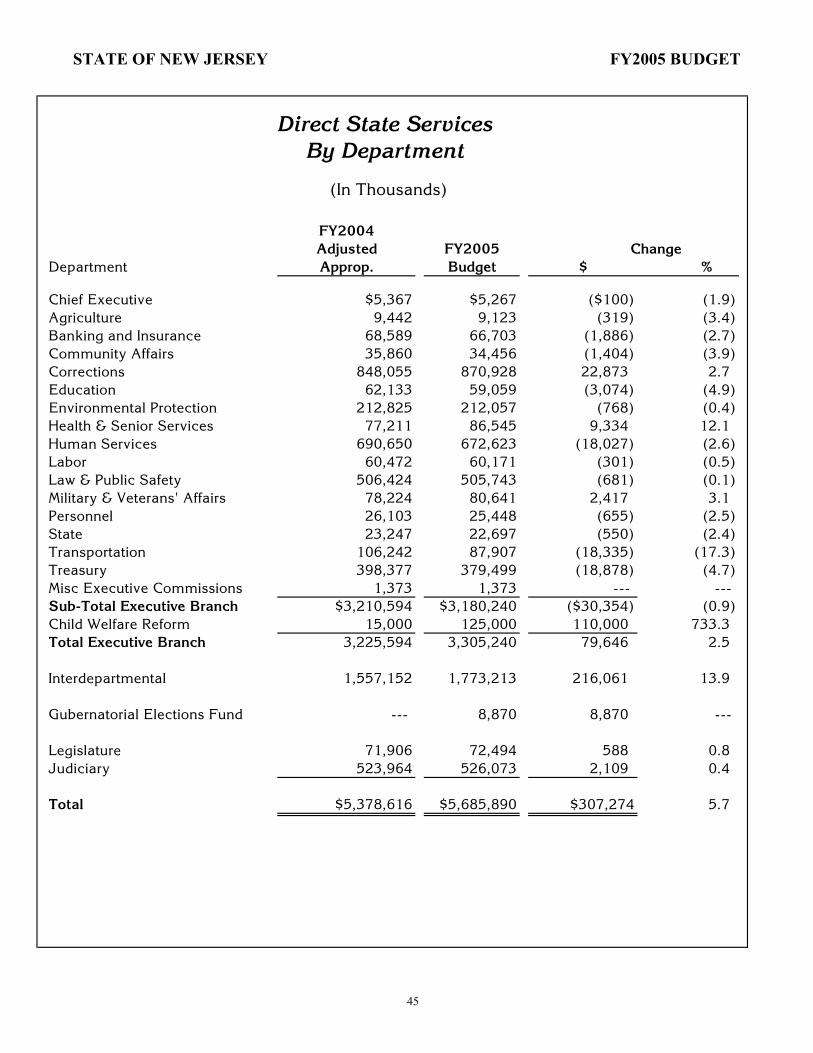
STATE OF NEW JERSEY FY2005 BUDGET
FY2004Adjusted FY2005 Change
Department Approp. Budget $ %
Chief Executive $5,367 $5,267 ($100) (1.9)Agriculture 9,442 9,123 (319) (3.4)Banking and Insurance 68,589 66,703 (1,886) (2.7)Community Affairs 35,860 34,456 (1,404) (3.9)Corrections 848,055 870,928 22,873 2.7Education 62,133 59,059 (3,074) (4.9)Environmental Protection 212,825 212,057 (768) (0.4)Health & Senior Services 77,211 86,545 9,334 12.1Human Services 690,650 672,623 (18,027) (2.6)Labor 60,472 60,171 (301) (0.5)Law & Public Safety 506,424 505,743 (681) (0.1)Military & Veterans' Affairs 78,224 80,641 2,417 3.1Personnel 26,103 25,448 (655) (2.5)State 23,247 22,697 (550) (2.4)Transportation 106,242 87,907 (18,335) (17.3)Treasury 398,377 379,499 (18,878) (4.7)Misc Executive Commissions 1,373 1,373 --- --- Sub-Total Executive Branch $3,210,594 $3,180,240 ($30,354) (0.9)Child Welfare Reform 15,000 125,000 110,000 733.3Total Executive Branch 3,225,594 3,305,240 79,646 2.5
Interdepartmental 1,557,152 1,773,213 216,061 13.9
Gubernatorial Elections Fund --- 8,870 8,870 ---
Legislature 71,906 72,494 588 0.8Judiciary 523,964 526,073 2,109 0.4
Total $5,378,616 $5,685,890 $307,274 5.7
Direct State ServicesBy Department
(In Thousands)
45
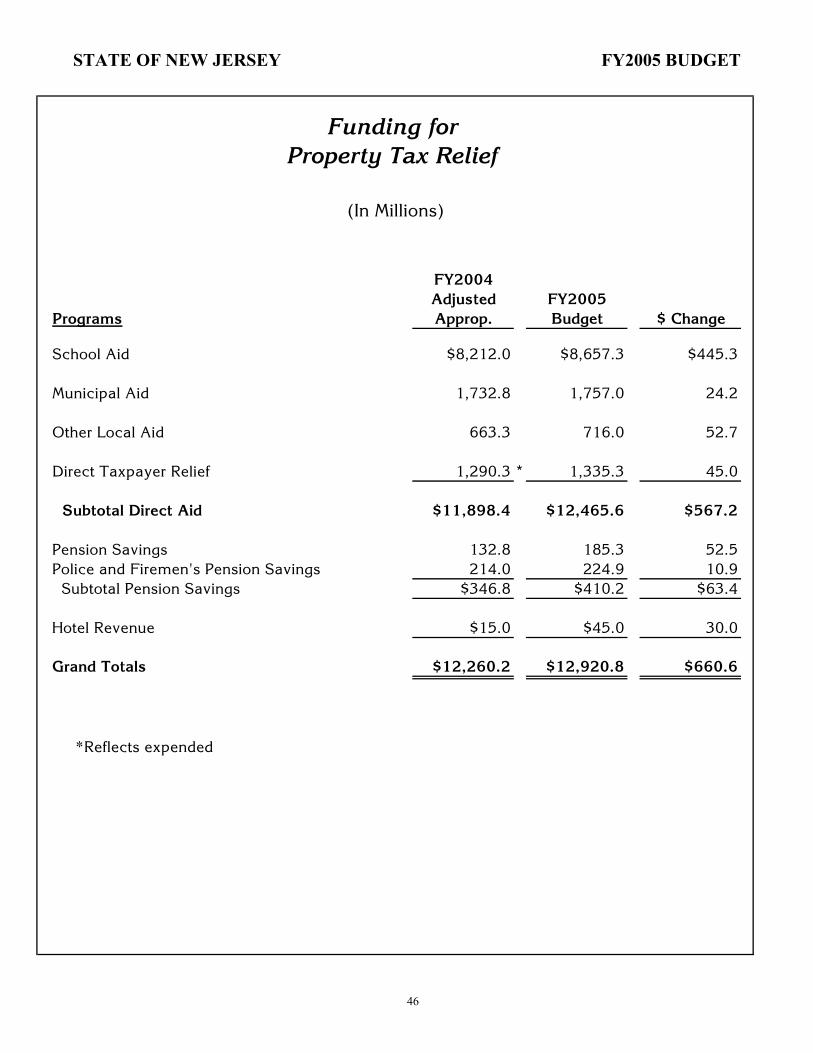
STATE OF NEW JERSEY FY2005 BUDGET
FY2004Adjusted FY2005
Programs Approp. Budget $ Change
School Aid $8,212.0 $8,657.3 $445.3 Municipal Aid 1,732.8 1,757.0 24.2 Other Local Aid 663.3 716.0 52.7 Direct Taxpayer Relief 1,290.3 * 1,335.3 45.0 Subtotal Direct Aid $11,898.4 $12,465.6 $567.2 Pension Savings 132.8 185.3 52.5Police and Firemen's Pension Savings 214.0 224.9 10.9 Subtotal Pension Savings $346.8 $410.2 $63.4
Hotel Revenue $15.0 $45.0 30.0 Grand Totals $12,260.2 $12,920.8 $660.6
*Reflects expended
Funding for
(In Millions)
Property Tax Relief
46
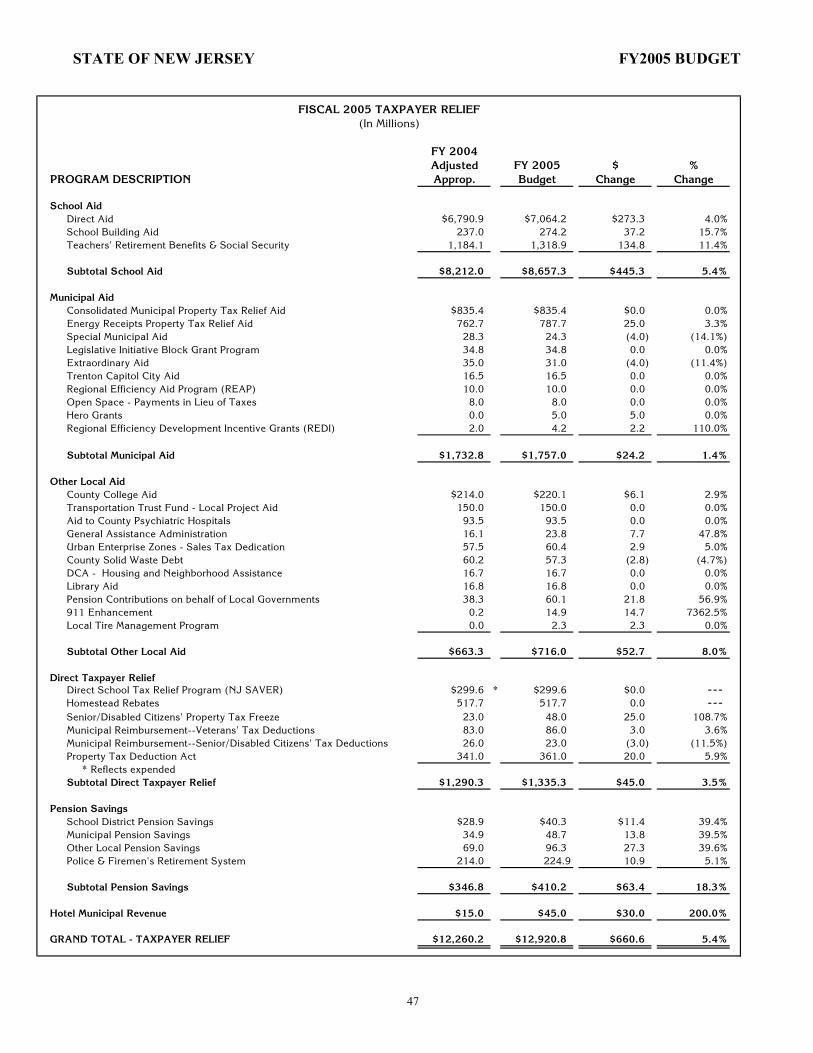
STATE OF NEW JERSEY FY2005 BUDGET
FY 2004Adjusted FY 2005 $ %
PROGRAM DESCRIPTION Approp. Budget Change Change
School Aid Direct Aid $6,790.9 $7,064.2 $273.3 4.0%School Building Aid 237.0 274.2 37.2 15.7%Teachers' Retirement Benefits & Social Security 1,184.1 1,318.9 134.8 11.4%
Subtotal School Aid $8,212.0 $8,657.3 $445.3 5.4%
Municipal Aid Consolidated Municipal Property Tax Relief Aid $835.4 $835.4 $0.0 0.0%Energy Receipts Property Tax Relief Aid 762.7 787.7 25.0 3.3%Special Municipal Aid 28.3 24.3 (4.0) (14.1%)Legislative Initiative Block Grant Program 34.8 34.8 0.0 0.0%Extraordinary Aid 35.0 31.0 (4.0) (11.4%)Trenton Capitol City Aid 16.5 16.5 0.0 0.0%Regional Efficiency Aid Program (REAP) 10.0 10.0 0.0 0.0%Open Space - Payments in Lieu of Taxes 8.0 8.0 0.0 0.0%Hero Grants 0.0 5.0 5.0 0.0%Regional Efficiency Development Incentive Grants (REDI) 2.0 4.2 2.2 110.0%
Subtotal Municipal Aid $1,732.8 $1,757.0 $24.2 1.4%
Other Local AidCounty College Aid $214.0 $220.1 $6.1 2.9%Transportation Trust Fund - Local Project Aid 150.0 150.0 0.0 0.0%Aid to County Psychiatric Hospitals 93.5 93.5 0.0 0.0%General Assistance Administration 16.1 23.8 7.7 47.8%Urban Enterprise Zones - Sales Tax Dedication 57.5 60.4 2.9 5.0%County Solid Waste Debt 60.2 57.3 (2.8) (4.7%)DCA - Housing and Neighborhood Assistance 16.7 16.7 0.0 0.0%Library Aid 16.8 16.8 0.0 0.0%Pension Contributions on behalf of Local Governments 38.3 60.1 21.8 56.9%911 Enhancement 0.2 14.9 14.7 7362.5%Local Tire Management Program 0.0 2.3 2.3 0.0%
Subtotal Other Local Aid $663.3 $716.0 $52.7 8.0%
Direct Taxpayer ReliefDirect School Tax Relief Program (NJ SAVER) $299.6 * $299.6 $0.0 --- Homestead Rebates 517.7 517.7 0.0 --- Senior/Disabled Citizens' Property Tax Freeze 23.0 48.0 25.0 108.7%Municipal Reimbursement--Veterans' Tax Deductions 83.0 86.0 3.0 3.6%Municipal Reimbursement--Senior/Disabled Citizens' Tax Deductions 26.0 23.0 (3.0) (11.5%)Property Tax Deduction Act 341.0 361.0 20.0 5.9% * Reflects expended Subtotal Direct Taxpayer Relief $1,290.3 $1,335.3 $45.0 3.5%
Pension SavingsSchool District Pension Savings $28.9 $40.3 $11.4 39.4%Municipal Pension Savings 34.9 48.7 13.8 39.5%Other Local Pension Savings 69.0 96.3 27.3 39.6%Police & Firemen's Retirement System 214.0 224.9 10.9 5.1%
Subtotal Pension Savings $346.8 $410.2 $63.4 18.3%
Hotel Municipal Revenue $15.0 $45.0 $30.0 200.0%
GRAND TOTAL - TAXPAYER RELIEF $12,260.2 $12,920.8 $660.6 5.4%
FISCAL 2005 TAXPAYER RELIEF(In Millions)
47
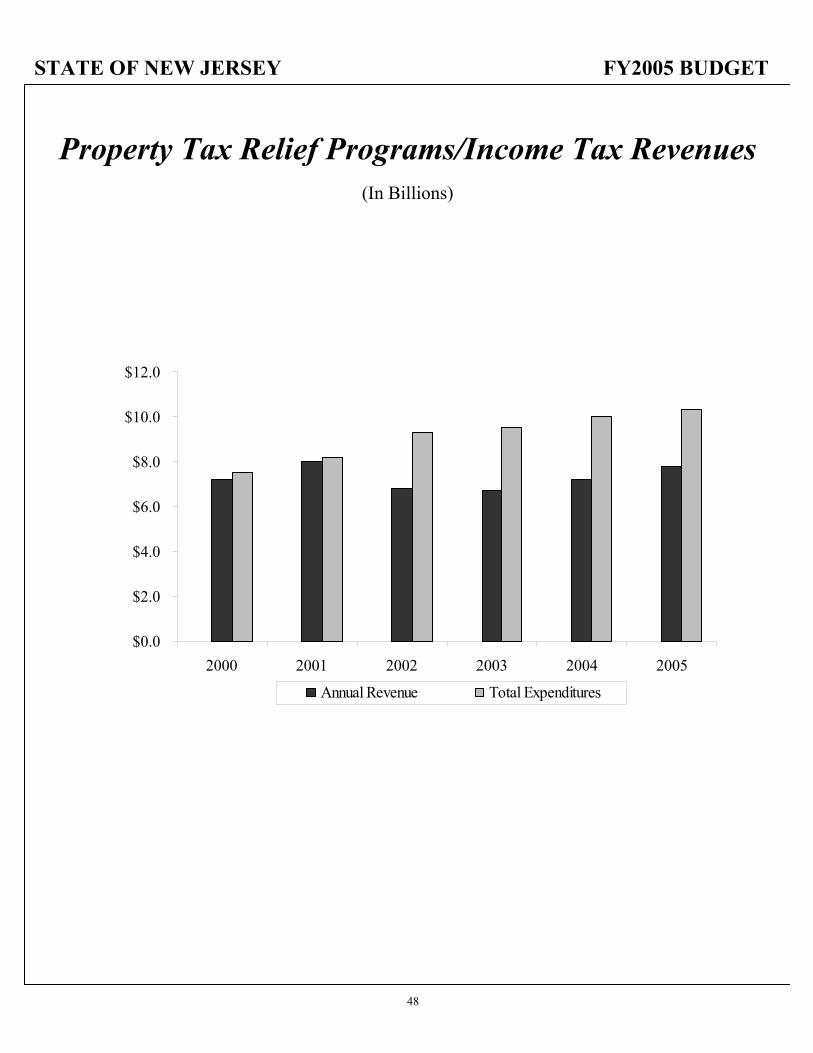
STATE OF NEW JERSEY FY2005 BUDGET
Property Tax Relief Programs/Income Tax Revenues(In Billions)
$0.0
$2.0
$4.0
$6.0
$8.0
$10.0
$12.0
2000 2001 2002 2003 2004 2005
Annual Revenue Total Expenditures
48
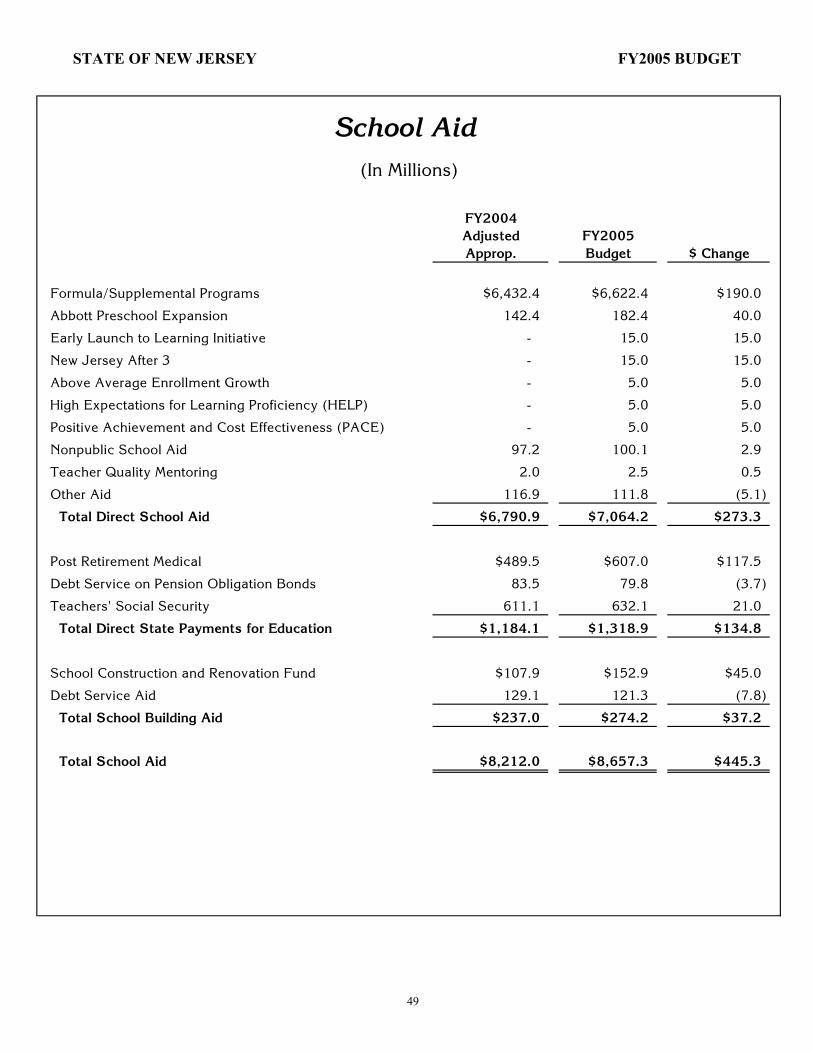
STATE OF NEW JERSEY FY2005 BUDGET
FY2004Adjusted FY2005
Approp. Budget $ Change
Formula/Supplemental Programs $6,432.4 $6,622.4 $190.0
Abbott Preschool Expansion 142.4 182.4 40.0
Early Launch to Learning Initiative - 15.0 15.0
New Jersey After 3 - 15.0 15.0
Above Average Enrollment Growth - 5.0 5.0
High Expectations for Learning Proficiency (HELP) - 5.0 5.0
Positive Achievement and Cost Effectiveness (PACE) - 5.0 5.0
Nonpublic School Aid 97.2 100.1 2.9
Teacher Quality Mentoring 2.0 2.5 0.5
Other Aid 116.9 111.8 (5.1)
Total Direct School Aid $6,790.9 $7,064.2 $273.3
Post Retirement Medical $489.5 $607.0 $117.5
Debt Service on Pension Obligation Bonds 83.5 79.8 (3.7)
Teachers' Social Security 611.1 632.1 21.0
Total Direct State Payments for Education $1,184.1 $1,318.9 $134.8
School Construction and Renovation Fund $107.9 $152.9 $45.0
Debt Service Aid 129.1 121.3 (7.8)
Total School Building Aid $237.0 $274.2 $37.2
Total School Aid $8,212.0 $8,657.3 $445.3
School Aid(In Millions)
49
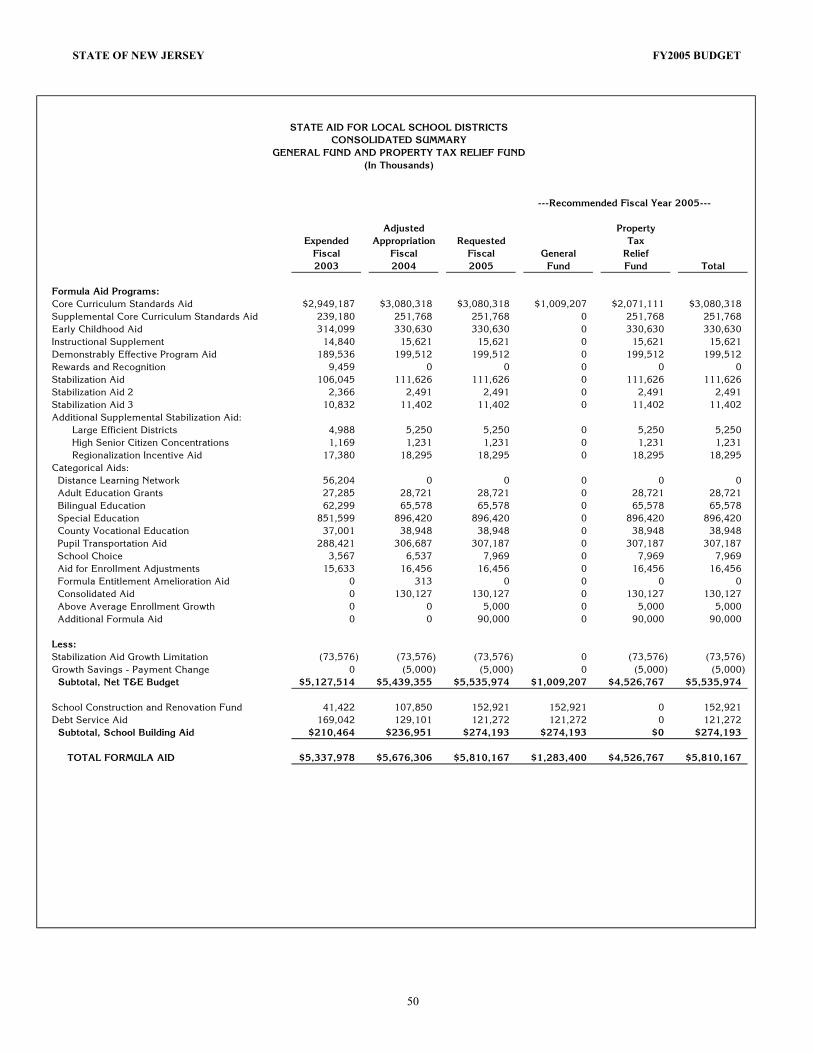
STATE OF NEW JERSEY FY2005 BUDGET
---Recommended Fiscal Year 2005---
Adjusted PropertyExpended Appropriation Requested Tax
Fiscal Fiscal Fiscal General Relief2003 2004 2005 Fund Fund Total
Formula Aid Programs:Core Curriculum Standards Aid $2,949,187 $3,080,318 $3,080,318 $1,009,207 $2,071,111 $3,080,318Supplemental Core Curriculum Standards Aid 239,180 251,768 251,768 0 251,768 251,768Early Childhood Aid 314,099 330,630 330,630 0 330,630 330,630Instructional Supplement 14,840 15,621 15,621 0 15,621 15,621Demonstrably Effective Program Aid 189,536 199,512 199,512 0 199,512 199,512Rewards and Recognition 9,459 0 0 0 0 0Stabilization Aid 106,045 111,626 111,626 0 111,626 111,626Stabilization Aid 2 2,366 2,491 2,491 0 2,491 2,491Stabilization Aid 3 10,832 11,402 11,402 0 11,402 11,402Additional Supplemental Stabilization Aid: Large Efficient Districts 4,988 5,250 5,250 0 5,250 5,250 High Senior Citizen Concentrations 1,169 1,231 1,231 0 1,231 1,231 Regionalization Incentive Aid 17,380 18,295 18,295 0 18,295 18,295Categorical Aids: Distance Learning Network 56,204 0 0 0 0 0 Adult Education Grants 27,285 28,721 28,721 0 28,721 28,721 Bilingual Education 62,299 65,578 65,578 0 65,578 65,578 Special Education 851,599 896,420 896,420 0 896,420 896,420 County Vocational Education 37,001 38,948 38,948 0 38,948 38,948 Pupil Transportation Aid 288,421 306,687 307,187 0 307,187 307,187 School Choice 3,567 6,537 7,969 0 7,969 7,969 Aid for Enrollment Adjustments 15,633 16,456 16,456 0 16,456 16,456 Formula Entitlement Amelioration Aid 0 313 0 0 0 0 Consolidated Aid 0 130,127 130,127 0 130,127 130,127 Above Average Enrollment Growth 0 0 5,000 0 5,000 5,000 Additional Formula Aid 0 0 90,000 0 90,000 90,000
Less:Stabilization Aid Growth Limitation (73,576) (73,576) (73,576) 0 (73,576) (73,576)Growth Savings - Payment Change 0 (5,000) (5,000) 0 (5,000) (5,000) Subtotal, Net T&E Budget $5,127,514 $5,439,355 $5,535,974 $1,009,207 $4,526,767 $5,535,974
School Construction and Renovation Fund 41,422 107,850 152,921 152,921 0 152,921Debt Service Aid 169,042 129,101 121,272 121,272 0 121,272 Subtotal, School Building Aid $210,464 $236,951 $274,193 $274,193 $0 $274,193
TOTAL FORMULA AID $5,337,978 $5,676,306 $5,810,167 $1,283,400 $4,526,767 $5,810,167
STATE AID FOR LOCAL SCHOOL DISTRICTSCONSOLIDATED SUMMARY
GENERAL FUND AND PROPERTY TAX RELIEF FUND(In Thousands)
50
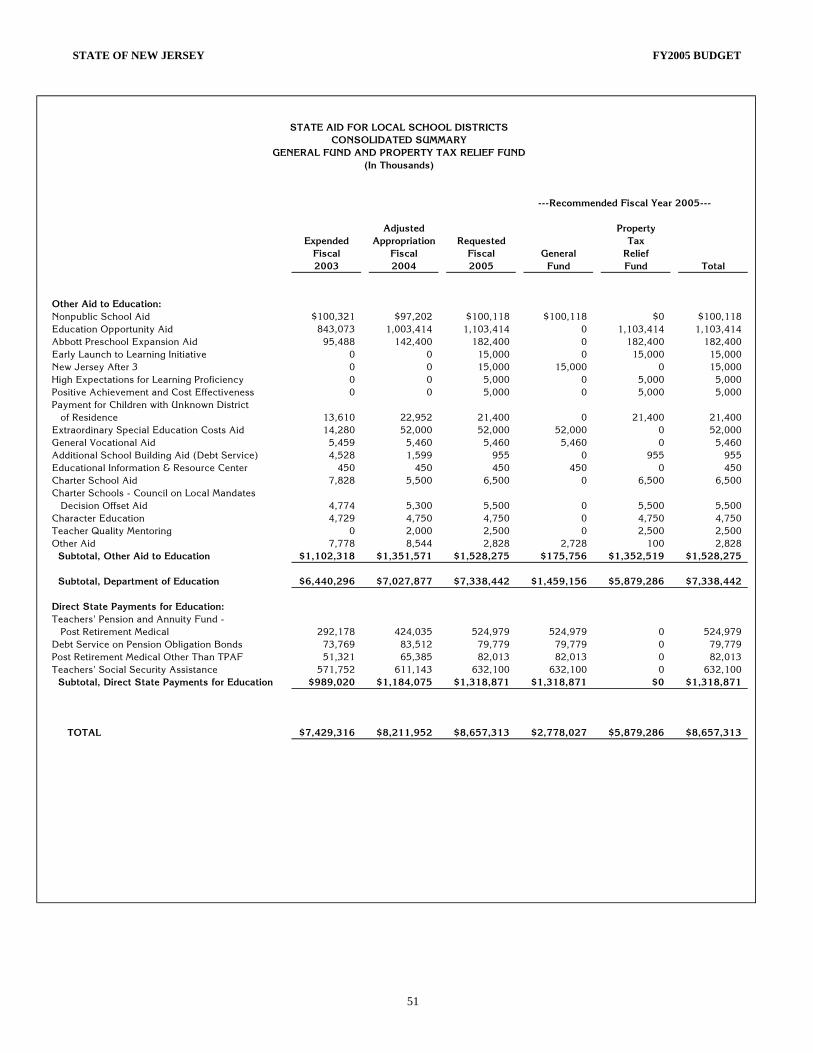
STATE OF NEW JERSEY FY2005 BUDGET
---Recommended Fiscal Year 2005---
Adjusted PropertyExpended Appropriation Requested Tax
Fiscal Fiscal Fiscal General Relief2003 2004 2005 Fund Fund Total
STATE AID FOR LOCAL SCHOOL DISTRICTSCONSOLIDATED SUMMARY
GENERAL FUND AND PROPERTY TAX RELIEF FUND(In Thousands)
Other Aid to Education:Nonpublic School Aid $100,321 $97,202 $100,118 $100,118 $0 $100,118Education Opportunity Aid 843,073 1,003,414 1,103,414 0 1,103,414 1,103,414Abbott Preschool Expansion Aid 95,488 142,400 182,400 0 182,400 182,400Early Launch to Learning Initiative 0 0 15,000 0 15,000 15,000New Jersey After 3 0 0 15,000 15,000 0 15,000High Expectations for Learning Proficiency 0 0 5,000 0 5,000 5,000Positive Achievement and Cost Effectiveness 0 0 5,000 0 5,000 5,000Payment for Children with Unknown District of Residence 13,610 22,952 21,400 0 21,400 21,400Extraordinary Special Education Costs Aid 14,280 52,000 52,000 52,000 0 52,000General Vocational Aid 5,459 5,460 5,460 5,460 0 5,460Additional School Building Aid (Debt Service) 4,528 1,599 955 0 955 955Educational Information & Resource Center 450 450 450 450 0 450Charter School Aid 7,828 5,500 6,500 0 6,500 6,500Charter Schools - Council on Local Mandates Decision Offset Aid 4,774 5,300 5,500 0 5,500 5,500Character Education 4,729 4,750 4,750 0 4,750 4,750Teacher Quality Mentoring 0 2,000 2,500 0 2,500 2,500Other Aid 7,778 8,544 2,828 2,728 100 2,828 Subtotal, Other Aid to Education $1,102,318 $1,351,571 $1,528,275 $175,756 $1,352,519 $1,528,275
Subtotal, Department of Education $6,440,296 $7,027,877 $7,338,442 $1,459,156 $5,879,286 $7,338,442 Direct State Payments for Education:Teachers' Pension and Annuity Fund - Post Retirement Medical 292,178 424,035 524,979 524,979 0 524,979Debt Service on Pension Obligation Bonds 73,769 83,512 79,779 79,779 0 79,779Post Retirement Medical Other Than TPAF 51,321 65,385 82,013 82,013 0 82,013Teachers' Social Security Assistance 571,752 611,143 632,100 632,100 0 632,100 Subtotal, Direct State Payments for Education $989,020 $1,184,075 $1,318,871 $1,318,871 $0 $1,318,871
TOTAL $7,429,316 $8,211,952 $8,657,313 $2,778,027 $5,879,286 $8,657,313
51
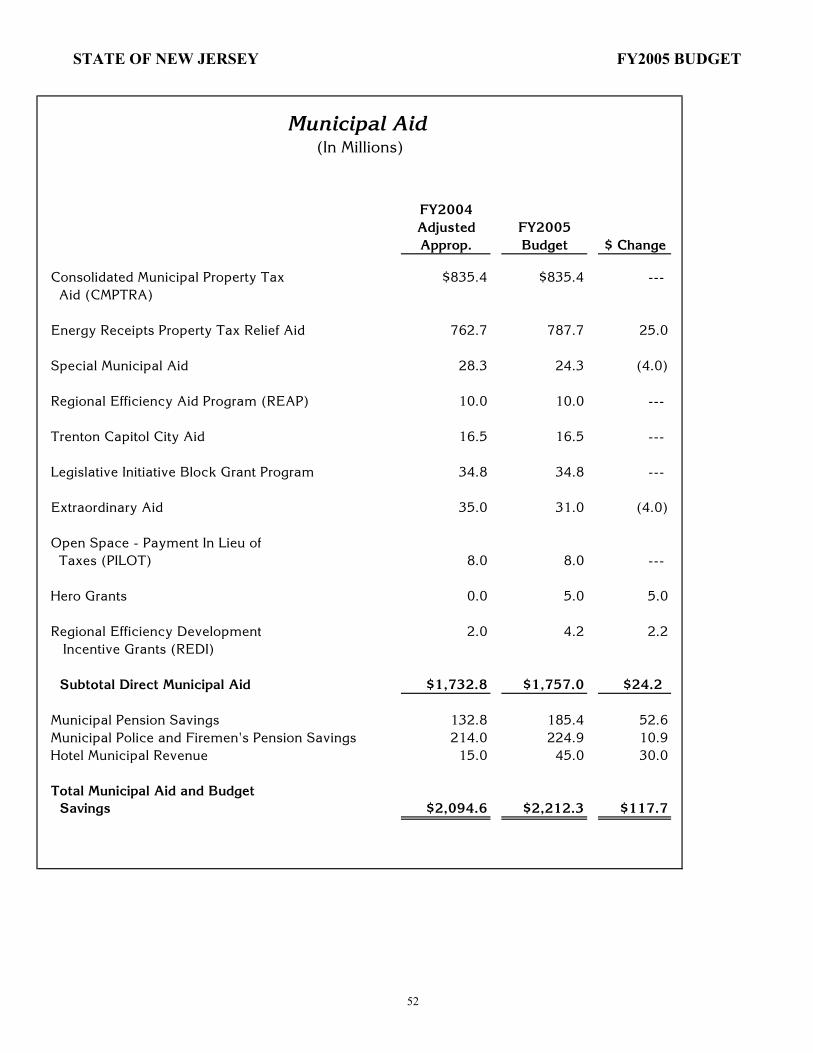
STATE OF NEW JERSEY FY2005 BUDGET
FY2004Adjusted FY2005
Approp. Budget $ Change
Consolidated Municipal Property Tax $835.4 $835.4 --- Aid (CMPTRA)
Energy Receipts Property Tax Relief Aid 762.7 787.7 25.0
Special Municipal Aid 28.3 24.3 (4.0)
Regional Efficiency Aid Program (REAP) 10.0 10.0 ---
Trenton Capitol City Aid 16.5 16.5 ---
Legislative Initiative Block Grant Program 34.8 34.8 ---
Extraordinary Aid 35.0 31.0 (4.0)
Open Space - Payment In Lieu of Taxes (PILOT) 8.0 8.0 ---
Hero Grants 0.0 5.0 5.0
Regional Efficiency Development 2.0 4.2 2.2 Incentive Grants (REDI)
Subtotal Direct Municipal Aid $1,732.8 $1,757.0 $24.2
Municipal Pension Savings 132.8 185.4 52.6Municipal Police and Firemen's Pension Savings 214.0 224.9 10.9Hotel Municipal Revenue 15.0 45.0 30.0
Total Municipal Aid and Budget Savings $2,094.6 $2,212.3 $117.7
Municipal Aid(In Millions)
52
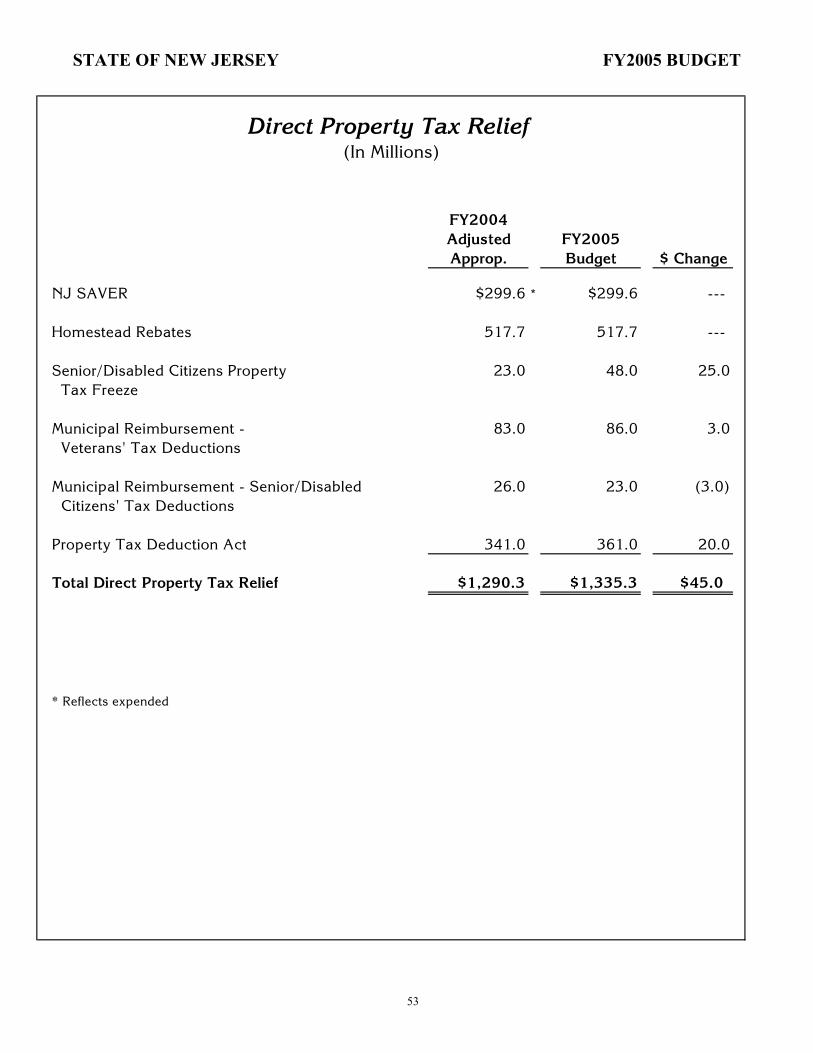
STATE OF NEW JERSEY FY2005 BUDGET
FY2004Adjusted FY2005
Approp. Budget $ Change
NJ SAVER $299.6 * $299.6 --- Homestead Rebates 517.7 517.7 --- Senior/Disabled Citizens Property 23.0 48.0 25.0 Tax Freeze
Municipal Reimbursement - 83.0 86.0 3.0 Veterans' Tax Deductions Municipal Reimbursement - Senior/Disabled 26.0 23.0 (3.0) Citizens' Tax Deductions
Property Tax Deduction Act 341.0 361.0 20.0
Total Direct Property Tax Relief $1,290.3 $1,335.3 $45.0
* Reflects expended
Direct Property Tax Relief(In Millions)
53
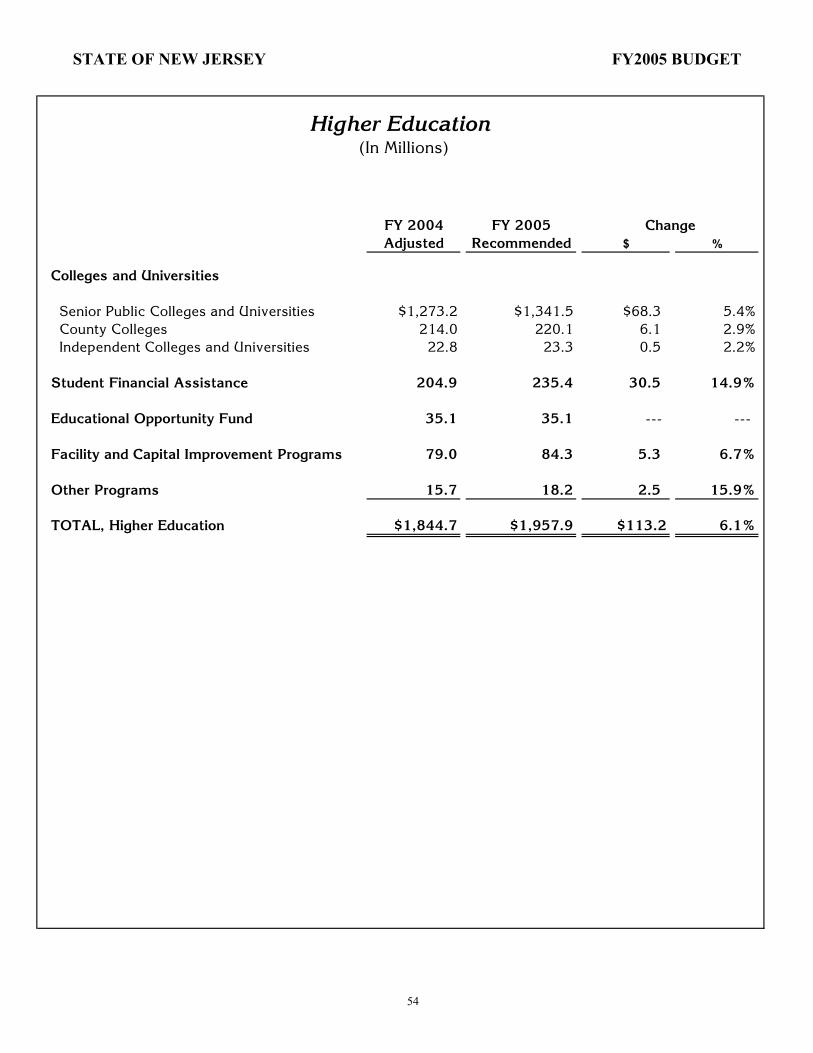
STATE OF NEW JERSEY FY2005 BUDGET
FY 2004 FY 2005 Adjusted Recommended $ %
Colleges and Universities Senior Public Colleges and Universities $1,273.2 $1,341.5 $68.3 5.4% County Colleges 214.0 220.1 6.1 2.9% Independent Colleges and Universities 22.8 23.3 0.5 2.2%
Student Financial Assistance 204.9 235.4 30.5 14.9% Educational Opportunity Fund 35.1 35.1 --- --- Facility and Capital Improvement Programs 79.0 84.3 5.3 6.7% Other Programs 15.7 18.2 2.5 15.9% TOTAL, Higher Education $1,844.7 $1,957.9 $113.2 6.1%
Higher Education(In Millions)
Change
54
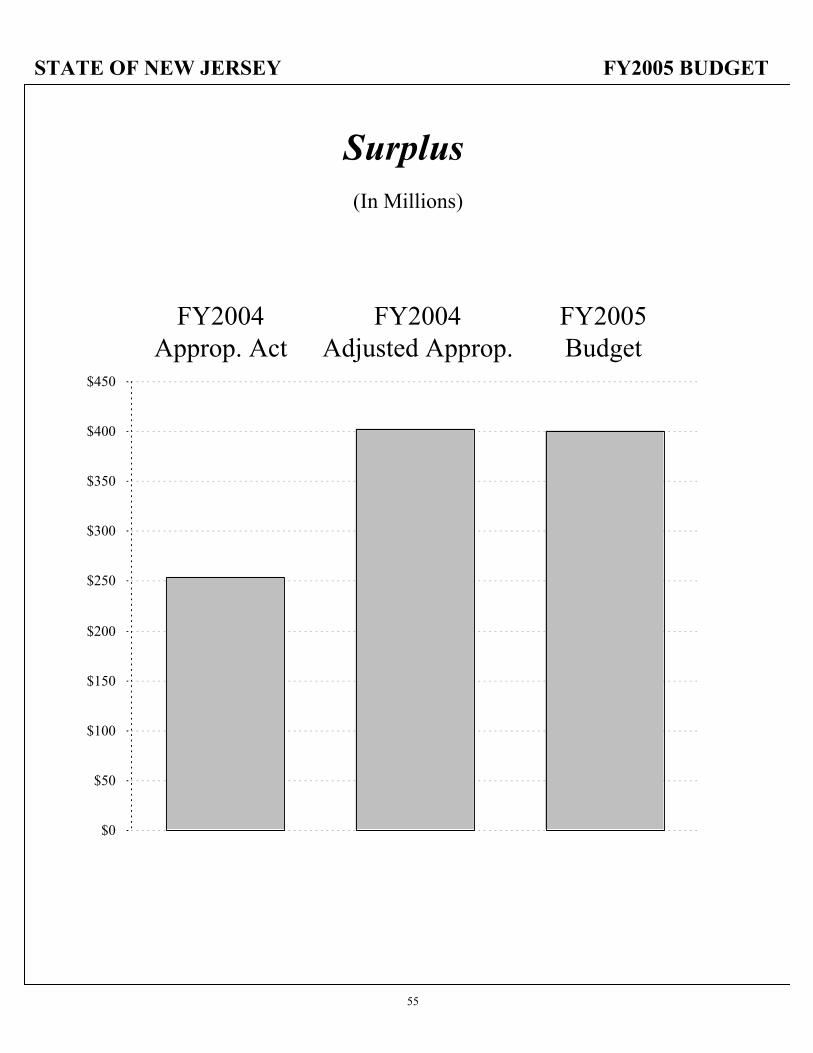
STATE OF NEW JERSEY FY2005 BUDGET
$0
$50
$100
$150
$200
$250
$300
$350
$400
$450
Surplus(In Millions)
FY2004Approp. Act
FY2004Adjusted Approp.
FY2005Budget
55
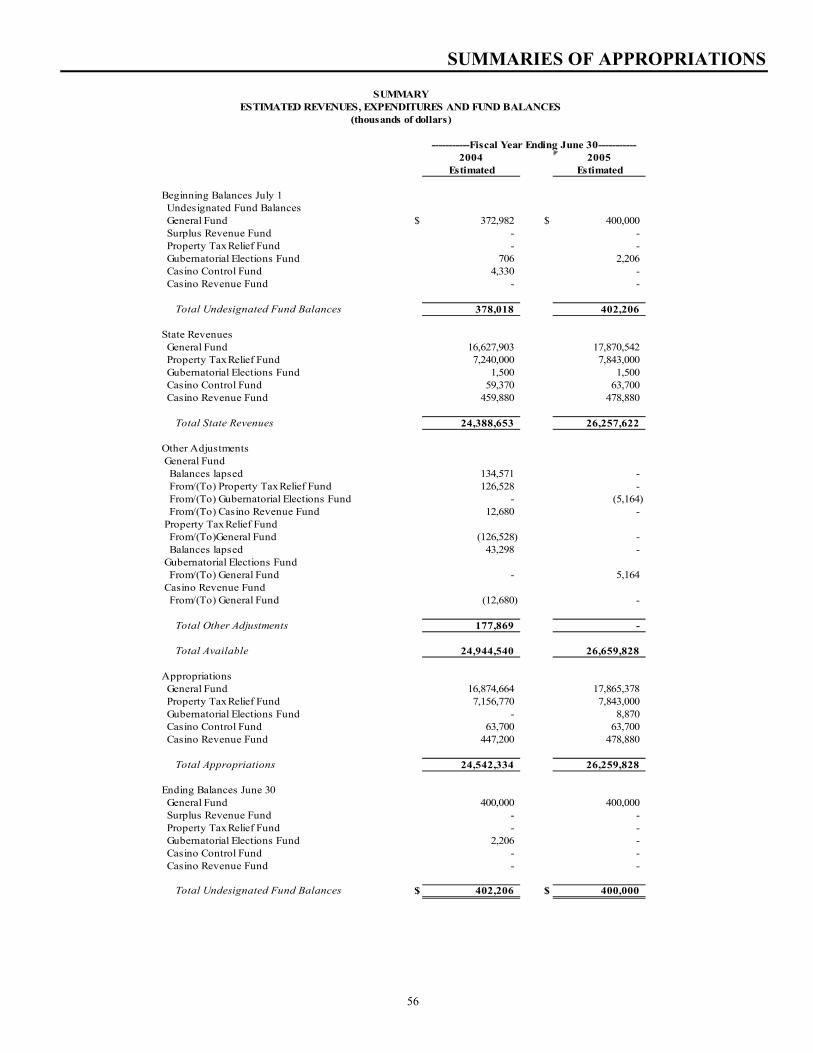
SUMMARIES OF APPROPRIATIONS
2004 2005Estimated Estimated
Beginning Balances July 1 Undesignated Fund Balances General Fund $ 372,982 $ 400,000 Surplus Revenue Fund - - Property Tax Relief Fund - - Gubernatorial Elections Fund 706 2,206 Casino Control Fund 4,330 - Casino Revenue Fund - -
Total Undesignated Fund Balances 378,018 402,206
State Revenues General Fund 16,627,903 17,870,542 Property Tax Relief Fund 7,240,000 7,843,000 Gubernatorial Elections Fund 1,500 1,500 Casino Control Fund 59,370 63,700 Casino Revenue Fund 459,880 478,880
Total State Revenues 24,388,653 26,257,622
Other Adjustments General Fund Balances lapsed 134,571 - From/(To) Property Tax Relief Fund 126,528 - From/(To) Gubernatorial Elections Fund - (5,164) From/(To) Casino Revenue Fund 12,680 - Property Tax Relief Fund From/(To)General Fund (126,528) - Balances lapsed 43,298 - Gubernatorial Elections Fund From/(To) General Fund - 5,164 Casino Revenue Fund From/(To) General Fund (12,680) -
Total Other Adjustments 177,869 -
Total Available 24,944,540 26,659,828 Appropriations General Fund 16,874,664 17,865,378 Property Tax Relief Fund 7,156,770 7,843,000 Gubernatorial Elections Fund - 8,870 Casino Control Fund 63,700 63,700 Casino Revenue Fund 447,200 478,880
Total Appropriations 24,542,334 26,259,828
Ending Balances June 30 General Fund 400,000 400,000 Surplus Revenue Fund - - Property Tax Relief Fund - - Gubernatorial Elections Fund 2,206 - Casino Control Fund - - Casino Revenue Fund - -
Total Undesignated Fund Balances $ 402,206 $ 400,000
-----------Fiscal Year Ending June 30-----------
SUMMARYESTIMATED REVENUES, EXPENDITURES AND FUND BALANCES
(thousands of dollars)
56
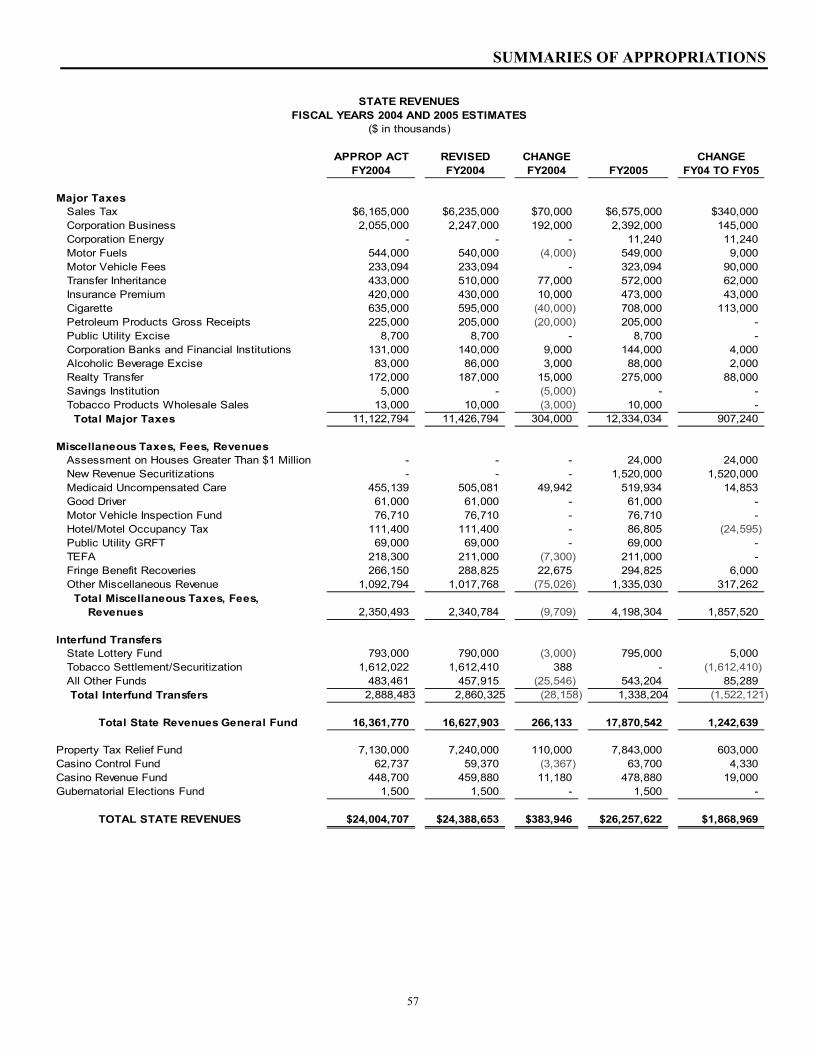
SUMMARIES OF APPROPRIATIONS
APPROP ACT REVISED CHANGE CHANGEFY2004 FY2004 FY2004 FY2005 FY04 TO FY05
Major Taxes Sales Tax $6,165,000 $6,235,000 $70,000 $6,575,000 $340,000 Corporation Business 2,055,000 2,247,000 192,000 2,392,000 145,000 Corporation Energy - - - 11,240 11,240 Motor Fuels 544,000 540,000 (4,000) 549,000 9,000 Motor Vehicle Fees 233,094 233,094 - 323,094 90,000 Transfer Inheritance 433,000 510,000 77,000 572,000 62,000 Insurance Premium 420,000 430,000 10,000 473,000 43,000 Cigarette 635,000 595,000 (40,000) 708,000 113,000 Petroleum Products Gross Receipts 225,000 205,000 (20,000) 205,000 - Public Utility Excise 8,700 8,700 - 8,700 - Corporation Banks and Financial Institutions 131,000 140,000 9,000 144,000 4,000 Alcoholic Beverage Excise 83,000 86,000 3,000 88,000 2,000 Realty Transfer 172,000 187,000 15,000 275,000 88,000 Savings Institution 5,000 - (5,000) - - Tobacco Products Wholesale Sales 13,000 10,000 (3,000) 10,000 - Total Major Taxes 11,122,794 11,426,794 304,000 12,334,034 907,240
Miscellaneous Taxes, Fees, Revenues Assessment on Houses Greater Than $1 Million - - - 24,000 24,000 New Revenue Securitizations - - - 1,520,000 1,520,000 Medicaid Uncompensated Care 455,139 505,081 49,942 519,934 14,853 Good Driver 61,000 61,000 - 61,000 - Motor Vehicle Inspection Fund 76,710 76,710 - 76,710 - Hotel/Motel Occupancy Tax 111,400 111,400 - 86,805 (24,595) Public Utility GRFT 69,000 69,000 - 69,000 - TEFA 218,300 211,000 (7,300) 211,000 - Fringe Benefit Recoveries 266,150 288,825 22,675 294,825 6,000 Other Miscellaneous Revenue 1,092,794 1,017,768 (75,026) 1,335,030 317,262 Total Miscellaneous Taxes, Fees, Revenues 2,350,493 2,340,784 (9,709) 4,198,304 1,857,520
Interfund Transfers State Lottery Fund 793,000 790,000 (3,000) 795,000 5,000 Tobacco Settlement/Securitization 1,612,022 1,612,410 388 - (1,612,410) All Other Funds 483,461 457,915 (25,546) 543,204 85,289 Total Interfund Transfers 2,888,483 2,860,325 (28,158) 1,338,204 (1,522,121)
Total State Revenues General Fund 16,361,770 16,627,903 266,133 17,870,542 1,242,639
Property Tax Relief Fund 7,130,000 7,240,000 110,000 7,843,000 603,000Casino Control Fund 62,737 59,370 (3,367) 63,700 4,330Casino Revenue Fund 448,700 459,880 11,180 478,880 19,000Gubernatorial Elections Fund 1,500 1,500 - 1,500 -
TOTAL STATE REVENUES $24,004,707 $24,388,653 $383,946 $26,257,622 $1,868,969
STATE REVENUESFISCAL YEARS 2004 AND 2005 ESTIMATES
($ in thousands)
57

SUMMARIES OF APPROPRIATIONS
SUMMARY OF APPROPRIATIONS MAJOR INCREASES AND DECREASES
This table summarizes the major increases and decreases in the fiscal 2005 Budget and is organized by category. Categories of appropriations are defined as follows: State Operations consists of programs and services operated directly by the State government. The largest single component is for the salary and benefits of State employees. This portion of the budget is subject to the spending limitations imposed by the Cap Law. Grants-in-Aid appropriations are for programs and services provided to the public on behalf of the State by a third party provider, or grants made directly to individuals based on assorted program eligibility criteria. The Medicaid program, the Tuition Assistance Grant Program, Homestead Rebates, payments for State inmates housed in county jails, public transportation aid and funding for State Colleges and Universities fall into this category. State Aid consists of payments to or on behalf of counties, municipalities, and school districts to assist them in carrying out their local responsibilities. In addition to School aid, this category of expenditure includes the Consolidated Municipal Property Tax Relief program, the Municipal Block Grant program and other forms of municipal aid. It also includes funding for county colleges, local public assistance and county psychiatric hospital costs. Debt Service payments represent the interest and principal on capital projects funded through the sale of general obligation bonds. Capital Construction represents pay-as-you-go allocations for construction and other infrastructure items.
APPROPRIATIONS MAJOR INCREASES AND DECREASES
($ In Millions) Net Increases Decrease Change State Operations Contracted Salary Increase-State Employees $ 126.580 Child Welfare Reform 125.000 State Employee Health Benefits 40.101 Post Retirement Medical - State Employees 26.475 Prison/Parole Board Costs 24.720 Employer Taxes 16.917 Employer Pension Contributions 13.720 Gubernatorial Elections Fund - Primary Election Public Funding 8.870 Statewide 911 Emergency Telephone System 6.502 Trooper Recruit Class/Vehicles 6.269 UMDNJ Self Insurance Reserve Fund 6.000 Women's Health Awareness 5.000 Statewide Assessment Program 3.000 New Lisbon Developmental Center Enhancements 2.826 Cancer Screening-Early Detection and Education Program 2.700 Drug Court Expansion 2.200 Snow Removal 2.000 Cardiovascular Program 2.000 Human Services Expanded Fingerprinting 1.800 New Vineland Veterans' Home 1.675
58
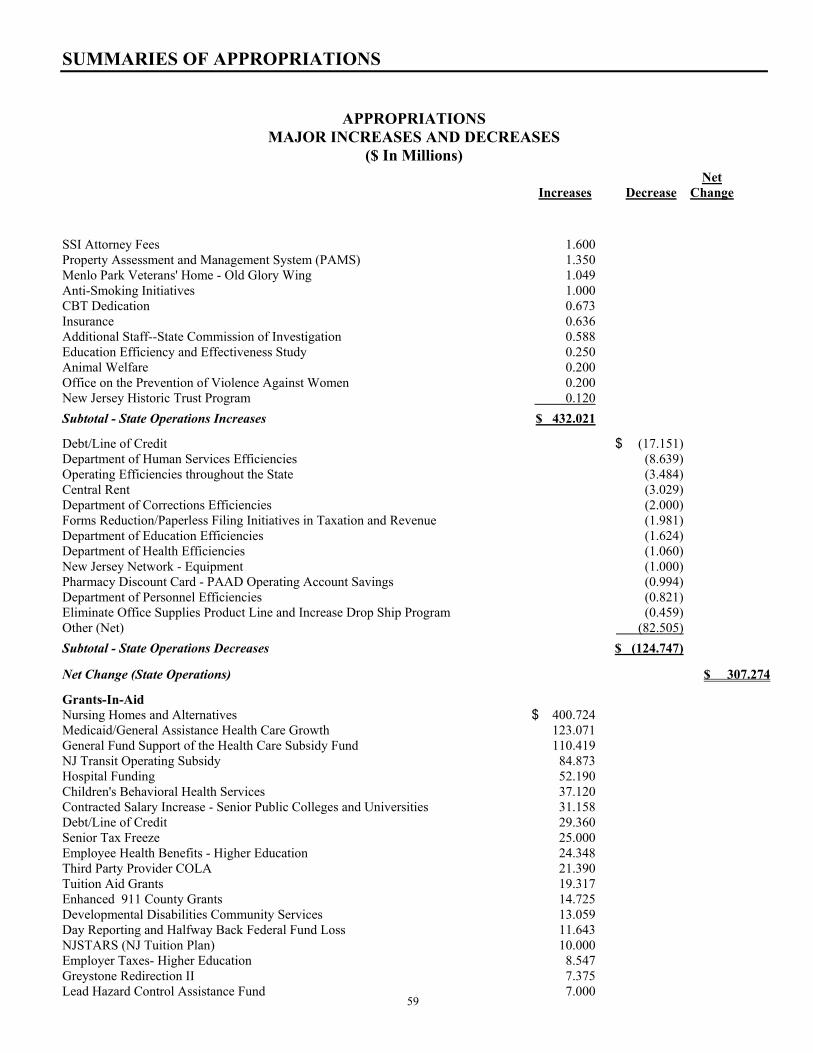
SUMMARIES OF APPROPRIATIONS
APPROPRIATIONS MAJOR INCREASES AND DECREASES
($ In Millions) Net Increases Decrease Change SSI Attorney Fees 1.600 Property Assessment and Management System (PAMS) 1.350 Menlo Park Veterans' Home - Old Glory Wing 1.049 Anti-Smoking Initiatives 1.000 CBT Dedication 0.673 Insurance 0.636 Additional Staff--State Commission of Investigation 0.588 Education Efficiency and Effectiveness Study 0.250 Animal Welfare 0.200 Office on the Prevention of Violence Against Women 0.200 New Jersey Historic Trust Program 0.120 Subtotal - State Operations Increases $ 432.021 Debt/Line of Credit $ (17.151) Department of Human Services Efficiencies (8.639) Operating Efficiencies throughout the State (3.484) Central Rent (3.029) Department of Corrections Efficiencies (2.000) Forms Reduction/Paperless Filing Initiatives in Taxation and Revenue (1.981) Department of Education Efficiencies (1.624) Department of Health Efficiencies (1.060) New Jersey Network - Equipment (1.000) Pharmacy Discount Card - PAAD Operating Account Savings (0.994) Department of Personnel Efficiencies (0.821) Eliminate Office Supplies Product Line and Increase Drop Ship Program (0.459) Other (Net) (82.505) Subtotal - State Operations Decreases $ (124.747) Net Change (State Operations) $ 307.274 Grants-In-Aid Nursing Homes and Alternatives $ 400.724 Medicaid/General Assistance Health Care Growth 123.071 General Fund Support of the Health Care Subsidy Fund 110.419 NJ Transit Operating Subsidy 84.873 Hospital Funding 52.190 Children's Behavioral Health Services 37.120 Contracted Salary Increase - Senior Public Colleges and Universities 31.158 Debt/Line of Credit 29.360 Senior Tax Freeze 25.000 Employee Health Benefits - Higher Education 24.348 Third Party Provider COLA 21.390 Tuition Aid Grants 19.317 Enhanced 911 County Grants 14.725 Developmental Disabilities Community Services 13.059 Day Reporting and Halfway Back Federal Fund Loss 11.643 NJSTARS (NJ Tuition Plan) 10.000 Employer Taxes- Higher Education 8.547 Greystone Redirection II 7.375 Lead Hazard Control Assistance Fund 7.000
59
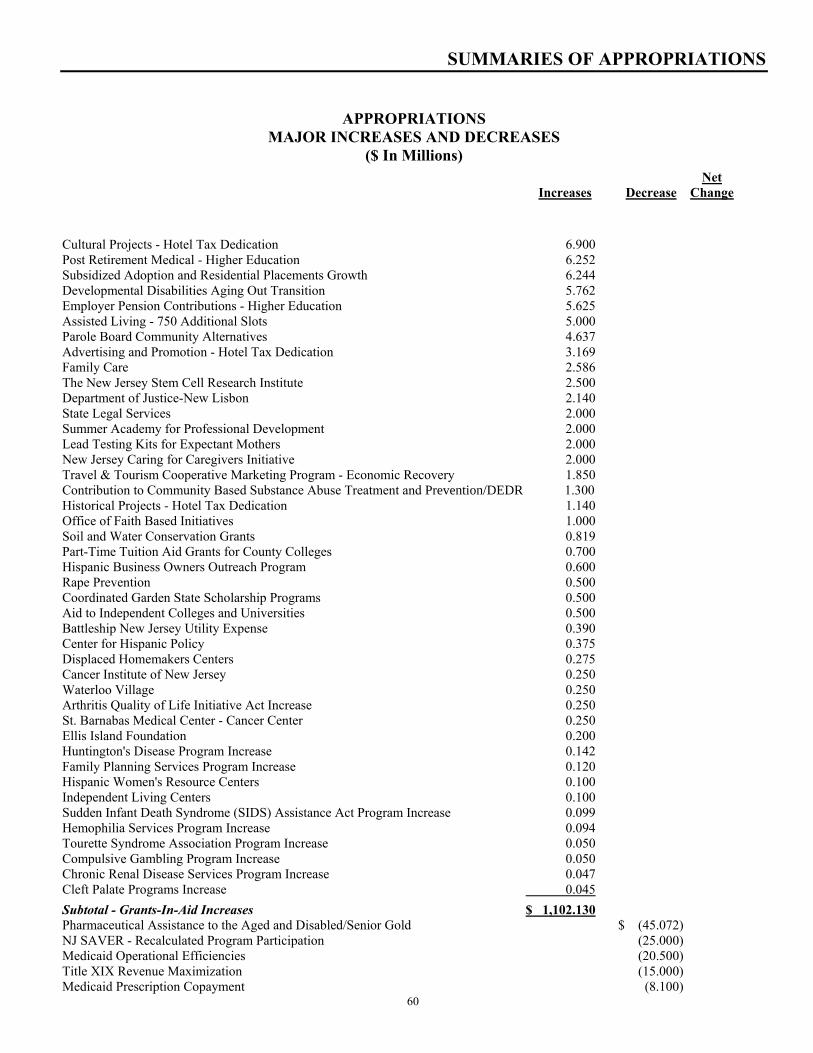
SUMMARIES OF APPROPRIATIONS
APPROPRIATIONS MAJOR INCREASES AND DECREASES
($ In Millions) Net Increases Decrease Change Cultural Projects - Hotel Tax Dedication 6.900 Post Retirement Medical - Higher Education 6.252 Subsidized Adoption and Residential Placements Growth 6.244 Developmental Disabilities Aging Out Transition 5.762 Employer Pension Contributions - Higher Education 5.625 Assisted Living - 750 Additional Slots 5.000 Parole Board Community Alternatives 4.637 Advertising and Promotion - Hotel Tax Dedication 3.169 Family Care 2.586 The New Jersey Stem Cell Research Institute 2.500 Department of Justice-New Lisbon 2.140 State Legal Services 2.000 Summer Academy for Professional Development 2.000 Lead Testing Kits for Expectant Mothers 2.000 New Jersey Caring for Caregivers Initiative 2.000 Travel & Tourism Cooperative Marketing Program - Economic Recovery 1.850 Contribution to Community Based Substance Abuse Treatment and Prevention/DEDR 1.300 Historical Projects - Hotel Tax Dedication 1.140 Office of Faith Based Initiatives 1.000 Soil and Water Conservation Grants 0.819 Part-Time Tuition Aid Grants for County Colleges 0.700 Hispanic Business Owners Outreach Program 0.600 Rape Prevention 0.500 Coordinated Garden State Scholarship Programs 0.500 Aid to Independent Colleges and Universities 0.500 Battleship New Jersey Utility Expense 0.390 Center for Hispanic Policy 0.375 Displaced Homemakers Centers 0.275 Cancer Institute of New Jersey 0.250 Waterloo Village 0.250 Arthritis Quality of Life Initiative Act Increase 0.250 St. Barnabas Medical Center - Cancer Center 0.250 Ellis Island Foundation 0.200 Huntington's Disease Program Increase 0.142 Family Planning Services Program Increase 0.120 Hispanic Women's Resource Centers 0.100 Independent Living Centers 0.100 Sudden Infant Death Syndrome (SIDS) Assistance Act Program Increase 0.099 Hemophilia Services Program Increase 0.094 Tourette Syndrome Association Program Increase 0.050 Compulsive Gambling Program Increase 0.050 Chronic Renal Disease Services Program Increase 0.047 Cleft Palate Programs Increase 0.045 Subtotal - Grants-In-Aid Increases $ 1,102.130 Pharmaceutical Assistance to the Aged and Disabled/Senior Gold $ (45.072) NJ SAVER - Recalculated Program Participation (25.000) Medicaid Operational Efficiencies (20.500) Title XIX Revenue Maximization (15.000) Medicaid Prescription Copayment (8.100)
60
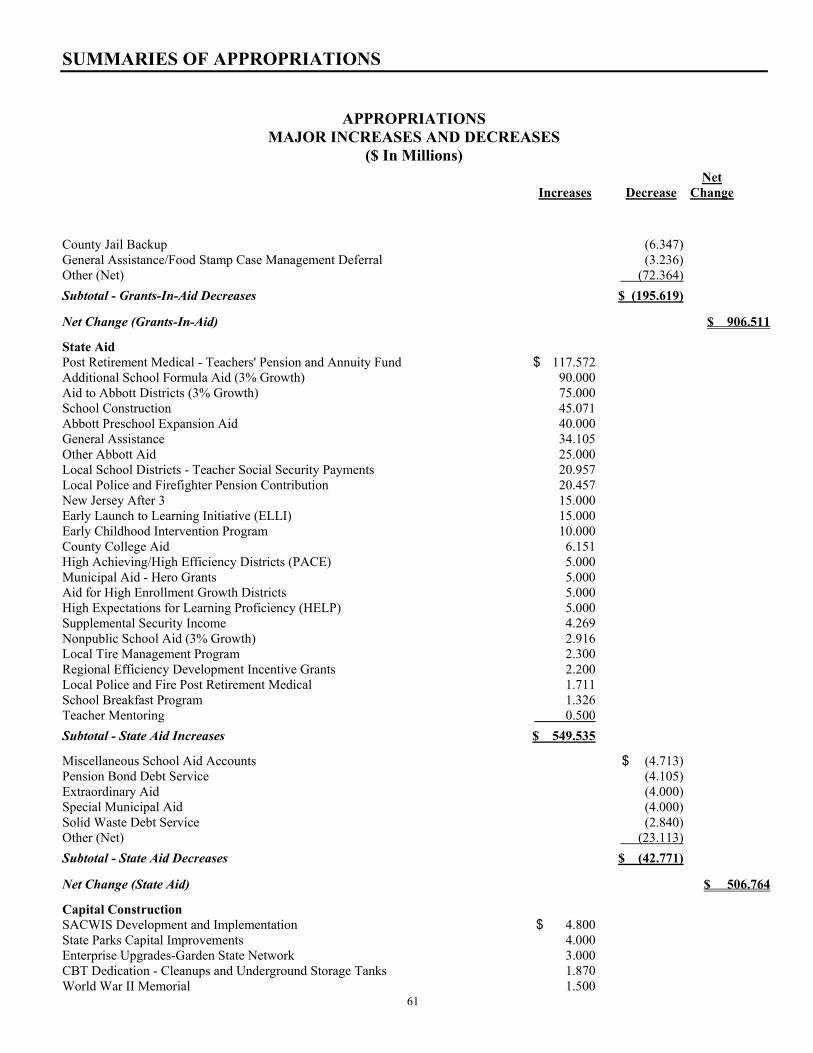
SUMMARIES OF APPROPRIATIONS
APPROPRIATIONS MAJOR INCREASES AND DECREASES
($ In Millions) Net Increases Decrease Change County Jail Backup (6.347) General Assistance/Food Stamp Case Management Deferral (3.236) Other (Net) (72.364) Subtotal - Grants-In-Aid Decreases $ (195.619) Net Change (Grants-In-Aid) $ 906.511 State Aid Post Retirement Medical - Teachers' Pension and Annuity Fund $ 117.572 Additional School Formula Aid (3% Growth) 90.000 Aid to Abbott Districts (3% Growth) 75.000 School Construction 45.071 Abbott Preschool Expansion Aid 40.000 General Assistance 34.105 Other Abbott Aid 25.000 Local School Districts - Teacher Social Security Payments 20.957 Local Police and Firefighter Pension Contribution 20.457 New Jersey After 3 15.000 Early Launch to Learning Initiative (ELLI) 15.000 Early Childhood Intervention Program 10.000 County College Aid 6.151 High Achieving/High Efficiency Districts (PACE) 5.000 Municipal Aid - Hero Grants 5.000 Aid for High Enrollment Growth Districts 5.000 High Expectations for Learning Proficiency (HELP) 5.000 Supplemental Security Income 4.269 Nonpublic School Aid (3% Growth) 2.916 Local Tire Management Program 2.300 Regional Efficiency Development Incentive Grants 2.200 Local Police and Fire Post Retirement Medical 1.711 School Breakfast Program 1.326 Teacher Mentoring 0.500 Subtotal - State Aid Increases $ 549.535 Miscellaneous School Aid Accounts $ (4.713) Pension Bond Debt Service (4.105) Extraordinary Aid (4.000) Special Municipal Aid (4.000) Solid Waste Debt Service (2.840) Other (Net) (23.113) Subtotal - State Aid Decreases $ (42.771) Net Change (State Aid) $ 506.764 Capital Construction SACWIS Development and Implementation $ 4.800 State Parks Capital Improvements 4.000 Enterprise Upgrades-Garden State Network 3.000 CBT Dedication - Cleanups and Underground Storage Tanks 1.870 World War II Memorial 1.500
61
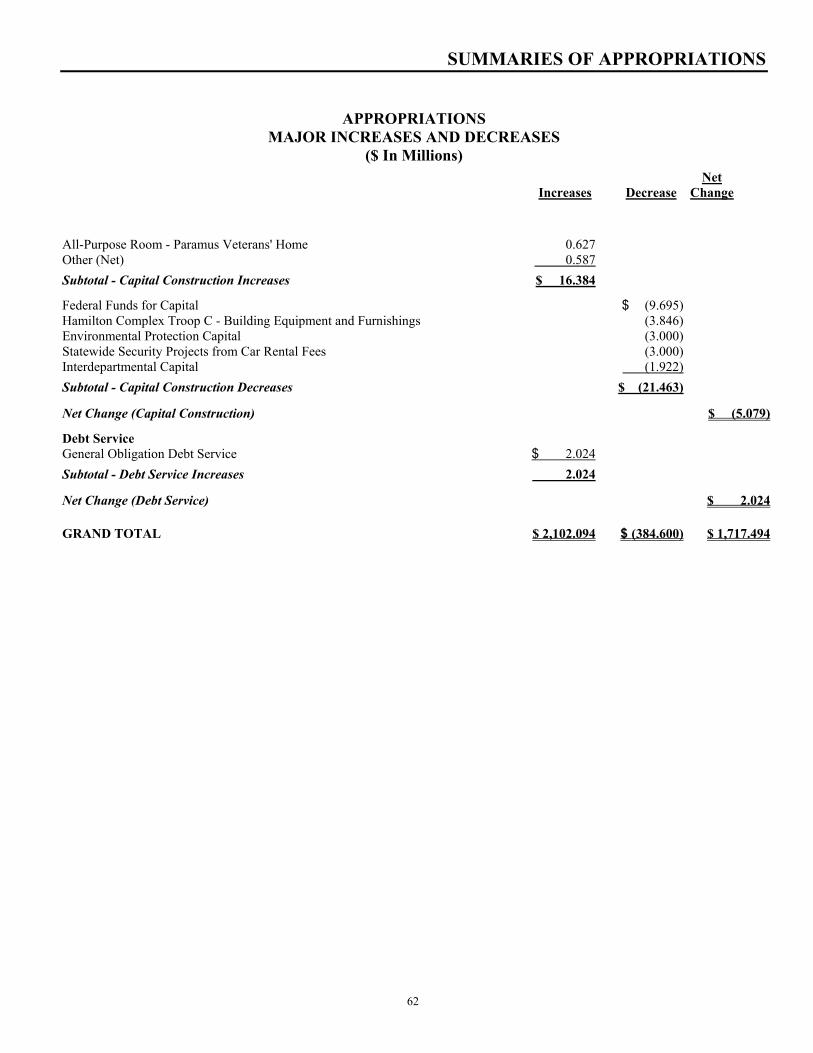
SUMMARIES OF APPROPRIATIONS
APPROPRIATIONS MAJOR INCREASES AND DECREASES
($ In Millions) Net Increases Decrease Change All-Purpose Room - Paramus Veterans' Home 0.627 Other (Net) 0.587 Subtotal - Capital Construction Increases $ 16.384 Federal Funds for Capital $ (9.695) Hamilton Complex Troop C - Building Equipment and Furnishings (3.846) Environmental Protection Capital (3.000) Statewide Security Projects from Car Rental Fees (3.000) Interdepartmental Capital (1.922) Subtotal - Capital Construction Decreases $ (21.463) Net Change (Capital Construction) $ (5.079) Debt Service General Obligation Debt Service $ 2.024 Subtotal - Debt Service Increases 2.024 Net Change (Debt Service) $ 2.024
GRAND TOTAL $ 2,102.094 $ (384.600) $ 1,717.494
62
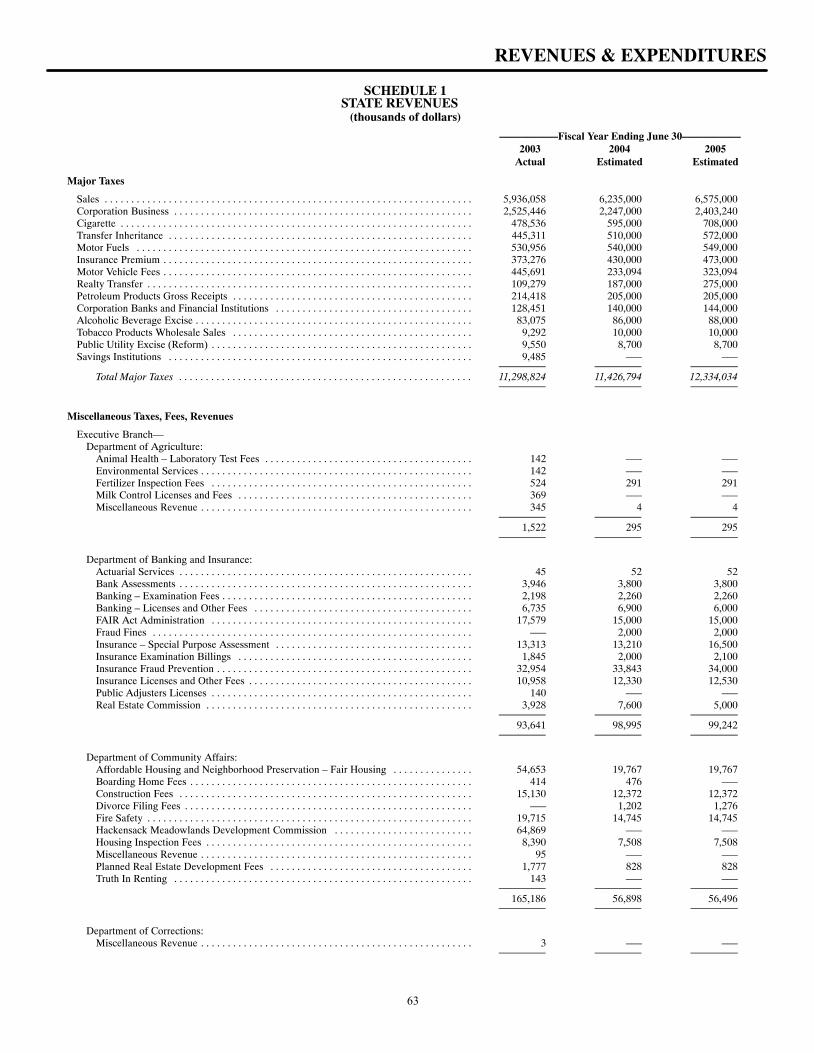
SCHEDULE 1STATE REVENUES
(thousands of dollars)
–––––––––––Fiscal Year Ending June 30–––––––––––2003 2004 2005
Actual Estimated Estimated
REVENUES & EXPENDITURES
Major Taxes
Sales 5,936,058 6,235,000 6,575,000. . . . . . . . . . . . . . . . . . . . . . . . . . . . . . . . . . . . . . . . . . . . . . . . . . . . . . . . . . . . . . . . . . . . . Corporation Business 2,525,446 2,247,000 2,403,240. . . . . . . . . . . . . . . . . . . . . . . . . . . . . . . . . . . . . . . . . . . . . . . . . . . . . . . . Cigarette 478,536 595,000 708,000. . . . . . . . . . . . . . . . . . . . . . . . . . . . . . . . . . . . . . . . . . . . . . . . . . . . . . . . . . . . . . . . . . Transfer Inheritance 445,311 510,000 572,000. . . . . . . . . . . . . . . . . . . . . . . . . . . . . . . . . . . . . . . . . . . . . . . . . . . . . . . . . Motor Fuels 530,956 540,000 549,000. . . . . . . . . . . . . . . . . . . . . . . . . . . . . . . . . . . . . . . . . . . . . . . . . . . . . . . . . . . . . . . Insurance Premium 373,276 430,000 473,000. . . . . . . . . . . . . . . . . . . . . . . . . . . . . . . . . . . . . . . . . . . . . . . . . . . . . . . . . . Motor Vehicle Fees 445,691 233,094 323,094. . . . . . . . . . . . . . . . . . . . . . . . . . . . . . . . . . . . . . . . . . . . . . . . . . . . . . . . . . Realty Transfer 109,279 187,000 275,000. . . . . . . . . . . . . . . . . . . . . . . . . . . . . . . . . . . . . . . . . . . . . . . . . . . . . . . . . . . . . Petroleum Products Gross Receipts 214,418 205,000 205,000. . . . . . . . . . . . . . . . . . . . . . . . . . . . . . . . . . . . . . . . . . . . . Corporation Banks and Financial Institutions 128,451 140,000 144,000. . . . . . . . . . . . . . . . . . . . . . . . . . . . . . . . . . . . . Alcoholic Beverage Excise 83,075 86,000 88,000. . . . . . . . . . . . . . . . . . . . . . . . . . . . . . . . . . . . . . . . . . . . . . . . . . . . Tobacco Products Wholesale Sales 9,292 10,000 10,000. . . . . . . . . . . . . . . . . . . . . . . . . . . . . . . . . . . . . . . . . . . . . Public Utility Excise (Reform) 9,550 8,700 8,700. . . . . . . . . . . . . . . . . . . . . . . . . . . . . . . . . . . . . . . . . . . . . . . . . Savings Institutions 9,485 ––– –––. . . . . . . . . . . . . . . . . . . . . . . . . . . . . . . . . . . . . . . . . . . . . . . . . . . . . . . . .
Total Major Taxes 11,298,824 11,426,794 12,334,034. . . . . . . . . . . . . . . . . . . . . . . . . . . . . . . . . . . . . . . . . . . . . . . . . . . . . . .
Miscellaneous Taxes, Fees, Revenues
Executive Branch––Department of Agriculture:
Animal Health – Laboratory Test Fees 142 ––– –––. . . . . . . . . . . . . . . . . . . . . . . . . . . . . . . . . . . . . . . Environmental Services 142 ––– –––. . . . . . . . . . . . . . . . . . . . . . . . . . . . . . . . . . . . . . . . . . . . . . . . . . . Fertilizer Inspection Fees 524 291 291. . . . . . . . . . . . . . . . . . . . . . . . . . . . . . . . . . . . . . . . . . . . . . . . . Milk Control Licenses and Fees 369 ––– –––. . . . . . . . . . . . . . . . . . . . . . . . . . . . . . . . . . . . . . . . . . . . Miscellaneous Revenue 345 4 4. . . . . . . . . . . . . . . . . . . . . . . . . . . . . . . . . . . . . . . . . . . . . . . . . . .
1,522 295 295
Department of Banking and Insurance:Actuarial Services 45 52 52. . . . . . . . . . . . . . . . . . . . . . . . . . . . . . . . . . . . . . . . . . . . . . . . . . . . . . . Bank Assessments 3,946 3,800 3,800. . . . . . . . . . . . . . . . . . . . . . . . . . . . . . . . . . . . . . . . . . . . . . . . . . . . . . . Banking – Examination Fees 2,198 2,260 2,260. . . . . . . . . . . . . . . . . . . . . . . . . . . . . . . . . . . . . . . . . . . . . . . Banking – Licenses and Other Fees 6,735 6,900 6,000. . . . . . . . . . . . . . . . . . . . . . . . . . . . . . . . . . . . . . . . . FAIR Act Administration 17,579 15,000 15,000. . . . . . . . . . . . . . . . . . . . . . . . . . . . . . . . . . . . . . . . . . . . . . . . . Fraud Fines ––– 2,000 2,000. . . . . . . . . . . . . . . . . . . . . . . . . . . . . . . . . . . . . . . . . . . . . . . . . . . . . . . . . . . . Insurance – Special Purpose Assessment 13,313 13,210 16,500. . . . . . . . . . . . . . . . . . . . . . . . . . . . . . . . . . . . . Insurance Examination Billings 1,845 2,000 2,100. . . . . . . . . . . . . . . . . . . . . . . . . . . . . . . . . . . . . . . . . . . . Insurance Fraud Prevention 32,954 33,843 34,000. . . . . . . . . . . . . . . . . . . . . . . . . . . . . . . . . . . . . . . . . . . . . . . . Insurance Licenses and Other Fees 10,958 12,330 12,530. . . . . . . . . . . . . . . . . . . . . . . . . . . . . . . . . . . . . . . . . . Public Adjusters Licenses 140 ––– –––. . . . . . . . . . . . . . . . . . . . . . . . . . . . . . . . . . . . . . . . . . . . . . . . . Real Estate Commission 3,928 7,600 5,000. . . . . . . . . . . . . . . . . . . . . . . . . . . . . . . . . . . . . . . . . . . . . . . . . .
93,641 98,995 99,242
Department of Community Affairs:Affordable Housing and Neighborhood Preservation – Fair Housing 54,653 19,767 19,767. . . . . . . . . . . . . . . Boarding Home Fees 414 476 –––. . . . . . . . . . . . . . . . . . . . . . . . . . . . . . . . . . . . . . . . . . . . . . . . . . . . . Construction Fees 15,130 12,372 12,372. . . . . . . . . . . . . . . . . . . . . . . . . . . . . . . . . . . . . . . . . . . . . . . . . . . . . . . Divorce Filing Fees ––– 1,202 1,276. . . . . . . . . . . . . . . . . . . . . . . . . . . . . . . . . . . . . . . . . . . . . . . . . . . . . . Fire Safety 19,715 14,745 14,745. . . . . . . . . . . . . . . . . . . . . . . . . . . . . . . . . . . . . . . . . . . . . . . . . . . . . . . . . . . . . Hackensack Meadowlands Development Commission 64,869 ––– –––. . . . . . . . . . . . . . . . . . . . . . . . . . Housing Inspection Fees 8,390 7,508 7,508. . . . . . . . . . . . . . . . . . . . . . . . . . . . . . . . . . . . . . . . . . . . . . . . . . Miscellaneous Revenue 95 ––– –––. . . . . . . . . . . . . . . . . . . . . . . . . . . . . . . . . . . . . . . . . . . . . . . . . . . Planned Real Estate Development Fees 1,777 828 828. . . . . . . . . . . . . . . . . . . . . . . . . . . . . . . . . . . . . . Truth In Renting 143 ––– –––. . . . . . . . . . . . . . . . . . . . . . . . . . . . . . . . . . . . . . . . . . . . . . . . . . . . . . . .
165,186 56,898 56,496
Department of Corrections:Miscellaneous Revenue 3 ––– –––. . . . . . . . . . . . . . . . . . . . . . . . . . . . . . . . . . . . . . . . . . . . . . . . . . .
63
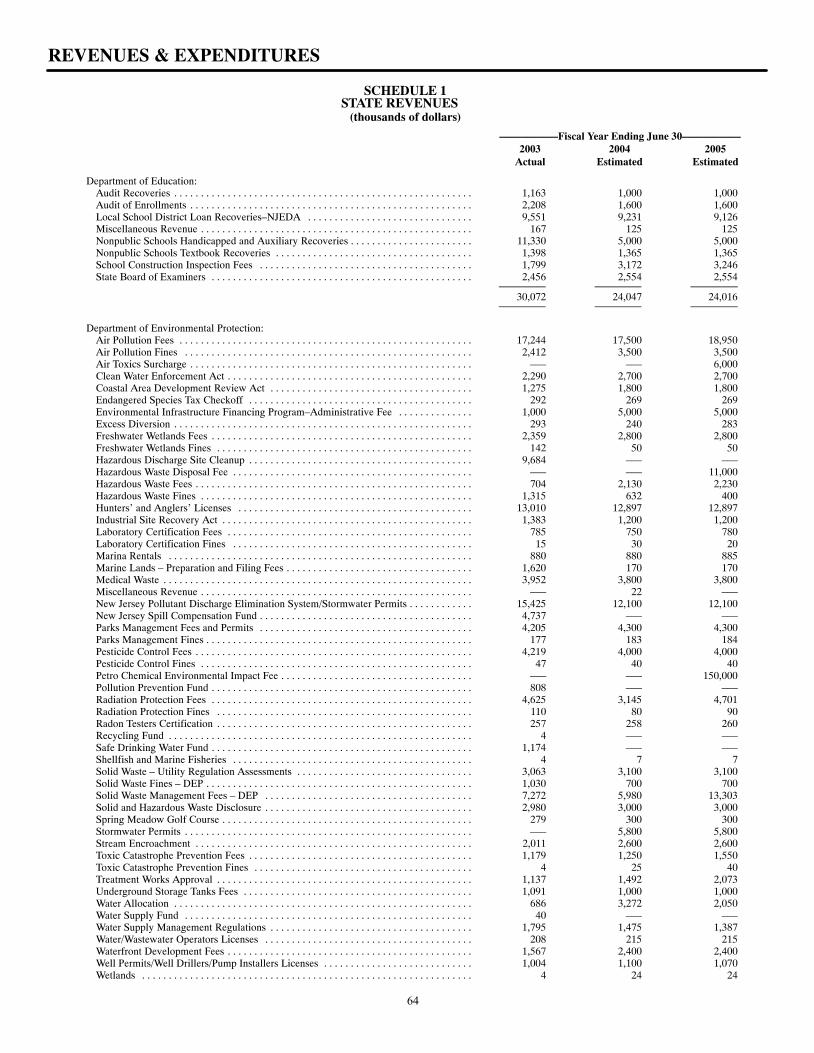
SCHEDULE 1STATE REVENUES
(thousands of dollars)
–––––––––––Fiscal Year Ending June 30–––––––––––2003 2004 2005
Actual Estimated Estimated
REVENUES & EXPENDITURES
Department of Education:Audit Recoveries 1,163 1,000 1,000. . . . . . . . . . . . . . . . . . . . . . . . . . . . . . . . . . . . . . . . . . . . . . . . . . . . . . . . Audit of Enrollments 2,208 1,600 1,600. . . . . . . . . . . . . . . . . . . . . . . . . . . . . . . . . . . . . . . . . . . . . . . . . . . . . Local School District Loan Recoveries–NJEDA 9,551 9,231 9,126. . . . . . . . . . . . . . . . . . . . . . . . . . . . . . . Miscellaneous Revenue 167 125 125. . . . . . . . . . . . . . . . . . . . . . . . . . . . . . . . . . . . . . . . . . . . . . . . . . . Nonpublic Schools Handicapped and Auxiliary Recoveries 11,330 5,000 5,000. . . . . . . . . . . . . . . . . . . . . . . Nonpublic Schools Textbook Recoveries 1,398 1,365 1,365. . . . . . . . . . . . . . . . . . . . . . . . . . . . . . . . . . . . . School Construction Inspection Fees 1,799 3,172 3,246. . . . . . . . . . . . . . . . . . . . . . . . . . . . . . . . . . . . . . . . State Board of Examiners 2,456 2,554 2,554. . . . . . . . . . . . . . . . . . . . . . . . . . . . . . . . . . . . . . . . . . . . . . . . .
30,072 24,047 24,016
Department of Environmental Protection:Air Pollution Fees 17,244 17,500 18,950. . . . . . . . . . . . . . . . . . . . . . . . . . . . . . . . . . . . . . . . . . . . . . . . . . . . . . . Air Pollution Fines 2,412 3,500 3,500. . . . . . . . . . . . . . . . . . . . . . . . . . . . . . . . . . . . . . . . . . . . . . . . . . . . . . Air Toxics Surcharge ––– ––– 6,000. . . . . . . . . . . . . . . . . . . . . . . . . . . . . . . . . . . . . . . . . . . . . . . . . . . . . Clean Water Enforcement Act 2,290 2,700 2,700. . . . . . . . . . . . . . . . . . . . . . . . . . . . . . . . . . . . . . . . . . . . . . Coastal Area Development Review Act 1,275 1,800 1,800. . . . . . . . . . . . . . . . . . . . . . . . . . . . . . . . . . . . . . Endangered Species Tax Checkoff 292 269 269. . . . . . . . . . . . . . . . . . . . . . . . . . . . . . . . . . . . . . . . . . Environmental Infrastructure Financing Program–Administrative Fee 1,000 5,000 5,000. . . . . . . . . . . . . . Excess Diversion 293 240 283. . . . . . . . . . . . . . . . . . . . . . . . . . . . . . . . . . . . . . . . . . . . . . . . . . . . . . . . Freshwater Wetlands Fees 2,359 2,800 2,800. . . . . . . . . . . . . . . . . . . . . . . . . . . . . . . . . . . . . . . . . . . . . . . . . Freshwater Wetlands Fines 142 50 50. . . . . . . . . . . . . . . . . . . . . . . . . . . . . . . . . . . . . . . . . . . . . . . . Hazardous Discharge Site Cleanup 9,684 ––– –––. . . . . . . . . . . . . . . . . . . . . . . . . . . . . . . . . . . . . . . . . . Hazardous Waste Disposal Fee ––– ––– 11,000. . . . . . . . . . . . . . . . . . . . . . . . . . . . . . . . . . . . . . . . . . . . . Hazardous Waste Fees 704 2,130 2,230. . . . . . . . . . . . . . . . . . . . . . . . . . . . . . . . . . . . . . . . . . . . . . . . . . . . Hazardous Waste Fines 1,315 632 400. . . . . . . . . . . . . . . . . . . . . . . . . . . . . . . . . . . . . . . . . . . . . . . . . . . Hunters’ and Anglers’ Licenses 13,010 12,897 12,897. . . . . . . . . . . . . . . . . . . . . . . . . . . . . . . . . . . . . . . . . . . . Industrial Site Recovery Act 1,383 1,200 1,200. . . . . . . . . . . . . . . . . . . . . . . . . . . . . . . . . . . . . . . . . . . . . . . Laboratory Certification Fees 785 750 780. . . . . . . . . . . . . . . . . . . . . . . . . . . . . . . . . . . . . . . . . . . . . . Laboratory Certification Fines 15 30 20. . . . . . . . . . . . . . . . . . . . . . . . . . . . . . . . . . . . . . . . . . . . . Marina Rentals 880 880 885. . . . . . . . . . . . . . . . . . . . . . . . . . . . . . . . . . . . . . . . . . . . . . . . . . . . . . . . . Marine Lands – Preparation and Filing Fees 1,620 170 170. . . . . . . . . . . . . . . . . . . . . . . . . . . . . . . . . . . Medical Waste 3,952 3,800 3,800. . . . . . . . . . . . . . . . . . . . . . . . . . . . . . . . . . . . . . . . . . . . . . . . . . . . . . . . . . Miscellaneous Revenue ––– 22 –––. . . . . . . . . . . . . . . . . . . . . . . . . . . . . . . . . . . . . . . . . . . . . . . . . . . New Jersey Pollutant Discharge Elimination System/Stormwater Permits 15,425 12,100 12,100. . . . . . . . . . . . New Jersey Spill Compensation Fund 4,737 ––– –––. . . . . . . . . . . . . . . . . . . . . . . . . . . . . . . . . . . . . . . . Parks Management Fees and Permits 4,205 4,300 4,300. . . . . . . . . . . . . . . . . . . . . . . . . . . . . . . . . . . . . . . . Parks Management Fines 177 183 184. . . . . . . . . . . . . . . . . . . . . . . . . . . . . . . . . . . . . . . . . . . . . . . . . . Pesticide Control Fees 4,219 4,000 4,000. . . . . . . . . . . . . . . . . . . . . . . . . . . . . . . . . . . . . . . . . . . . . . . . . . . . Pesticide Control Fines 47 40 40. . . . . . . . . . . . . . . . . . . . . . . . . . . . . . . . . . . . . . . . . . . . . . . . . . . Petro Chemical Environmental Impact Fee ––– ––– 150,000. . . . . . . . . . . . . . . . . . . . . . . . . . . . . . . . . . . . Pollution Prevention Fund 808 ––– –––. . . . . . . . . . . . . . . . . . . . . . . . . . . . . . . . . . . . . . . . . . . . . . . . . Radiation Protection Fees 4,625 3,145 4,701. . . . . . . . . . . . . . . . . . . . . . . . . . . . . . . . . . . . . . . . . . . . . . . . . Radiation Protection Fines 110 80 90. . . . . . . . . . . . . . . . . . . . . . . . . . . . . . . . . . . . . . . . . . . . . . . . Radon Testers Certification 257 258 260. . . . . . . . . . . . . . . . . . . . . . . . . . . . . . . . . . . . . . . . . . . . . . . . Recycling Fund 4 ––– –––. . . . . . . . . . . . . . . . . . . . . . . . . . . . . . . . . . . . . . . . . . . . . . . . . . . . . . . . . Safe Drinking Water Fund 1,174 ––– –––. . . . . . . . . . . . . . . . . . . . . . . . . . . . . . . . . . . . . . . . . . . . . . . . . Shellfish and Marine Fisheries 4 7 7. . . . . . . . . . . . . . . . . . . . . . . . . . . . . . . . . . . . . . . . . . . . . Solid Waste – Utility Regulation Assessments 3,063 3,100 3,100. . . . . . . . . . . . . . . . . . . . . . . . . . . . . . . . . Solid Waste Fines – DEP 1,030 700 700. . . . . . . . . . . . . . . . . . . . . . . . . . . . . . . . . . . . . . . . . . . . . . . . . . Solid Waste Management Fees – DEP 7,272 5,980 13,303. . . . . . . . . . . . . . . . . . . . . . . . . . . . . . . . . . . . . . . Solid and Hazardous Waste Disclosure 2,980 3,000 3,000. . . . . . . . . . . . . . . . . . . . . . . . . . . . . . . . . . . . . . . Spring Meadow Golf Course 279 300 300. . . . . . . . . . . . . . . . . . . . . . . . . . . . . . . . . . . . . . . . . . . . . . . Stormwater Permits ––– 5,800 5,800. . . . . . . . . . . . . . . . . . . . . . . . . . . . . . . . . . . . . . . . . . . . . . . . . . . . . . Stream Encroachment 2,011 2,600 2,600. . . . . . . . . . . . . . . . . . . . . . . . . . . . . . . . . . . . . . . . . . . . . . . . . . . . Toxic Catastrophe Prevention Fees 1,179 1,250 1,550. . . . . . . . . . . . . . . . . . . . . . . . . . . . . . . . . . . . . . . . . . Toxic Catastrophe Prevention Fines 4 25 40. . . . . . . . . . . . . . . . . . . . . . . . . . . . . . . . . . . . . . . . . Treatment Works Approval 1,137 1,492 2,073. . . . . . . . . . . . . . . . . . . . . . . . . . . . . . . . . . . . . . . . . . . . . . . . Underground Storage Tanks Fees 1,091 1,000 1,000. . . . . . . . . . . . . . . . . . . . . . . . . . . . . . . . . . . . . . . . . . . Water Allocation 686 3,272 2,050. . . . . . . . . . . . . . . . . . . . . . . . . . . . . . . . . . . . . . . . . . . . . . . . . . . . . . . . Water Supply Fund 40 ––– –––. . . . . . . . . . . . . . . . . . . . . . . . . . . . . . . . . . . . . . . . . . . . . . . . . . . . . . Water Supply Management Regulations 1,795 1,475 1,387. . . . . . . . . . . . . . . . . . . . . . . . . . . . . . . . . . . . . . Water/Wastewater Operators Licenses 208 215 215. . . . . . . . . . . . . . . . . . . . . . . . . . . . . . . . . . . . . . . Waterfront Development Fees 1,567 2,400 2,400. . . . . . . . . . . . . . . . . . . . . . . . . . . . . . . . . . . . . . . . . . . . . . Well Permits/Well Drillers/Pump Installers Licenses 1,004 1,100 1,070. . . . . . . . . . . . . . . . . . . . . . . . . . . . Wetlands 4 24 24. . . . . . . . . . . . . . . . . . . . . . . . . . . . . . . . . . . . . . . . . . . . . . . . . . . . . . . . . . . . . .
64
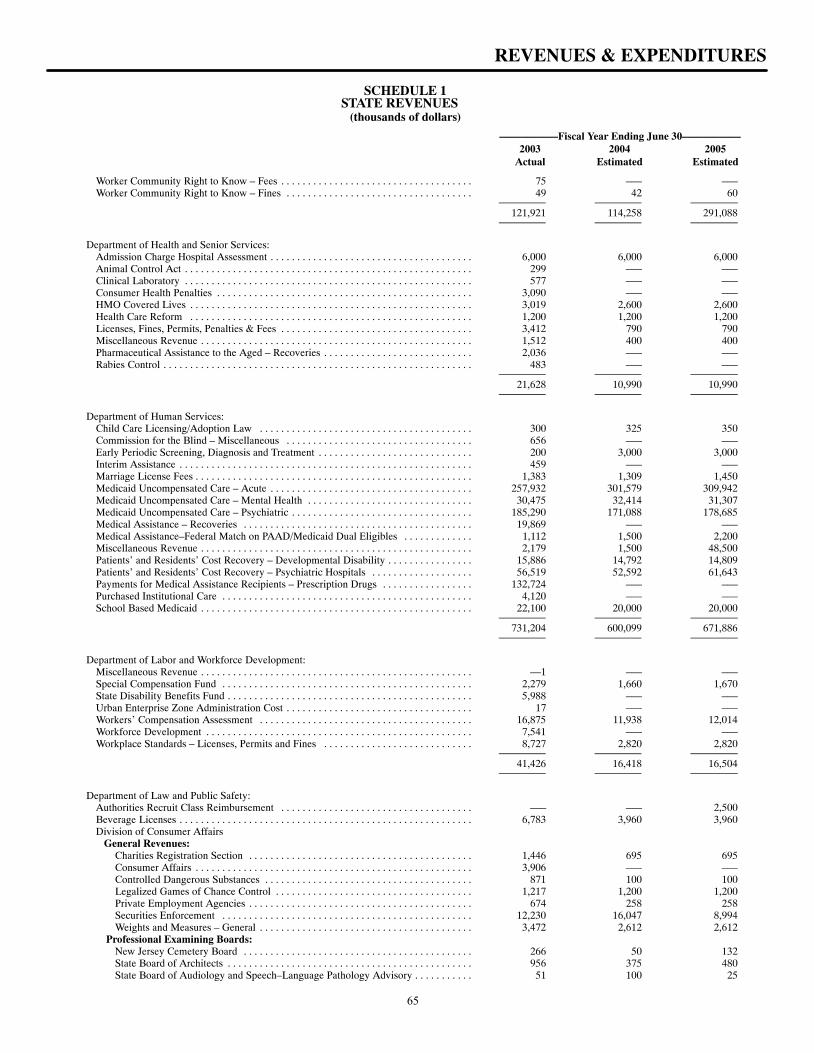
SCHEDULE 1STATE REVENUES
(thousands of dollars)
–––––––––––Fiscal Year Ending June 30–––––––––––2003 2004 2005
Actual Estimated Estimated
REVENUES & EXPENDITURES
Worker Community Right to Know – Fees 75 ––– –––. . . . . . . . . . . . . . . . . . . . . . . . . . . . . . . . . . . . Worker Community Right to Know – Fines 49 42 60. . . . . . . . . . . . . . . . . . . . . . . . . . . . . . . . . . .
121,921 114,258 291,088
Department of Health and Senior Services:Admission Charge Hospital Assessment 6,000 6,000 6,000. . . . . . . . . . . . . . . . . . . . . . . . . . . . . . . . . . . . . . Animal Control Act 299 ––– –––. . . . . . . . . . . . . . . . . . . . . . . . . . . . . . . . . . . . . . . . . . . . . . . . . . . . . . Clinical Laboratory 577 ––– –––. . . . . . . . . . . . . . . . . . . . . . . . . . . . . . . . . . . . . . . . . . . . . . . . . . . . . . Consumer Health Penalties 3,090 ––– –––. . . . . . . . . . . . . . . . . . . . . . . . . . . . . . . . . . . . . . . . . . . . . . . . HMO Covered Lives 3,019 2,600 2,600. . . . . . . . . . . . . . . . . . . . . . . . . . . . . . . . . . . . . . . . . . . . . . . . . . . . . Health Care Reform 1,200 1,200 1,200. . . . . . . . . . . . . . . . . . . . . . . . . . . . . . . . . . . . . . . . . . . . . . . . . . . . . Licenses, Fines, Permits, Penalties & Fees 3,412 790 790. . . . . . . . . . . . . . . . . . . . . . . . . . . . . . . . . . . . Miscellaneous Revenue 1,512 400 400. . . . . . . . . . . . . . . . . . . . . . . . . . . . . . . . . . . . . . . . . . . . . . . . . . . Pharmaceutical Assistance to the Aged – Recoveries 2,036 ––– –––. . . . . . . . . . . . . . . . . . . . . . . . . . . . Rabies Control 483 ––– –––. . . . . . . . . . . . . . . . . . . . . . . . . . . . . . . . . . . . . . . . . . . . . . . . . . . . . . . . . .
21,628 10,990 10,990
Department of Human Services:Child Care Licensing/Adoption Law 300 325 350. . . . . . . . . . . . . . . . . . . . . . . . . . . . . . . . . . . . . . . . Commission for the Blind – Miscellaneous 656 ––– –––. . . . . . . . . . . . . . . . . . . . . . . . . . . . . . . . . . . Early Periodic Screening, Diagnosis and Treatment 200 3,000 3,000. . . . . . . . . . . . . . . . . . . . . . . . . . . . . Interim Assistance 459 ––– –––. . . . . . . . . . . . . . . . . . . . . . . . . . . . . . . . . . . . . . . . . . . . . . . . . . . . . . . Marriage License Fees 1,383 1,309 1,450. . . . . . . . . . . . . . . . . . . . . . . . . . . . . . . . . . . . . . . . . . . . . . . . . . . . Medicaid Uncompensated Care – Acute 257,932 301,579 309,942. . . . . . . . . . . . . . . . . . . . . . . . . . . . . . . . . . . . . . Medicaid Uncompensated Care – Mental Health 30,475 32,414 31,307. . . . . . . . . . . . . . . . . . . . . . . . . . . . . . . Medicaid Uncompensated Care – Psychiatric 185,290 171,088 178,685. . . . . . . . . . . . . . . . . . . . . . . . . . . . . . . . . . Medical Assistance – Recoveries 19,869 ––– –––. . . . . . . . . . . . . . . . . . . . . . . . . . . . . . . . . . . . . . . . . . . Medical Assistance–Federal Match on PAAD/Medicaid Dual Eligibles 1,112 1,500 2,200. . . . . . . . . . . . . Miscellaneous Revenue 2,179 1,500 48,500. . . . . . . . . . . . . . . . . . . . . . . . . . . . . . . . . . . . . . . . . . . . . . . . . . . Patients’ and Residents’ Cost Recovery – Developmental Disability 15,886 14,792 14,809. . . . . . . . . . . . . . . . Patients’ and Residents’ Cost Recovery – Psychiatric Hospitals 56,519 52,592 61,643. . . . . . . . . . . . . . . . . . . Payments for Medical Assistance Recipients – Prescription Drugs 132,724 ––– –––. . . . . . . . . . . . . . . . . Purchased Institutional Care 4,120 ––– –––. . . . . . . . . . . . . . . . . . . . . . . . . . . . . . . . . . . . . . . . . . . . . . . School Based Medicaid 22,100 20,000 20,000. . . . . . . . . . . . . . . . . . . . . . . . . . . . . . . . . . . . . . . . . . . . . . . . . . .
731,204 600,099 671,886
Department of Labor and Workforce Development:Miscellaneous Revenue ––1 ––– –––. . . . . . . . . . . . . . . . . . . . . . . . . . . . . . . . . . . . . . . . . . . . . . . . . . . Special Compensation Fund 2,279 1,660 1,670. . . . . . . . . . . . . . . . . . . . . . . . . . . . . . . . . . . . . . . . . . . . . . . State Disability Benefits Fund 5,988 ––– –––. . . . . . . . . . . . . . . . . . . . . . . . . . . . . . . . . . . . . . . . . . . . . . Urban Enterprise Zone Administration Cost 17 ––– –––. . . . . . . . . . . . . . . . . . . . . . . . . . . . . . . . . . . Workers’ Compensation Assessment 16,875 11,938 12,014. . . . . . . . . . . . . . . . . . . . . . . . . . . . . . . . . . . . . . . . Workforce Development 7,541 ––– –––. . . . . . . . . . . . . . . . . . . . . . . . . . . . . . . . . . . . . . . . . . . . . . . . . . Workplace Standards – Licenses, Permits and Fines 8,727 2,820 2,820. . . . . . . . . . . . . . . . . . . . . . . . . . . .
41,426 16,418 16,504
Department of Law and Public Safety:Authorities Recruit Class Reimbursement ––– ––– 2,500. . . . . . . . . . . . . . . . . . . . . . . . . . . . . . . . . . . . Beverage Licenses 6,783 3,960 3,960. . . . . . . . . . . . . . . . . . . . . . . . . . . . . . . . . . . . . . . . . . . . . . . . . . . . . . . Division of Consumer Affairs General Revenues:
Charities Registration Section 1,446 695 695. . . . . . . . . . . . . . . . . . . . . . . . . . . . . . . . . . . . . . . . . . Consumer Affairs 3,906 ––– –––. . . . . . . . . . . . . . . . . . . . . . . . . . . . . . . . . . . . . . . . . . . . . . . . . . . . Controlled Dangerous Substances 871 100 100. . . . . . . . . . . . . . . . . . . . . . . . . . . . . . . . . . . . . . . Legalized Games of Chance Control 1,217 1,200 1,200. . . . . . . . . . . . . . . . . . . . . . . . . . . . . . . . . . . . . Private Employment Agencies 674 258 258. . . . . . . . . . . . . . . . . . . . . . . . . . . . . . . . . . . . . . . . . . Securities Enforcement 12,230 16,047 8,994. . . . . . . . . . . . . . . . . . . . . . . . . . . . . . . . . . . . . . . . . . . . . . . Weights and Measures – General 3,472 2,612 2,612. . . . . . . . . . . . . . . . . . . . . . . . . . . . . . . . . . . . . . . .
Professional Examining Boards:New Jersey Cemetery Board 266 50 132. . . . . . . . . . . . . . . . . . . . . . . . . . . . . . . . . . . . . . . . . . . State Board of Architects 956 375 480. . . . . . . . . . . . . . . . . . . . . . . . . . . . . . . . . . . . . . . . . . . . . . State Board of Audiology and Speech–Language Pathology Advisory 51 100 25. . . . . . . . . . .
65
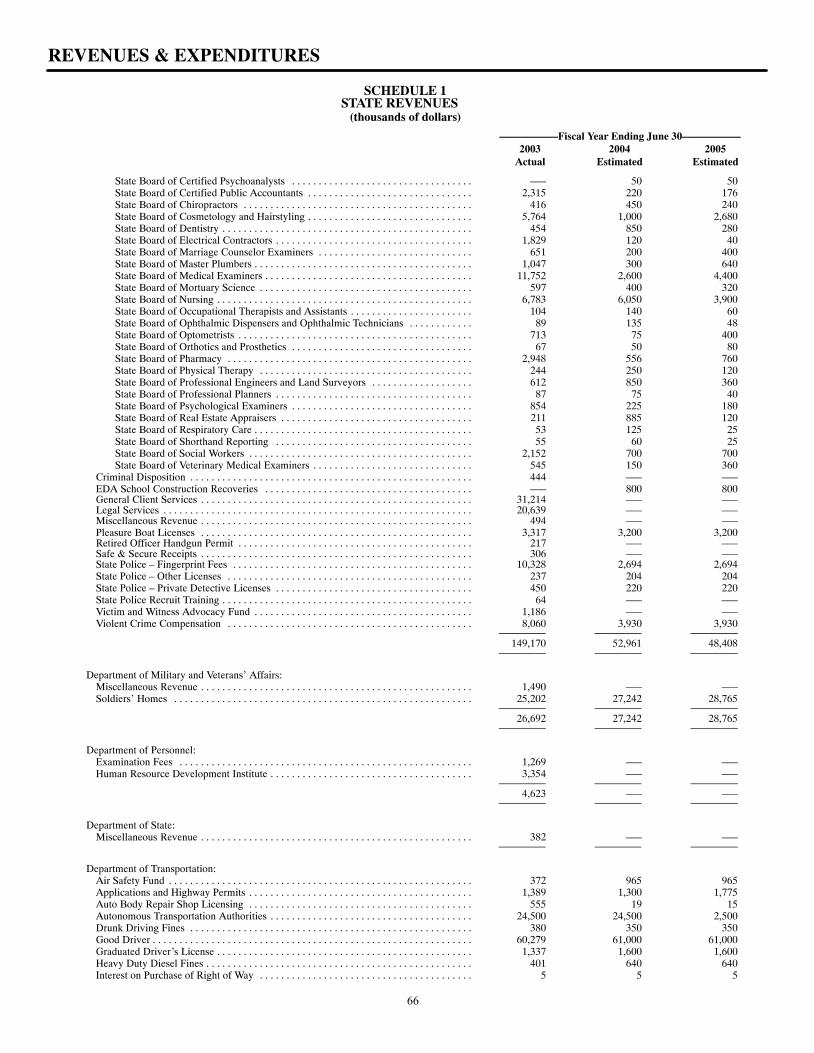
SCHEDULE 1STATE REVENUES
(thousands of dollars)
–––––––––––Fiscal Year Ending June 30–––––––––––2003 2004 2005
Actual Estimated Estimated
REVENUES & EXPENDITURES
State Board of Certified Psychoanalysts ––– 50 50. . . . . . . . . . . . . . . . . . . . . . . . . . . . . . . . . . State Board of Certified Public Accountants 2,315 220 176. . . . . . . . . . . . . . . . . . . . . . . . . . . . . . . State Board of Chiropractors 416 450 240. . . . . . . . . . . . . . . . . . . . . . . . . . . . . . . . . . . . . . . . . . . State Board of Cosmetology and Hairstyling 5,764 1,000 2,680. . . . . . . . . . . . . . . . . . . . . . . . . . . . . . . State Board of Dentistry 454 850 280. . . . . . . . . . . . . . . . . . . . . . . . . . . . . . . . . . . . . . . . . . . . . . . State Board of Electrical Contractors 1,829 120 40. . . . . . . . . . . . . . . . . . . . . . . . . . . . . . . . . . . . . State Board of Marriage Counselor Examiners 651 200 400. . . . . . . . . . . . . . . . . . . . . . . . . . . . . State Board of Master Plumbers 1,047 300 640. . . . . . . . . . . . . . . . . . . . . . . . . . . . . . . . . . . . . . . . . State Board of Medical Examiners 11,752 2,600 4,400. . . . . . . . . . . . . . . . . . . . . . . . . . . . . . . . . . . . . . . State Board of Mortuary Science 597 400 320. . . . . . . . . . . . . . . . . . . . . . . . . . . . . . . . . . . . . . . . State Board of Nursing 6,783 6,050 3,900. . . . . . . . . . . . . . . . . . . . . . . . . . . . . . . . . . . . . . . . . . . . . . . . State Board of Occupational Therapists and Assistants 104 140 60. . . . . . . . . . . . . . . . . . . . . . . State Board of Ophthalmic Dispensers and Ophthalmic Technicians 89 135 48. . . . . . . . . . . . State Board of Optometrists 713 75 400. . . . . . . . . . . . . . . . . . . . . . . . . . . . . . . . . . . . . . . . . . . . State Board of Orthotics and Prosthetics 67 50 80. . . . . . . . . . . . . . . . . . . . . . . . . . . . . . . . . . State Board of Pharmacy 2,948 556 760. . . . . . . . . . . . . . . . . . . . . . . . . . . . . . . . . . . . . . . . . . . . . . State Board of Physical Therapy 244 250 120. . . . . . . . . . . . . . . . . . . . . . . . . . . . . . . . . . . . . . . . State Board of Professional Engineers and Land Surveyors 612 850 360. . . . . . . . . . . . . . . . . . . State Board of Professional Planners 87 75 40. . . . . . . . . . . . . . . . . . . . . . . . . . . . . . . . . . . . . State Board of Psychological Examiners 854 225 180. . . . . . . . . . . . . . . . . . . . . . . . . . . . . . . . . . State Board of Real Estate Appraisers 211 885 120. . . . . . . . . . . . . . . . . . . . . . . . . . . . . . . . . . . . State Board of Respiratory Care 53 125 25. . . . . . . . . . . . . . . . . . . . . . . . . . . . . . . . . . . . . . . . . State Board of Shorthand Reporting 55 60 25. . . . . . . . . . . . . . . . . . . . . . . . . . . . . . . . . . . . . State Board of Social Workers 2,152 700 700. . . . . . . . . . . . . . . . . . . . . . . . . . . . . . . . . . . . . . . . . . State Board of Veterinary Medical Examiners 545 150 360. . . . . . . . . . . . . . . . . . . . . . . . . . . . . .
Criminal Disposition 444 ––– –––. . . . . . . . . . . . . . . . . . . . . . . . . . . . . . . . . . . . . . . . . . . . . . . . . . . . . EDA School Construction Recoveries ––– 800 800. . . . . . . . . . . . . . . . . . . . . . . . . . . . . . . . . . . . . . . General Client Services 31,214 ––– –––. . . . . . . . . . . . . . . . . . . . . . . . . . . . . . . . . . . . . . . . . . . . . . . . . . . Legal Services 20,639 ––– –––. . . . . . . . . . . . . . . . . . . . . . . . . . . . . . . . . . . . . . . . . . . . . . . . . . . . . . . . . . Miscellaneous Revenue 494 ––– –––. . . . . . . . . . . . . . . . . . . . . . . . . . . . . . . . . . . . . . . . . . . . . . . . . . . Pleasure Boat Licenses 3,317 3,200 3,200. . . . . . . . . . . . . . . . . . . . . . . . . . . . . . . . . . . . . . . . . . . . . . . . . . . Retired Officer Handgun Permit 217 ––– –––. . . . . . . . . . . . . . . . . . . . . . . . . . . . . . . . . . . . . . . . . . . . Safe & Secure Receipts 306 ––– –––. . . . . . . . . . . . . . . . . . . . . . . . . . . . . . . . . . . . . . . . . . . . . . . . . . . State Police – Fingerprint Fees 10,328 2,694 2,694. . . . . . . . . . . . . . . . . . . . . . . . . . . . . . . . . . . . . . . . . . . . . State Police – Other Licenses 237 204 204. . . . . . . . . . . . . . . . . . . . . . . . . . . . . . . . . . . . . . . . . . . . . . State Police – Private Detective Licenses 450 220 220. . . . . . . . . . . . . . . . . . . . . . . . . . . . . . . . . . . . . State Police Recruit Training 64 ––– –––. . . . . . . . . . . . . . . . . . . . . . . . . . . . . . . . . . . . . . . . . . . . . . . Victim and Witness Advocacy Fund 1,186 ––– –––. . . . . . . . . . . . . . . . . . . . . . . . . . . . . . . . . . . . . . . . . Violent Crime Compensation 8,060 3,930 3,930. . . . . . . . . . . . . . . . . . . . . . . . . . . . . . . . . . . . . . . . . . . . . .
149,170 52,961 48,408
Department of Military and Veterans’ Affairs:Miscellaneous Revenue 1,490 ––– –––. . . . . . . . . . . . . . . . . . . . . . . . . . . . . . . . . . . . . . . . . . . . . . . . . . . Soldiers’ Homes 25,202 27,242 28,765. . . . . . . . . . . . . . . . . . . . . . . . . . . . . . . . . . . . . . . . . . . . . . . . . . . . . . . .
26,692 27,242 28,765
Department of Personnel:Examination Fees 1,269 ––– –––. . . . . . . . . . . . . . . . . . . . . . . . . . . . . . . . . . . . . . . . . . . . . . . . . . . . . . . Human Resource Development Institute 3,354 ––– –––. . . . . . . . . . . . . . . . . . . . . . . . . . . . . . . . . . . . . .
4,623 ––– –––
Department of State:Miscellaneous Revenue 382 ––– –––. . . . . . . . . . . . . . . . . . . . . . . . . . . . . . . . . . . . . . . . . . . . . . . . . . .
Department of Transportation:Air Safety Fund 372 965 965. . . . . . . . . . . . . . . . . . . . . . . . . . . . . . . . . . . . . . . . . . . . . . . . . . . . . . . . . Applications and Highway Permits 1,389 1,300 1,775. . . . . . . . . . . . . . . . . . . . . . . . . . . . . . . . . . . . . . . . . . Auto Body Repair Shop Licensing 555 19 15. . . . . . . . . . . . . . . . . . . . . . . . . . . . . . . . . . . . . . . . . . Autonomous Transportation Authorities 24,500 24,500 2,500. . . . . . . . . . . . . . . . . . . . . . . . . . . . . . . . . . . . . . Drunk Driving Fines 380 350 350. . . . . . . . . . . . . . . . . . . . . . . . . . . . . . . . . . . . . . . . . . . . . . . . . . . . . Good Driver 60,279 61,000 61,000. . . . . . . . . . . . . . . . . . . . . . . . . . . . . . . . . . . . . . . . . . . . . . . . . . . . . . . . . . . . Graduated Driver’s License 1,337 1,600 1,600. . . . . . . . . . . . . . . . . . . . . . . . . . . . . . . . . . . . . . . . . . . . . . . . Heavy Duty Diesel Fines 401 640 640. . . . . . . . . . . . . . . . . . . . . . . . . . . . . . . . . . . . . . . . . . . . . . . . . . Interest on Purchase of Right of Way 5 5 5. . . . . . . . . . . . . . . . . . . . . . . . . . . . . . . . . . . . . . . .
66
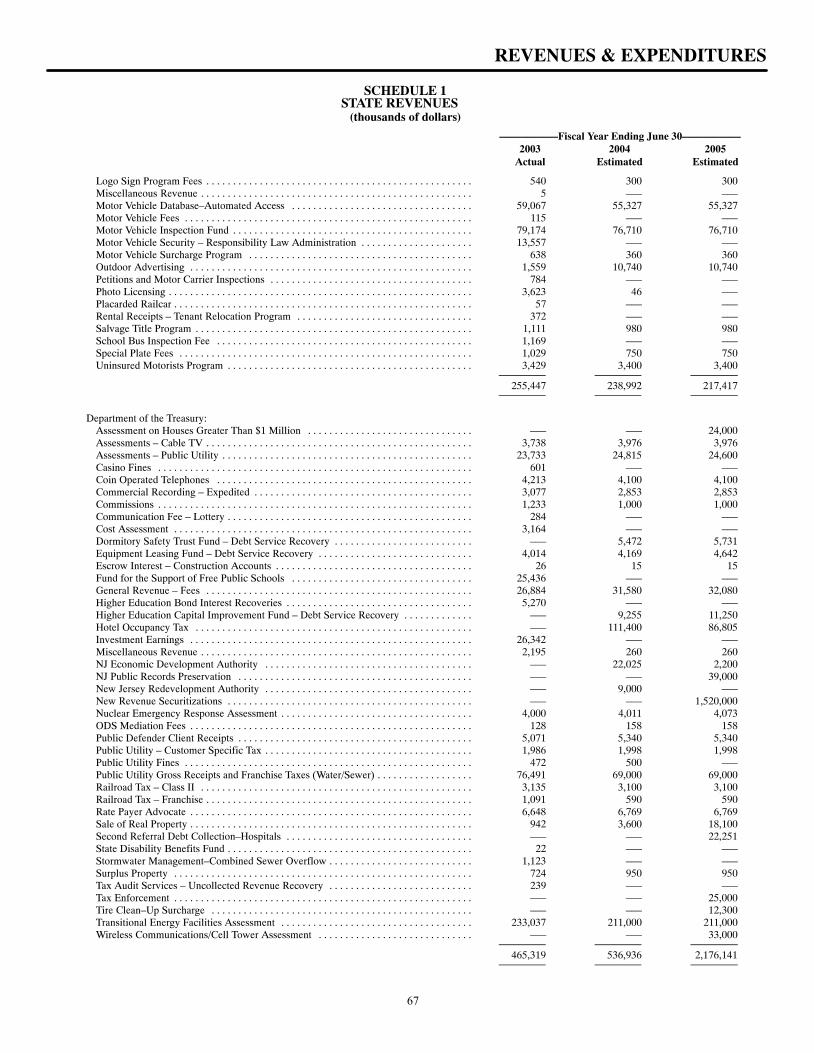
SCHEDULE 1STATE REVENUES
(thousands of dollars)
–––––––––––Fiscal Year Ending June 30–––––––––––2003 2004 2005
Actual Estimated Estimated
REVENUES & EXPENDITURES
Logo Sign Program Fees 540 300 300. . . . . . . . . . . . . . . . . . . . . . . . . . . . . . . . . . . . . . . . . . . . . . . . . . Miscellaneous Revenue 5 ––– –––. . . . . . . . . . . . . . . . . . . . . . . . . . . . . . . . . . . . . . . . . . . . . . . . . . . Motor Vehicle Database–Automated Access 59,067 55,327 55,327. . . . . . . . . . . . . . . . . . . . . . . . . . . . . . . . . . Motor Vehicle Fees 115 ––– –––. . . . . . . . . . . . . . . . . . . . . . . . . . . . . . . . . . . . . . . . . . . . . . . . . . . . . . Motor Vehicle Inspection Fund 79,174 76,710 76,710. . . . . . . . . . . . . . . . . . . . . . . . . . . . . . . . . . . . . . . . . . . . . Motor Vehicle Security – Responsibility Law Administration 13,557 ––– –––. . . . . . . . . . . . . . . . . . . . . Motor Vehicle Surcharge Program 638 360 360. . . . . . . . . . . . . . . . . . . . . . . . . . . . . . . . . . . . . . . . . . Outdoor Advertising 1,559 10,740 10,740. . . . . . . . . . . . . . . . . . . . . . . . . . . . . . . . . . . . . . . . . . . . . . . . . . . . . Petitions and Motor Carrier Inspections 784 ––– –––. . . . . . . . . . . . . . . . . . . . . . . . . . . . . . . . . . . . . . Photo Licensing 3,623 46 –––. . . . . . . . . . . . . . . . . . . . . . . . . . . . . . . . . . . . . . . . . . . . . . . . . . . . . . . . . Placarded Railcar 57 ––– –––. . . . . . . . . . . . . . . . . . . . . . . . . . . . . . . . . . . . . . . . . . . . . . . . . . . . . . . . Rental Receipts – Tenant Relocation Program 372 ––– –––. . . . . . . . . . . . . . . . . . . . . . . . . . . . . . . . . Salvage Title Program 1,111 980 980. . . . . . . . . . . . . . . . . . . . . . . . . . . . . . . . . . . . . . . . . . . . . . . . . . . . School Bus Inspection Fee 1,169 ––– –––. . . . . . . . . . . . . . . . . . . . . . . . . . . . . . . . . . . . . . . . . . . . . . . . Special Plate Fees 1,029 750 750. . . . . . . . . . . . . . . . . . . . . . . . . . . . . . . . . . . . . . . . . . . . . . . . . . . . . . . Uninsured Motorists Program 3,429 3,400 3,400. . . . . . . . . . . . . . . . . . . . . . . . . . . . . . . . . . . . . . . . . . . . . .
255,447 238,992 217,417
Department of the Treasury:Assessment on Houses Greater Than $1 Million ––– ––– 24,000. . . . . . . . . . . . . . . . . . . . . . . . . . . . . . . Assessments – Cable TV 3,738 3,976 3,976. . . . . . . . . . . . . . . . . . . . . . . . . . . . . . . . . . . . . . . . . . . . . . . . . . Assessments – Public Utility 23,733 24,815 24,600. . . . . . . . . . . . . . . . . . . . . . . . . . . . . . . . . . . . . . . . . . . . . . . Casino Fines 601 ––– –––. . . . . . . . . . . . . . . . . . . . . . . . . . . . . . . . . . . . . . . . . . . . . . . . . . . . . . . . . . . Coin Operated Telephones 4,213 4,100 4,100. . . . . . . . . . . . . . . . . . . . . . . . . . . . . . . . . . . . . . . . . . . . . . . . Commercial Recording – Expedited 3,077 2,853 2,853. . . . . . . . . . . . . . . . . . . . . . . . . . . . . . . . . . . . . . . . . Commissions 1,233 1,000 1,000. . . . . . . . . . . . . . . . . . . . . . . . . . . . . . . . . . . . . . . . . . . . . . . . . . . . . . . . . . . Communication Fee – Lottery 284 ––– –––. . . . . . . . . . . . . . . . . . . . . . . . . . . . . . . . . . . . . . . . . . . . . . Cost Assessment 3,164 ––– –––. . . . . . . . . . . . . . . . . . . . . . . . . . . . . . . . . . . . . . . . . . . . . . . . . . . . . . . . Dormitory Safety Trust Fund – Debt Service Recovery ––– 5,472 5,731. . . . . . . . . . . . . . . . . . . . . . . . . . Equipment Leasing Fund – Debt Service Recovery 4,014 4,169 4,642. . . . . . . . . . . . . . . . . . . . . . . . . . . . . Escrow Interest – Construction Accounts 26 15 15. . . . . . . . . . . . . . . . . . . . . . . . . . . . . . . . . . . . . Fund for the Support of Free Public Schools 25,436 ––– –––. . . . . . . . . . . . . . . . . . . . . . . . . . . . . . . . . . General Revenue – Fees 26,884 31,580 32,080. . . . . . . . . . . . . . . . . . . . . . . . . . . . . . . . . . . . . . . . . . . . . . . . . . Higher Education Bond Interest Recoveries 5,270 ––– –––. . . . . . . . . . . . . . . . . . . . . . . . . . . . . . . . . . . Higher Education Capital Improvement Fund – Debt Service Recovery ––– 9,255 11,250. . . . . . . . . . . . . Hotel Occupancy Tax ––– 111,400 86,805. . . . . . . . . . . . . . . . . . . . . . . . . . . . . . . . . . . . . . . . . . . . . . . . . . . . Investment Earnings 26,342 ––– –––. . . . . . . . . . . . . . . . . . . . . . . . . . . . . . . . . . . . . . . . . . . . . . . . . . . . . Miscellaneous Revenue 2,195 260 260. . . . . . . . . . . . . . . . . . . . . . . . . . . . . . . . . . . . . . . . . . . . . . . . . . . NJ Economic Development Authority ––– 22,025 2,200. . . . . . . . . . . . . . . . . . . . . . . . . . . . . . . . . . . . . . . NJ Public Records Preservation ––– ––– 39,000. . . . . . . . . . . . . . . . . . . . . . . . . . . . . . . . . . . . . . . . . . . . New Jersey Redevelopment Authority ––– 9,000 –––. . . . . . . . . . . . . . . . . . . . . . . . . . . . . . . . . . . . . . . New Revenue Securitizations ––– ––– 1,520,000. . . . . . . . . . . . . . . . . . . . . . . . . . . . . . . . . . . . . . . . . . . . . . Nuclear Emergency Response Assessment 4,000 4,011 4,073. . . . . . . . . . . . . . . . . . . . . . . . . . . . . . . . . . . . ODS Mediation Fees 128 158 158. . . . . . . . . . . . . . . . . . . . . . . . . . . . . . . . . . . . . . . . . . . . . . . . . . . . . Public Defender Client Receipts 5,071 5,340 5,340. . . . . . . . . . . . . . . . . . . . . . . . . . . . . . . . . . . . . . . . . . . . Public Utility – Customer Specific Tax 1,986 1,998 1,998. . . . . . . . . . . . . . . . . . . . . . . . . . . . . . . . . . . . . . . Public Utility Fines 472 500 –––. . . . . . . . . . . . . . . . . . . . . . . . . . . . . . . . . . . . . . . . . . . . . . . . . . . . . . Public Utility Gross Receipts and Franchise Taxes (Water/Sewer) 76,491 69,000 69,000. . . . . . . . . . . . . . . . . . Railroad Tax – Class II 3,135 3,100 3,100. . . . . . . . . . . . . . . . . . . . . . . . . . . . . . . . . . . . . . . . . . . . . . . . . . . Railroad Tax – Franchise 1,091 590 590. . . . . . . . . . . . . . . . . . . . . . . . . . . . . . . . . . . . . . . . . . . . . . . . . . Rate Payer Advocate 6,648 6,769 6,769. . . . . . . . . . . . . . . . . . . . . . . . . . . . . . . . . . . . . . . . . . . . . . . . . . . . . Sale of Real Property 942 3,600 18,100. . . . . . . . . . . . . . . . . . . . . . . . . . . . . . . . . . . . . . . . . . . . . . . . . . . . . Second Referral Debt Collection–Hospitals ––– ––– 22,251. . . . . . . . . . . . . . . . . . . . . . . . . . . . . . . . . . . State Disability Benefits Fund 22 ––– –––. . . . . . . . . . . . . . . . . . . . . . . . . . . . . . . . . . . . . . . . . . . . . . Stormwater Management–Combined Sewer Overflow 1,123 ––– –––. . . . . . . . . . . . . . . . . . . . . . . . . . . Surplus Property 724 950 950. . . . . . . . . . . . . . . . . . . . . . . . . . . . . . . . . . . . . . . . . . . . . . . . . . . . . . . . Tax Audit Services – Uncollected Revenue Recovery 239 ––– –––. . . . . . . . . . . . . . . . . . . . . . . . . . . Tax Enforcement ––– ––– 25,000. . . . . . . . . . . . . . . . . . . . . . . . . . . . . . . . . . . . . . . . . . . . . . . . . . . . . . . . Tire Clean–Up Surcharge ––– ––– 12,300. . . . . . . . . . . . . . . . . . . . . . . . . . . . . . . . . . . . . . . . . . . . . . . . . Transitional Energy Facilities Assessment 233,037 211,000 211,000. . . . . . . . . . . . . . . . . . . . . . . . . . . . . . . . . . . . Wireless Communications/Cell Tower Assessment ––– ––– 33,000. . . . . . . . . . . . . . . . . . . . . . . . . . . . .
465,319 536,936 2,176,141
67
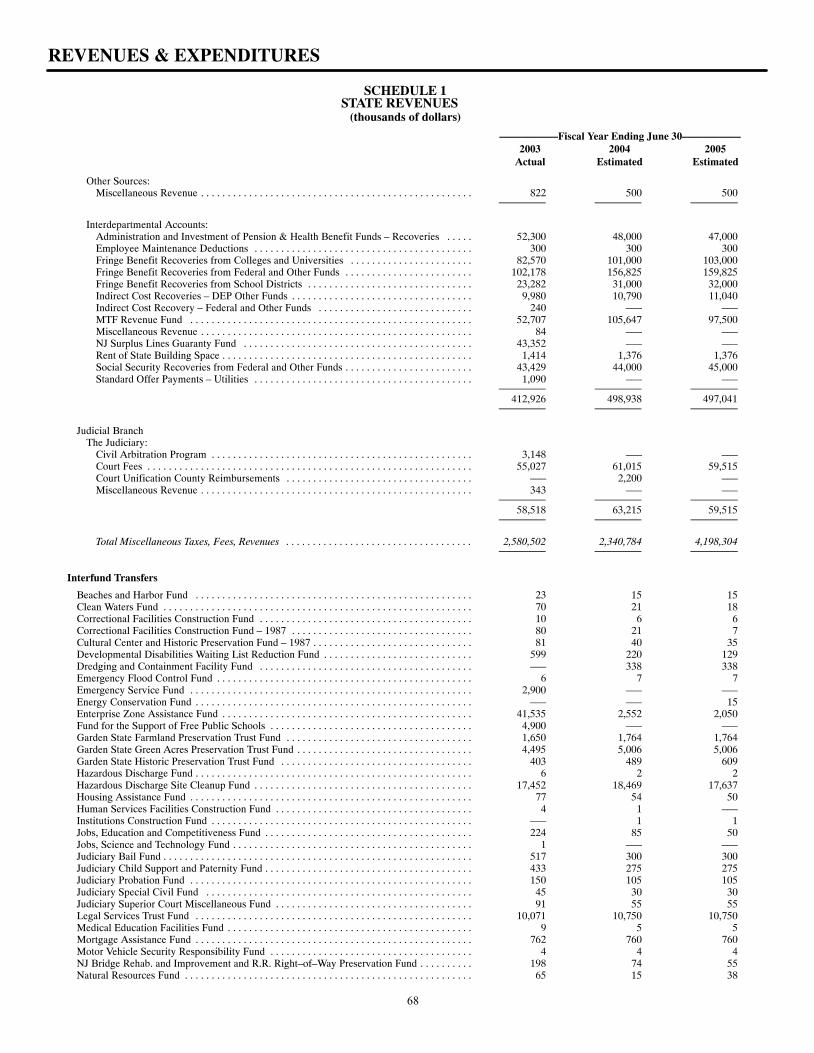
SCHEDULE 1STATE REVENUES
(thousands of dollars)
–––––––––––Fiscal Year Ending June 30–––––––––––2003 2004 2005
Actual Estimated Estimated
REVENUES & EXPENDITURES
Other Sources:Miscellaneous Revenue 822 500 500. . . . . . . . . . . . . . . . . . . . . . . . . . . . . . . . . . . . . . . . . . . . . . . . . . .
Interdepartmental Accounts:Administration and Investment of Pension & Health Benefit Funds – Recoveries 52,300 48,000 47,000. . . . . Employee Maintenance Deductions 300 300 300. . . . . . . . . . . . . . . . . . . . . . . . . . . . . . . . . . . . . . . . . Fringe Benefit Recoveries from Colleges and Universities 82,570 101,000 103,000. . . . . . . . . . . . . . . . . . . . . . . Fringe Benefit Recoveries from Federal and Other Funds 102,178 156,825 159,825. . . . . . . . . . . . . . . . . . . . . . . . Fringe Benefit Recoveries from School Districts 23,282 31,000 32,000. . . . . . . . . . . . . . . . . . . . . . . . . . . . . . . Indirect Cost Recoveries – DEP Other Funds 9,980 10,790 11,040. . . . . . . . . . . . . . . . . . . . . . . . . . . . . . . . . . Indirect Cost Recovery – Federal and Other Funds 240 ––– –––. . . . . . . . . . . . . . . . . . . . . . . . . . . . . MTF Revenue Fund 52,707 105,647 97,500. . . . . . . . . . . . . . . . . . . . . . . . . . . . . . . . . . . . . . . . . . . . . . . . . . . . . Miscellaneous Revenue 84 ––– –––. . . . . . . . . . . . . . . . . . . . . . . . . . . . . . . . . . . . . . . . . . . . . . . . . . . NJ Surplus Lines Guaranty Fund 43,352 ––– –––. . . . . . . . . . . . . . . . . . . . . . . . . . . . . . . . . . . . . . . . . . . Rent of State Building Space 1,414 1,376 1,376. . . . . . . . . . . . . . . . . . . . . . . . . . . . . . . . . . . . . . . . . . . . . . . Social Security Recoveries from Federal and Other Funds 43,429 44,000 45,000. . . . . . . . . . . . . . . . . . . . . . . . Standard Offer Payments – Utilities 1,090 ––– –––. . . . . . . . . . . . . . . . . . . . . . . . . . . . . . . . . . . . . . . . .
412,926 498,938 497,041
Judicial BranchThe Judiciary:
Civil Arbitration Program 3,148 ––– –––. . . . . . . . . . . . . . . . . . . . . . . . . . . . . . . . . . . . . . . . . . . . . . . . . Court Fees 55,027 61,015 59,515. . . . . . . . . . . . . . . . . . . . . . . . . . . . . . . . . . . . . . . . . . . . . . . . . . . . . . . . . . . . . Court Unification County Reimbursements ––– 2,200 –––. . . . . . . . . . . . . . . . . . . . . . . . . . . . . . . . . . . Miscellaneous Revenue 343 ––– –––. . . . . . . . . . . . . . . . . . . . . . . . . . . . . . . . . . . . . . . . . . . . . . . . . . .
58,518 63,215 59,515
Total Miscellaneous Taxes, Fees, Revenues 2,580,502 2,340,784 4,198,304. . . . . . . . . . . . . . . . . . . . . . . . . . . . . . . . . . .
Interfund Transfers
Beaches and Harbor Fund 23 15 15. . . . . . . . . . . . . . . . . . . . . . . . . . . . . . . . . . . . . . . . . . . . . . . . . . . . Clean Waters Fund 70 21 18. . . . . . . . . . . . . . . . . . . . . . . . . . . . . . . . . . . . . . . . . . . . . . . . . . . . . . . . . . Correctional Facilities Construction Fund 10 6 6. . . . . . . . . . . . . . . . . . . . . . . . . . . . . . . . . . . . . . . . Correctional Facilities Construction Fund – 1987 80 21 7. . . . . . . . . . . . . . . . . . . . . . . . . . . . . . . . . . Cultural Center and Historic Preservation Fund – 1987 81 40 35. . . . . . . . . . . . . . . . . . . . . . . . . . . . . . Developmental Disabilities Waiting List Reduction Fund 599 220 129. . . . . . . . . . . . . . . . . . . . . . . . . . . . Dredging and Containment Facility Fund ––– 338 338. . . . . . . . . . . . . . . . . . . . . . . . . . . . . . . . . . . . . . . . Emergency Flood Control Fund 6 7 7. . . . . . . . . . . . . . . . . . . . . . . . . . . . . . . . . . . . . . . . . . . . . . . . Emergency Service Fund 2,900 ––– –––. . . . . . . . . . . . . . . . . . . . . . . . . . . . . . . . . . . . . . . . . . . . . . . . . . . . . Energy Conservation Fund ––– ––– 15. . . . . . . . . . . . . . . . . . . . . . . . . . . . . . . . . . . . . . . . . . . . . . . . . . . . Enterprise Zone Assistance Fund 41,535 2,552 2,050. . . . . . . . . . . . . . . . . . . . . . . . . . . . . . . . . . . . . . . . . . . . . . . Fund for the Support of Free Public Schools 4,900 ––– –––. . . . . . . . . . . . . . . . . . . . . . . . . . . . . . . . . . . . . . Garden State Farmland Preservation Trust Fund 1,650 1,764 1,764. . . . . . . . . . . . . . . . . . . . . . . . . . . . . . . . . . . Garden State Green Acres Preservation Trust Fund 4,495 5,006 5,006. . . . . . . . . . . . . . . . . . . . . . . . . . . . . . . . . Garden State Historic Preservation Trust Fund 403 489 609. . . . . . . . . . . . . . . . . . . . . . . . . . . . . . . . . . . . Hazardous Discharge Fund 6 2 2. . . . . . . . . . . . . . . . . . . . . . . . . . . . . . . . . . . . . . . . . . . . . . . . . . . . Hazardous Discharge Site Cleanup Fund 17,452 18,469 17,637. . . . . . . . . . . . . . . . . . . . . . . . . . . . . . . . . . . . . . . . . Housing Assistance Fund 77 54 50. . . . . . . . . . . . . . . . . . . . . . . . . . . . . . . . . . . . . . . . . . . . . . . . . . . . . Human Services Facilities Construction Fund 4 1 –––. . . . . . . . . . . . . . . . . . . . . . . . . . . . . . . . . . . . . Institutions Construction Fund ––– 1 1. . . . . . . . . . . . . . . . . . . . . . . . . . . . . . . . . . . . . . . . . . . . . . . . . Jobs, Education and Competitiveness Fund 224 85 50. . . . . . . . . . . . . . . . . . . . . . . . . . . . . . . . . . . . . . . Jobs, Science and Technology Fund 1 ––– –––. . . . . . . . . . . . . . . . . . . . . . . . . . . . . . . . . . . . . . . . . . . . . Judiciary Bail Fund 517 300 300. . . . . . . . . . . . . . . . . . . . . . . . . . . . . . . . . . . . . . . . . . . . . . . . . . . . . . . . . . Judiciary Child Support and Paternity Fund 433 275 275. . . . . . . . . . . . . . . . . . . . . . . . . . . . . . . . . . . . . . . Judiciary Probation Fund 150 105 105. . . . . . . . . . . . . . . . . . . . . . . . . . . . . . . . . . . . . . . . . . . . . . . . . . . . . Judiciary Special Civil Fund 45 30 30. . . . . . . . . . . . . . . . . . . . . . . . . . . . . . . . . . . . . . . . . . . . . . . . . . Judiciary Superior Court Miscellaneous Fund 91 55 55. . . . . . . . . . . . . . . . . . . . . . . . . . . . . . . . . . . . . Legal Services Trust Fund 10,071 10,750 10,750. . . . . . . . . . . . . . . . . . . . . . . . . . . . . . . . . . . . . . . . . . . . . . . . . . . . Medical Education Facilities Fund 9 5 5. . . . . . . . . . . . . . . . . . . . . . . . . . . . . . . . . . . . . . . . . . . . . . Mortgage Assistance Fund 762 760 760. . . . . . . . . . . . . . . . . . . . . . . . . . . . . . . . . . . . . . . . . . . . . . . . . . . . Motor Vehicle Security Responsibility Fund 4 4 4. . . . . . . . . . . . . . . . . . . . . . . . . . . . . . . . . . . . . . NJ Bridge Rehab. and Improvement and R.R. Right–of–Way Preservation Fund 198 74 55. . . . . . . . . . Natural Resources Fund 65 15 38. . . . . . . . . . . . . . . . . . . . . . . . . . . . . . . . . . . . . . . . . . . . . . . . . . . . . .
68
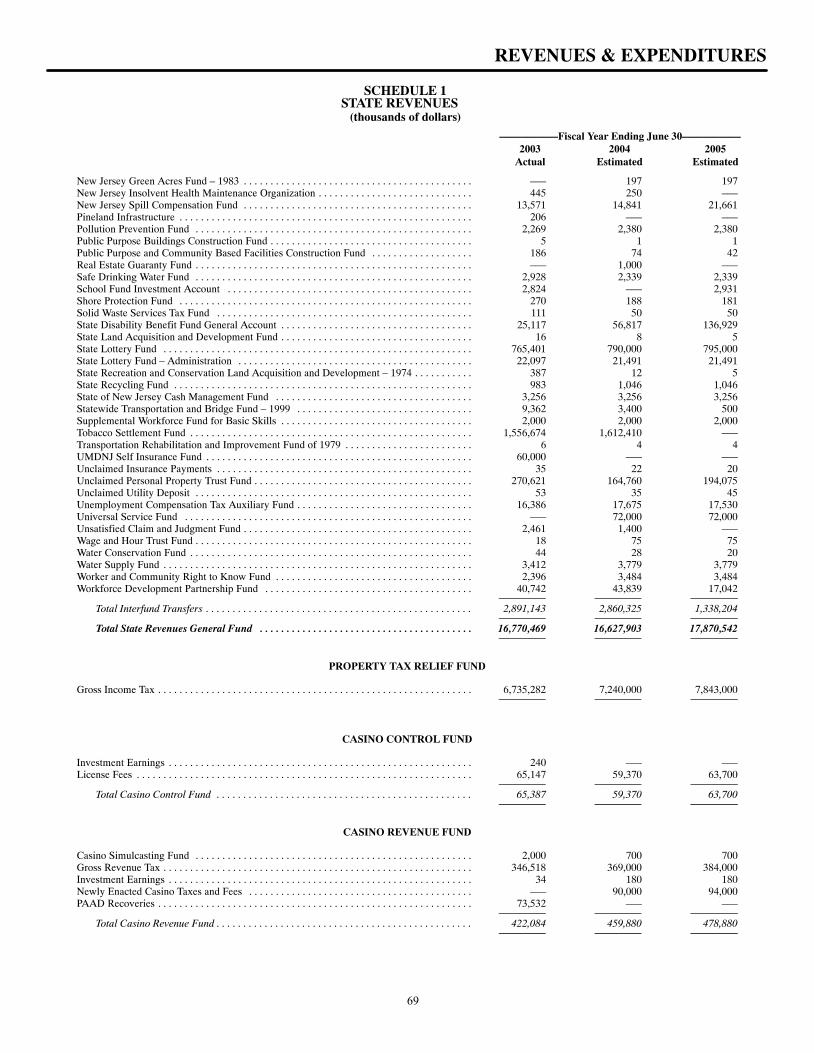
SCHEDULE 1STATE REVENUES
(thousands of dollars)
–––––––––––Fiscal Year Ending June 30–––––––––––2003 2004 2005
Actual Estimated Estimated
REVENUES & EXPENDITURES
New Jersey Green Acres Fund – 1983 ––– 197 197. . . . . . . . . . . . . . . . . . . . . . . . . . . . . . . . . . . . . . . . . . . New Jersey Insolvent Health Maintenance Organization 445 250 –––. . . . . . . . . . . . . . . . . . . . . . . . . . . . . New Jersey Spill Compensation Fund 13,571 14,841 21,661. . . . . . . . . . . . . . . . . . . . . . . . . . . . . . . . . . . . . . . . . . . Pineland Infrastructure 206 ––– –––. . . . . . . . . . . . . . . . . . . . . . . . . . . . . . . . . . . . . . . . . . . . . . . . . . . . . . . Pollution Prevention Fund 2,269 2,380 2,380. . . . . . . . . . . . . . . . . . . . . . . . . . . . . . . . . . . . . . . . . . . . . . . . . . . . Public Purpose Buildings Construction Fund 5 1 1. . . . . . . . . . . . . . . . . . . . . . . . . . . . . . . . . . . . . . Public Purpose and Community Based Facilities Construction Fund 186 74 42. . . . . . . . . . . . . . . . . . . Real Estate Guaranty Fund ––– 1,000 –––. . . . . . . . . . . . . . . . . . . . . . . . . . . . . . . . . . . . . . . . . . . . . . . . . . . . Safe Drinking Water Fund 2,928 2,339 2,339. . . . . . . . . . . . . . . . . . . . . . . . . . . . . . . . . . . . . . . . . . . . . . . . . . . . School Fund Investment Account 2,824 ––– 2,931. . . . . . . . . . . . . . . . . . . . . . . . . . . . . . . . . . . . . . . . . . . . . . Shore Protection Fund 270 188 181. . . . . . . . . . . . . . . . . . . . . . . . . . . . . . . . . . . . . . . . . . . . . . . . . . . . . . . Solid Waste Services Tax Fund 111 50 50. . . . . . . . . . . . . . . . . . . . . . . . . . . . . . . . . . . . . . . . . . . . . . . . State Disability Benefit Fund General Account 25,117 56,817 136,929. . . . . . . . . . . . . . . . . . . . . . . . . . . . . . . . . . . . State Land Acquisition and Development Fund 16 8 5. . . . . . . . . . . . . . . . . . . . . . . . . . . . . . . . . . . . State Lottery Fund 765,401 790,000 795,000. . . . . . . . . . . . . . . . . . . . . . . . . . . . . . . . . . . . . . . . . . . . . . . . . . . . . . . . . . State Lottery Fund – Administration 22,097 21,491 21,491. . . . . . . . . . . . . . . . . . . . . . . . . . . . . . . . . . . . . . . . . . . . State Recreation and Conservation Land Acquisition and Development – 1974 387 12 5. . . . . . . . . . . State Recycling Fund 983 1,046 1,046. . . . . . . . . . . . . . . . . . . . . . . . . . . . . . . . . . . . . . . . . . . . . . . . . . . . . . . . State of New Jersey Cash Management Fund 3,256 3,256 3,256. . . . . . . . . . . . . . . . . . . . . . . . . . . . . . . . . . . . . Statewide Transportation and Bridge Fund – 1999 9,362 3,400 500. . . . . . . . . . . . . . . . . . . . . . . . . . . . . . . . . Supplemental Workforce Fund for Basic Skills 2,000 2,000 2,000. . . . . . . . . . . . . . . . . . . . . . . . . . . . . . . . . . . . Tobacco Settlement Fund 1,556,674 1,612,410 –––. . . . . . . . . . . . . . . . . . . . . . . . . . . . . . . . . . . . . . . . . . . . . . . . . . . . . Transportation Rehabilitation and Improvement Fund of 1979 6 4 4. . . . . . . . . . . . . . . . . . . . . . . . UMDNJ Self Insurance Fund 60,000 ––– –––. . . . . . . . . . . . . . . . . . . . . . . . . . . . . . . . . . . . . . . . . . . . . . . . . . Unclaimed Insurance Payments 35 22 20. . . . . . . . . . . . . . . . . . . . . . . . . . . . . . . . . . . . . . . . . . . . . . . . Unclaimed Personal Property Trust Fund 270,621 164,760 194,075. . . . . . . . . . . . . . . . . . . . . . . . . . . . . . . . . . . . . . . . . Unclaimed Utility Deposit 53 35 45. . . . . . . . . . . . . . . . . . . . . . . . . . . . . . . . . . . . . . . . . . . . . . . . . . . . Unemployment Compensation Tax Auxiliary Fund 16,386 17,675 17,530. . . . . . . . . . . . . . . . . . . . . . . . . . . . . . . . . Universal Service Fund ––– 72,000 72,000. . . . . . . . . . . . . . . . . . . . . . . . . . . . . . . . . . . . . . . . . . . . . . . . . . . . . . Unsatisfied Claim and Judgment Fund 2,461 1,400 –––. . . . . . . . . . . . . . . . . . . . . . . . . . . . . . . . . . . . . . . . . . . Wage and Hour Trust Fund 18 75 75. . . . . . . . . . . . . . . . . . . . . . . . . . . . . . . . . . . . . . . . . . . . . . . . . . . . Water Conservation Fund 44 28 20. . . . . . . . . . . . . . . . . . . . . . . . . . . . . . . . . . . . . . . . . . . . . . . . . . . . . Water Supply Fund 3,412 3,779 3,779. . . . . . . . . . . . . . . . . . . . . . . . . . . . . . . . . . . . . . . . . . . . . . . . . . . . . . . . . . Worker and Community Right to Know Fund 2,396 3,484 3,484. . . . . . . . . . . . . . . . . . . . . . . . . . . . . . . . . . . . . Workforce Development Partnership Fund 40,742 43,839 17,042. . . . . . . . . . . . . . . . . . . . . . . . . . . . . . . . . . . . . . .
Total Interfund Transfers 2,891,143 2,860,325 1,338,204. . . . . . . . . . . . . . . . . . . . . . . . . . . . . . . . . . . . . . . . . . . . . . . . . .
Total State Revenues General Fund 16,770,469 16,627,903 17,870,542. . . . . . . . . . . . . . . . . . . . . . . . . . . . . . . . . . . . . . . .
PROPERTY TAX RELIEF FUND
Gross Income Tax 6,735,282 7,240,000 7,843,000. . . . . . . . . . . . . . . . . . . . . . . . . . . . . . . . . . . . . . . . . . . . . . . . . . . . . . . . . . .
CASINO CONTROL FUND
Investment Earnings 240 ––– –––. . . . . . . . . . . . . . . . . . . . . . . . . . . . . . . . . . . . . . . . . . . . . . . . . . . . . . . . . License Fees 65,147 59,370 63,700. . . . . . . . . . . . . . . . . . . . . . . . . . . . . . . . . . . . . . . . . . . . . . . . . . . . . . . . . . . . . . .
Total Casino Control Fund 65,387 59,370 63,700. . . . . . . . . . . . . . . . . . . . . . . . . . . . . . . . . . . . . . . . . . . . . . . .
CASINO REVENUE FUND
Casino Simulcasting Fund 2,000 700 700. . . . . . . . . . . . . . . . . . . . . . . . . . . . . . . . . . . . . . . . . . . . . . . . . . . . Gross Revenue Tax 346,518 369,000 384,000. . . . . . . . . . . . . . . . . . . . . . . . . . . . . . . . . . . . . . . . . . . . . . . . . . . . . . . . . . Investment Earnings 34 180 180. . . . . . . . . . . . . . . . . . . . . . . . . . . . . . . . . . . . . . . . . . . . . . . . . . . . . . . . . Newly Enacted Casino Taxes and Fees ––– 90,000 94,000. . . . . . . . . . . . . . . . . . . . . . . . . . . . . . . . . . . . . . . . . . PAAD Recoveries 73,532 ––– –––. . . . . . . . . . . . . . . . . . . . . . . . . . . . . . . . . . . . . . . . . . . . . . . . . . . . . . . . . . .
Total Casino Revenue Fund 422,084 459,880 478,880. . . . . . . . . . . . . . . . . . . . . . . . . . . . . . . . . . . . . . . . . . . . . . . .
69
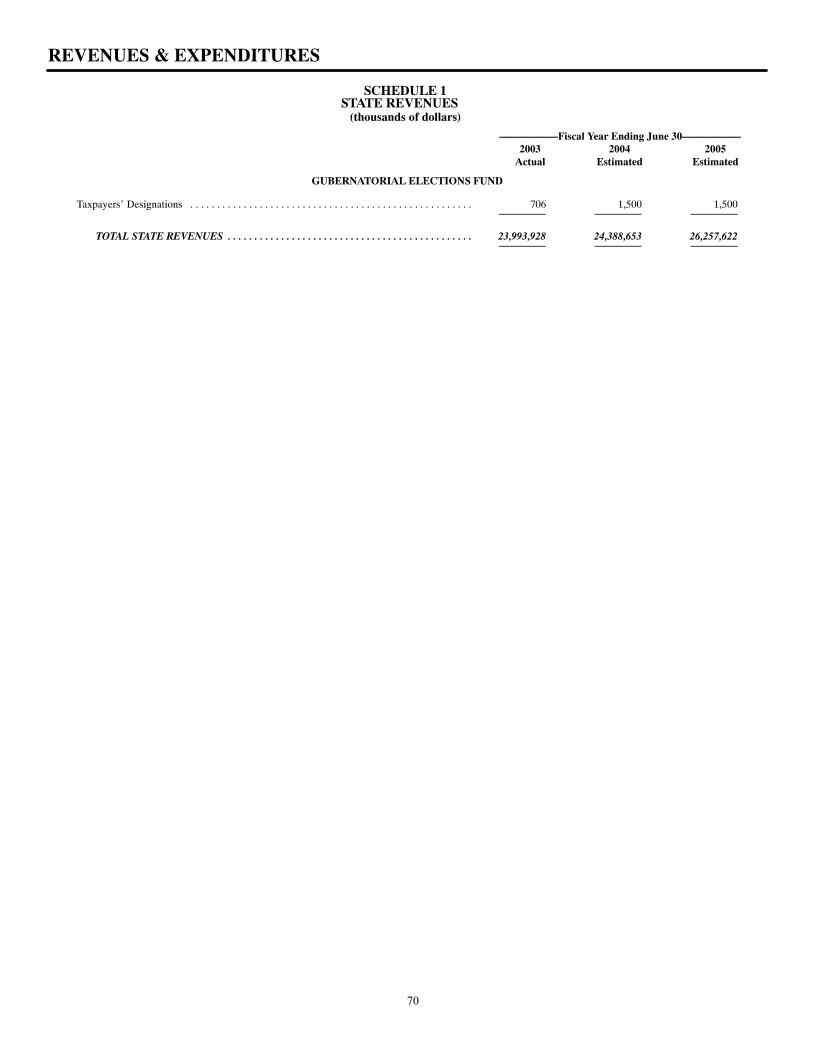
SCHEDULE 1STATE REVENUES
(thousands of dollars)
–––––––––––Fiscal Year Ending June 30–––––––––––2003 2004 2005
Actual Estimated Estimated
REVENUES & EXPENDITURES
GUBERNATORIAL ELECTIONS FUND
Taxpayers’ Designations 706 1,500 1,500. . . . . . . . . . . . . . . . . . . . . . . . . . . . . . . . . . . . . . . . . . . . . . . . . . . . .
TOTAL STATE REVENUES 23,993,928 24,388,653 26,257,622. . . . . . . . . . . . . . . . . . . . . . . . . . . . . . . . . . . . . . . . . . . . . .
70
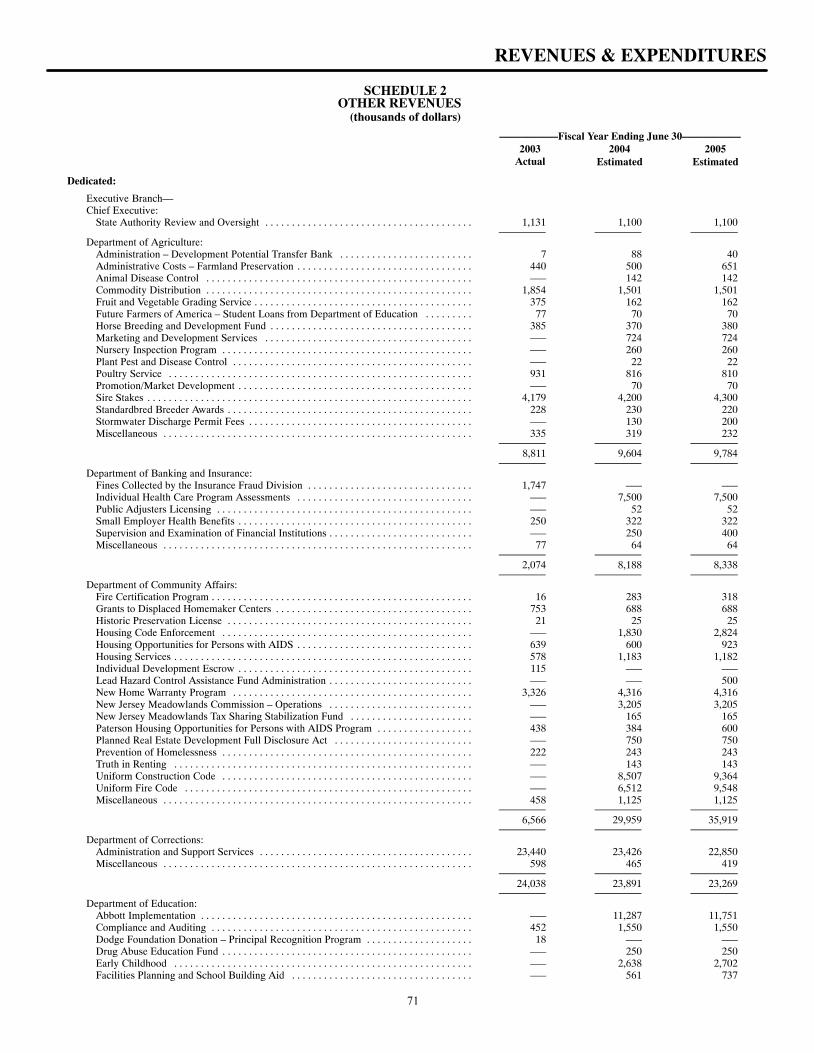
SCHEDULE 2OTHER REVENUES
(thousands of dollars)
–––––––––––Fiscal Year Ending June 30–––––––––––2003 2004 2005
Actual Estimated Estimated
REVENUES & EXPENDITURES
Dedicated:
Executive Branch––Chief Executive:
State Authority Review and Oversight 1,131 1,100 1,100. . . . . . . . . . . . . . . . . . . . . . . . . . . . . . . . . . . . . . .
Department of Agriculture:Administration – Development Potential Transfer Bank 7 88 40. . . . . . . . . . . . . . . . . . . . . . . . . Administrative Costs – Farmland Preservation 440 500 651. . . . . . . . . . . . . . . . . . . . . . . . . . . . . . . . . Animal Disease Control ––– 142 142. . . . . . . . . . . . . . . . . . . . . . . . . . . . . . . . . . . . . . . . . . . . . . . . . . Commodity Distribution 1,854 1,501 1,501. . . . . . . . . . . . . . . . . . . . . . . . . . . . . . . . . . . . . . . . . . . . . . . . . . Fruit and Vegetable Grading Service 375 162 162. . . . . . . . . . . . . . . . . . . . . . . . . . . . . . . . . . . . . . . . . Future Farmers of America – Student Loans from Department of Education 77 70 70. . . . . . . . . Horse Breeding and Development Fund 385 370 380. . . . . . . . . . . . . . . . . . . . . . . . . . . . . . . . . . . . . . Marketing and Development Services ––– 724 724. . . . . . . . . . . . . . . . . . . . . . . . . . . . . . . . . . . . . . . Nursery Inspection Program ––– 260 260. . . . . . . . . . . . . . . . . . . . . . . . . . . . . . . . . . . . . . . . . . . . . . . Plant Pest and Disease Control ––– 22 22. . . . . . . . . . . . . . . . . . . . . . . . . . . . . . . . . . . . . . . . . . . . . Poultry Service 931 816 810. . . . . . . . . . . . . . . . . . . . . . . . . . . . . . . . . . . . . . . . . . . . . . . . . . . . . . . . . Promotion/Market Development ––– 70 70. . . . . . . . . . . . . . . . . . . . . . . . . . . . . . . . . . . . . . . . . . . . Sire Stakes 4,179 4,200 4,300. . . . . . . . . . . . . . . . . . . . . . . . . . . . . . . . . . . . . . . . . . . . . . . . . . . . . . . . . . . . . Standardbred Breeder Awards 228 230 220. . . . . . . . . . . . . . . . . . . . . . . . . . . . . . . . . . . . . . . . . . . . . . Stormwater Discharge Permit Fees ––– 130 200. . . . . . . . . . . . . . . . . . . . . . . . . . . . . . . . . . . . . . . . . . Miscellaneous 335 319 232. . . . . . . . . . . . . . . . . . . . . . . . . . . . . . . . . . . . . . . . . . . . . . . . . . . . . . . . . .
8,811 9,604 9,784
Department of Banking and Insurance:Fines Collected by the Insurance Fraud Division 1,747 ––– –––. . . . . . . . . . . . . . . . . . . . . . . . . . . . . . . Individual Health Care Program Assessments ––– 7,500 7,500. . . . . . . . . . . . . . . . . . . . . . . . . . . . . . . . . Public Adjusters Licensing ––– 52 52. . . . . . . . . . . . . . . . . . . . . . . . . . . . . . . . . . . . . . . . . . . . . . . . Small Employer Health Benefits 250 322 322. . . . . . . . . . . . . . . . . . . . . . . . . . . . . . . . . . . . . . . . . . . . Supervision and Examination of Financial Institutions ––– 250 400. . . . . . . . . . . . . . . . . . . . . . . . . . . Miscellaneous 77 64 64. . . . . . . . . . . . . . . . . . . . . . . . . . . . . . . . . . . . . . . . . . . . . . . . . . . . . . . . . .
2,074 8,188 8,338
Department of Community Affairs:Fire Certification Program 16 283 318. . . . . . . . . . . . . . . . . . . . . . . . . . . . . . . . . . . . . . . . . . . . . . . . . Grants to Displaced Homemaker Centers 753 688 688. . . . . . . . . . . . . . . . . . . . . . . . . . . . . . . . . . . . . Historic Preservation License 21 25 25. . . . . . . . . . . . . . . . . . . . . . . . . . . . . . . . . . . . . . . . . . . . . . Housing Code Enforcement ––– 1,830 2,824. . . . . . . . . . . . . . . . . . . . . . . . . . . . . . . . . . . . . . . . . . . . . . . Housing Opportunities for Persons with AIDS 639 600 923. . . . . . . . . . . . . . . . . . . . . . . . . . . . . . . . . Housing Services 578 1,183 1,182. . . . . . . . . . . . . . . . . . . . . . . . . . . . . . . . . . . . . . . . . . . . . . . . . . . . . . . . Individual Development Escrow 115 ––– –––. . . . . . . . . . . . . . . . . . . . . . . . . . . . . . . . . . . . . . . . . . . . Lead Hazard Control Assistance Fund Administration ––– ––– 500. . . . . . . . . . . . . . . . . . . . . . . . . . . New Home Warranty Program 3,326 4,316 4,316. . . . . . . . . . . . . . . . . . . . . . . . . . . . . . . . . . . . . . . . . . . . . New Jersey Meadowlands Commission – Operations ––– 3,205 3,205. . . . . . . . . . . . . . . . . . . . . . . . . . . New Jersey Meadowlands Tax Sharing Stabilization Fund ––– 165 165. . . . . . . . . . . . . . . . . . . . . . . Paterson Housing Opportunities for Persons with AIDS Program 438 384 600. . . . . . . . . . . . . . . . . . Planned Real Estate Development Full Disclosure Act ––– 750 750. . . . . . . . . . . . . . . . . . . . . . . . . . Prevention of Homelessness 222 243 243. . . . . . . . . . . . . . . . . . . . . . . . . . . . . . . . . . . . . . . . . . . . . . . Truth in Renting ––– 143 143. . . . . . . . . . . . . . . . . . . . . . . . . . . . . . . . . . . . . . . . . . . . . . . . . . . . . . . . Uniform Construction Code ––– 8,507 9,364. . . . . . . . . . . . . . . . . . . . . . . . . . . . . . . . . . . . . . . . . . . . . . . Uniform Fire Code ––– 6,512 9,548. . . . . . . . . . . . . . . . . . . . . . . . . . . . . . . . . . . . . . . . . . . . . . . . . . . . . . Miscellaneous 458 1,125 1,125. . . . . . . . . . . . . . . . . . . . . . . . . . . . . . . . . . . . . . . . . . . . . . . . . . . . . . . . . .
6,566 29,959 35,919
Department of Corrections:Administration and Support Services 23,440 23,426 22,850. . . . . . . . . . . . . . . . . . . . . . . . . . . . . . . . . . . . . . . . Miscellaneous 598 465 419. . . . . . . . . . . . . . . . . . . . . . . . . . . . . . . . . . . . . . . . . . . . . . . . . . . . . . . . . .
24,038 23,891 23,269
Department of Education:Abbott Implementation ––– 11,287 11,751. . . . . . . . . . . . . . . . . . . . . . . . . . . . . . . . . . . . . . . . . . . . . . . . . . . Compliance and Auditing 452 1,550 1,550. . . . . . . . . . . . . . . . . . . . . . . . . . . . . . . . . . . . . . . . . . . . . . . . . Dodge Foundation Donation – Principal Recognition Program 18 ––– –––. . . . . . . . . . . . . . . . . . . . Drug Abuse Education Fund ––– 250 250. . . . . . . . . . . . . . . . . . . . . . . . . . . . . . . . . . . . . . . . . . . . . . . Early Childhood ––– 2,638 2,702. . . . . . . . . . . . . . . . . . . . . . . . . . . . . . . . . . . . . . . . . . . . . . . . . . . . . . . . Facilities Planning and School Building Aid ––– 561 737. . . . . . . . . . . . . . . . . . . . . . . . . . . . . . . . . .
71
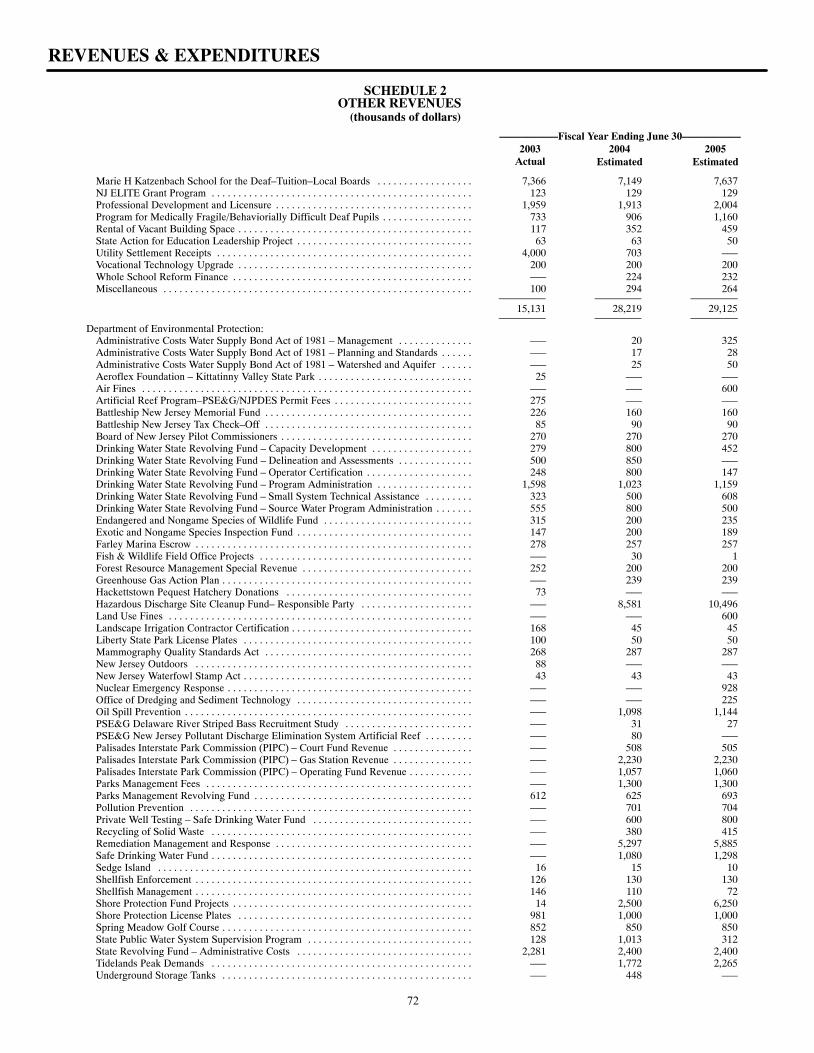
SCHEDULE 2OTHER REVENUES
(thousands of dollars)
–––––––––––Fiscal Year Ending June 30–––––––––––2003 2004 2005
Actual Estimated Estimated
REVENUES & EXPENDITURES
Marie H Katzenbach School for the Deaf–Tuition–Local Boards 7,366 7,149 7,637. . . . . . . . . . . . . . . . . . NJ ELITE Grant Program 123 129 129. . . . . . . . . . . . . . . . . . . . . . . . . . . . . . . . . . . . . . . . . . . . . . . . . Professional Development and Licensure 1,959 1,913 2,004. . . . . . . . . . . . . . . . . . . . . . . . . . . . . . . . . . . . . Program for Medically Fragile/Behaviorially Difficult Deaf Pupils 733 906 1,160. . . . . . . . . . . . . . . . . Rental of Vacant Building Space 117 352 459. . . . . . . . . . . . . . . . . . . . . . . . . . . . . . . . . . . . . . . . . . . . State Action for Education Leadership Project 63 63 50. . . . . . . . . . . . . . . . . . . . . . . . . . . . . . . . . Utility Settlement Receipts 4,000 703 –––. . . . . . . . . . . . . . . . . . . . . . . . . . . . . . . . . . . . . . . . . . . . . . . . Vocational Technology Upgrade 200 200 200. . . . . . . . . . . . . . . . . . . . . . . . . . . . . . . . . . . . . . . . . . . . Whole School Reform Finance ––– 224 232. . . . . . . . . . . . . . . . . . . . . . . . . . . . . . . . . . . . . . . . . . . . . Miscellaneous 100 294 264. . . . . . . . . . . . . . . . . . . . . . . . . . . . . . . . . . . . . . . . . . . . . . . . . . . . . . . . . .
15,131 28,219 29,125
Department of Environmental Protection:Administrative Costs Water Supply Bond Act of 1981 – Management ––– 20 325. . . . . . . . . . . . . . Administrative Costs Water Supply Bond Act of 1981 – Planning and Standards ––– 17 28. . . . . . Administrative Costs Water Supply Bond Act of 1981 – Watershed and Aquifer ––– 25 50. . . . . . Aeroflex Foundation – Kittatinny Valley State Park 25 ––– –––. . . . . . . . . . . . . . . . . . . . . . . . . . . . . Air Fines ––– ––– 600. . . . . . . . . . . . . . . . . . . . . . . . . . . . . . . . . . . . . . . . . . . . . . . . . . . . . . . . . . . . . . Artificial Reef Program–PSE&G/NJPDES Permit Fees 275 ––– –––. . . . . . . . . . . . . . . . . . . . . . . . . . Battleship New Jersey Memorial Fund 226 160 160. . . . . . . . . . . . . . . . . . . . . . . . . . . . . . . . . . . . . . . Battleship New Jersey Tax Check–Off 85 90 90. . . . . . . . . . . . . . . . . . . . . . . . . . . . . . . . . . . . . . . Board of New Jersey Pilot Commissioners 270 270 270. . . . . . . . . . . . . . . . . . . . . . . . . . . . . . . . . . . . Drinking Water State Revolving Fund – Capacity Development 279 800 452. . . . . . . . . . . . . . . . . . . Drinking Water State Revolving Fund – Delineation and Assessments 500 850 –––. . . . . . . . . . . . . . Drinking Water State Revolving Fund – Operator Certification 248 800 147. . . . . . . . . . . . . . . . . . . . Drinking Water State Revolving Fund – Program Administration 1,598 1,023 1,159. . . . . . . . . . . . . . . . . . Drinking Water State Revolving Fund – Small System Technical Assistance 323 500 608. . . . . . . . . Drinking Water State Revolving Fund – Source Water Program Administration 555 800 500. . . . . . . Endangered and Nongame Species of Wildlife Fund 315 200 235. . . . . . . . . . . . . . . . . . . . . . . . . . . . Exotic and Nongame Species Inspection Fund 147 200 189. . . . . . . . . . . . . . . . . . . . . . . . . . . . . . . . . Farley Marina Escrow 278 257 257. . . . . . . . . . . . . . . . . . . . . . . . . . . . . . . . . . . . . . . . . . . . . . . . . . . . Fish & Wildlife Field Office Projects ––– 30 1. . . . . . . . . . . . . . . . . . . . . . . . . . . . . . . . . . . . . . . . Forest Resource Management Special Revenue 252 200 200. . . . . . . . . . . . . . . . . . . . . . . . . . . . . . . . Greenhouse Gas Action Plan ––– 239 239. . . . . . . . . . . . . . . . . . . . . . . . . . . . . . . . . . . . . . . . . . . . . . . Hackettstown Pequest Hatchery Donations 73 ––– –––. . . . . . . . . . . . . . . . . . . . . . . . . . . . . . . . . . . Hazardous Discharge Site Cleanup Fund– Responsible Party ––– 8,581 10,496. . . . . . . . . . . . . . . . . . . . . Land Use Fines ––– ––– 600. . . . . . . . . . . . . . . . . . . . . . . . . . . . . . . . . . . . . . . . . . . . . . . . . . . . . . . . . Landscape Irrigation Contractor Certification 168 45 45. . . . . . . . . . . . . . . . . . . . . . . . . . . . . . . . . . Liberty State Park License Plates 100 50 50. . . . . . . . . . . . . . . . . . . . . . . . . . . . . . . . . . . . . . . . . . . Mammography Quality Standards Act 268 287 287. . . . . . . . . . . . . . . . . . . . . . . . . . . . . . . . . . . . . . . New Jersey Outdoors 88 ––– –––. . . . . . . . . . . . . . . . . . . . . . . . . . . . . . . . . . . . . . . . . . . . . . . . . . . . New Jersey Waterfowl Stamp Act 43 43 43. . . . . . . . . . . . . . . . . . . . . . . . . . . . . . . . . . . . . . . . . . . Nuclear Emergency Response ––– ––– 928. . . . . . . . . . . . . . . . . . . . . . . . . . . . . . . . . . . . . . . . . . . . . . Office of Dredging and Sediment Technology ––– ––– 225. . . . . . . . . . . . . . . . . . . . . . . . . . . . . . . . . Oil Spill Prevention ––– 1,098 1,144. . . . . . . . . . . . . . . . . . . . . . . . . . . . . . . . . . . . . . . . . . . . . . . . . . . . . . PSE&G Delaware River Striped Bass Recruitment Study ––– 31 27. . . . . . . . . . . . . . . . . . . . . . . . PSE&G New Jersey Pollutant Discharge Elimination System Artificial Reef ––– 80 –––. . . . . . . . . Palisades Interstate Park Commission (PIPC) – Court Fund Revenue ––– 508 505. . . . . . . . . . . . . . . Palisades Interstate Park Commission (PIPC) – Gas Station Revenue ––– 2,230 2,230. . . . . . . . . . . . . . . Palisades Interstate Park Commission (PIPC) – Operating Fund Revenue ––– 1,057 1,060. . . . . . . . . . . . Parks Management Fees ––– 1,300 1,300. . . . . . . . . . . . . . . . . . . . . . . . . . . . . . . . . . . . . . . . . . . . . . . . . . Parks Management Revolving Fund 612 625 693. . . . . . . . . . . . . . . . . . . . . . . . . . . . . . . . . . . . . . . . . Pollution Prevention ––– 701 704. . . . . . . . . . . . . . . . . . . . . . . . . . . . . . . . . . . . . . . . . . . . . . . . . . . . . Private Well Testing – Safe Drinking Water Fund ––– 600 800. . . . . . . . . . . . . . . . . . . . . . . . . . . . . . Recycling of Solid Waste ––– 380 415. . . . . . . . . . . . . . . . . . . . . . . . . . . . . . . . . . . . . . . . . . . . . . . . . Remediation Management and Response ––– 5,297 5,885. . . . . . . . . . . . . . . . . . . . . . . . . . . . . . . . . . . . . Safe Drinking Water Fund ––– 1,080 1,298. . . . . . . . . . . . . . . . . . . . . . . . . . . . . . . . . . . . . . . . . . . . . . . . . Sedge Island 16 15 10. . . . . . . . . . . . . . . . . . . . . . . . . . . . . . . . . . . . . . . . . . . . . . . . . . . . . . . . . . . Shellfish Enforcement 126 130 130. . . . . . . . . . . . . . . . . . . . . . . . . . . . . . . . . . . . . . . . . . . . . . . . . . . . Shellfish Management 146 110 72. . . . . . . . . . . . . . . . . . . . . . . . . . . . . . . . . . . . . . . . . . . . . . . . . . . . Shore Protection Fund Projects 14 2,500 6,250. . . . . . . . . . . . . . . . . . . . . . . . . . . . . . . . . . . . . . . . . . . . . Shore Protection License Plates 981 1,000 1,000. . . . . . . . . . . . . . . . . . . . . . . . . . . . . . . . . . . . . . . . . . . . Spring Meadow Golf Course 852 850 850. . . . . . . . . . . . . . . . . . . . . . . . . . . . . . . . . . . . . . . . . . . . . . . State Public Water System Supervision Program 128 1,013 312. . . . . . . . . . . . . . . . . . . . . . . . . . . . . . . State Revolving Fund – Administrative Costs 2,281 2,400 2,400. . . . . . . . . . . . . . . . . . . . . . . . . . . . . . . . . Tidelands Peak Demands ––– 1,772 2,265. . . . . . . . . . . . . . . . . . . . . . . . . . . . . . . . . . . . . . . . . . . . . . . . . Underground Storage Tanks ––– 448 –––. . . . . . . . . . . . . . . . . . . . . . . . . . . . . . . . . . . . . . . . . . . . . . .
72
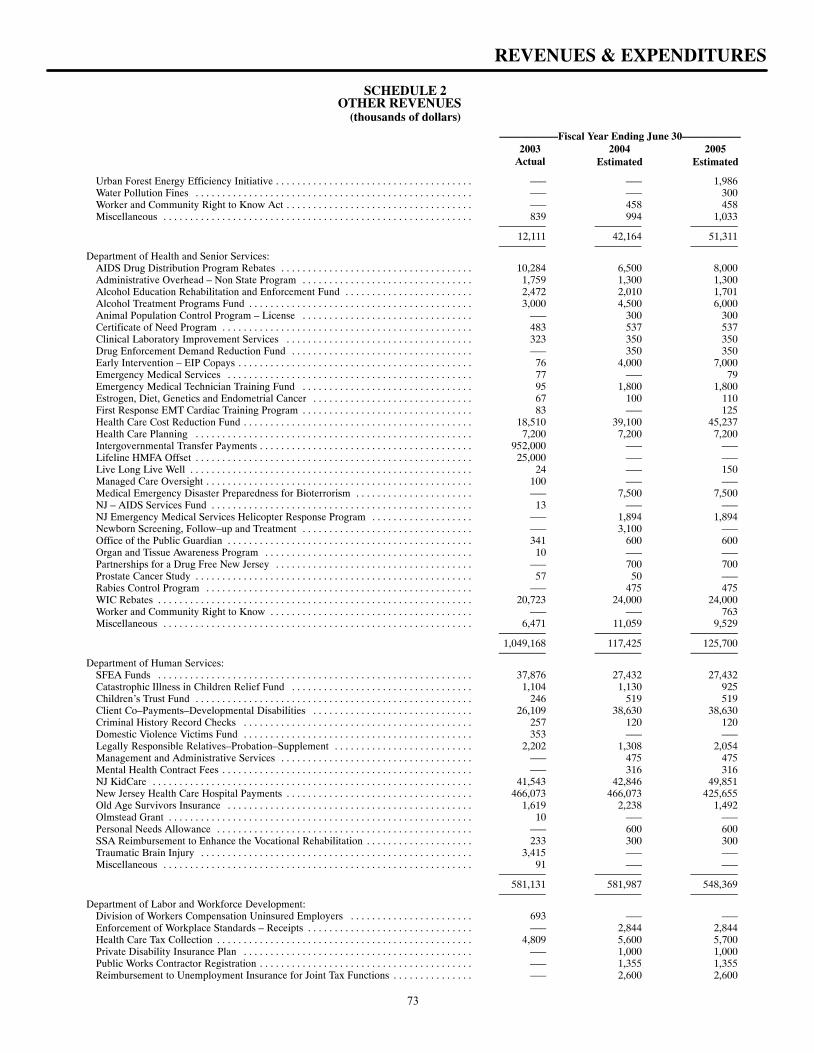
SCHEDULE 2OTHER REVENUES
(thousands of dollars)
–––––––––––Fiscal Year Ending June 30–––––––––––2003 2004 2005
Actual Estimated Estimated
REVENUES & EXPENDITURES
Urban Forest Energy Efficiency Initiative ––– ––– 1,986. . . . . . . . . . . . . . . . . . . . . . . . . . . . . . . . . . . . . Water Pollution Fines ––– ––– 300. . . . . . . . . . . . . . . . . . . . . . . . . . . . . . . . . . . . . . . . . . . . . . . . . . . . Worker and Community Right to Know Act ––– 458 458. . . . . . . . . . . . . . . . . . . . . . . . . . . . . . . . . . . Miscellaneous 839 994 1,033. . . . . . . . . . . . . . . . . . . . . . . . . . . . . . . . . . . . . . . . . . . . . . . . . . . . . . . . . .
12,111 42,164 51,311
Department of Health and Senior Services:AIDS Drug Distribution Program Rebates 10,284 6,500 8,000. . . . . . . . . . . . . . . . . . . . . . . . . . . . . . . . . . . . Administrative Overhead – Non State Program 1,759 1,300 1,300. . . . . . . . . . . . . . . . . . . . . . . . . . . . . . . . Alcohol Education Rehabilitation and Enforcement Fund 2,472 2,010 1,701. . . . . . . . . . . . . . . . . . . . . . . . Alcohol Treatment Programs Fund 3,000 4,500 6,000. . . . . . . . . . . . . . . . . . . . . . . . . . . . . . . . . . . . . . . . . . Animal Population Control Program – License ––– 300 300. . . . . . . . . . . . . . . . . . . . . . . . . . . . . . . . Certificate of Need Program 483 537 537. . . . . . . . . . . . . . . . . . . . . . . . . . . . . . . . . . . . . . . . . . . . . . . Clinical Laboratory Improvement Services 323 350 350. . . . . . . . . . . . . . . . . . . . . . . . . . . . . . . . . . . Drug Enforcement Demand Reduction Fund ––– 350 350. . . . . . . . . . . . . . . . . . . . . . . . . . . . . . . . . . Early Intervention – EIP Copays 76 4,000 7,000. . . . . . . . . . . . . . . . . . . . . . . . . . . . . . . . . . . . . . . . . . . . Emergency Medical Services 77 ––– 79. . . . . . . . . . . . . . . . . . . . . . . . . . . . . . . . . . . . . . . . . . . . . . Emergency Medical Technician Training Fund 95 1,800 1,800. . . . . . . . . . . . . . . . . . . . . . . . . . . . . . . . Estrogen, Diet, Genetics and Endometrial Cancer 67 100 110. . . . . . . . . . . . . . . . . . . . . . . . . . . . . . First Response EMT Cardiac Training Program 83 ––– 125. . . . . . . . . . . . . . . . . . . . . . . . . . . . . . . . Health Care Cost Reduction Fund 18,510 39,100 45,237. . . . . . . . . . . . . . . . . . . . . . . . . . . . . . . . . . . . . . . . . . . Health Care Planning 7,200 7,200 7,200. . . . . . . . . . . . . . . . . . . . . . . . . . . . . . . . . . . . . . . . . . . . . . . . . . . . Intergovernmental Transfer Payments 952,000 ––– –––. . . . . . . . . . . . . . . . . . . . . . . . . . . . . . . . . . . . . . . . Lifeline HMFA Offset 25,000 ––– –––. . . . . . . . . . . . . . . . . . . . . . . . . . . . . . . . . . . . . . . . . . . . . . . . . . . . Live Long Live Well 24 ––– 150. . . . . . . . . . . . . . . . . . . . . . . . . . . . . . . . . . . . . . . . . . . . . . . . . . . . . Managed Care Oversight 100 ––– –––. . . . . . . . . . . . . . . . . . . . . . . . . . . . . . . . . . . . . . . . . . . . . . . . . . Medical Emergency Disaster Preparedness for Bioterrorism ––– 7,500 7,500. . . . . . . . . . . . . . . . . . . . . . NJ – AIDS Services Fund 13 ––– –––. . . . . . . . . . . . . . . . . . . . . . . . . . . . . . . . . . . . . . . . . . . . . . . . . NJ Emergency Medical Services Helicopter Response Program ––– 1,894 1,894. . . . . . . . . . . . . . . . . . . Newborn Screening, Follow–up and Treatment ––– 3,100 –––. . . . . . . . . . . . . . . . . . . . . . . . . . . . . . . . Office of the Public Guardian 341 600 600. . . . . . . . . . . . . . . . . . . . . . . . . . . . . . . . . . . . . . . . . . . . . . Organ and Tissue Awareness Program 10 ––– –––. . . . . . . . . . . . . . . . . . . . . . . . . . . . . . . . . . . . . . . Partnerships for a Drug Free New Jersey ––– 700 700. . . . . . . . . . . . . . . . . . . . . . . . . . . . . . . . . . . . . Prostate Cancer Study 57 50 –––. . . . . . . . . . . . . . . . . . . . . . . . . . . . . . . . . . . . . . . . . . . . . . . . . . . . Rabies Control Program ––– 475 475. . . . . . . . . . . . . . . . . . . . . . . . . . . . . . . . . . . . . . . . . . . . . . . . . . WIC Rebates 20,723 24,000 24,000. . . . . . . . . . . . . . . . . . . . . . . . . . . . . . . . . . . . . . . . . . . . . . . . . . . . . . . . . . . Worker and Community Right to Know ––– ––– 763. . . . . . . . . . . . . . . . . . . . . . . . . . . . . . . . . . . . . . Miscellaneous 6,471 11,059 9,529. . . . . . . . . . . . . . . . . . . . . . . . . . . . . . . . . . . . . . . . . . . . . . . . . . . . . . . . . .
1,049,168 117,425 125,700
Department of Human Services:SFEA Funds 37,876 27,432 27,432. . . . . . . . . . . . . . . . . . . . . . . . . . . . . . . . . . . . . . . . . . . . . . . . . . . . . . . . . . . Catastrophic Illness in Children Relief Fund 1,104 1,130 925. . . . . . . . . . . . . . . . . . . . . . . . . . . . . . . . . . Children’s Trust Fund 246 519 519. . . . . . . . . . . . . . . . . . . . . . . . . . . . . . . . . . . . . . . . . . . . . . . . . . . . Client Co–Payments–Developmental Disabilities 26,109 38,630 38,630. . . . . . . . . . . . . . . . . . . . . . . . . . . . . . Criminal History Record Checks 257 120 120. . . . . . . . . . . . . . . . . . . . . . . . . . . . . . . . . . . . . . . . . . . Domestic Violence Victims Fund 353 ––– –––. . . . . . . . . . . . . . . . . . . . . . . . . . . . . . . . . . . . . . . . . . . Legally Responsible Relatives–Probation–Supplement 2,202 1,308 2,054. . . . . . . . . . . . . . . . . . . . . . . . . . Management and Administrative Services ––– 475 475. . . . . . . . . . . . . . . . . . . . . . . . . . . . . . . . . . . . Mental Health Contract Fees ––– 316 316. . . . . . . . . . . . . . . . . . . . . . . . . . . . . . . . . . . . . . . . . . . . . . . NJ KidCare 41,543 42,846 49,851. . . . . . . . . . . . . . . . . . . . . . . . . . . . . . . . . . . . . . . . . . . . . . . . . . . . . . . . . . . . New Jersey Health Care Hospital Payments 466,073 466,073 425,655. . . . . . . . . . . . . . . . . . . . . . . . . . . . . . . . . . . Old Age Survivors Insurance 1,619 2,238 1,492. . . . . . . . . . . . . . . . . . . . . . . . . . . . . . . . . . . . . . . . . . . . . . Olmstead Grant 10 ––– –––. . . . . . . . . . . . . . . . . . . . . . . . . . . . . . . . . . . . . . . . . . . . . . . . . . . . . . . . . Personal Needs Allowance ––– 600 600. . . . . . . . . . . . . . . . . . . . . . . . . . . . . . . . . . . . . . . . . . . . . . . . SSA Reimbursement to Enhance the Vocational Rehabilitation 233 300 300. . . . . . . . . . . . . . . . . . . . Traumatic Brain Injury 3,415 ––– –––. . . . . . . . . . . . . . . . . . . . . . . . . . . . . . . . . . . . . . . . . . . . . . . . . . . Miscellaneous 91 ––– –––. . . . . . . . . . . . . . . . . . . . . . . . . . . . . . . . . . . . . . . . . . . . . . . . . . . . . . . . . .
581,131 581,987 548,369
Department of Labor and Workforce Development:Division of Workers Compensation Uninsured Employers 693 ––– –––. . . . . . . . . . . . . . . . . . . . . . . Enforcement of Workplace Standards – Receipts ––– 2,844 2,844. . . . . . . . . . . . . . . . . . . . . . . . . . . . . . . Health Care Tax Collection 4,809 5,600 5,700. . . . . . . . . . . . . . . . . . . . . . . . . . . . . . . . . . . . . . . . . . . . . . . . Private Disability Insurance Plan ––– 1,000 1,000. . . . . . . . . . . . . . . . . . . . . . . . . . . . . . . . . . . . . . . . . . . Public Works Contractor Registration ––– 1,355 1,355. . . . . . . . . . . . . . . . . . . . . . . . . . . . . . . . . . . . . . . . Reimbursement to Unemployment Insurance for Joint Tax Functions ––– 2,600 2,600. . . . . . . . . . . . . . .
73
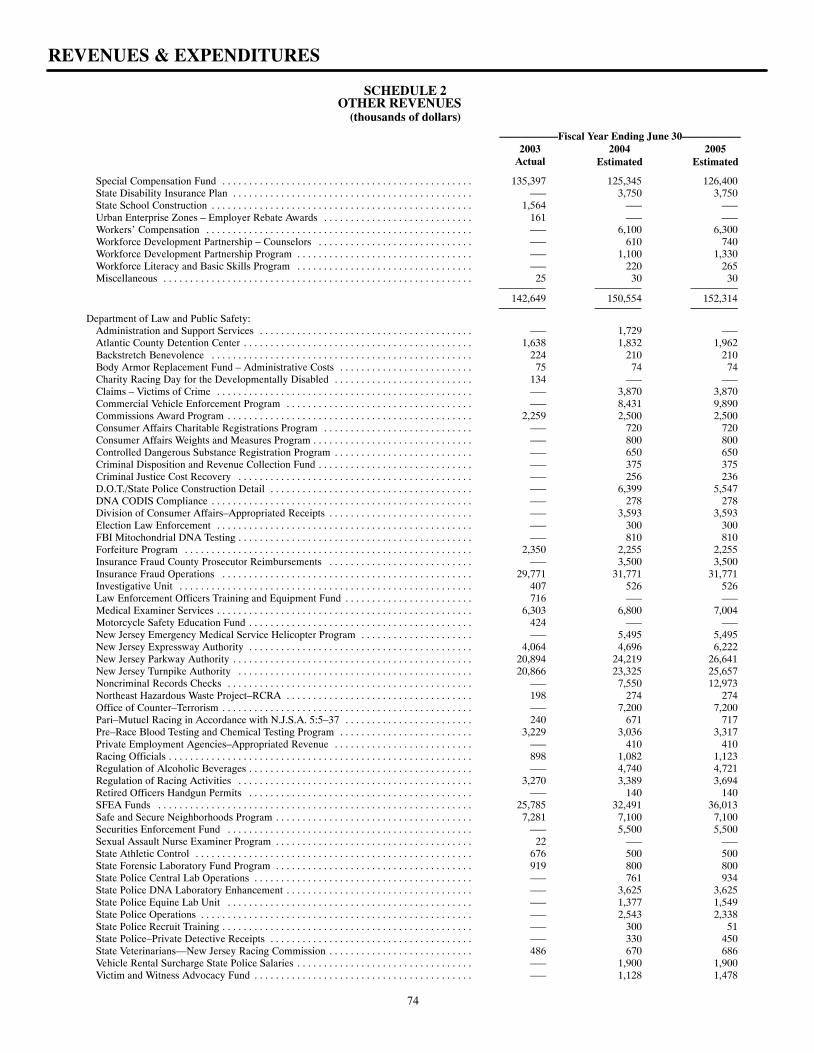
SCHEDULE 2OTHER REVENUES
(thousands of dollars)
–––––––––––Fiscal Year Ending June 30–––––––––––2003 2004 2005
Actual Estimated Estimated
REVENUES & EXPENDITURES
Special Compensation Fund 135,397 125,345 126,400. . . . . . . . . . . . . . . . . . . . . . . . . . . . . . . . . . . . . . . . . . . . . . . State Disability Insurance Plan ––– 3,750 3,750. . . . . . . . . . . . . . . . . . . . . . . . . . . . . . . . . . . . . . . . . . . . . State School Construction 1,564 ––– –––. . . . . . . . . . . . . . . . . . . . . . . . . . . . . . . . . . . . . . . . . . . . . . . . . Urban Enterprise Zones – Employer Rebate Awards 161 ––– –––. . . . . . . . . . . . . . . . . . . . . . . . . . . . Workers’ Compensation ––– 6,100 6,300. . . . . . . . . . . . . . . . . . . . . . . . . . . . . . . . . . . . . . . . . . . . . . . . . . Workforce Development Partnership – Counselors ––– 610 740. . . . . . . . . . . . . . . . . . . . . . . . . . . . . Workforce Development Partnership Program ––– 1,100 1,330. . . . . . . . . . . . . . . . . . . . . . . . . . . . . . . . . Workforce Literacy and Basic Skills Program ––– 220 265. . . . . . . . . . . . . . . . . . . . . . . . . . . . . . . . . Miscellaneous 25 30 30. . . . . . . . . . . . . . . . . . . . . . . . . . . . . . . . . . . . . . . . . . . . . . . . . . . . . . . . . .
142,649 150,554 152,314
Department of Law and Public Safety:Administration and Support Services ––– 1,729 –––. . . . . . . . . . . . . . . . . . . . . . . . . . . . . . . . . . . . . . . . Atlantic County Detention Center 1,638 1,832 1,962. . . . . . . . . . . . . . . . . . . . . . . . . . . . . . . . . . . . . . . . . . . Backstretch Benevolence 224 210 210. . . . . . . . . . . . . . . . . . . . . . . . . . . . . . . . . . . . . . . . . . . . . . . . . Body Armor Replacement Fund – Administrative Costs 75 74 74. . . . . . . . . . . . . . . . . . . . . . . . . Charity Racing Day for the Developmentally Disabled 134 ––– –––. . . . . . . . . . . . . . . . . . . . . . . . . . Claims – Victims of Crime ––– 3,870 3,870. . . . . . . . . . . . . . . . . . . . . . . . . . . . . . . . . . . . . . . . . . . . . . . . Commercial Vehicle Enforcement Program ––– 8,431 9,890. . . . . . . . . . . . . . . . . . . . . . . . . . . . . . . . . . . Commissions Award Program 2,259 2,500 2,500. . . . . . . . . . . . . . . . . . . . . . . . . . . . . . . . . . . . . . . . . . . . . . Consumer Affairs Charitable Registrations Program ––– 720 720. . . . . . . . . . . . . . . . . . . . . . . . . . . . Consumer Affairs Weights and Measures Program ––– 800 800. . . . . . . . . . . . . . . . . . . . . . . . . . . . . . Controlled Dangerous Substance Registration Program ––– 650 650. . . . . . . . . . . . . . . . . . . . . . . . . . Criminal Disposition and Revenue Collection Fund ––– 375 375. . . . . . . . . . . . . . . . . . . . . . . . . . . . . Criminal Justice Cost Recovery ––– 256 236. . . . . . . . . . . . . . . . . . . . . . . . . . . . . . . . . . . . . . . . . . . . D.O.T./State Police Construction Detail ––– 6,399 5,547. . . . . . . . . . . . . . . . . . . . . . . . . . . . . . . . . . . . . . DNA CODIS Compliance ––– 278 278. . . . . . . . . . . . . . . . . . . . . . . . . . . . . . . . . . . . . . . . . . . . . . . . . Division of Consumer Affairs–Appropriated Receipts ––– 3,593 3,593. . . . . . . . . . . . . . . . . . . . . . . . . . . Election Law Enforcement ––– 300 300. . . . . . . . . . . . . . . . . . . . . . . . . . . . . . . . . . . . . . . . . . . . . . . . FBI Mitochondrial DNA Testing ––– 810 810. . . . . . . . . . . . . . . . . . . . . . . . . . . . . . . . . . . . . . . . . . . . Forfeiture Program 2,350 2,255 2,255. . . . . . . . . . . . . . . . . . . . . . . . . . . . . . . . . . . . . . . . . . . . . . . . . . . . . . Insurance Fraud County Prosecutor Reimbursements ––– 3,500 3,500. . . . . . . . . . . . . . . . . . . . . . . . . . . Insurance Fraud Operations 29,771 31,771 31,771. . . . . . . . . . . . . . . . . . . . . . . . . . . . . . . . . . . . . . . . . . . . . . . Investigative Unit 407 526 526. . . . . . . . . . . . . . . . . . . . . . . . . . . . . . . . . . . . . . . . . . . . . . . . . . . . . . . Law Enforcement Officers Training and Equipment Fund 716 ––– –––. . . . . . . . . . . . . . . . . . . . . . . . Medical Examiner Services 6,303 6,800 7,004. . . . . . . . . . . . . . . . . . . . . . . . . . . . . . . . . . . . . . . . . . . . . . . . Motorcycle Safety Education Fund 424 ––– –––. . . . . . . . . . . . . . . . . . . . . . . . . . . . . . . . . . . . . . . . . . New Jersey Emergency Medical Service Helicopter Program ––– 5,495 5,495. . . . . . . . . . . . . . . . . . . . . New Jersey Expressway Authority 4,064 4,696 6,222. . . . . . . . . . . . . . . . . . . . . . . . . . . . . . . . . . . . . . . . . . New Jersey Parkway Authority 20,894 24,219 26,641. . . . . . . . . . . . . . . . . . . . . . . . . . . . . . . . . . . . . . . . . . . . . New Jersey Turnpike Authority 20,866 23,325 25,657. . . . . . . . . . . . . . . . . . . . . . . . . . . . . . . . . . . . . . . . . . . . Noncriminal Records Checks ––– 7,550 12,973. . . . . . . . . . . . . . . . . . . . . . . . . . . . . . . . . . . . . . . . . . . . . . Northeast Hazardous Waste Project–RCRA 198 274 274. . . . . . . . . . . . . . . . . . . . . . . . . . . . . . . . . . . Office of Counter–Terrorism ––– 7,200 7,200. . . . . . . . . . . . . . . . . . . . . . . . . . . . . . . . . . . . . . . . . . . . . . . Pari–Mutuel Racing in Accordance with N.J.S.A. 5:5–37 240 671 717. . . . . . . . . . . . . . . . . . . . . . . . Pre–Race Blood Testing and Chemical Testing Program 3,229 3,036 3,317. . . . . . . . . . . . . . . . . . . . . . . . . Private Employment Agencies–Appropriated Revenue ––– 410 410. . . . . . . . . . . . . . . . . . . . . . . . . . Racing Officials 898 1,082 1,123. . . . . . . . . . . . . . . . . . . . . . . . . . . . . . . . . . . . . . . . . . . . . . . . . . . . . . . . . Regulation of Alcoholic Beverages ––– 4,740 4,721. . . . . . . . . . . . . . . . . . . . . . . . . . . . . . . . . . . . . . . . . . Regulation of Racing Activities 3,270 3,389 3,694. . . . . . . . . . . . . . . . . . . . . . . . . . . . . . . . . . . . . . . . . . . . Retired Officers Handgun Permits ––– 140 140. . . . . . . . . . . . . . . . . . . . . . . . . . . . . . . . . . . . . . . . . . SFEA Funds 25,785 32,491 36,013. . . . . . . . . . . . . . . . . . . . . . . . . . . . . . . . . . . . . . . . . . . . . . . . . . . . . . . . . . . Safe and Secure Neighborhoods Program 7,281 7,100 7,100. . . . . . . . . . . . . . . . . . . . . . . . . . . . . . . . . . . . . Securities Enforcement Fund ––– 5,500 5,500. . . . . . . . . . . . . . . . . . . . . . . . . . . . . . . . . . . . . . . . . . . . . . Sexual Assault Nurse Examiner Program 22 ––– –––. . . . . . . . . . . . . . . . . . . . . . . . . . . . . . . . . . . . . State Athletic Control 676 500 500. . . . . . . . . . . . . . . . . . . . . . . . . . . . . . . . . . . . . . . . . . . . . . . . . . . . State Forensic Laboratory Fund Program 919 800 800. . . . . . . . . . . . . . . . . . . . . . . . . . . . . . . . . . . . . State Police Central Lab Operations ––– 761 934. . . . . . . . . . . . . . . . . . . . . . . . . . . . . . . . . . . . . . . . . State Police DNA Laboratory Enhancement ––– 3,625 3,625. . . . . . . . . . . . . . . . . . . . . . . . . . . . . . . . . . . State Police Equine Lab Unit ––– 1,377 1,549. . . . . . . . . . . . . . . . . . . . . . . . . . . . . . . . . . . . . . . . . . . . . . State Police Operations ––– 2,543 2,338. . . . . . . . . . . . . . . . . . . . . . . . . . . . . . . . . . . . . . . . . . . . . . . . . . . State Police Recruit Training ––– 300 51. . . . . . . . . . . . . . . . . . . . . . . . . . . . . . . . . . . . . . . . . . . . . . . State Police–Private Detective Receipts ––– 330 450. . . . . . . . . . . . . . . . . . . . . . . . . . . . . . . . . . . . . . State Veterinarians––New Jersey Racing Commission 486 670 686. . . . . . . . . . . . . . . . . . . . . . . . . . . Vehicle Rental Surcharge State Police Salaries ––– 1,900 1,900. . . . . . . . . . . . . . . . . . . . . . . . . . . . . . . . . Victim and Witness Advocacy Fund ––– 1,128 1,478. . . . . . . . . . . . . . . . . . . . . . . . . . . . . . . . . . . . . . . . .
74
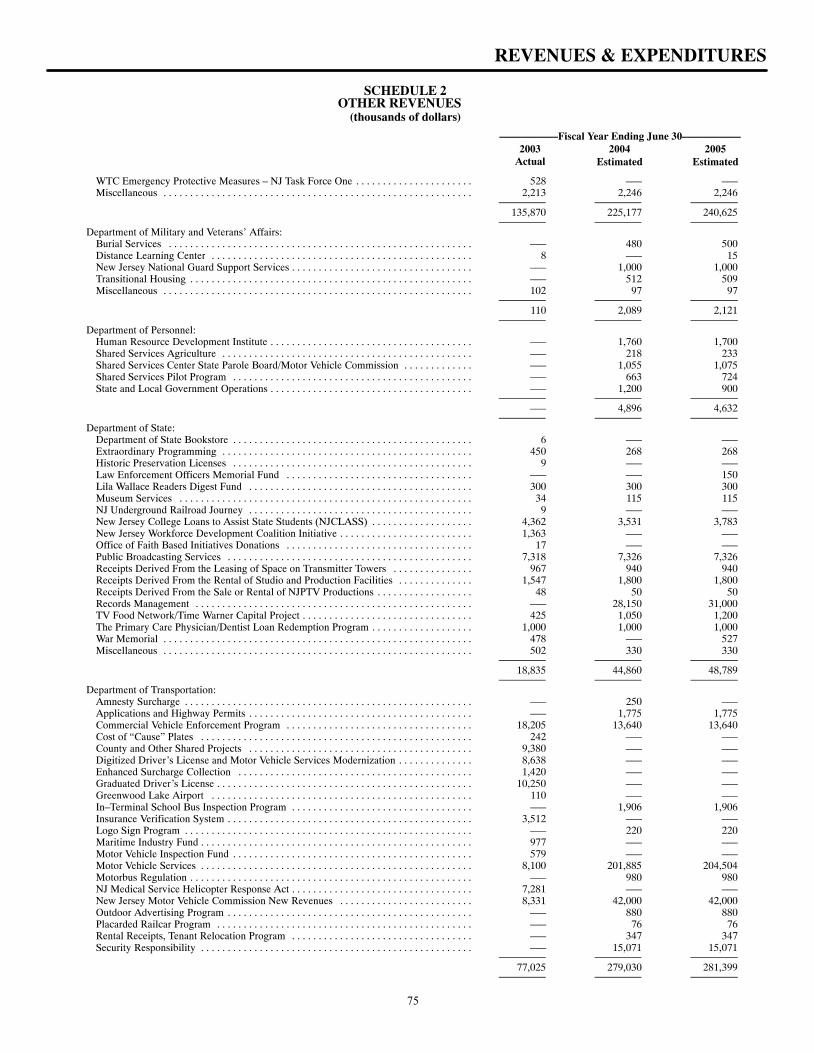
SCHEDULE 2OTHER REVENUES
(thousands of dollars)
–––––––––––Fiscal Year Ending June 30–––––––––––2003 2004 2005
Actual Estimated Estimated
REVENUES & EXPENDITURES
WTC Emergency Protective Measures – NJ Task Force One 528 ––– –––. . . . . . . . . . . . . . . . . . . . . . Miscellaneous 2,213 2,246 2,246. . . . . . . . . . . . . . . . . . . . . . . . . . . . . . . . . . . . . . . . . . . . . . . . . . . . . . . . . .
135,870 225,177 240,625
Department of Military and Veterans’ Affairs:Burial Services ––– 480 500. . . . . . . . . . . . . . . . . . . . . . . . . . . . . . . . . . . . . . . . . . . . . . . . . . . . . . . . . Distance Learning Center 8 ––– 15. . . . . . . . . . . . . . . . . . . . . . . . . . . . . . . . . . . . . . . . . . . . . . . . . New Jersey National Guard Support Services ––– 1,000 1,000. . . . . . . . . . . . . . . . . . . . . . . . . . . . . . . . . . Transitional Housing ––– 512 509. . . . . . . . . . . . . . . . . . . . . . . . . . . . . . . . . . . . . . . . . . . . . . . . . . . . . Miscellaneous 102 97 97. . . . . . . . . . . . . . . . . . . . . . . . . . . . . . . . . . . . . . . . . . . . . . . . . . . . . . . . . .
110 2,089 2,121
Department of Personnel:Human Resource Development Institute ––– 1,760 1,700. . . . . . . . . . . . . . . . . . . . . . . . . . . . . . . . . . . . . . Shared Services Agriculture ––– 218 233. . . . . . . . . . . . . . . . . . . . . . . . . . . . . . . . . . . . . . . . . . . . . . . Shared Services Center State Parole Board/Motor Vehicle Commission ––– 1,055 1,075. . . . . . . . . . . . . Shared Services Pilot Program ––– 663 724. . . . . . . . . . . . . . . . . . . . . . . . . . . . . . . . . . . . . . . . . . . . . State and Local Government Operations ––– 1,200 900. . . . . . . . . . . . . . . . . . . . . . . . . . . . . . . . . . . . . .
––– 4,896 4,632
Department of State:Department of State Bookstore 6 ––– –––. . . . . . . . . . . . . . . . . . . . . . . . . . . . . . . . . . . . . . . . . . . . . Extraordinary Programming 450 268 268. . . . . . . . . . . . . . . . . . . . . . . . . . . . . . . . . . . . . . . . . . . . . . . Historic Preservation Licenses 9 ––– –––. . . . . . . . . . . . . . . . . . . . . . . . . . . . . . . . . . . . . . . . . . . . . Law Enforcement Officers Memorial Fund ––– ––– 150. . . . . . . . . . . . . . . . . . . . . . . . . . . . . . . . . . . Lila Wallace Readers Digest Fund 300 300 300. . . . . . . . . . . . . . . . . . . . . . . . . . . . . . . . . . . . . . . . . . Museum Services 34 115 115. . . . . . . . . . . . . . . . . . . . . . . . . . . . . . . . . . . . . . . . . . . . . . . . . . . . . . . NJ Underground Railroad Journey 9 ––– –––. . . . . . . . . . . . . . . . . . . . . . . . . . . . . . . . . . . . . . . . . . New Jersey College Loans to Assist State Students (NJCLASS) 4,362 3,531 3,783. . . . . . . . . . . . . . . . . . . New Jersey Workforce Development Coalition Initiative 1,363 ––– –––. . . . . . . . . . . . . . . . . . . . . . . . . Office of Faith Based Initiatives Donations 17 ––– –––. . . . . . . . . . . . . . . . . . . . . . . . . . . . . . . . . . . Public Broadcasting Services 7,318 7,326 7,326. . . . . . . . . . . . . . . . . . . . . . . . . . . . . . . . . . . . . . . . . . . . . . Receipts Derived From the Leasing of Space on Transmitter Towers 967 940 940. . . . . . . . . . . . . . . Receipts Derived From the Rental of Studio and Production Facilities 1,547 1,800 1,800. . . . . . . . . . . . . . Receipts Derived From the Sale or Rental of NJPTV Productions 48 50 50. . . . . . . . . . . . . . . . . . Records Management ––– 28,150 31,000. . . . . . . . . . . . . . . . . . . . . . . . . . . . . . . . . . . . . . . . . . . . . . . . . . . . TV Food Network/Time Warner Capital Project 425 1,050 1,200. . . . . . . . . . . . . . . . . . . . . . . . . . . . . . . . The Primary Care Physician/Dentist Loan Redemption Program 1,000 1,000 1,000. . . . . . . . . . . . . . . . . . . War Memorial 478 ––– 527. . . . . . . . . . . . . . . . . . . . . . . . . . . . . . . . . . . . . . . . . . . . . . . . . . . . . . . . . . Miscellaneous 502 330 330. . . . . . . . . . . . . . . . . . . . . . . . . . . . . . . . . . . . . . . . . . . . . . . . . . . . . . . . . .
18,835 44,860 48,789
Department of Transportation:Amnesty Surcharge ––– 250 –––. . . . . . . . . . . . . . . . . . . . . . . . . . . . . . . . . . . . . . . . . . . . . . . . . . . . . . Applications and Highway Permits ––– 1,775 1,775. . . . . . . . . . . . . . . . . . . . . . . . . . . . . . . . . . . . . . . . . . Commercial Vehicle Enforcement Program 18,205 13,640 13,640. . . . . . . . . . . . . . . . . . . . . . . . . . . . . . . . . . . Cost of “Cause” Plates 242 ––– –––. . . . . . . . . . . . . . . . . . . . . . . . . . . . . . . . . . . . . . . . . . . . . . . . . . . County and Other Shared Projects 9,380 ––– –––. . . . . . . . . . . . . . . . . . . . . . . . . . . . . . . . . . . . . . . . . . Digitized Driver’s License and Motor Vehicle Services Modernization 8,638 ––– –––. . . . . . . . . . . . . . Enhanced Surcharge Collection 1,420 ––– –––. . . . . . . . . . . . . . . . . . . . . . . . . . . . . . . . . . . . . . . . . . . . Graduated Driver’s License 10,250 ––– –––. . . . . . . . . . . . . . . . . . . . . . . . . . . . . . . . . . . . . . . . . . . . . . . . Greenwood Lake Airport 110 ––– –––. . . . . . . . . . . . . . . . . . . . . . . . . . . . . . . . . . . . . . . . . . . . . . . . . In–Terminal School Bus Inspection Program ––– 1,906 1,906. . . . . . . . . . . . . . . . . . . . . . . . . . . . . . . . . . Insurance Verification System 3,512 ––– –––. . . . . . . . . . . . . . . . . . . . . . . . . . . . . . . . . . . . . . . . . . . . . . Logo Sign Program ––– 220 220. . . . . . . . . . . . . . . . . . . . . . . . . . . . . . . . . . . . . . . . . . . . . . . . . . . . . . Maritime Industry Fund 977 ––– –––. . . . . . . . . . . . . . . . . . . . . . . . . . . . . . . . . . . . . . . . . . . . . . . . . . . Motor Vehicle Inspection Fund 579 ––– –––. . . . . . . . . . . . . . . . . . . . . . . . . . . . . . . . . . . . . . . . . . . . . Motor Vehicle Services 8,100 201,885 204,504. . . . . . . . . . . . . . . . . . . . . . . . . . . . . . . . . . . . . . . . . . . . . . . . . . . Motorbus Regulation ––– 980 980. . . . . . . . . . . . . . . . . . . . . . . . . . . . . . . . . . . . . . . . . . . . . . . . . . . . . NJ Medical Service Helicopter Response Act 7,281 ––– –––. . . . . . . . . . . . . . . . . . . . . . . . . . . . . . . . . . New Jersey Motor Vehicle Commission New Revenues 8,331 42,000 42,000. . . . . . . . . . . . . . . . . . . . . . . . . Outdoor Advertising Program ––– 880 880. . . . . . . . . . . . . . . . . . . . . . . . . . . . . . . . . . . . . . . . . . . . . . Placarded Railcar Program ––– 76 76. . . . . . . . . . . . . . . . . . . . . . . . . . . . . . . . . . . . . . . . . . . . . . . . Rental Receipts, Tenant Relocation Program ––– 347 347. . . . . . . . . . . . . . . . . . . . . . . . . . . . . . . . . . Security Responsibility ––– 15,071 15,071. . . . . . . . . . . . . . . . . . . . . . . . . . . . . . . . . . . . . . . . . . . . . . . . . . .
77,025 279,030 281,399
75
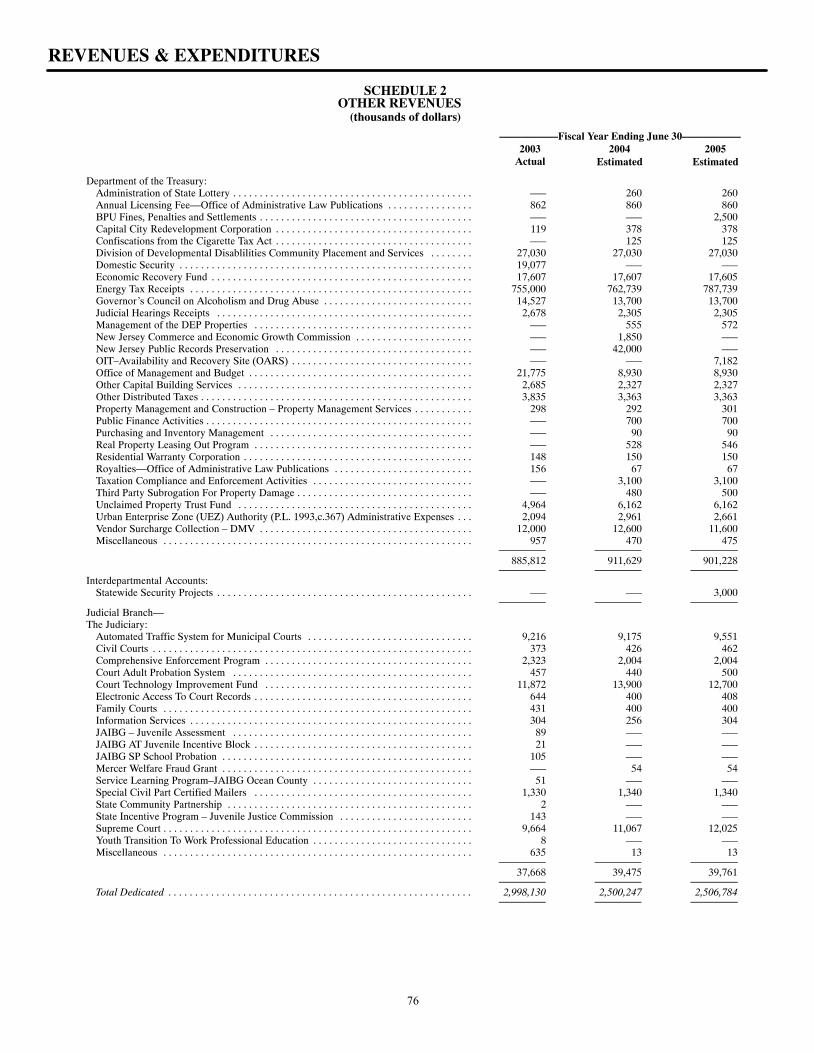
SCHEDULE 2OTHER REVENUES
(thousands of dollars)
–––––––––––Fiscal Year Ending June 30–––––––––––2003 2004 2005
Actual Estimated Estimated
REVENUES & EXPENDITURES
Department of the Treasury:Administration of State Lottery ––– 260 260. . . . . . . . . . . . . . . . . . . . . . . . . . . . . . . . . . . . . . . . . . . . . Annual Licensing Fee––Office of Administrative Law Publications 862 860 860. . . . . . . . . . . . . . . . BPU Fines, Penalties and Settlements ––– ––– 2,500. . . . . . . . . . . . . . . . . . . . . . . . . . . . . . . . . . . . . . . . Capital City Redevelopment Corporation 119 378 378. . . . . . . . . . . . . . . . . . . . . . . . . . . . . . . . . . . . . Confiscations from the Cigarette Tax Act ––– 125 125. . . . . . . . . . . . . . . . . . . . . . . . . . . . . . . . . . . . . Division of Developmental Disablilities Community Placement and Services 27,030 27,030 27,030. . . . . . . . Domestic Security 19,077 ––– –––. . . . . . . . . . . . . . . . . . . . . . . . . . . . . . . . . . . . . . . . . . . . . . . . . . . . . . . Economic Recovery Fund 17,607 17,607 17,605. . . . . . . . . . . . . . . . . . . . . . . . . . . . . . . . . . . . . . . . . . . . . . . . . Energy Tax Receipts 755,000 762,739 787,739. . . . . . . . . . . . . . . . . . . . . . . . . . . . . . . . . . . . . . . . . . . . . . . . . . . . . Governor’s Council on Alcoholism and Drug Abuse 14,527 13,700 13,700. . . . . . . . . . . . . . . . . . . . . . . . . . . . Judicial Hearings Receipts 2,678 2,305 2,305. . . . . . . . . . . . . . . . . . . . . . . . . . . . . . . . . . . . . . . . . . . . . . . . Management of the DEP Properties ––– 555 572. . . . . . . . . . . . . . . . . . . . . . . . . . . . . . . . . . . . . . . . . New Jersey Commerce and Economic Growth Commission ––– 1,850 –––. . . . . . . . . . . . . . . . . . . . . . New Jersey Public Records Preservation ––– 42,000 –––. . . . . . . . . . . . . . . . . . . . . . . . . . . . . . . . . . . . . OIT–Availability and Recovery Site (OARS) ––– ––– 7,182. . . . . . . . . . . . . . . . . . . . . . . . . . . . . . . . . . Office of Management and Budget 21,775 8,930 8,930. . . . . . . . . . . . . . . . . . . . . . . . . . . . . . . . . . . . . . . . . . Other Capital Building Services 2,685 2,327 2,327. . . . . . . . . . . . . . . . . . . . . . . . . . . . . . . . . . . . . . . . . . . . Other Distributed Taxes 3,835 3,363 3,363. . . . . . . . . . . . . . . . . . . . . . . . . . . . . . . . . . . . . . . . . . . . . . . . . . . Property Management and Construction – Property Management Services 298 292 301. . . . . . . . . . . Public Finance Activities ––– 700 700. . . . . . . . . . . . . . . . . . . . . . . . . . . . . . . . . . . . . . . . . . . . . . . . . . Purchasing and Inventory Management ––– 90 90. . . . . . . . . . . . . . . . . . . . . . . . . . . . . . . . . . . . . . Real Property Leasing Out Program ––– 528 546. . . . . . . . . . . . . . . . . . . . . . . . . . . . . . . . . . . . . . . . . Residential Warranty Corporation 148 150 150. . . . . . . . . . . . . . . . . . . . . . . . . . . . . . . . . . . . . . . . . . . Royalties––Office of Administrative Law Publications 156 67 67. . . . . . . . . . . . . . . . . . . . . . . . . . Taxation Compliance and Enforcement Activities ––– 3,100 3,100. . . . . . . . . . . . . . . . . . . . . . . . . . . . . . Third Party Subrogation For Property Damage ––– 480 500. . . . . . . . . . . . . . . . . . . . . . . . . . . . . . . . . Unclaimed Property Trust Fund 4,964 6,162 6,162. . . . . . . . . . . . . . . . . . . . . . . . . . . . . . . . . . . . . . . . . . . . Urban Enterprise Zone (UEZ) Authority (P.L. 1993,c.367) Administrative Expenses 2,094 2,961 2,661. . . Vendor Surcharge Collection – DMV 12,000 12,600 11,600. . . . . . . . . . . . . . . . . . . . . . . . . . . . . . . . . . . . . . . . Miscellaneous 957 470 475. . . . . . . . . . . . . . . . . . . . . . . . . . . . . . . . . . . . . . . . . . . . . . . . . . . . . . . . . .
885,812 911,629 901,228
Interdepartmental Accounts:Statewide Security Projects ––– ––– 3,000. . . . . . . . . . . . . . . . . . . . . . . . . . . . . . . . . . . . . . . . . . . . . . . .
Judicial Branch––The Judiciary:
Automated Traffic System for Municipal Courts 9,216 9,175 9,551. . . . . . . . . . . . . . . . . . . . . . . . . . . . . . . Civil Courts 373 426 462. . . . . . . . . . . . . . . . . . . . . . . . . . . . . . . . . . . . . . . . . . . . . . . . . . . . . . . . . . . . Comprehensive Enforcement Program 2,323 2,004 2,004. . . . . . . . . . . . . . . . . . . . . . . . . . . . . . . . . . . . . . . Court Adult Probation System 457 440 500. . . . . . . . . . . . . . . . . . . . . . . . . . . . . . . . . . . . . . . . . . . . . Court Technology Improvement Fund 11,872 13,900 12,700. . . . . . . . . . . . . . . . . . . . . . . . . . . . . . . . . . . . . . . Electronic Access To Court Records 644 400 408. . . . . . . . . . . . . . . . . . . . . . . . . . . . . . . . . . . . . . . . . Family Courts 431 400 400. . . . . . . . . . . . . . . . . . . . . . . . . . . . . . . . . . . . . . . . . . . . . . . . . . . . . . . . . . Information Services 304 256 304. . . . . . . . . . . . . . . . . . . . . . . . . . . . . . . . . . . . . . . . . . . . . . . . . . . . . JAIBG – Juvenile Assessment 89 ––– –––. . . . . . . . . . . . . . . . . . . . . . . . . . . . . . . . . . . . . . . . . . . . . JAIBG AT Juvenile Incentive Block 21 ––– –––. . . . . . . . . . . . . . . . . . . . . . . . . . . . . . . . . . . . . . . . . JAIBG SP School Probation 105 ––– –––. . . . . . . . . . . . . . . . . . . . . . . . . . . . . . . . . . . . . . . . . . . . . . . Mercer Welfare Fraud Grant ––– 54 54. . . . . . . . . . . . . . . . . . . . . . . . . . . . . . . . . . . . . . . . . . . . . . . Service Learning Program–JAIBG Ocean County 51 ––– –––. . . . . . . . . . . . . . . . . . . . . . . . . . . . . . Special Civil Part Certified Mailers 1,330 1,340 1,340. . . . . . . . . . . . . . . . . . . . . . . . . . . . . . . . . . . . . . . . . State Community Partnership 2 ––– –––. . . . . . . . . . . . . . . . . . . . . . . . . . . . . . . . . . . . . . . . . . . . . . State Incentive Program – Juvenile Justice Commission 143 ––– –––. . . . . . . . . . . . . . . . . . . . . . . . . Supreme Court 9,664 11,067 12,025. . . . . . . . . . . . . . . . . . . . . . . . . . . . . . . . . . . . . . . . . . . . . . . . . . . . . . . . . . Youth Transition To Work Professional Education 8 ––– –––. . . . . . . . . . . . . . . . . . . . . . . . . . . . . . Miscellaneous 635 13 13. . . . . . . . . . . . . . . . . . . . . . . . . . . . . . . . . . . . . . . . . . . . . . . . . . . . . . . . . .
37,668 39,475 39,761
Total Dedicated 2,998,130 2,500,247 2,506,784. . . . . . . . . . . . . . . . . . . . . . . . . . . . . . . . . . . . . . . . . . . . . . . . . . . . . . . . .
76
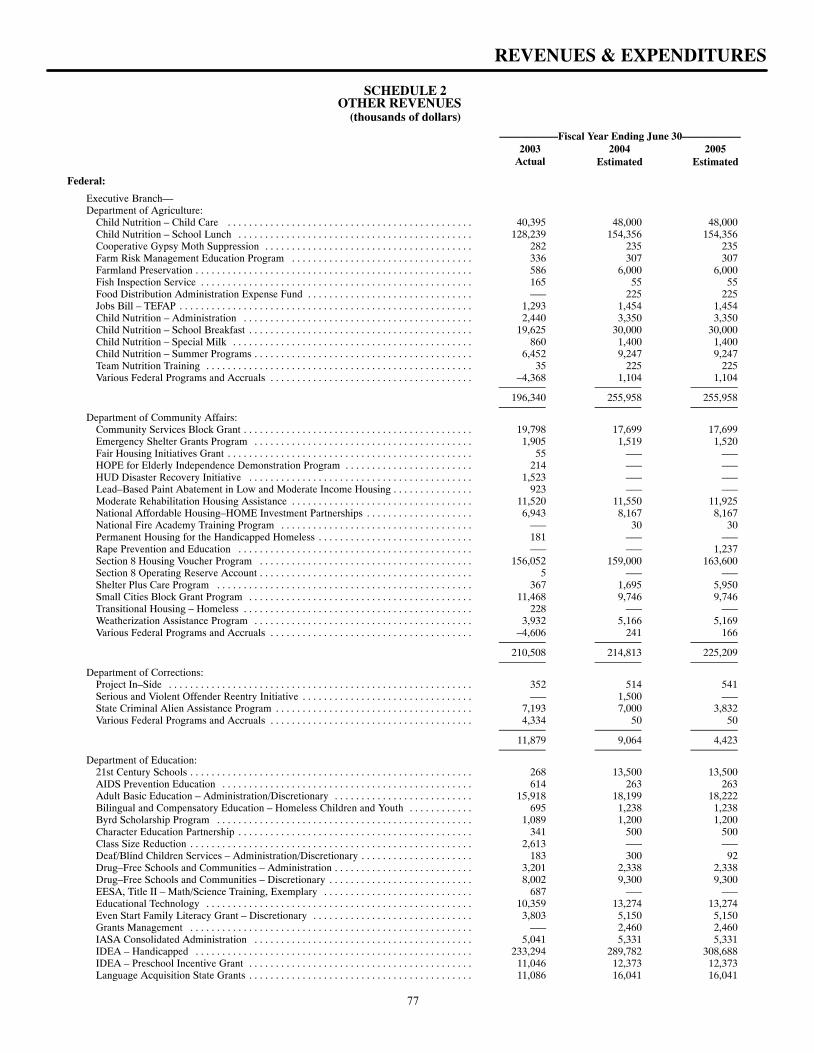
SCHEDULE 2OTHER REVENUES
(thousands of dollars)
–––––––––––Fiscal Year Ending June 30–––––––––––2003 2004 2005
Actual Estimated Estimated
REVENUES & EXPENDITURES
Federal:
Executive Branch––Department of Agriculture:
Child Nutrition – Child Care 40,395 48,000 48,000. . . . . . . . . . . . . . . . . . . . . . . . . . . . . . . . . . . . . . . . . . . . . . Child Nutrition – School Lunch 128,239 154,356 154,356. . . . . . . . . . . . . . . . . . . . . . . . . . . . . . . . . . . . . . . . . . . . Cooperative Gypsy Moth Suppression 282 235 235. . . . . . . . . . . . . . . . . . . . . . . . . . . . . . . . . . . . . . . Farm Risk Management Education Program 336 307 307. . . . . . . . . . . . . . . . . . . . . . . . . . . . . . . . . . Farmland Preservation 586 6,000 6,000. . . . . . . . . . . . . . . . . . . . . . . . . . . . . . . . . . . . . . . . . . . . . . . . . . . . Fish Inspection Service 165 55 55. . . . . . . . . . . . . . . . . . . . . . . . . . . . . . . . . . . . . . . . . . . . . . . . . . . Food Distribution Administration Expense Fund ––– 225 225. . . . . . . . . . . . . . . . . . . . . . . . . . . . . . . Jobs Bill – TEFAP 1,293 1,454 1,454. . . . . . . . . . . . . . . . . . . . . . . . . . . . . . . . . . . . . . . . . . . . . . . . . . . . . . . Child Nutrition – Administration 2,440 3,350 3,350. . . . . . . . . . . . . . . . . . . . . . . . . . . . . . . . . . . . . . . . . . . Child Nutrition – School Breakfast 19,625 30,000 30,000. . . . . . . . . . . . . . . . . . . . . . . . . . . . . . . . . . . . . . . . . . Child Nutrition – Special Milk 860 1,400 1,400. . . . . . . . . . . . . . . . . . . . . . . . . . . . . . . . . . . . . . . . . . . . . Child Nutrition – Summer Programs 6,452 9,247 9,247. . . . . . . . . . . . . . . . . . . . . . . . . . . . . . . . . . . . . . . . . Team Nutrition Training 35 225 225. . . . . . . . . . . . . . . . . . . . . . . . . . . . . . . . . . . . . . . . . . . . . . . . . . Various Federal Programs and Accruals –4,368 1,104 1,104. . . . . . . . . . . . . . . . . . . . . . . . . . . . . . . . . . . . . .
196,340 255,958 255,958
Department of Community Affairs:Community Services Block Grant 19,798 17,699 17,699. . . . . . . . . . . . . . . . . . . . . . . . . . . . . . . . . . . . . . . . . . . Emergency Shelter Grants Program 1,905 1,519 1,520. . . . . . . . . . . . . . . . . . . . . . . . . . . . . . . . . . . . . . . . . Fair Housing Initiatives Grant 55 ––– –––. . . . . . . . . . . . . . . . . . . . . . . . . . . . . . . . . . . . . . . . . . . . . . HOPE for Elderly Independence Demonstration Program 214 ––– –––. . . . . . . . . . . . . . . . . . . . . . . . HUD Disaster Recovery Initiative 1,523 ––– –––. . . . . . . . . . . . . . . . . . . . . . . . . . . . . . . . . . . . . . . . . . Lead–Based Paint Abatement in Low and Moderate Income Housing 923 ––– –––. . . . . . . . . . . . . . . Moderate Rehabilitation Housing Assistance 11,520 11,550 11,925. . . . . . . . . . . . . . . . . . . . . . . . . . . . . . . . . . National Affordable Housing–HOME Investment Partnerships 6,943 8,167 8,167. . . . . . . . . . . . . . . . . . . . National Fire Academy Training Program ––– 30 30. . . . . . . . . . . . . . . . . . . . . . . . . . . . . . . . . . . . Permanent Housing for the Handicapped Homeless 181 ––– –––. . . . . . . . . . . . . . . . . . . . . . . . . . . . . Rape Prevention and Education ––– ––– 1,237. . . . . . . . . . . . . . . . . . . . . . . . . . . . . . . . . . . . . . . . . . . . Section 8 Housing Voucher Program 156,052 159,000 163,600. . . . . . . . . . . . . . . . . . . . . . . . . . . . . . . . . . . . . . . . Section 8 Operating Reserve Account 5 ––– –––. . . . . . . . . . . . . . . . . . . . . . . . . . . . . . . . . . . . . . . . Shelter Plus Care Program 367 1,695 5,950. . . . . . . . . . . . . . . . . . . . . . . . . . . . . . . . . . . . . . . . . . . . . . . . Small Cities Block Grant Program 11,468 9,746 9,746. . . . . . . . . . . . . . . . . . . . . . . . . . . . . . . . . . . . . . . . . . Transitional Housing – Homeless 228 ––– –––. . . . . . . . . . . . . . . . . . . . . . . . . . . . . . . . . . . . . . . . . . . Weatherization Assistance Program 3,932 5,166 5,169. . . . . . . . . . . . . . . . . . . . . . . . . . . . . . . . . . . . . . . . . Various Federal Programs and Accruals –4,606 241 166. . . . . . . . . . . . . . . . . . . . . . . . . . . . . . . . . . . . . .
210,508 214,813 225,209
Department of Corrections:Project In–Side 352 514 541. . . . . . . . . . . . . . . . . . . . . . . . . . . . . . . . . . . . . . . . . . . . . . . . . . . . . . . . . Serious and Violent Offender Reentry Initiative ––– 1,500 –––. . . . . . . . . . . . . . . . . . . . . . . . . . . . . . . . State Criminal Alien Assistance Program 7,193 7,000 3,832. . . . . . . . . . . . . . . . . . . . . . . . . . . . . . . . . . . . . Various Federal Programs and Accruals 4,334 50 50. . . . . . . . . . . . . . . . . . . . . . . . . . . . . . . . . . . . . .
11,879 9,064 4,423
Department of Education:21st Century Schools 268 13,500 13,500. . . . . . . . . . . . . . . . . . . . . . . . . . . . . . . . . . . . . . . . . . . . . . . . . . . . . AIDS Prevention Education 614 263 263. . . . . . . . . . . . . . . . . . . . . . . . . . . . . . . . . . . . . . . . . . . . . . . Adult Basic Education – Administration/Discretionary 15,918 18,199 18,222. . . . . . . . . . . . . . . . . . . . . . . . . . Bilingual and Compensatory Education – Homeless Children and Youth 695 1,238 1,238. . . . . . . . . . . . Byrd Scholarship Program 1,089 1,200 1,200. . . . . . . . . . . . . . . . . . . . . . . . . . . . . . . . . . . . . . . . . . . . . . . . Character Education Partnership 341 500 500. . . . . . . . . . . . . . . . . . . . . . . . . . . . . . . . . . . . . . . . . . . . Class Size Reduction 2,613 ––– –––. . . . . . . . . . . . . . . . . . . . . . . . . . . . . . . . . . . . . . . . . . . . . . . . . . . . . Deaf/Blind Children Services – Administration/Discretionary 183 300 92. . . . . . . . . . . . . . . . . . . . . Drug–Free Schools and Communities – Administration 3,201 2,338 2,338. . . . . . . . . . . . . . . . . . . . . . . . . . Drug–Free Schools and Communities – Discretionary 8,002 9,300 9,300. . . . . . . . . . . . . . . . . . . . . . . . . . . EESA, Title II – Math/Science Training, Exemplary 687 ––– –––. . . . . . . . . . . . . . . . . . . . . . . . . . . . Educational Technology 10,359 13,274 13,274. . . . . . . . . . . . . . . . . . . . . . . . . . . . . . . . . . . . . . . . . . . . . . . . . . Even Start Family Literacy Grant – Discretionary 3,803 5,150 5,150. . . . . . . . . . . . . . . . . . . . . . . . . . . . . . Grants Management ––– 2,460 2,460. . . . . . . . . . . . . . . . . . . . . . . . . . . . . . . . . . . . . . . . . . . . . . . . . . . . . IASA Consolidated Administration 5,041 5,331 5,331. . . . . . . . . . . . . . . . . . . . . . . . . . . . . . . . . . . . . . . . . IDEA – Handicapped 233,294 289,782 308,688. . . . . . . . . . . . . . . . . . . . . . . . . . . . . . . . . . . . . . . . . . . . . . . . . . . . IDEA – Preschool Incentive Grant 11,046 12,373 12,373. . . . . . . . . . . . . . . . . . . . . . . . . . . . . . . . . . . . . . . . . . Language Acquisition State Grants 11,086 16,041 16,041. . . . . . . . . . . . . . . . . . . . . . . . . . . . . . . . . . . . . . . . . .
77
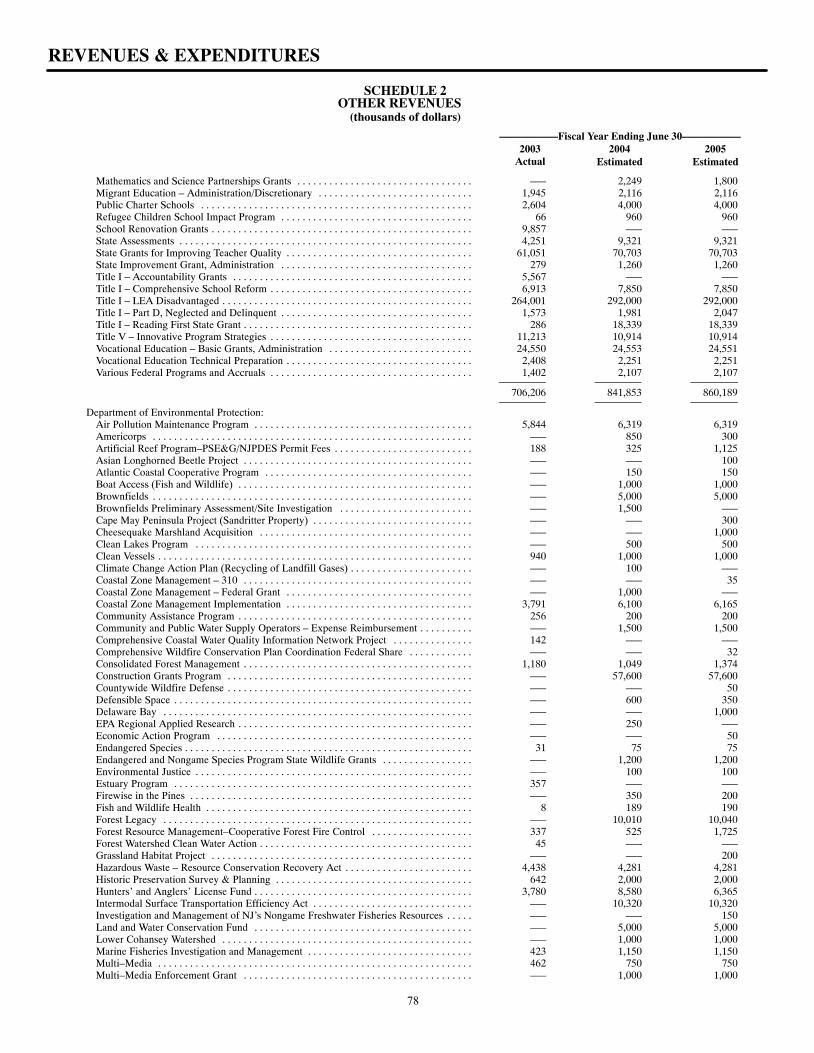
SCHEDULE 2OTHER REVENUES
(thousands of dollars)
–––––––––––Fiscal Year Ending June 30–––––––––––2003 2004 2005
Actual Estimated Estimated
REVENUES & EXPENDITURES
Mathematics and Science Partnerships Grants ––– 2,249 1,800. . . . . . . . . . . . . . . . . . . . . . . . . . . . . . . . . Migrant Education – Administration/Discretionary 1,945 2,116 2,116. . . . . . . . . . . . . . . . . . . . . . . . . . . . . Public Charter Schools 2,604 4,000 4,000. . . . . . . . . . . . . . . . . . . . . . . . . . . . . . . . . . . . . . . . . . . . . . . . . . . Refugee Children School Impact Program 66 960 960. . . . . . . . . . . . . . . . . . . . . . . . . . . . . . . . . . . . School Renovation Grants 9,857 ––– –––. . . . . . . . . . . . . . . . . . . . . . . . . . . . . . . . . . . . . . . . . . . . . . . . . State Assessments 4,251 9,321 9,321. . . . . . . . . . . . . . . . . . . . . . . . . . . . . . . . . . . . . . . . . . . . . . . . . . . . . . . State Grants for Improving Teacher Quality 61,051 70,703 70,703. . . . . . . . . . . . . . . . . . . . . . . . . . . . . . . . . . . State Improvement Grant, Administration 279 1,260 1,260. . . . . . . . . . . . . . . . . . . . . . . . . . . . . . . . . . . . Title I – Accountability Grants 5,567 ––– –––. . . . . . . . . . . . . . . . . . . . . . . . . . . . . . . . . . . . . . . . . . . . . Title I – Comprehensive School Reform 6,913 7,850 7,850. . . . . . . . . . . . . . . . . . . . . . . . . . . . . . . . . . . . . . Title I – LEA Disadvantaged 264,001 292,000 292,000. . . . . . . . . . . . . . . . . . . . . . . . . . . . . . . . . . . . . . . . . . . . . . . Title I – Part D, Neglected and Delinquent 1,573 1,981 2,047. . . . . . . . . . . . . . . . . . . . . . . . . . . . . . . . . . . . Title I – Reading First State Grant 286 18,339 18,339. . . . . . . . . . . . . . . . . . . . . . . . . . . . . . . . . . . . . . . . . . . Title V – Innovative Program Strategies 11,213 10,914 10,914. . . . . . . . . . . . . . . . . . . . . . . . . . . . . . . . . . . . . . Vocational Education – Basic Grants, Administration 24,550 24,553 24,551. . . . . . . . . . . . . . . . . . . . . . . . . . . Vocational Education Technical Preparation 2,408 2,251 2,251. . . . . . . . . . . . . . . . . . . . . . . . . . . . . . . . . . . Various Federal Programs and Accruals 1,402 2,107 2,107. . . . . . . . . . . . . . . . . . . . . . . . . . . . . . . . . . . . . .
706,206 841,853 860,189
Department of Environmental Protection:Air Pollution Maintenance Program 5,844 6,319 6,319. . . . . . . . . . . . . . . . . . . . . . . . . . . . . . . . . . . . . . . . . Americorps ––– 850 300. . . . . . . . . . . . . . . . . . . . . . . . . . . . . . . . . . . . . . . . . . . . . . . . . . . . . . . . . . . . Artificial Reef Program–PSE&G/NJPDES Permit Fees 188 325 1,125. . . . . . . . . . . . . . . . . . . . . . . . . . Asian Longhorned Beetle Project ––– ––– 100. . . . . . . . . . . . . . . . . . . . . . . . . . . . . . . . . . . . . . . . . . . Atlantic Coastal Cooperative Program ––– 150 150. . . . . . . . . . . . . . . . . . . . . . . . . . . . . . . . . . . . . . . Boat Access (Fish and Wildlife) ––– 1,000 1,000. . . . . . . . . . . . . . . . . . . . . . . . . . . . . . . . . . . . . . . . . . . . Brownfields ––– 5,000 5,000. . . . . . . . . . . . . . . . . . . . . . . . . . . . . . . . . . . . . . . . . . . . . . . . . . . . . . . . . . . . Brownfields Preliminary Assessment/Site Investigation ––– 1,500 –––. . . . . . . . . . . . . . . . . . . . . . . . . Cape May Peninsula Project (Sandritter Property) ––– ––– 300. . . . . . . . . . . . . . . . . . . . . . . . . . . . . . Cheesequake Marshland Acquisition ––– ––– 1,000. . . . . . . . . . . . . . . . . . . . . . . . . . . . . . . . . . . . . . . . Clean Lakes Program ––– 500 500. . . . . . . . . . . . . . . . . . . . . . . . . . . . . . . . . . . . . . . . . . . . . . . . . . . . Clean Vessels 940 1,000 1,000. . . . . . . . . . . . . . . . . . . . . . . . . . . . . . . . . . . . . . . . . . . . . . . . . . . . . . . . . . . Climate Change Action Plan (Recycling of Landfill Gases) ––– 100 –––. . . . . . . . . . . . . . . . . . . . . . . Coastal Zone Management – 310 ––– ––– 35. . . . . . . . . . . . . . . . . . . . . . . . . . . . . . . . . . . . . . . . . . . Coastal Zone Management – Federal Grant ––– 1,000 –––. . . . . . . . . . . . . . . . . . . . . . . . . . . . . . . . . . . Coastal Zone Management Implementation 3,791 6,100 6,165. . . . . . . . . . . . . . . . . . . . . . . . . . . . . . . . . . . Community Assistance Program 256 200 200. . . . . . . . . . . . . . . . . . . . . . . . . . . . . . . . . . . . . . . . . . . . Community and Public Water Supply Operators – Expense Reimbursement ––– 1,500 1,500. . . . . . . . . . Comprehensive Coastal Water Quality Information Network Project 142 ––– –––. . . . . . . . . . . . . . . Comprehensive Wildfire Conservation Plan Coordination Federal Share ––– ––– 32. . . . . . . . . . . . Consolidated Forest Management 1,180 1,049 1,374. . . . . . . . . . . . . . . . . . . . . . . . . . . . . . . . . . . . . . . . . . . Construction Grants Program ––– 57,600 57,600. . . . . . . . . . . . . . . . . . . . . . . . . . . . . . . . . . . . . . . . . . . . . . Countywide Wildfire Defense ––– ––– 50. . . . . . . . . . . . . . . . . . . . . . . . . . . . . . . . . . . . . . . . . . . . . . Defensible Space ––– 600 350. . . . . . . . . . . . . . . . . . . . . . . . . . . . . . . . . . . . . . . . . . . . . . . . . . . . . . . . Delaware Bay ––– ––– 1,000. . . . . . . . . . . . . . . . . . . . . . . . . . . . . . . . . . . . . . . . . . . . . . . . . . . . . . . . . . EPA Regional Applied Research ––– 250 –––. . . . . . . . . . . . . . . . . . . . . . . . . . . . . . . . . . . . . . . . . . . . Economic Action Program ––– ––– 50. . . . . . . . . . . . . . . . . . . . . . . . . . . . . . . . . . . . . . . . . . . . . . . . Endangered Species 31 75 75. . . . . . . . . . . . . . . . . . . . . . . . . . . . . . . . . . . . . . . . . . . . . . . . . . . . . . Endangered and Nongame Species Program State Wildlife Grants ––– 1,200 1,200. . . . . . . . . . . . . . . . . Environmental Justice ––– 100 100. . . . . . . . . . . . . . . . . . . . . . . . . . . . . . . . . . . . . . . . . . . . . . . . . . . . Estuary Program 357 ––– –––. . . . . . . . . . . . . . . . . . . . . . . . . . . . . . . . . . . . . . . . . . . . . . . . . . . . . . . . Firewise in the Pines ––– 350 200. . . . . . . . . . . . . . . . . . . . . . . . . . . . . . . . . . . . . . . . . . . . . . . . . . . . . Fish and Wildlife Health 8 189 190. . . . . . . . . . . . . . . . . . . . . . . . . . . . . . . . . . . . . . . . . . . . . . . . . . Forest Legacy ––– 10,010 10,040. . . . . . . . . . . . . . . . . . . . . . . . . . . . . . . . . . . . . . . . . . . . . . . . . . . . . . . . . . Forest Resource Management–Cooperative Forest Fire Control 337 525 1,725. . . . . . . . . . . . . . . . . . . Forest Watershed Clean Water Action 45 ––– –––. . . . . . . . . . . . . . . . . . . . . . . . . . . . . . . . . . . . . . . . Grassland Habitat Project ––– ––– 200. . . . . . . . . . . . . . . . . . . . . . . . . . . . . . . . . . . . . . . . . . . . . . . . . Hazardous Waste – Resource Conservation Recovery Act 4,438 4,281 4,281. . . . . . . . . . . . . . . . . . . . . . . . Historic Preservation Survey & Planning 642 2,000 2,000. . . . . . . . . . . . . . . . . . . . . . . . . . . . . . . . . . . . . Hunters’ and Anglers’ License Fund 3,780 8,580 6,365. . . . . . . . . . . . . . . . . . . . . . . . . . . . . . . . . . . . . . . . . Intermodal Surface Transportation Efficiency Act ––– 10,320 10,320. . . . . . . . . . . . . . . . . . . . . . . . . . . . . . Investigation and Management of NJ’s Nongame Freshwater Fisheries Resources ––– ––– 150. . . . . Land and Water Conservation Fund ––– 5,000 5,000. . . . . . . . . . . . . . . . . . . . . . . . . . . . . . . . . . . . . . . . . Lower Cohansey Watershed ––– 1,000 1,000. . . . . . . . . . . . . . . . . . . . . . . . . . . . . . . . . . . . . . . . . . . . . . . Marine Fisheries Investigation and Management 423 1,150 1,150. . . . . . . . . . . . . . . . . . . . . . . . . . . . . . . Multi–Media 462 750 750. . . . . . . . . . . . . . . . . . . . . . . . . . . . . . . . . . . . . . . . . . . . . . . . . . . . . . . . . . . Multi–Media Enforcement Grant ––– 1,000 1,000. . . . . . . . . . . . . . . . . . . . . . . . . . . . . . . . . . . . . . . . . . .
78
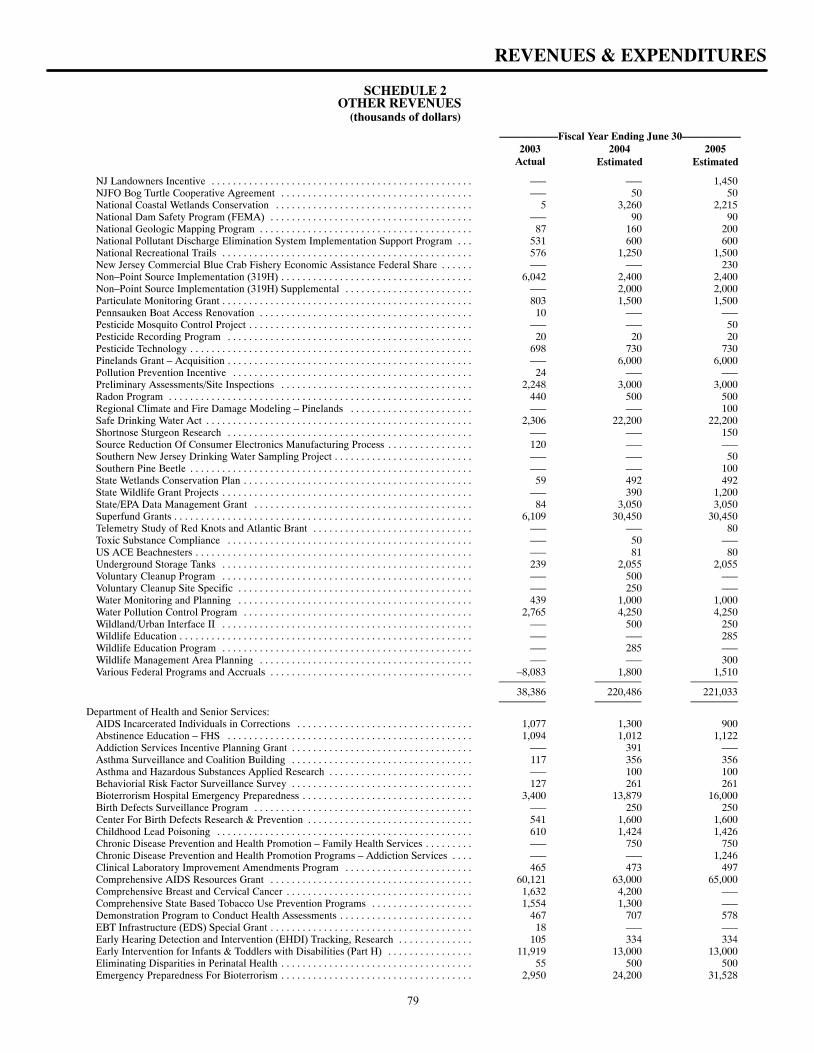
SCHEDULE 2OTHER REVENUES
(thousands of dollars)
–––––––––––Fiscal Year Ending June 30–––––––––––2003 2004 2005
Actual Estimated Estimated
REVENUES & EXPENDITURES
NJ Landowners Incentive ––– ––– 1,450. . . . . . . . . . . . . . . . . . . . . . . . . . . . . . . . . . . . . . . . . . . . . . . . . NJFO Bog Turtle Cooperative Agreement ––– 50 50. . . . . . . . . . . . . . . . . . . . . . . . . . . . . . . . . . . . National Coastal Wetlands Conservation 5 3,260 2,215. . . . . . . . . . . . . . . . . . . . . . . . . . . . . . . . . . . . . National Dam Safety Program (FEMA) ––– 90 90. . . . . . . . . . . . . . . . . . . . . . . . . . . . . . . . . . . . . . National Geologic Mapping Program 87 160 200. . . . . . . . . . . . . . . . . . . . . . . . . . . . . . . . . . . . . . . . National Pollutant Discharge Elimination System Implementation Support Program 531 600 600. . . National Recreational Trails 576 1,250 1,500. . . . . . . . . . . . . . . . . . . . . . . . . . . . . . . . . . . . . . . . . . . . . . . New Jersey Commercial Blue Crab Fishery Economic Assistance Federal Share ––– ––– 230. . . . . . Non–Point Source Implementation (319H) 6,042 2,400 2,400. . . . . . . . . . . . . . . . . . . . . . . . . . . . . . . . . . . . Non–Point Source Implementation (319H) Supplemental ––– 2,000 2,000. . . . . . . . . . . . . . . . . . . . . . . . Particulate Monitoring Grant 803 1,500 1,500. . . . . . . . . . . . . . . . . . . . . . . . . . . . . . . . . . . . . . . . . . . . . . . Pennsauken Boat Access Renovation 10 ––– –––. . . . . . . . . . . . . . . . . . . . . . . . . . . . . . . . . . . . . . . . Pesticide Mosquito Control Project ––– ––– 50. . . . . . . . . . . . . . . . . . . . . . . . . . . . . . . . . . . . . . . . . . Pesticide Recording Program 20 20 20. . . . . . . . . . . . . . . . . . . . . . . . . . . . . . . . . . . . . . . . . . . . . . Pesticide Technology 698 730 730. . . . . . . . . . . . . . . . . . . . . . . . . . . . . . . . . . . . . . . . . . . . . . . . . . . . . Pinelands Grant – Acquisition ––– 6,000 6,000. . . . . . . . . . . . . . . . . . . . . . . . . . . . . . . . . . . . . . . . . . . . . . Pollution Prevention Incentive 24 ––– –––. . . . . . . . . . . . . . . . . . . . . . . . . . . . . . . . . . . . . . . . . . . . . Preliminary Assessments/Site Inspections 2,248 3,000 3,000. . . . . . . . . . . . . . . . . . . . . . . . . . . . . . . . . . . . Radon Program 440 500 500. . . . . . . . . . . . . . . . . . . . . . . . . . . . . . . . . . . . . . . . . . . . . . . . . . . . . . . . . Regional Climate and Fire Damage Modeling – Pinelands ––– ––– 100. . . . . . . . . . . . . . . . . . . . . . . Safe Drinking Water Act 2,306 22,200 22,200. . . . . . . . . . . . . . . . . . . . . . . . . . . . . . . . . . . . . . . . . . . . . . . . . . Shortnose Sturgeon Research ––– ––– 150. . . . . . . . . . . . . . . . . . . . . . . . . . . . . . . . . . . . . . . . . . . . . . Source Reduction Of Consumer Electronics Manufacturing Process 120 ––– –––. . . . . . . . . . . . . . . . Southern New Jersey Drinking Water Sampling Project ––– ––– 50. . . . . . . . . . . . . . . . . . . . . . . . . . Southern Pine Beetle ––– ––– 100. . . . . . . . . . . . . . . . . . . . . . . . . . . . . . . . . . . . . . . . . . . . . . . . . . . . . State Wetlands Conservation Plan 59 492 492. . . . . . . . . . . . . . . . . . . . . . . . . . . . . . . . . . . . . . . . . . . State Wildlife Grant Projects ––– 390 1,200. . . . . . . . . . . . . . . . . . . . . . . . . . . . . . . . . . . . . . . . . . . . . . . State/EPA Data Management Grant 84 3,050 3,050. . . . . . . . . . . . . . . . . . . . . . . . . . . . . . . . . . . . . . . . . Superfund Grants 6,109 30,450 30,450. . . . . . . . . . . . . . . . . . . . . . . . . . . . . . . . . . . . . . . . . . . . . . . . . . . . . . . . Telemetry Study of Red Knots and Atlantic Brant ––– ––– 80. . . . . . . . . . . . . . . . . . . . . . . . . . . . . . Toxic Substance Compliance ––– 50 –––. . . . . . . . . . . . . . . . . . . . . . . . . . . . . . . . . . . . . . . . . . . . . . US ACE Beachnesters ––– 81 80. . . . . . . . . . . . . . . . . . . . . . . . . . . . . . . . . . . . . . . . . . . . . . . . . . . . Underground Storage Tanks 239 2,055 2,055. . . . . . . . . . . . . . . . . . . . . . . . . . . . . . . . . . . . . . . . . . . . . . . Voluntary Cleanup Program ––– 500 –––. . . . . . . . . . . . . . . . . . . . . . . . . . . . . . . . . . . . . . . . . . . . . . . Voluntary Cleanup Site Specific ––– 250 –––. . . . . . . . . . . . . . . . . . . . . . . . . . . . . . . . . . . . . . . . . . . . Water Monitoring and Planning 439 1,000 1,000. . . . . . . . . . . . . . . . . . . . . . . . . . . . . . . . . . . . . . . . . . . . Water Pollution Control Program 2,765 4,250 4,250. . . . . . . . . . . . . . . . . . . . . . . . . . . . . . . . . . . . . . . . . . . Wildland/Urban Interface II ––– 500 250. . . . . . . . . . . . . . . . . . . . . . . . . . . . . . . . . . . . . . . . . . . . . . . Wildlife Education ––– ––– 285. . . . . . . . . . . . . . . . . . . . . . . . . . . . . . . . . . . . . . . . . . . . . . . . . . . . . . . Wildlife Education Program ––– 285 –––. . . . . . . . . . . . . . . . . . . . . . . . . . . . . . . . . . . . . . . . . . . . . . . Wildlife Management Area Planning ––– ––– 300. . . . . . . . . . . . . . . . . . . . . . . . . . . . . . . . . . . . . . . . Various Federal Programs and Accruals –8,083 1,800 1,510. . . . . . . . . . . . . . . . . . . . . . . . . . . . . . . . . . . . . .
38,386 220,486 221,033
Department of Health and Senior Services:AIDS Incarcerated Individuals in Corrections 1,077 1,300 900. . . . . . . . . . . . . . . . . . . . . . . . . . . . . . . . . Abstinence Education – FHS 1,094 1,012 1,122. . . . . . . . . . . . . . . . . . . . . . . . . . . . . . . . . . . . . . . . . . . . . . Addiction Services Incentive Planning Grant ––– 391 –––. . . . . . . . . . . . . . . . . . . . . . . . . . . . . . . . . . Asthma Surveillance and Coalition Building 117 356 356. . . . . . . . . . . . . . . . . . . . . . . . . . . . . . . . . . Asthma and Hazardous Substances Applied Research ––– 100 100. . . . . . . . . . . . . . . . . . . . . . . . . . . Behaviorial Risk Factor Surveillance Survey 127 261 261. . . . . . . . . . . . . . . . . . . . . . . . . . . . . . . . . . Bioterrorism Hospital Emergency Preparedness 3,400 13,879 16,000. . . . . . . . . . . . . . . . . . . . . . . . . . . . . . . . Birth Defects Surveillance Program ––– 250 250. . . . . . . . . . . . . . . . . . . . . . . . . . . . . . . . . . . . . . . . . Center For Birth Defects Research & Prevention 541 1,600 1,600. . . . . . . . . . . . . . . . . . . . . . . . . . . . . . . Childhood Lead Poisoning 610 1,424 1,426. . . . . . . . . . . . . . . . . . . . . . . . . . . . . . . . . . . . . . . . . . . . . . . . Chronic Disease Prevention and Health Promotion – Family Health Services ––– 750 750. . . . . . . . . Chronic Disease Prevention and Health Promotion Programs – Addiction Services ––– ––– 1,246. . . . Clinical Laboratory Improvement Amendments Program 465 473 497. . . . . . . . . . . . . . . . . . . . . . . . Comprehensive AIDS Resources Grant 60,121 63,000 65,000. . . . . . . . . . . . . . . . . . . . . . . . . . . . . . . . . . . . . . Comprehensive Breast and Cervical Cancer 1,632 4,200 –––. . . . . . . . . . . . . . . . . . . . . . . . . . . . . . . . . . . Comprehensive State Based Tobacco Use Prevention Programs 1,554 1,300 –––. . . . . . . . . . . . . . . . . . . Demonstration Program to Conduct Health Assessments 467 707 578. . . . . . . . . . . . . . . . . . . . . . . . . EBT Infrastructure (EDS) Special Grant 18 ––– –––. . . . . . . . . . . . . . . . . . . . . . . . . . . . . . . . . . . . . . Early Hearing Detection and Intervention (EHDI) Tracking, Research 105 334 334. . . . . . . . . . . . . . Early Intervention for Infants & Toddlers with Disabilities (Part H) 11,919 13,000 13,000. . . . . . . . . . . . . . . . Eliminating Disparities in Perinatal Health 55 500 500. . . . . . . . . . . . . . . . . . . . . . . . . . . . . . . . . . . . Emergency Preparedness For Bioterrorism 2,950 24,200 31,528. . . . . . . . . . . . . . . . . . . . . . . . . . . . . . . . . . . .
79
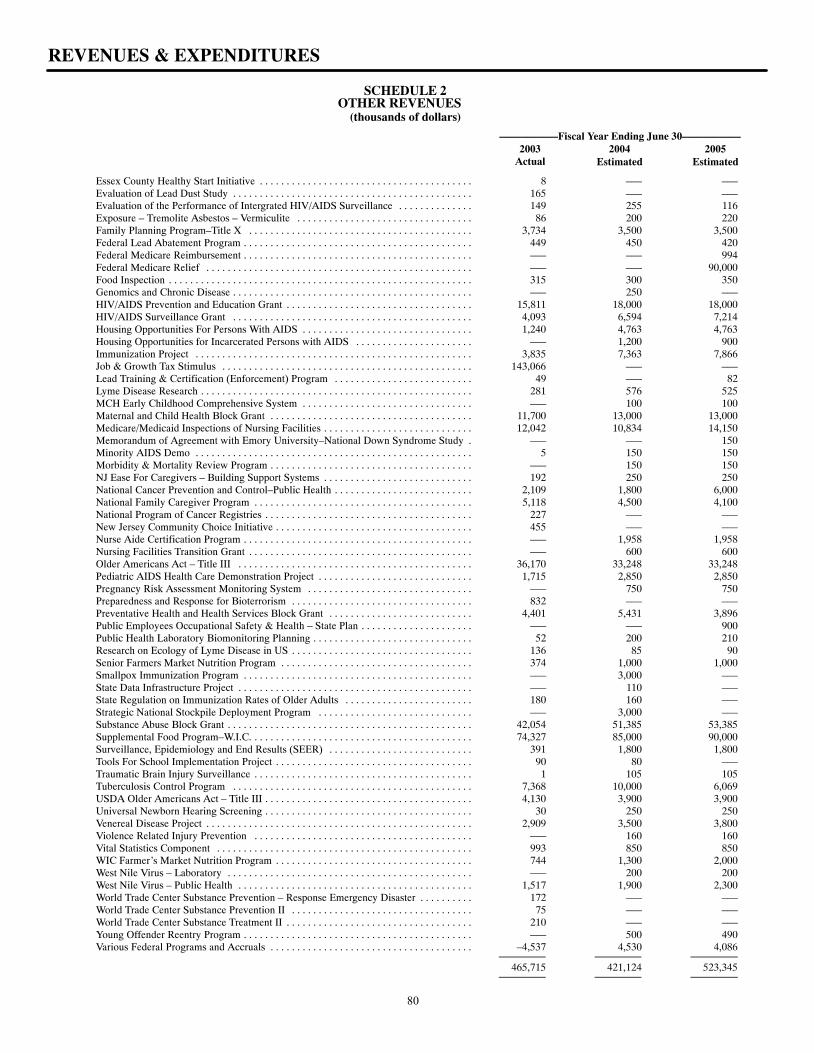
SCHEDULE 2OTHER REVENUES
(thousands of dollars)
–––––––––––Fiscal Year Ending June 30–––––––––––2003 2004 2005
Actual Estimated Estimated
REVENUES & EXPENDITURES
Essex County Healthy Start Initiative 8 ––– –––. . . . . . . . . . . . . . . . . . . . . . . . . . . . . . . . . . . . . . . . Evaluation of Lead Dust Study 165 ––– –––. . . . . . . . . . . . . . . . . . . . . . . . . . . . . . . . . . . . . . . . . . . . . Evaluation of the Performance of Intergrated HIV/AIDS Surveillance 149 255 116. . . . . . . . . . . . . . Exposure – Tremolite Asbestos – Vermiculite 86 200 220. . . . . . . . . . . . . . . . . . . . . . . . . . . . . . . . . Family Planning Program–Title X 3,734 3,500 3,500. . . . . . . . . . . . . . . . . . . . . . . . . . . . . . . . . . . . . . . . . . Federal Lead Abatement Program 449 450 420. . . . . . . . . . . . . . . . . . . . . . . . . . . . . . . . . . . . . . . . . . . Federal Medicare Reimbursement ––– ––– 994. . . . . . . . . . . . . . . . . . . . . . . . . . . . . . . . . . . . . . . . . . . Federal Medicare Relief ––– ––– 90,000. . . . . . . . . . . . . . . . . . . . . . . . . . . . . . . . . . . . . . . . . . . . . . . . . . Food Inspection 315 300 350. . . . . . . . . . . . . . . . . . . . . . . . . . . . . . . . . . . . . . . . . . . . . . . . . . . . . . . . . Genomics and Chronic Disease ––– 250 –––. . . . . . . . . . . . . . . . . . . . . . . . . . . . . . . . . . . . . . . . . . . . . HIV/AIDS Prevention and Education Grant 15,811 18,000 18,000. . . . . . . . . . . . . . . . . . . . . . . . . . . . . . . . . . . HIV/AIDS Surveillance Grant 4,093 6,594 7,214. . . . . . . . . . . . . . . . . . . . . . . . . . . . . . . . . . . . . . . . . . . . . Housing Opportunities For Persons With AIDS 1,240 4,763 4,763. . . . . . . . . . . . . . . . . . . . . . . . . . . . . . . . Housing Opportunities for Incarcerated Persons with AIDS ––– 1,200 900. . . . . . . . . . . . . . . . . . . . . . Immunization Project 3,835 7,363 7,866. . . . . . . . . . . . . . . . . . . . . . . . . . . . . . . . . . . . . . . . . . . . . . . . . . . . Job & Growth Tax Stimulus 143,066 ––– –––. . . . . . . . . . . . . . . . . . . . . . . . . . . . . . . . . . . . . . . . . . . . . . . Lead Training & Certification (Enforcement) Program 49 ––– 82. . . . . . . . . . . . . . . . . . . . . . . . . . Lyme Disease Research 281 576 525. . . . . . . . . . . . . . . . . . . . . . . . . . . . . . . . . . . . . . . . . . . . . . . . . . . MCH Early Childhood Comprehensive System ––– 100 100. . . . . . . . . . . . . . . . . . . . . . . . . . . . . . . . Maternal and Child Health Block Grant 11,700 13,000 13,000. . . . . . . . . . . . . . . . . . . . . . . . . . . . . . . . . . . . . . Medicare/Medicaid Inspections of Nursing Facilities 12,042 10,834 14,150. . . . . . . . . . . . . . . . . . . . . . . . . . . . Memorandum of Agreement with Emory University–National Down Syndrome Study ––– ––– 150. Minority AIDS Demo 5 150 150. . . . . . . . . . . . . . . . . . . . . . . . . . . . . . . . . . . . . . . . . . . . . . . . . . . . Morbidity & Mortality Review Program ––– 150 150. . . . . . . . . . . . . . . . . . . . . . . . . . . . . . . . . . . . . . NJ Ease For Caregivers – Building Support Systems 192 250 250. . . . . . . . . . . . . . . . . . . . . . . . . . . . National Cancer Prevention and Control–Public Health 2,109 1,800 6,000. . . . . . . . . . . . . . . . . . . . . . . . . . National Family Caregiver Program 5,118 4,500 4,100. . . . . . . . . . . . . . . . . . . . . . . . . . . . . . . . . . . . . . . . . National Program of Cancer Registries 227 ––– –––. . . . . . . . . . . . . . . . . . . . . . . . . . . . . . . . . . . . . . . New Jersey Community Choice Initiative 455 ––– –––. . . . . . . . . . . . . . . . . . . . . . . . . . . . . . . . . . . . . Nurse Aide Certification Program ––– 1,958 1,958. . . . . . . . . . . . . . . . . . . . . . . . . . . . . . . . . . . . . . . . . . . Nursing Facilities Transition Grant ––– 600 600. . . . . . . . . . . . . . . . . . . . . . . . . . . . . . . . . . . . . . . . . . Older Americans Act – Title III 36,170 33,248 33,248. . . . . . . . . . . . . . . . . . . . . . . . . . . . . . . . . . . . . . . . . . . . Pediatric AIDS Health Care Demonstration Project 1,715 2,850 2,850. . . . . . . . . . . . . . . . . . . . . . . . . . . . . Pregnancy Risk Assessment Monitoring System ––– 750 750. . . . . . . . . . . . . . . . . . . . . . . . . . . . . . . Preparedness and Response for Bioterrorism 832 ––– –––. . . . . . . . . . . . . . . . . . . . . . . . . . . . . . . . . . Preventative Health and Health Services Block Grant 4,401 5,431 3,896. . . . . . . . . . . . . . . . . . . . . . . . . . . Public Employees Occupational Safety & Health – State Plan ––– ––– 900. . . . . . . . . . . . . . . . . . . . . Public Health Laboratory Biomonitoring Planning 52 200 210. . . . . . . . . . . . . . . . . . . . . . . . . . . . . . Research on Ecology of Lyme Disease in US 136 85 90. . . . . . . . . . . . . . . . . . . . . . . . . . . . . . . . . . Senior Farmers Market Nutrition Program 374 1,000 1,000. . . . . . . . . . . . . . . . . . . . . . . . . . . . . . . . . . . . Smallpox Immunization Program ––– 3,000 –––. . . . . . . . . . . . . . . . . . . . . . . . . . . . . . . . . . . . . . . . . . . State Data Infrastructure Project ––– 110 –––. . . . . . . . . . . . . . . . . . . . . . . . . . . . . . . . . . . . . . . . . . . . State Regulation on Immunization Rates of Older Adults 180 160 –––. . . . . . . . . . . . . . . . . . . . . . . . Strategic National Stockpile Deployment Program ––– 3,000 –––. . . . . . . . . . . . . . . . . . . . . . . . . . . . . Substance Abuse Block Grant 42,054 51,385 53,385. . . . . . . . . . . . . . . . . . . . . . . . . . . . . . . . . . . . . . . . . . . . . . Supplemental Food Program–W.I.C. 74,327 85,000 90,000. . . . . . . . . . . . . . . . . . . . . . . . . . . . . . . . . . . . . . . . . Surveillance, Epidemiology and End Results (SEER) 391 1,800 1,800. . . . . . . . . . . . . . . . . . . . . . . . . . . Tools For School Implementation Project 90 80 –––. . . . . . . . . . . . . . . . . . . . . . . . . . . . . . . . . . . . . Traumatic Brain Injury Surveillance 1 105 105. . . . . . . . . . . . . . . . . . . . . . . . . . . . . . . . . . . . . . . . . Tuberculosis Control Program 7,368 10,000 6,069. . . . . . . . . . . . . . . . . . . . . . . . . . . . . . . . . . . . . . . . . . . . . USDA Older Americans Act – Title III 4,130 3,900 3,900. . . . . . . . . . . . . . . . . . . . . . . . . . . . . . . . . . . . . . . Universal Newborn Hearing Screening 30 250 250. . . . . . . . . . . . . . . . . . . . . . . . . . . . . . . . . . . . . . . Venereal Disease Project 2,909 3,500 3,800. . . . . . . . . . . . . . . . . . . . . . . . . . . . . . . . . . . . . . . . . . . . . . . . . . Violence Related Injury Prevention ––– 160 160. . . . . . . . . . . . . . . . . . . . . . . . . . . . . . . . . . . . . . . . . Vital Statistics Component 993 850 850. . . . . . . . . . . . . . . . . . . . . . . . . . . . . . . . . . . . . . . . . . . . . . . . WIC Farmer’s Market Nutrition Program 744 1,300 2,000. . . . . . . . . . . . . . . . . . . . . . . . . . . . . . . . . . . . . West Nile Virus – Laboratory ––– 200 200. . . . . . . . . . . . . . . . . . . . . . . . . . . . . . . . . . . . . . . . . . . . . . West Nile Virus – Public Health 1,517 1,900 2,300. . . . . . . . . . . . . . . . . . . . . . . . . . . . . . . . . . . . . . . . . . . . World Trade Center Substance Prevention – Response Emergency Disaster 172 ––– –––. . . . . . . . . . World Trade Center Substance Prevention II 75 ––– –––. . . . . . . . . . . . . . . . . . . . . . . . . . . . . . . . . . World Trade Center Substance Treatment II 210 ––– –––. . . . . . . . . . . . . . . . . . . . . . . . . . . . . . . . . . . Young Offender Reentry Program ––– 500 490. . . . . . . . . . . . . . . . . . . . . . . . . . . . . . . . . . . . . . . . . . . Various Federal Programs and Accruals –4,537 4,530 4,086. . . . . . . . . . . . . . . . . . . . . . . . . . . . . . . . . . . . . .
465,715 421,124 523,345
80
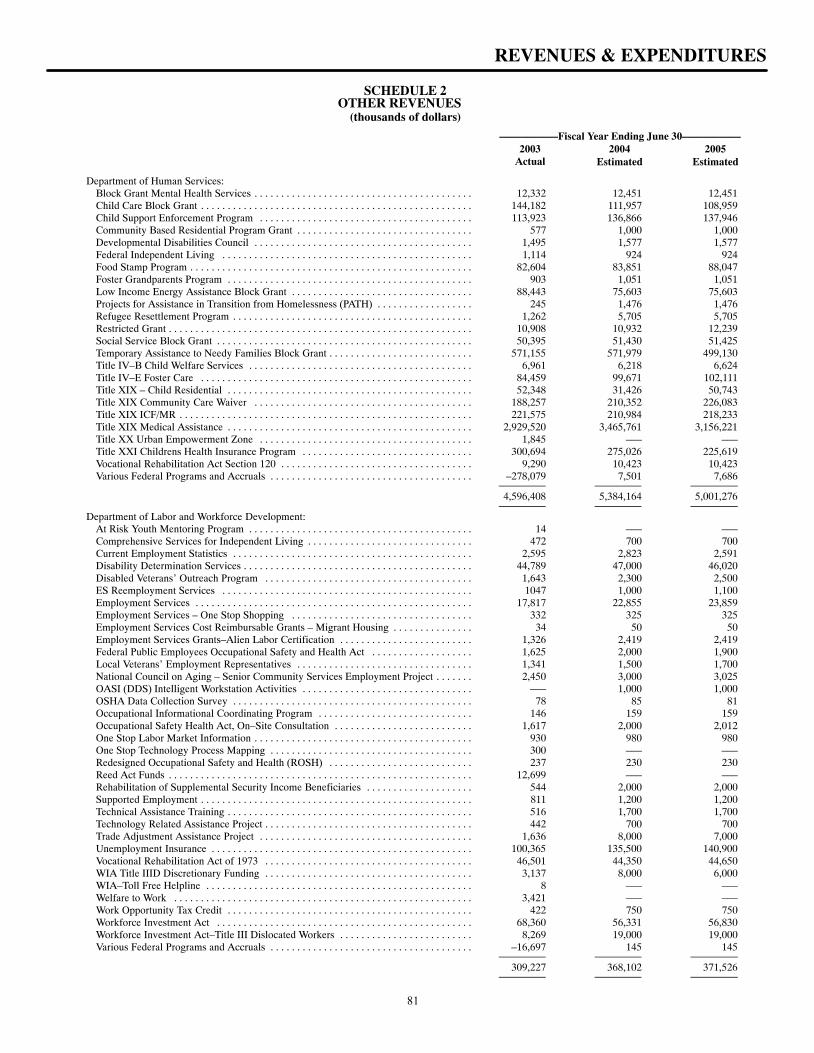
SCHEDULE 2OTHER REVENUES
(thousands of dollars)
–––––––––––Fiscal Year Ending June 30–––––––––––2003 2004 2005
Actual Estimated Estimated
REVENUES & EXPENDITURES
Department of Human Services:Block Grant Mental Health Services 12,332 12,451 12,451. . . . . . . . . . . . . . . . . . . . . . . . . . . . . . . . . . . . . . . . . Child Care Block Grant 144,182 111,957 108,959. . . . . . . . . . . . . . . . . . . . . . . . . . . . . . . . . . . . . . . . . . . . . . . . . . . Child Support Enforcement Program 113,923 136,866 137,946. . . . . . . . . . . . . . . . . . . . . . . . . . . . . . . . . . . . . . . . Community Based Residential Program Grant 577 1,000 1,000. . . . . . . . . . . . . . . . . . . . . . . . . . . . . . . . . Developmental Disabilities Council 1,495 1,577 1,577. . . . . . . . . . . . . . . . . . . . . . . . . . . . . . . . . . . . . . . . . Federal Independent Living 1,114 924 924. . . . . . . . . . . . . . . . . . . . . . . . . . . . . . . . . . . . . . . . . . . . . . . Food Stamp Program 82,604 83,851 88,047. . . . . . . . . . . . . . . . . . . . . . . . . . . . . . . . . . . . . . . . . . . . . . . . . . . . . Foster Grandparents Program 903 1,051 1,051. . . . . . . . . . . . . . . . . . . . . . . . . . . . . . . . . . . . . . . . . . . . . . Low Income Energy Assistance Block Grant 88,443 75,603 75,603. . . . . . . . . . . . . . . . . . . . . . . . . . . . . . . . . . Projects for Assistance in Transition from Homelessness (PATH) 245 1,476 1,476. . . . . . . . . . . . . . . . . . Refugee Resettlement Program 1,262 5,705 5,705. . . . . . . . . . . . . . . . . . . . . . . . . . . . . . . . . . . . . . . . . . . . . Restricted Grant 10,908 10,932 12,239. . . . . . . . . . . . . . . . . . . . . . . . . . . . . . . . . . . . . . . . . . . . . . . . . . . . . . . . . Social Service Block Grant 50,395 51,430 51,425. . . . . . . . . . . . . . . . . . . . . . . . . . . . . . . . . . . . . . . . . . . . . . . . Temporary Assistance to Needy Families Block Grant 571,155 571,979 499,130. . . . . . . . . . . . . . . . . . . . . . . . . . . Title IV–B Child Welfare Services 6,961 6,218 6,624. . . . . . . . . . . . . . . . . . . . . . . . . . . . . . . . . . . . . . . . . . Title IV–E Foster Care 84,459 99,671 102,111. . . . . . . . . . . . . . . . . . . . . . . . . . . . . . . . . . . . . . . . . . . . . . . . . . . Title XIX – Child Residential 52,348 31,426 50,743. . . . . . . . . . . . . . . . . . . . . . . . . . . . . . . . . . . . . . . . . . . . . . Title XIX Community Care Waiver 188,257 210,352 226,083. . . . . . . . . . . . . . . . . . . . . . . . . . . . . . . . . . . . . . . . . Title XIX ICF/MR 221,575 210,984 218,233. . . . . . . . . . . . . . . . . . . . . . . . . . . . . . . . . . . . . . . . . . . . . . . . . . . . . . . Title XIX Medical Assistance 2,929,520 3,465,761 3,156,221. . . . . . . . . . . . . . . . . . . . . . . . . . . . . . . . . . . . . . . . . . . . . . Title XX Urban Empowerment Zone 1,845 ––– –––. . . . . . . . . . . . . . . . . . . . . . . . . . . . . . . . . . . . . . . . Title XXI Childrens Health Insurance Program 300,694 275,026 225,619. . . . . . . . . . . . . . . . . . . . . . . . . . . . . . . . Vocational Rehabilitation Act Section 120 9,290 10,423 10,423. . . . . . . . . . . . . . . . . . . . . . . . . . . . . . . . . . . . Various Federal Programs and Accruals –278,079 7,501 7,686. . . . . . . . . . . . . . . . . . . . . . . . . . . . . . . . . . . . . .
4,596,408 5,384,164 5,001,276
Department of Labor and Workforce Development:At Risk Youth Mentoring Program 14 ––– –––. . . . . . . . . . . . . . . . . . . . . . . . . . . . . . . . . . . . . . . . . . Comprehensive Services for Independent Living 472 700 700. . . . . . . . . . . . . . . . . . . . . . . . . . . . . . . Current Employment Statistics 2,595 2,823 2,591. . . . . . . . . . . . . . . . . . . . . . . . . . . . . . . . . . . . . . . . . . . . . Disability Determination Services 44,789 47,000 46,020. . . . . . . . . . . . . . . . . . . . . . . . . . . . . . . . . . . . . . . . . . . Disabled Veterans’ Outreach Program 1,643 2,300 2,500. . . . . . . . . . . . . . . . . . . . . . . . . . . . . . . . . . . . . . . ES Reemployment Services 1047 1,000 1,100. . . . . . . . . . . . . . . . . . . . . . . . . . . . . . . . . . . . . . . . . . . . . . . Employment Services 17,817 22,855 23,859. . . . . . . . . . . . . . . . . . . . . . . . . . . . . . . . . . . . . . . . . . . . . . . . . . . . Employment Services – One Stop Shopping 332 325 325. . . . . . . . . . . . . . . . . . . . . . . . . . . . . . . . . . Employment Services Cost Reimbursable Grants – Migrant Housing 34 50 50. . . . . . . . . . . . . . . Employment Services Grants–Alien Labor Certification 1,326 2,419 2,419. . . . . . . . . . . . . . . . . . . . . . . . . Federal Public Employees Occupational Safety and Health Act 1,625 2,000 1,900. . . . . . . . . . . . . . . . . . . Local Veterans’ Employment Representatives 1,341 1,500 1,700. . . . . . . . . . . . . . . . . . . . . . . . . . . . . . . . . National Council on Aging – Senior Community Services Employment Project 2,450 3,000 3,025. . . . . . . OASI (DDS) Intelligent Workstation Activities ––– 1,000 1,000. . . . . . . . . . . . . . . . . . . . . . . . . . . . . . . . OSHA Data Collection Survey 78 85 81. . . . . . . . . . . . . . . . . . . . . . . . . . . . . . . . . . . . . . . . . . . . . Occupational Informational Coordinating Program 146 159 159. . . . . . . . . . . . . . . . . . . . . . . . . . . . . Occupational Safety Health Act, On–Site Consultation 1,617 2,000 2,012. . . . . . . . . . . . . . . . . . . . . . . . . . One Stop Labor Market Information 930 980 980. . . . . . . . . . . . . . . . . . . . . . . . . . . . . . . . . . . . . . . . . One Stop Technology Process Mapping 300 ––– –––. . . . . . . . . . . . . . . . . . . . . . . . . . . . . . . . . . . . . . Redesigned Occupational Safety and Health (ROSH) 237 230 230. . . . . . . . . . . . . . . . . . . . . . . . . . . Reed Act Funds 12,699 ––– –––. . . . . . . . . . . . . . . . . . . . . . . . . . . . . . . . . . . . . . . . . . . . . . . . . . . . . . . . . Rehabilitation of Supplemental Security Income Beneficiaries 544 2,000 2,000. . . . . . . . . . . . . . . . . . . . Supported Employment 811 1,200 1,200. . . . . . . . . . . . . . . . . . . . . . . . . . . . . . . . . . . . . . . . . . . . . . . . . . . Technical Assistance Training 516 1,700 1,700. . . . . . . . . . . . . . . . . . . . . . . . . . . . . . . . . . . . . . . . . . . . . . Technology Related Assistance Project 442 700 700. . . . . . . . . . . . . . . . . . . . . . . . . . . . . . . . . . . . . . . Trade Adjustment Assistance Project 1,636 8,000 7,000. . . . . . . . . . . . . . . . . . . . . . . . . . . . . . . . . . . . . . . . Unemployment Insurance 100,365 135,500 140,900. . . . . . . . . . . . . . . . . . . . . . . . . . . . . . . . . . . . . . . . . . . . . . . . . Vocational Rehabilitation Act of 1973 46,501 44,350 44,650. . . . . . . . . . . . . . . . . . . . . . . . . . . . . . . . . . . . . . . WIA Title IIID Discretionary Funding 3,137 8,000 6,000. . . . . . . . . . . . . . . . . . . . . . . . . . . . . . . . . . . . . . . WIA–Toll Free Helpline 8 ––– –––. . . . . . . . . . . . . . . . . . . . . . . . . . . . . . . . . . . . . . . . . . . . . . . . . . Welfare to Work 3,421 ––– –––. . . . . . . . . . . . . . . . . . . . . . . . . . . . . . . . . . . . . . . . . . . . . . . . . . . . . . . . Work Opportunity Tax Credit 422 750 750. . . . . . . . . . . . . . . . . . . . . . . . . . . . . . . . . . . . . . . . . . . . . . Workforce Investment Act 68,360 56,331 56,830. . . . . . . . . . . . . . . . . . . . . . . . . . . . . . . . . . . . . . . . . . . . . . . . Workforce Investment Act–Title III Dislocated Workers 8,269 19,000 19,000. . . . . . . . . . . . . . . . . . . . . . . . . Various Federal Programs and Accruals –16,697 145 145. . . . . . . . . . . . . . . . . . . . . . . . . . . . . . . . . . . . . .
309,227 368,102 371,526
81
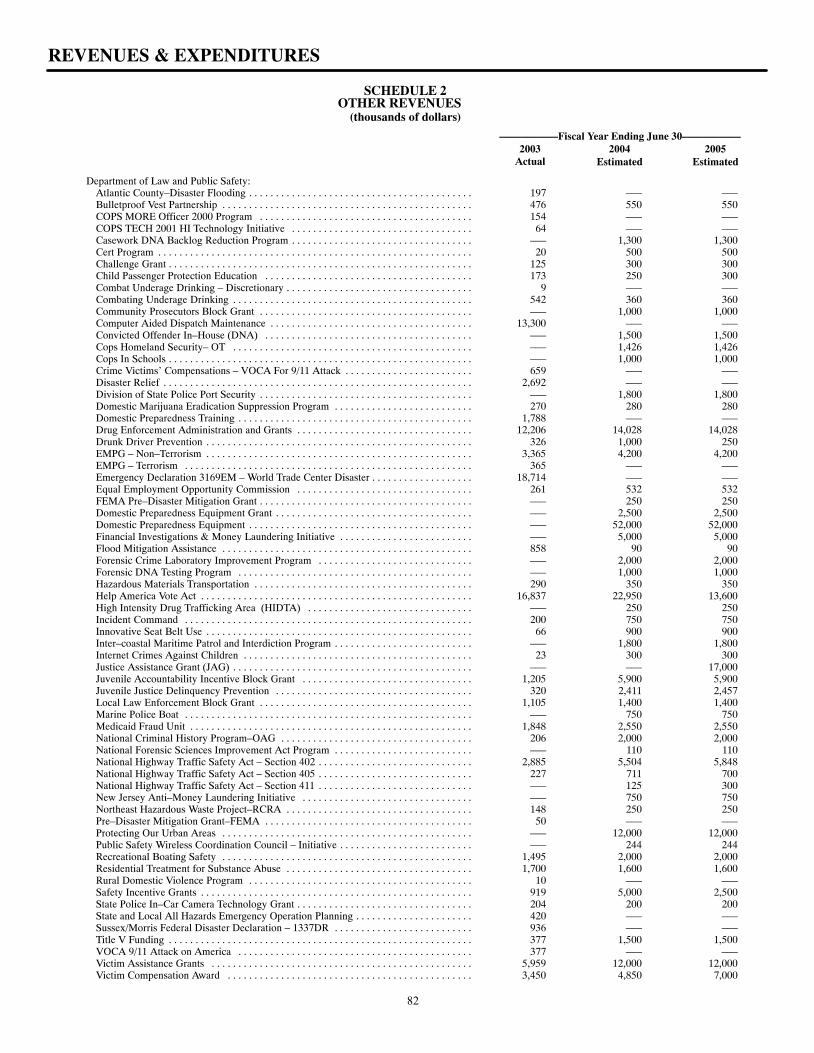
SCHEDULE 2OTHER REVENUES
(thousands of dollars)
–––––––––––Fiscal Year Ending June 30–––––––––––2003 2004 2005
Actual Estimated Estimated
REVENUES & EXPENDITURES
Department of Law and Public Safety:Atlantic County–Disaster Flooding 197 ––– –––. . . . . . . . . . . . . . . . . . . . . . . . . . . . . . . . . . . . . . . . . . Bulletproof Vest Partnership 476 550 550. . . . . . . . . . . . . . . . . . . . . . . . . . . . . . . . . . . . . . . . . . . . . . . COPS MORE Officer 2000 Program 154 ––– –––. . . . . . . . . . . . . . . . . . . . . . . . . . . . . . . . . . . . . . . . COPS TECH 2001 HI Technology Initiative 64 ––– –––. . . . . . . . . . . . . . . . . . . . . . . . . . . . . . . . . . Casework DNA Backlog Reduction Program ––– 1,300 1,300. . . . . . . . . . . . . . . . . . . . . . . . . . . . . . . . . . Cert Program 20 500 500. . . . . . . . . . . . . . . . . . . . . . . . . . . . . . . . . . . . . . . . . . . . . . . . . . . . . . . . . . . Challenge Grant 125 300 300. . . . . . . . . . . . . . . . . . . . . . . . . . . . . . . . . . . . . . . . . . . . . . . . . . . . . . . . . Child Passenger Protection Education 173 250 300. . . . . . . . . . . . . . . . . . . . . . . . . . . . . . . . . . . . . . . Combat Underage Drinking – Discretionary 9 ––– –––. . . . . . . . . . . . . . . . . . . . . . . . . . . . . . . . . . . Combating Underage Drinking 542 360 360. . . . . . . . . . . . . . . . . . . . . . . . . . . . . . . . . . . . . . . . . . . . . Community Prosecutors Block Grant ––– 1,000 1,000. . . . . . . . . . . . . . . . . . . . . . . . . . . . . . . . . . . . . . . . Computer Aided Dispatch Maintenance 13,300 ––– –––. . . . . . . . . . . . . . . . . . . . . . . . . . . . . . . . . . . . . . Convicted Offender In–House (DNA) ––– 1,500 1,500. . . . . . . . . . . . . . . . . . . . . . . . . . . . . . . . . . . . . . . Cops Homeland Security– OT ––– 1,426 1,426. . . . . . . . . . . . . . . . . . . . . . . . . . . . . . . . . . . . . . . . . . . . . Cops In Schools ––– 1,000 1,000. . . . . . . . . . . . . . . . . . . . . . . . . . . . . . . . . . . . . . . . . . . . . . . . . . . . . . . . . Crime Victims’ Compensations – VOCA For 9/11 Attack 659 ––– –––. . . . . . . . . . . . . . . . . . . . . . . . Disaster Relief 2,692 ––– –––. . . . . . . . . . . . . . . . . . . . . . . . . . . . . . . . . . . . . . . . . . . . . . . . . . . . . . . . . . Division of State Police Port Security ––– 1,800 1,800. . . . . . . . . . . . . . . . . . . . . . . . . . . . . . . . . . . . . . . . Domestic Marijuana Eradication Suppression Program 270 280 280. . . . . . . . . . . . . . . . . . . . . . . . . . Domestic Preparedness Training 1,788 ––– –––. . . . . . . . . . . . . . . . . . . . . . . . . . . . . . . . . . . . . . . . . . . . Drug Enforcement Administration and Grants 12,206 14,028 14,028. . . . . . . . . . . . . . . . . . . . . . . . . . . . . . . . . Drunk Driver Prevention 326 1,000 250. . . . . . . . . . . . . . . . . . . . . . . . . . . . . . . . . . . . . . . . . . . . . . . . . . EMPG – Non–Terrorism 3,365 4,200 4,200. . . . . . . . . . . . . . . . . . . . . . . . . . . . . . . . . . . . . . . . . . . . . . . . . . EMPG – Terrorism 365 ––– –––. . . . . . . . . . . . . . . . . . . . . . . . . . . . . . . . . . . . . . . . . . . . . . . . . . . . . . Emergency Declaration 3169EM – World Trade Center Disaster 18,714 ––– –––. . . . . . . . . . . . . . . . . . . Equal Employment Opportunity Commission 261 532 532. . . . . . . . . . . . . . . . . . . . . . . . . . . . . . . . . FEMA Pre–Disaster Mitigation Grant ––– 250 250. . . . . . . . . . . . . . . . . . . . . . . . . . . . . . . . . . . . . . . . Domestic Preparedness Equipment Grant ––– 2,500 2,500. . . . . . . . . . . . . . . . . . . . . . . . . . . . . . . . . . . . . Domestic Preparedness Equipment ––– 52,000 52,000. . . . . . . . . . . . . . . . . . . . . . . . . . . . . . . . . . . . . . . . . . Financial Investigations & Money Laundering Initiative ––– 5,000 5,000. . . . . . . . . . . . . . . . . . . . . . . . . Flood Mitigation Assistance 858 90 90. . . . . . . . . . . . . . . . . . . . . . . . . . . . . . . . . . . . . . . . . . . . . . . Forensic Crime Laboratory Improvement Program ––– 2,000 2,000. . . . . . . . . . . . . . . . . . . . . . . . . . . . . Forensic DNA Testing Program ––– 1,000 1,000. . . . . . . . . . . . . . . . . . . . . . . . . . . . . . . . . . . . . . . . . . . . Hazardous Materials Transportation 290 350 350. . . . . . . . . . . . . . . . . . . . . . . . . . . . . . . . . . . . . . . . . Help America Vote Act 16,837 22,950 13,600. . . . . . . . . . . . . . . . . . . . . . . . . . . . . . . . . . . . . . . . . . . . . . . . . . . High Intensity Drug Trafficking Area (HIDTA) ––– 250 250. . . . . . . . . . . . . . . . . . . . . . . . . . . . . . . Incident Command 200 750 750. . . . . . . . . . . . . . . . . . . . . . . . . . . . . . . . . . . . . . . . . . . . . . . . . . . . . . Innovative Seat Belt Use 66 900 900. . . . . . . . . . . . . . . . . . . . . . . . . . . . . . . . . . . . . . . . . . . . . . . . . . Inter–coastal Maritime Patrol and Interdiction Program ––– 1,800 1,800. . . . . . . . . . . . . . . . . . . . . . . . . . Internet Crimes Against Children 23 300 300. . . . . . . . . . . . . . . . . . . . . . . . . . . . . . . . . . . . . . . . . . . Justice Assistance Grant (JAG) ––– ––– 17,000. . . . . . . . . . . . . . . . . . . . . . . . . . . . . . . . . . . . . . . . . . . . . Juvenile Accountability Incentive Block Grant 1,205 5,900 5,900. . . . . . . . . . . . . . . . . . . . . . . . . . . . . . . . Juvenile Justice Delinquency Prevention 320 2,411 2,457. . . . . . . . . . . . . . . . . . . . . . . . . . . . . . . . . . . . . Local Law Enforcement Block Grant 1,105 1,400 1,400. . . . . . . . . . . . . . . . . . . . . . . . . . . . . . . . . . . . . . . . Marine Police Boat ––– 750 750. . . . . . . . . . . . . . . . . . . . . . . . . . . . . . . . . . . . . . . . . . . . . . . . . . . . . . Medicaid Fraud Unit 1,848 2,550 2,550. . . . . . . . . . . . . . . . . . . . . . . . . . . . . . . . . . . . . . . . . . . . . . . . . . . . . National Criminal History Program–OAG 206 2,000 2,000. . . . . . . . . . . . . . . . . . . . . . . . . . . . . . . . . . . . National Forensic Sciences Improvement Act Program ––– 110 110. . . . . . . . . . . . . . . . . . . . . . . . . . National Highway Traffic Safety Act – Section 402 2,885 5,504 5,848. . . . . . . . . . . . . . . . . . . . . . . . . . . . . National Highway Traffic Safety Act – Section 405 227 711 700. . . . . . . . . . . . . . . . . . . . . . . . . . . . . National Highway Traffic Safety Act – Section 411 ––– 125 300. . . . . . . . . . . . . . . . . . . . . . . . . . . . . New Jersey Anti–Money Laundering Initiative ––– 750 750. . . . . . . . . . . . . . . . . . . . . . . . . . . . . . . . Northeast Hazardous Waste Project–RCRA 148 250 250. . . . . . . . . . . . . . . . . . . . . . . . . . . . . . . . . . . Pre–Disaster Mitigation Grant–FEMA 50 ––– –––. . . . . . . . . . . . . . . . . . . . . . . . . . . . . . . . . . . . . . . Protecting Our Urban Areas ––– 12,000 12,000. . . . . . . . . . . . . . . . . . . . . . . . . . . . . . . . . . . . . . . . . . . . . . . Public Safety Wireless Coordination Council – Initiative ––– 244 244. . . . . . . . . . . . . . . . . . . . . . . . . Recreational Boating Safety 1,495 2,000 2,000. . . . . . . . . . . . . . . . . . . . . . . . . . . . . . . . . . . . . . . . . . . . . . . Residential Treatment for Substance Abuse 1,700 1,600 1,600. . . . . . . . . . . . . . . . . . . . . . . . . . . . . . . . . . . Rural Domestic Violence Program 10 ––– –––. . . . . . . . . . . . . . . . . . . . . . . . . . . . . . . . . . . . . . . . . . Safety Incentive Grants 919 5,000 2,500. . . . . . . . . . . . . . . . . . . . . . . . . . . . . . . . . . . . . . . . . . . . . . . . . . . State Police In–Car Camera Technology Grant 204 200 200. . . . . . . . . . . . . . . . . . . . . . . . . . . . . . . . . State and Local All Hazards Emergency Operation Planning 420 ––– –––. . . . . . . . . . . . . . . . . . . . . . Sussex/Morris Federal Disaster Declaration – 1337DR 936 ––– –––. . . . . . . . . . . . . . . . . . . . . . . . . . Title V Funding 377 1,500 1,500. . . . . . . . . . . . . . . . . . . . . . . . . . . . . . . . . . . . . . . . . . . . . . . . . . . . . . . . . VOCA 9/11 Attack on America 377 ––– –––. . . . . . . . . . . . . . . . . . . . . . . . . . . . . . . . . . . . . . . . . . . . Victim Assistance Grants 5,959 12,000 12,000. . . . . . . . . . . . . . . . . . . . . . . . . . . . . . . . . . . . . . . . . . . . . . . . . Victim Compensation Award 3,450 4,850 7,000. . . . . . . . . . . . . . . . . . . . . . . . . . . . . . . . . . . . . . . . . . . . . .
82
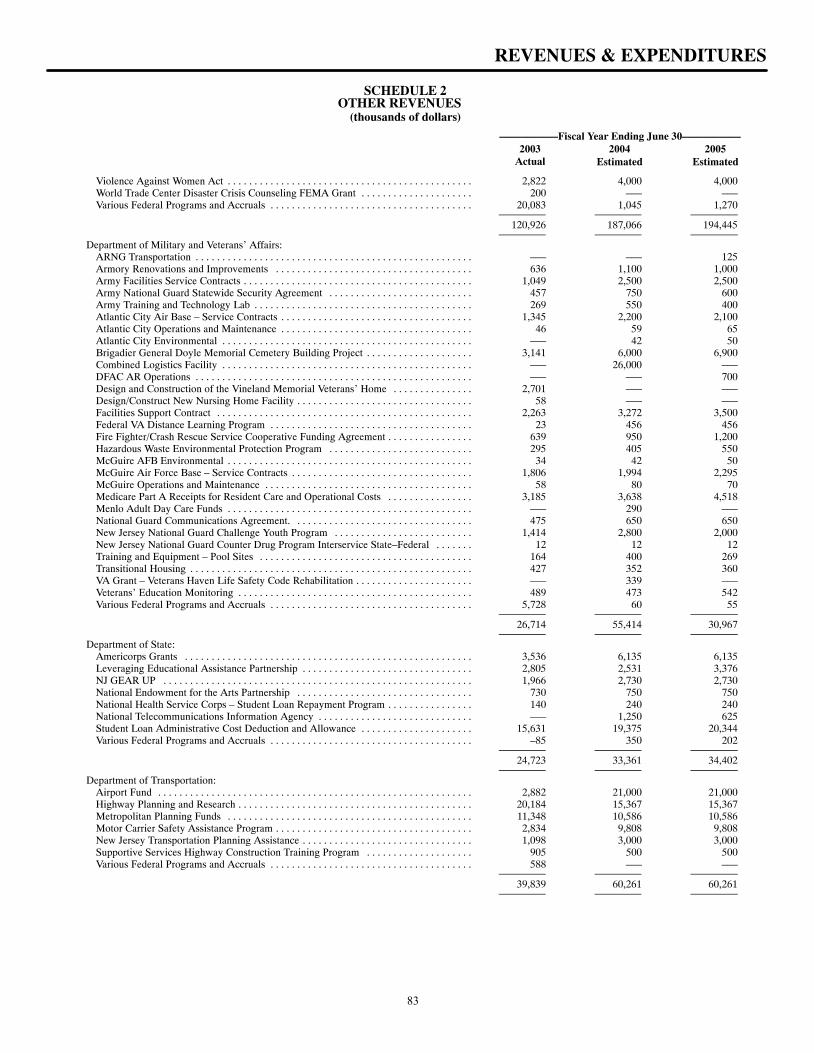
SCHEDULE 2OTHER REVENUES
(thousands of dollars)
–––––––––––Fiscal Year Ending June 30–––––––––––2003 2004 2005
Actual Estimated Estimated
REVENUES & EXPENDITURES
Violence Against Women Act 2,822 4,000 4,000. . . . . . . . . . . . . . . . . . . . . . . . . . . . . . . . . . . . . . . . . . . . . . World Trade Center Disaster Crisis Counseling FEMA Grant 200 ––– –––. . . . . . . . . . . . . . . . . . . . . Various Federal Programs and Accruals 20,083 1,045 1,270. . . . . . . . . . . . . . . . . . . . . . . . . . . . . . . . . . . . . .
120,926 187,066 194,445
Department of Military and Veterans’ Affairs:ARNG Transportation ––– ––– 125. . . . . . . . . . . . . . . . . . . . . . . . . . . . . . . . . . . . . . . . . . . . . . . . . . . . Armory Renovations and Improvements 636 1,100 1,000. . . . . . . . . . . . . . . . . . . . . . . . . . . . . . . . . . . . . Army Facilities Service Contracts 1,049 2,500 2,500. . . . . . . . . . . . . . . . . . . . . . . . . . . . . . . . . . . . . . . . . . . Army National Guard Statewide Security Agreement 457 750 600. . . . . . . . . . . . . . . . . . . . . . . . . . . Army Training and Technology Lab 269 550 400. . . . . . . . . . . . . . . . . . . . . . . . . . . . . . . . . . . . . . . . . Atlantic City Air Base – Service Contracts 1,345 2,200 2,100. . . . . . . . . . . . . . . . . . . . . . . . . . . . . . . . . . . . Atlantic City Operations and Maintenance 46 59 65. . . . . . . . . . . . . . . . . . . . . . . . . . . . . . . . . . . . Atlantic City Environmental ––– 42 50. . . . . . . . . . . . . . . . . . . . . . . . . . . . . . . . . . . . . . . . . . . . . . . Brigadier General Doyle Memorial Cemetery Building Project 3,141 6,000 6,900. . . . . . . . . . . . . . . . . . . . Combined Logistics Facility ––– 26,000 –––. . . . . . . . . . . . . . . . . . . . . . . . . . . . . . . . . . . . . . . . . . . . . . . DFAC AR Operations ––– ––– 700. . . . . . . . . . . . . . . . . . . . . . . . . . . . . . . . . . . . . . . . . . . . . . . . . . . . Design and Construction of the Vineland Memorial Veterans’ Home 2,701 ––– –––. . . . . . . . . . . . . . . Design/Construct New Nursing Home Facility 58 ––– –––. . . . . . . . . . . . . . . . . . . . . . . . . . . . . . . . . Facilities Support Contract 2,263 3,272 3,500. . . . . . . . . . . . . . . . . . . . . . . . . . . . . . . . . . . . . . . . . . . . . . . . Federal VA Distance Learning Program 23 456 456. . . . . . . . . . . . . . . . . . . . . . . . . . . . . . . . . . . . . . Fire Fighter/Crash Rescue Service Cooperative Funding Agreement 639 950 1,200. . . . . . . . . . . . . . . . Hazardous Waste Environmental Protection Program 295 405 550. . . . . . . . . . . . . . . . . . . . . . . . . . . McGuire AFB Environmental 34 42 50. . . . . . . . . . . . . . . . . . . . . . . . . . . . . . . . . . . . . . . . . . . . . . McGuire Air Force Base – Service Contracts 1,806 1,994 2,295. . . . . . . . . . . . . . . . . . . . . . . . . . . . . . . . . . McGuire Operations and Maintenance 58 80 70. . . . . . . . . . . . . . . . . . . . . . . . . . . . . . . . . . . . . . . Medicare Part A Receipts for Resident Care and Operational Costs 3,185 3,638 4,518. . . . . . . . . . . . . . . . Menlo Adult Day Care Funds ––– 290 –––. . . . . . . . . . . . . . . . . . . . . . . . . . . . . . . . . . . . . . . . . . . . . . National Guard Communications Agreement. 475 650 650. . . . . . . . . . . . . . . . . . . . . . . . . . . . . . . . . New Jersey National Guard Challenge Youth Program 1,414 2,800 2,000. . . . . . . . . . . . . . . . . . . . . . . . . . New Jersey National Guard Counter Drug Program Interservice State–Federal 12 12 12. . . . . . . Training and Equipment – Pool Sites 164 400 269. . . . . . . . . . . . . . . . . . . . . . . . . . . . . . . . . . . . . . . . Transitional Housing 427 352 360. . . . . . . . . . . . . . . . . . . . . . . . . . . . . . . . . . . . . . . . . . . . . . . . . . . . . VA Grant – Veterans Haven Life Safety Code Rehabilitation ––– 339 –––. . . . . . . . . . . . . . . . . . . . . . Veterans’ Education Monitoring 489 473 542. . . . . . . . . . . . . . . . . . . . . . . . . . . . . . . . . . . . . . . . . . . . Various Federal Programs and Accruals 5,728 60 55. . . . . . . . . . . . . . . . . . . . . . . . . . . . . . . . . . . . . .
26,714 55,414 30,967
Department of State:Americorps Grants 3,536 6,135 6,135. . . . . . . . . . . . . . . . . . . . . . . . . . . . . . . . . . . . . . . . . . . . . . . . . . . . . . Leveraging Educational Assistance Partnership 2,805 2,531 3,376. . . . . . . . . . . . . . . . . . . . . . . . . . . . . . . . NJ GEAR UP 1,966 2,730 2,730. . . . . . . . . . . . . . . . . . . . . . . . . . . . . . . . . . . . . . . . . . . . . . . . . . . . . . . . . . National Endowment for the Arts Partnership 730 750 750. . . . . . . . . . . . . . . . . . . . . . . . . . . . . . . . . National Health Service Corps – Student Loan Repayment Program 140 240 240. . . . . . . . . . . . . . . . National Telecommunications Information Agency ––– 1,250 625. . . . . . . . . . . . . . . . . . . . . . . . . . . . . Student Loan Administrative Cost Deduction and Allowance 15,631 19,375 20,344. . . . . . . . . . . . . . . . . . . . . Various Federal Programs and Accruals –85 350 202. . . . . . . . . . . . . . . . . . . . . . . . . . . . . . . . . . . . . .
24,723 33,361 34,402
Department of Transportation:Airport Fund 2,882 21,000 21,000. . . . . . . . . . . . . . . . . . . . . . . . . . . . . . . . . . . . . . . . . . . . . . . . . . . . . . . . . . . Highway Planning and Research 20,184 15,367 15,367. . . . . . . . . . . . . . . . . . . . . . . . . . . . . . . . . . . . . . . . . . . . Metropolitan Planning Funds 11,348 10,586 10,586. . . . . . . . . . . . . . . . . . . . . . . . . . . . . . . . . . . . . . . . . . . . . . Motor Carrier Safety Assistance Program 2,834 9,808 9,808. . . . . . . . . . . . . . . . . . . . . . . . . . . . . . . . . . . . . New Jersey Transportation Planning Assistance 1,098 3,000 3,000. . . . . . . . . . . . . . . . . . . . . . . . . . . . . . . . Supportive Services Highway Construction Training Program 905 500 500. . . . . . . . . . . . . . . . . . . . Various Federal Programs and Accruals 588 ––– –––. . . . . . . . . . . . . . . . . . . . . . . . . . . . . . . . . . . . . .
39,839 60,261 60,261
83
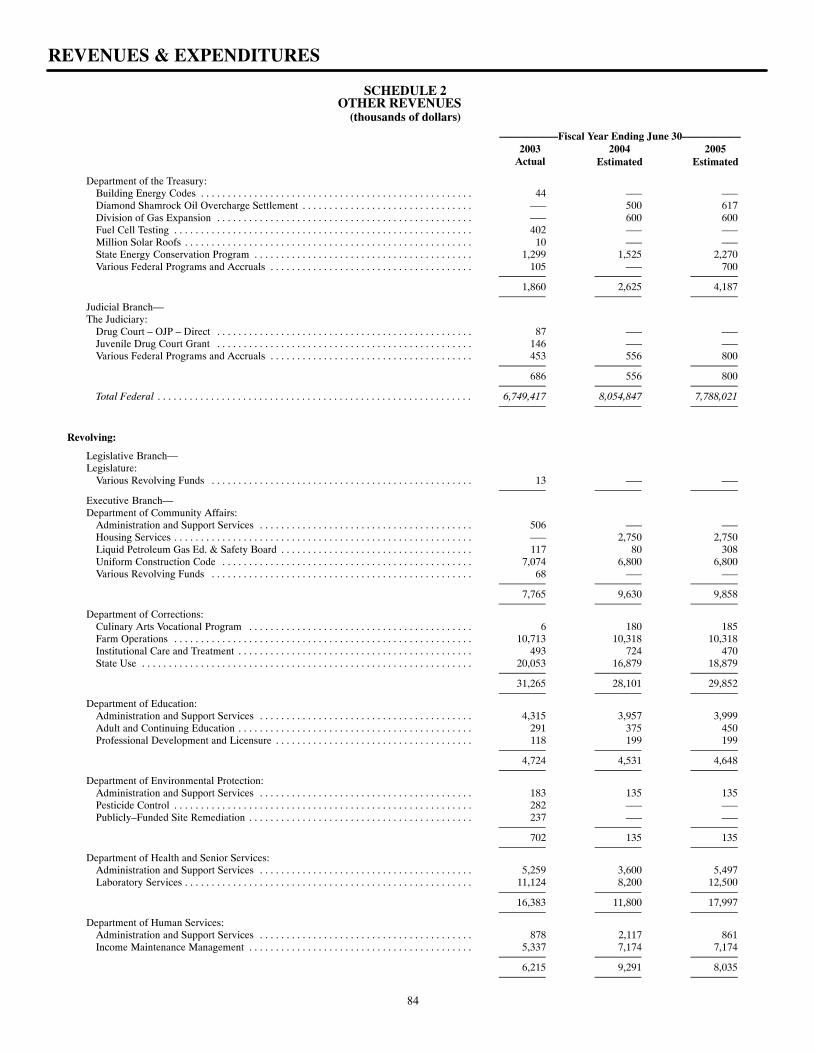
SCHEDULE 2OTHER REVENUES
(thousands of dollars)
–––––––––––Fiscal Year Ending June 30–––––––––––2003 2004 2005
Actual Estimated Estimated
REVENUES & EXPENDITURES
Department of the Treasury:Building Energy Codes 44 ––– –––. . . . . . . . . . . . . . . . . . . . . . . . . . . . . . . . . . . . . . . . . . . . . . . . . . . Diamond Shamrock Oil Overcharge Settlement ––– 500 617. . . . . . . . . . . . . . . . . . . . . . . . . . . . . . . . Division of Gas Expansion ––– 600 600. . . . . . . . . . . . . . . . . . . . . . . . . . . . . . . . . . . . . . . . . . . . . . . . Fuel Cell Testing 402 ––– –––. . . . . . . . . . . . . . . . . . . . . . . . . . . . . . . . . . . . . . . . . . . . . . . . . . . . . . . . Million Solar Roofs 10 ––– –––. . . . . . . . . . . . . . . . . . . . . . . . . . . . . . . . . . . . . . . . . . . . . . . . . . . . . . State Energy Conservation Program 1,299 1,525 2,270. . . . . . . . . . . . . . . . . . . . . . . . . . . . . . . . . . . . . . . . . Various Federal Programs and Accruals 105 ––– 700. . . . . . . . . . . . . . . . . . . . . . . . . . . . . . . . . . . . . .
1,860 2,625 4,187
Judicial Branch––The Judiciary:
Drug Court – OJP – Direct 87 ––– –––. . . . . . . . . . . . . . . . . . . . . . . . . . . . . . . . . . . . . . . . . . . . . . . . Juvenile Drug Court Grant 146 ––– –––. . . . . . . . . . . . . . . . . . . . . . . . . . . . . . . . . . . . . . . . . . . . . . . . Various Federal Programs and Accruals 453 556 800. . . . . . . . . . . . . . . . . . . . . . . . . . . . . . . . . . . . . .
686 556 800
Total Federal 6,749,417 8,054,847 7,788,021. . . . . . . . . . . . . . . . . . . . . . . . . . . . . . . . . . . . . . . . . . . . . . . . . . . . . . . . . . .
Revolving:
Legislative Branch––Legislature:
Various Revolving Funds 13 ––– –––. . . . . . . . . . . . . . . . . . . . . . . . . . . . . . . . . . . . . . . . . . . . . . . . .
Executive Branch––Department of Community Affairs:
Administration and Support Services 506 ––– –––. . . . . . . . . . . . . . . . . . . . . . . . . . . . . . . . . . . . . . . . Housing Services ––– 2,750 2,750. . . . . . . . . . . . . . . . . . . . . . . . . . . . . . . . . . . . . . . . . . . . . . . . . . . . . . . . Liquid Petroleum Gas Ed. & Safety Board 117 80 308. . . . . . . . . . . . . . . . . . . . . . . . . . . . . . . . . . . . Uniform Construction Code 7,074 6,800 6,800. . . . . . . . . . . . . . . . . . . . . . . . . . . . . . . . . . . . . . . . . . . . . . . Various Revolving Funds 68 ––– –––. . . . . . . . . . . . . . . . . . . . . . . . . . . . . . . . . . . . . . . . . . . . . . . . .
7,765 9,630 9,858
Department of Corrections:Culinary Arts Vocational Program 6 180 185. . . . . . . . . . . . . . . . . . . . . . . . . . . . . . . . . . . . . . . . . . Farm Operations 10,713 10,318 10,318. . . . . . . . . . . . . . . . . . . . . . . . . . . . . . . . . . . . . . . . . . . . . . . . . . . . . . . . Institutional Care and Treatment 493 724 470. . . . . . . . . . . . . . . . . . . . . . . . . . . . . . . . . . . . . . . . . . . . State Use 20,053 16,879 18,879. . . . . . . . . . . . . . . . . . . . . . . . . . . . . . . . . . . . . . . . . . . . . . . . . . . . . . . . . . . . . .
31,265 28,101 29,852
Department of Education:Administration and Support Services 4,315 3,957 3,999. . . . . . . . . . . . . . . . . . . . . . . . . . . . . . . . . . . . . . . . Adult and Continuing Education 291 375 450. . . . . . . . . . . . . . . . . . . . . . . . . . . . . . . . . . . . . . . . . . . . Professional Development and Licensure 118 199 199. . . . . . . . . . . . . . . . . . . . . . . . . . . . . . . . . . . . .
4,724 4,531 4,648
Department of Environmental Protection:Administration and Support Services 183 135 135. . . . . . . . . . . . . . . . . . . . . . . . . . . . . . . . . . . . . . . . Pesticide Control 282 ––– –––. . . . . . . . . . . . . . . . . . . . . . . . . . . . . . . . . . . . . . . . . . . . . . . . . . . . . . . . Publicly–Funded Site Remediation 237 ––– –––. . . . . . . . . . . . . . . . . . . . . . . . . . . . . . . . . . . . . . . . . .
702 135 135
Department of Health and Senior Services:Administration and Support Services 5,259 3,600 5,497. . . . . . . . . . . . . . . . . . . . . . . . . . . . . . . . . . . . . . . . Laboratory Services 11,124 8,200 12,500. . . . . . . . . . . . . . . . . . . . . . . . . . . . . . . . . . . . . . . . . . . . . . . . . . . . . .
16,383 11,800 17,997
Department of Human Services:Administration and Support Services 878 2,117 861. . . . . . . . . . . . . . . . . . . . . . . . . . . . . . . . . . . . . . . . Income Maintenance Management 5,337 7,174 7,174. . . . . . . . . . . . . . . . . . . . . . . . . . . . . . . . . . . . . . . . . .
6,215 9,291 8,035
84
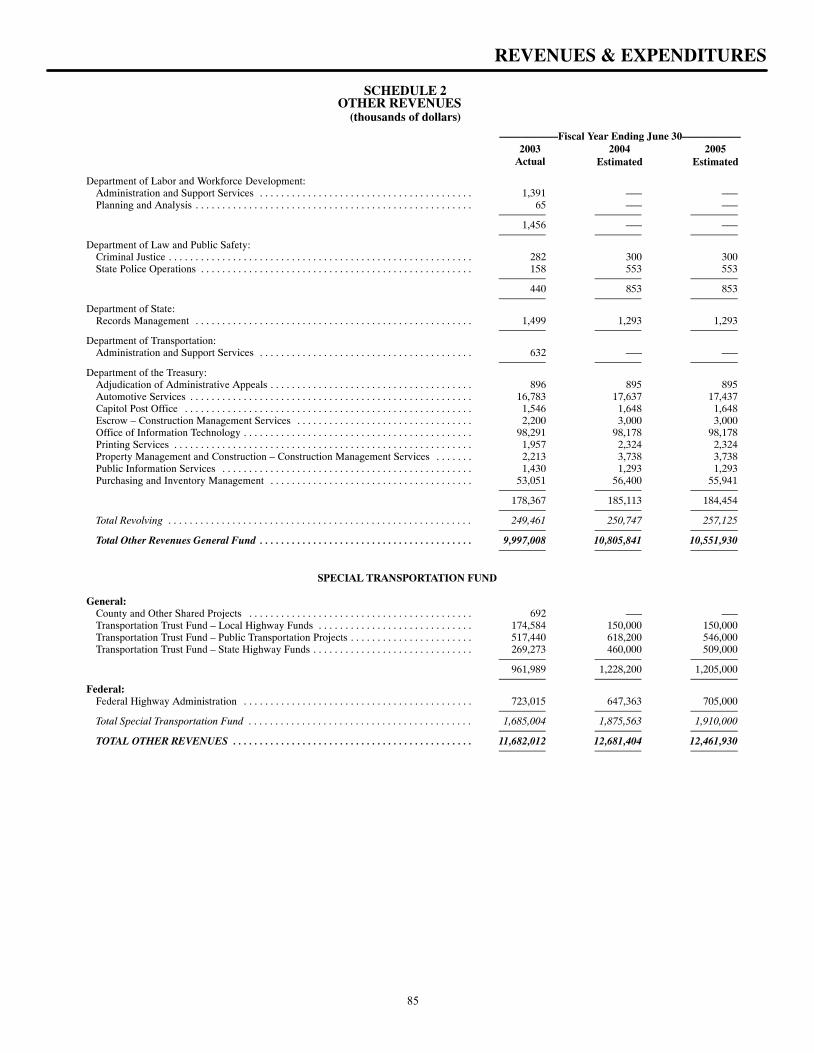
SCHEDULE 2OTHER REVENUES
(thousands of dollars)
–––––––––––Fiscal Year Ending June 30–––––––––––2003 2004 2005
Actual Estimated Estimated
REVENUES & EXPENDITURES
Department of Labor and Workforce Development:Administration and Support Services 1,391 ––– –––. . . . . . . . . . . . . . . . . . . . . . . . . . . . . . . . . . . . . . . . Planning and Analysis 65 ––– –––. . . . . . . . . . . . . . . . . . . . . . . . . . . . . . . . . . . . . . . . . . . . . . . . . . . .
1,456 ––– –––
Department of Law and Public Safety:Criminal Justice 282 300 300. . . . . . . . . . . . . . . . . . . . . . . . . . . . . . . . . . . . . . . . . . . . . . . . . . . . . . . . . State Police Operations 158 553 553. . . . . . . . . . . . . . . . . . . . . . . . . . . . . . . . . . . . . . . . . . . . . . . . . . .
440 853 853
Department of State:Records Management 1,499 1,293 1,293. . . . . . . . . . . . . . . . . . . . . . . . . . . . . . . . . . . . . . . . . . . . . . . . . . . .
Department of Transportation:Administration and Support Services 632 ––– –––. . . . . . . . . . . . . . . . . . . . . . . . . . . . . . . . . . . . . . . .
Department of the Treasury:Adjudication of Administrative Appeals 896 895 895. . . . . . . . . . . . . . . . . . . . . . . . . . . . . . . . . . . . . . Automotive Services 16,783 17,637 17,437. . . . . . . . . . . . . . . . . . . . . . . . . . . . . . . . . . . . . . . . . . . . . . . . . . . . . Capitol Post Office 1,546 1,648 1,648. . . . . . . . . . . . . . . . . . . . . . . . . . . . . . . . . . . . . . . . . . . . . . . . . . . . . . Escrow – Construction Management Services 2,200 3,000 3,000. . . . . . . . . . . . . . . . . . . . . . . . . . . . . . . . . Office of Information Technology 98,291 98,178 98,178. . . . . . . . . . . . . . . . . . . . . . . . . . . . . . . . . . . . . . . . . . . Printing Services 1,957 2,324 2,324. . . . . . . . . . . . . . . . . . . . . . . . . . . . . . . . . . . . . . . . . . . . . . . . . . . . . . . . Property Management and Construction – Construction Management Services 2,213 3,738 3,738. . . . . . . Public Information Services 1,430 1,293 1,293. . . . . . . . . . . . . . . . . . . . . . . . . . . . . . . . . . . . . . . . . . . . . . . Purchasing and Inventory Management 53,051 56,400 55,941. . . . . . . . . . . . . . . . . . . . . . . . . . . . . . . . . . . . . .
178,367 185,113 184,454
Total Revolving 249,461 250,747 257,125. . . . . . . . . . . . . . . . . . . . . . . . . . . . . . . . . . . . . . . . . . . . . . . . . . . . . . . . .
Total Other Revenues General Fund 9,997,008 10,805,841 10,551,930. . . . . . . . . . . . . . . . . . . . . . . . . . . . . . . . . . . . . . . .
SPECIAL TRANSPORTATION FUND
General:County and Other Shared Projects 692 ––– –––. . . . . . . . . . . . . . . . . . . . . . . . . . . . . . . . . . . . . . . . . . Transportation Trust Fund – Local Highway Funds 174,584 150,000 150,000. . . . . . . . . . . . . . . . . . . . . . . . . . . . . Transportation Trust Fund – Public Transportation Projects 517,440 618,200 546,000. . . . . . . . . . . . . . . . . . . . . . . Transportation Trust Fund – State Highway Funds 269,273 460,000 509,000. . . . . . . . . . . . . . . . . . . . . . . . . . . . . .
961,989 1,228,200 1,205,000
Federal:Federal Highway Administration 723,015 647,363 705,000. . . . . . . . . . . . . . . . . . . . . . . . . . . . . . . . . . . . . . . . . . .
Total Special Transportation Fund 1,685,004 1,875,563 1,910,000. . . . . . . . . . . . . . . . . . . . . . . . . . . . . . . . . . . . . . . . . .
TOTAL OTHER REVENUES 11,682,012 12,681,404 12,461,930. . . . . . . . . . . . . . . . . . . . . . . . . . . . . . . . . . . . . . . . . . . . .
85
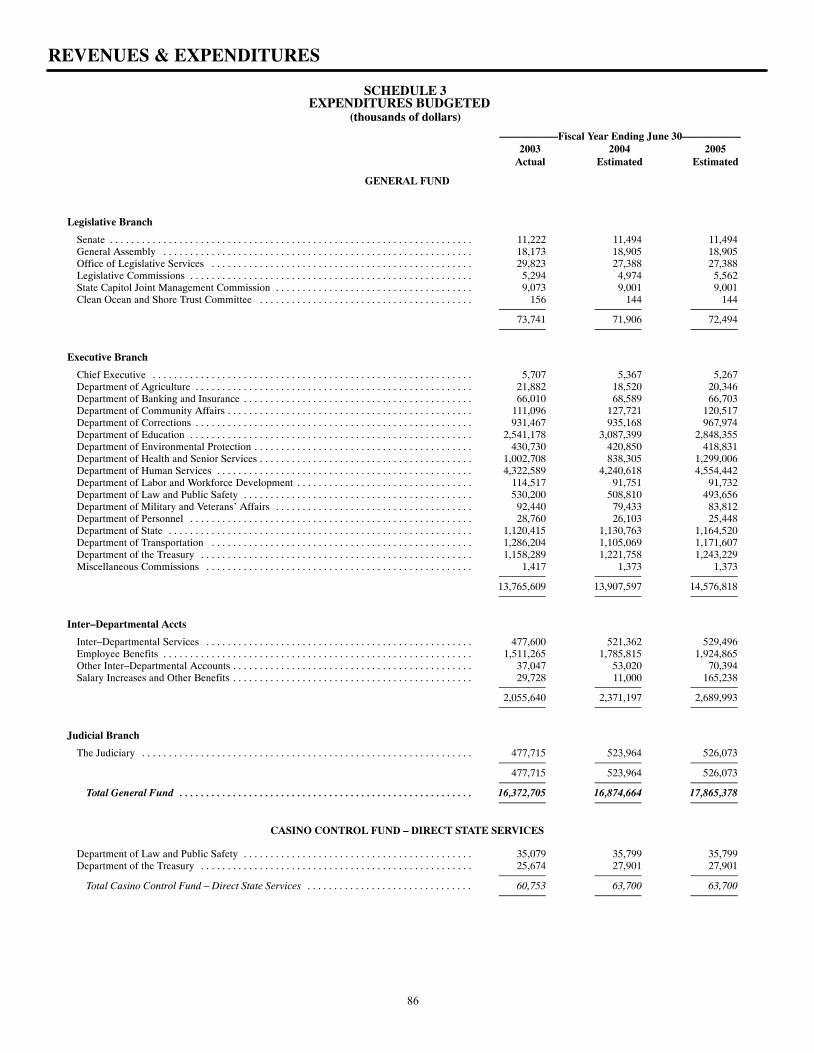
SCHEDULE 3EXPENDITURES BUDGETED
(thousands of dollars)
–––––––––––Fiscal Year Ending June 30–––––––––––2003 2004 2005
Actual Estimated Estimated
REVENUES & EXPENDITURES
GENERAL FUND
Legislative Branch
Senate 11,222 11,494 11,494. . . . . . . . . . . . . . . . . . . . . . . . . . . . . . . . . . . . . . . . . . . . . . . . . . . . . . . . . . . . . . . . . . . . General Assembly 18,173 18,905 18,905. . . . . . . . . . . . . . . . . . . . . . . . . . . . . . . . . . . . . . . . . . . . . . . . . . . . . . . . . . Office of Legislative Services 29,823 27,388 27,388. . . . . . . . . . . . . . . . . . . . . . . . . . . . . . . . . . . . . . . . . . . . . . . . . Legislative Commissions 5,294 4,974 5,562. . . . . . . . . . . . . . . . . . . . . . . . . . . . . . . . . . . . . . . . . . . . . . . . . . . . . State Capitol Joint Management Commission 9,073 9,001 9,001. . . . . . . . . . . . . . . . . . . . . . . . . . . . . . . . . . . . . Clean Ocean and Shore Trust Committee 156 144 144. . . . . . . . . . . . . . . . . . . . . . . . . . . . . . . . . . . . . . . .
73,741 71,906 72,494
Executive Branch
Chief Executive 5,707 5,367 5,267. . . . . . . . . . . . . . . . . . . . . . . . . . . . . . . . . . . . . . . . . . . . . . . . . . . . . . . . . . . . Department of Agriculture 21,882 18,520 20,346. . . . . . . . . . . . . . . . . . . . . . . . . . . . . . . . . . . . . . . . . . . . . . . . . . . . Department of Banking and Insurance 66,010 68,589 66,703. . . . . . . . . . . . . . . . . . . . . . . . . . . . . . . . . . . . . . . . . . . Department of Community Affairs 111,096 127,721 120,517. . . . . . . . . . . . . . . . . . . . . . . . . . . . . . . . . . . . . . . . . . . . . . Department of Corrections 931,467 935,168 967,974. . . . . . . . . . . . . . . . . . . . . . . . . . . . . . . . . . . . . . . . . . . . . . . . . . . . Department of Education 2,541,178 3,087,399 2,848,355. . . . . . . . . . . . . . . . . . . . . . . . . . . . . . . . . . . . . . . . . . . . . . . . . . . . . Department of Environmental Protection 430,730 420,850 418,831. . . . . . . . . . . . . . . . . . . . . . . . . . . . . . . . . . . . . . . . . Department of Health and Senior Services 1,002,708 838,305 1,299,006. . . . . . . . . . . . . . . . . . . . . . . . . . . . . . . . . . . . . . . . Department of Human Services 4,322,589 4,240,618 4,554,442. . . . . . . . . . . . . . . . . . . . . . . . . . . . . . . . . . . . . . . . . . . . . . . . Department of Labor and Workforce Development 114,517 91,751 91,732. . . . . . . . . . . . . . . . . . . . . . . . . . . . . . . . . Department of Law and Public Safety 530,200 508,810 493,656. . . . . . . . . . . . . . . . . . . . . . . . . . . . . . . . . . . . . . . . . . . Department of Military and Veterans’ Affairs 92,440 79,433 83,812. . . . . . . . . . . . . . . . . . . . . . . . . . . . . . . . . . . . . Department of Personnel 28,760 26,103 25,448. . . . . . . . . . . . . . . . . . . . . . . . . . . . . . . . . . . . . . . . . . . . . . . . . . . . . Department of State 1,120,415 1,130,763 1,164,520. . . . . . . . . . . . . . . . . . . . . . . . . . . . . . . . . . . . . . . . . . . . . . . . . . . . . . . . . Department of Transportation 1,286,204 1,105,069 1,171,607. . . . . . . . . . . . . . . . . . . . . . . . . . . . . . . . . . . . . . . . . . . . . . . . . Department of the Treasury 1,158,289 1,221,758 1,243,229. . . . . . . . . . . . . . . . . . . . . . . . . . . . . . . . . . . . . . . . . . . . . . . . . . . Miscellaneous Commissions 1,417 1,373 1,373. . . . . . . . . . . . . . . . . . . . . . . . . . . . . . . . . . . . . . . . . . . . . . . . . .
13,765,609 13,907,597 14,576,818
Inter–Departmental Accts
Inter–Departmental Services 477,600 521,362 529,496. . . . . . . . . . . . . . . . . . . . . . . . . . . . . . . . . . . . . . . . . . . . . . . . . . Employee Benefits 1,511,265 1,785,815 1,924,865. . . . . . . . . . . . . . . . . . . . . . . . . . . . . . . . . . . . . . . . . . . . . . . . . . . . . . . . . . Other Inter–Departmental Accounts 37,047 53,020 70,394. . . . . . . . . . . . . . . . . . . . . . . . . . . . . . . . . . . . . . . . . . . . . Salary Increases and Other Benefits 29,728 11,000 165,238. . . . . . . . . . . . . . . . . . . . . . . . . . . . . . . . . . . . . . . . . . . . .
2,055,640 2,371,197 2,689,993
Judicial Branch
The Judiciary 477,715 523,964 526,073. . . . . . . . . . . . . . . . . . . . . . . . . . . . . . . . . . . . . . . . . . . . . . . . . . . . . . . . . . . . . .
477,715 523,964 526,073
Total General Fund 16,372,705 16,874,664 17,865,378. . . . . . . . . . . . . . . . . . . . . . . . . . . . . . . . . . . . . . . . . . . . . . . . . . . . . . .
CASINO CONTROL FUND – DIRECT STATE SERVICES
Department of Law and Public Safety 35,079 35,799 35,799. . . . . . . . . . . . . . . . . . . . . . . . . . . . . . . . . . . . . . . . . . . Department of the Treasury 25,674 27,901 27,901. . . . . . . . . . . . . . . . . . . . . . . . . . . . . . . . . . . . . . . . . . . . . . . . . . .
Total Casino Control Fund – Direct State Services 60,753 63,700 63,700. . . . . . . . . . . . . . . . . . . . . . . . . . . . . . .
86
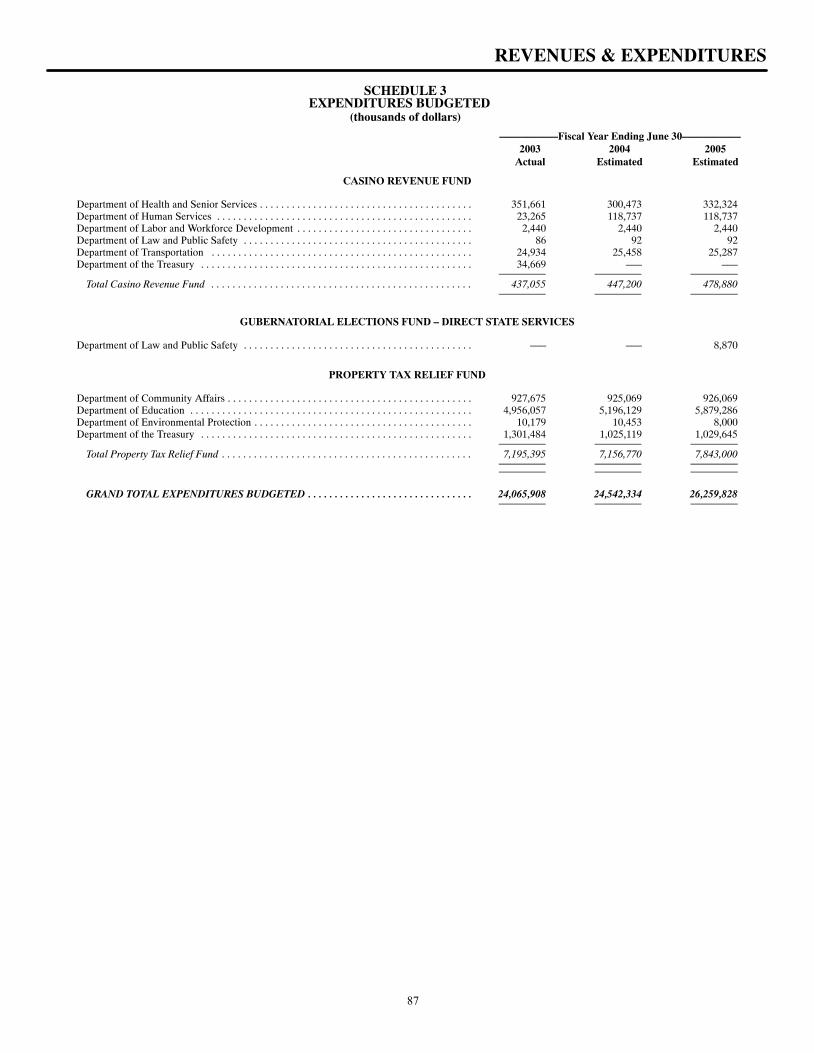
SCHEDULE 3EXPENDITURES BUDGETED
(thousands of dollars)
–––––––––––Fiscal Year Ending June 30–––––––––––2003 2004 2005
Actual Estimated Estimated
REVENUES & EXPENDITURES
CASINO REVENUE FUND
Department of Health and Senior Services 351,661 300,473 332,324. . . . . . . . . . . . . . . . . . . . . . . . . . . . . . . . . . . . . . . . Department of Human Services 23,265 118,737 118,737. . . . . . . . . . . . . . . . . . . . . . . . . . . . . . . . . . . . . . . . . . . . . . . . Department of Labor and Workforce Development 2,440 2,440 2,440. . . . . . . . . . . . . . . . . . . . . . . . . . . . . . . . . Department of Law and Public Safety 86 92 92. . . . . . . . . . . . . . . . . . . . . . . . . . . . . . . . . . . . . . . . . . . Department of Transportation 24,934 25,458 25,287. . . . . . . . . . . . . . . . . . . . . . . . . . . . . . . . . . . . . . . . . . . . . . . . . Department of the Treasury 34,669 ––– –––. . . . . . . . . . . . . . . . . . . . . . . . . . . . . . . . . . . . . . . . . . . . . . . . . . .
Total Casino Revenue Fund 437,055 447,200 478,880. . . . . . . . . . . . . . . . . . . . . . . . . . . . . . . . . . . . . . . . . . . . . . . . .
GUBERNATORIAL ELECTIONS FUND – DIRECT STATE SERVICES
Department of Law and Public Safety ––– ––– 8,870. . . . . . . . . . . . . . . . . . . . . . . . . . . . . . . . . . . . . . . . . . .
PROPERTY TAX RELIEF FUND
Department of Community Affairs 927,675 925,069 926,069. . . . . . . . . . . . . . . . . . . . . . . . . . . . . . . . . . . . . . . . . . . . . . Department of Education 4,956,057 5,196,129 5,879,286. . . . . . . . . . . . . . . . . . . . . . . . . . . . . . . . . . . . . . . . . . . . . . . . . . . . . Department of Environmental Protection 10,179 10,453 8,000. . . . . . . . . . . . . . . . . . . . . . . . . . . . . . . . . . . . . . . . . Department of the Treasury 1,301,484 1,025,119 1,029,645. . . . . . . . . . . . . . . . . . . . . . . . . . . . . . . . . . . . . . . . . . . . . . . . . . .
Total Property Tax Relief Fund 7,195,395 7,156,770 7,843,000. . . . . . . . . . . . . . . . . . . . . . . . . . . . . . . . . . . . . . . . . . . . . . .
GRAND TOTAL EXPENDITURES BUDGETED 24,065,908 24,542,334 26,259,828. . . . . . . . . . . . . . . . . . . . . . . . . . . . . . .
87
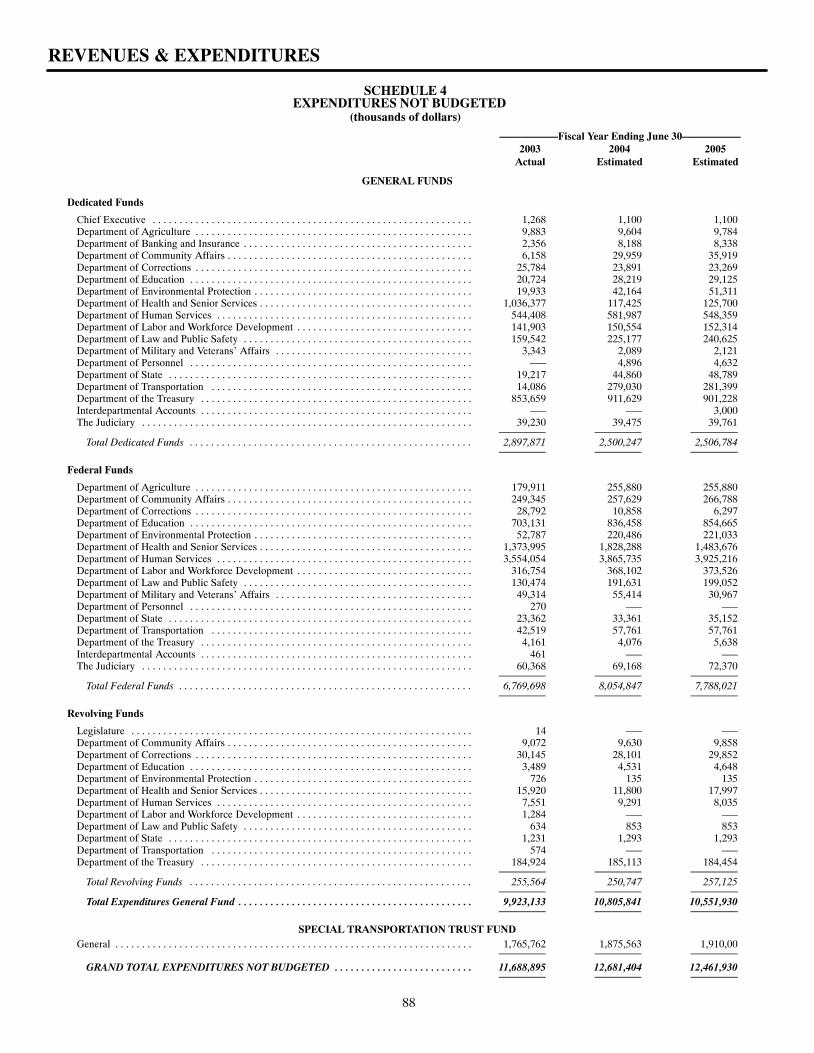
SCHEDULE 4EXPENDITURES NOT BUDGETED
(thousands of dollars)
–––––––––––Fiscal Year Ending June 30–––––––––––2003 2004 2005
Actual Estimated Estimated
REVENUES & EXPENDITURES
88
GENERAL FUNDS
Dedicated Funds
Chief Executive 1,268 1,100 1,100. . . . . . . . . . . . . . . . . . . . . . . . . . . . . . . . . . . . . . . . . . . . . . . . . . . . . . . . . . . . Department of Agriculture 9,883 9,604 9,784. . . . . . . . . . . . . . . . . . . . . . . . . . . . . . . . . . . . . . . . . . . . . . . . . . . . Department of Banking and Insurance 2,356 8,188 8,338. . . . . . . . . . . . . . . . . . . . . . . . . . . . . . . . . . . . . . . . . . . Department of Community Affairs 6,158 29,959 35,919. . . . . . . . . . . . . . . . . . . . . . . . . . . . . . . . . . . . . . . . . . . . . . Department of Corrections 25,784 23,891 23,269. . . . . . . . . . . . . . . . . . . . . . . . . . . . . . . . . . . . . . . . . . . . . . . . . . . . Department of Education 20,724 28,219 29,125. . . . . . . . . . . . . . . . . . . . . . . . . . . . . . . . . . . . . . . . . . . . . . . . . . . . . Department of Environmental Protection 19,933 42,164 51,311. . . . . . . . . . . . . . . . . . . . . . . . . . . . . . . . . . . . . . . . . Department of Health and Senior Services 1,036,377 117,425 125,700. . . . . . . . . . . . . . . . . . . . . . . . . . . . . . . . . . . . . . . . Department of Human Services 544,408 581,987 548,359. . . . . . . . . . . . . . . . . . . . . . . . . . . . . . . . . . . . . . . . . . . . . . . . Department of Labor and Workforce Development 141,903 150,554 152,314. . . . . . . . . . . . . . . . . . . . . . . . . . . . . . . . . Department of Law and Public Safety 159,542 225,177 240,625. . . . . . . . . . . . . . . . . . . . . . . . . . . . . . . . . . . . . . . . . . . Department of Military and Veterans’ Affairs 3,343 2,089 2,121. . . . . . . . . . . . . . . . . . . . . . . . . . . . . . . . . . . . . Department of Personnel ––– 4,896 4,632. . . . . . . . . . . . . . . . . . . . . . . . . . . . . . . . . . . . . . . . . . . . . . . . . . . . . Department of State 19,217 44,860 48,789. . . . . . . . . . . . . . . . . . . . . . . . . . . . . . . . . . . . . . . . . . . . . . . . . . . . . . . . . Department of Transportation 14,086 279,030 281,399. . . . . . . . . . . . . . . . . . . . . . . . . . . . . . . . . . . . . . . . . . . . . . . . . Department of the Treasury 853,659 911,629 901,228. . . . . . . . . . . . . . . . . . . . . . . . . . . . . . . . . . . . . . . . . . . . . . . . . . . Interdepartmental Accounts ––– ––– 3,000. . . . . . . . . . . . . . . . . . . . . . . . . . . . . . . . . . . . . . . . . . . . . . . . . . . The Judiciary 39,230 39,475 39,761. . . . . . . . . . . . . . . . . . . . . . . . . . . . . . . . . . . . . . . . . . . . . . . . . . . . . . . . . . . . . .
Total Dedicated Funds 2,897,871 2,500,247 2,506,784. . . . . . . . . . . . . . . . . . . . . . . . . . . . . . . . . . . . . . . . . . . . . . . . . . . . .
Federal Funds
Department of Agriculture 179,911 255,880 255,880. . . . . . . . . . . . . . . . . . . . . . . . . . . . . . . . . . . . . . . . . . . . . . . . . . . . Department of Community Affairs 249,345 257,629 266,788. . . . . . . . . . . . . . . . . . . . . . . . . . . . . . . . . . . . . . . . . . . . . . Department of Corrections 28,792 10,858 6,297. . . . . . . . . . . . . . . . . . . . . . . . . . . . . . . . . . . . . . . . . . . . . . . . . . . . Department of Education 703,131 836,458 854,665. . . . . . . . . . . . . . . . . . . . . . . . . . . . . . . . . . . . . . . . . . . . . . . . . . . . . Department of Environmental Protection 52,787 220,486 221,033. . . . . . . . . . . . . . . . . . . . . . . . . . . . . . . . . . . . . . . . . Department of Health and Senior Services 1,373,995 1,828,288 1,483,676. . . . . . . . . . . . . . . . . . . . . . . . . . . . . . . . . . . . . . . . Department of Human Services 3,554,054 3,865,735 3,925,216. . . . . . . . . . . . . . . . . . . . . . . . . . . . . . . . . . . . . . . . . . . . . . . . Department of Labor and Workforce Development 316,754 368,102 373,526. . . . . . . . . . . . . . . . . . . . . . . . . . . . . . . . . Department of Law and Public Safety 130,474 191,631 199,052. . . . . . . . . . . . . . . . . . . . . . . . . . . . . . . . . . . . . . . . . . . Department of Military and Veterans’ Affairs 49,314 55,414 30,967. . . . . . . . . . . . . . . . . . . . . . . . . . . . . . . . . . . . . Department of Personnel 270 ––– –––. . . . . . . . . . . . . . . . . . . . . . . . . . . . . . . . . . . . . . . . . . . . . . . . . . . . . Department of State 23,362 33,361 35,152. . . . . . . . . . . . . . . . . . . . . . . . . . . . . . . . . . . . . . . . . . . . . . . . . . . . . . . . . Department of Transportation 42,519 57,761 57,761. . . . . . . . . . . . . . . . . . . . . . . . . . . . . . . . . . . . . . . . . . . . . . . . . Department of the Treasury 4,161 4,076 5,638. . . . . . . . . . . . . . . . . . . . . . . . . . . . . . . . . . . . . . . . . . . . . . . . . . . Interdepartmental Accounts 461 ––– –––. . . . . . . . . . . . . . . . . . . . . . . . . . . . . . . . . . . . . . . . . . . . . . . . . . . The Judiciary 60,368 69,168 72,370. . . . . . . . . . . . . . . . . . . . . . . . . . . . . . . . . . . . . . . . . . . . . . . . . . . . . . . . . . . . . .
Total Federal Funds 6,769,698 8,054,847 7,788,021. . . . . . . . . . . . . . . . . . . . . . . . . . . . . . . . . . . . . . . . . . . . . . . . . . . . . . .
Revolving Funds
Legislature 14 ––– –––. . . . . . . . . . . . . . . . . . . . . . . . . . . . . . . . . . . . . . . . . . . . . . . . . . . . . . . . . . . . . . . . Department of Community Affairs 9,072 9,630 9,858. . . . . . . . . . . . . . . . . . . . . . . . . . . . . . . . . . . . . . . . . . . . . . Department of Corrections 30,145 28,101 29,852. . . . . . . . . . . . . . . . . . . . . . . . . . . . . . . . . . . . . . . . . . . . . . . . . . . . Department of Education 3,489 4,531 4,648. . . . . . . . . . . . . . . . . . . . . . . . . . . . . . . . . . . . . . . . . . . . . . . . . . . . . Department of Environmental Protection 726 135 135. . . . . . . . . . . . . . . . . . . . . . . . . . . . . . . . . . . . . . . . . Department of Health and Senior Services 15,920 11,800 17,997. . . . . . . . . . . . . . . . . . . . . . . . . . . . . . . . . . . . . . . . Department of Human Services 7,551 9,291 8,035. . . . . . . . . . . . . . . . . . . . . . . . . . . . . . . . . . . . . . . . . . . . . . . . Department of Labor and Workforce Development 1,284 ––– –––. . . . . . . . . . . . . . . . . . . . . . . . . . . . . . . . . Department of Law and Public Safety 634 853 853. . . . . . . . . . . . . . . . . . . . . . . . . . . . . . . . . . . . . . . . . . . Department of State 1,231 1,293 1,293. . . . . . . . . . . . . . . . . . . . . . . . . . . . . . . . . . . . . . . . . . . . . . . . . . . . . . . . . Department of Transportation 574 ––– –––. . . . . . . . . . . . . . . . . . . . . . . . . . . . . . . . . . . . . . . . . . . . . . . . . Department of the Treasury 184,924 185,113 184,454. . . . . . . . . . . . . . . . . . . . . . . . . . . . . . . . . . . . . . . . . . . . . . . . . . .
Total Revolving Funds 255,564 250,747 257,125. . . . . . . . . . . . . . . . . . . . . . . . . . . . . . . . . . . . . . . . . . . . . . . . . . . . .
Total Expenditures General Fund 9,923,133 10,805,841 10,551,930. . . . . . . . . . . . . . . . . . . . . . . . . . . . . . . . . . . . . . . . . . . .
SPECIAL TRANSPORTATION TRUST FUNDGeneral 1,765,762 1,875,563 1,910,00. . . . . . . . . . . . . . . . . . . . . . . . . . . . . . . . . . . . . . . . . . . . . . . . . . . . . . . . . . . . . . . . . . .
GRAND TOTAL EXPENDITURES NOT BUDGETED 11,688,895 12,681,404 12,461,930. . . . . . . . . . . . . . . . . . . . . . . . . .
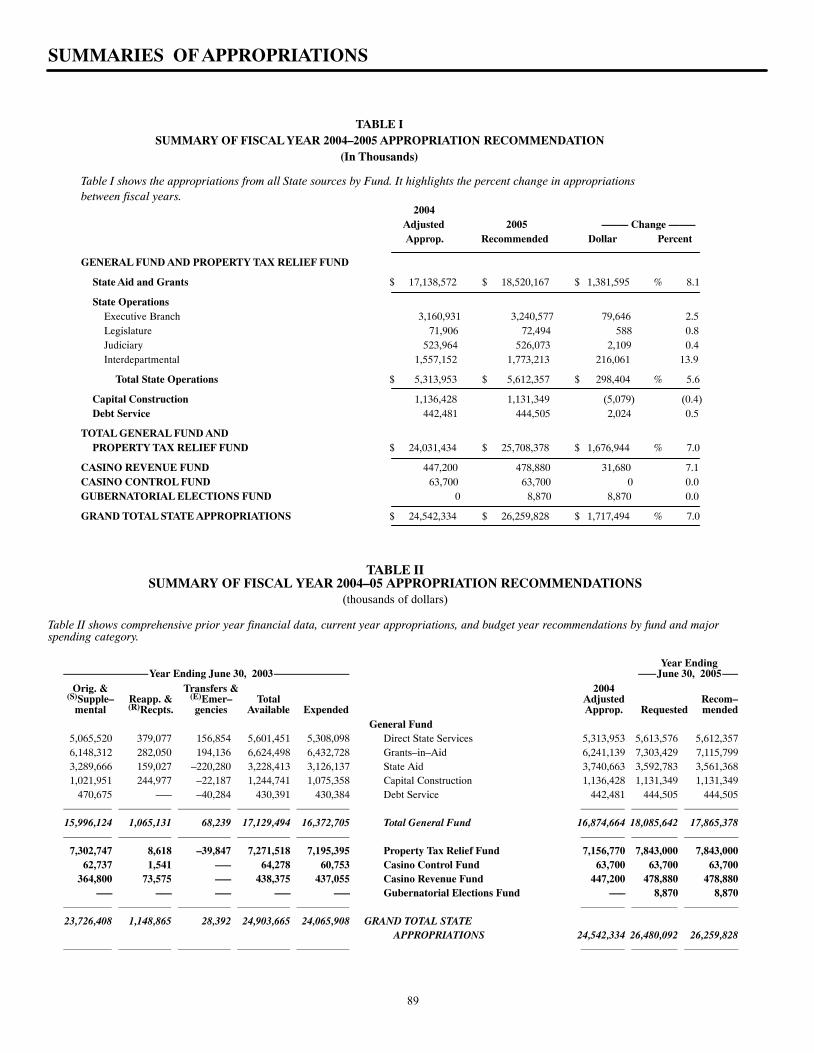
SUMMARIES OF APPROPRIATIONS
TABLE ISUMMARY OF FISCAL YEAR 2004–2005 APPROPRIATION RECOMMENDATION
(In Thousands)
Table I shows the appropriations from all State sources by Fund. It highlights the percent change in appropriationsbetween fiscal years.
2004Adjusted 2005 ––––– Change –––––Approp. Recommended Dollar Percent
GENERAL FUND AND PROPERTY TAX RELIEF FUND
State Aid and Grants 17,138,572$ 18,520,167$ 1,381,595$ 8.1%
State OperationsExecutive Branch 3,160,931 3,240,577 79,646 2.5Legislature 71,906 72,494 588 0.8Judiciary 523,964 526,073 2,109 0.4Interdepartmental 1,557,152 1,773,213 216,061 13.9
Total State Operations 5,313,953$ 5,612,357$ 298,404$ 5.6%
Capital Construction 1,136,428 1,131,349 (5,079) (0.4)Debt Service 442,481 444,505 2,024 0.5
TOTAL GENERAL FUND ANDPROPERTY TAX RELIEF FUND 24,031,434$ 25,708,378$ 1,676,944$ 7.0%
CASINO REVENUE FUND 447,200 478,880 31,680 7.1CASINO CONTROL FUND 63,700 63,700 0 0.0GUBERNATORIAL ELECTIONS FUND 0 8,870 8,870 0.0
GRAND TOTAL STATE APPROPRIATIONS 24,542,334$ 26,259,828$ 1,717,494$ 7.0%
TABLE IISUMMARY OF FISCAL YEAR 2004–05 APPROPRIATION RECOMMENDATIONS
(thousands of dollars)
Table II shows comprehensive prior year financial data, current year appropriations, and budget year recommendations by fund and majorspending category.
Year EndingYear Ending June 30, 2003 June 30, 2005
Orig. & Transfers & 2004(S)Supple– Reapp. & (E)Emer– Total Adjusted Recom–
mental (R)Recpts. gencies Available Expended Approp. Requested mendedGeneral Fund
5,065,520 379,077 156,854 5,601,451 5,308,098 Direct State Services 5,313,953 5,613,576 5,612,3576,148,312 282,050 194,136 6,624,498 6,432,728 Grants–in–Aid 6,241,139 7,303,429 7,115,7993,289,666 159,027 –220,280 3,228,413 3,126,137 State Aid 3,740,663 3,592,783 3,561,3681,021,951 244,977 –22,187 1,244,741 1,075,358 Capital Construction 1,136,428 1,131,349 1,131,349
470,675 ––– –40,284 430,391 430,384 Debt Service 442,481 444,505 444,505
15,996,124 1,065,131 68,239 17,129,494 16,372,705 Total General Fund 16,874,664 18,085,642 17,865,378
7,302,747 8,618 –39,847 7,271,518 7,195,395 Property Tax Relief Fund 7,156,770 7,843,000 7,843,00062,737 1,541 ––– 64,278 60,753 Casino Control Fund 63,700 63,700 63,700
364,800 73,575 ––– 438,375 437,055 Casino Revenue Fund 447,200 478,880 478,880––– ––– ––– ––– ––– Gubernatorial Elections Fund ––– 8,870 8,870
23,726,408 1,148,865 28,392 24,903,665 24,065,908 GRAND TOTAL STATE
APPROPRIATIONS 24,542,334 26,480,092 26,259,828
89
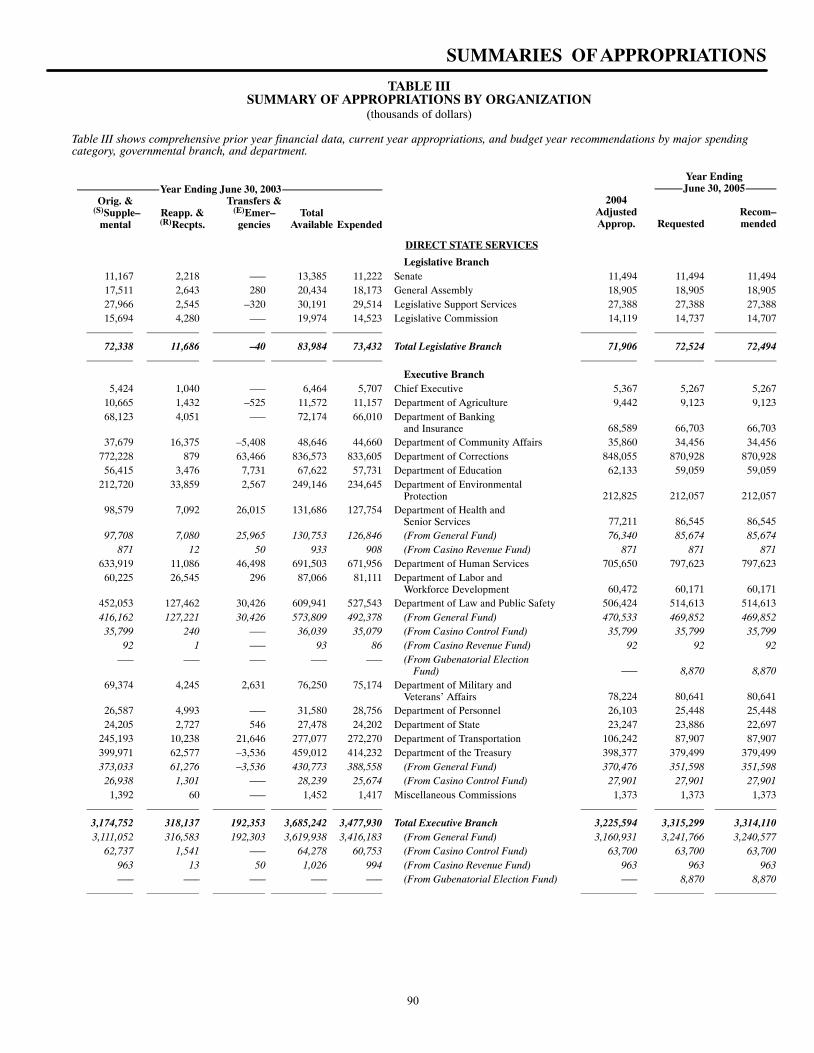
SUMMARIES OF APPROPRIATIONS
TABLE IIISUMMARY OF APPROPRIATIONS BY ORGANIZATION
(thousands of dollars)
Table III shows comprehensive prior year financial data, current year appropriations, and budget year recommendations by major spendingcategory, governmental branch, and department.
Year Ending June 30, 2003Orig. & Transfers &
(S)Supple– Reapp. & (E)Emer– Totalmental (R)Recpts. gencies Available Expended
Year EndingJune 30, 2005
2004 Adjusted Recom– Approp. Requested mended
DIRECT STATE SERVICES
Legislative Branch11,167 2,218 ––– 13,385 11,222 Senate 11,494 11,494 11,49417,511 2,643 280 20,434 18,173 General Assembly 18,905 18,905 18,90527,966 2,545 –320 30,191 29,514 Legislative Support Services 27,388 27,388 27,38815,694 4,280 ––– 19,974 14,523 Legislative Commission 14,119 14,737 14,707
72,338 11,686 –40 83,984 73,432 Total Legislative Branch 71,906 72,524 72,494
Executive Branch5,424 1,040 ––– 6,464 5,707 Chief Executive 5,367 5,267 5,267
10,665 1,432 –525 11,572 11,157 Department of Agriculture 9,442 9,123 9,12368,123 4,051 ––– 72,174 66,010 Department of Banking
and Insurance 68,589 66,703 66,70337,679 16,375 –5,408 48,646 44,660 Department of Community Affairs 35,860 34,456 34,456
772,228 879 63,466 836,573 833,605 Department of Corrections 848,055 870,928 870,92856,415 3,476 7,731 67,622 57,731 Department of Education 62,133 59,059 59,059
212,720 33,859 2,567 249,146 234,645 Department of EnvironmentalProtection 212,825 212,057 212,057
98,579 7,092 26,015 131,686 127,754 Department of Health and Senior Services 77,211 86,545 86,545
97,708 7,080 25,965 130,753 126,846 (From General Fund) 76,340 85,674 85,674871 12 50 933 908 (From Casino Revenue Fund) 871 871 871
633,919 11,086 46,498 691,503 671,956 Department of Human Services 705,650 797,623 797,62360,225 26,545 296 87,066 81,111 Department of Labor and
Workforce Development 60,472 60,171 60,171452,053 127,462 30,426 609,941 527,543 Department of Law and Public Safety 506,424 514,613 514,613416,162 127,221 30,426 573,809 492,378 (From General Fund) 470,533 469,852 469,852
35,799 240 ––– 36,039 35,079 (From Casino Control Fund) 35,799 35,799 35,79992 1 ––– 93 86 (From Casino Revenue Fund) 92 92 92
––– ––– ––– ––– ––– (From Gubenatorial ElectionFund) ––– 8,870 8,870
69,374 4,245 2,631 76,250 75,174 Department of Military andVeterans’ Affairs 78,224 80,641 80,641
26,587 4,993 ––– 31,580 28,756 Department of Personnel 26,103 25,448 25,44824,205 2,727 546 27,478 24,202 Department of State 23,247 23,886 22,697
245,193 10,238 21,646 277,077 272,270 Department of Transportation 106,242 87,907 87,907399,971 62,577 –3,536 459,012 414,232 Department of the Treasury 398,377 379,499 379,499373,033 61,276 –3,536 430,773 388,558 (From General Fund) 370,476 351,598 351,598
26,938 1,301 ––– 28,239 25,674 (From Casino Control Fund) 27,901 27,901 27,9011,392 60 ––– 1,452 1,417 Miscellaneous Commissions 1,373 1,373 1,373
3,174,752 318,137 192,353 3,685,242 3,477,930 Total Executive Branch 3,225,594 3,315,299 3,314,1103,111,052 316,583 192,303 3,619,938 3,416,183 (From General Fund) 3,160,931 3,241,766 3,240,577
62,737 1,541 ––– 64,278 60,753 (From Casino Control Fund) 63,700 63,700 63,700963 13 50 1,026 994 (From Casino Revenue Fund) 963 963 963––– ––– ––– ––– ––– (From Gubenatorial Election Fund) ––– 8,870 8,870
90
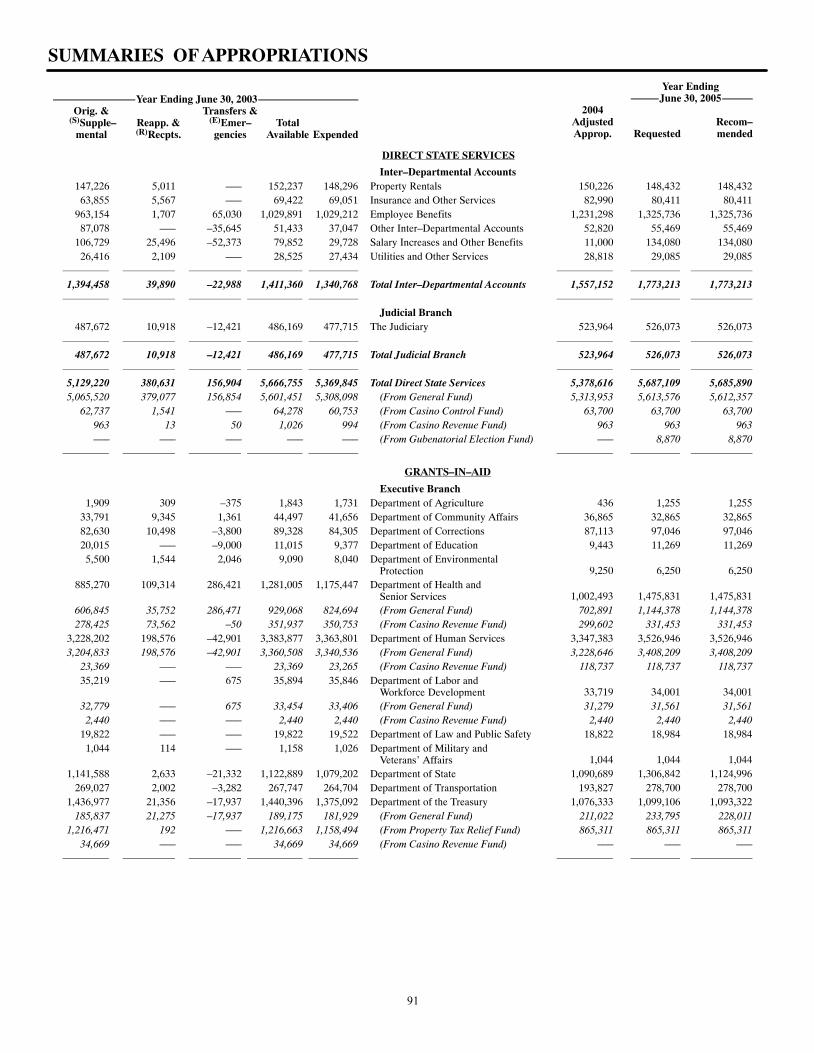
SUMMARIES OF APPROPRIATIONS
Year Ending June 30, 2003Orig. & Transfers &
(S)Supple– Reapp. & (E)Emer– Totalmental (R)Recpts. gencies Available Expended
Year EndingJune 30, 2005
2004 Adjusted Recom– Approp. Requested mended
DIRECT STATE SERVICES
Inter–Departmental Accounts147,226 5,011 ––– 152,237 148,296 Property Rentals 150,226 148,432 148,432
63,855 5,567 ––– 69,422 69,051 Insurance and Other Services 82,990 80,411 80,411963,154 1,707 65,030 1,029,891 1,029,212 Employee Benefits 1,231,298 1,325,736 1,325,736
87,078 ––– –35,645 51,433 37,047 Other Inter–Departmental Accounts 52,820 55,469 55,469106,729 25,496 –52,373 79,852 29,728 Salary Increases and Other Benefits 11,000 134,080 134,080
26,416 2,109 ––– 28,525 27,434 Utilities and Other Services 28,818 29,085 29,085
1,394,458 39,890 –22,988 1,411,360 1,340,768 Total Inter–Departmental Accounts 1,557,152 1,773,213 1,773,213
Judicial Branch487,672 10,918 –12,421 486,169 477,715 The Judiciary 523,964 526,073 526,073
487,672 10,918 –12,421 486,169 477,715 Total Judicial Branch 523,964 526,073 526,073
5,129,220 380,631 156,904 5,666,755 5,369,845 Total Direct State Services 5,378,616 5,687,109 5,685,8905,065,520 379,077 156,854 5,601,451 5,308,098 (From General Fund) 5,313,953 5,613,576 5,612,357
62,737 1,541 ––– 64,278 60,753 (From Casino Control Fund) 63,700 63,700 63,700963 13 50 1,026 994 (From Casino Revenue Fund) 963 963 963––– ––– ––– ––– ––– (From Gubenatorial Election Fund) ––– 8,870 8,870
GRANTS–IN–AID
Executive Branch1,909 309 –375 1,843 1,731 Department of Agriculture 436 1,255 1,255
33,791 9,345 1,361 44,497 41,656 Department of Community Affairs 36,865 32,865 32,86582,630 10,498 –3,800 89,328 84,305 Department of Corrections 87,113 97,046 97,04620,015 ––– –9,000 11,015 9,377 Department of Education 9,443 11,269 11,269
5,500 1,544 2,046 9,090 8,040 Department of EnvironmentalProtection 9,250 6,250 6,250
885,270 109,314 286,421 1,281,005 1,175,447 Department of Health and Senior Services 1,002,493 1,475,831 1,475,831
606,845 35,752 286,471 929,068 824,694 (From General Fund) 702,891 1,144,378 1,144,378278,425 73,562 –50 351,937 350,753 (From Casino Revenue Fund) 299,602 331,453 331,453
3,228,202 198,576 –42,901 3,383,877 3,363,801 Department of Human Services 3,347,383 3,526,946 3,526,9463,204,833 198,576 –42,901 3,360,508 3,340,536 (From General Fund) 3,228,646 3,408,209 3,408,209
23,369 ––– ––– 23,369 23,265 (From Casino Revenue Fund) 118,737 118,737 118,73735,219 ––– 675 35,894 35,846 Department of Labor and
Workforce Development 33,719 34,001 34,00132,779 ––– 675 33,454 33,406 (From General Fund) 31,279 31,561 31,561
2,440 ––– ––– 2,440 2,440 (From Casino Revenue Fund) 2,440 2,440 2,44019,822 ––– ––– 19,822 19,522 Department of Law and Public Safety 18,822 18,984 18,984
1,044 114 ––– 1,158 1,026 Department of Military andVeterans’ Affairs 1,044 1,044 1,044
1,141,588 2,633 –21,332 1,122,889 1,079,202 Department of State 1,090,689 1,306,842 1,124,996269,027 2,002 –3,282 267,747 264,704 Department of Transportation 193,827 278,700 278,700
1,436,977 21,356 –17,937 1,440,396 1,375,092 Department of the Treasury 1,076,333 1,099,106 1,093,322185,837 21,275 –17,937 189,175 181,929 (From General Fund) 211,022 233,795 228,011
1,216,471 192 ––– 1,216,663 1,158,494 (From Property Tax Relief Fund) 865,311 865,311 865,31134,669 ––– ––– 34,669 34,669 (From Casino Revenue Fund) ––– ––– –––
91
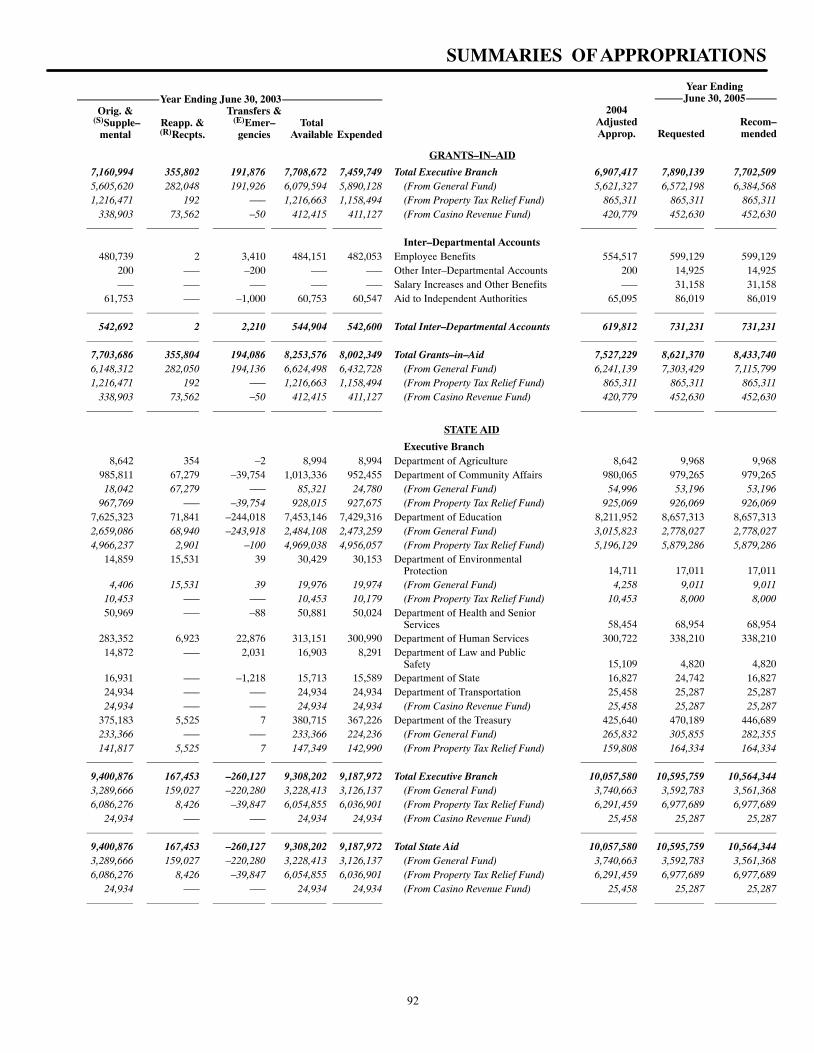
SUMMARIES OF APPROPRIATIONS
Year Ending June 30, 2003Orig. & Transfers &
(S)Supple– Reapp. & (E)Emer– Totalmental (R)Recpts. gencies Available Expended
Year EndingJune 30, 2005
2004 Adjusted Recom– Approp. Requested mended
GRANTS–IN–AID
7,160,994 355,802 191,876 7,708,672 7,459,749 Total Executive Branch 6,907,417 7,890,139 7,702,5095,605,620 282,048 191,926 6,079,594 5,890,128 (From General Fund) 5,621,327 6,572,198 6,384,5681,216,471 192 ––– 1,216,663 1,158,494 (From Property Tax Relief Fund) 865,311 865,311 865,311
338,903 73,562 –50 412,415 411,127 (From Casino Revenue Fund) 420,779 452,630 452,630
Inter–Departmental Accounts480,739 2 3,410 484,151 482,053 Employee Benefits 554,517 599,129 599,129
200 ––– –200 ––– ––– Other Inter–Departmental Accounts 200 14,925 14,925––– ––– ––– ––– ––– Salary Increases and Other Benefits ––– 31,158 31,158
61,753 ––– –1,000 60,753 60,547 Aid to Independent Authorities 65,095 86,019 86,019
542,692 2 2,210 544,904 542,600 Total Inter–Departmental Accounts 619,812 731,231 731,231
7,703,686 355,804 194,086 8,253,576 8,002,349 Total Grants–in–Aid 7,527,229 8,621,370 8,433,7406,148,312 282,050 194,136 6,624,498 6,432,728 (From General Fund) 6,241,139 7,303,429 7,115,7991,216,471 192 ––– 1,216,663 1,158,494 (From Property Tax Relief Fund) 865,311 865,311 865,311
338,903 73,562 –50 412,415 411,127 (From Casino Revenue Fund) 420,779 452,630 452,630
STATE AID
Executive Branch8,642 354 –2 8,994 8,994 Department of Agriculture 8,642 9,968 9,968
985,811 67,279 –39,754 1,013,336 952,455 Department of Community Affairs 980,065 979,265 979,26518,042 67,279 ––– 85,321 24,780 (From General Fund) 54,996 53,196 53,196
967,769 ––– –39,754 928,015 927,675 (From Property Tax Relief Fund) 925,069 926,069 926,0697,625,323 71,841 –244,018 7,453,146 7,429,316 Department of Education 8,211,952 8,657,313 8,657,3132,659,086 68,940 –243,918 2,484,108 2,473,259 (From General Fund) 3,015,823 2,778,027 2,778,0274,966,237 2,901 –100 4,969,038 4,956,057 (From Property Tax Relief Fund) 5,196,129 5,879,286 5,879,286
14,859 15,531 39 30,429 30,153 Department of EnvironmentalProtection 14,711 17,011 17,011
4,406 15,531 39 19,976 19,974 (From General Fund) 4,258 9,011 9,01110,453 ––– ––– 10,453 10,179 (From Property Tax Relief Fund) 10,453 8,000 8,00050,969 ––– –88 50,881 50,024 Department of Health and Senior
Services 58,454 68,954 68,954283,352 6,923 22,876 313,151 300,990 Department of Human Services 300,722 338,210 338,210
14,872 ––– 2,031 16,903 8,291 Department of Law and PublicSafety 15,109 4,820 4,820
16,931 ––– –1,218 15,713 15,589 Department of State 16,827 24,742 16,82724,934 ––– ––– 24,934 24,934 Department of Transportation 25,458 25,287 25,28724,934 ––– ––– 24,934 24,934 (From Casino Revenue Fund) 25,458 25,287 25,287
375,183 5,525 7 380,715 367,226 Department of the Treasury 425,640 470,189 446,689233,366 ––– ––– 233,366 224,236 (From General Fund) 265,832 305,855 282,355141,817 5,525 7 147,349 142,990 (From Property Tax Relief Fund) 159,808 164,334 164,334
9,400,876 167,453 –260,127 9,308,202 9,187,972 Total Executive Branch 10,057,580 10,595,759 10,564,3443,289,666 159,027 –220,280 3,228,413 3,126,137 (From General Fund) 3,740,663 3,592,783 3,561,3686,086,276 8,426 –39,847 6,054,855 6,036,901 (From Property Tax Relief Fund) 6,291,459 6,977,689 6,977,689
24,934 ––– ––– 24,934 24,934 (From Casino Revenue Fund) 25,458 25,287 25,287
9,400,876 167,453 –260,127 9,308,202 9,187,972 Total State Aid 10,057,580 10,595,759 10,564,3443,289,666 159,027 –220,280 3,228,413 3,126,137 (From General Fund) 3,740,663 3,592,783 3,561,3686,086,276 8,426 –39,847 6,054,855 6,036,901 (From Property Tax Relief Fund) 6,291,459 6,977,689 6,977,689
24,934 ––– ––– 24,934 24,934 (From Casino Revenue Fund) 25,458 25,287 25,287
92
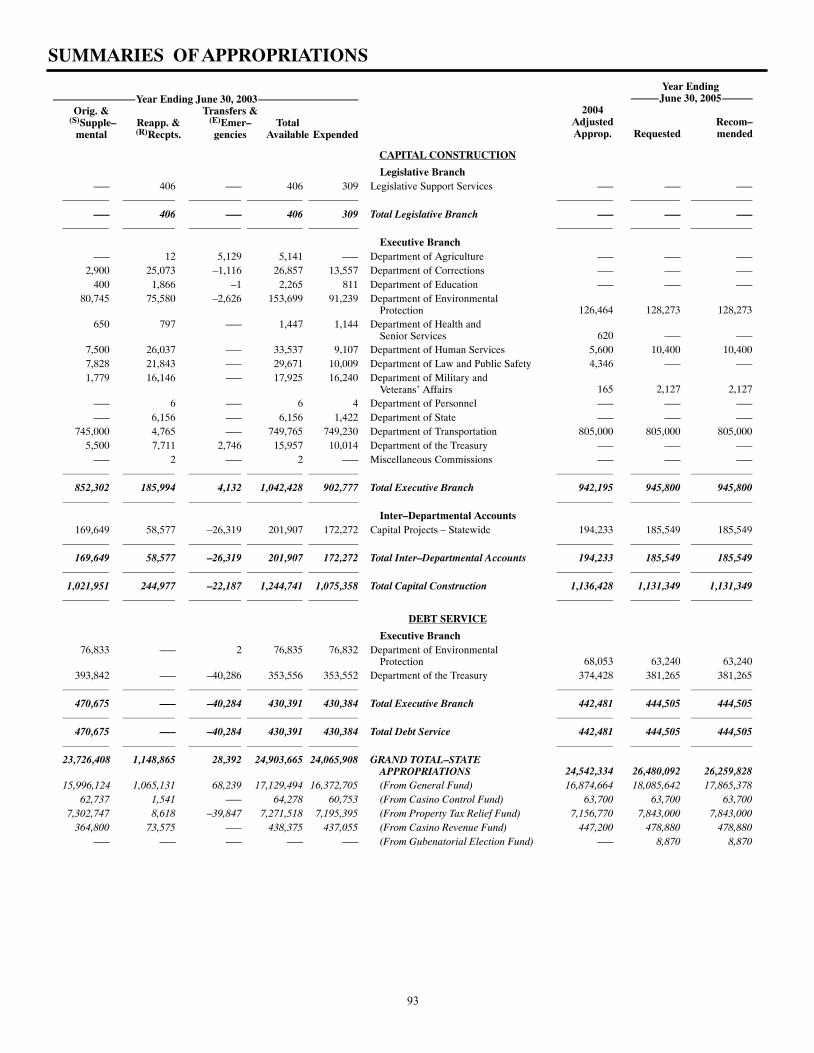
SUMMARIES OF APPROPRIATIONS
Year Ending June 30, 2003Orig. & Transfers &
(S)Supple– Reapp. & (E)Emer– Totalmental (R)Recpts. gencies Available Expended
Year EndingJune 30, 2005
2004 Adjusted Recom– Approp. Requested mended
CAPITAL CONSTRUCTION
Legislative Branch––– 406 ––– 406 309 Legislative Support Services ––– ––– –––
––– 406 ––– 406 309 Total Legislative Branch ––– ––– –––
Executive Branch––– 12 5,129 5,141 ––– Department of Agriculture ––– ––– –––
2,900 25,073 –1,116 26,857 13,557 Department of Corrections ––– ––– –––400 1,866 –1 2,265 811 Department of Education ––– ––– –––
80,745 75,580 –2,626 153,699 91,239 Department of EnvironmentalProtection 126,464 128,273 128,273
650 797 ––– 1,447 1,144 Department of Health and Senior Services 620 ––– –––
7,500 26,037 ––– 33,537 9,107 Department of Human Services 5,600 10,400 10,4007,828 21,843 ––– 29,671 10,009 Department of Law and Public Safety 4,346 ––– –––1,779 16,146 ––– 17,925 16,240 Department of Military and
Veterans’ Affairs 165 2,127 2,127––– 6 ––– 6 4 Department of Personnel ––– ––– –––––– 6,156 ––– 6,156 1,422 Department of State ––– ––– –––
745,000 4,765 ––– 749,765 749,230 Department of Transportation 805,000 805,000 805,0005,500 7,711 2,746 15,957 10,014 Department of the Treasury ––– ––– –––
––– 2 ––– 2 ––– Miscellaneous Commissions ––– ––– –––
852,302 185,994 4,132 1,042,428 902,777 Total Executive Branch 942,195 945,800 945,800
Inter–Departmental Accounts169,649 58,577 –26,319 201,907 172,272 Capital Projects – Statewide 194,233 185,549 185,549
169,649 58,577 –26,319 201,907 172,272 Total Inter–Departmental Accounts 194,233 185,549 185,549
1,021,951 244,977 –22,187 1,244,741 1,075,358 Total Capital Construction 1,136,428 1,131,349 1,131,349
DEBT SERVICE
Executive Branch76,833 ––– 2 76,835 76,832 Department of Environmental
Protection 68,053 63,240 63,240393,842 ––– –40,286 353,556 353,552 Department of the Treasury 374,428 381,265 381,265
470,675 ––– –40,284 430,391 430,384 Total Executive Branch 442,481 444,505 444,505
470,675 ––– –40,284 430,391 430,384 Total Debt Service 442,481 444,505 444,505
23,726,408 1,148,865 28,392 24,903,665 24,065,908 GRAND TOTAL–STATEAPPROPRIATIONS 24,542,334 26,480,092 26,259,828
15,996,124 1,065,131 68,239 17,129,494 16,372,705 (From General Fund) 16,874,664 18,085,642 17,865,37862,737 1,541 ––– 64,278 60,753 (From Casino Control Fund) 63,700 63,700 63,700
7,302,747 8,618 –39,847 7,271,518 7,195,395 (From Property Tax Relief Fund) 7,156,770 7,843,000 7,843,000364,800 73,575 ––– 438,375 437,055 (From Casino Revenue Fund) 447,200 478,880 478,880
––– ––– ––– ––– ––– (From Gubenatorial Election Fund) ––– 8,870 8,870
93
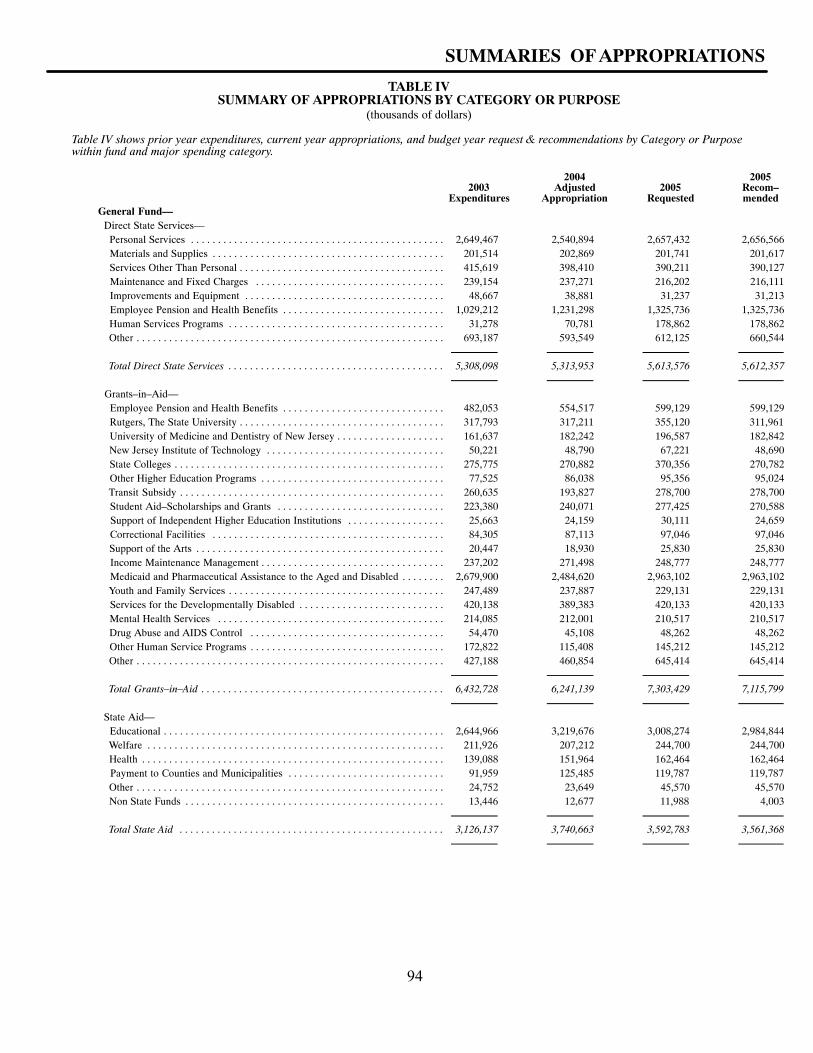
SUMMARIES OF APPROPRIATIONS
TABLE IVSUMMARY OF APPROPRIATIONS BY CATEGORY OR PURPOSE
(thousands of dollars)
Table IV shows prior year expenditures, current year appropriations, and budget year request & recommendations by Category or Purposewithin fund and major spending category.
2004 20052003 Adjusted 2005 Recom–
Expenditures Appropriation Requested mendedGeneral Fund–– Direct State Services–– Personal Services 2,649,467 2,540,894 2,657,432 2,656,566. . . . . . . . . . . . . . . . . . . . . . . . . . . . . . . . . . . . . . . . . . . . . . . Materials and Supplies 201,514 202,869 201,741 201,617. . . . . . . . . . . . . . . . . . . . . . . . . . . . . . . . . . . . . . . . . . . Services Other Than Personal 415,619 398,410 390,211 390,127. . . . . . . . . . . . . . . . . . . . . . . . . . . . . . . . . . . . . . Maintenance and Fixed Charges 239,154 237,271 216,202 216,111. . . . . . . . . . . . . . . . . . . . . . . . . . . . . . . . . . . Improvements and Equipment 48,667 38,881 31,237 31,213. . . . . . . . . . . . . . . . . . . . . . . . . . . . . . . . . . . . . Employee Pension and Health Benefits 1,029,212 1,231,298 1,325,736 1,325,736. . . . . . . . . . . . . . . . . . . . . . . . . . . . . . Human Services Programs 31,278 70,781 178,862 178,862. . . . . . . . . . . . . . . . . . . . . . . . . . . . . . . . . . . . . . . . Other 693,187 593,549 612,125 660,544. . . . . . . . . . . . . . . . . . . . . . . . . . . . . . . . . . . . . . . . . . . . . . . . . . . . . . . . .
Total Direct State Services 5,308,098 5,313,953 5,613,576 5,612,357. . . . . . . . . . . . . . . . . . . . . . . . . . . . . . . . . . . . . . . .
Grants–in–Aid–– Employee Pension and Health Benefits 482,053 554,517 599,129 599,129. . . . . . . . . . . . . . . . . . . . . . . . . . . . . . Rutgers, The State University 317,793 317,211 355,120 311,961. . . . . . . . . . . . . . . . . . . . . . . . . . . . . . . . . . . . . . University of Medicine and Dentistry of New Jersey 161,637 182,242 196,587 182,842. . . . . . . . . . . . . . . . . . . . New Jersey Institute of Technology 50,221 48,790 67,221 48,690. . . . . . . . . . . . . . . . . . . . . . . . . . . . . . . . . State Colleges 275,775 270,882 370,356 270,782. . . . . . . . . . . . . . . . . . . . . . . . . . . . . . . . . . . . . . . . . . . . . . . . . . Other Higher Education Programs 77,525 86,038 95,356 95,024. . . . . . . . . . . . . . . . . . . . . . . . . . . . . . . . . . Transit Subsidy 260,635 193,827 278,700 278,700. . . . . . . . . . . . . . . . . . . . . . . . . . . . . . . . . . . . . . . . . . . . . . . . . Student Aid–Scholarships and Grants 223,380 240,071 277,425 270,588. . . . . . . . . . . . . . . . . . . . . . . . . . . . . . . Support of Independent Higher Education Institutions 25,663 24,159 30,111 24,659. . . . . . . . . . . . . . . . . . Correctional Facilities 84,305 87,113 97,046 97,046. . . . . . . . . . . . . . . . . . . . . . . . . . . . . . . . . . . . . . . . . . . Support of the Arts 20,447 18,930 25,830 25,830. . . . . . . . . . . . . . . . . . . . . . . . . . . . . . . . . . . . . . . . . . . . . . Income Maintenance Management 237,202 271,498 248,777 248,777. . . . . . . . . . . . . . . . . . . . . . . . . . . . . . . . . . Medicaid and Pharmaceutical Assistance to the Aged and Disabled 2,679,900 2,484,620 2,963,102 2,963,102. . . . . . . . Youth and Family Services 247,489 237,887 229,131 229,131. . . . . . . . . . . . . . . . . . . . . . . . . . . . . . . . . . . . . . . . Services for the Developmentally Disabled 420,138 389,383 420,133 420,133. . . . . . . . . . . . . . . . . . . . . . . . . . . Mental Health Services 214,085 212,001 210,517 210,517. . . . . . . . . . . . . . . . . . . . . . . . . . . . . . . . . . . . . . . . . . Drug Abuse and AIDS Control 54,470 45,108 48,262 48,262. . . . . . . . . . . . . . . . . . . . . . . . . . . . . . . . . . . . Other Human Service Programs 172,822 115,408 145,212 145,212. . . . . . . . . . . . . . . . . . . . . . . . . . . . . . . . . . . . Other 427,188 460,854 645,414 645,414. . . . . . . . . . . . . . . . . . . . . . . . . . . . . . . . . . . . . . . . . . . . . . . . . . . . . . . . .
Total Grants–in–Aid 6,432,728 6,241,139 7,303,429 7,115,799. . . . . . . . . . . . . . . . . . . . . . . . . . . . . . . . . . . . . . . . . . . . .
State Aid–– Educational 2,644,966 3,219,676 3,008,274 2,984,844. . . . . . . . . . . . . . . . . . . . . . . . . . . . . . . . . . . . . . . . . . . . . . . . . . . . Welfare 211,926 207,212 244,700 244,700. . . . . . . . . . . . . . . . . . . . . . . . . . . . . . . . . . . . . . . . . . . . . . . . . . . . . . . Health 139,088 151,964 162,464 162,464. . . . . . . . . . . . . . . . . . . . . . . . . . . . . . . . . . . . . . . . . . . . . . . . . . . . . . . . Payment to Counties and Municipalities 91,959 125,485 119,787 119,787. . . . . . . . . . . . . . . . . . . . . . . . . . . . . Other 24,752 23,649 45,570 45,570. . . . . . . . . . . . . . . . . . . . . . . . . . . . . . . . . . . . . . . . . . . . . . . . . . . . . . . . . Non State Funds 13,446 12,677 11,988 4,003. . . . . . . . . . . . . . . . . . . . . . . . . . . . . . . . . . . . . . . . . . . . . . . .
Total State Aid 3,126,137 3,740,663 3,592,783 3,561,368. . . . . . . . . . . . . . . . . . . . . . . . . . . . . . . . . . . . . . . . . . . . . . . . .
94
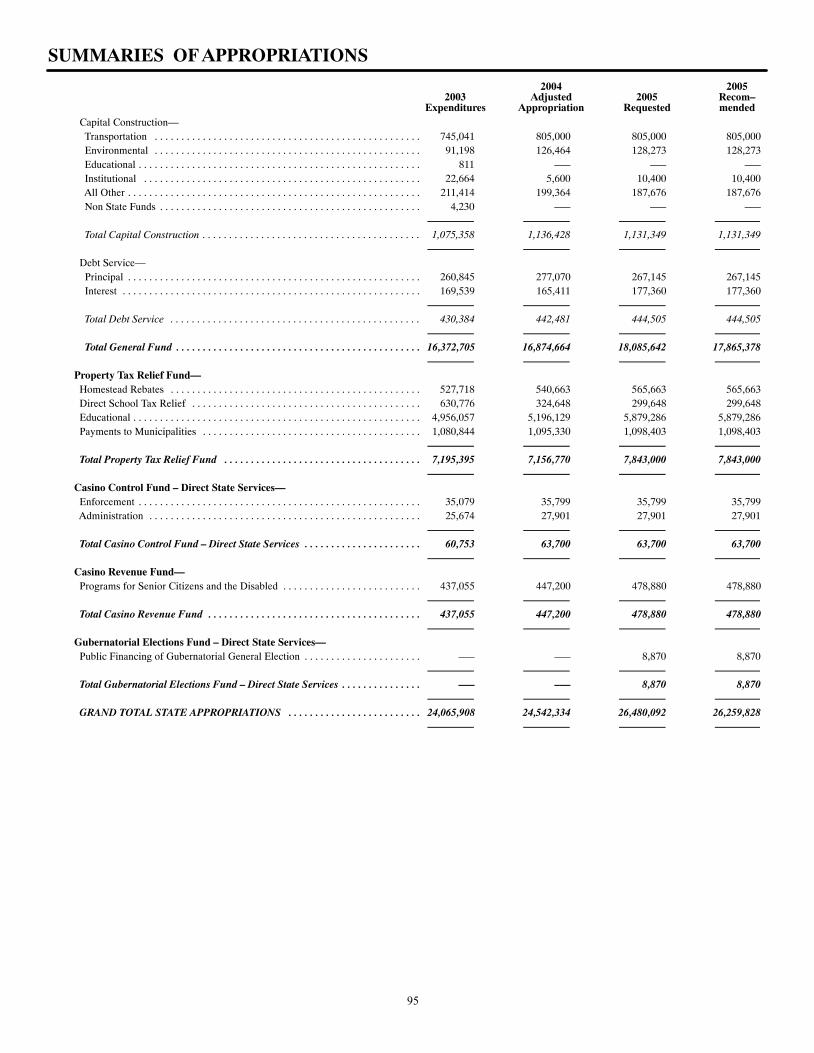
SUMMARIES OF APPROPRIATIONS
2004 20052003 Adjusted 2005 Recom–
Expenditures Appropriation Requested mended Capital Construction–– Transportation 745,041 805,000 805,000 805,000. . . . . . . . . . . . . . . . . . . . . . . . . . . . . . . . . . . . . . . . . . . . . . . . . . Environmental 91,198 126,464 128,273 128,273. . . . . . . . . . . . . . . . . . . . . . . . . . . . . . . . . . . . . . . . . . . . . . . . . . Educational 811 ––– ––– –––. . . . . . . . . . . . . . . . . . . . . . . . . . . . . . . . . . . . . . . . . . . . . . . . . . . . . Institutional 22,664 5,600 10,400 10,400. . . . . . . . . . . . . . . . . . . . . . . . . . . . . . . . . . . . . . . . . . . . . . . . . . . . All Other 211,414 199,364 187,676 187,676. . . . . . . . . . . . . . . . . . . . . . . . . . . . . . . . . . . . . . . . . . . . . . . . . . . . . . . Non State Funds 4,230 ––– ––– –––. . . . . . . . . . . . . . . . . . . . . . . . . . . . . . . . . . . . . . . . . . . . . . . . .
Total Capital Construction 1,075,358 1,136,428 1,131,349 1,131,349. . . . . . . . . . . . . . . . . . . . . . . . . . . . . . . . . . . . . . . . .
Debt Service–– Principal 260,845 277,070 267,145 267,145. . . . . . . . . . . . . . . . . . . . . . . . . . . . . . . . . . . . . . . . . . . . . . . . . . . . . . . Interest 169,539 165,411 177,360 177,360. . . . . . . . . . . . . . . . . . . . . . . . . . . . . . . . . . . . . . . . . . . . . . . . . . . . . . . .
Total Debt Service 430,384 442,481 444,505 444,505. . . . . . . . . . . . . . . . . . . . . . . . . . . . . . . . . . . . . . . . . . . . . . .
Total General Fund 16,372,705 16,874,664 18,085,642 17,865,378. . . . . . . . . . . . . . . . . . . . . . . . . . . . . . . . . . . . . . . . . . . . . .
Property Tax Relief Fund–– Homestead Rebates 527,718 540,663 565,663 565,663. . . . . . . . . . . . . . . . . . . . . . . . . . . . . . . . . . . . . . . . . . . . . . . Direct School Tax Relief 630,776 324,648 299,648 299,648. . . . . . . . . . . . . . . . . . . . . . . . . . . . . . . . . . . . . . . . . . . Educational 4,956,057 5,196,129 5,879,286 5,879,286. . . . . . . . . . . . . . . . . . . . . . . . . . . . . . . . . . . . . . . . . . . . . . . . . . . . . . Payments to Municipalities 1,080,844 1,095,330 1,098,403 1,098,403. . . . . . . . . . . . . . . . . . . . . . . . . . . . . . . . . . . . . . . . .
Total Property Tax Relief Fund 7,195,395 7,156,770 7,843,000 7,843,000. . . . . . . . . . . . . . . . . . . . . . . . . . . . . . . . . . . . .
Casino Control Fund – Direct State Services–– Enforcement 35,079 35,799 35,799 35,799. . . . . . . . . . . . . . . . . . . . . . . . . . . . . . . . . . . . . . . . . . . . . . . . . . . . . Administration 25,674 27,901 27,901 27,901. . . . . . . . . . . . . . . . . . . . . . . . . . . . . . . . . . . . . . . . . . . . . . . . . . .
Total Casino Control Fund – Direct State Services 60,753 63,700 63,700 63,700. . . . . . . . . . . . . . . . . . . . . .
Casino Revenue Fund–– Programs for Senior Citizens and the Disabled 437,055 447,200 478,880 478,880. . . . . . . . . . . . . . . . . . . . . . . . . .
Total Casino Revenue Fund 437,055 447,200 478,880 478,880. . . . . . . . . . . . . . . . . . . . . . . . . . . . . . . . . . . . . . . .
Gubernatorial Elections Fund – Direct State Services–– Public Financing of Gubernatorial General Election ––– ––– 8,870 8,870. . . . . . . . . . . . . . . . . . . . . .
Total Gubernatorial Elections Fund – Direct State Services ––– ––– 8,870 8,870. . . . . . . . . . . . . . .
GRAND TOTAL STATE APPROPRIATIONS 24,065,908 24,542,334 26,480,092 26,259,828. . . . . . . . . . . . . . . . . . . . . . . . .
95
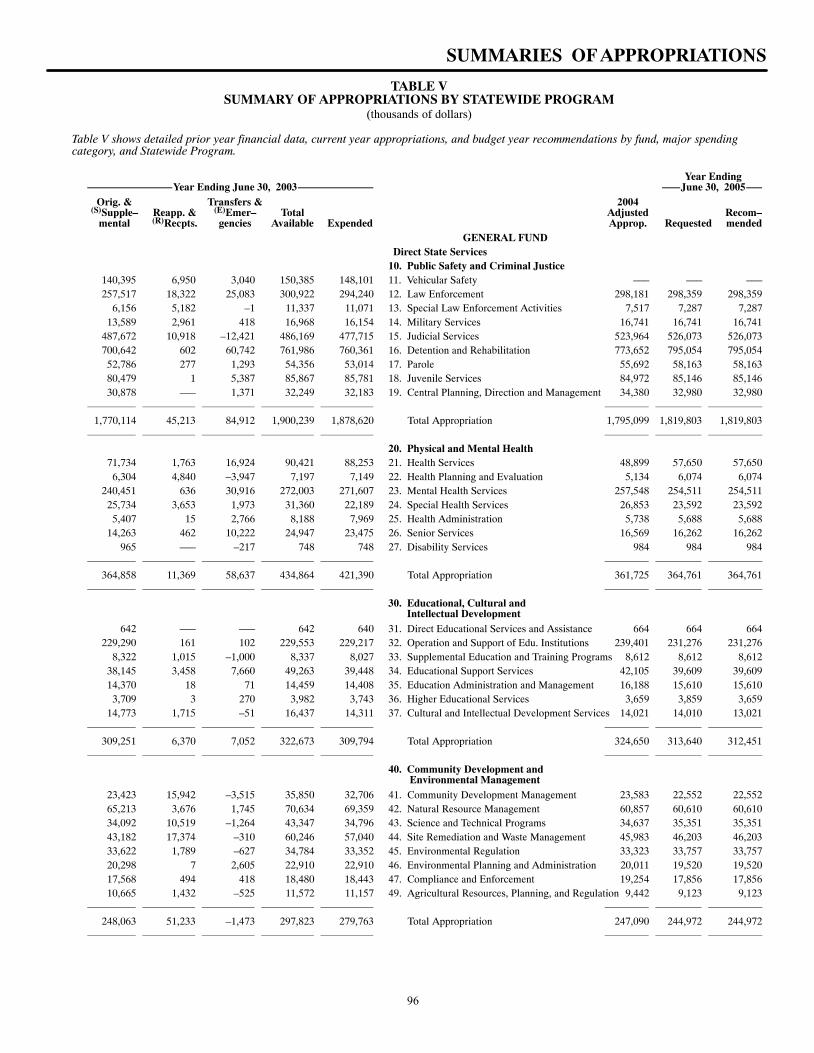
SUMMARIES OF APPROPRIATIONS
TABLE VSUMMARY OF APPROPRIATIONS BY STATEWIDE PROGRAM
(thousands of dollars)
Table V shows detailed prior year financial data, current year appropriations, and budget year recommendations by fund, major spendingcategory, and Statewide Program.
Year EndingYear Ending June 30, 2003 June 30, 2005
Orig. & Transfers & 2004(S)Supple– Reapp. & (E)Emer– Total Adjusted Recom–
mental (R)Recpts. gencies Available Expended Approp. Requested mendedGENERAL FUND
Direct State Services10. Public Safety and Criminal Justice
140,395 6,950 3,040 150,385 148,101 11. Vehicular Safety ––– ––– –––257,517 18,322 25,083 300,922 294,240 12. Law Enforcement 298,181 298,359 298,359
6,156 5,182 –1 11,337 11,071 13. Special Law Enforcement Activities 7,517 7,287 7,28713,589 2,961 418 16,968 16,154 14. Military Services 16,741 16,741 16,741
487,672 10,918 –12,421 486,169 477,715 15. Judicial Services 523,964 526,073 526,073700,642 602 60,742 761,986 760,361 16. Detention and Rehabilitation 773,652 795,054 795,054
52,786 277 1,293 54,356 53,014 17. Parole 55,692 58,163 58,16380,479 1 5,387 85,867 85,781 18. Juvenile Services 84,972 85,146 85,14630,878 ––– 1,371 32,249 32,183 19. Central Planning, Direction and Management 34,380 32,980 32,980
1,770,114 45,213 84,912 1,900,239 1,878,620 Total Appropriation 1,795,099 1,819,803 1,819,803
20. Physical and Mental Health
71,734 1,763 16,924 90,421 88,253 21. Health Services 48,899 57,650 57,6506,304 4,840 –3,947 7,197 7,149 22. Health Planning and Evaluation 5,134 6,074 6,074
240,451 636 30,916 272,003 271,607 23. Mental Health Services 257,548 254,511 254,51125,734 3,653 1,973 31,360 22,189 24. Special Health Services 26,853 23,592 23,592
5,407 15 2,766 8,188 7,969 25. Health Administration 5,738 5,688 5,68814,263 462 10,222 24,947 23,475 26. Senior Services 16,569 16,262 16,262
965 ––– –217 748 748 27. Disability Services 984 984 984
364,858 11,369 58,637 434,864 421,390 Total Appropriation 361,725 364,761 364,761
30. Educational, Cultural and Intellectual Development
642 ––– ––– 642 640 31. Direct Educational Services and Assistance 664 664 664229,290 161 102 229,553 229,217 32. Operation and Support of Edu. Institutions 239,401 231,276 231,276
8,322 1,015 –1,000 8,337 8,027 33. Supplemental Education and Training Programs 8,612 8,612 8,61238,145 3,458 7,660 49,263 39,448 34. Educational Support Services 42,105 39,609 39,60914,370 18 71 14,459 14,408 35. Education Administration and Management 16,188 15,610 15,610
3,709 3 270 3,982 3,743 36. Higher Educational Services 3,659 3,859 3,65914,773 1,715 –51 16,437 14,311 37. Cultural and Intellectual Development Services 14,021 14,010 13,021
309,251 6,370 7,052 322,673 309,794 Total Appropriation 324,650 313,640 312,451
40. Community Development and Environmental Management
23,423 15,942 –3,515 35,850 32,706 41. Community Development Management 23,583 22,552 22,55265,213 3,676 1,745 70,634 69,359 42. Natural Resource Management 60,857 60,610 60,61034,092 10,519 –1,264 43,347 34,796 43. Science and Technical Programs 34,637 35,351 35,35143,182 17,374 –310 60,246 57,040 44. Site Remediation and Waste Management 45,983 46,203 46,20333,622 1,789 –627 34,784 33,352 45. Environmental Regulation 33,323 33,757 33,75720,298 7 2,605 22,910 22,910 46. Environmental Planning and Administration 20,011 19,520 19,52017,568 494 418 18,480 18,443 47. Compliance and Enforcement 19,254 17,856 17,85610,665 1,432 –525 11,572 11,157 49. Agricultural Resources, Planning, and Regulation 9,442 9,123 9,123
248,063 51,233 –1,473 297,823 279,763 Total Appropriation 247,090 244,972 244,972
96
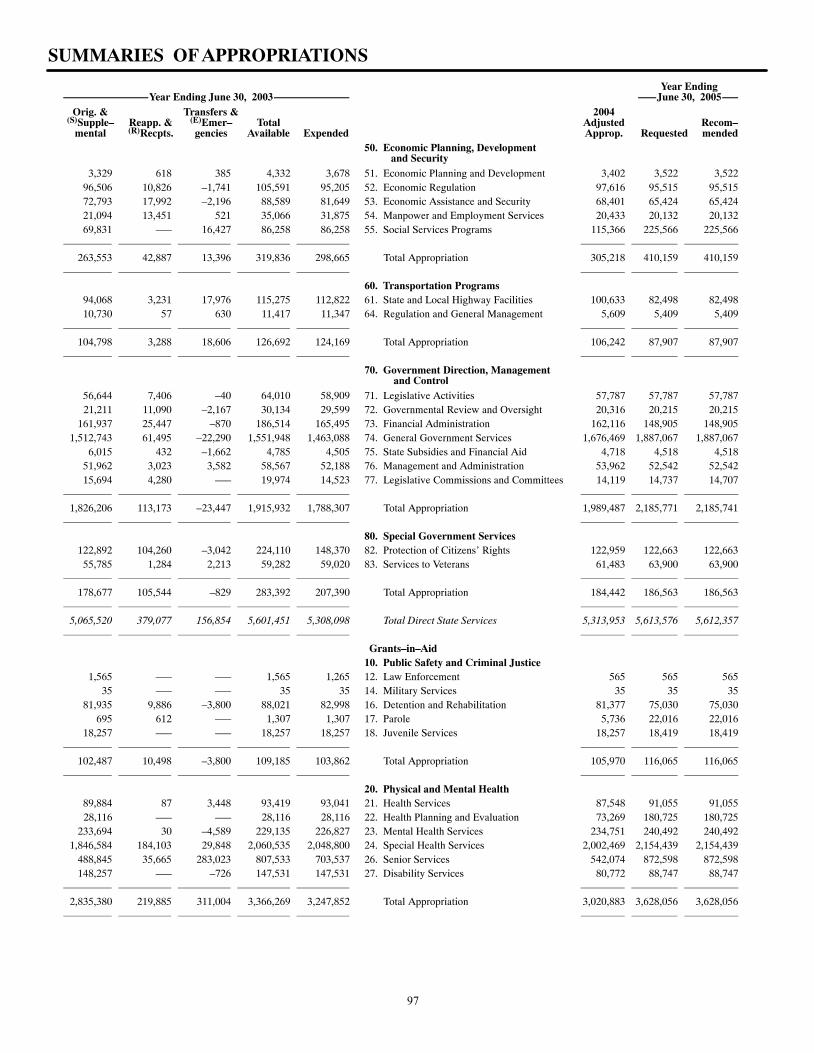
SUMMARIES OF APPROPRIATIONS
Year EndingYear Ending June 30, 2003 June 30, 2005
Orig. & Transfers & 2004(S)Supple– Reapp. & (E)Emer– Total Adjusted Recom–
mental (R)Recpts. gencies Available Expended Approp. Requested mended50. Economic Planning, Development and Security
3,329 618 385 4,332 3,678 51. Economic Planning and Development 3,402 3,522 3,52296,506 10,826 –1,741 105,591 95,205 52. Economic Regulation 97,616 95,515 95,51572,793 17,992 –2,196 88,589 81,649 53. Economic Assistance and Security 68,401 65,424 65,42421,094 13,451 521 35,066 31,875 54. Manpower and Employment Services 20,433 20,132 20,13269,831 ––– 16,427 86,258 86,258 55. Social Services Programs 115,366 225,566 225,566
263,553 42,887 13,396 319,836 298,665 Total Appropriation 305,218 410,159 410,159
60. Transportation Programs
94,068 3,231 17,976 115,275 112,822 61. State and Local Highway Facilities 100,633 82,498 82,49810,730 57 630 11,417 11,347 64. Regulation and General Management 5,609 5,409 5,409
104,798 3,288 18,606 126,692 124,169 Total Appropriation 106,242 87,907 87,907
70. Government Direction, Management and Control
56,644 7,406 –40 64,010 58,909 71. Legislative Activities 57,787 57,787 57,78721,211 11,090 –2,167 30,134 29,599 72. Governmental Review and Oversight 20,316 20,215 20,215
161,937 25,447 –870 186,514 165,495 73. Financial Administration 162,116 148,905 148,9051,512,743 61,495 –22,290 1,551,948 1,463,088 74. General Government Services 1,676,469 1,887,067 1,887,067
6,015 432 –1,662 4,785 4,505 75. State Subsidies and Financial Aid 4,718 4,518 4,51851,962 3,023 3,582 58,567 52,188 76. Management and Administration 53,962 52,542 52,54215,694 4,280 ––– 19,974 14,523 77. Legislative Commissions and Committees 14,119 14,737 14,707
1,826,206 113,173 –23,447 1,915,932 1,788,307 Total Appropriation 1,989,487 2,185,771 2,185,741
80. Special Government Services
122,892 104,260 –3,042 224,110 148,370 82. Protection of Citizens’ Rights 122,959 122,663 122,66355,785 1,284 2,213 59,282 59,020 83. Services to Veterans 61,483 63,900 63,900
178,677 105,544 –829 283,392 207,390 Total Appropriation 184,442 186,563 186,563
5,065,520 379,077 156,854 5,601,451 5,308,098 Total Direct State Services 5,313,953 5,613,576 5,612,357
Grants–in–Aid
10. Public Safety and Criminal Justice1,565 ––– ––– 1,565 1,265 12. Law Enforcement 565 565 565
35 ––– ––– 35 35 14. Military Services 35 35 3581,935 9,886 –3,800 88,021 82,998 16. Detention and Rehabilitation 81,377 75,030 75,030
695 612 ––– 1,307 1,307 17. Parole 5,736 22,016 22,01618,257 ––– ––– 18,257 18,257 18. Juvenile Services 18,257 18,419 18,419
102,487 10,498 –3,800 109,185 103,862 Total Appropriation 105,970 116,065 116,065
20. Physical and Mental Health
89,884 87 3,448 93,419 93,041 21. Health Services 87,548 91,055 91,05528,116 ––– ––– 28,116 28,116 22. Health Planning and Evaluation 73,269 180,725 180,725
233,694 30 –4,589 229,135 226,827 23. Mental Health Services 234,751 240,492 240,4921,846,584 184,103 29,848 2,060,535 2,048,800 24. Special Health Services 2,002,469 2,154,439 2,154,439
488,845 35,665 283,023 807,533 703,537 26. Senior Services 542,074 872,598 872,598148,257 ––– –726 147,531 147,531 27. Disability Services 80,772 88,747 88,747
2,835,380 219,885 311,004 3,366,269 3,247,852 Total Appropriation 3,020,883 3,628,056 3,628,056
97

SUMMARIES OF APPROPRIATIONS
Year EndingYear Ending June 30, 2003 June 30, 2005
Orig. & Transfers & 2004(S)Supple– Reapp. & (E)Emer– Total Adjusted Recom–
mental (R)Recpts. gencies Available Expended Approp. Requested mended30. Educational, Cultural and Intellectual Development
421,101 ––– ––– 421,101 420,138 32. Operation and Support of Edu. Institutions 389,383 420,133 420,1334,456 ––– ––– 4,456 4,456 33. Supplemental Education and Training Programs 4,178 4,178 4,178
20,015 ––– –9,000 11,015 9,377 34. Educational Support Services 9,443 11,269 11,2691,201,893 21,298 –42,568 1,180,623 1,131,920 36. Higher Educational Services 1,169,891 1,392,074 1,204,444
25,602 3 –316 25,289 25,287 37. Cultural and Intellectual Development Services 22,532 30,552 30,552
1,673,067 21,301 –51,884 1,642,484 1,591,178 Total Appropriation 1,595,427 1,858,206 1,670,576
40. Community Development and Environmental Management
16,950 9,071 4,448 30,469 27,686 41. Community Development Management 15,850 15,850 15,8505,500 1,544 1,546 8,590 7,540 42. Natural Resource Management 3,250 250 250
––– ––– 500 500 500 43. Science and Technical Programs 6,000 6,000 6,0001,909 309 –375 1,843 1,731 49. Agricultural Resources, Planning, and
Regulation 436 1,255 1,255
24,359 10,924 6,119 41,402 37,457 Total Appropriation 25,536 23,355 23,355
50. Economic Planning, Development and Security
67,459 2,055 –940 68,574 66,398 51. Economic Planning and Development 26,648 32,151 32,15111,171 ––– ––– 11,171 11,171 52. Economic Regulation 70,840 70,840 70,840
297,444 14,369 –70,019 241,794 237,202 53. Economic Assistance and Security 271,498 248,777 248,77732,779 ––– 675 33,454 33,406 54. Manpower and Employment Services 31,279 31,561 31,561
256,524 315 –2,720 254,119 253,754 55. Social Services Programs 245,702 243,446 243,446
665,377 16,739 –73,004 609,112 601,931 Total Appropriation 645,967 626,775 626,775
60. Transportation Programs9,000 ––– –2,944 6,056 4,069 61. State and Local Highway Facilities ––– ––– –––
260,027 ––– –379 259,648 259,648 62. Public Transportation 193,827 278,700 278,700––– 2,002 41 2,043 987 64. Regulation and General Management ––– ––– –––
269,027 2,002 –3,282 267,747 264,704 Total Appropriation 193,827 278,700 278,700
70. Government Direction, Management and Control
554,692 2 6,765 561,459 559,155 74. General Government Services 622,312 734,951 734,9514,876 33 129 5,038 5,005 75. State Subsidies and Financial Aid 10,500 ––– –––6,038 552 2,089 8,679 8,593 76. Management and Administration 7,708 22,312 22,312
565,606 587 8,983 575,176 572,753 Total Appropriation 640,520 757,263 757,263
80. Special Government Services
12,000 ––– ––– 12,000 12,000 82. Protection of Citizens’ Rights 12,000 14,000 14,0001,009 114 ––– 1,123 991 83. Services to Veterans 1,009 1,009 1,009
13,009 114 ––– 13,123 12,991 Total Appropriation 13,009 15,009 15,009
6,148,312 282,050 194,136 6,624,498 6,432,728 Total Grants–in–Aid 6,241,139 7,303,429 7,115,799
98
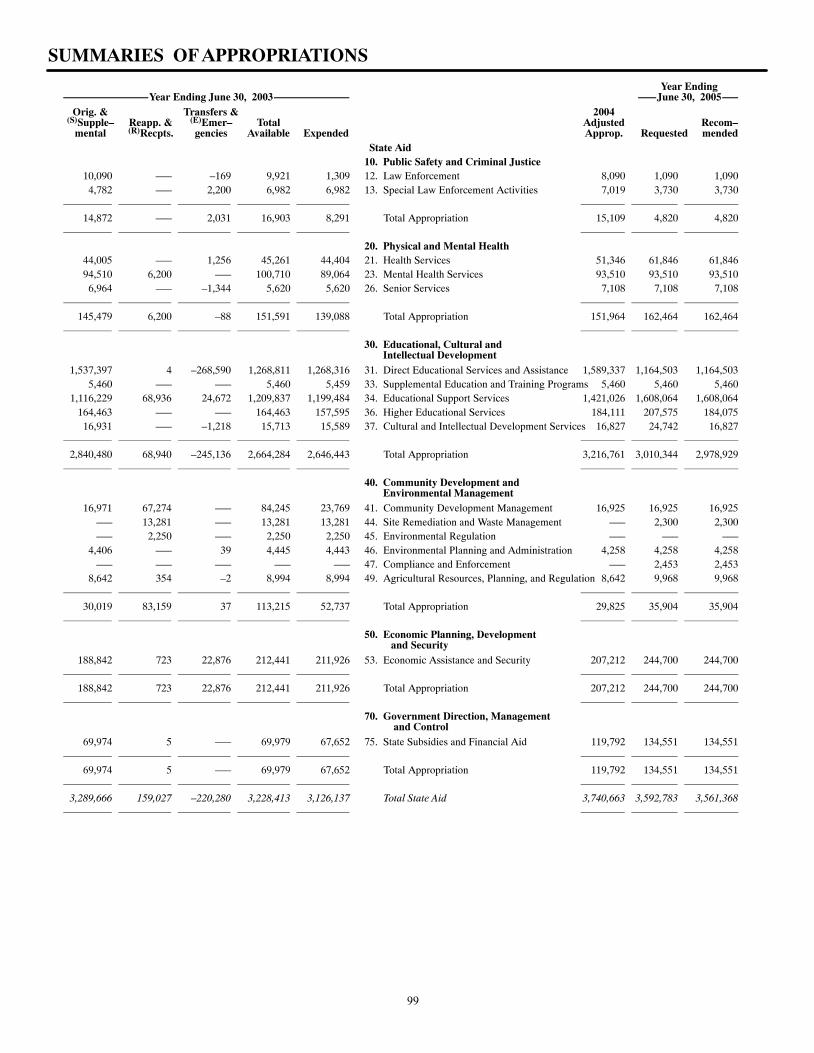
SUMMARIES OF APPROPRIATIONS
Year EndingYear Ending June 30, 2003 June 30, 2005
Orig. & Transfers & 2004(S)Supple– Reapp. & (E)Emer– Total Adjusted Recom–
mental (R)Recpts. gencies Available Expended Approp. Requested mendedState Aid
10. Public Safety and Criminal Justice10,090 ––– –169 9,921 1,309 12. Law Enforcement 8,090 1,090 1,090
4,782 ––– 2,200 6,982 6,982 13. Special Law Enforcement Activities 7,019 3,730 3,730
14,872 ––– 2,031 16,903 8,291 Total Appropriation 15,109 4,820 4,820
20. Physical and Mental Health44,005 ––– 1,256 45,261 44,404 21. Health Services 51,346 61,846 61,84694,510 6,200 ––– 100,710 89,064 23. Mental Health Services 93,510 93,510 93,510
6,964 ––– –1,344 5,620 5,620 26. Senior Services 7,108 7,108 7,108
145,479 6,200 –88 151,591 139,088 Total Appropriation 151,964 162,464 162,464
30. Educational, Cultural and Intellectual Development
1,537,397 4 –268,590 1,268,811 1,268,316 31. Direct Educational Services and Assistance 1,589,337 1,164,503 1,164,5035,460 ––– ––– 5,460 5,459 33. Supplemental Education and Training Programs 5,460 5,460 5,460
1,116,229 68,936 24,672 1,209,837 1,199,484 34. Educational Support Services 1,421,026 1,608,064 1,608,064164,463 ––– ––– 164,463 157,595 36. Higher Educational Services 184,111 207,575 184,075
16,931 ––– –1,218 15,713 15,589 37. Cultural and Intellectual Development Services 16,827 24,742 16,827
2,840,480 68,940 –245,136 2,664,284 2,646,443 Total Appropriation 3,216,761 3,010,344 2,978,929
40. Community Development and Environmental Management
16,971 67,274 ––– 84,245 23,769 41. Community Development Management 16,925 16,925 16,925––– 13,281 ––– 13,281 13,281 44. Site Remediation and Waste Management ––– 2,300 2,300––– 2,250 ––– 2,250 2,250 45. Environmental Regulation ––– ––– –––
4,406 ––– 39 4,445 4,443 46. Environmental Planning and Administration 4,258 4,258 4,258––– ––– ––– ––– ––– 47. Compliance and Enforcement ––– 2,453 2,453
8,642 354 –2 8,994 8,994 49. Agricultural Resources, Planning, and Regulation 8,642 9,968 9,968
30,019 83,159 37 113,215 52,737 Total Appropriation 29,825 35,904 35,904
50. Economic Planning, Development and Security
188,842 723 22,876 212,441 211,926 53. Economic Assistance and Security 207,212 244,700 244,700
188,842 723 22,876 212,441 211,926 Total Appropriation 207,212 244,700 244,700
70. Government Direction, Management and Control
69,974 5 ––– 69,979 67,652 75. State Subsidies and Financial Aid 119,792 134,551 134,551
69,974 5 ––– 69,979 67,652 Total Appropriation 119,792 134,551 134,551
3,289,666 159,027 –220,280 3,228,413 3,126,137 Total State Aid 3,740,663 3,592,783 3,561,368
99
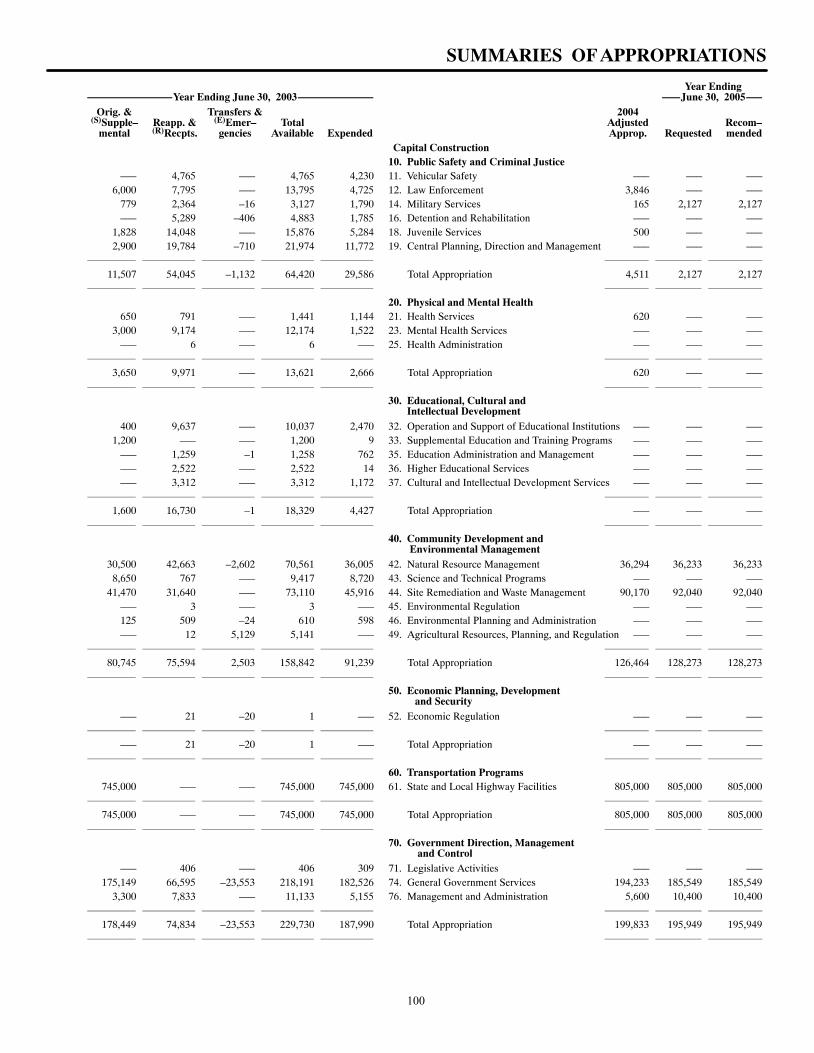
SUMMARIES OF APPROPRIATIONS
Year EndingYear Ending June 30, 2003 June 30, 2005
Orig. & Transfers & 2004(S)Supple– Reapp. & (E)Emer– Total Adjusted Recom–
mental (R)Recpts. gencies Available Expended Approp. Requested mendedCapital Construction
10. Public Safety and Criminal Justice––– 4,765 ––– 4,765 4,230 11. Vehicular Safety ––– ––– –––
6,000 7,795 ––– 13,795 4,725 12. Law Enforcement 3,846 ––– –––779 2,364 –16 3,127 1,790 14. Military Services 165 2,127 2,127––– 5,289 –406 4,883 1,785 16. Detention and Rehabilitation ––– ––– –––
1,828 14,048 ––– 15,876 5,284 18. Juvenile Services 500 ––– –––2,900 19,784 –710 21,974 11,772 19. Central Planning, Direction and Management ––– ––– –––
11,507 54,045 –1,132 64,420 29,586 Total Appropriation 4,511 2,127 2,127
20. Physical and Mental Health
650 791 ––– 1,441 1,144 21. Health Services 620 ––– –––3,000 9,174 ––– 12,174 1,522 23. Mental Health Services ––– ––– –––
––– 6 ––– 6 ––– 25. Health Administration ––– ––– –––
3,650 9,971 ––– 13,621 2,666 Total Appropriation 620 ––– –––
30. Educational, Cultural and Intellectual Development
400 9,637 ––– 10,037 2,470 32. Operation and Support of Educational Institutions ––– ––– –––1,200 ––– ––– 1,200 9 33. Supplemental Education and Training Programs ––– ––– –––
––– 1,259 –1 1,258 762 35. Education Administration and Management ––– ––– –––––– 2,522 ––– 2,522 14 36. Higher Educational Services ––– ––– –––––– 3,312 ––– 3,312 1,172 37. Cultural and Intellectual Development Services ––– ––– –––
1,600 16,730 –1 18,329 4,427 Total Appropriation ––– ––– –––
40. Community Development and Environmental Management
30,500 42,663 –2,602 70,561 36,005 42. Natural Resource Management 36,294 36,233 36,2338,650 767 ––– 9,417 8,720 43. Science and Technical Programs ––– ––– –––
41,470 31,640 ––– 73,110 45,916 44. Site Remediation and Waste Management 90,170 92,040 92,040––– 3 ––– 3 ––– 45. Environmental Regulation ––– ––– –––125 509 –24 610 598 46. Environmental Planning and Administration ––– ––– –––––– 12 5,129 5,141 ––– 49. Agricultural Resources, Planning, and Regulation ––– ––– –––
80,745 75,594 2,503 158,842 91,239 Total Appropriation 126,464 128,273 128,273
50. Economic Planning, Development and Security
––– 21 –20 1 ––– 52. Economic Regulation ––– ––– –––
––– 21 –20 1 ––– Total Appropriation ––– ––– –––
60. Transportation Programs745,000 ––– ––– 745,000 745,000 61. State and Local Highway Facilities 805,000 805,000 805,000
745,000 ––– ––– 745,000 745,000 Total Appropriation 805,000 805,000 805,000
70. Government Direction, Management and Control
––– 406 ––– 406 309 71. Legislative Activities ––– ––– –––175,149 66,595 –23,553 218,191 182,526 74. General Government Services 194,233 185,549 185,549
3,300 7,833 ––– 11,133 5,155 76. Management and Administration 5,600 10,400 10,400
178,449 74,834 –23,553 229,730 187,990 Total Appropriation 199,833 195,949 195,949
100
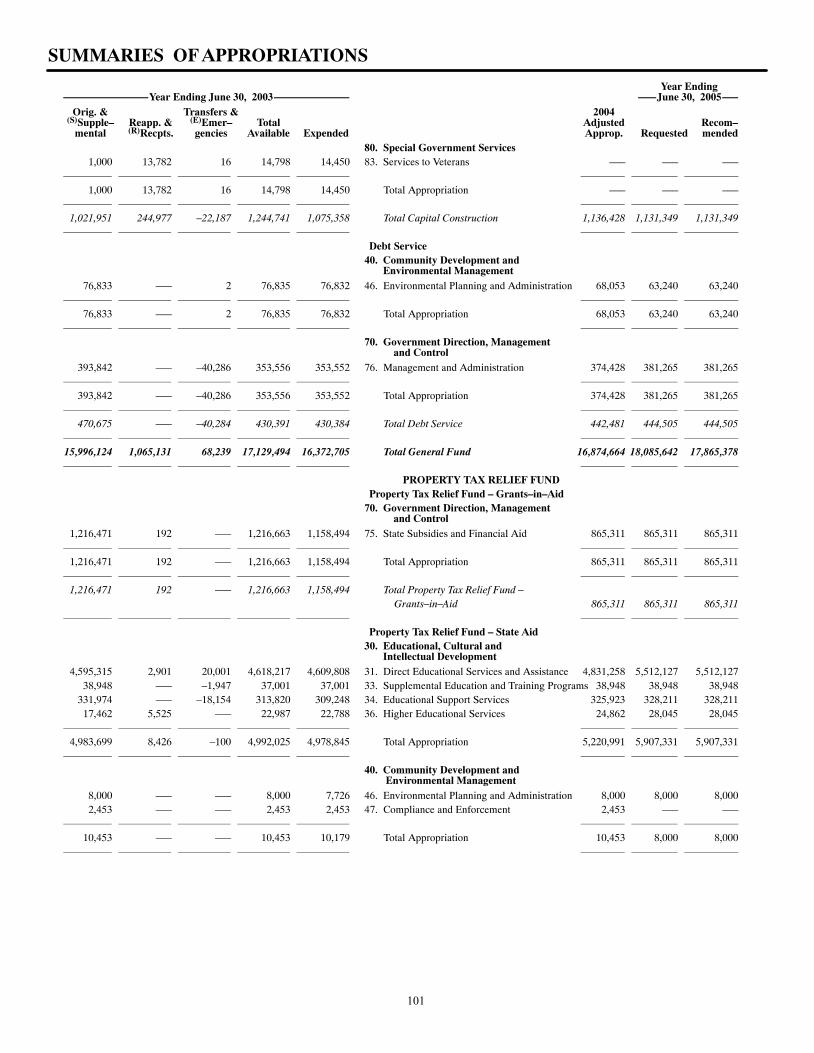
SUMMARIES OF APPROPRIATIONS
Year EndingYear Ending June 30, 2003 June 30, 2005
Orig. & Transfers & 2004(S)Supple– Reapp. & (E)Emer– Total Adjusted Recom–
mental (R)Recpts. gencies Available Expended Approp. Requested mended80. Special Government Services
1,000 13,782 16 14,798 14,450 83. Services to Veterans ––– ––– –––
1,000 13,782 16 14,798 14,450 Total Appropriation ––– ––– –––
1,021,951 244,977 –22,187 1,244,741 1,075,358 Total Capital Construction 1,136,428 1,131,349 1,131,349
Debt Service40. Community Development and Environmental Management
76,833 ––– 2 76,835 76,832 46. Environmental Planning and Administration 68,053 63,240 63,240
76,833 ––– 2 76,835 76,832 Total Appropriation 68,053 63,240 63,240
70. Government Direction, Management and Control
393,842 ––– –40,286 353,556 353,552 76. Management and Administration 374,428 381,265 381,265
393,842 ––– –40,286 353,556 353,552 Total Appropriation 374,428 381,265 381,265
470,675 ––– –40,284 430,391 430,384 Total Debt Service 442,481 444,505 444,505
15,996,124 1,065,131 68,239 17,129,494 16,372,705 Total General Fund 16,874,664 18,085,642 17,865,378
PROPERTY TAX RELIEF FUNDProperty Tax Relief Fund – Grants–in–Aid
70. Government Direction, Management and Control
1,216,471 192 ––– 1,216,663 1,158,494 75. State Subsidies and Financial Aid 865,311 865,311 865,311
1,216,471 192 ––– 1,216,663 1,158,494 Total Appropriation 865,311 865,311 865,311
1,216,471 192 ––– 1,216,663 1,158,494 Total Property Tax Relief Fund – Grants–in–Aid 865,311 865,311 865,311
Property Tax Relief Fund – State Aid
30. Educational, Cultural and Intellectual Development
4,595,315 2,901 20,001 4,618,217 4,609,808 31. Direct Educational Services and Assistance 4,831,258 5,512,127 5,512,12738,948 ––– –1,947 37,001 37,001 33. Supplemental Education and Training Programs 38,948 38,948 38,948
331,974 ––– –18,154 313,820 309,248 34. Educational Support Services 325,923 328,211 328,21117,462 5,525 ––– 22,987 22,788 36. Higher Educational Services 24,862 28,045 28,045
4,983,699 8,426 –100 4,992,025 4,978,845 Total Appropriation 5,220,991 5,907,331 5,907,331
40. Community Development and Environmental Management
8,000 ––– ––– 8,000 7,726 46. Environmental Planning and Administration 8,000 8,000 8,0002,453 ––– ––– 2,453 2,453 47. Compliance and Enforcement 2,453 ––– –––
10,453 ––– ––– 10,453 10,179 Total Appropriation 10,453 8,000 8,000
101
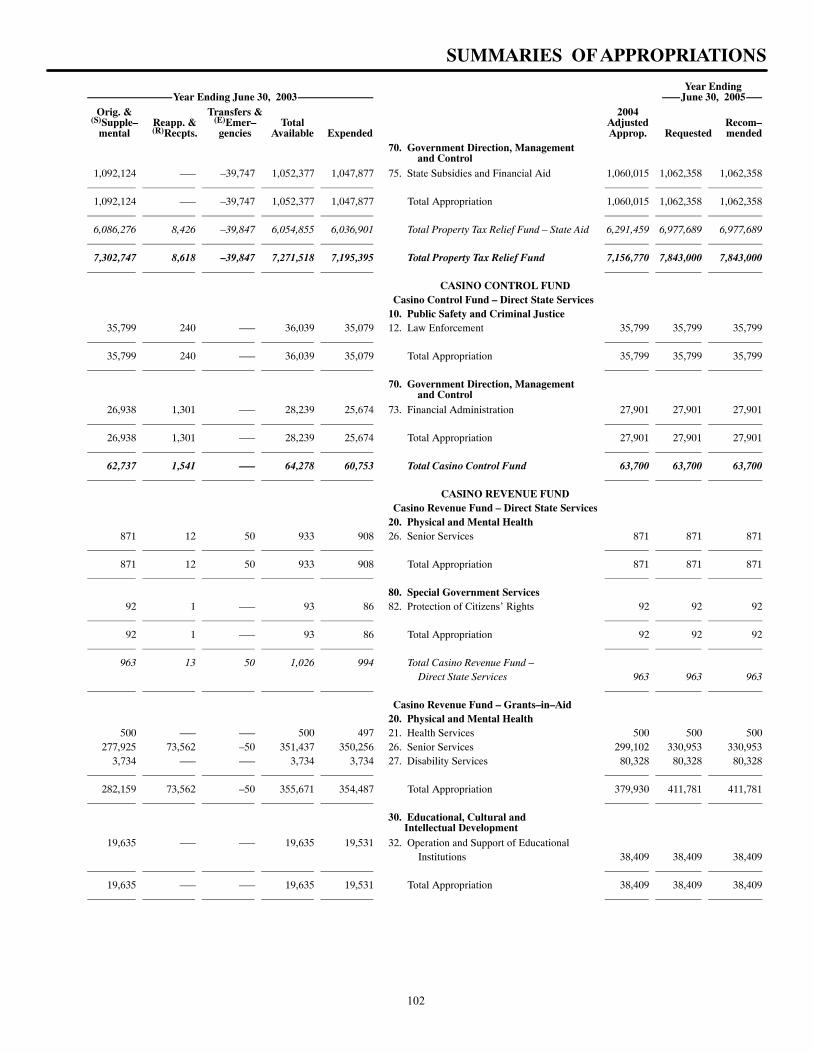
SUMMARIES OF APPROPRIATIONS
Year EndingYear Ending June 30, 2003 June 30, 2005
Orig. & Transfers & 2004(S)Supple– Reapp. & (E)Emer– Total Adjusted Recom–
mental (R)Recpts. gencies Available Expended Approp. Requested mended70. Government Direction, Management and Control
1,092,124 ––– –39,747 1,052,377 1,047,877 75. State Subsidies and Financial Aid 1,060,015 1,062,358 1,062,358
1,092,124 ––– –39,747 1,052,377 1,047,877 Total Appropriation 1,060,015 1,062,358 1,062,358
6,086,276 8,426 –39,847 6,054,855 6,036,901 Total Property Tax Relief Fund – State Aid 6,291,459 6,977,689 6,977,689
7,302,747 8,618 –39,847 7,271,518 7,195,395 Total Property Tax Relief Fund 7,156,770 7,843,000 7,843,000
CASINO CONTROL FUNDCasino Control Fund – Direct State Services
10. Public Safety and Criminal Justice35,799 240 ––– 36,039 35,079 12. Law Enforcement 35,799 35,799 35,799
35,799 240 ––– 36,039 35,079 Total Appropriation 35,799 35,799 35,799
70. Government Direction, Management and Control
26,938 1,301 ––– 28,239 25,674 73. Financial Administration 27,901 27,901 27,901
26,938 1,301 ––– 28,239 25,674 Total Appropriation 27,901 27,901 27,901
62,737 1,541 ––– 64,278 60,753 Total Casino Control Fund 63,700 63,700 63,700
CASINO REVENUE FUNDCasino Revenue Fund – Direct State Services
20. Physical and Mental Health871 12 50 933 908 26. Senior Services 871 871 871
871 12 50 933 908 Total Appropriation 871 871 871
80. Special Government Services
92 1 ––– 93 86 82. Protection of Citizens’ Rights 92 92 92
92 1 ––– 93 86 Total Appropriation 92 92 92
963 13 50 1,026 994 Total Casino Revenue Fund – Direct State Services 963 963 963
Casino Revenue Fund – Grants–in–Aid
20. Physical and Mental Health500 ––– ––– 500 497 21. Health Services 500 500 500
277,925 73,562 –50 351,437 350,256 26. Senior Services 299,102 330,953 330,9533,734 ––– ––– 3,734 3,734 27. Disability Services 80,328 80,328 80,328
282,159 73,562 –50 355,671 354,487 Total Appropriation 379,930 411,781 411,781
30. Educational, Cultural and Intellectual Development
19,635 ––– ––– 19,635 19,531 32. Operation and Support of Educational Institutions 38,409 38,409 38,409
19,635 ––– ––– 19,635 19,531 Total Appropriation 38,409 38,409 38,409
102
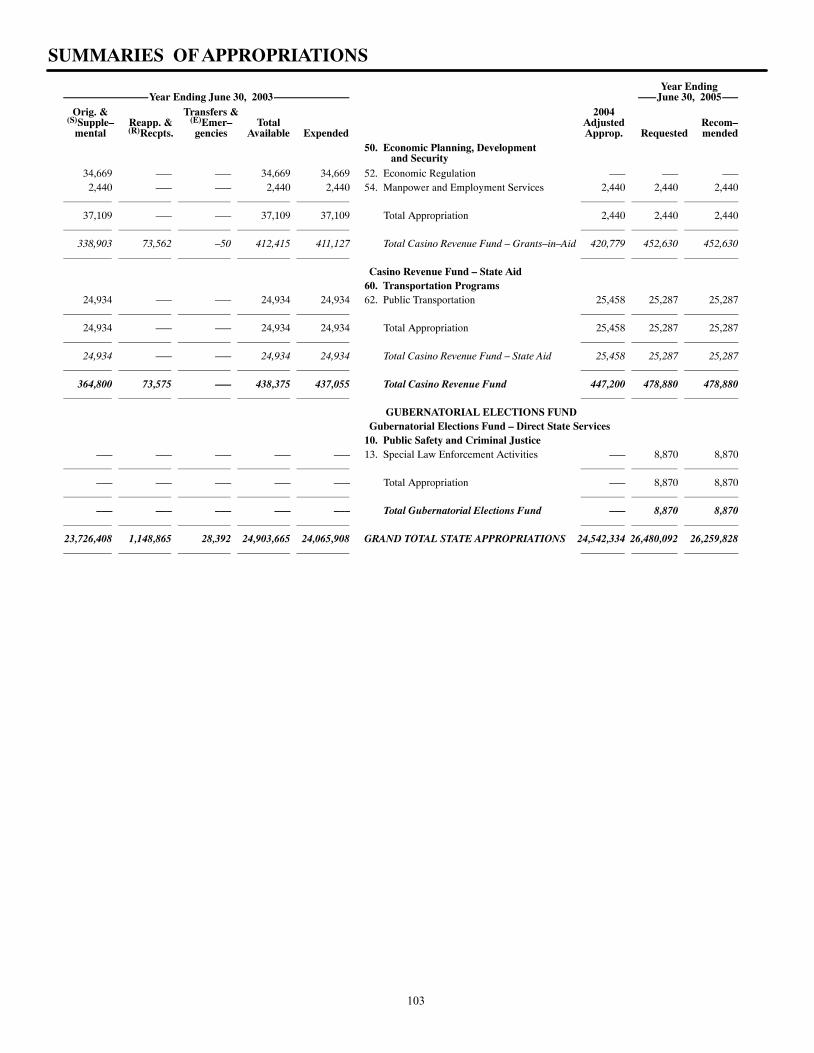
SUMMARIES OF APPROPRIATIONS
Year EndingYear Ending June 30, 2003 June 30, 2005
Orig. & Transfers & 2004(S)Supple– Reapp. & (E)Emer– Total Adjusted Recom–
mental (R)Recpts. gencies Available Expended Approp. Requested mended50. Economic Planning, Development and Security
34,669 ––– ––– 34,669 34,669 52. Economic Regulation ––– ––– –––2,440 ––– ––– 2,440 2,440 54. Manpower and Employment Services 2,440 2,440 2,440
37,109 ––– ––– 37,109 37,109 Total Appropriation 2,440 2,440 2,440
338,903 73,562 –50 412,415 411,127 Total Casino Revenue Fund – Grants–in–Aid 420,779 452,630 452,630
Casino Revenue Fund – State Aid
60. Transportation Programs24,934 ––– ––– 24,934 24,934 62. Public Transportation 25,458 25,287 25,287
24,934 ––– ––– 24,934 24,934 Total Appropriation 25,458 25,287 25,287
24,934 ––– ––– 24,934 24,934 Total Casino Revenue Fund – State Aid 25,458 25,287 25,287
364,800 73,575 ––– 438,375 437,055 Total Casino Revenue Fund 447,200 478,880 478,880
GUBERNATORIAL ELECTIONS FUND
Gubernatorial Elections Fund – Direct State Services10. Public Safety and Criminal Justice
––– ––– ––– ––– ––– 13. Special Law Enforcement Activities ––– 8,870 8,870
––– ––– ––– ––– ––– Total Appropriation ––– 8,870 8,870
––– ––– ––– ––– ––– Total Gubernatorial Elections Fund ––– 8,870 8,870
23,726,408 1,148,865 28,392 24,903,665 24,065,908 GRAND TOTAL STATE APPROPRIATIONS 24,542,334 26,480,092 26,259,828
103
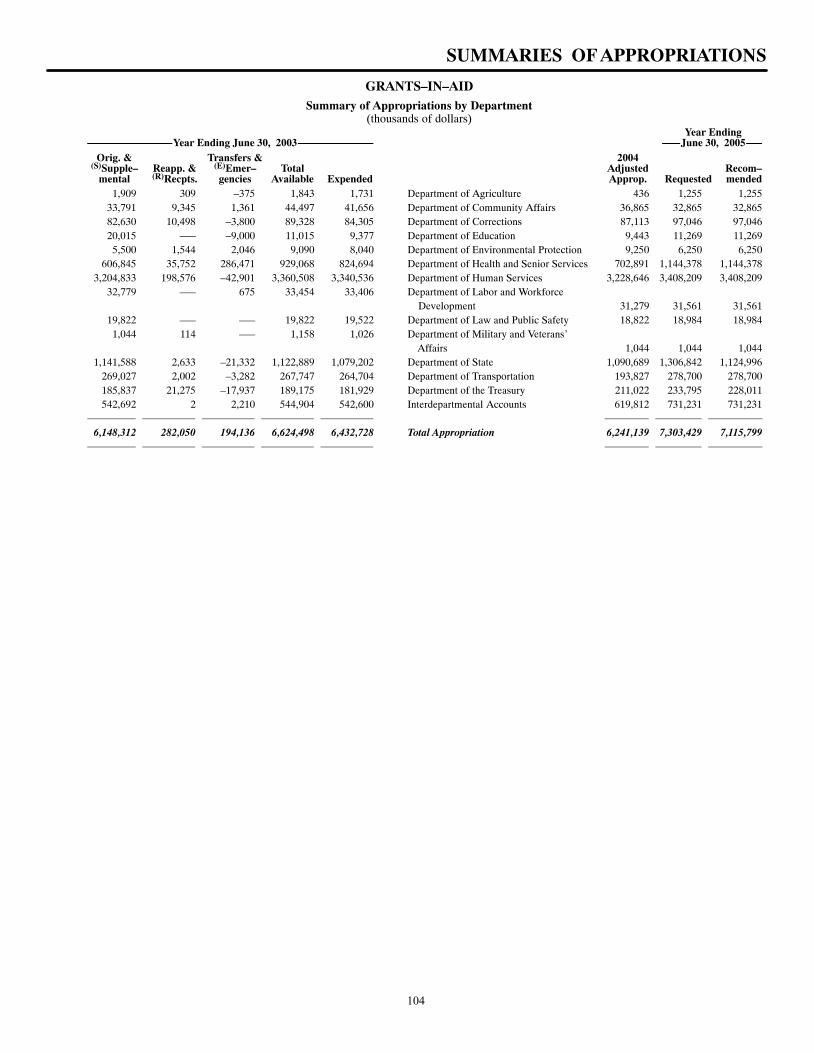
SUMMARIES OF APPROPRIATIONS
GRANTS–IN–AIDSummary of Appropriations by Department
(thousands of dollars)Year Ending
Year Ending June 30, 2003 June 30, 2005Orig. & Transfers & 2004
(S)Supple– Reapp. & (E)Emer– Total Adjusted Recom–mental (R)Recpts. gencies Available Expended Approp. Requested mended
1,909 309 –375 1,843 1,731 Department of Agriculture 436 1,255 1,25533,791 9,345 1,361 44,497 41,656 Department of Community Affairs 36,865 32,865 32,86582,630 10,498 –3,800 89,328 84,305 Department of Corrections 87,113 97,046 97,04620,015 ––– –9,000 11,015 9,377 Department of Education 9,443 11,269 11,269
5,500 1,544 2,046 9,090 8,040 Department of Environmental Protection 9,250 6,250 6,250606,845 35,752 286,471 929,068 824,694 Department of Health and Senior Services 702,891 1,144,378 1,144,378
3,204,833 198,576 –42,901 3,360,508 3,340,536 Department of Human Services 3,228,646 3,408,209 3,408,20932,779 ––– 675 33,454 33,406 Department of Labor and Workforce
Development 31,279 31,561 31,56119,822 ––– ––– 19,822 19,522 Department of Law and Public Safety 18,822 18,984 18,984
1,044 114 ––– 1,158 1,026 Department of Military and Veterans’ Affairs 1,044 1,044 1,044
1,141,588 2,633 –21,332 1,122,889 1,079,202 Department of State 1,090,689 1,306,842 1,124,996269,027 2,002 –3,282 267,747 264,704 Department of Transportation 193,827 278,700 278,700185,837 21,275 –17,937 189,175 181,929 Department of the Treasury 211,022 233,795 228,011542,692 2 2,210 544,904 542,600 Interdepartmental Accounts 619,812 731,231 731,231
6,148,312 282,050 194,136 6,624,498 6,432,728 Total Appropriation 6,241,139 7,303,429 7,115,799
104
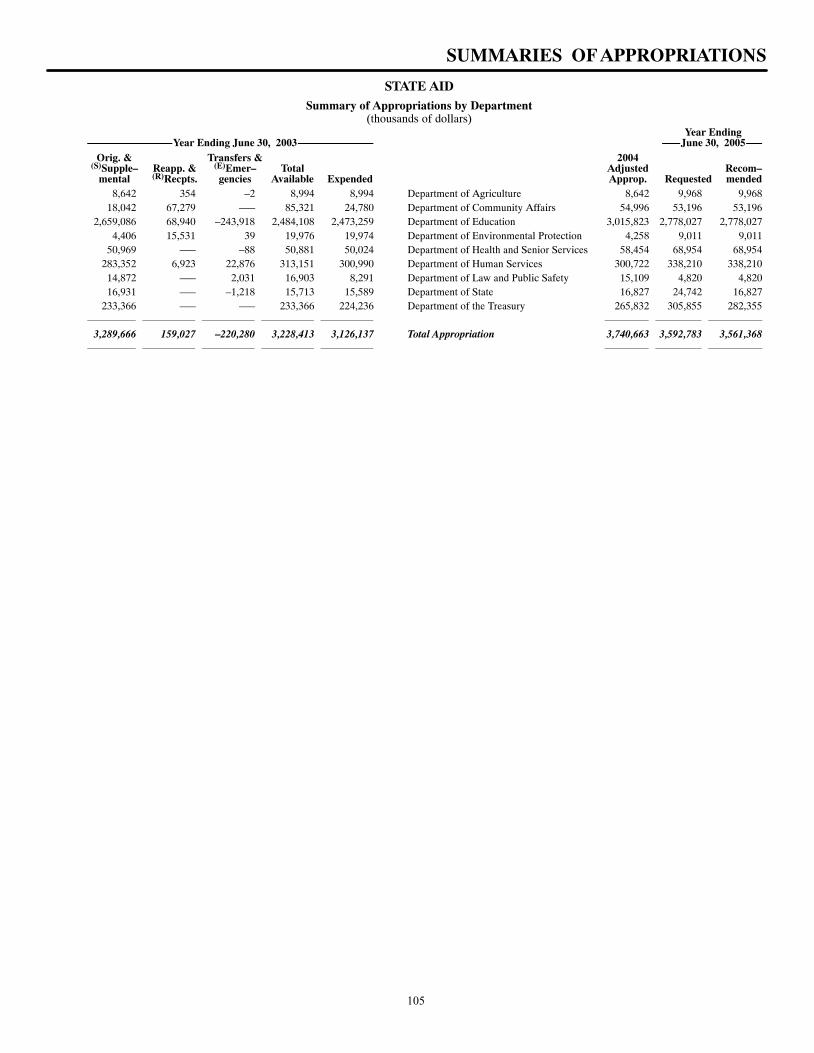
SUMMARIES OF APPROPRIATIONS
STATE AIDSummary of Appropriations by Department
(thousands of dollars)Year Ending
Year Ending June 30, 2003 June 30, 2005Orig. & Transfers & 2004
(S)Supple– Reapp. & (E)Emer– Total Adjusted Recom–mental (R)Recpts. gencies Available Expended Approp. Requested mended
8,642 354 –2 8,994 8,994 Department of Agriculture 8,642 9,968 9,96818,042 67,279 ––– 85,321 24,780 Department of Community Affairs 54,996 53,196 53,196
2,659,086 68,940 –243,918 2,484,108 2,473,259 Department of Education 3,015,823 2,778,027 2,778,0274,406 15,531 39 19,976 19,974 Department of Environmental Protection 4,258 9,011 9,011
50,969 ––– –88 50,881 50,024 Department of Health and Senior Services 58,454 68,954 68,954283,352 6,923 22,876 313,151 300,990 Department of Human Services 300,722 338,210 338,210
14,872 ––– 2,031 16,903 8,291 Department of Law and Public Safety 15,109 4,820 4,82016,931 ––– –1,218 15,713 15,589 Department of State 16,827 24,742 16,827
233,366 ––– ––– 233,366 224,236 Department of the Treasury 265,832 305,855 282,355
3,289,666 159,027 –220,280 3,228,413 3,126,137 Total Appropriation 3,740,663 3,592,783 3,561,368
105
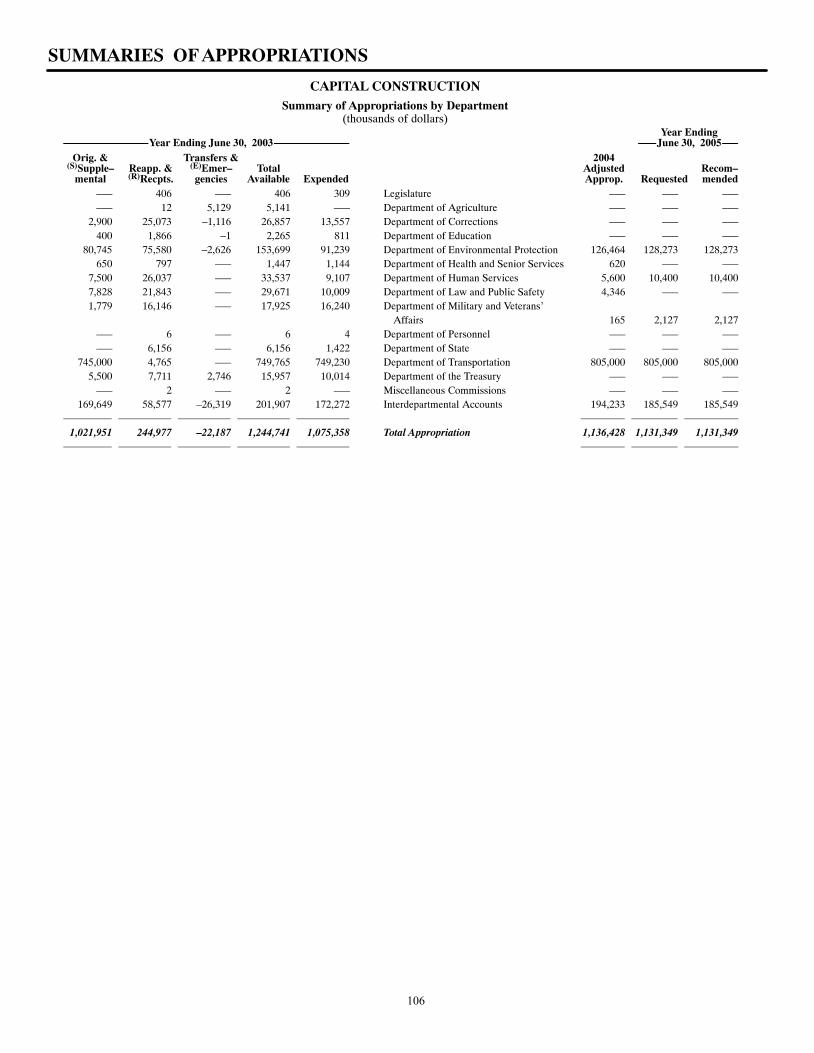
SUMMARIES OF APPROPRIATIONS
CAPITAL CONSTRUCTIONSummary of Appropriations by Department
(thousands of dollars)Year Ending
Year Ending June 30, 2003 June 30, 2005Orig. & Transfers & 2004
(S)Supple– Reapp. & (E)Emer– Total Adjusted Recom–mental (R)Recpts. gencies Available Expended Approp. Requested mended
––– 406 ––– 406 309 Legislature ––– ––– –––––– 12 5,129 5,141 ––– Department of Agriculture ––– ––– –––
2,900 25,073 –1,116 26,857 13,557 Department of Corrections ––– ––– –––400 1,866 –1 2,265 811 Department of Education ––– ––– –––
80,745 75,580 –2,626 153,699 91,239 Department of Environmental Protection 126,464 128,273 128,273650 797 ––– 1,447 1,144 Department of Health and Senior Services 620 ––– –––
7,500 26,037 ––– 33,537 9,107 Department of Human Services 5,600 10,400 10,4007,828 21,843 ––– 29,671 10,009 Department of Law and Public Safety 4,346 ––– –––1,779 16,146 ––– 17,925 16,240 Department of Military and Veterans’
Affairs 165 2,127 2,127––– 6 ––– 6 4 Department of Personnel ––– ––– –––––– 6,156 ––– 6,156 1,422 Department of State ––– ––– –––
745,000 4,765 ––– 749,765 749,230 Department of Transportation 805,000 805,000 805,0005,500 7,711 2,746 15,957 10,014 Department of the Treasury ––– ––– –––
––– 2 ––– 2 ––– Miscellaneous Commissions ––– ––– –––169,649 58,577 –26,319 201,907 172,272 Interdepartmental Accounts 194,233 185,549 185,549
1,021,951 244,977 –22,187 1,244,741 1,075,358 Total Appropriation 1,136,428 1,131,349 1,131,349
106
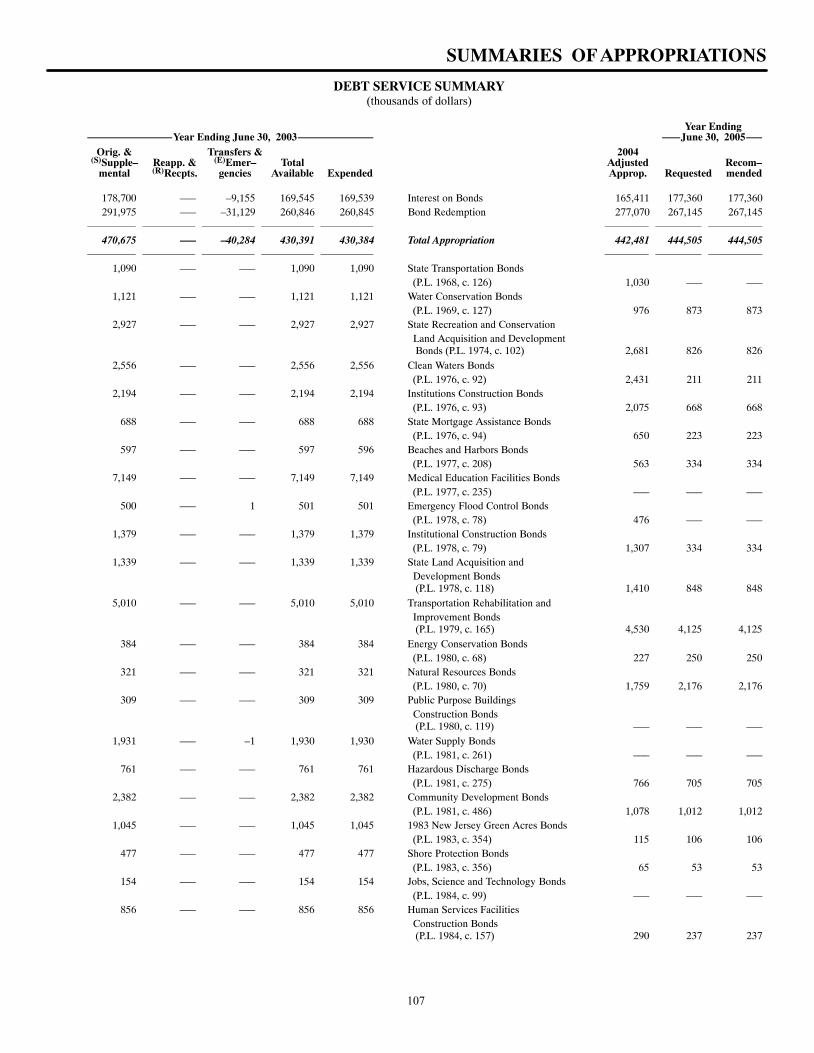
SUMMARIES OF APPROPRIATIONS
DEBT SERVICE SUMMARY(thousands of dollars)
Year EndingYear Ending June 30, 2003 June 30, 2005
Orig. & Transfers & 2004(S)Supple– Reapp. & (E)Emer– Total Adjusted Recom–
mental (R)Recpts. gencies Available Expended Approp. Requested mended
178,700 ––– –9,155 169,545 169,539 Interest on Bonds 165,411 177,360 177,360 291,975 ––– –31,129 260,846 260,845 Bond Redemption 277,070 267,145 267,145
470,675 ––– –40,284 430,391 430,384 Total Appropriation 442,481 444,505 444,505
1,090 ––– ––– 1,090 1,090 State Transportation Bonds
(P.L. 1968, c. 126) 1,030 ––– ––– 1,121 ––– ––– 1,121 1,121 Water Conservation Bonds
(P.L. 1969, c. 127) 976 873 873 2,927 ––– ––– 2,927 2,927 State Recreation and Conservation
Land Acquisition and Development Bonds (P.L. 1974, c. 102) 2,681 826 826
2,556 ––– ––– 2,556 2,556 Clean Waters Bonds (P.L. 1976, c. 92) 2,431 211 211
2,194 ––– ––– 2,194 2,194 Institutions Construction Bonds (P.L. 1976, c. 93) 2,075 668 668
688 ––– ––– 688 688 State Mortgage Assistance Bonds (P.L. 1976, c. 94) 650 223 223
597 ––– ––– 597 596 Beaches and Harbors Bonds (P.L. 1977, c. 208) 563 334 334
7,149 ––– ––– 7,149 7,149 Medical Education Facilities Bonds (P.L. 1977, c. 235) ––– ––– –––
500 ––– 1 501 501 Emergency Flood Control Bonds (P.L. 1978, c. 78) 476 ––– –––
1,379 ––– ––– 1,379 1,379 Institutional Construction Bonds (P.L. 1978, c. 79) 1,307 334 334
1,339 ––– ––– 1,339 1,339 State Land Acquisition and Development Bonds (P.L. 1978, c. 118) 1,410 848 848
5,010 ––– ––– 5,010 5,010 Transportation Rehabilitation and Improvement Bonds (P.L. 1979, c. 165) 4,530 4,125 4,125
384 ––– ––– 384 384 Energy Conservation Bonds (P.L. 1980, c. 68) 227 250 250
321 ––– ––– 321 321 Natural Resources Bonds (P.L. 1980, c. 70) 1,759 2,176 2,176
309 ––– ––– 309 309 Public Purpose Buildings Construction Bonds (P.L. 1980, c. 119) ––– ––– –––
1,931 ––– –1 1,930 1,930 Water Supply Bonds (P.L. 1981, c. 261) ––– ––– –––
761 ––– ––– 761 761 Hazardous Discharge Bonds (P.L. 1981, c. 275) 766 705 705
2,382 ––– ––– 2,382 2,382 Community Development Bonds (P.L. 1981, c. 486) 1,078 1,012 1,012
1,045 ––– ––– 1,045 1,045 1983 New Jersey Green Acres Bonds (P.L. 1983, c. 354) 115 106 106
477 ––– ––– 477 477 Shore Protection Bonds (P.L. 1983, c. 356) 65 53 53
154 ––– ––– 154 154 Jobs, Science and Technology Bonds (P.L. 1984, c. 99) ––– ––– –––
856 ––– ––– 856 856 Human Services Facilities Construction Bonds (P.L. 1984, c. 157) 290 237 237
107
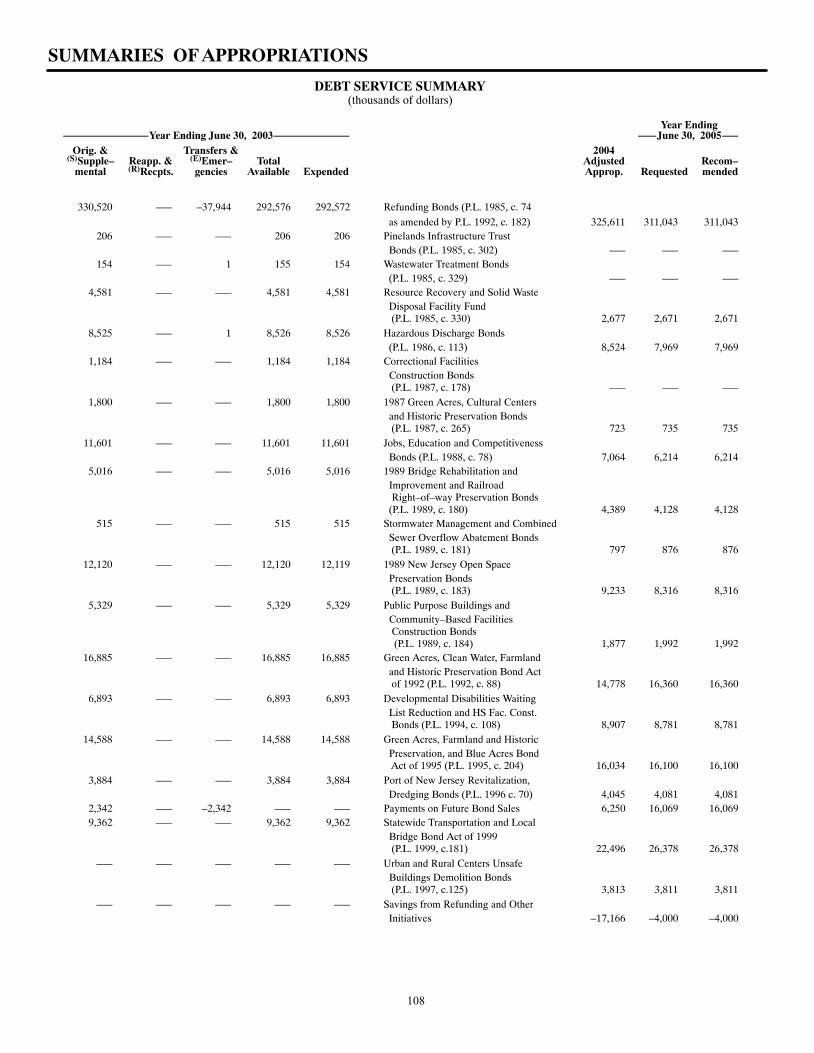
SUMMARIES OF APPROPRIATIONS
DEBT SERVICE SUMMARY (thousands of dollars)
Year EndingYear Ending June 30, 2003 June 30, 2005
Orig. & Transfers & 2004(S)Supple– Reapp. & (E)Emer– Total Adjusted Recom–
mental (R)Recpts. gencies Available Expended Approp. Requested mended
330,520 ––– –37,944 292,576 292,572 Refunding Bonds (P.L. 1985, c. 74
as amended by P.L. 1992, c. 182) 325,611 311,043 311,043 206 ––– ––– 206 206 Pinelands Infrastructure Trust
Bonds (P.L. 1985, c. 302) ––– ––– ––– 154 ––– 1 155 154 Wastewater Treatment Bonds
(P.L. 1985, c. 329) ––– ––– ––– 4,581 ––– ––– 4,581 4,581 Resource Recovery and Solid Waste
Disposal Facility Fund (P.L. 1985, c. 330) 2,677 2,671 2,671
8,525 ––– 1 8,526 8,526 Hazardous Discharge Bonds (P.L. 1986, c. 113) 8,524 7,969 7,969
1,184 ––– ––– 1,184 1,184 Correctional Facilities Construction Bonds (P.L. 1987, c. 178) ––– ––– –––
1,800 ––– ––– 1,800 1,800 1987 Green Acres, Cultural Centers and Historic Preservation Bonds (P.L. 1987, c. 265) 723 735 735
11,601 ––– ––– 11,601 11,601 Jobs, Education and Competitiveness Bonds (P.L. 1988, c. 78) 7,064 6,214 6,214
5,016 ––– ––– 5,016 5,016 1989 Bridge Rehabilitation and Improvement and Railroad Right–of–way Preservation Bonds (P.L. 1989, c. 180) 4,389 4,128 4,128
515 ––– ––– 515 515 Stormwater Management and Combined Sewer Overflow Abatement Bonds (P.L. 1989, c. 181) 797 876 876
12,120 ––– ––– 12,120 12,119 1989 New Jersey Open Space Preservation Bonds (P.L. 1989, c. 183) 9,233 8,316 8,316
5,329 ––– ––– 5,329 5,329 Public Purpose Buildings and Community–Based Facilities Construction Bonds (P.L. 1989, c. 184) 1,877 1,992 1,992
16,885 ––– ––– 16,885 16,885 Green Acres, Clean Water, Farmland and Historic Preservation Bond Act of 1992 (P.L. 1992, c. 88) 14,778 16,360 16,360
6,893 ––– ––– 6,893 6,893 Developmental Disabilities Waiting List Reduction and HS Fac. Const. Bonds (P.L. 1994, c. 108) 8,907 8,781 8,781
14,588 ––– ––– 14,588 14,588 Green Acres, Farmland and Historic Preservation, and Blue Acres Bond Act of 1995 (P.L. 1995, c. 204) 16,034 16,100 16,100
3,884 ––– ––– 3,884 3,884 Port of New Jersey Revitalization, Dredging Bonds (P.L. 1996 c. 70) 4,045 4,081 4,081
2,342 ––– –2,342 ––– ––– Payments on Future Bond Sales 6,250 16,069 16,069 9,362 ––– ––– 9,362 9,362 Statewide Transportation and Local
Bridge Bond Act of 1999 (P.L. 1999, c.181) 22,496 26,378 26,378
––– ––– ––– ––– ––– Urban and Rural Centers Unsafe Buildings Demolition Bonds (P.L. 1997, c.125) 3,813 3,811 3,811
––– ––– ––– ––– ––– Savings from Refunding and Other Initiatives –17,166 –4,000 –4,000
108
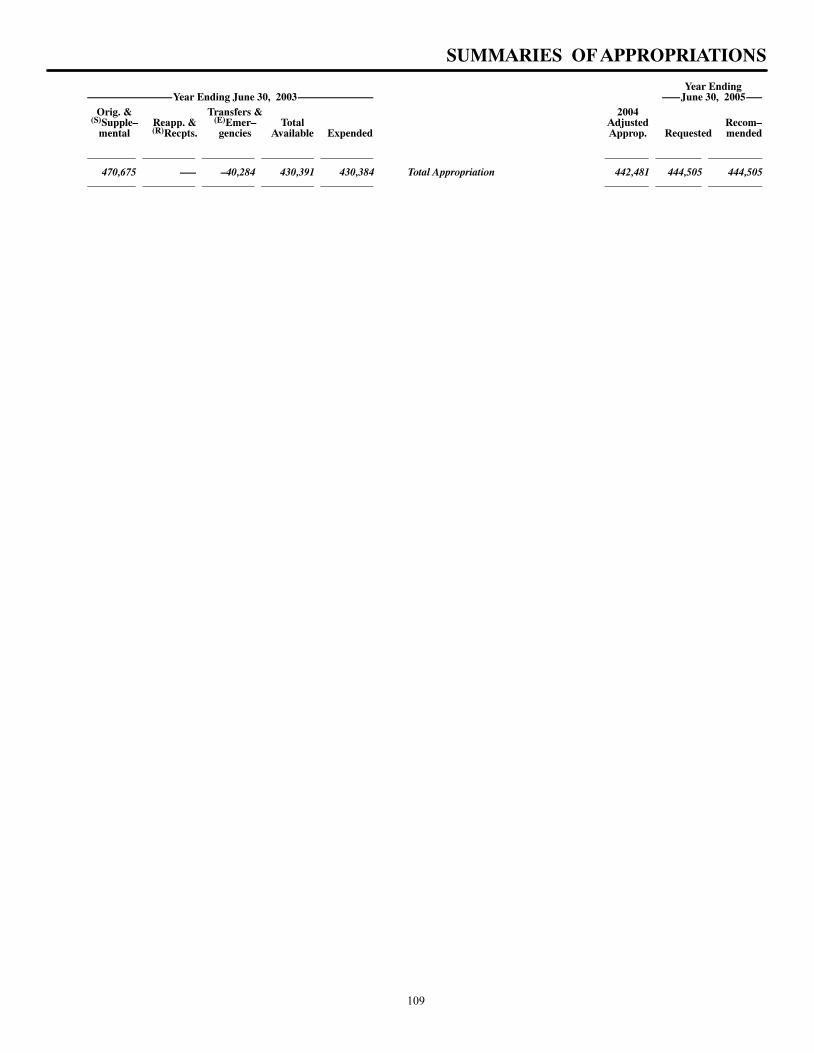
SUMMARIES OF APPROPRIATIONS
Year EndingYear Ending June 30, 2003 June 30, 2005
Orig. & Transfers & 2004(S)Supple– Reapp. & (E)Emer– Total Adjusted Recom–
mental (R)Recpts. gencies Available Expended Approp. Requested mended
470,675 ––– –40,284 430,391 430,384 Total Appropriation 442,481 444,505 444,505
109
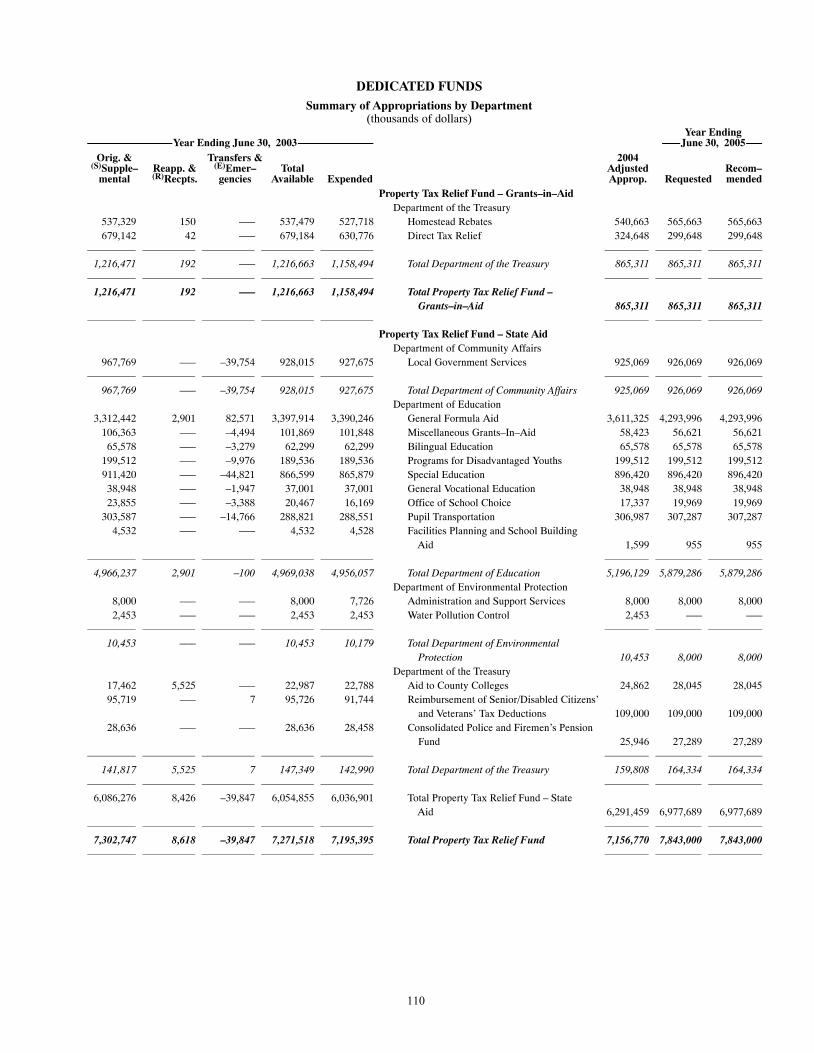
DEDICATED FUNDSSummary of Appropriations by Department
(thousands of dollars)Year Ending
Year Ending June 30, 2003 June 30, 2005Orig. & Transfers & 2004
(S)Supple– Reapp. & (E)Emer– Total Adjusted Recom–mental (R)Recpts. gencies Available Expended Approp. Requested mended
Property Tax Relief Fund – Grants–in–AidDepartment of the Treasury
537,329 150 ––– 537,479 527,718 Homestead Rebates 540,663 565,663 565,663679,142 42 ––– 679,184 630,776 Direct Tax Relief 324,648 299,648 299,648
1,216,471 192 ––– 1,216,663 1,158,494 Total Department of the Treasury 865,311 865,311 865,311
1,216,471 192 ––– 1,216,663 1,158,494 Total Property Tax Relief Fund –
Grants–in–Aid 865,311 865,311 865,311
Property Tax Relief Fund – State AidDepartment of Community Affairs
967,769 ––– –39,754 928,015 927,675 Local Government Services 925,069 926,069 926,069
967,769 ––– –39,754 928,015 927,675 Total Department of Community Affairs 925,069 926,069 926,069Department of Education
3,312,442 2,901 82,571 3,397,914 3,390,246 General Formula Aid 3,611,325 4,293,996 4,293,996106,363 ––– –4,494 101,869 101,848 Miscellaneous Grants–In–Aid 58,423 56,621 56,621
65,578 ––– –3,279 62,299 62,299 Bilingual Education 65,578 65,578 65,578199,512 ––– –9,976 189,536 189,536 Programs for Disadvantaged Youths 199,512 199,512 199,512911,420 ––– –44,821 866,599 865,879 Special Education 896,420 896,420 896,42038,948 ––– –1,947 37,001 37,001 General Vocational Education 38,948 38,948 38,94823,855 ––– –3,388 20,467 16,169 Office of School Choice 17,337 19,969 19,969
303,587 ––– –14,766 288,821 288,551 Pupil Transportation 306,987 307,287 307,2874,532 ––– ––– 4,532 4,528 Facilities Planning and School Building
Aid 1,599 955 955
4,966,237 2,901 –100 4,969,038 4,956,057 Total Department of Education 5,196,129 5,879,286 5,879,286Department of Environmental Protection
8,000 ––– ––– 8,000 7,726 Administration and Support Services 8,000 8,000 8,0002,453 ––– ––– 2,453 2,453 Water Pollution Control 2,453 ––– –––
10,453 ––– ––– 10,453 10,179 Total Department of Environmental
Protection 10,453 8,000 8,000Department of the Treasury
17,462 5,525 ––– 22,987 22,788 Aid to County Colleges 24,862 28,045 28,04595,719 ––– 7 95,726 91,744 Reimbursement of Senior/Disabled Citizens’
and Veterans’ Tax Deductions 109,000 109,000 109,00028,636 ––– ––– 28,636 28,458 Consolidated Police and Firemen’s Pension
Fund 25,946 27,289 27,289
141,817 5,525 7 147,349 142,990 Total Department of the Treasury 159,808 164,334 164,334
6,086,276 8,426 –39,847 6,054,855 6,036,901 Total Property Tax Relief Fund – State Aid 6,291,459 6,977,689 6,977,689
7,302,747 8,618 –39,847 7,271,518 7,195,395 Total Property Tax Relief Fund 7,156,770 7,843,000 7,843,000
110
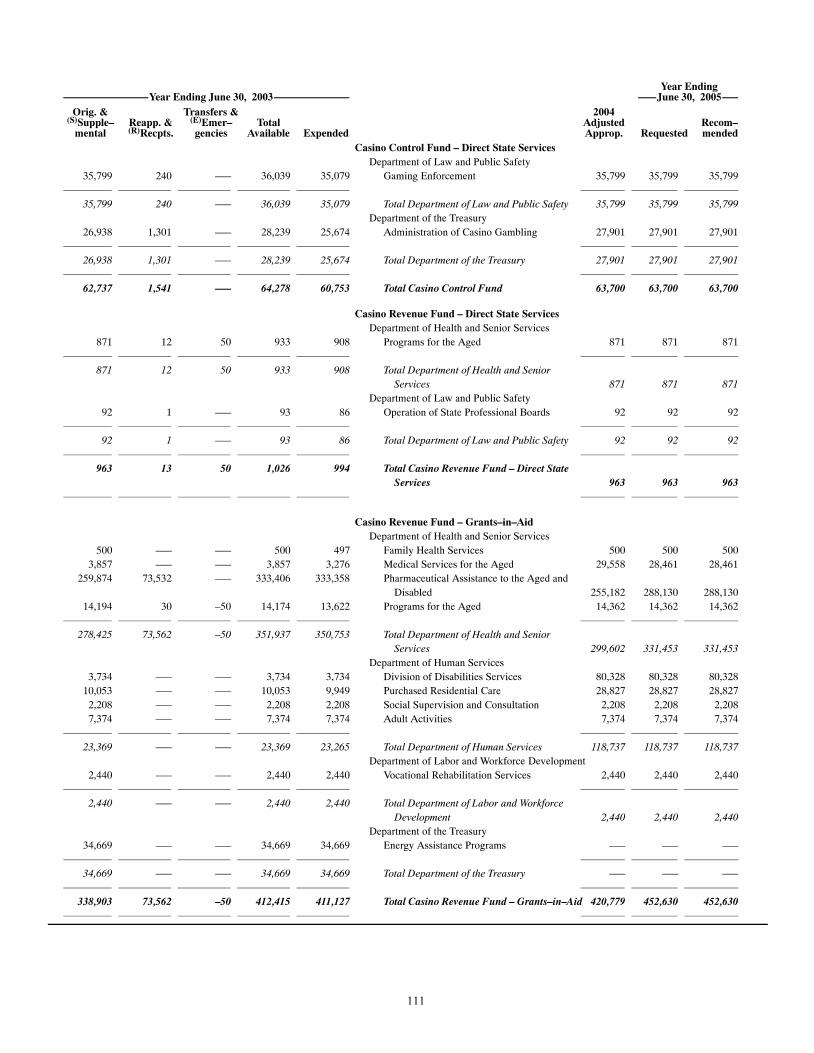
Year EndingYear Ending June 30, 2003 June 30, 2005
Orig. & Transfers & 2004(S)Supple– Reapp. & (E)Emer– Total Adjusted Recom–
mental (R)Recpts. gencies Available Expended Approp. Requested mendedCasino Control Fund – Direct State Services
Department of Law and Public Safety35,799 240 ––– 36,039 35,079 Gaming Enforcement 35,799 35,799 35,799
35,799 240 ––– 36,039 35,079 Total Department of Law and Public Safety 35,799 35,799 35,799
Department of the Treasury26,938 1,301 ––– 28,239 25,674 Administration of Casino Gambling 27,901 27,901 27,901
26,938 1,301 ––– 28,239 25,674 Total Department of the Treasury 27,901 27,901 27,901
62,737 1,541 ––– 64,278 60,753 Total Casino Control Fund 63,700 63,700 63,700
Casino Revenue Fund – Direct State ServicesDepartment of Health and Senior Services
871 12 50 933 908 Programs for the Aged 871 871 871
871 12 50 933 908 Total Department of Health and Senior Services 871 871 871
Department of Law and Public Safety92 1 ––– 93 86 Operation of State Professional Boards 92 92 92
92 1 ––– 93 86 Total Department of Law and Public Safety 92 92 92
963 13 50 1,026 994 Total Casino Revenue Fund – Direct State
Services 963 963 963
Casino Revenue Fund – Grants–in–AidDepartment of Health and Senior Services
500 ––– ––– 500 497 Family Health Services 500 500 5003,857 ––– ––– 3,857 3,276 Medical Services for the Aged 29,558 28,461 28,461
259,874 73,532 ––– 333,406 333,358 Pharmaceutical Assistance to the Aged and Disabled 255,182 288,130 288,130
14,194 30 –50 14,174 13,622 Programs for the Aged 14,362 14,362 14,362
278,425 73,562 –50 351,937 350,753 Total Department of Health and Senior Services 299,602 331,453 331,453
Department of Human Services3,734 ––– ––– 3,734 3,734 Division of Disabilities Services 80,328 80,328 80,328
10,053 ––– ––– 10,053 9,949 Purchased Residential Care 28,827 28,827 28,8272,208 ––– ––– 2,208 2,208 Social Supervision and Consultation 2,208 2,208 2,2087,374 ––– ––– 7,374 7,374 Adult Activities 7,374 7,374 7,374
23,369 ––– ––– 23,369 23,265 Total Department of Human Services 118,737 118,737 118,737
Department of Labor and Workforce Development2,440 ––– ––– 2,440 2,440 Vocational Rehabilitation Services 2,440 2,440 2,440
2,440 ––– ––– 2,440 2,440 Total Department of Labor and Workforce
Development 2,440 2,440 2,440Department of the Treasury
34,669 ––– ––– 34,669 34,669 Energy Assistance Programs ––– ––– –––
34,669 ––– ––– 34,669 34,669 Total Department of the Treasury ––– ––– –––
338,903 73,562 –50 412,415 411,127 Total Casino Revenue Fund – Grants–in–Aid 420,779 452,630 452,630
111
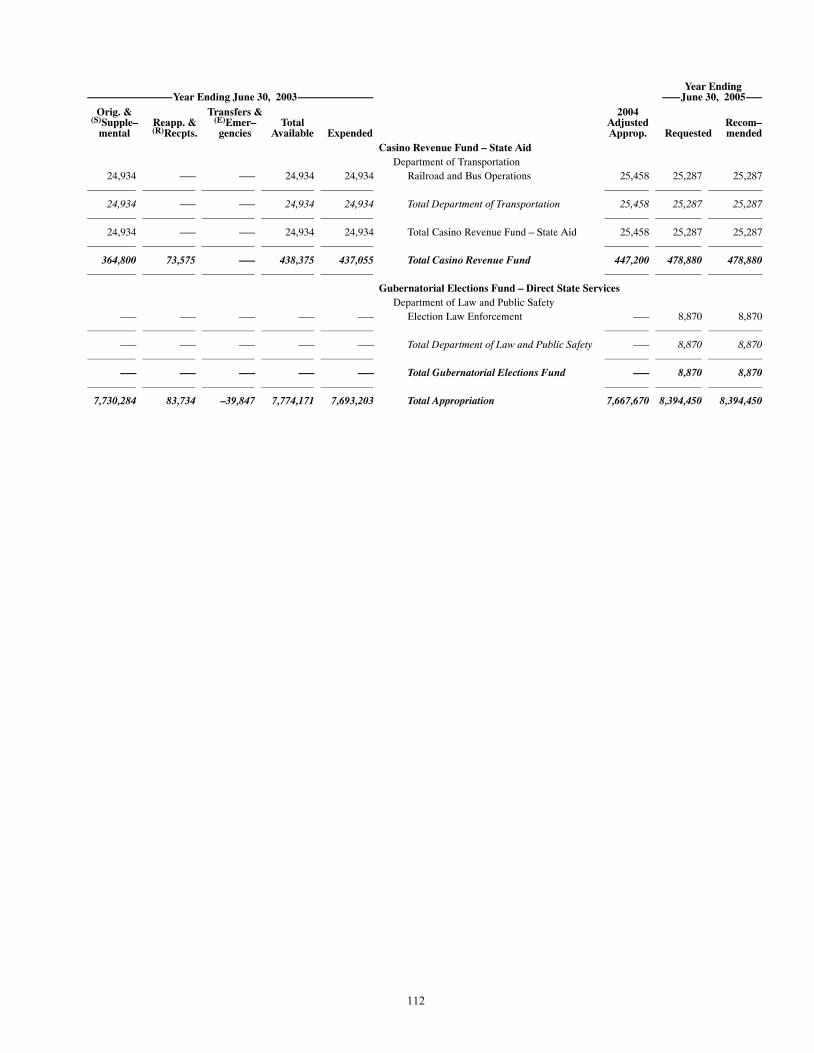
Year EndingYear Ending June 30, 2003 June 30, 2005
Orig. & Transfers & 2004(S)Supple– Reapp. & (E)Emer– Total Adjusted Recom–
mental (R)Recpts. gencies Available Expended Approp. Requested mendedCasino Revenue Fund – State Aid
Department of Transportation24,934 ––– ––– 24,934 24,934 Railroad and Bus Operations 25,458 25,287 25,287
24,934 ––– ––– 24,934 24,934 Total Department of Transportation 25,458 25,287 25,287
24,934 ––– ––– 24,934 24,934 Total Casino Revenue Fund – State Aid 25,458 25,287 25,287
364,800 73,575 ––– 438,375 437,055 Total Casino Revenue Fund 447,200 478,880 478,880
Gubernatorial Elections Fund – Direct State Services
Department of Law and Public Safety––– ––– ––– ––– ––– Election Law Enforcement ––– 8,870 8,870
––– ––– ––– ––– ––– Total Department of Law and Public Safety ––– 8,870 8,870
––– ––– ––– ––– ––– Total Gubernatorial Elections Fund ––– 8,870 8,870
7,730,284 83,734 –39,847 7,774,171 7,693,203 Total Appropriation 7,667,670 8,394,450 8,394,450
112