Embed Size (px)
Citation preview

1
First Report of Charge-Transfer Induced Heat-set Hydrogel. Structural
Insights and Remarkable Properties
Subham Bhattacharjee,a Bappa Maiti,
b and Santanu Bhattacharya*
bc
aPresent address: The Department of Chemical Engineering and Chemistry, Eindhoven
University of Technology, P.O. Box 513, 5600 MB Eindhoven, The Netherlands.
bDepartment of Organic Chemistry, Indian Institute of Science, Bangalore, Karnataka
560012, India.
cDirector’s Research Unit, Indian Association for the Cultivation of Science, Kolkata
700032, India. E-mail: [email protected], [email protected]; Tel: +91 (0)33 2473
4688.
1. Physical Measurements and Instrumentation.
Materials and Methods: All chemicals, solvents and silica gel for TLC were obtained from well-known
commercial sources and were used without further purification, as appropriate. Solvents were distilled and dried
by standard procedure before use. Melting points was measured in open capillaries and were uncorrected. 1H-
NMR and 13C-NMR spectra were recorded in Bruker-400 Advance NMR spectrometer. Chemical shifts were
reported in ppm downfield from the internal standard tetramethylsilane (TMS). Mass spectrometry of individual
compounds was performed using a MicroMass ESI-TOF MS instrument. Elemental analysis was recorded in
Thermo Finnigan EA FLASH 1112 SERIES.
Gelation Studies. A detailed procedure leading to the formation of RT-gels as well as the heat-set gels is
presented in the main paper. The formation of the gel was confirmed using a tube inversion method. If a gel was
formed, it was evaluated quantitatively by determining the critical gelator concentration (CGC) which is the
minimum amount of gelator required to immobilize 1 mL of a particular solvent or solvent mixtures.
FT-IR Spectroscopy. Solution of the compounds were drop-cast on the CaF2 cell and dried under vacuum and
the spectra were recorded in Perkin Elmer Spectrum BX FT-IR system.
UV-Vis absorption and Fluorescence Spectroscopy. The UV-Vis and fluorescence spectra of various solution
and gel were recorded on a Shimadzu model 2100 spectrophotometer and Hitachi F-4500 spectrofluorimeter
respectively, both equipped with a temperature-controller bath.
Scanning Electron Microscopy (SEM). The gels were carefully drop-coated onto the brass stubs and were
allowed to freeze-dry overnight. The freeze-dried samples were then coated with gold vapor and analyzed on a
Quanta 200 SEM operated at 10-15 kV.
Transmission Electron Microscopy (TEM). Solutions of the gelator were drop-casted on carbon-coated
copper grid and then carefully air-dried. Samples were stained with 0.1% uranyl acetate solution. TEM image
were taken at an accelerating voltage of 200 kV using a TECNAI F30.
Dynamic Light Scattering (DLS). DLS measurements were performed at room temperature using a Malvern
Zetasizer Nano ZS particle sizer (Malvern Instruments Inc., Westborough, MA). Samples were prepared and
Electronic Supplementary Material (ESI) for Nanoscale.This journal is © The Royal Society of Chemistry 2016

2
examined under dust-free conditions. Average hydrodynamic diameters (Dh) reported were obtained from the
Gaussian analysis of the intensity-weighted particle size distributions.
1H NMR Spectroscopy of the CT Hydrogel. In order to avoid DMF for the 1H-NMR study, the solvents in the
hydrogel were removed using high vacuum pump to yield a film of a dark colored solid. Dispersion of the solid
in D2O by both sonication and vortexing afforded a deep violet colored, hydrogel instantaneously, which was
used for the 1H NMR spectroscopic studies.
Rheological Studies. For rheology experiment of the gels, an Anton Paar 100 rheometer with a cone and plate
geometry (CP 25-2) having an adjustable peltier temperature controlling system was used. All the measurements
were done fixing the gap distance between the cone and the plate at 0.05 mm. The gels were scooped on the
plate of the rheometer. An oscillatory strain amplitude sweep experiment was performed at a constant oscillation
frequency of 1 Hz for the applied strain range 0.001-400 % at 20 °C. The software US-200 converted the torque
measurements into either Gʹ (the storage modulus) and Gʺ (the loss modulus) and represent Gʹ and Gʺ with
either strain or shear stress.
Oscillatory frequency sweep experiments were performed in the linear viscoelastic region (strain 0.01%) to
ensure that calculated parameters correspond to an intact network structures.
A thixotropic loop test has been carried out by applying a successive low-high strain separated by sufficient time
interval to ensure a complete gel-to-sol and sol-to-gel transition. Interestingly the sol obtained after applying
high strain, transforms into a robust gel on relaxing the high strain. This provides a concrete evidence of the
thixotropic behavior of the halogel.
Differential Scanning Calorimetry (DSC). Solid phase DSC experiment of Py-D was performed using a
differential scanning calorimeter (DSC; Perkin-Elmer, Model Pyris 1D) with heating and cooling rate fixed at 2
ºC min-1. This technique was used to detect the thermal transitions and to monitor the rate of heat flow from the
sample during phase change.
Polarized Optical Microscopy (POM). The change in the birefringent texture of Py-D during thermal phase
transition was followed under polarized optical microscope (Olympus BX51) equipped with a heating stage
(Mettler FP82HT) and a central processor (Mettler FP90). Before experiment, ~0.2 mg sample was placed on a
glass slide and covered with a piece of cover slip. The sample was heated (~80 ºC) until it reached the isotropic
state and then it was cooled slowly to 25 ºC with a cooling rate of 1 ºC min-1. Repeated heating and cooling
cycles were performed to confirm the reproducibility of the phases appeared under POM.
X-ray Diffraction. Gels were scooped onto glass slide and dried under vacuum for the corresponding XRD
measurement. For the solid sample of Py-D, the compound was annealed at its associated isotropic temperature
and subsequently used for the XRD measurement. These samples were analyzed using a Bruker D8 Advance
instrument (θ, 2θ geometry with scintillation detectors). The X-ray beam generated with rotating Cu anode at the
wavelength of KR beam at 1.5418Ǻ was directed toward the film edge and scanning was done up to a 2θ value
of 30°. Data were analyzed and interpreted using the Bragg equation.
Single Crystal X-ray Diffraction. Single crystal X-ray data for NDI-A and 1:1 Pyrene:NDI-A co-crystal was
collected on a Bruker SMART APEX CCD diffractometer using the SMART/SAINT softwareS1 at 293 K and
100 K respectively. Intensity data were collected using graphite-monochromatized Mo-Kradiation (0.71073 Å)
at 293 K. The structures were solved by direct methods using the SHELX-97S2 program incorporated into
WinGX.S3 Empirical absorption corrections were applied with SADABS.S4 Refinement of coordinates and
anisotropic thermal parameters of non-hydrogen atoms were performed using the full-matrix least-squares
method.
It is important to note that the R-Factor (%) of the 1:1 Pyrene:NDI-A co-crystal was 14.17. Our impression is
that the co-crystal contains solvent molecules in its unit cell. We have attempted to assign those solvent
molecules during solving the crystal structure using WinGX software. However, we have failed to do the same

3
even after several attempts. We have also grown the co-crystal several times and subsequently collected the data
at 100 K. Despite all these attempts the R-Factor of the co-crystal could not be reduced.
2. Synthesis and Characterization. The synthesis of compound 1 was carried out according to a reported
procedure.(S5) Synthetic scheme of Py-D, NDI-A and NDI-A 1 are shown below.
Synthetic Scheme.
Reagents, reaction conditions, and yields: (a) 1-Pyrenecarboxaldehyde, 1, 1:1 MeOH/THF, reflux, 4 h, yield
= 95%; (b) 1,4,5,8-napthalenetetracarboxylic dianhydride, isoniazid, DMF, 140 °C, 12 h, yield = 90%; (c)
1,4,5,8-napthalenetetracarboxylic dianhydride, 4-aminopyridine, DMF, 140 °C, 12 h, yield = 81%
Synthesis of Py-D: A mixture of 1-Pyrenecarboxaldehyde (1g, 4.3 mmol) and compound 1 (2.7 g, 4.3 mmol) in
dry MeOH/THF (30 ml, 1:1 v/v) was heated at 70 °C for 4 h under nitrogen atmosphere. The crude product was
purified using silica column chromatography using 3% MeOH/CHCl3 and pure Py-D has been obtained in 95 %
yield as a light yellow wax like solid. IR (Neat, cm-1) 3517, 2877, 1645, 1581, 1557, 1498, 1440, 1332, 1215,
1112, 1052, 944, 851; 1H NMR (400 MHz, CDCl3) δ 3.31 (m, 6H), 3.37 (m, 3H), 3.54 (m, 6H), 3.62 (m, 18H),
3.77 (m, 6H), 4.18 (m, 6H), 7.39 (s, 2H), 7.99 (m, 7H), 8.67 (m, 2H), 9.55 (s, 1H), 10.99 (s, 1H); 13C NMR (100
MHz, CDCl3) δ 58.83, 58.92, 68.85, 69.61, 70.38, 70.42, 70.44, 70.52, 70.57, 71.81, 71.85, 72.31, 107.84,
122.06, 124.44, 124.62, 125.07, 125.4, 125.73, 125.97, 126.81, 127.38, 128.21, 128.38, 129.42, 130.40, 131.13,
132.49, 141.69, 152.37, 164.08; HRMS: m/z calcd. for C45H58N2O13 (M+Na)+: 857.39, found: 857.3838;
Elemental analysis: calcd. for C45H58N2O13 : C, 64.73; H, 7; N, 3.36; found: C, 64.41; H, 7.41; N, 3.21.
Synthesis of NDI-A: A mixture of 1,4,5,8-napthalenetetracarboxylic dianhydride (1 g, 3.73 mmol) and
isoniazid (1.02 g, 7.46 mmol) in dry DMF (20 ml) was heated at 140 °C for 12 h under nitrogen atmosphere. A
crystalline solid which was obtained on cooling, was filtered and purified by repeated washing with DMF. The
pure product was obtained in 90% yield as an off-white solid. m.p. > 275 °C; IR (Neat, cm-1) 3578, 3479, 3191,
2850, 1732, 1698, 1582, 1527, 1412, 1291, 1240, 1198, 1126, 984, 846, 757, 584; 1H NMR (400 MHz, DMSO-
d6) δ 7.97 (d, J = 5.6 Hz, 4H), 8.89 (s, 4H), 8.92 (d, J = 5.2 Hz, 4H), 11.97 (s, 2H); 13C NMR (100 MHz,
DMSO-d6) δ 122.48, 127.43, 127.51, 132.59, 139.30, 151.66, 161.63, 164.95; HRMS: m/z calcd. for
C26H14N6O6 (M+Na)+: 529.1, found: 529.0873; Elemental analysis: calcd. for C26H14N6O6 : C, 61.66; H, 2.79; N,
16.59; found: C, 61.93; H, 2.71; N, 16.74.
NNH
O
OO
O
OO
OO
OO
OO
O
NH
O
OO
O
OO
OO
OO
OO
O
H2N
(a)CHO
N N
O
O
O
O
NH
O
HN
O
N
N
O
OO O
O O
N
CONHNH2
(b)
Py-D
NDI-A
1
+
+
N N
O
O
O
OO
OO O
O O
N
NH2
(c)
NDI-A 1
+ N N

4
Synthesis of NDI-A 1: NDI-A 1 was synthesized following a reported procedure.S6 The pure product was
obtained in 81% yield as an off-white solid. m.p. > 275 °C; IR (Neat, cm-1) 3578, 3479, 3191, 2850, 1732, 1698,
1582, 1527, 1412, 1291, 1240, 1198, 1126, 984, 846, 757, 584; 1H NMR (400 MHz, DMSO-d6) δ 7.61 (d, J =
5.2 Hz, 4H), 8.79 (s, 4H), 8.85 (d, J = 5.2 Hz, 4H); HRMS: m/z calcd. for C24H12N4O4 (M+H)+: 421.09, found:
421.0937; Elemental analysis: calcd. for C26H14N6O6 : C, 68.57; H, 2.88; N, 13.33; found: C, 68.61; H, 2.77; N,
13.24.

5
13C-NMR spectra of NDI-A in d6-DMSO
1H-NMR spectra of NDI-A in d6-DMSO

6
HRMS of NDI-A
1H-NMR spectra of Py-D in CDCl3

7
HRMS of Py-D
1H-NMR spectra (only aromatic region) of NDI-A 1 in d6-DMSO
8
Table S1. Crystal data of NDI-A and co-crystal of 1:1 Pyrene:NDI-A.
Crystal
System
NDI-A Crystal 1:1 Pyrene:NDI-A
Co-crystal
CCDC No. 982241 1023064
Formula C26H14N6O6 C42H24N6O6
Formula
weight
506.43 708.67
Crystal system triclinic monoclinic
Space group P -1 P 21/c
T, K 293 100
λ (Mo Kα), Ǻ 0.71073 0.71073
a, Ǻ 8.1387(7) 7.5752(18)
b, Ǻ 10.1108(9) 25.656(5)
c, Ǻ 16.5691(15) 11.692(2)
α, 96.538(5) 90
β, 97.798(5) 100.740(13)
λ, 107.518(5) 90
V, Ǻ3 1270.8(2) 2232.5(8)
Z 2 2
ρcalcd., g cm-3 1.324 1.054
μ, mm-1 0.098 0.073
F(000) 520.0 732.0
GOF 1.076 1.359
R1 [I > 2σ(I)] 0.0547 0.1417
wR2 [I >
2σ(I)]
0.1675 0.4303

9
NN
N
OO
C
C
H-bonding
300 400 500 600
0.0
0.1
0.2
0.3
0.4
Ab
sorb
an
ce
Wavelength (nm)
1.4 equiv. of Ag+
0 equiv. of Ag+
280 350 4200.0
0.2
0.4
Ab
sorb
an
ce
Wavelength (nm)
1:9
2:8
3:7
4:6
5:5
6:4
7:3
8:2
9:1
9.5:0.5
[NDI-A] : [Ag+]
0.0 0.2 0.4 0.6 0.8 1.0
0.0
0.4
0.8
1.2
A
X [
Ag
+]
[NDI]/[{[NDI] + [Ag+]}
0.5
(a) (b)
(c)
Figure S1. Packing arrangement of NDI-A in the single-crystal (viewed along the b-axis).
Figure S2. (a) UV-Vis spectra of NDI-A:Ag+ (at different molar ratios) at a fixed total concentration of 50 μΜ.
(b) Job’s plot of NDI-A with Ag+ in 2:1 v/v DMSO:H2O; For Job’s plot the total concentration of [NDI-A] +
[Ag+] is kept at 0.5 x 10⁻⁴ M. (c) UV-Vis titration of NDI-A (25 μM) in 2:1 v/v DMSO:H2O with the gradual
addition of Ag+.
10
100 μm 30 μm 4 μm
240 320 4000.0
0.3
0.6 Py-D in H2O; 20 M
Py-D in THF; 5 M
Py-D in H2O; 5 M
Ab
sorb
an
ce
Wavelength (nm)
Py-D in THF; 20 M
400 500 600
0.0
2.0x10⁵
4.0x10⁵
6.0x10⁵
Py-D in H2O [Py-D] 0.02 mM
F.
I. (
a.u
.)
Wavelength (nm)
Py-D in THF
(a) (b)
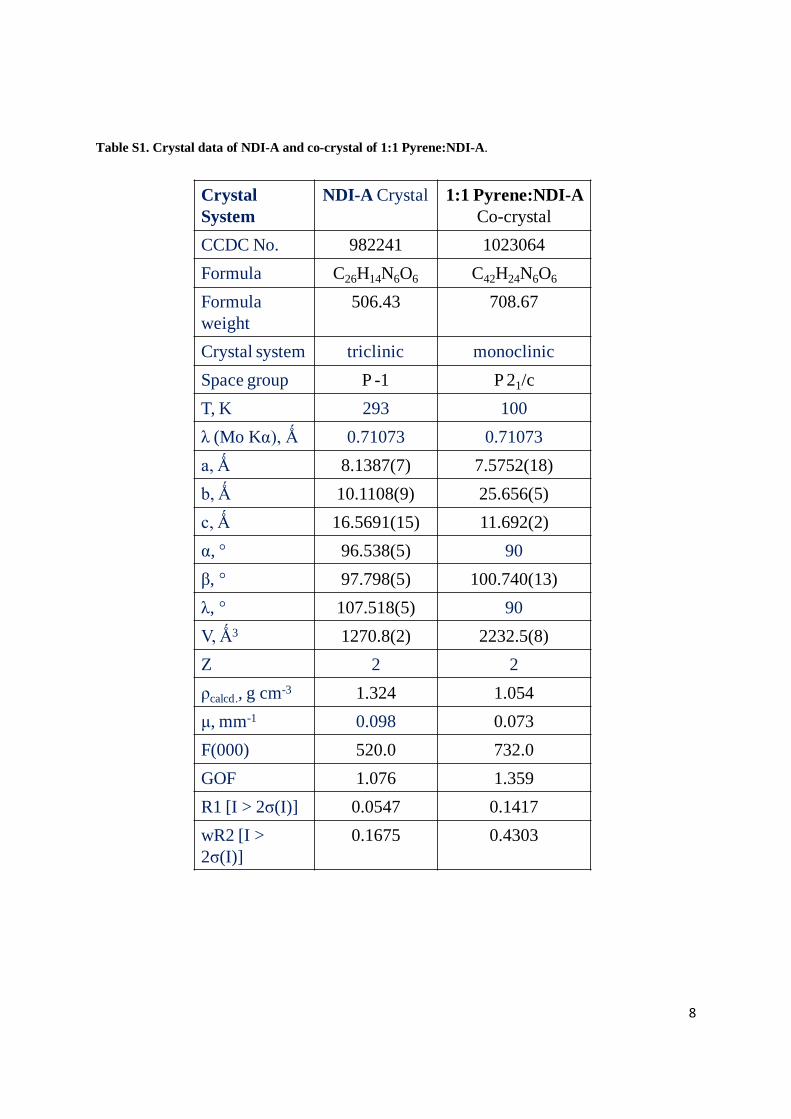
Figure S3. SEM images of 1:2 NDI-A:AgOTf at [NDI-A] = 25 mM from 2:1 v/v DMSO:H2O solution at
different magnifications.
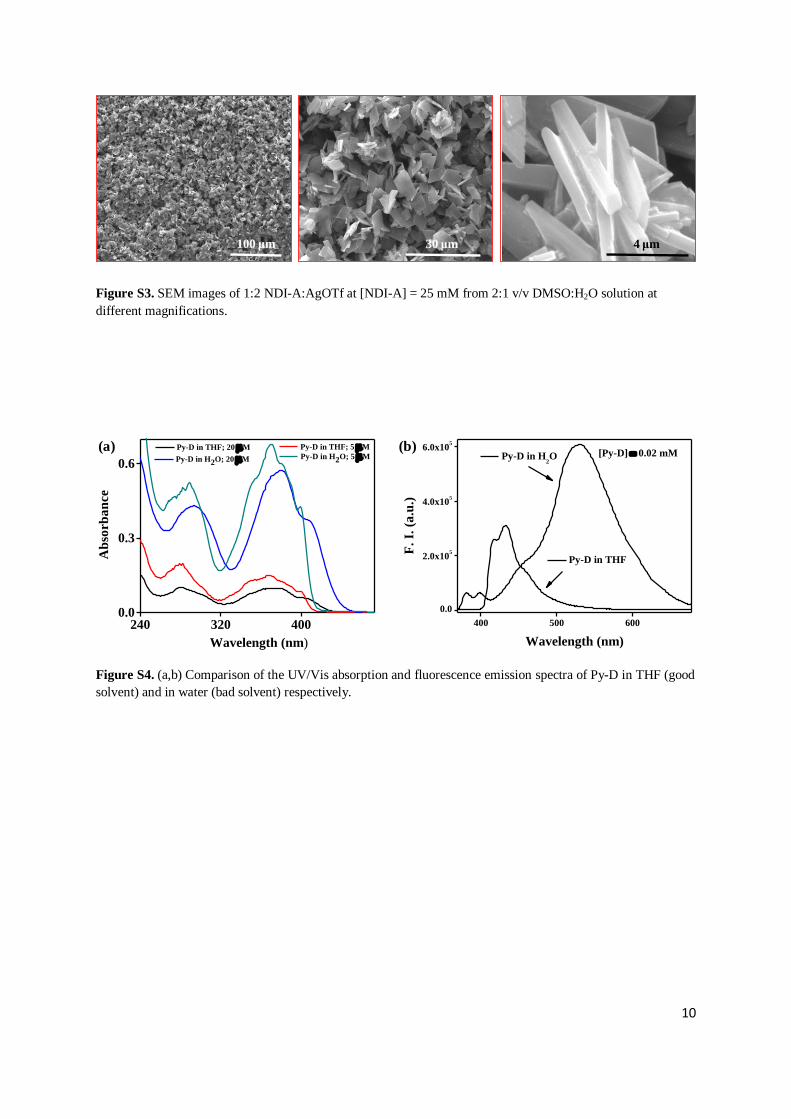
Figure S4. (a,b) Comparison of the UV/Vis absorption and fluorescence emission spectra of Py-D in THF (good
solvent) and in water (bad solvent) respectively.

11
(a)
(b)
(c)
(d)
In THF
In H2O, [Py-D] = 5 μM
In H2O, [Py-D] = 10 μM
In H2O, [Py-D] = 20 μM
30 40 50 60 70 8020
40
60
80
100
51.1 C
2.4 mM
1.2 mM
0.6 mM
0.3 mM
0.15 mM
0.075 mM
0.037 mM
Tra
nsm
itta
nce
Temperature (C)
48 C
52.5 C
[Py-D]
0 2 4 6 8 10 12
20
30
40
50
60
70
80
90
100
@ 795 nm
Tra
nsm
itta
nce (
%)
Cycle450 540 630
0.0
5.0x10⁴
1.0x10⁵
51 C
F.I
. (a
.u.)
Wavelength (nm)
25 C
(a) (b)
25-47 C47.3 C
48-70 C(d)
(c)
Figure S5. (a) Py-D remains as a monomeric form in THF alone. (b) Schematic illustrations of the aggregation
mode of Py-D in H2O at different concentrations. Only a part of the truly existing superstructures i.e, spherical
aggregates has been shown in figure c and d for clarity. The slipped π-π stacking among the Py-D scaffolds in
the aggregates is maintained in the schematic diagrams.
Figure S6. (a) Temperature-dependent transmittance of Py-D solutions at different concentration. (b)
Reversibility of the LCST phenomena of solution of Py-D at a concentration of Py = 2.4 mM. (c) Temperature-
dependent emission spectroscopy of a solution of Py-D at a concentration of Py-D = 0.2 mM below the phase transition temperature. (d) Temperature-dependent measurement of average hydrodynamic diameter (Dh) of a
solution of Py-D at a concentration of Py-D = 2.4 mM.

12
2.7 nm
Figure S7. Variable temperature 1H-NMR spectra (upper panel : aromatic region; lower panel : aliphatic region)
of Py-D at a concentration of Py-D = 2.4 mM. Chemical shift of HDO as a function of temperature has been
assigned following a reported literature.S7
Figure S8. Energy minimized structure of Py-D using B3LYP/6-31 G* level of computation.

13
1 2 3 4 5 6 7
0.0010
0.0015
0.0020
0.0025
0.0030
0.0035
Co
nc.
(M)/
A
1/A1/2
Equation y = a + b*x
Adj. R-Square 0.98504
Value Standard Error
B Intercept 2.47503E-4 1.22919E-4
B Slope 5.26516E-4 3.23781E-5
60 C25 C 70 C 76 C
42 C
31 C 29 C 25 C 23 C
74 C39 C 37 C 35 C
Figure S9. POM images of Py-D were captured during heating (upper panel) and cooling (lower panel) cycle
respectively (sweep rate = 2 °C/min).
Figure S10. Analysis of the data of figure 4b in the manuscript; Conc. (M)/A vs. 1/A1/2 has been plotted and the
association constant (K) was estimated using the following equation as shown below:
C/A = 1/(K€l)1/2 x 1/A1/2 + 1/€l
Where C, A, K, € and l denote concentration, absorbance of the CT-band, association constant, extinction
coefficient and path length (1 cm) of the cuvette respectively.

14
Shaking
Rest
Heat
> 48 C Shaking
Cool &
then
Heating
2:1 Py-D:NDI-A
Cool and RestCool
CGC = [Py-D] = 7.56 mM CGC = [Py-D] = 0.98 mM
> LCST
< LCST
(h)
(a)
(b)
(c) (d)
(e)
(f)
(g)
Figure S11. Photographs showing abolition of the RT-gel of 2:1 Py-D:NDI-A ([Py-D] = 6 mM) to a clear
transparent solution on shaking (Path a). The resultant sol again turns into the native RT-gel on resting (Path b).
The resultant sol, on the other hand, directly transform into the heat-set gel on heating (Path c). Abolition of the
heat-set gel on shaking and reformation of the heat-set gel on cooling of the heated sol and subsequent heating
of the cooled sol has been also demonstrated (Path d,e). The heat-set gel or the heated sol again transformed into
the RT-gel on cooling and rest (Path f,g). (h) Demonstration of LCST transition of 2:1 Py-D:NDI-A solution by
heating the lower part of the solution above the clouding point ([Py-D] = 3 mM).

15
30 40 50 60 70 80
30
40
50
60
70
80
90
100@ 795 nm
[Py-D] = 3 mM
1.5 mM
0.75 mM
0.38 mM
0.19 mM
0.094 mM
0.047 mM
Tra
nsm
itta
nce (
%)
Temperature (C)
2:1 Py-D:NDI-A
20 30 40 50 60 70 8020
30
40
50
60
70
80
90
100
110
[Py-D] = 3 mM
2:1 Py-D:NDI-A @ 795 nm
Up Scan
Down Scan
Tra
nsm
itta
nce (
%)
Temperature (C)
0 2 4 6 8 10 1220
30
40
50
60
70
80
90
100
110
@ 795 nm
Tra
nsm
itta
nce (
%)
Cycle
30 40 50 60 70 8020
40
60
80
100
Temperature (C)
Tra
nsm
itta
nce (
%)
0
500
1000
1500
2000
Dh (n
m)
2:1 Py-D:NDI-A @ 795 nm
[Py-D] = 1.5 mM
(a) (b)
(c) (d)
(e)
25-47 C48 C 49 C 50-70 C
Figure S12. (a) Variable temperature concentration dependence of transmittance of 2:1 Py-D:NDI-A. (b)
Hysteresis (1 °C) of LCST transition between the heating and cooling processes. (c) Reversibility of LCST
phenomena of solution of 2:1 Py-D:NDI-A at a concentration of Py-D = 3 mM. (d) Variable temperature (VT)
DLS measurement of 2:1 Py-D:NDI-A and its comparison with VT transmittance of 2:1 Py-D:NDI-A ([Py-D] =
1.5 mM). (e) Size distribution of the globular aggregates of the 2:1 Py-D:NDI-A before phase transition (25-47
°C), during phase transition (48 °C and 49 °C)) and after phase transition (50-70 °C); ([Py-D] = 1.5 mM).

16
20 C
30 C
40 C
50 C
60 C
70 C
80 C
69 70 71
0.0
0.4
0.8
1.2
1.6
2.0
Ex
cess
Hea
t C
ap
acit
y (
kca
l/m
ol.
K)
Temperature (C)
1:1 Py-D:NDI-A
50 55 60
0.0
0.4
0.8
1.2
1.6
2.0
Ex
cess
Hea
t C
ap
acit
y (
kca
l/m
ol.
K)
Temperature (C)
Py-D alone
2:1 Py-D:NDI-A
Figure S13. Variable temperature 1H-NMR spectra of 1:1 Py-D:NDI-A in D2O at a concentration of Py-D = 10
mM. In order to avoid DMF for the 1H-NMR study, the solvents in the hydrogel were evaporated using high
vacuum pump to yield a film of a dark colored solid. Dispersion of the solid in D2O by both sonication and
vortexing afforded a deep violet colored, hydrogel instantaneously, which was used for the 1H NMR
spectroscopic studies. The 1H-NMR signals at around 8, 2.9 and 3 ppm have appeared due to the presence of
residual DMF in the hydrogel. Chemical shift of HDO as a function of temperature has been assigned following
a reported literature.S7
Figure S14. DSC studies of the solution of Py-D ([Py] = 2.4 mM) alone in water as well as 1:1 Py-D:NDI-A
([Py-D] = 2.4 mM) and 2:1 Py-D:NDI-A ([Py-D] = 6 mM) CT hydrogels.

17
2.7 nm
1 μm 2 μm
(a) (b) (c)
1 10 100
10
100
Py-D:NDI-A
G, 1:1
G, 1:1
G, 2:1
G, 2:1G, G
(P
a)
Angular Frequency (rad/s)
Figure S15. Frequency-sweep rheology data of 1:1 and 2:1 Py-D:NDI-A CT gels ([Py-D] = 10 mM).
Oscillatory frequency sweep experiments were performed in the linear viscoelastic region (strain 0.01%) to
ensure that calculated parameters correspond to an intact network structures. The results indicate that Gʹ remains
always greater than Gʺ and both of them are invariant to the applied angular frequency range.
Figure S16. (a,b) SEM images of 2:1 Py-D:NDI-A system dried below the clouding point of the solution, ([Py-
D] = 0.3 mM). (c) TEM images of the 2:1 Py-D:NDI-A system at [Py-D] = 0.2 mΜ.
Figure S17. An energy minimized structure of 1:1 Py-D:NDI-A based on B3LYP/6-31 G* level of computation.

18
NC
O
N
C
Figure S18. Unit cell of the co-crystal of 1:1 Pyrene:NDI-A viewed along the a-axis showing the long axis of pyrene
molecule (represented with green bonds) was placed between the two NDI-A molecules in a diagonal fashion. H-atoms are omitted for clarity.
Figure S19. Space-filling diagram of the co-crystal showing the molecular channels along the b-axis.
References:
(S1) SMART/SAINT; Bruker AXS, Inc.: Madison, WI, 2004.
(S2) Sheldrick, G. M. Acta Crystallogr. 2008, A64, 112.
(S3) Farrugia, L. J. J. Appl. Crystallogr. 1999, 32, 837.
(S4) Sheldrick, G. M. SADABS; University of Göttingen, Göttingen, Germany, 1999.
(S5) Bhattacharjee, S.; Bhattacharya, S. Chem. Asian J. 2015, 10, 572-580.
(S6) Dinolfo, P. H.; Williams, M. E.; Stern, C. L.; Hupp, J. T. J. Am. Chem. Soc. 2004, 126, 12989-13001.
(S7) Gottlieb, H. E.; Kotlyar, V.; Nudelman, A. J. Org. Chem. 1997, 62, 7512-7515.