Embed Size (px)
Citation preview

Charts on 3rd Quarter 2011/12August 10, 2012
Dr. Heinrich Hiesinger, CEOGuido Kerkhoff, CFO

Developing the future.
Charts on 3rd Quarter 2011/12August 10, 2012
1
Key Figures, Strategic Way Forward and Group Outlook
Group Performance and Financials
Business Area Performance
Conclusion
Agenda

Developing the future.
Charts on 3rd Quarter 2011/12August 10, 2012
2
Group EBIT adj. on similar level qoq
6 of 7 BAs positive, 5 with qoq improvements except
• Steel Americas: inv. writedowns, FX, fuel rate
• Marine Systems: normalized earnings
Capital Goods order intake: underlying trend solid
• Record level at Elevator Technology
• Yoy decline at Marine Systems due to big ticket order in Q3 prior year
Materials order intake: decline price- & volume-driven
Q3 2011/12 Highlights – Continued Operations
Q3
281485
2010/11 2011/12
EBIT adjusted (in €m) not consolidated
MaterialsCapital Goods
570 134
Q2
(108)
453
Group
(118)
444
122
Q3
NFD (in €m)
6,249 5,8006,480
NFD reduction
€1.0 bn FCF from cont’d ops.
Value crystallization by Waupaca divestment
Strategic review Steel Americas in progress
Further divestments: Construction (SE), Berco (CT)
FY outlook confirmed
7,483 6,383
Order intake (in €m) not consolidated
12,984 11,596
7,195 5,064 6,159 4,691
10,231
-21%yoy
-12%qoq
-79%yoy
-9%qoq
MS

Developing the future.
Charts on 3rd Quarter 2011/12August 10, 2012
3
• ET: record order intake in Q3 driven by new inst. in China, India and the US
• PT: project delays at chemical plants
• CT: strong auto-related order intake yoycompensating slowdown of industrial comp. businesses
• MS: big ticket order in Q3 prior year
• SE and MX: lower volumes qoq and yoy
not consolidated
Order intake – continued operations (million €)
11,596
Q32011/12
Q32010/11
10,231
Q2
-21%yoy
Economic Uncertainty Weighing on Orders, Cap Goods Underlying Solid
12,984
Group
3,573
2,990
3,973
3,006
-12%qoq
1,097
1,320
504 1,811
2,155
632
1,541
934
1,858
731 3,235
2,511
413
1,575
832
1,828
456
AM
MX
SEPT
MS
ET
CT
Book-to-bill:>1
~€2 bn submarine order from
Turkish Navy

Developing the future.
Charts on 3rd Quarter 2011/12August 10, 2012
4
Sales – continued operations (million €)
10,613
Q32011/12
Q32010/11
10,710
Q2
-7%yoy
Economic Uncertainty Weighing on Sales, Cap Goods with Modest Growth
11,506
Group
3,408
2,886
3,980
3,518
+1%qoq
943
1,298
4291,779
479
546
1,322
983
1,880
220
3,369
2,900
543
1,429
1,027
1,852
294
not consolidated
• ET: increase driven by Asia and partly Europe & Americas; qoq mainly due to billing; yoy due to business growth
• PT: increase qoq and yoy due to billing of project milestones
• SE and MX: lower volumes qoq and yoy
AM
MX
SE PT
MS
ET
CT

Developing the future.
Charts on 3rd Quarter 2011/12August 10, 2012
5
EBIT – Solid Contribution from Capital Goods, Materials ex AM Positive
EBIT adjusted – continued operations (million €)
Q1 Q3
451
144
484
281
485
Q4
444
205
Q2
2010/11
409
(146)
Q1
2011/12
not consolidated
Materials
Capital Goods
261 435 570 495 83 -9%134
Q2
(108)
453
Group
(35)
Materials margin(excl. Steel Americas)
(118)
444
122
Q3
Capital Goods margin
Materials margin

Developing the future.
Charts on 3rd Quarter 2011/12August 10, 2012
6
200
400
600
800
1,000
J A J O J A J O J A J
200
400
600
800
1,000
1.00
1.50
2.00
2.50
3.00
1.00
1.50
2.00
2.50
3.00
Steel Americas – Underlying Progress in a Challenging Business Environment Diluted by Inventory Writedowns and Translation Effects
BRL/USD
EBIT adjusted in €m
xxxScrap and HRC price development in USD/t
Source: SBB: Scrap #1 Busheling, HRC N. America domestic
HRC
scrap
‘10 ‘11 ‘12
Q3 Q2
2011/122010/11
Q3
(378) (319)(190) (184)
(288)(228)
(262)revenue/mix cost volumes
FX/other
cont’d challengingbusiness env’t
Q4 et seqq.:Focus on• completion of technical
ramp-up• subsequent optimization• certification processes and• increasing exposure
to premium segments
in parallel with Strategic Review
‘12‘11‘10‘09‘08‘07‘06‘05
Sig. depreciationof BRL vs USD
during fiscal Q3
esp. ~€(50) m translationeffect related to BRL-
based sales tax credits,~€30 m compensation payments
esp. ~€(30) m inventory writedowns at CSA;
inefficient bf operations,high fuel rate, low PCI

Developing the future.
Charts on 3rd Quarter 2011/12August 10, 2012
7
mid-termtarget:15%
Elevator – Temporary Margin Dilution by Regional Development
Restructuring in Europe and the US Temporary lower Elevator margin
Sales and margin, Operating Units
EBIT adj. in €m
Sales split/growth Elevator by region
10/1106/07
Europe
Americas
Asia/Pacific
43%
47%
40%
42%
10%18% +102%
+4.9%
+0.8%
4.75.3
+12%
Headcount reduction Spain and US before 2012(US -1,300; Spain -300 employees)Restructuring in 2012:• Efficiency gains in manufacturing
processes• Alignment of structure to changed
market conditions (Southern Europe -300 employees)
• Total restructuring expenses in 2011/12: €50 m
Additional measures in preparation
07/08 09/10 10/1106/07 08/09
07/08 09/10 10/1106/07 08/09
646 641
12.212.5
Americas
SEAME (incl. Spain)
Margin % Sales
11/12E
11/12E
Sales, €bn Growth
Development by region, Operating Units
Americas: normalization of NI margins (past construction boom years)
SEAME: Southern Europe (e.g. Spain)with low NI demand, competitive pricing
Asia/Pacific: strong NI growth• China: increase number of branches
by >50% by 2015• India: new multi-purpose facility
under construction
Margin %
Order intake Elevator on record level
07/08 09/10 10/1106/07 08/09
Order intake, €bn
11/12E
5.35.1
ytd (9M 11/12):China +42%India +18%Americas +21%
07/08 09/10 11/12E10/1106/07 08/09
despiterecent decline, margins still
above Elevator average

Developing the future.
Charts on 3rd Quarter 2011/12August 10, 2012
8
Outlook FY 2011/12 – Continued Operations
Business Areas
Steel Europe
FY2011/12
EBIT adjusted in mid three-digit million euro range
Capex max. €2 bn
NFD: around the same level as in Q3
Group
Q3 Q4EEBIT adjusted, in million €
Steel Americas
Materials Services
Elevator Technology
Plant Technology
Components Technology
Marine Systems
52 Flat
(262)
92
147
140
134
23
Improvements from ramp-up, but offsettingheadwinds from US trading conditions
Flat
Absence of Waupaca earnings contribution and lower capacity utilization (slewing bearings)
Broadly flat
Potential headwinds from trading conditions in Southern Europe
Flat

Developing the future.
Charts on 3rd Quarter 2011/12August 10, 2012
9
Company
Positioning
ThyssenKrupp – Strategic Way Forward
FinancialStabilization
Financing Capacities
Positive FCF
Reduce NFD
Investment-Grade
Dividend
Grow Core Businesses
StrategicPush
Expand market position
Smaller acquisitions: Technologies & Services
Increase R&D spending
Performance Orientation
ChangeManagement
Portfolio Optimization ++ +
Profit & CashImprovement
Continuous benchmarking
Sales growth(price and volume)
Cost & cash control
Increase capital efficiency
Ramp-up & Strategic review Steel Americas
Leadership &Culture
Leadership
Transparency
Mission Statement
Regional development
Innovation
People
Exit Non-Core Businesses
OngoingMetal FormingXervonCivil shipbuilding
AdditionalStainless GlobalWaupacaTailored BlanksBilstein-Group(Springs & Stabilizers)Bilstein-Group (Auto Systems Brazil)
Strategic development
Bilstein-GroupPresta Steering
closed
signed
closed
carved-out
closedclosed
closed
• Strategic review Steel Americas in progress
• Further divestments:
• Construction (Steel Europe)
• Berco (Components Technology)
~90%
completed

Developing the future.
Charts on 3rd Quarter 2011/12August 10, 2012
10
Key Figures, Strategic Way Forward and Group Outlook
Group Performance and Financials
Business Area Performance
Conclusion
Agenda

Developing the future.
Charts on 3rd Quarter 2011/12August 10, 2012
11
All Continued Operations with Positive EBIT Performance (Except AM)
EBIT adjusted (million €); EBIT adjusted margin (%)
322
92
132
115
128
Q3 2010/11 Q2 Q3 2011/12 Q3 2010/11 Q2 Q3 2011/12
78
(228)
(21)**
9.2
2.7
11.7
6.8
35.5
(1.3)
0.0
062
141
131
13.9
7.9
12.9
30
1.0
(190)
1493.7
52
1.8
(262)
90
2.6
147
10.0
151
11.6 10.3
140
13.6
134
7.2
23
7.8
1.1
19**
SE
AM
MX
SG*
* Inoxum ** Q2 and Q3 2011/12 EBIT excl. regular depreciation charges of €48 m and €49 m respectively
ET
PT
CT
MS

Developing the future.
Charts on 3rd Quarter 2011/12August 10, 2012
12
570
296
549
EBIT adjusted – continued operations (million €) EBIT – continued operations (million €)
Reported EBIT Positively Affected by Disposal Gain of Waupaca
Q32011/12
Q32010/11
Q2 Q32011/12
Q32010/11
Q2
Special items Q3 2011/12: €174 m,thereof• Materials Services (133)• Components Technology 325
(mainly Waupaca)
122
-79%yoy
-9%qoq
-46%yoy
+€220 mqoq
76134

Developing the future.
Charts on 3rd Quarter 2011/12August 10, 2012
13
Positive Tax Effect Supporting Bottom-Line
Income after tax and net income reconciliation Q3 2011/12 (million €)
Net financial
line
EBIT
Tax income
Income after tax
Discont. operations
Net income(incl. discont. ops.)
76
217
296(155)
incl. IFRS 5 valuation adjustment of €(59) m mainly reflecting Outokumpu share price* development
(130)
87
EPS cont. ops.
0.46
EPS incl. discont. ops.
0.21
* Outokumpu share price from €0.95 (beginning of May) to €0.70 (beginning of August)
Developing the future.
Charts on 3rd Quarter 2011/12August 10, 2012
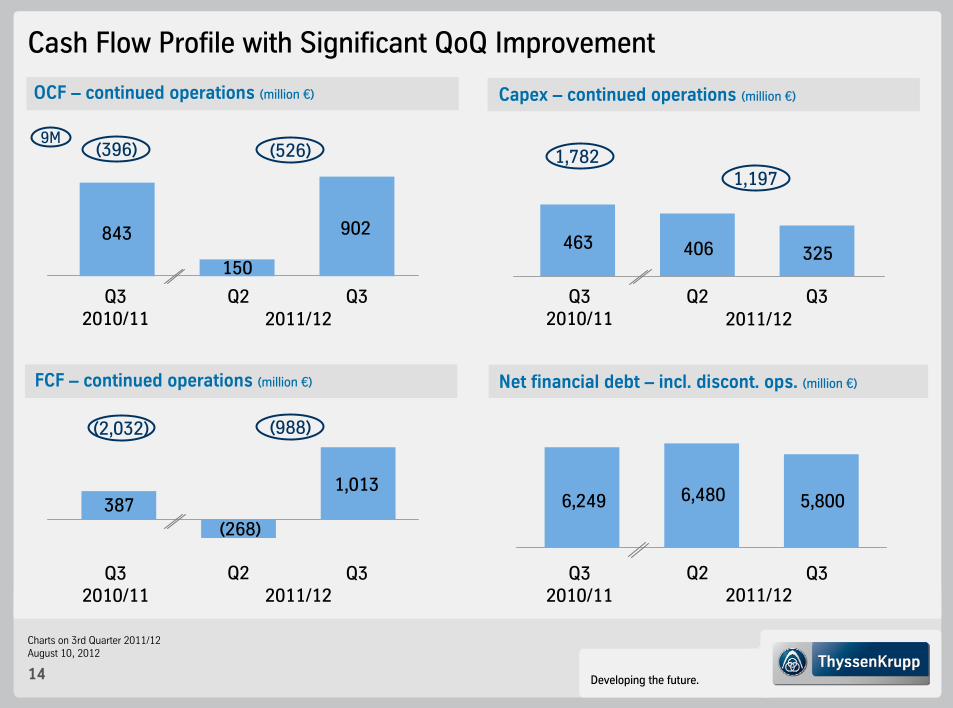
14
OCF – continued operations (million €)
FCF – continued operations (million €)
387
Net financial debt – incl. discont. ops. (million €)
Capex – continued operations (million €)
902
Q3Q32010/11
Q2 Q3Q32010/11
Q2
Cash Flow Profile with Significant QoQ Improvement
150406
1,013
Q3Q32010/11
Q2
6,249 5,800
843 463
(988)
(268)
Q3Q32010/11
Q2
9M(526)
1,1971,782
325
6,480
(396)
(2,032)
2011/12 2011/12
2011/12 2011/12

Developing the future.
Charts on 3rd Quarter 2011/12August 10, 2012
15
227
Q3 2011/12 (million €)
Strong OCF Fueled by Declining Inventories and Advance Payments
OCF
375
D/A
Netincome
87
(431)
Others Inventories Trade accounts receivable
(218)
Trade accounts payable
Other provisions
Other assets/liabilities*
* not related to investing or financing activities
(5)
902
769
Discont. operations
130
OCF(incl.
disc. ops.)
871
Income from continued operations
217
(32)
thereof:• Steel Europe 401• Elevator Technology 89• Components Technology 143• Marine Systems 444
mainly• advance payments at Marine Systems• cartel fine to be paid
(in P&L; cash-out in Q4)
mainly• disposal gain related
to Waupaca divestment

Developing the future.
Charts on 3rd Quarter 2011/12August 10, 2012
16
Declining Inventories at Steel Europe and Steel Americas
Steel EuropeInventories
Qoq inventories down by ~0.4 m t~0.2 m t ore, coal and coke~0.2 m t slabs & finished prod.
Cash conversion partially delayed/ cushioned by
higher receivables following reduction of finished products
Overall, strong OCF in fiscal Q3
€m days
Steel AmericasInventories
Qoq inventories down by ~0.3 m t~0.1 m t raw materials~0.2 m t slabs & finished prod.
Lower inventories reflectinglower slab production in Brazilsale of stock at Steel USA
€m days
Materials ServicesInventories
Qoq value of inventories slightly upvolumes virtually unchangedprice/mix effect at non-ferrous metals esp. for aerospace industry
€m days
0
1,000
2,000
3,000
4,000
0
40
80
120
0
200
400
600
800
1,000
1,200
0
200
400
600
800
0
500
1,000
1,500
2,000
2,500
0
10
20
30
40
50
60
Q22010/11
Q22011/12
Q1Q1 Q3 Q4 Q3 Q22010/11
Q22011/12
Q1Q1 Q3 Q4 Q3 Q22010/11
Q22011/12
Q1Q1 Q3 Q4 Q3

Developing the future.
Charts on 3rd Quarter 2011/12August 10, 2012
17
Capex*
NFDMar 2012
(incl. disc. operations)
NFDJune 2012
(incl. disc. operations)
(5,800)
Gearing63.8%
(6,480)
Gearing73.0%
436
Divestments
Q3 2011/12 (million €)
* Capex for property, plant & equipment, financial & intangible assets and financial investments
Decrease in NFD due to Strong OCF and Divestments
OCF
cont. operations 1,013 FCF
902(209)
FCF disc. ops.
(124)
9M 2011/12 (million €)
Capex*
NFDSep 2011
(incl. disc. ops.)
NFDJune 2012
(incl. disc. ops.)
(5,800)
(1,197) Gearing63.8%
OCF
(526)
(3,578)Gearing34.5%
735
Divestments FCF disc. ops.(598)
Others
(636)
cont. operations (988) FCF
add. toloan note
Others
(325)
Mainly FX effects

Developing the future.
Charts on 3rd Quarter 2011/12August 10, 2012
18
Effective Cash Control Already Leading to Improvements…
Q4 Q1 Q2
FCF Groupexcl. Steel Americas
FCFSteel Americas
FCF Group
(0.5)
1.4
0.9
(0.5)
Q3
(0.3)
0
1.2
(0.2)
Q4E
(1.7)
(0.3)
2011/12
FCF from continued operations (billion €)
Q1 Q2 Q3
2010/11
(1.2)(0.5)
0.9
0.4
(0.8)
0.1
(0.7)
(1.7)
(1.0)
(0.7)
1.0
… and substituting for disproportionate year-end measures!

Developing the future.
Charts on 3rd Quarter 2011/12August 10, 2012
19
Solid Financial Situation
Liquidity analysis and maturity profile of gross financial debt as of June 30, 2012 (million €)
2012/13 2013/14 2014/15 after2015/16
Available committed credit facilities
Cash and cash equivalents
710
2,0051,746
1,4881,979
3,101*
973
* incl. securities of €6 million
7,283
Total: 8,901
8% 22% 20% 11% 17% 22%
4,182
2015/164th Quarter2011/12

Developing the future.
Charts on 3rd Quarter 2011/12August 10, 2012
20
Targeted cost savings FY 2011/12 Exemplary impact measures
Program Realizing Efficiency Potentials Across The Group
OperationsPurchasing
General Admin.
44%
14%
41%
1%Sales & Service
~€300 m
Materials
Capital Goods
62%
38%
~€300 m
Marine Systems
Material Services
Elevator Technology
Components Technology
Fleet management optimization across North American operations
Optimization of preventive maintenance schedules to increase equipment availability at South American processing operations
Process optimization in new installations and service business in Southern Europe
Cost reduction Manufacturing: efficiency gains by plant layout and process optimization in Americas
Cycle time reduction for higher production line efficiencyat Forging Group operations
Optimization of supply concept forAsian slewing bearings and rings operations
Bundled procurement of B- & C-Parts by improved enterprise resource planning

Developing the future.
Charts on 3rd Quarter 2011/12August 10, 2012
21
Steel Europe/Steel Americas
Materials Services
Plant Technology/
Marine Systems
Elevator Technology
Components Technology Corporate
• Short-time work(~2,200 empl.)
• Reduction ofleased labor
• Temporary idling of BF 9
• Cost-cutting programs (M&R, SG&A)
• Hiring freeze
• Headcount reduction (~200 employees acrossEurop. activities)
• Reduction of leased labor by ~300 employees
• Cost-cutting programs (SG&A)
• PT: Headcount reduction (mainly in Thailand, Mexico, Australia)
• PT & MS:Employee flexibilization possible
• Headcount reduction (~500 employees e.g. in Southern Europe, UK, Russia)
• Production process optimization (e.g. Germany)
• Cost-cutting programs
• Hiring freeze
• Cost-cutting programs (e.g. travel, events, advertising, facilities services,fleet mgmt)
• Project revision
• Headcount reduction (mainly in Brazil, Italy & Asia)
• Employee flexibilization / shift adjustments
• Cost-cutting programs
(Performance + Portfolio)
TK synergize+ (Strategic Purchasing Program)
Additional Cost Measures Complementing Stringent Cash Control
+

Developing the future.
Charts on 3rd Quarter 2011/12August 10, 2012
22
Key Figures, Strategic Way Forward and Group Outlook
Group Performance and Financials
Business Area Performance
Conclusion
Agenda

Developing the future.
Charts on 3rd Quarter 2011/12August 10, 2012
23
Steel Europe – Q3 2011/12 HighlightsOrder intake in €m
Current trading conditions
Q3
Shipments in 1,000 t
Q3
2010/11 2010/11
Q3
2010/11
3,006
Q2
3,431
Q2
322
9.2136
indexed (Q1 2004/05=100) Ø rev/t
140 146
2,688 3,018 253
8.3
2,705
Q2
2011/12
2,580
147
2011/12
4.0
102
2011/12
Inventories and Months of Supply - Europe
EBIT improvement in fiscal Q3 as lower shipments were compensated by higher Ø revenues/t; solid FCF generation
Expectation fiscal Q4: volume and price development reflecting cont’d intense competition; sequentially lower volumes set against higher Ø revenues/t
Introduction of short-time working from August 2012 following weak orders
2,9903,289
1.0
21
Premium product mix as basis for sustainable differentiation
EBIT in €m; EBIT adj. margin in %
EBIT adjustedEBIT
30
Q3
2,511 3,196
138
Q3 Q3
52
47
1.8
8
7
15 612
8
2
8
34
TailoredBlanks Construction
Elements
ElectricalSteel
Medium-wideStrip
Hot Strip
Tinplate
Coated Products(HDG, EG, Color)
Cold Strip
Heavy Plate
in % of sales; FY 2010/11

Developing the future.
Charts on 3rd Quarter 2011/12August 10, 2012
24
Slab productionCSA
Steel Americas – Q3 2011/12 HighlightsOrder intake in €m
Current trading conditions
Production & shipments in 1,000 t EBIT in €m
xxx
Q3 Q2
2011/12
632
504
Q3
ShipmentsSteel USA
880
403 Q3 Q2
2011/12
(190)
437
852
Q2
421
(2,258)
EBIT adjustedEBIT
(184)
583
914
Q3 Q2
622
(288)
2010/11
2010/11
Certification processes with good progress
Higher losses reflecting translation effect related to R$-based sales tax credits, inventory writedowns, inefficient blast furnace operations with higher fuel rate and lower share of PCI and cont’d challenging business environment impacted by falling scrap and steel prices; partly cushioned by compensation paymentsCertification processes with good progress at all 10 major auto OEMs in North America and for more than 100 products; 20% of approvals already received
2010/11 2011/12
2010/11 2011/12
786
777
(230)(228)
Q3
413
Q3
Q3
800
636
Q3
(263)(262)

Developing the future.
Charts on 3rd Quarter 2011/12August 10, 2012
25
Materials Services – Q3 2011/12 HighlightsOrder intake* in €m Materials warehousing shipments in 1,000 t EBIT in €m; EBIT adj. margin in %
Q3 Q2 Q3
3,201
2010/11
3,973
Q3 Q2 Q3
2010/11
1,440
Q3
40
2010/11Q3
149
3.7
*thereof materials warehousing business ~ 60%
3,618 1,387
81
3.6
136
2011/12 2011/12 2011/12
1,254 1.3
Current trading conditionsBusiness model with high degree of independence
3,5731,423 2.6
74
Q2
90
3,2351,413
2.7
(42)
92
Solid EBIT development supported by strict cost mgmt
Fine of €103 m for rail cartel case; €30 m provisions for ongoing investigations
Competitive environment, high material availability,price softness
Customers continuing to act very cautiously
Inventories still at moderate levels
Independency from single products
o Broad range of ferrous and nonferrous materials complementedby related processing and logistics
Independence from singleproducts Independency from single
industries
o Broad range of industries served
Independence from singleindustries• Broad range of industries
served
• Limited risks due to degree of independence• Service orientation (processing, logistics) paying off
• Broad range of ferrous andnon-ferrous materials complemented by relatedprocessing and logistics
EBIT adjustedEBIT

Developing the future.
Charts on 3rd Quarter 2011/12August 10, 2012
26
Elevator Technology – Q3 2011/12 Highlights
132142172
Order intake in €m Units under Maintenance EBIT in €m; EBIT adj. margin in %
Q3 Q2
1,466
2010/11
1,5411,320
Q3
113
2010/11
Q2
151
10.5
11.6
04/05 11/12
~800,000
1,297
332
12.4
EBIT adjustedEBIT
2011/12 2011/12
Current trading conditionsChina: Multi-brand approach for broader market coverage
>1m
NI demand: strong growth in Asia/Pacific (total order intake 9 months: China +42%; India +18%), demand Americas close to pre-crisis level
Modernization in Europe and North America with good demand
Maintenance portfolio growing constantly
Restructuring in Europe (e.g. Spain and Germany) progressing;total amount in FY 2011/12: €50 m
Yoy decline in EBIT adj. and EBIT adj. margin due to:
• normalization of NI margins in US
• weak demand and pricing in Southern Europe
118
10.0
Q3
1,575
147134
10.3
Record level
Q3
Latest Technology
ValueEnd
Mid
High End
NI market segments Multi-brand approach
2nd BrandProvenTechnology
3rd BrandMinority JVNew Product
9M: 3,9849M: 4,582

Developing the future.
Charts on 3rd Quarter 2011/12August 10, 2012
27
Plant Technology – Q3 2011/12 HighlightsOrder intake in €m Order backlog in €bn EBIT in €m; EBIT adj. margin in %
Q3 Q2
871
1,097
Q3 Q2
2010/11
Q3
125
2010/11
Q2
131
13.313.9
1,466
129
10.8
6.36.4 6.6
Major order intake Q3 2011/12
(Picture shows comparable project)
Again good demand from the minerals & mining and the automotive industries, project delays at chemical plants
Increased interest in fertilizer plants in the US due to decreasing gas prices
Order backlog to secure ~18 months of sales
Acquisition of UK based Energy & Power Global Limited in order to strengthen the chemical engineering capabilities in the global oil and gas business
Current trading conditions
2010/11 2011/12 2011/12 2011/12
6.6
Bodyshell line:
Largest order in history of System Engineering
Order value: ~ €85 m
Commissioning: 2014
114
11.7
934
6.5
EBIT adjustedEBIT
115
832
Q3 Q3
140
13.6
Q3
9M: 3,009 9M: 2,637

Developing the future.
Charts on 3rd Quarter 2011/12August 10, 2012
28
Current trading conditionsClosing of Waupaca sale to KPS Capital Partners
Components Technology – Q3 2011/12 HighlightsOrder intake in €m Quarterly order intake auto components EBIT in €m; EBIT adj. margin in %
Q3 Q2
2011/12
1,811
Q3
169
2011/12
Q2
141
7.9
103
EBIT adjustedEBIT
1,713
6.9
161
2010/11 2010/11
5.91,778
121
1,858
128
6.8
Stable order intake and sales qoq and yoy due to ongoing strong demand from the automotive industry (especially in the US) compensating weaker demand for industrial components (mainly in China)
Increase of EBIT margin adj. in Q3 to 7.2% including ramp-up costs for new plants in Asia and R&D costs for new products
Divestment of Berco initiated
Q3
459
7.2
134
Q3
1,828
Largest global producer of gray, ductile and compacted graphite iron castings for the automotive, agricultural and construction industries
Sales (FY 2010/11): ~ €1.1 bn
Closing on June 29, 2012 resulting in a disposal gain of more than €300 m
Q4 2011/12 results already excluding Waupaca with a mid triple-digit impact on sales and a low double-digit impact on EBIT
Q4Q2
2008/09
Q2
2009/10
Q4
2007/08
Q4 Q2
2010/11
Q4 Q2
2011/12
Q3 2011/12: still ~20% above pre-crisis level(average of FY 2007/08)

Developing the future.
Charts on 3rd Quarter 2011/12August 10, 2012
29
Marine Systems – Q3 2011/12 HighlightsOrder intake in €m EBIT in €m; EBIT adj. margin in %
Q3 Q2
222
2010/11
2,155
Q3
2011/12
Q2
62 10.7
12.9
EBIT adjustedEBIT
Order backlog in €m
6,397
Q3 Q2
2010/11
6,958
247
6,532 21
7.2
Current trading conditions
Contract with Algeria (frigates) signed, order intake expected in Q4 2011/12
Order backlog at record level securing ~4.7 years of sales
EBIT adjusted returns to normalized level
2010/112011/122011/12
(116)
39
78
61
35.5
6,826731
Major order intake Q3 2011/12
Q3Q3 Q3
456
6,9907.8
Submarine class DolphinCustomer: Israeli NavyOrder intake Q3: ~ €400 mDelivery: 2017Overall contract includes 2 more submarines currently being constructed. Earlier contract comprised 3 submarines already in use (see picture).
23
Record level~€2 bn submarine order from Turkish Navy

Developing the future.
Charts on 3rd Quarter 2011/12August 10, 2012
30
Current trading conditionsNickel price development & monthly order intake (EU 29) (Jan 08=100%)
Source: Eurofer; CRU June 2012, Metalprices (NICKEL) June 2012
Discontinued Operation: Stainless Global – Q3 2011/12 HighlightsOrder intake in €m Shipments in 1,000 t (hot- and cold-rolled) EBIT in €m; EBIT adj. margin in %
Q3 Q2
1,372
2010/11
1,360
Q3 Q2
2010/11
460
Q3 Q22010/11
(29) (44)
0
(51)
0.0
111
indexed (Q1 2004/05=100)
129 116
Ø transaction price/t
1,412
457
(851)
(3.0)
2011/12 2011/12 2011/12
467
107
(3.9)
EBIT SL USA
(321)
Decrease in order intake qoq due to weak market conditions (economic uncertainty, declining nickel price, destocking), but German end customers still showing robust demandDecreasing average transaction prices qoq, lower alloy surcharges driven by weak nickel price Special items of €(124) m, mainly €(59) m impairment charges from Inoxum transaction & restructuring provision of €(63) mEBIT Stainless USA: €(54) m
(51)
1,618
(303)
19*1.1
533
(31)
(56)*
* Q1, Q2, Q3 2011/12 EBIT excl. regular depreciation charges of €46 m, €48 m and €49 m respectively
Q3Q3
(54)
(21)*
(1.3)(145)
110
476
Q3
1,291
020406080
100
Jan-08
May Sep Jan-09
May Sep Jan-10
May SepJan-11
May SepJan-12
May0
10,000
20,000
30,000
40,000% US$/t
Order intake EU29 (cold-rolled)NickelLong-term average of order intake (2004-2011)

Developing the future.
Charts on 3rd Quarter 2011/12August 10, 2012
31
Key Figures, Strategic Way Forward and Group Outlook
Group Performance and Financials
Business Area Performance
Conclusion
Agenda

Developing the future.
Charts on 3rd Quarter 2011/12August 10, 2012
32
Group
Perspective FY 2011/12 – Continued Operations
Cost savings of ~ €300 m(~80% have been realized already)
complemented by additional cost measures OperationsPurchasing
General Admin.
44%
14%
41%
1%Sales & Service
EBIT adjusted in mid three-digit million euro range
Capex max. €2 bn
NFD: around the same level as in Q3
Developing the future.
Charts on 3rd Quarter 2011/12August 10, 2012
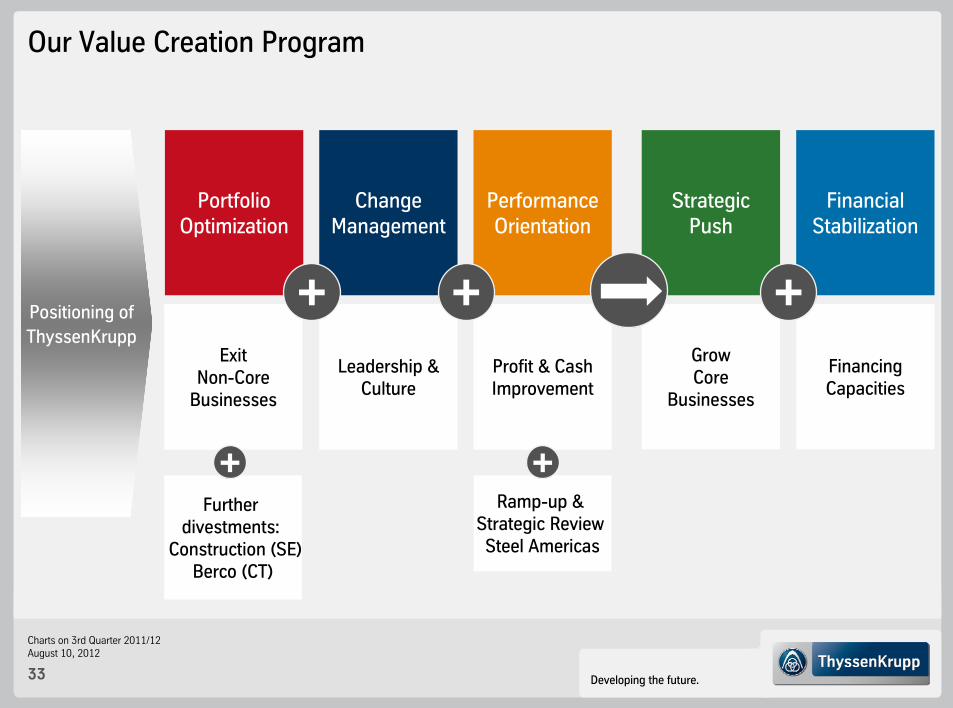
33
Further divestments:
Construction (SE)Berco (CT)
Ramp-up & Strategic ReviewSteel Americas
Our Value Creation Program
FinancialStabilization
Financing Capacities
GrowCore
Businesses
Strategic Push
Performance Orientation
Profit & Cash Improvement
Leadership & Culture
ChangeManagement
Portfolio Optimization
ExitNon-Core
Businesses
++ +
+
Positioning of ThyssenKrupp
+
Developing the future.
Charts on 3rd Quarter 2011/12August 10, 2012
34
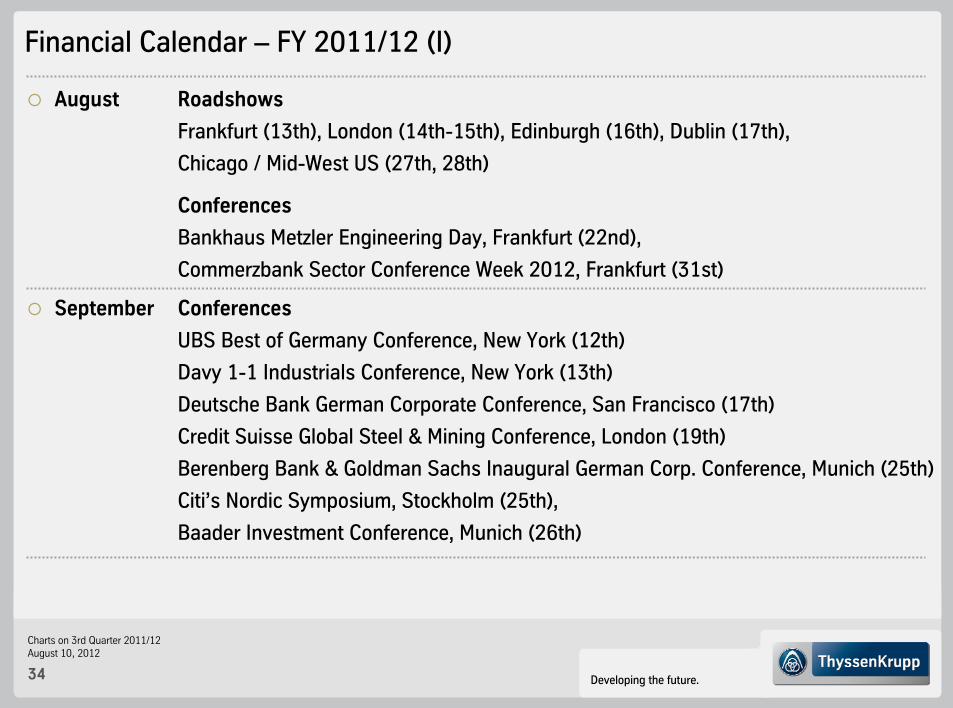
August Roadshows
Frankfurt (13th), London (14th-15th), Edinburgh (16th), Dublin (17th),
Chicago / Mid-West US (27th, 28th)
Conferences
Bankhaus Metzler Engineering Day, Frankfurt (22nd),
Commerzbank Sector Conference Week 2012, Frankfurt (31st)
September Conferences
UBS Best of Germany Conference, New York (12th)
Davy 1-1 Industrials Conference, New York (13th)
Deutsche Bank German Corporate Conference, San Francisco (17th)
Credit Suisse Global Steel & Mining Conference, London (19th)
Berenberg Bank & Goldman Sachs Inaugural German Corp. Conference, Munich (25th)
Citi’s Nordic Symposium, Stockholm (25th),
Baader Investment Conference, Munich (26th)
Financial Calendar – FY 2011/12 (I)

Developing the future.
Charts on 3rd Quarter 2011/12August 10, 2012
35
October Roadshows
New York (8th), Boston (9th), Paris (SRI) (16th)
November Conference Call FY 2011/12 (22nd)
Conferences
Goldman Sachs Annual Global Metals & Mining/Steel Conf., New York (27th-28th)
December Capital Markets Day, London (4th)
Conferences
Steubing/Deutsche Börse High Tech Engineering Investors’ Day, Zurich (6th)
January Annual Stockholders’ Meeting (18th)
Financial Calendar – FY 2012/13 (II)

Developing the future.
Charts on 3rd Quarter 2011/12August 10, 2012
36
Contact Details ThyssenKrupp Corporate Center Investor Relations
Phone numbers +49 201-844-
Dr. Claus Ehrenbeck -536464Head of Investor Relations
Christian Schulte -536966 Klaudia Kelch -538371IR Manager (Deputy Head) IR Manager
Rainer Hecker -538830 Sabine Sawazki -536420IR Manager IR Manager
Hartmut Eimers -538382 Ute Kaatz -536466IR Manager (Retail) Event Manager
To be added to the IR mailing list,
send us a brief e-mail with your details!
E-mail: [email protected]

Developing the future.
Charts on 3rd Quarter 2011/12August 10, 2012
37
Appendix
Agenda

Developing the future.
Charts on 3rd Quarter 2011/12August 10, 2012
38
Group Overview (I) – Continued Operations
Q1 Q2 Q3 Q4 FY Q1 Q2 Q3
Order intake €m 9,997 11,328 12,984 10,809 45,118 10,078 11,596 10,231
Sales €m 10,020 10,680 11,506 11,150 43,356 9,896 10,613 10,710
EBITDA €m 592 827 944 846 3,209 471 432 659
EBITDA adjusted €m 592 827 965 865 3,249 433 452 485
EBIT €m 261 435 549 (1,435) (190) (33) 76 296
EBIT adjusted €m 261 435 570 495 1,761 83 134 122
EBT €m 136 297 419 (1,603) (751) (183) (91) 141
EBT adjusted €m 136 297 440 327 1,200 (66) (34) (33)
Income from cont. ops. €m 90 200 263 (1,507) (954) (172) (304) 217
Earnings per share € 0.29 0.51 0.44 (2.03) (0.97) (0.30) (0.59) 0.46
2010/11 2011/12

Developing the future.
Charts on 3rd Quarter 2011/12August 10, 2012
39
EBIT (million €)
Reconciliation EBIT adjusted Q3 2011/12 – Continued Operations
EBITadjusted
EBIT
296
122
Q3: 174
Special items (million €)
1• OthersCorporate
(5)• Several effects (e.g. several smaller asset disposals)
Steel Europe
(1)• Asset disposalSteel Americas
325• Mainly deconsolidation Waupaca
Components Technology
(13)• RestructuringElevator Technology
(133)• Rail cartel caseMaterial Services
174Group

Developing the future.
Charts on 3rd Quarter 2011/12August 10, 2012
40
Group Overview (I) - Incl. Discontinued Operations
* attributable to ThyssenKrupp stockholders
Q1 Q2 Q3 Q4 FY Q1 Q2 Q3
Order intake €m 11,260 12,848 14,120 12,019 50,247 11,260 13,008 11,362
Sales €m 11,370 12,266 12,851 12,605 49,092 11,138 12,155 12,116
EBITDA €m 645 932 983 825 3,385 412 424 573
EBITDA adjusted €m 645 932 1,004 844 3,425 374 471 463
EBIT €m 273 497 545 (2,303) (988) (357) (228) 151
EBIT adjusted €m 273 497 566 427 1,763 25 152 101
EBT €m 145 352 407 (2,482) (1,578) (513) (402) (12)
EBT adjusted €m 145 352 428 248 1,173 (131) (22) (62)
Net income* €m 142 272 212 (1,917) (1,291) (460) (587) 109
Earnings per share € 0.31 0.58 0.46 (3.75) (2.71) (0.89) (1.14) 0.21
TK Value Added €m (2,962)
Ø Capital Employed €m 22,832 23,400 23,554 23,223 23,223 24,536 23,329 22,701
Goodwill €m 3,378
2010/11 2011/12

Developing the future.
Charts on 3rd Quarter 2011/12August 10, 2012
41
Group Overview (II) – Continued Operations
* incl. financial investments
** incl. discontinued operations
Q1 Q2 Q3 Q4 FY Q1 Q2 Q3
Capital expenditures* €m 716 603 463 723 2,505 466 406 325
Depreciation/amort. €m 340 401 407 2,293 3,441 514 367 375
Operating cash flow €m (1,094) (145) 843 1,408 1,012 (1,578) 150 902
Cash flow from divestm. €m 119 20 7 277 423 311 (12) 436
Cash flow from investm. €m (716) (603) (463) (723) (2,505) (466) (406) (325)
Free cash flow €m (1,691) (728) 387 962 (1,070) (1,733) (268) 1,013
Cash and cash equivalents** (incl. short-term securities) €m
2,869 2,022 1,877 3,574 3,574 1,980 2,531 3,101
Net financial debt** €m 5,814 6,492 6,249 3,578 3,578 5,937 6,480 5,800
Employees 167,095 169,120 171,086 168,560 168,560 159,682 159,009 155,588
2010/11 2011/12

Developing the future.
Charts on 3rd Quarter 2011/12August 10, 2012
42
Equity
Sep 2008
11,489
1,584
13.8%
27.6%Equity ratio
Sep 2009
21.2%
23.4%
9,696
2,059
Net financial position, equity and ratios (million €)
Sep 2011
10,388
3,780
34.5%
23.8%
Sep 2010
10,382
3,578
36.4%
23.8%
Net financialposition
Gearing
June 2012
63.8%
20.7%
9,088
5,800
Decrease in NFD due to Strong OCF and Divestments

Developing the future.
Charts on 3rd Quarter 2011/12August 10, 2012
43
Tight Capex Management Going Forward
2008/092007/08 2009/10
Capex
Divestments2010/11 2010/11
3.5
Steel Americas and Stainless USA* Projects
2011/12E
4.14.2
0.3 0.2
Depreciation
Cash flows from investing activities (billion €)
0.6
2.8
0.4
max. €2 bn
continued operations
0.4
2.5
9M 2011/12
0.7
1.2
* not included in continued operations

Developing the future.
Charts on 3rd Quarter 2011/12August 10, 2012
44
ThyssenKrupp – “Diversified Industrial Company”
Diversification over business cycles
Stable earnings &cash flow profile
Financialstability & flexibility
Cross-operational synergies
Efficient capital allocation based on clearly defined key figures
Focus oncore activities with leading
market positions
Best-in-class performance within all businesses
Leading Engineering CompetenceInfrastructure Resources

Developing the future.
Charts on 3rd Quarter 2011/12August 10, 2012
45
Portfolio Optimization: Well on TrackAlready signed or closed transactions comprising ~ 90% of sales to be divested
Execution time line 12 to 18 months
May 13, 2011
Decision for Strategic Way Forward
Start Q42010/11
Q12011/12
Q22011/12
Q32011/12
Q42011/12
Q12012/13
November 30, 2011
Sale of Xervon Group to Remondis
January 31, 2012
Sale of civil shipbuilding activities to Star Capital
July 20, 2011
Sale of Metal Forming Group to Gestamp
December 6, 2011
Sale of Automotive Systems (Brazil) to Cosma International
January 31, 2012
Signing of combinationInoxum with Outokumpu
May 15, 2012
Strategic review Steel Americas (“all strategic options”)
Further divestments: Construction (Steel Europe), Berco (Components Technology)
June 29, 2012
Sale of Waupaca to KPS Capital Partners

Developing the future.
Charts on 3rd Quarter 2011/12August 10, 2012
46
ThyssenKrupp has already signed or closed transactions comprising ~ 90% of sales to be divested
Disposal candidates
23%
Initiated:10%
Signed orclosed:90%
€49.1 bn
Tailored BlanksSales: ~€0.7 bn
WaupacaSales: ~€1.1 bn
Stainless GlobalSales: ~€6.7 bn
signed
Metal FormingSales: ~€1.1 bn
closed
XervonSales: ~€0.7 bn
closed
Bilstein-Group(Automotive Systems Brazil)
Bilstein-Group(Springs & Stabilizers)
Sales: ~€0.7 bn
closed
closedBlohm + Voss(Shipyards and Services)Sales: ~€0.4 bn
Portfolio Optimization: Geared to Reduce Volatility and Complexity
progressing
carved-out
Sales FY 2010/11(before Stainless Global carve-out, not consolidated)
closed

Developing the future.
Charts on 3rd Quarter 2011/12August 10, 2012
47
Portfolio Optimization: Exit Non-Core Businesses
Current Divestments Strategic DevelopmentAdditional Divestments
Metal Forming Tailored Blanks
Xervon
Stainless Global
BVSS
Waupaca
Bilstein-Group(Shock absorbers)
Presta Steering
Sales: ~€1.1 bn; Employees: ~5,700 Sales: ~€0.7 bn; Employees: ~900
Sales: ~€0.7 bn; Employees: ~8,600
Sales: ~€6.7 bn; Employees: ~11,000
Sales: ~€1.1 bn; Employees: ~3,000
Sales: ~€0.7 bn; Employees: >3,000
Consolidation to achassis-full-service-providerSales: ~€3.0 bn; Employees: ~7,200
Sales: ~€0.4 bn; Employees: ~1,500
Tech
nolo
gies
Mat
eria
ls
Steel Europe
StainlessGlobal
MaterialsServices
Com-ponentsTechno-
logy
MarineSystems
Sales: FY 2010/11; Employees: Sep 30, 2011
Bilstein-Group (Automotive Systems Brazil)
Bilstein-Group (Springs & Stabilizers)
closed
closed
carved-outclosedclosed
signed
closed
Developing the future.
Charts on 3rd Quarter 2011/12August 10, 2012
48
530
155
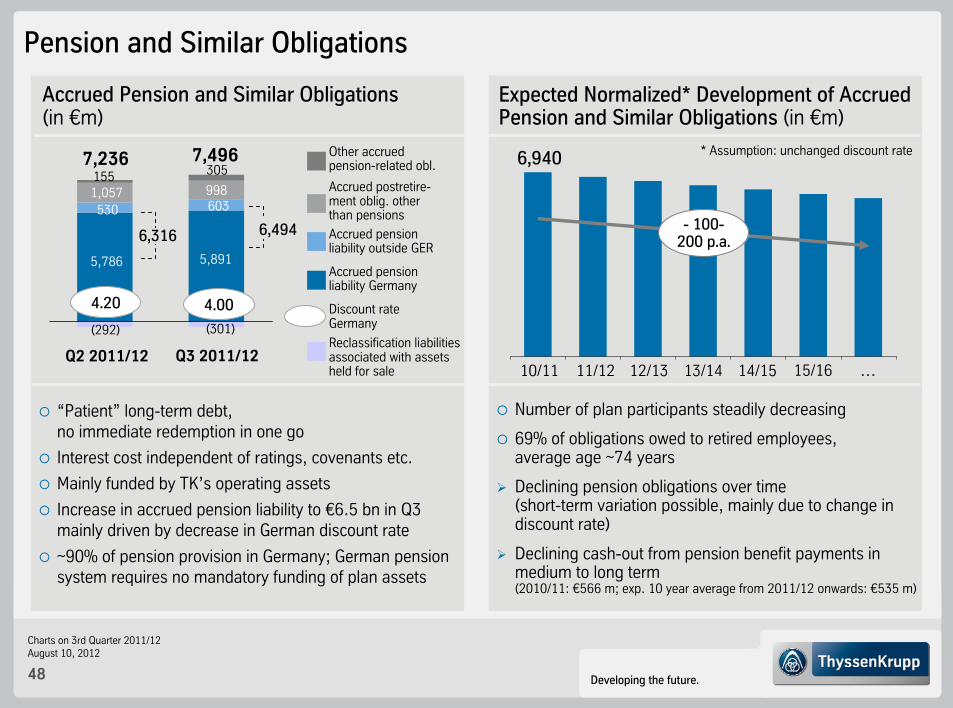
Pension and Similar Obligations
Expected Normalized* Development of Accrued Pension and Similar Obligations (in €m)
“Patient” long-term debt, no immediate redemption in one go
Interest cost independent of ratings, covenants etc.
Mainly funded by TK’s operating assets
Increase in accrued pension liability to €6.5 bn in Q3 mainly driven by decrease in German discount rate
~90% of pension provision in Germany; German pension system requires no mandatory funding of plan assets
Accrued pension liability Germany
Accrued postretire-ment oblig. other than pensions
Other accrued pension-related obl.
Accrued Pension and Similar Obligations(in €m)
Q3 2011/12
Accrued pension liability outside GER
Discount rateGermany
4.20
6,940
10/11 11/12 12/13 13/14 14/15 …
- 100-200 p.a.
* Assumption: unchanged discount rate
Number of plan participants steadily decreasing
69% of obligations owed to retired employees,average age ~74 years
Declining pension obligations over time(short-term variation possible, mainly due to change indiscount rate)
Declining cash-out from pension benefit payments in medium to long term(2010/11: €566 m; exp. 10 year average from 2011/12 onwards: €535 m)
(292)Reclassification liabilities associated with assets held for sale
1,057
7,236
6,316
5,786
Q2 2011/1215/16
6,494
4.00
7,496305
998
(301)
5,891
603

Developing the future.
Charts on 3rd Quarter 2011/12August 10, 2012
49
Pension payments higher than pension cost:Indicator for mature pension schemes
Pension Obligations: ThyssenKrupp with Mature Pension Schemes
Interestcost
Net Periodic Pension Cost vs. Pension Benefit Payments(Defined Benefit Obligations*; FY 2010/11; in €m)
351
(124)
Expected return on plan assets
126
398
Net periodic pension cost
(Past) Service cost,other P+L effects*
566
Pension benefit payments
Shown inP&L as:
Interest income/expense Personnel expenses(functional P&L lines) * Other P+L effects include
termination benefits
* including continued and discontinued operations
45
Curtailment and settlement

Developing the future.
Charts on 3rd Quarter 2011/12August 10, 2012
50
Long term- Short term- Outlookrating rating
Standard & Poor’s BB B negative
Moody’s Baa3 Prime-3 negative
Fitch BBB- F3 negative
Restoring / maintaining investment grade statuswith all three rating agencies is key!
ThyssenKrupp Rating
Developing the future.
Charts on 3rd Quarter 2011/12August 10, 2012
51
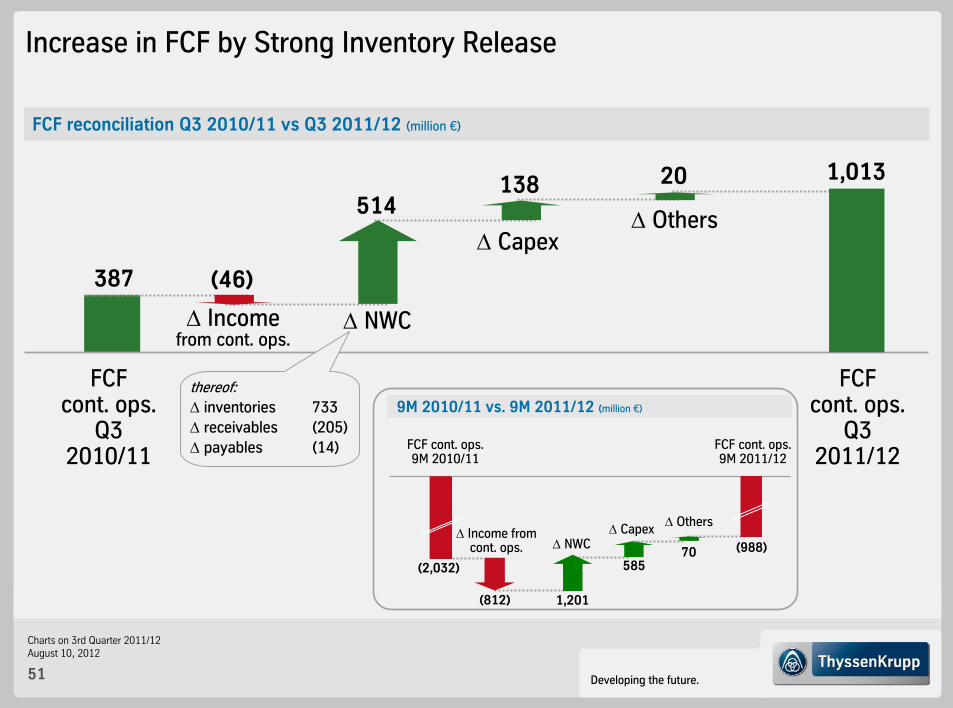
FCF reconciliation Q3 2010/11 vs Q3 2011/12 (million €)
Increase in FCF by Strong Inventory Release
Δ Income from cont. ops.
FCFcont. ops.
Q32010/11
Δ NWC
Δ CapexΔ Others
FCFcont. ops.
Q32011/12
(46)
514138 20 1,013
387
thereof:Δ inventories 733 Δ receivables (205)Δ payables (14)
9M 2010/11 vs. 9M 2011/12 (million €)
FCF cont. ops. 9M 2010/11
(2,032)
(988)Δ Income from
cont. ops.
(812)
Δ NWC
1,201
Δ Others
70
Δ Capex
585
FCF cont. ops. 9M 2011/12

Developing the future.
Charts on 3rd Quarter 2011/12August 10, 2012
52
8
9M 2011/12 (million €)
OCF Impacted by Increase in NWC
OCF
1,256
D/A
Netincome
(980)
(613)
Others
Inventories
Trade accounts receivable
(716)
Trade accounts payable
Other provisions
Other assets/liabilities*
* not related to investing or financing activities
(470)
thereof:• Steel Europe 70• Steel Americas (652)• Materials Services (407)• Elevator Technology 209• Plant Technology (141)• Components Technology 86• Marine Systems 442
(526)
472
Discont. operations
721
OCF(incl.
disc. ops.)
(848)
Income from continued operations
(259)
(204)

Developing the future.
Charts on 3rd Quarter 2011/12August 10, 2012
53
Steel Europe
Key figures
Q1 Q2 Q3 Q4 FY Q1 Q2 Q3
Order intake €m 2,929 3,721 3,006 2,688 12,344 2,705 2,990 2,511
Sales €m 2,958 3,287 3,518 3,051 12,814 2,530 2,886 2,900
EBITDA €m 399 439 458 374 1,670 225 142 163
EBITDA adjusted €m 399 439 458 374 1,670 225 150 168
EBIT €m 258 300 322 253 1,133 102 21 47
EBIT adjusted €m 258 300 322 253 1,133 102 30 52
TK Value Added €m 609
Ø Capital Employed €m 5,695 5,797 5,830 5,822 5,822 5,874 5,936 5,865
OCF €m (433) 323 184 608 682 (632) 301 401
CF from divestm. €m 0 14 0 242 256 25 (5) (4)
CF for investm. €m (100) (84) (93) (154) (431) (101) (106) (90)
FCF €m (533) 253 91 696 506 (708) 190 307
34,204 33,917 33,702 28,843 28,843 28,273 28,137 28,104Employees
2010/11 2011/12

Developing the future.
Charts on 3rd Quarter 2011/12August 10, 2012
54
816 875 908
130147
120140 138146
114133125
156
122136
116129
136129
116135138
118133 138
134123
134150
129
Q1
2011/12
3,142
Average revenues per ton*, indexed Q1 2004/2005 = 100
HKM share
837
449
696 865 854 786805
Q2
Steel Europe: Output, Shipments and Revenues per Metric Ton
Fiscal year
2007/08 2008/09 Q1
2010/11
2,306
Cold-rolledHot-rolled; incl. slabs
2005/06 2006/07
Q3 Q4
2007/08
2009/10
3,553
Q1
2011/12
3,542
Crude steel output (incl. share in HKM) 1,000 t/quarter Shipments*: Hot-rolled and cold-rolled products 1,000 t/quarter
2008/09
2,6282,716
1,858
2,6772,531 2,563
2,166
Fiscal year
2007/08 2008/09 2009/10
3,590
1,093
2,497 2,335
660
1,675
* shipments and average revenues per ton until FY 2007/08 relate to former Steel segment
3,385 3,3492,971
Q1 Q2 Q3 Q4Q1 Q2 Q3 Q4 Q1 Q2 Q3 Q4 Q1 Q2 Q3 Q4
Q1
2010/11
2,580
830
1,750
Q2 Q3 Q4
2,813
Q1 Q2 Q3 Q4 Q1 Q2 Q3 Q4 Q1
2009/10 2010/11
3,002
957
2,046 2,107
1,035
3,431
2,221
1,210
3,431
1,201
2,2303,018
1,073
1,944
3,324
2011/12
136150 153
139120
1,997
3,071
2,172
Q2
3,289
1,113
2,176
Q1 Q2
Q2Q3 Q3
3,196
1,122
2,074
2,164
Q3
3,047

Developing the future.
Charts on 3rd Quarter 2011/12August 10, 2012
55
0
1
2
3
4
5
6
7
8
9
J'0
5
J'0
6
J'0
7
J'0
8
J'0
9
J'1
0
J'1
1
J'1
2
1.5
2.0
2.5
3.0
3.5
4.0
4.5
0.0
0.5
1.0
1.5
2.0
2.5
3.0
J'0
5
J'0
6
J'0
7
J'0
8
J'0
9
J'1
0
J'1
1
J'1
2
1
2
3
4
5
6
7
Steel: Inventories and Months of Supply
InventoriesChina
Inventories and Months of Supply - Europe
Inventories and Months of Supply - USA
Source(s): EASSC, MSCI, UBS, MySteel
Europe: European SSC: June inventories at month end / flat carbon steel w/o quarto
Inventories[m t]
MOS[months]
USA: June MSCI inventories, carbon flat-rolled
Inventories[m st]
MOS[months]
China: flat steel inventory in 23 major cities (HR, CR and Plate)
Inventories[m t]
0
1
2
3
4
5
6
7
8
9
J 0
8
J 0
9
J 1
0
J 1
1
J 1
2

Developing the future.
Charts on 3rd Quarter 2011/12August 10, 2012
56
Steel Americas
Key figures
Q1 Q2 Q3 Q4 FY Q1 Q2 Q3
Order intake €m 84 268 504 437 1,293 583 632 413
Sales €m 86 260 429 364 1,139 498 546 543
EBITDA €m (328) (211) (95) (252) (886) (205) (139) (171)
EBITDA adjusted €m (328) (211) (95) (79) (713) (205) (137) (170)
EBIT €m (378) (319) (190) (2,258) (3,146) (288) (230) (263)
EBIT adjusted €m (378) (319) (190) (184) (1,071) (288) (228) (262)
TK Value Added €m (3,813)
Ø Capital Employed €m 7,230 7,430 7,524 7,416 7,416 6,624 6,726 6,778
OCF €m (585) (361) (269) (174) (1,389) (364) (189) (99)
CF from divestm. €m 90 1 (6) (5) 80 0 0 1
CF for investm. €m (477) (424) (197) (271) (1,369) (152) (160) (80)
FCF €m (972) (783) (472) (450) (2,678) (516) (349) (178)
3,571 3,748 3,995 4,060 4,060 4,081 4,258 4,236Employees
2010/11 2011/12

Developing the future.
Charts on 3rd Quarter 2011/12August 10, 2012
57
Materials Services
Key figures
Q1 Q2 Q3 Q4 FY Q1 Q2 Q3
Order intake €m 3,259 3,918 3,973 3,618 14,768 3,201 3,573 3,235
Sales €m 3,311 3,704 3,980 3,781 14,776 3,145 3,408 3,369
EBITDA €m 117 197 181 166 661 65 99 (20)
EBITDA adjusted €m 117 197 181 173 668 65 98 130
EBIT €m 85 163 149 81 478 40 74 (42)
EBIT adjusted €m 85 163 149 136 533 40 90 92
TK Value Added €m 186
Ø Capital Employed €m 3,273 3,422 3,485 3,430 3,430 2,861 2,966 2,971
OCF €m (497) 104 (16) 907 498 (441) 23 11
CF from divestm. €m 10 14 0 6 30 197 42 2
CF for investm. €m (64) (22) (18) (32) (136) (17) (18) (16)
FCF €m (551) 96 (34) 881 392 (261) 47 (3)
34,196 35,391 35,440 36,568 36,568 27,910 28,123 27,945Employees
2010/11 2011/12

Developing the future.
Charts on 3rd Quarter 2011/12August 10, 2012
58
Elevator Technology
Key figures
Q1 Q2 Q3 Q4 FY Q1 Q2 Q3
Order intake €m 1,306 1,358 1,320 1,297 5,281 1,466 1,541 1,575
Sales €m 1,299 1,267 1,298 1,389 5,253 1,348 1,322 1,429
EBITDA €m 189 165 168 353 875 132 139 156
EBITDA adjusted €m 189 165 168 194 716 161 148 168
EBIT €m 171 147 151 332 801 113 118 134
EBIT adjusted €m 171 147 151 172 641 142 132 147
TK Value Added €m 621
Ø Capital Employed €m 2,249 2,272 2,259 2,243 2,243 2,322 2,393 2,425
OCF €m 52 168 87 315 623 (49) 169 89
CF from divestm. €m 3 3 1 3 10 2 0 0
CF for investm. €m (18) (16) (28) (79) (142) (77) (26) (17)
FCF €m 38 155 60 239 491 (124) 143 72
44,489 44,937 45,603 46,243 46,243 46,581 46,605 46,656Employees
2010/11 2011/12

Developing the future.
Charts on 3rd Quarter 2011/12August 10, 2012
59
Plant Technology
Key figures
Q1 Q2 Q3 Q4 FY Q1 Q2 Q3
Order intake €m 1,016 896 1,097 1,466 4,474 871 934 832
Sales €m 897 969 943 1,195 4,004 943 983 1,027
EBITDA €m 115 148 149 138 550 134 125 150
EBITDA adjusted €m 115 148 149 138 550 134 124 149
EBIT €m 107 139 131 129 506 125 114 140
EBIT adjusted €m 107 139 131 129 506 125 115 140
Ø Capital Employed €m 303 329 239 245 245 300 326 331
OCF €m 118 (26) 129 267 488 (116) 51 (76)
CF from divestm. €m 0 0 1 0 2 1 1 1
CF for investm. €m (7) (9) (10) (21) (48) (15) (6) (14)
FCF €m 111 (35) 120 247 442 (130) 46 (89)
13,001 13,026 13,194 13,478 13,478 13,786 13,956 14,105Employees
2010/11 2011/12

Developing the future.
Charts on 3rd Quarter 2011/12August 10, 2012
60
Components Technology
Key figures
Q1 Q2 Q3 Q4 FY Q1 Q2 Q3
Order intake €m 1,602 1,795 1,811 1,713 6,921 1,778 1,858 1,828
Sales €m 1,599 1,769 1,779 1,761 6,908 1,753 1,880 1,852
EBITDA €m 196 186 220 178 780 243 203 548
EBITDA adjusted €m 196 186 220 176 778 178 203 209
EBIT €m 127 114 141 161 543 169 128 459
EBIT adjusted €m 127 114 141 121 503 103 128 134
TK Value Added €m 291
Ø Capital Employed €m 2,689 2,734 2,760 2,796 2,796 3,075 3,142 3,140
OCF €m (25) 46 146 277 444 (121) 64 143
CF from divestm. €m 4 1 4 (1) 7 77 2 432
CF for investm. €m (33) (54) (90) (183) (361) (95) (83) (109)
FCF €m (54) (8) 60 92 91 (139) (17) 466
29,649 30,080 31,049 31,270 31,270 30,936 31,304 27,775Employees
2010/11 2011/12

Developing the future.
Charts on 3rd Quarter 2011/12August 10, 2012
61
Marine Systems
Key figures
Q1 Q2 Q3 Q4 FY Q1 Q2 Q3
Order intake €m 426 149 2,155 247 2,977 222 731 456
Sales €m 504 219 479 291 1,493 366 220 294
EBITDA €m 51 87 71 28 237 45 66 28
EBITDA adjusted €m 51 87 71 28 237 45 69 28
EBIT €m 46 84 62 21 214 (116) 61 23
EBIT adjusted €m 46 84 62 21 214 39 78 23
Ø Capital Employed €m 1,289 1,335 1,344 1,334 1,334 1,241 1,184 1,144
OCF €m (25) 47 613 (300) 334 (94) 92 444
CF from divestm. €m 11 5 0 0 16 0 (30) 1
CF for investm. €m (1) (3) (4) (6) (14) (2) (3) (5)
FCF €m (16) 50 609 (306) 337 (96) 59 440
5,407 5,372 5,398 5,295 5,295 5,301 3,731 3,781Employees
2010/11 2011/12

Developing the future.
Charts on 3rd Quarter 2011/12August 10, 2012
62
Discontinued Operation: Stainless Global
Key figures
Q1 Q2 Q3 Q4 FY Q1 Q2 Q3
Order intake €m 1,483 1,790 1,360 1,412 6,045 1,372 1,618 1,291
Sales €m 1,605 1,856 1,586 1,692 6,739 1,438 1,768 1,606
EBITDA €m 48 103 43 (6) 188 (57) (7) (86)
EBITDA adjusted €m 48 103 43 (6) 188 (55) 17 (21)
EBIT €m 7 59 0 (851) (785) (321) (303) (145)
EBIT adjusted €m 7 59 0 (51) 15 (56) 19 (21)
TK Value Added €m (1,087)
Ø Capital Employed €m 3,362 3,414 3,442 3,356 3,356 2,870 2,700 2,615
OCF €m (308) 83 (139) 270 (95) (215) (64) (54)
CF from divestm. €m 6 (4) 0 0 1 1 (32) 4
CF for investm. €m (61) (52) (54) (99) (266) (85) (98) (94)
11,196 11,292 11,339 11,490 11,490 11,630 11,771 11,806Employees
2010/11 2011/12

Developing the future.
Charts on 3rd Quarter 2011/12August 10, 2012
63
Corporate: Overview
Corporate
Q1 Q2 Q3 Q4 FY Q1 Q2 Q3
Order intake €m 31 33 32 47 143 33 39 34
Sales €m 31 33 32 47 143 35 37 34
EBITDA €m (78) (102) (109) (37) (326) (88) (109) (95)
EBIT €m (88) (111) (120) (58) (377) (99) (119) (106)
OCF €m 258 (452) (18) (553) (766) 221 (340) 1
2,578 2,649 2,705 2,803 2,803 2,814 2,895 2,986Employees
2010/11 2011/12

Developing the future.
Charts on 3rd Quarter 2011/12August 10, 2012
64
Business Area Overview – Quarterly Order Intake
million € Q1 Q2 Q3 Q4 FY Q1 Q2 Q3
Steel Europe 2,929 3,721 3,006 2,688 12,344 2,705 2,990 2,511
Steel Americas 84 268 504 437 1,293 583 632 413
Materials Services 3,259 3,918 3,973 3,618 14,768 3,201 3,573 3,235
Elevator Technology 1,306 1,358 1,320 1,297 5,281 1,466 1,541 1,575
Plant Technology 1,016 896 1,097 1,466 4,474 871 934 832
Components Technology 1,602 1,795 1,811 1,713 6,921 1,778 1,858 1,828
Marine Systems 426 149 2,155 247 2,977 222 731 456
Corporate 31 33 32 47 143 33 39 34
Consolidation (656) (811) (914) (702) (3,083) (781) (702) (653)
Continued operations 9,997 11,328 12,984 10,809 45,118 10,078 11,596 10,231
Stainless Global (disc. operations) 1,483 1,790 1,360 1,412 6,045 1,372 1,618 1,291
Group (incl. Stainless Global) 11,260 12,848 14,120 12,019 50,247 11,260 13,008 11,362
2010/11 2011/12

Developing the future.
Charts on 3rd Quarter 2011/12August 10, 2012
65
Business Area Overview – Quarterly Sales
million € Q1 Q2 Q3 Q4 FY Q1 Q2 Q3
Steel Europe 2,958 3,287 3,518 3,051 12,814 2,530 2,886 2,900
Steel Americas 86 260 429 364 1,139 498 546 543
Materials Services 3,311 3,704 3,980 3,781 14,776 3,145 3,408 3,369
Elevator Technology 1,299 1,267 1,298 1,389 5,253 1,348 1,322 1,429
Plant Technology 897 969 943 1,195 4,004 943 983 1,027
Components Technology 1,599 1,769 1,779 1,761 6,908 1,753 1,880 1,852
Marine Systems 504 219 479 291 1,493 366 220 294
Corporate 31 33 32 47 143 35 37 34
Consolidation (665) (828) (952) (729) (3,174) (722) (669) (738)
Continued operations 10,020 10,680 11,506 11,150 43,356 9,896 10,613 10,710
Stainless Global (disc. operations) 1,605 1,856 1,586 1,692 6,739 1,438 1,768 1,606
Group (incl. Stainless Global) 11,370 12,266 12,851 12,605 49,092 11,138 12,155 12,116
2010/11 2011/12

Developing the future.
Charts on 3rd Quarter 2011/12August 10, 2012
66
Business Area Overview – Quarterly EBITDA and Margin
million € Q1 Q2 Q3 Q4 FY Q1 Q2 Q3
Steel Europe 399 439 458 374 1,670 225 142 163
% 13.5 13.4 13.0 12.3 13.0 8.9 4.9 5.6Steel Americas (328) (211) (95) (252) (886) (205) (139) (171)
% n.a. n.a. n.a. n.a. n.a. n.a. n.a. n.a.Materials Services 117 197 181 166 661 65 99 (20)
% 3.5 5.3 4.5 4.4 4.5 2.1 2.9 (0.6)Elevator Technology 189 165 168 353 875 132 139 156
% 14.5 13.0 12.9 25.4 16.7 9.8 10.5 10.9Plant Technology 115 148 149 138 550 134 125 150
% 12.8 15.3 15.8 11.5 13.7 14.2 12.7 14.6Components Technology 196 186 220 178 780 243 203 548
% 12.3 10.5 12.4 10.1 11.3 13.9 10.8 29.6Marine Systems 51 87 71 28 237 45 66 28
% 10.1 39.7 14.8 9.6 15.9 12.3 30.0 9.5Corporate (78) (102) (109) (37) (326) (88) (109) (95)
Consolidation (69) (82) (99) (102) (352) (80) (94) (100)
Continued operations 592 827 944 846 3,209 471 432 659% 5.9 7.7 8.2 7.6 7.4 4.8 4.1 6.2
Stainless Global (disc. operations) 48 103 43 (6) 188 (57) (7) (86)
% 3.0 5.5 2.7 (0.4) 2.8 (4.0) (0.4) (5.4)
Group (incl. Stainless Global) 645 932 983 825 3,385 412 424 573% 5.7 7.6 7.6 6.5 6.9 3.7 3.5 4.7
2010/11 2011/12

Developing the future.
Charts on 3rd Quarter 2011/12August 10, 2012
67
Business Area Overview – Quarterly EBITDA adjusted and Margin
million € Q1 Q2 Q3 Q4 FY Q1 Q2 Q3
Steel Europe 399 439 458 374 1,670 225 150 168
% 13.5 13.4 13.0 12.3 13.0 8.9 5.2 5.8Steel Americas (328) (211) (95) (79) (713) (205) (137) (170)
% n.a. n.a. n.a. n.a. n.a. n.a. n.a. n.a.Materials Services 117 197 181 173 668 65 98 130
% 3.5 5.3 4.5 4.6 4.5 2.1 2.9 3.9Elevator Technology 189 165 168 194 716 161 148 168
% 14.5 13.0 12.9 14.0 13.6 11.9 11.2 11.8Plant Technology 115 148 149 138 550 134 124 149
% 12.8 15.3 15.8 11.5 13.7 14.2 12.6 14.5Components Technology 196 186 220 176 778 178 203 209
% 12.3 10.5 12.4 10.0 11.3 10.2 10.8 11.3Marine Systems 51 87 71 28 237 45 69 28
% 10.1 39.7 14.8 9.6 15.9 12.3 31.4 9.5Corporate (78) (102) (88) (37) (305) (90) (110) (97)
Consolidation (69) (82) (99) (102) (352) (80) (93) (99)
Continued operations 592 827 965 865 3,249 433 452 485% 5.9 7.7 8.4 7.8 7.5 4.4 4.3 4.5
Stainless Global (disc. operations) 48 103 43 (6) 188 (55) 17 (21)
% 3.0 5.5 2.7 (0.4) 2.8 (3.8) 1.0 (1.3)
Group (incl. Stainless Global) 645 932 1,004 844 3,425 374 471 463% 5.7 7.6 7.8 6.7 7.0 3.4 3.9 3.8
2010/11 2011/12

Developing the future.
Charts on 3rd Quarter 2011/12August 10, 2012
68
million € Q1 Q2 Q3 Q4 FY Q1 Q2 Q3
Steel Europe 258 300 322 253 1,133 102 21 47
% 8.7 9.1 9.2 8.3 8.8 4.0 0.7 1.6Steel Americas (378) (319) (190) (2,258) (3,146) (288) (230) (263)
% n.a. n.a. n.a. n.a. n.a. n.a. n.a. n.a.Materials Services 85 163 149 81 478 40 74 (42)
% 2.6 4.4 3.7 2.1 3.2 1.3 2.2 (1.2)
Elevator Technology 171 147 151 332 801 113 118 134
% 13.2 11.6 11.6 23.9 15.2 8.4 8.9 9.4Plant Technology 107 139 131 129 506 125 114 140
% 11.9 14.3 13.9 10.8 12.6 13.3 11.6 13.6Components Technology 127 114 141 161 543 169 128 459
% 7.9 6.4 7.9 9.1 7.9 9.6 6.8 24.8Marine Systems 46 84 62 21 214 (116) 61 23
% 9.1 38.4 12.9 7.2 14.3 (31.7) 27.7 7.8Corporate (88) (111) (120) (58) (377) (99) (119) (106)
Consolidation (67) (82) (97) (96) (342) (79) (91) (96)
Continued operations 261 435 549 (1,435) (190) (33) 76 296% 2.6 4.1 4.8 (12.9) (0.4) (0.3) 0.7 2.8
Stainless Global (disc. operations) 7 59 0 (851) (785) (321) (303) (145)
% 0.4 3.2 0.0 (50.3) (11.6) (22.3) (17.1) (9.0)
Group (incl. Stainless Global) 273 497 545 (2,303) (988) (357) (228) 151% 2.4 4.1 4.2 (18.3) (2.0) (3.2) (1.9) 1.2
2010/11 2011/12
Business Area Overview – Quarterly EBIT and Margin

Developing the future.
Charts on 3rd Quarter 2011/12August 10, 2012
69
Business Area Overview – Quarterly EBIT adjusted and Margin
million € Q1 Q2 Q3 Q4 FY Q1 Q2 Q3
Steel Europe 258 300 322 253 1,133 102 30 52
% 8.7 9.1 9.2 8.3 8.8 4.0 1.0 1.8Steel Americas (378) (319) (190) (184) (1,071) (288) (228) (262)
% n.a. n.a. n.a. n.a. n.a. n.a. n.a. n.a.Materials Services 85 163 149 136 533 40 90 92
% 2.6 4.4 3.7 3.6 3.6 1.3 2.6 2.7Elevator Technology 171 147 151 172 641 142 132 147
% 13.2 11.6 11.6 12.4 12.2 10.5 10.0 10.3Plant Technology 107 139 131 129 506 125 115 140
% 11.9 14.3 13.9 10.8 12.6 13.3 11.7 13.6Components Technology 127 114 141 121 503 103 128 134
% 7.9 6.4 7.9 6.9 7.3 5.9 6.8 7.2Marine Systems 46 84 62 21 214 39 78 23
% 9.1 38.4 12.9 7.2 14.3 10.7 35.5 7.8Corporate (88) (111) (99) (58) (356) (101) (120) (107)
Consolidation (67) (82) (97) (96) (342) (79) (91) (97)
Continued operations 261 435 570 495 1,761 83 134 122% 2.6 4.1 5.0 4.4 4.1 0.8 1.3 1.1
Stainless Global (disc. operations) 7 59 0 (51) 15 (56) 19 (21)
% 0.4 3.2 0.0 (3.0) 0.2 (3.9) 1.1 (1.3)
Group (incl. Stainless Global) 273 497 566 427 1,763 25 152 101% 2.4 4.1 4.4 3.4 3.6 0.2 1.3 0.8
2010/11 2011/12

Developing the future.
Charts on 3rd Quarter 2011/12August 10, 2012
70
Business Area Overview – Quarterly Operating Cash Flow
million € Q1 Q2 Q3 Q4 FY Q1 Q2 Q3
Steel Europe (433) 323 184 608 682 (632) 301 401
Steel Americas (585) (361) (269) (174) (1,389) (364) (189) (99)
Materials Services (497) 104 (16) 907 498 (441) 23 11
Elevator Technology 52 168 87 315 623 (49) 169 89
Plant Technology 118 (26) 129 267 488 (116) 51 (76)
Components Technology (25) 46 146 277 444 (121) 64 143
Marine Systems (25) 47 613 (300) 334 (94) 92 444
Corporate 258 (452) (18) (553) (766) 221 (340) 1
Consolidation 43 7 (14) 61 97 18 (21) (12)
Continued operations (1,094) (145) 843 1,408 1,012 (1,578) 150 902
Disc. operations (341) 66 (134) 173 (236) (237) (54) (31)
Group (incl. Stainless Global) (1,435) (79) 709 1,582 776 (1,815) 96 871
2010/11 2011/12

Developing the future.
Charts on 3rd Quarter 2011/12August 10, 2012
71
Business Area Overview (I)
9M 2010/11
9M 2011/12
9M 2010/11
9M 2011/12
9M 2010/11
9M 2011/12
Steel Europe 9,656 8,206 9,763 8,316 33,702 28,104
Steel Americas 856 1,628 775 1,587 3,995 4,236
Materials Services 11,150 10,009 10,995 9,922 35,440 27,945
Elevator Technology 3,984 4,582 3,864 4,099 45,603 46,656
Plant Technology 3,009 2,637 2,809 2,953 13,194 14,105
Components Technology 5,208 5,464 5,147 5,485 31,049 27,775
Marine Systems 2,730 1,409 1,202 880 5,398 3,781
Corporate 96 106 96 106 2,705 2,986
Consolidation (2,380) (2,136) (2,445) (2,129) - -
Continued operations 34,309 31,905 32,206 31,219 171,086 155,588
Stainless Global (disc. operations) 4,633 4,281 5,047 4,812 11,339 11,806
Group (incl. Stainless Global) 38,228 35,630 36,487 35,409 182,425 167,394
Order Intake (€m) Sales (€m) Employees

Developing the future.
Charts on 3rd Quarter 2011/12August 10, 2012
72
Business Area Overview (II)
9M 2010/11
9M 2011/12
9M 2010/11
9M 2011/12
9M 2010/11
9M 2011/12
9M 2010/11
9M 2011/12
Steel Europe 1,296 530 1,296 543 880 170 880 184
Steel Americas (634) (515) (634) (512) (887) (781) (887) (778)
Materials Services 495 144 495 293 397 72 397 222
Elevator Technology 522 427 522 477 469 365 469 421
Plant Technology 412 409 412 407 377 379 377 380
Components Technology 602 994 602 590 382 756 382 365
Marine Systems 209 139 209 142 192 (32) 192 140
Corporate (289) (292) (268) (297) (319) (324) (298) (328)
Consolidation (250) (274) (250) (272) (246) (266) (246) (267)
Continued operations 2,363 1,562 2,384 1,371 1,245 339 1,266 339
Stainless Global (disc. op.) 194 (150) 194 (59) 66 (769) 66 (58)
Group (incl. Stainless Global) 2,560 1,409 2,581 1,308 1,315 (434) 1,336 278
EBITDA (€m) EBIT (€m) EBIT adjusted (€m)EBITDA adjusted (€m)

Developing the future.
Charts on 3rd Quarter 2011/12August 10, 2012
73
Special ItemsBusiness Area(million €) Q1 Q2 Q3 Q4 FY Q1 Q2 Q3
Steel EuropeAsset disposals (9) (5)
Steel Americas:Impairment related charges (2,075) (2,075)Asset disposal (2) (1)
Materials Services:Disposal Xervon (55) (55)Impairment (16)Rail cartel case (133)
Elevator Technology:Refund anti-trust fine 160 160Restructuring (29) (14) (13)
Plant TechnologyImpairment (1)
Components Technology:Impairment Waupaca 40 40Disposal Auto Systems (Brazil) & Healthcare savings Waupaca 66
Impairment (13)Disposal effect Waupaca & others 338
Marine Systems:Impairment (155) (17)
Corporate:Provision for litigation risks (21) (21)Others 2 1 1
Continued operations (21) (1,930) (1,951) (116) (58) 174
Stainless Global:Goodwill impairment/IFRS 5 charge (800) (800) (265) (250) (59)Impairment (48)Restructuring (63)Others (24) (3)
Group (incl. Stainless Global) (21) (2,730) (2,751) (381) (380) 50
2010/11 2011/12

Developing the future.
Charts on 3rd Quarter 2011/12August 10, 2012
74
P&L Structure
ThyssenKrupp-specific Key Figures (I): EBIT DefinitionQ3 2011/12: Reconciliation “Income from operations” (P&L Structure) to EBIT
Net sales 10,710
- Cost of sales 1) (9,345)
- SG&A 1), R&D (1,269)
+/- Other income/expense (110)
+/- Other gains/losses 310
= Income from operations 296
+/- Income from companies using equity method 14
+/- Finance income/expense (169)incl. capitalized interest exp. of €10 m
= EBT 141
EBIT definition
Net sales 10,710
- Cost of sales 1) (9,345)
- SG&A 1), R&D (1,269)
+/- Other income/expense (110)
+/- Other gains/losses 310
+/- Income from companies using equity method 14
+ Adjustm. for depreciation on cap. interest 11
+/- Adjustm. for oper. items in fin. income/expense (25)
= EBIT 296
+/- Finance income/expense (169)incl. capitalized interest exp. of €10 m
- Depreciation on capitalized interest (11)
+/- Operating items in fin. income/expense 25
= EBT 141
1) incl. depreciation on capitalized interest expenses of €(11) m

Developing the future.
Charts on 3rd Quarter 2011/12August 10, 2012
75
Net sales 31,219
- Cost of sales 1) (27,272)
- SG&A 1), R&D (3,811)
+/- Other income/expense (209)
+/- Other gains/losses 347
= Income from operations 274
+/- Income from companies using equity method 26
+/- Finance income/expense (433)incl. capitalized interest exp. of €29 m
= EBT (133)
P&L Structure
ThyssenKrupp-specific Key Figures (I): EBIT Definition9M 2011/12: Reconciliation “Income from operations” (P&L Structure) to EBIT
EBIT definition
Net sales 31,219
- Cost of sales 1) (27,272)
- SG&A 1), R&D (3,811)
+/- Other income/expense (209)
+/- Other gains/losses 347
+/- Income from companies using equity method 26
+ Adjustm. for depreciation on cap. interest 32
+/- Operating items in fin. income/expense 7
= EBIT 339
+/- Finance income/expense (433)incl. capitalized interest exp. of €29 m
- Depreciation on capitalized interest (32)
+/- Operating items in fin. income/expense (7)
= EBT (133)
1) incl. depreciation on capitalized interest expenses of €(32) m

Developing the future.
Charts on 3rd Quarter 2011/12August 10, 2012
76
ThyssenKrupp Value Added (TKVA)
ThyssenKrupp-specific Key Figures (II): EBIT/EBT adjusted & TKVA
Measurement of value added in a periodat all levels of the Group
TKVA
EBIT
Cost of Capital
Capital Employed
WACCx
-
Reported only on full-year basis
EBIT / EBT adjusted (= Key Performance Indicator of ThyssenKrupp)
Earnings adjusted for special, nonrecurring items:
Special items to be eliminated include disposal gains/losses, restructuring expense, impairment losses, other non-operating expense and other non-operating income. These special items are positive or negative effects that occur only once or infrequently, are of material importance due to their type or amount and thus affect the results of our operating activities.
EBIT increased by an imputed income contribution calculated by assigning a return to the average net advance payments surplus equal to the WACC for the business areas
Capital Employed is also increased by the amount of the net advance payments surpluses
Imputed income contributions in EBIT and increases to Capital Employed are eliminated at Group level during consolidation and therefore not included in the Group's key figures
EBIT & Capital Employed at Business Area level:

Developing the future.
Charts on 3rd Quarter 2011/12August 10, 2012
77
Disclaimer ThyssenKrupp AG
“The information set forth and included in this presentation is not provided in connection with an offer or solicitation for the purchase or sale of a security and is intended for informational purposes only.
This presentation contains forward-looking statements that are subject to risks and uncertainties. Statements contained herein that are not statements of historical fact may be deemed to be forward-looking information. When we use words such as “plan,” “believe,”“expect,” “anticipate,” “intend,” “estimate,” “may” or similar expressions, we are making forward-looking statements. You should not rely on forward-looking statements because they are subject to a number of assumptions concerning future events, and are subject to a number of uncertainties and other factors, many of which are outside of our control, that could cause actual results to differmaterially from those indicated. These factors include, but are not limited to, the following:(i) market risks: principally economic price and volume developments, (ii) dependence on performance of major customers and industries, (iii) our level of debt, management of interest rate risk and hedging against commodity price risks;(iv) costs associated with, and regulation relating to, our pension liabilities and healthcare measures, (v) environmental protection and remediation of real estate and associated with rising standards for real estate environmental protection, (vi) volatility of steel prices and dependence on the automotive industry, (vii) availability of raw materials; (viii) inflation, interest rate levels and fluctuations in exchange rates; (ix) general economic, political and business conditions and existing and future governmental regulation; and (x) the effects of competition. Please note that we disclaim any intention or obligation to update or revise any forward-looking statements whether as a result of new information, future events or otherwise.”