Embed Size (px)
Citation preview

1
First Quarter ReportFor the period ended March 31, 2018
FIR
ST
QU
AR
TE
R R
EP
OR
T 20
18P
OW
ER
FIN
AN
CIA
L C
OR
PO
RA
TIO
N


POWER FINANCIAL CORPORATION�— �FIRST QUARTER REPORT 2018 1
To the Shareholders
Consolidated Results of Power FinancialFor the three months ended March 31, 2018
Power Financial Corporation’s net earnings attributable to common shareholders and adjusted net earnings attributable to common shareholders (a non-IFRS fi nancial measure)�[1] were $586 million or $0.82 per share, compared with net earnings of $484 million, or $0.68 per share, and adjusted net earnings of $501 million, or $0.70 per share, in 2017.
Contributions to Power Financial’s adjusted net earnings were:
(in millions of dollars) 2018 2017
Great-West Lifeco Inc. (Lifeco) 495 419IGM Financial Inc. (IGM) 107 104Pargesa Holding SA (Pargesa) 44 43Power Financial Corporate and Other (60) (65)
586 501
Results of Great-West Lifeco, IGM Financial and Pargesa HoldingFor the three months ended March 31, 2018
GREAT-WE ST LIFECO INC .
Net earnings and adjusted net earnings attributable to common shareholders were $731 million or $0.740 per share, compared with net earnings of $591 million, or $0.598 per share, and adjusted net earnings of $619 million, or $0.627 per share, in 2017.
On May 3, 2018, Lifeco declared a quarterly dividend of $0.3890 per common share, unchanged from the previous quarter.
IGM FINANCIAL INC .
Net earnings and adjusted net earnings available to common shareholders were $186 million or $0.77 per share, compared with $177 million or $0.74 per share in 2017.
On May 4, 2018, IGM declared a quarterly dividend of $0.5625 per common share, unchanged from the previous quarter.
PARGE SA HOLDING
Pargesa reported net earnings of SF61 million, compared with SF125 million in 2017. The 2018 results exclude Pargesa’s share of gains realized on private equity investments totalling SF57 million which, eff ective January 1, 2018, have been reclassifi ed as fair value through profi t and loss in accordance with IFRS 9�[2].
On May 3, 2018, Pargesa declared a dividend of SF2.50 per bearer share, an increase of 2.5% over the previous year.
On behalf of the Board of Directors,
Paul Desmarais, Jr., O.C., O.Q. André Desmarais, O.C., O.Q. R. Jeff rey OrrExecutive Co-Chairman Executive Co-Chairman President andof the Board of the Board Chief Executive Offi cer
May 10, 2018
1 Non-IFRS fi nancial measures do not have standard meanings and may not be comparable to similar measures used by other entities. See the “Non-IFRS Financial Measures and Presentation” section within the enclosed management’s discussion and analysis of the Corporation for further disclosure concerning non-IFRS fi nancial measures.
2 On January 1, 2018, Pargesa adopted IFRS 9 which resulted in the reclassifi cation of the majority of its investments (excluding private equity funds) from available for sale (AFS) to fair value through other comprehensive income (FVOCI). All changes in fair value of equity investments designated as FVOCI are recognized permanently in other comprehensive income.
Investments in private equity funds were reclassifi ed from AFS to fair value through profi t or loss (FVPL) and unrealized gains accumulated to December 31, 2017 were transferred to retained earnings. Power Financial continues to apply IAS 39 and its share of these gains realized on private equity investments of $21 million has been included in the contribution from Pargesa.
PFC_QUAT1_Eng00_Letter.indd 1PFC_QUAT1_Eng00_Letter.indd 1 2018-05-10 12:18 AM2018-05-10 12:18 AM
Signed, Signed, Signed,

2 POWER FINANCIAL CORPORATION�— �FIRST QUARTER REPORT 2018
Page intentionally left blank.
PFC_QUAT1_Eng00_Letter.indd 2PFC_QUAT1_Eng00_Letter.indd 2 2018-05-10 12:18 AM2018-05-10 12:18 AM

PA
RT
B
GR
EA
T-WE
ST LIFECO
INC
.P
AR
T C
IG
M FIN
AN
CIA
L INC
.P
AR
T D
PA
RG
ESA
HO
LDIN
G SA
PA
RT
AP
OW
ER FIN
AN
CIA
L CO
RP
OR
ATIO
N
POWER FINANCIAL CORPORATIONTABLE OF CONTENTS
POWER FINANCIAL CORPORATION PART A
GREAT-WEST LIFECO INC. PART B
IGM FINANCIAL INC. PART C
PARGESA HOLDING SA PART D
This document contains management’s discussion and analysis of the fi nancial condition,
fi nancial performance and cash fl ows of Power Financial Corporation (the Corporation) for
the three months ended March 31, 2018 and the unaudited interim condensed consolidated
fi nancial statements of the Corporation as at and for the three months ended March 31, 2018.
This document has been fi led with the securities regulatory authorities in each of the provinces
and territories of Canada and mailed to requesting shareholders of the Corporation in
accordance with applicable securities laws.
POWER FINANCIAL CORPORATION�— �FIRST QUARTER REPORT 2018 3
PFC_QUAT1_Eng01_PFC_2018-05-09_v1.indd 3PFC_QUAT1_Eng01_PFC_2018-05-09_v1.indd 3 18-05-10 12:00 AM18-05-10 12:00 AM

The trademarks contained in this report are owned by Power Financial Corporation or by a Member of the
Power Corporation Group of Companies®. Trademarks that are not owned by Power Financial are used
with permission.
4 POWER FINANCIAL CORPORATION�— �FIRST QUARTER REPORT 2018
PFC_QUAT1_Eng01_PFC_2018-05-09_v1.indd 4PFC_QUAT1_Eng01_PFC_2018-05-09_v1.indd 4 18-05-10 12:00 AM18-05-10 12:00 AM

PA
RT
AP
OW
ER FIN
AN
CIA
L CO
RP
OR
ATIO
NMANAGEMENT’S DISCUSSION AND ANALYSIS
PAG E A 2
FINANCIAL STATEMENTS AND NOTES
PAG E A 35
POWER FINANCIAL CORPORATIONPART A
POWER FINANCIAL CORPORATION�— �FIRST QUARTER REPORT 2018 A 1
PFC_QUAT1_Eng01_PFC_2018-05-09_v1.indd B1PFC_QUAT1_Eng01_PFC_2018-05-09_v1.indd B1 18-05-09 10:54 PM18-05-09 10:54 PM

PA
RT
AP
OW
ER F
INA
NC
IAL
CO
RP
OR
ATI
ON
Power Financial Corporation Management’s Discussion and Analysis
MAY 10, 2018 ALL TABULAR AMOUNTS ARE IN MILLIONS OF CANADIAN DOLLARS, UNLESS OTHERWISE NOTED.
The following presents Management’s Discussion and Analysis (MD&A) of the unaudited interim condensed consolidated financial condition and financial performance of Power Financial Corporation (Power Financial or the Corporation) (TSX: PWF), a public corporation, for the three-month period ended March 31, 2018. This MD&A should be read in conjunction with the unaudited interim condensed consolidated financial statements of Power Financial and notes thereto for the three-month period ended March 31, 2018 (the Interim Consolidated Financial Statements), the MD&A for the year ended December 31, 2017 (the 2017 Annual MD&A), and the audited consolidated financial statements and notes thereto for the year ended December 31, 2017 (the 2017 Consolidated Financial Statements). Additional information relating to Power Financial, including its Annual Information Form, may be found on the Corporation’s website at www.powerfinancial.com and on SEDAR at www.sedar.com.
FORWARD-LOOKING STATEMENTS › Certain statements in this MD&A, other than statements of historical fact, are forward-looking statements based on certain assumptions and reflect the Corporation’s current expectations, or with respect to disclosure regarding the Corporation’s public subsidiaries, reflect such subsidiaries’ disclosed current expectations. Forward-looking statements are provided for the purposes of assisting the reader in understanding the Corporation’s financial performance, financial position and cash flows as at and for the periods ended on certain dates and to present information about management’s current expectations and plans relating to the future and the reader is cautioned that such statements may not be appropriate for other purposes. These statements may include, without limitation, statements regarding the operations, business, financial condition, expected financial results, performance, prospects, opportunities, priorities, targets, goals, ongoing objectives, strategies and outlook of the Corporation and its subsidiaries, as well as the outlook for North American and international economies for the current fiscal year and subsequent periods. Forward-looking statements include statements that are predictive in nature, depend upon or refer to future events or conditions, or include words such as “expects”, “anticipates”, “plans”, “believes”, “estimates”, “seeks”, “intends”, “targets”, “projects”, “forecasts” or negative versions thereof and other similar expressions, or future or conditional verbs such as “may”, “will”, “should”, “would” and “could”. By its nature, this information is subject to inherent risks and uncertainties that may be general or specific and which give rise to the possibility that expectations, forecasts, predictions, projections or conclusions will not prove to be accurate, that assumptions may not be correct and that objectives, strategic goals and priorities will not be achieved. A variety of factors, many of which are beyond the Corporation’s and its subsidiaries’ control, affect the operations, performance and results of the Corporation and its subsidiaries and their businesses, and could cause actual results to differ materially from current expectations of estimated or anticipated events or results. These factors include, but are not limited to: the impact or unanticipated impact of general economic, political and market factors in North America and internationally, fluctuations in interest, inflation and foreign exchange rates, monetary policies, business investment and the health of local and global equity and capital markets, management of market liquidity and funding risks, risks related to investments in private companies and illiquid securities, risks associated with financial instruments, changes in accounting policies and methods used to report financial condition (including uncertainties associated with significant judgments, estimates and assumptions), the effect of applying future accounting changes, business competition, operational and reputational risks, technological changes, cybersecurity risks, changes in government regulation and legislation, changes in tax laws, unexpected judicial or regulatory proceedings, catastrophic events, the Corporation’s and its subsidiaries’ ability to complete strategic transactions, integrate acquisitions and implement other growth strategies, and the Corporation’s and its subsidiaries’ success in anticipating and managing the foregoing factors. The reader is cautioned to consider these and other factors, uncertainties and potential events carefully and not to put undue reliance on forward-looking statements. Information contained in forward-looking statements is based upon certain material assumptions that were applied in drawing a conclusion or making a forecast or projection, including management’s perceptions of historical trends, current conditions and expected future developments, as well as other considerations that are believed to be appropriate in the circumstances, including that the list of factors in the previous paragraph, collectively, are not expected to have a material impact on the Corporation and its subsidiaries. While the Corporation considers these assumptions to be reasonable based on information currently available to management, they may prove to be incorrect. Other than as specifically required by applicable Canadian law, the Corporation undertakes no obligation to update any forward-looking statement to reflect events or circumstances after the date on which such statement is made, or to reflect the occurrence of unanticipated events, whether as a result of new information, future events or results, or otherwise. Additional information about the risks and uncertainties of the Corporation’s business and material factors or assumptions on which information contained in forward-looking statements is based is provided in its disclosure materials, including this MD&A and its most recent Annual Information Form, filed with the securities regulatory authorities in Canada and available at www.sedar.com.
The following abbreviations are used throughout this report: adidas BME Burberry Canada Life China AMC EBR EPA GBL GEA Great-West Financial or
Great-West Life & Annuity Great-West Life IFRS IGM or IGM Financial Investment Planning Counsel Investors Group Irish Life LafargeHolcim Lifeco
adidas AG Madrid Stock Exchange Burberry Group plc The Canada Life Assurance Company China Asset Management Co., Ltd Euronext Brussels Euronext Paris Groupe Bruxelles Lambert GEA Group Great-West Life & Annuity Insurance Company The Great-West Life Assurance Company International Financial Reporting Standards IGM Financial Inc. Investment Planning Counsel Inc. Investors Group Inc. Irish Life Group Limited LafargeHolcim Ltd Great-West Lifeco Inc.
LON London Life Mackenzie or
Mackenzie Investments Ontex PanAgora Pargesa Parjointco Parques Portag3 Power Corporation Putnam Retirement Advantage SGS SIX Total Umicore Wealthsimple XETR
London Stock Exchange London Life Insurance Company Mackenzie Financial Corporation Ontex N.V. PanAgora Asset Management, Inc. Pargesa Holding SA Parjointco N.V. Parques Reunidos Servicios Centrales, S.A. Portag3 Ventures Limited Partnership Power Corporation of Canada Putnam Investments, LLC MGM Advantage Holdings Ltd. SGS SA Swiss Stock Exchange Total SA Umicore, NV/SA Wealthsimple Financial Corp. XETRA Stock Exchange
A 2 POWER FINANCIAL CORPORATION�— �FIRST QUARTER REPORT 2018
PFC_QUAT1_Eng01_PFC_2018-05-09_v1.indd B2PFC_QUAT1_Eng01_PFC_2018-05-09_v1.indd B2 18-05-09 10:54 PM18-05-09 10:54 PM

PA
RT
AP
OW
ER FIN
AN
CIA
L CO
RP
OR
ATIO
NPOWER FINANCIAL CORPORATION
Organization of the Interim MD&A
Page Page Overview
Power Financial Corporation Financial Position Lifeco Cash Flows IGM Financial Capital Management Pargesa and GBL Risk Management Portag3 and Wealthsimple Financial Instruments and Other Instruments
Basis of Presentation Off-Balance Sheet Arrangements IFRS Financial Measures and Presentation Contingent Liabilities Non-IFRS Financial Measures and Presentation Commitments and Contractual Obligations
Changes in Accounting Policies Income Taxes Future Accounting Changes Transactions with Related Parties Results of Power Financial Summary of Critical Accounting Estimates and Judgments
Consolidated statements of earnings Internal Control over Financial Reporting Non-consolidated statements of earnings Summary of Quarterly Results Contribution to adjusted net earnings
Overview
POWER FINANCIAL CORPORATION Power Financial, a subsidiary of Power Corporation, is a diversified international management and holding company that holds interests substantially in the financial services sector in Canada, the U.S. and Europe. Founded in 1984 with the ambition of creating an integrated financial services group, Power Financial has remained committed to the growth and evolution of its primary holdings through its controlling interests in Lifeco and IGM. Power Financial also has an investment in Pargesa, a holding company with significant holdings in global industrial and services companies based in Europe. As a holding company, Power Financial’s objective is to create long-term shareholder value.
Since its formation, Power Financial has remained committed to driving growth and value primarily within the financial services sector. The leadership of Power Financial has prudently focused on protecting and increasing long-term shareholder value through its risk-aware strategy:
Holding significant investments in a limited number of companies with the potential for growth;
Supporting operating subsidiaries to develop leading positions within their industries;
Working with strong management teams toward sustainable earnings, profitable growth, and long-term shareholder value; and
Maintaining healthy balance sheets to protect shareholder value in slower economic periods or to seize new opportunities.
POWER FINANCIAL CORPORATION�— �FIRST QUARTER REPORT 2018 A 3
PFC_QUAT1_Eng01_PFC_2018-05-09_v1.indd B3PFC_QUAT1_Eng01_PFC_2018-05-09_v1.indd B3 18-05-09 10:54 PM18-05-09 10:54 PM

PA
RT
AP
OW
ER F
INA
NC
IAL
CO
RP
OR
ATI
ON
POWER FINANCIAL CORPORATION
Value creation Power Financial is committed to developing market-leading businesses that in turn create long-term shareholder value. Its investment approach is guided by three overriding principles, from identifying the right investment to the oversight and evaluation of each investee company:
Investment Principles Invest in companies that have a long-term perspective and investment horizon Support operating companies’ management to build industry leaders Focus on high-growth and high return on equity products and market segments Perform a disciplined, fact-based analysis
Operating Principles Majority or significant level of ownership Focus on strategy, people and capital allocation Prudent, risk-aware and focus on creating and maintaining a strong balance sheet
Governance Principles Active governance model through boards of subsidiaries Board composition is a combination of Power Financial executives and external directors
Power Financial executives provide substantial industry and company knowledge External directors provide expertise and diverse perspectives
Current portfolio Lifeco and IGM have become leaders across the insurance, asset management and wealth and retirement business lines across Canada, the U.S. and Europe. Power Financial has supported them through various acquisitions and the group strategically benefits through: Group-wide distribution of products and services;
Collaborative product development;
Shared technologies and back-office capabilities;
Scale enhancement through key relationships and aggregated purchasing power; and
Collaborative approach to important industry developments.
Power Financial, in partnership with Lifeco and IGM, continues to collaborate on the future of the financial services market, which is rapidly changing. Recently, the group has developed a “fintech” strategy to invest in companies that have the potential to produce good returns. This strategy also enables the group to learn about new technology applications, how these disruptive business models will affect the current business and how to react to changes in the environment in order to be more effective.
Power Financial also holds jointly with the Frère Group of Belgium a controlling interest in Pargesa, a holding company which, through its subsidiary GBL, focuses on a limited number of significant holdings and a portfolio of private equity, debt and thematic funds. The Pargesa group has positioned its portfolio of companies for long-term value creation and shares the values and prudent investing approach of Power Financial. This investment provides Power Financial with a vehicle to create value in the European market.
A 4 POWER FINANCIAL CORPORATION�— �FIRST QUARTER REPORT 2018
PFC_QUAT1_Eng01_PFC_2018-05-09_v1.indd B4PFC_QUAT1_Eng01_PFC_2018-05-09_v1.indd B4 18-05-09 10:54 PM18-05-09 10:54 PM
PA
RT
AP
OW
ER FIN
AN
CIA
L CO
RP
OR
ATIO
NPOWER FINANCIAL CORPORATION
Organization of the MD&A The Corporation’s MD&A consists of four parts: Part A Power Financial, presented on a consolidated and non-consolidated basis;
Part B Lifeco’s interim MD&A, as prepared and disclosed by Lifeco in accordance with applicable securities legislation, and which is also available either directly from SEDAR (www.sedar.com) or from Lifeco’s website (www.greatwestlifeco.com);
Part C IGM’s interim MD&A, as prepared and disclosed by IGM in accordance with applicable securities legislation, and which is also available either directly from SEDAR (www.sedar.com) or from IGM’s website (www.igmfinancial.com);
Part D Pargesa’s financial results, derived from publicly disclosed information, as issued by Pargesa in its first quarter press release. Further information on Pargesa’s results is available on its website (www.pargesa.ch).
Lifeco (TSX: GWO) and IGM (TSX: IGM) are public companies listed on the Toronto Stock Exchange. Pargesa is a public company listed on the Swiss Stock Exchange (SIX: PARG).
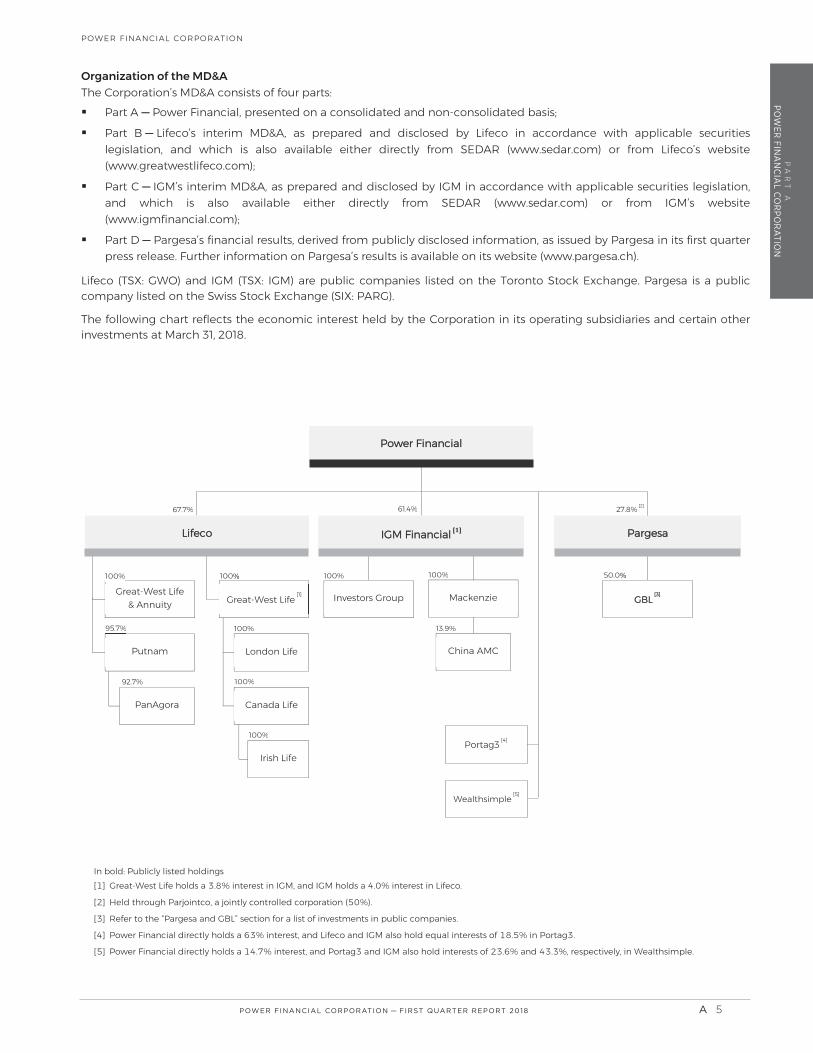
The following chart reflects the economic interest held by the Corporation in its operating subsidiaries and certain other investments at March 31, 2018.
PanAgora
In bold: Publicly listed holdings [ ] Great-
[ ] Held through
[ ] Refer to the “Pargesa and GBL” section for a list of investments in public companies.
[ ]
Power Financial directly holds a
Great-West Life [1]
Power Financial
Pargesa
London Life
Canada Life
Irish Life
Wealthsimple [5]
GBL [3]
Great-West Life
& Annuity
100%
Putnam
95.7
50.0% 61.4 [2]
Mackenzie
China AMC
Lifeco
Investors Group
IGM Financial [1]
92.7
Portag3 [4]
POWER FINANCIAL CORPORATION�— �FIRST QUARTER REPORT 2018 A 5
PFC_QUAT1_Eng01_PFC_2018-05-09_v1.indd B5PFC_QUAT1_Eng01_PFC_2018-05-09_v1.indd B5 18-05-09 10:54 PM18-05-09 10:54 PM

PA
RT
AP
OW
ER F
INA
NC
IAL
CO
RP
OR
ATI
ON
POWER FINANCIAL CORPORATION
LIFECO Great-West Lifeco Inc., TSX: GWO; market capitalization of $32.5 billion, is an international financial services holding company with interests in life insurance, health insurance, retirement and investment services, asset management and reinsurance businesses. Lifeco has operations in Canada, the United States and Europe through Great-West Life, London Life, Canada Life, Great-West Financial, Putnam and Irish Life. For reporting purposes, Lifeco has four reportable segments: Canada, the United States, Europe and Corporate, which reflect geographic lines as well as the management and corporate structure of the companies.
In Canada, through the Individual Customer and Group Customer business units, Lifeco offers a broad portfolio of financial and benefit plan solutions for individuals, families, businesses and organizations, including life, disability and critical illness insurance products as well as wealth accumulation, annuity and other speciality products.
The European segment is comprised of two distinct business units, Insurance & Annuities and Reinsurance, which offer protection and wealth management products, including payout annuity products and reinsurance products.
The United States segment operates two business units, Financial Services and Asset Management. Its Financial Services unit serves all segments of the employer-sponsored retirement plan market and offers employer-sponsored defined contribution plans, individual retirement accounts, enrolment services, communication materials, investment options and education services as well as fund management, investment and advisory services. The Asset Management unit, Putnam, provides investment management, certain administrative functions, and distribution services as well as offers a broad range of investment products, including equity, fixed income, absolute return and alternative strategies. PanAgora, a Putnam affiliate, offers a broad range of investment solutions using sophisticated quantitative techniques.
At March 31, 2018, Power Financial and IGM held interests of 67.7 4.0 in Lifeco’s common shares, representing approximately 65 ts attached to all outstanding Lifeco voting shares. The Insurance Companies Act limits voting rights
See part B of this MD&A for additional information on Lifeco.
IGM FINANCIAL IGM Financial Inc., TSX: IGM; market capitalization of $9.1 billion, is a financial services company which serves the financial needs of Canadians through its principal subsidiaries, each operating distinctly, primarily within the advice segment of the financial services market. Its activities are carried out principally through its subsidiaries Investors Group, Mackenzie Investments and Investment Planning Counsel.
Investors Group offers an exclusive family of mutual funds and other investment vehicles, and a wide range of insurance, securities, mortgage products and other financial services. Investors Group provides its services through its exclusive network of consultants across Canada.
Mackenzie Investments is an investment management firm providing investment advisory and related services through multiple distribution channels: Retail, Strategic Alliances and Institutional. Mackenzie distributes its products and services primarily through a diversified distribution network of third-party financial advisors.
Mackenzie Investments holds a 13 e of the first fund management companies in China, which has developed and maintained its position among the market leaders in China’s asset management industry. China AMC’s assets under management, excluding subsidiary assets under management, were RMB870 billion (C$168 billion) at December 31, 2017. in China AMC. Power Cor AMC. Power Corporation and IGM have significant influence and account for their interests as an associate using the equity method.
Investment Planning Counsel is an independent distributor of financial products, services and advice in Canada.
At March 31, 2018, Power Financial and Great-West Life, a subsidiary of Lifeco, held interests of 61.4 3.8in IGM’s common shares.
See part C of this MD&A for additional information on IGM.
A 6 POWER FINANCIAL CORPORATION�— �FIRST QUARTER REPORT 2018
PFC_QUAT1_Eng01_PFC_2018-05-09_v1.indd B6PFC_QUAT1_Eng01_PFC_2018-05-09_v1.indd B6 18-05-09 10:54 PM18-05-09 10:54 PM

PA
RT
AP
OW
ER FIN
AN
CIA
L CO
RP
OR
ATIO
NPOWER FINANCIAL CORPORATION
PARGESA AND GBL Power Financial Europe B.V., a wholly owned subsidiary of Power Financial, and the Frère Group in Parjointco. At March 31, 2018, Parjointco held a 55.5 interest in Pargesa, representing 75.4 of the voting rights.
Pargesa, SIX: PARG; market capitalization of SF7.2 billion, is a holding company, which, at March 31, 2018interest in GBL, representing 51.8 of the voting rights. GBL, a Belgian holding company, is listed on the Brussels Stock Exchange.
GBL, EBR: GBLB; market capitalization of €15 billion, is one of the largest listed holding companies in Europe. As a holding company focused on long-term value creation, GBL relies on a stable, family shareholder base. Its portfolio is comprised of global industrial and services companies, leaders in their market, in which GBL plays its role of professional shareholder.
At March 31, 2018, GBL’s portfolio was comprised of investments in the following publicly traded companies:
Imerys (EPA: NK) – mineral-based specialty solutions for industry
SGS (SIX: SGSN) – testing, inspection and certification
LafargeHolcim (SIX: HOLN and EPA: LHN) – cement, aggregates and concrete
Pernod Ricard (EPA: RI) – wines and spirits
adidas (XETR: ADS) – design and distribution of sportswear
Umicore (EBR: UMI) – materials technology and recycling of precious metals
Total (EPA: FP) – oil, gas and chemical industries
Burberry (LON: BRBY) – a global luxury brand
Ontex (EBR: ONTEX) – disposable hygiene products
GEA (XETR: G1A) – supplier of equipment and project management for a wide range of processing industries primarily in the food and beverage sectors
Parques (BME: PQR) – operation of regional leisure parks
In addition, through its subsidiary Sienna Capital, GBL is developing a portfolio of private equity, debt and thematic funds.
At March 31, 2018, Pargesa’s net asset value was SF11,033 million, compared with SF10,851 million at December 31, 2017. GBL’s net asset value at March 31, 2018, was €19,079 million compared with €18,888 million at December 31, 2017.
See Part D of this MD&A for additional information on Pargesa.
PORTAG3 AND WEALTHSIMPLE Power Financial (along with IGM and Lifeco) controls Portag3, an investment fund dedicated to backing innovative financial services companies. Portag3 holds a 23.6 equity interest in Wealthsimple, a technology-driven investment manager with assets under administration of $2.2 billion at March 31, 2018. In addition to the interest held indirectly through Portag3, Power Financial and IGM also held, at March 31, 2018, equity interests in Wealthsimple of 14.7 and 43.3 .
In the first quarter of 2018, Power Financial and IGM invested $20 million and $45 million, respectively, in Wealthsimple. To date, the group has invested $183 million in Wealthsimple.
POWER FINANCIAL CORPORATION�— �FIRST QUARTER REPORT 2018 A 7
PFC_QUAT1_Eng01_PFC_2018-05-09_v1.indd B7PFC_QUAT1_Eng01_PFC_2018-05-09_v1.indd B7 18-05-09 10:54 PM18-05-09 10:54 PM
PA
RT
AP
OW
ER F
INA
NC
IAL
CO
RP
OR
ATI
ON
POWER FINANCIAL CORPORATION
Basis of Presentation
IFRS FINANCIAL MEASURES AND PRESENTATION The Interim Consolidated Financial Statements of the Corporation have been prepared in accordance with International Accounting Standard 34 Interim Financial Reporting (IAS 34) and are presented in Canadian dollars.
Consolidated financial statements present, as a single economic entity, the assets, liabilities, revenues, expenses and cash flows of the parent company and its subsidiaries. The consolidated financial statements present the financial results of Power Financial (parent) and Lifeco, IGM, Portag3 and Wealthsimple (Power Financial’s controlled operating subsidiaries) after the elimination of intercompany balances and transactions.
Power Financial’s investment in Pargesa is held through Parjointco. Parjointco is a holding company jointly controlled by Power Financial and the Frère Group. Power Financial’s investment in Parjointco is accounted for using the equity method, in which the investment is initially recognized at cost and adjusted thereafter for: Power Financial’s share of:
Net earnings or loss in Pargesa;
Other comprehensive income or loss in Pargesa; and
Pargesa’s other changes in equity.
Dividends received from Parjointco.
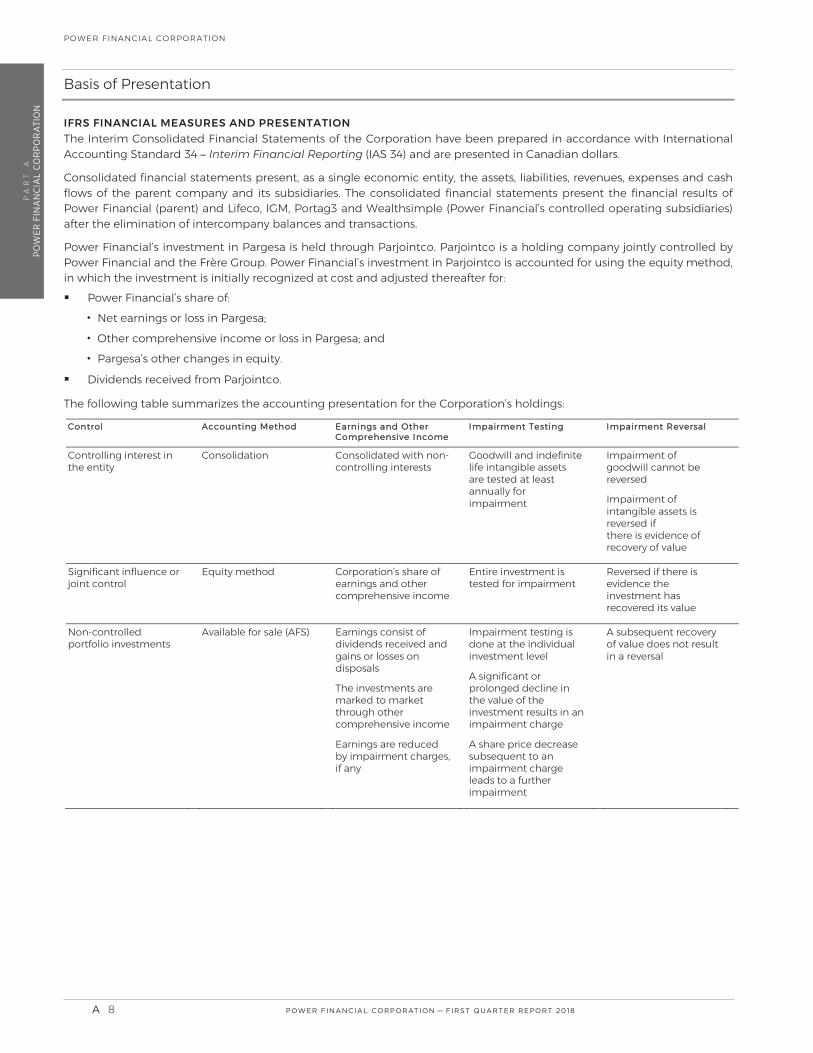
The following table summarizes the accounting presentation for the Corporation’s holdings:
CControl AAccounting MMethod EEarnings and Other CComprehensive Income
IImpairment Testing IImpairment Reversal
Controlling interest in the entity
Consolidation Consolidated with non-controlling interests
Goodwill and indefinite life intangible assets are tested at least annually for impairment
Impairment of goodwill cannot be reversed
Impairment of intangible assets is reversed if there is evidence of recovery of value
Significant influence or joint control
Equity method Corporation’s share of earnings and other comprehensive income
Entire investment is tested for impairment
Reversed if there is evidence the investment has recovered its value
Non-controlled portfolio investments
Available for sale (AFS) Earnings consist of dividends received and gains or losses on disposals
The investments are marked to market through other comprehensive income
Earnings are reduced by impairment charges, if any
Impairment testing is done at the individual investment level
A significant or prolonged decline in the value of the investment results in an impairment charge
A share price decrease subsequent to an impairment charge leads to a further impairment
A subsequent recovery of value does not result in a reversal
A 8 POWER FINANCIAL CORPORATION�— �FIRST QUARTER REPORT 2018
PFC_QUAT1_Eng01_PFC_2018-05-09_v1.indd B8PFC_QUAT1_Eng01_PFC_2018-05-09_v1.indd B8 18-05-09 10:54 PM18-05-09 10:54 PM

PA
RT
AP
OW
ER FIN
AN
CIA
L CO
RP
OR
ATIO
NPOWER FINANCIAL CORPORATION
At March 31, 2018, the Corporation’s holdings were as follows:
Holdings interest Nature of investment Accounting method
Lifeco [1] Controlling interest Consolidation IGM [2] Controlling interest Consolidation Pargesa [3] Joint control Equity method Portag3 [4] Controlling interest Consolidation Wealthsimple [5] Controlling interest Consolidation
IGM also Great-West Life also holds a 3.8
[ ] . Lifeco and IGM also hold equal interests
[ ] Portag3 and IGM also hold interests of 23.6 43.3 , respectively, in Wealthsimple.
At March 31, 2018, Pargesa’s holdings were as follows:
Holdings
interest Nature of investment Accounting method
GBL Controlling interest Consolidation Imerys Controlling interest Consolidation SGS Portfolio investment Available for sale LafargeHolcim Portfolio investment Available for sale Pernod Ricard Portfolio investment Available for sale adidas Portfolio investment Available for sale Umicore Portfolio investment Available for sale Total Portfolio investment Available for sale Burberry Portfolio investment Available for sale Ontex Portfolio investment Available for sale GEA Portfolio investment Available for sale Parques Significant influence Equity method
This summary of accounting presentation should be read in conjunction with the following notes to the Corporation’s 2017 Consolidated Financial Statements: Basis of presentation and summary of significant accounting policies (Note 2);
Investments (Note 5);
Investments in jointly controlled corporations and associates (Note 7);
Goodwill and intangible assets (Note 10); and
Non-controlling interests (Note 19).
POWER FINANCIAL CORPORATION�— �FIRST QUARTER REPORT 2018 A 9
PFC_QUAT1_Eng01_PFC_2018-05-09_v1.indd B9PFC_QUAT1_Eng01_PFC_2018-05-09_v1.indd B9 18-05-09 10:54 PM18-05-09 10:54 PM
PA
RT
AP
OW
ER F
INA
NC
IAL
CO
RP
OR
ATI
ON
POWER FINANCIAL CORPORATION
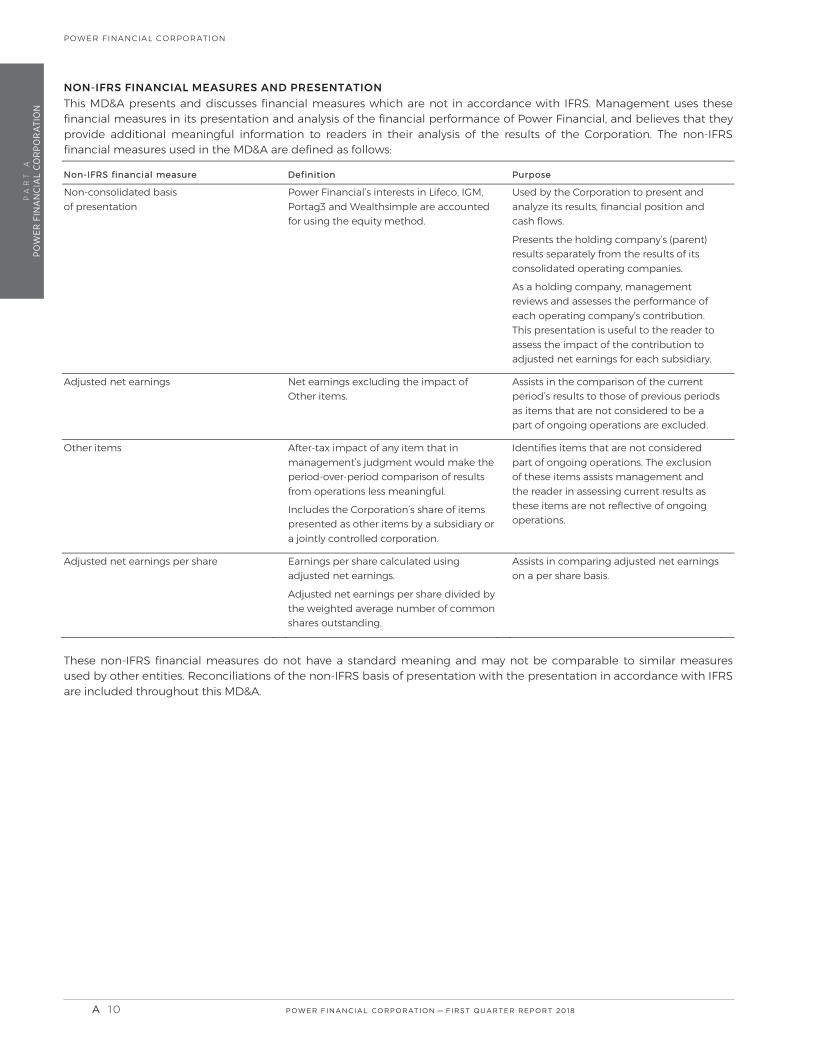
NON-IFRS FINANCIAL MEASURES AND PRESENTATION This MD&A presents and discusses financial measures which are not in accordance with IFRS. Management uses these financial measures in its presentation and analysis of the financial performance of Power Financial, and believes that they provide additional meaningful information to readers in their analysis of the results of the Corporation. The non-IFRS financial measures used in the MD&A are defined as follows:
NNon--IIFRS financial measure DDefinition PPurpose
Non-consolidated basis of presentation
Power Financial’s interests in Lifeco, IGM, Portag3 and Wealthsimple are accounted for using the equity method.
Used by the Corporation to present and analyze its results, financial position and cash flows.
Presents the holding company’s (parent) results separately from the results of its consolidated operating companies.
As a holding company, management reviews and assesses the performance of each operating company’s contribution. This presentation is useful to the reader to assess the impact of the contribution to adjusted net earnings for each subsidiary.
Adjusted net earnings
Net earnings excluding the impact of Other items.
Assists in the comparison of the current period’s results to those of previous periods as items that are not considered to be a part of ongoing operations are excluded.
Other items
After-tax impact of any item that in management’s judgment would make the period-over-period comparison of results from operations less meaningful.
Includes the Corporation’s share of items presented as other items by a subsidiary or a jointly controlled corporation.
Identifies items that are not considered part of ongoing operations. The exclusion of these items assists management and the reader in assessing current results as these items are not reflective of ongoing operations.
Adjusted net earnings per share
Earnings per share calculated using adjusted net earnings.
Adjusted net earnings per share divided by the weighted average number of common shares outstanding.
Assists in comparing adjusted net earnings on a per share basis.
These non-IFRS financial measures do not have a standard meaning and may not be comparable to similar measures used by other entities. Reconciliations of the non-IFRS basis of presentation with the presentation in accordance with IFRS are included throughout this MD&A.
A 10 POWER FINANCIAL CORPORATION�— �FIRST QUARTER REPORT 2018
PFC_QUAT1_Eng01_PFC_2018-05-09_v1.indd B10PFC_QUAT1_Eng01_PFC_2018-05-09_v1.indd B10 18-05-09 10:54 PM18-05-09 10:54 PM

PA
RT
AP
OW
ER FIN
AN
CIA
L CO
RP
OR
ATIO
NPOWER FINANCIAL CORPORATION
Reconciliation of IFRS and non-IFRS financial measures The following tables present a reconciliation of net earnings and earnings per share reported in accordance with IFRS to non-IFRS financial measures: adjusted net earnings, other items and adjusted net earnings per share. Adjusted net earnings and adjusted net earnings per share are presented in the section “Non-Consolidated Statements of Earnings”:
Three months ended March
March ,
Net earnings – IFRS financial measure [1]
Share of Other items, net of tax
Lifeco
IGM
Pargesa )
Adjusted net earnings – Non-IFRS financial measure [1]
[ ] Available to common shareholders of Power Financial.
Three months ended March
March ,
Net earnings per share – IFRS financial measure [1]
Share of Other items, net of tax
Lifeco
IGM
Adjusted net earnings per share – Non-IFRS financial measure [1]
[ ] Available to common shareholders of Power Financial.
Changes in Accounting Policies
There were no changes to the Corporation’s accounting policies from those reported at December 31, 2017, except as described below.
ADOPTION OF IFRS 15 – REVENUE FROM CONTRACTS WITH CUSTOMERS (IFRS 15) On January 1, 2018, the Corporation and its subsidiaries adopted IFRS 15, Revenue from Contracts with Customers which outlines a single comprehensive model for entities to use in accounting for revenue arising from contracts with customers (refer to Note 3 to the Interim Consolidated Financial Statements). The standard outlines criteria that determine whether the Corporation’s subsidiaries in the asset management industry are to capitalize and amortize contract costs or expense them.
The Corporation’s subsidiaries receive commissions on investment product sales where they either receive a fee directly from the client or directly from the mutual fund. The application of IFRS 15 has resulted in a change to the accounting policy related to commission expense as follows: Commissions that are paid on investment product sales where a fee is directly received from the client are capitalized
and amortized over their estimated useful lives, not exceeding a period of seven years.
All other commissions paid on investment product sales are expensed as incurred.
The Corporation and its subsidiaries have elected to apply the modified retrospective approach, as permitted by the transition provisions within IFRS 15. As a result of changes to the treatment of contract costs, Lifeco and IGM have recorded an adjustment for the derecognition of certain deferred acquisition costs included in other assets, deferred selling commissions included in intangible assets and related income tax liabilities which resulted in a decrease of $360 million in the opening retained earnings of the Corporation at January 1, 2018.
POWER FINANCIAL CORPORATION�— �FIRST QUARTER REPORT 2018 A 1 1
PFC_QUAT1_Eng01_PFC_2018-05-09_v1.indd B11PFC_QUAT1_Eng01_PFC_2018-05-09_v1.indd B11 18-05-09 10:54 PM18-05-09 10:54 PM

PA
RT
AP
OW
ER F
INA
NC
IAL
CO
RP
OR
ATI
ON
POWER FINANCIAL CORPORATION
The impact of the change in accounting policy on the consolidated balance sheet is as follows:
(as previously reported) Impact of change in
accounting policy
(restated )
AAssets Other assets ) Intangible assets – Deferred selling commissions )
)
LLiabilities aand sshhareholders’’ eeqquity Deferred tax liabilities ) Retained earnings ) Non-controlling interests )
)
Commission expenses are expected to decline in future years due to the change in treatment of the contract costs in accordance with IFRS 15 and changes in IGM’s commission structure in which there is an ongoing shift from sales-based commissions to asset-based commissions. In addition, the Corporation and its subsidiaries have reclassified fee and premium income amounts for 2017 comparative periods in the Consolidated Statements of Earnings and in this MD&A for the change in presentation of certain revenues and expenses on a gross or net basis. These reclassifications did not have an impact on net earnings. The implementation of IFRS 15 will result in a change in timing of the recognition of commission expenses. However, there is no effect on the cash flows of the Corporation’s subsidiaries. For a further description of the impact of the accounting policy change, refer to Note 3 of the Interim Consolidated Financial Statements for the period ended March 31, 2018.
Future Accounting Changes
The Corporation and its subsidiaries continuously monitor the potential changes proposed by the International Accounting Standards Board (IASB) and analyze the effect that changes in the standards may have on their consolidated financial statements when they become effective. There were no significant changes to the future accounting policies that could impact the Corporation and its subsidiaries, in addition to the disclosure in the 2017 MD&A, and the 2017 Consolidated Financial Statements other than as described below:
CURRENT IMPLICATION OF IFRS 9 – FINANCIAL INSTRUMENTS (IFRS 9) In July 2014, the IASB issued a final version of IFRS 9, Financial Instruments, which replaces IAS 39, Financial Instruments: Recognition and Measurement (IAS 39), the current standard for accounting for financial instruments, with an effective date of January 1, 2018. In September 2016, the IASB issued an amendment to IFRS 4, Insurance Contracts (IFRS 4). The amendment “Applying IFRS 9, Financial Instruments with IFRS 4, Insurance Contracts” provides qualifying insurance companies with two options to address the potential volatility associated with implementing the IFRS 9 standard before the new proposed insurance contract standard is effective. The two options are as follows:
Deferral Approach: provides the option to defer implementation of IFRS 9 until the year 2021 or the effective date of the new insurance contract standard, whichever is earlier; or
Overlay Approach: provides the option to recognize the volatility that could arise when IFRS 9 is applied within other comprehensive income, rather than profit or loss.
The Corporation qualifies and has elected to apply the deferral approach which permits the adoption of both IFRS 9 and IFRS 17 Insurance Contracts simultaneously on January 1, 2021. IGM, a subsidiary and Pargesa, held through Parjointco, a jointly controlled corporation do not qualify for the exemption and adopted IFRS 9 on January 1, 2018. The impact of adoption is disclosed in their publicly available information. The Corporation, in accordance with the amendment of IFRS 4 to defer the adoption of IFRS 9, is permitted but not required to retain the accounting policies applied by an associate or a jointly controlled corporation which is accounted for using the equity method. The Corporation has decided to continue applying accounting policies in accordance with IAS 39 to Pargesa’s results. On consolidation, the Corporation has adjusted the results of both IGM and Pargesa to be in accordance with IAS 39. Refer to the specific discussion included in the IGM and Pargesa sections “Contribution to adjusted net earnings”.
A 12 POWER FINANCIAL CORPORATION�— �FIRST QUARTER REPORT 2018
PFC_QUAT1_Eng01_PFC_2018-05-09_v1.indd B12PFC_QUAT1_Eng01_PFC_2018-05-09_v1.indd B12 18-05-09 10:54 PM18-05-09 10:54 PM

PA
RT
AP
OW
ER FIN
AN
CIA
L CO
RP
OR
ATIO
NPOWER FINANCIAL CORPORATION
Results of Power Financial
This section presents: The “Consolidated Statements of Earnings in accordance with IFRS”; and
The “Non-Consolidated Statements of Earnings”, which present the contributions of operating subsidiaries and Pargesa to the net earnings and adjusted net earnings of Power Financial.
Refer to the section “Non-IFRS Financial Measures and Presentation” for a description of the non-consolidated basis of presentation and a reconciliation of IFRS and non-IFRS financial measures.
CONSOLIDATED STATEMENTS OF EARNINGS IN ACCORDANCE WITH IFRS Power Financial’s consolidated statements of earnings for the three months ended March 31, 2018 are presented below. The Corporation’s operating segments are Lifeco, IGM and Pargesa. This table reflects the contributions from Lifeco, IGM and Pargesa to the net earnings attributable to Power Financial’s common shareholders.
Consolidated net earnings – Three months ended Lifeco IGM Pargesa Corporate [ ] Power Financial
Consolidated net earnings
March ,
December ,
March ,
RRevenues
Premium income, net [4] )
Net investment income )
Fee income [4] ( )
Total revenues ( )
EExpenses
Total paid or credited to policyholders
Commissions [4] )
Operating and administrative expenses [4]
Financing charges
Total expenses Earnings before investments in jointly
controlled corporations and associates, and income taxes )
Share of earnings of investments in jointly controlled corporations and associates
Earnings before income taxes )
Income taxes
NNet earnings ) AAttributable to
Non-controlling interests )
Perpetual preferred shareholders Common shareholders of
Power Financial ) )
[ ] Results reported by IGM are in accordance with IFRS 9 and include the transition impact related to the reclassification and remeasurement of certain mortgage loans. As the Corporation has not adopted IFRS 9, this adjustment has been reversed on consolidation and included in “Corporate”.
[ ] The Corporation’s share of earnings of Pargesa includes its share of gains realized on private equity investments in the first quarter, not included in Pargesa’s reported net earnings as it
[ ] “Corporate” is comprised of the results of Portag3 and Wealthsimple, the Corporation’s investment activities, corporate operations and consolidation entries.
[ ] Amounts in comparative periods have been reclassified; refer to section “Adoption of IFRS 15” for more details.
POWER FINANCIAL CORPORATION�— �FIRST QUARTER REPORT 2018 A 1 3
PFC_QUAT1_Eng01_PFC_2018-05-09_v1.indd B13PFC_QUAT1_Eng01_PFC_2018-05-09_v1.indd B13 18-05-09 10:54 PM18-05-09 10:54 PM

PA
RT
AP
OW
ER F
INA
NC
IAL
CO
RP
OR
ATI
ON
POWER FINANCIAL CORPORATION
The Corporation evaluates the performance of each segment based on its contribution to adjusted net earnings. A discussion of the results of Lifeco, IGM and Pargesa is provided in the “Contribution to adjusted net earnings” section below.
NON-CONSOLIDATED STATEMENTS OF EARNINGS In this section, the contributions from Lifeco and IGM to the net earnings and adjusted net earnings attributable to Power Financial’s common shareholders are accounted for using the equity method.
Three months ended March ,
March ,
AAdjusted net earnings [[1]
Lifeco [2]
IGM [2]
Pargesa [2]
Corporate operations ) ) )
Dividends on perpetual preferred shares ) ) )
AAdjusted net earnings [[3]
OOther items [[4]
Lifeco ) )
IGM )
Pargesa ) )
NNet earnings [[3] EEarnings per share –– bbasic [[3]
Adjusted net earnings
Other items ) )
Net earnings
] For a reconciliation of Lifeco, IGM and Pargesa’s non-IFRS adjusted net earnings to their net earnings, refer to the “Contribution to adjusted net earnings” section below.
[ ] The contributions from Lifeco and IGM include an allocation of the results of Wealthsimple and Portag3, based on their respective interest. Contributions from IGM and Pargesa reflect adjustments in accordance with IAS 39.
[ ] Attributable to common shareholders.
[ ] See “Other items” section below.
QQ1 2018 vs. Q1 2017 and Q4 2017
NNet earnings $586 million or $0.82 per share, compared with $484 million or $0.68 per share in the corresponding period in 2017, an increase of 20.6 , and $225 million or $0.32 per share in the fourth quarter of 2017.
AAdjusted net earnings $586 million or $0.82 per share, compared with $501 million or $0.70 per share in the corresponding period in 2017, an increase of 17.1on a per share basis, and $547 million or $0.77 per share in the fourth quarter of 2017.
CContribution to adjusted net earnings from Lifeco, IGGM and Pargesa Contribution of $646 million, compared with $566 million in the corresponding period in 2017, and $608 million in the fourth quarter of 2017.
A discussion of the results of the Corporation is provided in the sections “Contribution to adjusted net earnings”, “Corporate operations”, and “Other items” below.
A 14 POWER FINANCIAL CORPORATION�— �FIRST QUARTER REPORT 2018
PFC_QUAT1_Eng01_PFC_2018-05-09_v1.indd B14PFC_QUAT1_Eng01_PFC_2018-05-09_v1.indd B14 18-05-09 10:54 PM18-05-09 10:54 PM

PA
RT
AP
OW
ER FIN
AN
CIA
L CO
RP
OR
ATIO
NPOWER FINANCIAL CORPORATION
CONTRIBUTION TO ADJUSTED NET EARNINGS
LIFECO CContribution to Power Financial
Three months ended March
March ,
Contribution to Power Financial’s [1]:
Adjusted net earnings
As reported by Lifeco
Consolidation entries )
Other items ) )
NNet earnings
[ ] quarter ended March 31, 2018.
AAdjusted aand nnet earnings by ssegment aas reported by Lifeco
Three months ended March ,
March ,
CCanada
Individual Customer
Group Customer
Canada Corporate
UUnited States
Financial Services
Asset Management ) ) )
U.S. Corporate )
EEurope
Insurance and Annuities
Reinsurance
Europe Corporate ) )
LLifeco Corporate ) ) )
Adjusted net earnings [1]
Other items ) )
NNet earnings [[11]]
[ ] Attributable to Lifeco common shareholders.
QQ1 2018 vs. Q1 2017 and Q4 2017
AAdjusted net earnings $731 million or $0.740 per share, compared with $619 million or $0.627 per share in the corresponding period in 2017, an increase of 18on a per share basis, and $734 million or $0.742 per share in the fourth quarter of 2017.
POWER FINANCIAL CORPORATION�— �FIRST QUARTER REPORT 2018 A 1 5
PFC_QUAT1_Eng01_PFC_2018-05-09_v1.indd B15PFC_QUAT1_Eng01_PFC_2018-05-09_v1.indd B15 18-05-09 10:54 PM18-05-09 10:54 PM

PA
RT
AP
OW
ER F
INA
NC
IAL
CO
RP
OR
ATI
ON
POWER FINANCIAL CORPORATION
CCANADA
IIndividual Customer Net earnings for the three-month period ended March 31, 2018 decreased by $8 million to $138 million, compared with the same quarter last year. The decrease was primarily due to: Less favourable mortality experience and a lower impact from new business driven by lower insurance sales;
Partially offset by more favourable policyholder behaviour experience.
GGroup Customer Net earnings for the three-month period ended March 31, 2018 increased by $38 million to $142 million, compared with the same quarter last year. The increase was primarily due to: Favourable mortality and morbidity experience;
Higher contributions from insurance contract liability basis changes;
Lower expenses driven by the Canadian business transformation;
Partially offset by lower contributions from investment experience.
UUNITED STATES
FFinancial Services For the three-month period ended March 31, 2018, net earnings were US$72 million (C$91 million), compared with US$64 million (C$85 million) in the corresponding period in 2017. The increase of US$8 million was primarily due to: The impact of the U.S. corporate tax rate changes, which resulted in increased earnings of US$12 million;
Partially offset by a lower release of interest margins on insurance contract liabilities.
AAsset Management For the three-month period ended March 31, 2018, net loss was US$13 million (C$16 million), compared with a net loss of US$12 million (C$16 million) in the corresponding period in 2017. The increased loss of US$1 million was primarily due to: Lower net investment income, driven by lower gains on seed capital, a one-time expense associated with lowering
future technology expenses and higher variable incentive compensation;
Offset by higher fee income driven by higher assets under management;
The net loss includes lower financing costs, offset by the impact of a reduction in the U.S. corporate tax rate.
EEUROPE
IInsurance and Annuities Net earnings for the three-month period ended March 31, 2018 increased by $19 million to $244 million, compared with the same quarter last year. The increase was primarily due to: Improved mortality and morbidity experience, higher contributions from insurance contract liability basis changes
related to the impact of updated annuitant mortality assumptions and the impact of currency movement;
Partially offset by the impact of lower new business volumes in payout annuities, lower contributions from investment experience and a gain on the sale of Lifeco’s Allianz Ireland holdings in the first quarter of 2017.
RReinsurannce Net earnings for the three-month period ended March 31, 2018 increased by $23 million to $104 million, compared with the same quarter last year. The increase was primarily due to: Higher contributions from insurance contract liability basis changes;
Partially offset by lower impacts from new business gains.
A 16 POWER FINANCIAL CORPORATION�— �FIRST QUARTER REPORT 2018
PFC_QUAT1_Eng01_PFC_2018-05-09_v1.indd B16PFC_QUAT1_Eng01_PFC_2018-05-09_v1.indd B16 18-05-09 10:54 PM18-05-09 10:54 PM

PA
RT
AP
OW
ER FIN
AN
CIA
L CO
RP
OR
ATIO
NPOWER FINANCIAL CORPORATION
OOTHER ITEMS There were no Other items in the first quarter of 2018.
In the first and fourth quarters of 2017, Other items of $28 million and $342 million consisted mainly of:
FFirst quarter Restructuring charges of $28 million related to restructuring in the Financial Services business in the U.S. segment
and integration activities in the Insurance and Annuities business in Europe.
FFourth quarter Impact of the U.S. tax reform which resulted in a charge of $216 million:
On December 22, 2017, the Tax Reconciliation Act was substantively enacted by the U.S. and is generally effective for tax years beginning on January 1, 2018. The legislation results in significant tax reform and revises the Internal Revenue Code how the U.S. taxes multinational entities. The charge primarily related to the revaluation of certain deferred tax balances and the impact on insurance contract liabilities and expense provisions.
Net charge on sale of equity investment of $122 million:
Lifeco entered into an agreement to sell an equity investment in Nissay Asset Management Corporation (Nissay). The equity investment in Nissay was reclassified to assets held for sale and the net charge on the sale of $122 million was recognized, including the write-off of an associated indefinite life intangible asset.
The information above has been derived from Lifeco’s interim MD&A; see Part B of this MD&A for more information on Lifeco’s results.
POWER FINANCIAL CORPORATION�— �FIRST QUARTER REPORT 2018 A 1 7
PFC_QUAT1_Eng01_PFC_2018-05-09_v1.indd B17PFC_QUAT1_Eng01_PFC_2018-05-09_v1.indd B17 18-05-09 10:54 PM18-05-09 10:54 PM

PA
RT
AP
OW
ER F
INA
NC
IAL
CO
RP
OR
ATI
ON
POWER FINANCIAL CORPORATION
IGM FINANCIAL CContribution to Power Financial
Three months ended March
March ,
Contribution to Power Financial’s [1]:
Adjusted net earnings
As reported by IGM
Consolidation entries [2] ) ) )
Other items )
NNet earnings
[ ] The average direct ownership of Power Financial in IGM was 61.4 quarter ended March 31, 2018.
[ ] Contribution to Power Financial includes an adjustment in accordance with IAS 39 and the allocation of the results of Wealthsimple and Portag3.
AAdjusted and net earnings by segment as rreported by IGM (in accordance with IFRS 9)
Three months ended March ,
March ,
Investors Group
Mackenzie
Corporate and other
Adjusted net earnings (before interest, income taxes, preferred share dividends and other) [1]
Interest expense, income taxes, preferred share dividends and other ) ) )
Adjusted net earnings [1, 2]
Other items )
NNet earnings [[2]
Non-IFRS financial measures described in Part C of this MD&A.
[ ] Available to IGM common shareholders.
QQ1 2018 vs. Q1 2017 and Q4 2017
AAdjusted net earnings $186 million or $0.77 per share, compared with $177 million or $0.74 per share in the corresponding period in 2017, an increase of 4.1on a per share basis, and $192 million or $0.79 per share in the fourth quarter of 2017.
On January 1, 2018, IGM adopted IFRS 9, Financial Instruments. IGM elected not to restate its comparative financial information for the effect of applying IFRS 9. The cumulative impact of applying IFRS 9 has been recognized as an adjustment to the opening retained earnings on January 1, 2018.
Mortgage loans of $282.6 million previously classified as held for trading were reclassified to amortized cost as a result of IGM’s business model and contractual cash flow characteristics assessment. This resulted in a total remeasurement of $49.7 million due to the reversal of unrealized losses included in the carrying value of the loans and the capitalization of previously expensed mortgage issue costs.
Securities of $19.9 million were reclassified from available for sale to fair value through profit or loss (FVPL), and IGM elected to classify securities of $262.8 million at fair value through other comprehensive income (FVOCI). These reclassifications had no impact on opening retained earnings.
The Corporation has deferred the adoption of IFRS 9 and continues to apply IAS 39, Financial Instruments: Recognition and Measurement. As such, the contribution to Power Financial includes an adjustment to reverse the impact of IFRS 9.
A 18 POWER FINANCIAL CORPORATION�— �FIRST QUARTER REPORT 2018
PFC_QUAT1_Eng01_PFC_2018-05-09_v1.indd B18PFC_QUAT1_Eng01_PFC_2018-05-09_v1.indd B18 18-05-09 10:54 PM18-05-09 10:54 PM

PA
RT
AP
OW
ER FIN
AN
CIA
L CO
RP
OR
ATIO
NPOWER FINANCIAL CORPORATION
IINVESTORS GROUP Net earnings increased by $4 million in the three-month period ended March 31, 2018, compared with the corresponding period in 2017, due to: An increase in income from management fees of $20 million to $361 million. The increase was primarily due to an
increase in average assets under management of 3.8
A decrease in distribution fee income of $14 million to $43 million, mainly due to a decrease in distribution fee income from insurance products and lower redemption fees;
A decrease in net investment income of $8 million to $10 million. Net interest income on securitized loans decreased due to lower margins on the loans as a result of the impact from the adoption of IFRS 9. There was also a decrease of gains realized on the sale of residential mortgages and negative fair value adjustments on loans held;
Expenses in the three-month period were $310 million, a decrease of $7 million mainly related to a decrease in commission expenses, primarily due to the treatment of commission expenses as a result of the adoption of IFRS 15 (refer to section “Adoption of IFRS 15”).
MMAACKENZIE Net earnings remained stable at $42 million in the three-month period ended March 31, 2018, compared with the corresponding period in 2017. Fee revenue increased due to an increase in average assets under management of 11.1 , partially offset by a decline in the average management fee rate and an increase in non-commission expense.
AASSETS AND INVVESTMENT FUND ASSETS UUNDER MANAGEMENT Total assets under management were as follows:
(In billions of dollars) March
March
Investors Group
Mackenzie [1]
Corporate and other [2]
Total
[ ] Effective October 1, 2017, the Mackenzie segment has been redefined to exclude advisory mandates to Investors Group from assets under management; the comparatives have been restated to reflect this change.
[ ] Includes Investment Planning Counsel’s assets under management less an adjustment for assets sub-advised by Mackenzie on behalf of other segments.
Total average daily investment fund assets under management were as follows:
(In billions of dollars)
Investors Group
Mackenzie [1]
Corporate and other [2]
Total
[ ] Effective October 1, 2017, the Mackenzie segment has been redefined to exclude advisory mandates to Investors Group from assets under management; the comparatives have been restated to reflect this change.
[ ] Includes Investment Planning Counsel’s assets under management less an adjustment for assets sub-advised by Mackenzie on behalf of other segments.
OOTHER ITEMS There were no Other items in both the first quarter of 2018 and 2017.
In the fourth quarter of 2017, Other items of $141 million consisted of:
Restructuring and other charges of $127 million after tax related to the implementation by IGM of a number of initiatives to assist in its operational effectiveness. The initiatives included simplifying IGM’s reporting structure, expanding the IGM shared services model, including joining the Investors Group and Mackenzie investment management functions, and offering a one-time voluntary retirement program.
IGM’s proportionate share of Lifeco’s one-time charges of $14 million.
The information above has been derived from IGM’s interim MD&A; see Part C of this MD&A for more information on IGM’s results.
POWER FINANCIAL CORPORATION�— �FIRST QUARTER REPORT 2018 A 1 9
PFC_QUAT1_Eng01_PFC_2018-05-09_v1.indd B19PFC_QUAT1_Eng01_PFC_2018-05-09_v1.indd B19 18-05-09 10:54 PM18-05-09 10:54 PM
PA
RT
AP
OW
ER F
INA
NC
IAL
CO
RP
OR
ATI
ON
POWER FINANCIAL CORPORATION
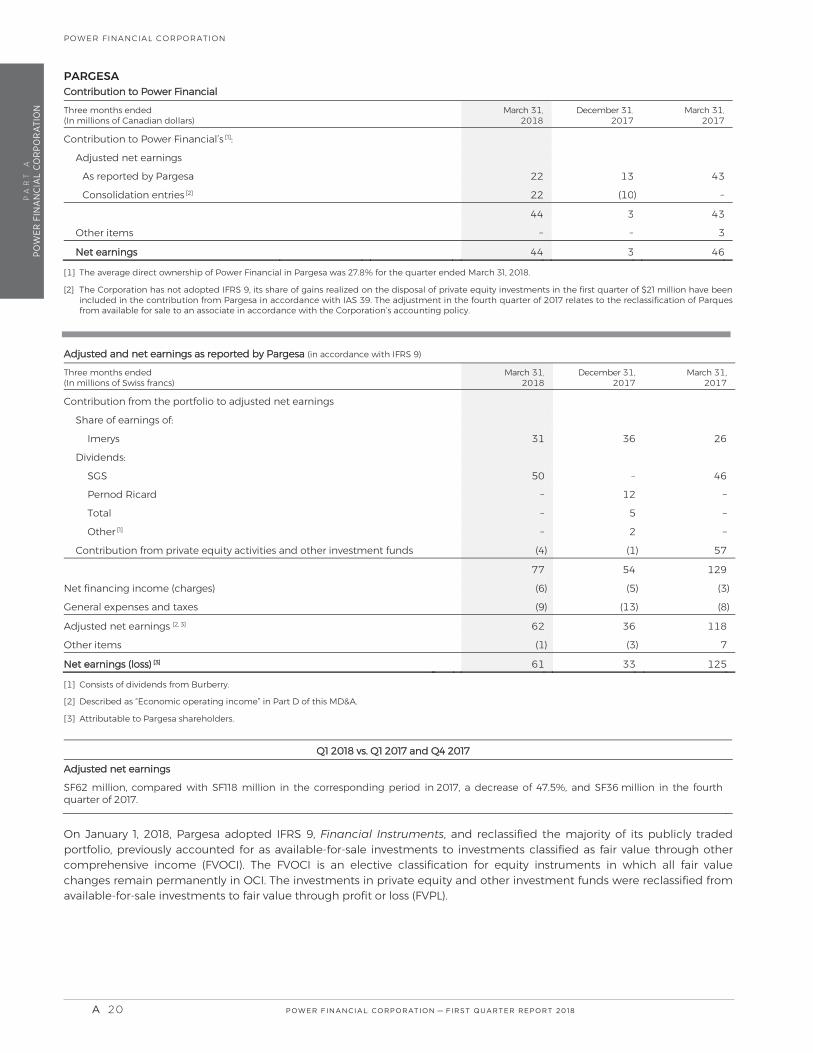
PARGESA CContribution to Power Financial
Three months ended (In millions of Canadian dollars)
March
Contribution to Power Financial’s [1]:
Adjusted net earnings
As reported by Pargesa
Consolidation entries [2] )
Other items
NNet earnings
[ ] The average direct ownership of Power Financial in Pargesa was 27.8 quarter ended March 31, 2018.
[2] The Corporation has not adopted IFRS 9, its share of gains realized on the disposal of private equity investments in the first quarter of $21 million have been included in the contribution from Pargesa in accordance with IAS 39. The adjustment in the fourth quarter of 2017 relates to the reclassification of Parques from available for sale to an associate in accordance with the Corporation’s accounting policy.
AAdjusted and net earnings aas reported bby Pargesa (in accordance with IFRS 9)
Three months ended (In millions of Swiss francs)
March ,
Contribution from the portfolio to adjusted net earnings
Share of earnings of:
Imerys
Dividends:
SGS
Pernod Ricard
Total
Other [1]
Contribution from private equity activities and other investment funds ) )
Net financing income (charges) ) ) )
General expenses and taxes ) ) )
Adjusted net earnings [2, 3]
Other items ) )
NNet earnings (loss) [[33]]
] Consists of dividends from Burberry.
[ ] Described as “Economic operating income” in Part D of this MD&A.
[ ] Attributable to Pargesa shareholders.
QQ1 2018 vs. Q1 2017 and Q4 2017
AAdjusted net earnings SF62 million, compared with SF118 million in the corresponding period in 2017, a decrease of 47.5 million in the fourth quarter of 2017.
On January 1, 2018, Pargesa adopted IFRS 9, Financial Instruments, and reclassified the majority of its publicly traded portfolio, previously accounted for as available-for-sale investments to investments classified as fair value through other comprehensive income (FVOCI). The FVOCI is an elective classification for equity instruments in which all fair value changes remain permanently in OCI. The investments in private equity and other investment funds were reclassified from available-for-sale investments to fair value through profit or loss (FVPL).
A 20 POWER FINANCIAL CORPORATION�— �FIRST QUARTER REPORT 2018
PFC_QUAT1_Eng01_PFC_2018-05-09_v1.indd B20PFC_QUAT1_Eng01_PFC_2018-05-09_v1.indd B20 18-05-09 10:54 PM18-05-09 10:54 PM

PA
RT
AP
OW
ER FIN
AN
CIA
L CO
RP
OR
ATIO
NPOWER FINANCIAL CORPORATION
The transition requirements of IFRS 9 require that all unrealized gains and losses on investments previously classified as available for sale remain permanently in equity, as follows: Unrealized gains and losses on instruments reclassified to FVPL are transferred from other comprehensive income to
retained earnings; and
Unrealized gains and losses on instruments reclassified to FVOCI may either remain in OCI or be reclassified in retained earnings.
On transition, the unrealized gain on private equity activities and investment funds was transferred to retained earnings.
During the quarter, two investments held through a private equity fund were disposed of, which resulted in gains of SF57 million. These realized gains have not been reflected in Pargesa’s earnings as the investments were reclassified from available for sale to FVPL on January 1, 2018. On transition, the related unrealized gains were transferred permanently to retained earnings.
The Corporation has deferred the adoption of IFRS 9 and continues to apply IAS 39. As such, the contribution to Power Financial includes adjustments to comply with IAS 39.
Other than the share of earnings of Imerys, a significant portion of Pargesa’s adjusted net earnings is composed of dividends from its non-consolidated investments, which are declared as follows: LafargeHolcim (second quarter)
SGS (first quarter)
Pernod Ricard (second and fourth quarters)
Total (second, third and fourth quarters)
adidas (second quarter)
Umicore (second and third quarters)
Burberry (second and fourth quarters)
Ontex (second quarter)
GEA (second quarter)
On December 31, 2017, the investment in Parques was reclassified from available for sale to an associate. The results of Parques have not been included in the net earnings as reported by Pargesa for the first quarter. Parques’ results are published after the date of publication of Pargesa’s results. The first quarter results will be included in the second quarter.
RRESULTS Adjusted net earnings in the three-month period ended March 31, 2018 decreased by SF56 million to SF62 million, compared with the corresponding period in 2017, mainly due to: The contribution from Imerys increased by SF5 million from SF26 million to SF31 million at March 31, 2018;
A decrease in the contribution from private equity activities and other investment funds of SF61 million. The decrease is mainly due to the adoption of IFRS 9 by Pargesa, resulting in gains of SF57 million realized during the quarter on the disposal of investments not reflected in earnings;
Dividends from its principal holdings of SF50 million, compared with SF46 million the corresponding period in 2017.
OOTHER ITEMS There were no significant Other items in the first quarter of 2018 and in the first and fourth quarters of 2017.
AAVERAGE EEXCHANGE RATES The average exchange rates for the three-month period ended March 31, 2018 and 2017 were as follows:
March
March ,
Euro/SF
SF/CAD
The information above has been derived from Pargesa’s first quarter of 2018 press release; see Part D of this MD&A for more information on Pargesa’s results.
POWER FINANCIAL CORPORATION�— �FIRST QUARTER REPORT 2018 A 2 1
PFC_QUAT1_Eng01_PFC_2018-05-09_v1.indd B21PFC_QUAT1_Eng01_PFC_2018-05-09_v1.indd B21 18-05-09 10:54 PM18-05-09 10:54 PM

PA
RT
AP
OW
ER F
INA
NC
IAL
CO
RP
OR
ATI
ON
POWER FINANCIAL CORPORATION
CORPORATE OPERATIONS Corporate operations include income (loss) from investments, operating expenses, financing charges, depreciation and income taxes.
Three months ended March ,
March ,
Income (loss) from investments ) ) )
Operating and other expenses
Operating expenses ) ) )
Financing charges ) ) )
Depreciation ) ) )
Income taxes [1] ) ) )
Corporate operations ) ) )
[ ] The fourth quarter amount consists mainly of a reversal of a provision for withholding taxes payable on the eventual repatriation of cash from Power Financial Europe B.V. to Power Financial. The reversal is due to substantive enactment in 2017 of a withholding tax exemption on repatriation.
OTHER ITEMS (NOT INCLUDED IN ADJUSTED NET EARNINGS)
The following table presents the Corporation’s share of Other items:
Three months ended March
March
Lifeco
Impact of U.S. tax reform )
Restructuring charges ) )
Net charge on sale of an equity investment )
Share of IGM’s other items ) ) )
IGM
Restructuring and other charges )
Share of Lifeco’s other items ) )
Pargesa
Other income ) )
For additional information, refer to the respective Lifeco, IGM or Pargesa “Other items” sections above.
A 22 POWER FINANCIAL CORPORATION�— �FIRST QUARTER REPORT 2018
PFC_QUAT1_Eng01_PFC_2018-05-09_v1.indd B22PFC_QUAT1_Eng01_PFC_2018-05-09_v1.indd B22 18-05-09 10:54 PM18-05-09 10:54 PM
PA
RT
AP
OW
ER FIN
AN
CIA
L CO
RP
OR
ATIO
NPOWER FINANCIAL CORPORATION
Financial Position
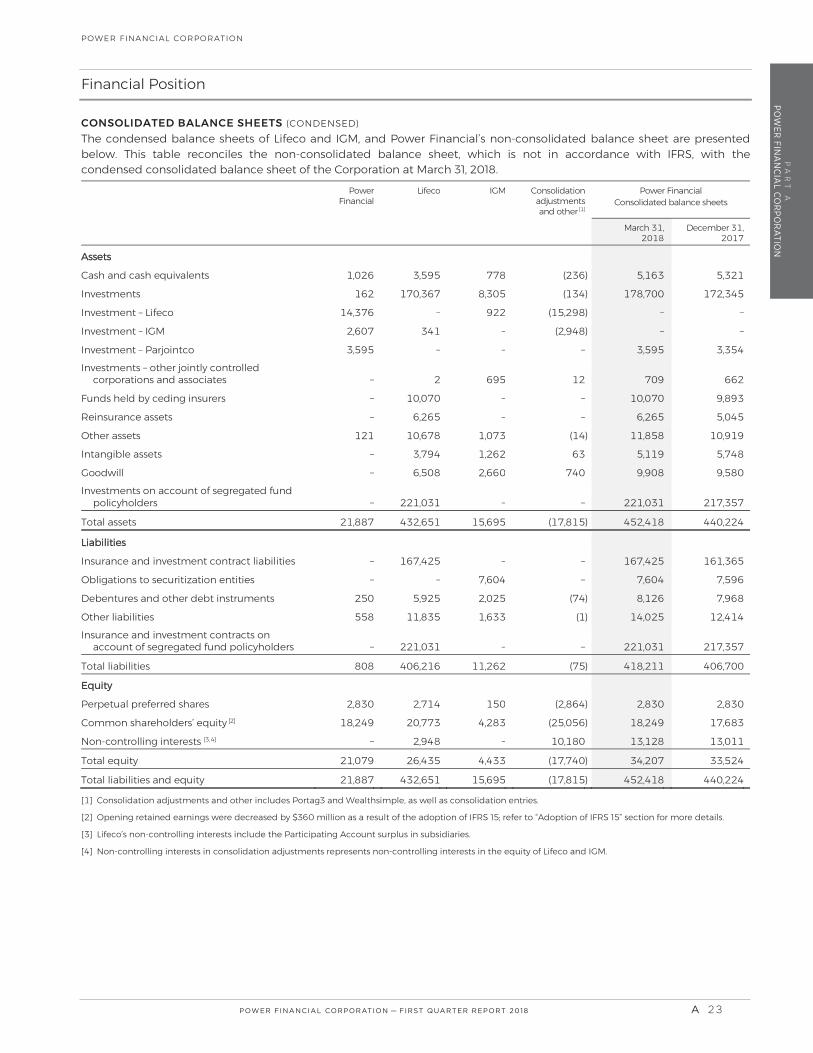
CONSOLIDATED BALANCE SHEETS (CONDENSED) The condensed balance sheets of Lifeco and IGM, and Power Financial’s non-consolidated balance sheet are presented below. This table reconciles the non-consolidated balance sheet, which is not in accordance with IFRS, with the condensed consolidated balance sheet of the Corporation at March 31, 2018.
Power Financial
Lifeco
IGM
Consolidation adjustments and other
Power Financial Consolidated balance sheets
March ,
AAssets
Cash and cash equivalents )
Investments )
Investment – Lifeco )
Investment – IGM )
Investment – Parjointco Investments – other jointly controlled
corporations and associates
Funds held by ceding insurers
Reinsurance assets
Other assets ( )
Intangible assets
Goodwill Investments on account of segregated fund
policyholders
Total assets )
LLiabilities
Insurance and investment contract liabilities
Obligations to securitization entities
Debentures and other debt instruments )
Other liabilities ) Insurance and investment contracts on
account of segregated fund policyholders
Total liabilities , ( )
EEquity
Perpetual preferred shares )
Common shareholders’ equity [2] )
Non-controlling interests [ ]
Total equity , ) ,
Total liabilities and equity )
Consolidation adjustments and other includes Portag3 and Wealthsimple, as well as consolidation entries.
[ ] Opening retained earnings were decreased by $360 million as a result of the adoption of IFRS 15; refer to “Adoption of IFRS 15” section for more details.
[ ] Lifeco’s non-controlling interests include the Participating Account surplus in subsidiaries.
[ ] Non-controlling interests in consolidation adjustments represents non-controlling interests in the equity of Lifeco and IGM.
POWER FINANCIAL CORPORATION�— �FIRST QUARTER REPORT 2018 A 23
PFC_QUAT1_Eng01_PFC_2018-05-09_v1.indd B23PFC_QUAT1_Eng01_PFC_2018-05-09_v1.indd B23 18-05-09 10:54 PM18-05-09 10:54 PM

PA
RT
AP
OW
ER F
INA
NC
IAL
CO
RP
OR
ATI
ON
POWER FINANCIAL CORPORATION
Total assets of the Corporation increased to $452.4 billion at March 31, 2018, compared with $440.2 billion at December 31, 2017, mainly due to the impact of currency movement and new business growth, partially offset by the impact of market movements.
Liabilities increased to $418.2 billion at March 31, 2018, compared with $406.7 billion at December 31, 2017, mainly due to the following, as disclosed by Lifeco:
Insurance and investment contract liabilities increased by $6.1 billion, primarily due to the strengthening of the British pound, euro and U.S. dollar against the Canadian dollar and the acquisition of Retirement Advantage, partially offset by the impact of fair value adjustments.
Insurance and investment contract liabilities on account of segregated fund policyholders increased by $3.7 billion, primarily due to the impact of currency movement of $6.6 billion, partially offset by the net impact of market value losses and investment income of $2.9 billion and net withdrawals of $0.4 billion.
Parts B and C of this MD&A include a discussion of the consolidated balance sheets of Lifeco and IGM, respectively.
NON-CONSOLIDATED BALANCE SHEETS In the non-consolidated basis of presentation shown below, Lifeco and IGM are presented by the Corporation using the equity method. These non-consolidated balance sheets, which are not in accordance with IFRS, enhance the MD&A and assist the reader by identifying changes in Power Financial’s non-consolidated balance sheets.
March ,
AAssets
Cash and cash equivalents [1]
Investments
Lifeco
IGM
Parjointco
Other [2]
Other assets
Total assets
LLiabilities
Debentures
Other liabilities
Total liabilities
EEquity
Perpetual preferred shares
Common shareholders’ equity
Total equity ,
Total liabilities and equity
[ ] Cash equivalents include $295 million ($281 million at December 31, 2017) of fixed income securities with maturities of more than three months. In accordance with IFRS, these are classified in investments in the Consolidated Financial Statements.
[ ] Includes investments in Portag3 and Wealthsimple.
Cash and cash equivalents Cash and cash equivalents held by Power Financial amounted to $1,026 million at March 31, 2018, compared with $1,054 million at the end of December 2017. The first quarter dividends declared by the Corporation and paid on May 1, 2018 are included in other liabilities and amounted to $343 million. Dividends declared in the first quarter by IGM and received by the Corporation on April 30, 2018 are included in other assets and amounted to $83 million (see “Non-consolidated Statements of Cash Flows” below for details).
A 24 POWER FINANCIAL CORPORATION�— �FIRST QUARTER REPORT 2018
PFC_QUAT1_Eng01_PFC_2018-05-09_v1.indd B24PFC_QUAT1_Eng01_PFC_2018-05-09_v1.indd B24 18-05-09 10:54 PM18-05-09 10:54 PM
PA
RT
AP
OW
ER FIN
AN
CIA
L CO
RP
OR
ATIO
NPOWER FINANCIAL CORPORATION
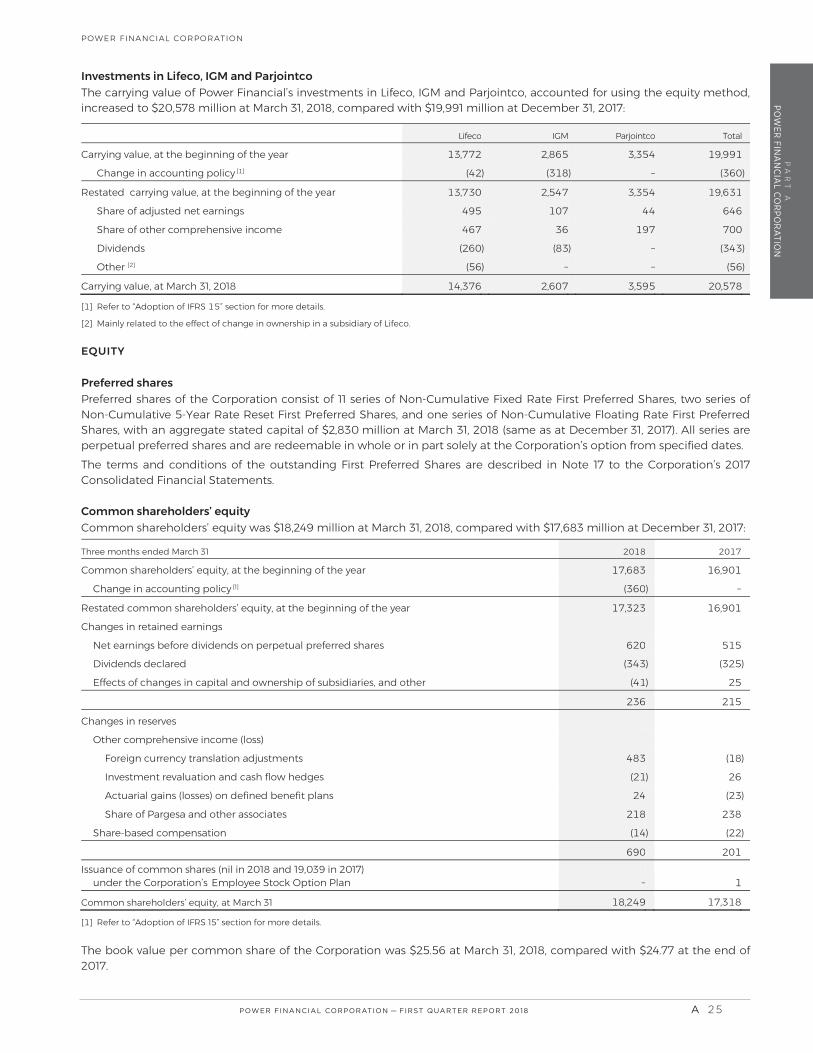
Investments in Lifeco, IGM and Parjointco The carrying value of Power Financial’s investments in Lifeco, IGM and Parjointco, accounted for using the equity method, increased to $20,578 million at March 31, 2018, compared with $19,991 million at December 31, 2017:
[ ] ” section for more details.
[ ] Mainly related to the effect of change in ownership in a subsidiary of Lifeco.
EQUITY
Preferred shares Preferred shares of the Corporation consist of 11 series of Non-Cumulative Fixed Rate First Preferred Shares, two series of Non-Cumulative 5-Year Rate Reset First Preferred Shares, and one series of Non-Cumulative Floating Rate First Preferred Shares, with an aggregate stated capital of $2,830 million at March 31, 2018 (same as at December 31, 2017). All series are perpetual preferred shares and are redeemable in whole or in part solely at the Corporation’s option from specified dates. The terms and conditions of the outstanding First Preferred Shares are described in Note 17 to the Corporation’s 2017 Consolidated Financial Statements.
Common shareholders’ equity Common shareholders’ equity was $18,249 million at March 31, 2018, compared with $17,683 million at December 31, 2017:
Three months ended March 31
Common shareholders’ equity, at the beginning of the year
Change in accounting policy [1] )
Restated common shareholders’ equity, at the beginning of the year
Changes in retained earnings
Net earnings before dividends on perpetual preferred shares
Dividends declared ) )
Effects of changes in capital and ownership of subsidiaries, and other )
Changes in reserves
Other comprehensive income (loss)
Foreign currency translation adjustments )
Investment revaluation and cash flow hedges )
Actuarial gains (losses) on defined benefit plans )
Share of Pargesa and other associates
Share-based compensation ) ) Issuance of common shares (nil in 2018 and 19,039 in 2017) under the Corporation’s Employee Stock Option Plan
Common shareholders’ equity, at March 31
Refer to “Adoption of IFRS 15” section for more details.
The book value per common share of the Corporation was $25.56 at March 31, 2018, compared with $24.77 at the end of 2017.
Lifeco IGM Parjointco Total
Carrying value, at the beginning of the year
Change in accounting policy ) ) )
Restated carrying value, at the beginning of the year
Share of adjusted net earnings
Share of other comprehensive income
Dividends ) ) )
Other [ ] ) )
Carrying value, at March 31, 2018
POWER FINANCIAL CORPORATION�— �FIRST QUARTER REPORT 2018 A 25
PFC_QUAT1_Eng01_PFC_2018-05-09_v1.indd B25PFC_QUAT1_Eng01_PFC_2018-05-09_v1.indd B25 18-05-09 10:54 PM18-05-09 10:54 PM

PA
RT
AP
OW
ER F
INA
NC
IAL
CO
RP
OR
ATI
ON
POWER FINANCIAL CORPORATION
Outstanding number of common shares At the date of this MD&A, there were 713,871,479 common shares of the Corporation outstanding (same as at December 31, 2017). At the date of this MD&A, options were outstanding to purchase up to an aggregate of 12,043,012 common shares of the Corporation under the Corporation’s Employee Stock Option Plan.
Cash Flows
CONSOLIDATED STATEMENTS OF CASH FLOWS (CONDENSED) The condensed cash flows of Lifeco and IGM, and Power Financial’s non-consolidated cash flows, are presented below. This table reconciles the non-consolidated statement of cash flows, which is not in accordance with IFRS, to the condensed consolidated statement of cash flows of the Corporation for the three-month period ended March 31, 2018.
PowerFinancial
Lifeco IGM Consolidation adjustments
and other
Power Financial Consolidated
Three months ended March 31
Cash flows from:
Operating activities )
Financing activities ) ) ) ) )
Investing activities ) ) ) ) ) Effect of changes in exchange rates on cash and cash equivalents )
Increase (decrease) in cash and cash equivalents ( ) ) ) Cash and cash equivalents, at the beginning of the year )
Cash and cash equivalents, at March 31 ) Consolidated cash and cash equivalents decreased by $158 million in the three-month period ended March 31, 2018, compared with an increase of $407 million in the corresponding period in 2017.
Operating activities produced a net inflow of $1,227 million in the three-month period ended March 31, 2018, compared with a net inflow of $1,553 million in the corresponding period in 2017.
Cash flows from financing activities, which include dividends paid on the common and preferred shares of the Corporation and dividends paid by subsidiaries to non-controlling interests, represented a net outflow of $480 million in the three-month period ended March 31, 2018, compared with a net outflow of $137 million in the corresponding period in 2017.
Cash flows from investing activities resulted in a net outflow of $1,029 million in the three-month period ended March 31, 2018, compared with a net outflow of $1,001 million in the corresponding period in 2017.
The Corporation increased its level of fixed income securities with maturities of more than three months, resulting in a net outflow of $14 million in the three-month period ended March 31, 2018, compared with a net inflow of $91 million in the corresponding period in 2017.
Parts B and C of this MD&A include a discussion of the cash flows of Lifeco and IGM, respectively.
A 26 POWER FINANCIAL CORPORATION�— �FIRST QUARTER REPORT 2018
PFC_QUAT1_Eng01_PFC_2018-05-09_v1.indd B26PFC_QUAT1_Eng01_PFC_2018-05-09_v1.indd B26 18-05-09 10:54 PM18-05-09 10:54 PM

PA
RT
AP
OW
ER FIN
AN
CIA
L CO
RP
OR
ATIO
NPOWER FINANCIAL CORPORATION
NON-CONSOLIDATED STATEMENTS OF CASH FLOWS As Power Financial is a holding company, corporate cash flows are primarily comprised of dividends received from Lifeco, IGM and Parjointco and income (loss) from cash and cash equivalents, less operating expenses, financing charges, income taxes, and preferred and common share dividends.
The following non-consolidated statements of cash flows of the Corporation, which are not presented in accordance with IFRS, have been prepared to assist the reader as they isolate the cash flows of Power Financial, the parent company.
Three months ended March 31
OOperating activities
Dividends
Lifeco
IGM
Corporate operations, net of non-cash items ( ) )
FFinancing activities
Dividends paid on perpetual preferred shares ) )
Dividends paid on common shares ) )
Issuance of common shares ) )
IInvesting activities
Investments in Portag3 and Wealthsimple ) )
Purchase of other investments and other ) )
) )
Decrease in cash and cash equivalents ( ) )
Cash and cash equivalents, at the beginning of the year
CCash and cash equivalents, at MMarch 31
On a non-consolidated basis, cash and cash equivalents decreased by $28 million in the three-month period ended March 31, 2018, compared with a decrease of $59 million in the corresponding period in 2017.
Operating activities resulted in a net inflow of $324 million in the three-month period ended March 31, 2018, compared with a net inflow of $308 million in the corresponding period in 2017. Dividends paid by Lifeco on its common shares during the three-month period ended March 31, 2018 were $0.3890
per share, compared with $0.3670 in the corresponding period in 2017. In the three-month period ended March 31, 2018, the Corporation received dividends from Lifeco of $260 million, compared with $246 million in the corresponding period in 2017.
Dividends paid by IGM on its common shares during the three-month period ended March 31, 2018 were $0.5625 per share, the same as in the corresponding period in 2017. In the three-month period ended March 31, 2018, the Corporation received dividends from IGM of $83 million, the same as in the corresponding period in 2017.
Pargesa declares and pays an annual dividend in the second quarter. The Board of Directors of Pargesa approved a dividend for 2018 of SF2.50 per bearer share, compared with SF2.44 in 2017, to be paid on May 15, 2018.
POWER FINANCIAL CORPORATION�— �FIRST QUARTER REPORT 2018 A 27
PFC_QUAT1_Eng01_PFC_2018-05-09_v1.indd B27PFC_QUAT1_Eng01_PFC_2018-05-09_v1.indd B27 18-05-09 10:54 PM18-05-09 10:54 PM

PA
RT
AP
OW
ER F
INA
NC
IAL
CO
RP
OR
ATI
ON
POWER FINANCIAL CORPORATION
The Corporation’s financing activities during the three-month period ended March 31, 2018 were a net outflow of $328 million, compared with a net outflow of $310 million in the corresponding period in 2017, and included: Dividends paid on preferred and common shares by the Corporation of $328 million, compared with $311 million in
the corresponding period in 2017. In the three-month period ended March 31, 2018, dividends paid on the Corporation’s common shares were $0.4125 per share, compared with $0.3925 per share in the corresponding period in 2017.
No employee stock options were exercised in the period, compared with common shares issued of $1 million in the corresponding period in 2017.
The Corporation’s investing activities during the three-month period ended March 31, 2018 were a net outflow of $24 million, compared with a net outflow of $57 million in the corresponding period in 2017.
Capital Management
As a holding company, Power Financial’s objectives in managing its capital are to: provide attractive long-term returns to shareholders of the Corporation;
provide sufficient financial flexibility to pursue its growth strategy to invest on a timely basis in its operating companies and other investments as opportunities present;
maintain a capital structure that matches the long-term nature of its investments by maximizing the use of permanent capital; and
maintain an appropriate credit rating to ensure stable access to capital markets.
The Corporation manages its capital taking into consideration the risk characteristics and liquidity of its holdings. In order to maintain or adjust its capital structure, the Corporation may adjust the amount of dividends paid to shareholders, return capital to shareholders or issue capital.
The Board of Directors of the Corporation is responsible for capital management. Management of the Corporation is responsible for establishing capital management procedures and for implementing and monitoring its capital plans. The Board of Directors of the Corporation reviews and approves capital transactions such as the issuance, redemption and repurchase of common shares, perpetual preferred shares and debentures. The boards of directors of the Corporation’s subsidiaries, as well as those of Pargesa and GBL, govern and have responsibility for their respective company’s capital management.
With the exception of debentures and other debt instruments, the Corporation’s capital is permanent, matching the long-term nature of its investments. The capital structure of the Corporation consists of: debentures, perpetual preferred shares, common shareholders’ equity, and non-controlling interests. The Corporation views perpetual preferred shares as a cost-effective source of permanent capital.
A 28 POWER FINANCIAL CORPORATION�— �FIRST QUARTER REPORT 2018
PFC_QUAT1_Eng01_PFC_2018-05-09_v1.indd B28PFC_QUAT1_Eng01_PFC_2018-05-09_v1.indd B28 18-05-09 10:54 PM18-05-09 10:54 PM
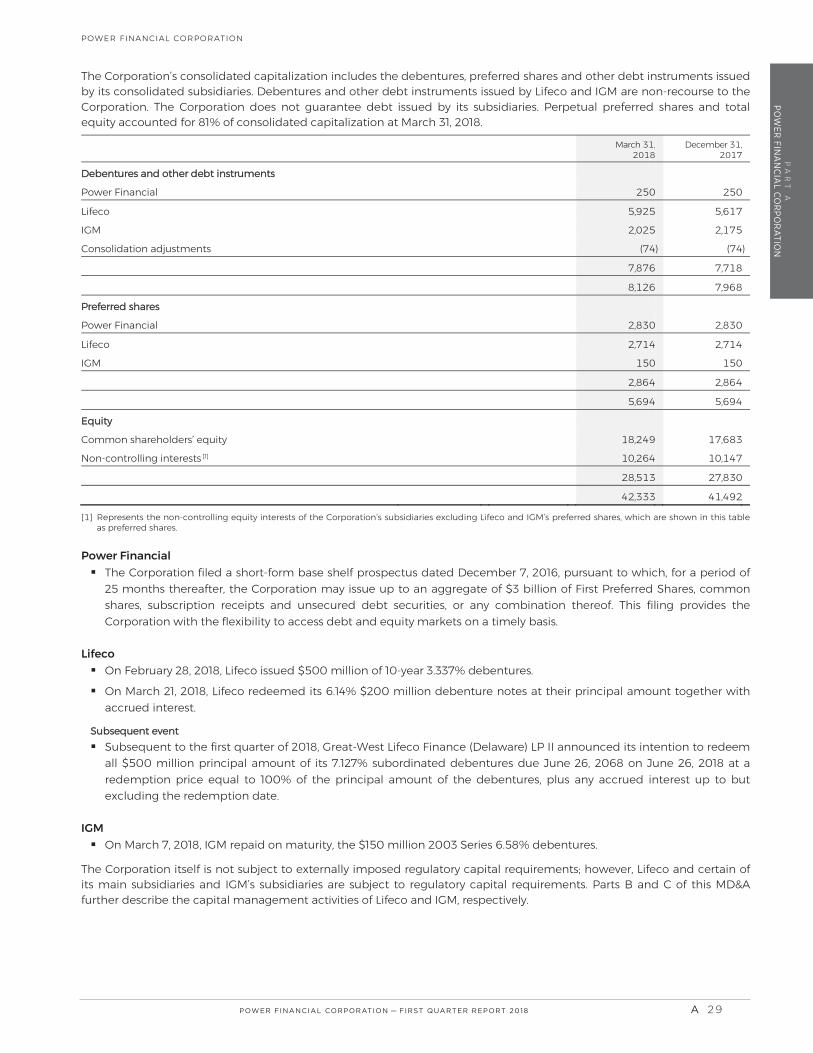
PA
RT
AP
OW
ER FIN
AN
CIA
L CO
RP
OR
ATIO
NPOWER FINANCIAL CORPORATION
The Corporation’s consolidated capitalization includes the debentures, preferred shares and other debt instruments issued by its consolidated subsidiaries. Debentures and other debt instruments issued by Lifeco and IGM are non-recourse to the Corporation. The Corporation does not guarantee debt issued by its subsidiaries. Perpetual preferred shares and total equity accounted for of consolidated capitalization at March 31, 2018.
March ,
December
DDebentures and oother ddebt instruments
Power Financial
Lifeco
IGM
Consolidation adjustments ) )
PPreferred shares
Power Financial
Lifeco
IGM
EEquity
Common shareholders’ equity
Non-controlling interests [1]
] Represents the non-controlling equity interests of the Corporation’s subsidiaries excluding Lifeco and IGM’s preferred shares, which are shown in this table as preferred shares.
Power Financial The Corporation filed a short-form base shelf prospectus dated December 7, 2016, pursuant to which, for a period of
25 months thereafter, the Corporation may issue up to an aggregate of $3 billion of First Preferred Shares, common shares, subscription receipts and unsecured debt securities, or any combination thereof. This filing provides the Corporation with the flexibility to access debt and equity markets on a timely basis.
Lifeco On February 28, 2018, Lifeco issued $500 million of 10-
ir principal amount together with accrued interest.
SSubsequent eevvent Subsequent to the first quarter of 2018, Great-West Lifeco Finance (Delaware) LP II announced its intention to redeem
all $500 million a crued interest up to but
excluding the redemption date.
IGM On March 7, 2018, IGM repaid on maturity, debentures.
The Corporation itself is not subject to externally imposed regulatory capital requirements; however, Lifeco and certain of its main subsidiaries and IGM’s subsidiaries are subject to regulatory capital requirements. Parts B and C of this MD&A further describe the capital management activities of Lifeco and IGM, respectively.
POWER FINANCIAL CORPORATION�— �FIRST QUARTER REPORT 2018 A 29
PFC_QUAT1_Eng01_PFC_2018-05-09_v1.indd B29PFC_QUAT1_Eng01_PFC_2018-05-09_v1.indd B29 18-05-09 10:54 PM18-05-09 10:54 PM

PA
RT
AP
OW
ER F
INA
NC
IAL
CO
RP
OR
ATI
ON
POWER FINANCIAL CORPORATION
RATINGS The current rating by Standard & Poor’s (S&P) of the Corporation’s debentures is “A+” with a stable outlook. Dominion Bond Rating Service’s (DBRS) current rating on the Corporation’s debentures is “A (High)” with a stable rating trend.
Credit ratings are intended to provide investors with an independent measure of the credit quality of the securities of a corporation and are indicators of the likelihood of payment and the capacity of a corporation to meet its obligations in accordance with the terms of each obligation. Descriptions of the rating categories for each of the agencies set forth below have been obtained from the respective rating agencies’ websites. These ratings are not a recommendation to buy, sell or hold the securities of a corporation and do not address market price or other factors that might determine suitability of a specific security for a particular investor. The ratings also may not reflect the potential impact of all risks on the value of securities and are subject to revision or withdrawal at any time by the rating organization.
The “A+” rating assigned to the Corporation’s debentures by S&P is the fifth highest of the 22 ratings used for long-term debt. A long-term debenture rated “A+” is somewhat more susceptible to the adverse effects of changes in circumstances and economic conditions than obligations in higher-rated categories; however, the obligor’s capacity to meet its financial commitment on the obligation is still strong.
The “A (High)” rating assigned to the Corporation’s debentures by DBRS is the fifth highest of the 26 ratings used for long-term debt. A long-term debenture rated “A (High)” implies that the capacity for repayment is substantial, but of lesser credit quality than AA, and may be vulnerable to future events, although qualifying negative factors are considered manageable.
Risk Management
Power Financial is a diversified international management and holding company with interests in the financial services, asset management and other business sectors. Its principal holdings are a controlling interest in each of Lifeco and IGM and a joint controlling interest in Parjointco, which itself holds a controlling interest in GBL through Pargesa. As a result, the Corporation bears the risks associated with being a significant shareholder of these operating companies. A complete description of these risks is presented in their public disclosures. The respective boards of directors of Lifeco, IGM, Pargesa and GBL are responsible for the risk oversight function at their respective companies. The risk committee of the board of directors of Lifeco is responsible for its risk oversight, and the board of directors of IGM provides oversight and carries out its risk management mandate through various committees. Certain officers of the Corporation are members of these boards and committees of these boards and, consequently, in their role as directors, they participate in the risk oversight function at the operating companies. Parts B and C of this MD&A further describe risks related to Lifeco and IGM, respectively.
RISK OVERSIGHT APPROACH The Corporation believes that a prudent approach to risk is achieved through a governance model that focuses on the active oversight of its investments. The Board of Directors and executive officers of the Corporation have overall oversight and responsibility for risk management associated with the investment activities and operations of the holding company and maintain a comprehensive and appropriate set of policies and controls.
The Board of Directors provides oversight and carries out its risk management mandate primarily through the following committees: The Audit Committee addresses risks related to financial reporting and cybersecurity.
The Compensation Committee considers risks associated with the Corporation’s compensation policies and practices.
The Governance and Nominating Committee oversees the Corporation’s approach to appropriately address potential risks related to governance matters.
The Related Party and Conduct Review Committee considers for approval transactions with related parties of the Corporation.
There are certain risks inherent in an investment in the securities of the Corporation and in the activities of the Corporation, including the following risks and others discussed elsewhere in this MD&A, which investors should carefully consider before investing in securities of the Corporation. The 2017 Annual MD&A reviews certain risks that could impact the financial condition and financial performance, and the value of the equity of the Corporation. This description of risks does not include all possible risks, and there may be other risks of which the Corporation is not currently aware.
During the first quarter of 2018, there were no changes to the Corporation’s risk oversight approach, and the identification and management of the specific risks described in the 2017 Annual MD&A.
A 30 POWER FINANCIAL CORPORATION�— �FIRST QUARTER REPORT 2018
PFC_QUAT1_Eng01_PFC_2018-05-09_v1.indd B30PFC_QUAT1_Eng01_PFC_2018-05-09_v1.indd B30 18-05-09 10:54 PM18-05-09 10:54 PM

PA
RT
AP
OW
ER FIN
AN
CIA
L CO
RP
OR
ATIO
NPOWER FINANCIAL CORPORATION
Financial Instruments and Other Instruments
FAIR VALUE MEASUREMENT At March 31, 2018, there had been no material changes to the carrying amounts and fair value of the Corporation and its subsidiaries’ assets and liabilities recorded at fair value from December 31, 2017. See Note 18 to the Corporation’s Interim Consolidated Financial Statements for additional disclosure of the Corporation’s fair value measurement.
DERIVATIVE FINANCIAL INSTRUMENTS In the course of their activities, the Corporation and its subsidiaries use derivative financial instruments. When using such derivatives, they only act as limited end-users and not as market makers in such derivatives.
The use of derivatives is monitored and reviewed on a regular basis by senior management of the Corporation and by senior management of its subsidiaries. The Corporation and its subsidiaries have each established operating policies, guidelines and procedures relating to the use of derivative financial instruments, which in particular focus on: prohibiting the use of derivative instruments for speculative purposes;
documenting transactions and ensuring their consistency with risk management policies;
demonstrating the effectiveness of the hedging relationships; and
monitoring the hedging relationships.
There were no major changes to the Corporation and its subsidiaries’ policies and procedures with respect to the use of derivative instruments in the three-month period ended March 31, 2018. The following table provides a summary of the Corporation and its subsidiaries’ derivatives portfolio:
During the three-month period ended March 31, 2018, there was an increase of $2.4 billion in the notional amount of derivatives outstanding, primarily due to an increase in forward settling mortgage backed security transactions (“to-be-announced securities”) and regular hedging activities. The Corporation and its subsidiaries’ exposure to derivative counterparty risk (which represents the market value of instruments in a gain position) decreased to $382 million at March 31, 2018 from $422 million at December 31, 2017. The decrease is primarily due to the strengthening of the U.S. dollar against the Canadian dollar on cross-currency swaps that pay U.S. dollars and receive Canadian dollars.
Parts B and C of this MD&A provide information on the types of derivative financial instruments used by Lifeco and IGM, respectively.
See Note 25 to the Corporation’s 2017 Consolidated Financial Statements for additional information.
Notional Maximum credit risk
Total fair value Notional
Maximum credit risk
Total fair value
Power Financial
Lifeco ) )
IGM )
) )
) )
POWER FINANCIAL CORPORATION�— �FIRST QUARTER REPORT 2018 A 3 1
PFC_QUAT1_Eng01_PFC_2018-05-09_v1.indd B31PFC_QUAT1_Eng01_PFC_2018-05-09_v1.indd B31 18-05-09 10:54 PM18-05-09 10:54 PM

PA
RT
AP
OW
ER F
INA
NC
IAL
CO
RP
OR
ATI
ON
POWER FINANCIAL CORPORATION
Off-Balance Sheet Arrangements
GUARANTEES In the normal course of their operations, the Corporation and its subsidiaries may enter into certain agreements, the nature of which precludes the possibility of making a reasonable estimate of the maximum potential amount the Corporation or subsidiary could be required to pay third parties, as some of these agreements do not specify a maximum amount and the amounts are dependent on the outcome of future contingent events, the nature and likelihood of which cannot be determined.
LETTERS OF CREDIT In the normal course of its reinsurance business, Lifeco provides letters of credit to other parties or beneficiaries. A beneficiary will typically hold a letter of credit as collateral in order to secure statutory credit for insurance and investment contract liabilities ceded to or amounts due from Lifeco. Lifeco may be required to seek collateral alternatives if it is unable to renew existing letters of credit on maturity. See also Part B of this MD&A and Note 31 to the Corporation’s 2017 Consolidated Financial Statements.
Contingent Liabilities
The Corporation and its subsidiaries are from time to time subject to legal actions, including arbitrations and class actions, arising in the normal course of business. It is inherently difficult to predict the outcome of any of these proceedings with certainty, and it is possible that an adverse resolution could have a material adverse effect on the consolidated financial position of the Corporation. However, based on information presently known, it is not expected that any of the existing legal actions, either individually or in the aggregate, will have a material adverse effect on the consolidated financial position of the Corporation.
Commitments and Contractual Obligations
At March 31, 2018, there had been no material changes in the contractual obligations of the Corporation and its subsidiaries from those reported in the 2017 Annual MD&A.
Income Taxes (Non-Consolidated Basis)
The Corporation had, at March 31, 2018, non-capital losses of $169 million available to reduce future taxable income (including capital gains). These losses expire during the years 2028 to 2038. In addition, the Corporation has capital losses of $84 million that can be used indefinitely to reduce future capital gains.
See also “Transactions with Related Parties” below.
- - A 32 POWER FINANCIAL CORPORATION�— �FIRST QUARTER REPORT 2018
PFC_QUAT1_Eng01_PFC_2018-05-09_v1.indd B32PFC_QUAT1_Eng01_PFC_2018-05-09_v1.indd B32 18-05-09 10:54 PM18-05-09 10:54 PM

PA
RT
AP
OW
ER FIN
AN
CIA
L CO
RP
OR
ATIO
NPOWER FINANCIAL CORPORATION
Transactions with Related Parties
Power Financial has a Related Party and Conduct Review Committee composed entirely of Directors who are independent of management and independent of the Corporation’s controlling shareholder. The mandate of this Committee is to review proposed transactions with related parties of the Corporation, including its controlling shareholder, and to approve only those transactions that it deems appropriate and that are done at market terms and conditions.
In the normal course of business, Great-West Life and Putnam enter into various transactions with related companies which include providing group insurance benefits and sub-advisory services to other companies within the Power Financial group of companies. Such transactions are at market terms and conditions. These transactions are reviewed by the appropriate related party and conduct review committee.
Lifeco provides asset management and administrative services for employee benefit plans relating to pension and other post-employment benefits for employees of Power Financial, and Lifeco and its subsidiaries. These transactions are at market terms and conditions and are reviewed by the appropriate related party and conduct review committee.
IGM enters into transactions with subsidiaries of Lifeco. These transactions are in the normal course of operations and include (i) providing certain administrative services, (ii) distributing insurance products and (iii) the sale of residential mortgages to Great-West Life and London Life. These transactions are at market terms and conditions and are reviewed by the appropriate related party and conduct review committee.
In October 2017, IGM obtained advanced tax rulings which permitted tax loss consolidation transactions with a subsidiary of Power Corporation, whereby shares of a subsidiary that has generated tax losses may be acquired by IGM. The acquisitions are expected to close in the fourth quarter of each year. IGM will recognize the benefit of the tax losses realized throughout the year.
See Note 29 to the Corporation’s 2017 Consolidated Financial Statements for additional information.
Summary of Critical Accounting Estimates and Judgments
In the preparation of the financial statements, management of the Corporation and the managements of its subsidiaries – Lifeco and IGM – are required to make significant judgments, estimates and assumptions that affect the reported amounts of assets, liabilities, net earnings, comprehensive income and related disclosures. Key sources of estimation uncertainty and areas where significant judgments are made by the management of the Corporation and the managements of its subsidiaries include: the entities to be consolidated, insurance and investment contract liabilities, fair value measurements, investment impairment, goodwill and intangible assets, income taxes and employee future benefits. These are described in the Corporation’s 2017 Annual MD&A and in the notes to the 2017 Consolidated Financial Statements. There were no changes in the Corporation’s critical accounting estimates and judgments in the first quarter of 2018.
Internal Control over Financial Reporting
The Corporation’s internal control over financial reporting is designed to provide reasonable assurance regarding the reliability of financial reporting and that the preparation of financial statements for external purposes is in accordance with IFRS. The Corporation’s management, under the supervision of the Chief Executive Officer and the Chief Financial Officer, is responsible for establishing and maintaining effective internal control over financial reporting. All internal control systems have inherent limitations and may become ineffective because of changes in conditions. Therefore, even those systems determined to be effective can provide only reasonable assurance with respect to financial statement preparation and presentation.
There have been no changes in the Corporation’s internal control over financial reporting during the three-month period ended March 31, 2018 which have materially affected, or are reasonably likely to materially affect, the Corporation’s internal control over financial reporting.
POWER FINANCIAL CORPORATION�— �FIRST QUARTER REPORT 2018 A 33
PFC_QUAT1_Eng01_PFC_2018-05-09_v1.indd B33PFC_QUAT1_Eng01_PFC_2018-05-09_v1.indd B33 18-05-09 10:54 PM18-05-09 10:54 PM
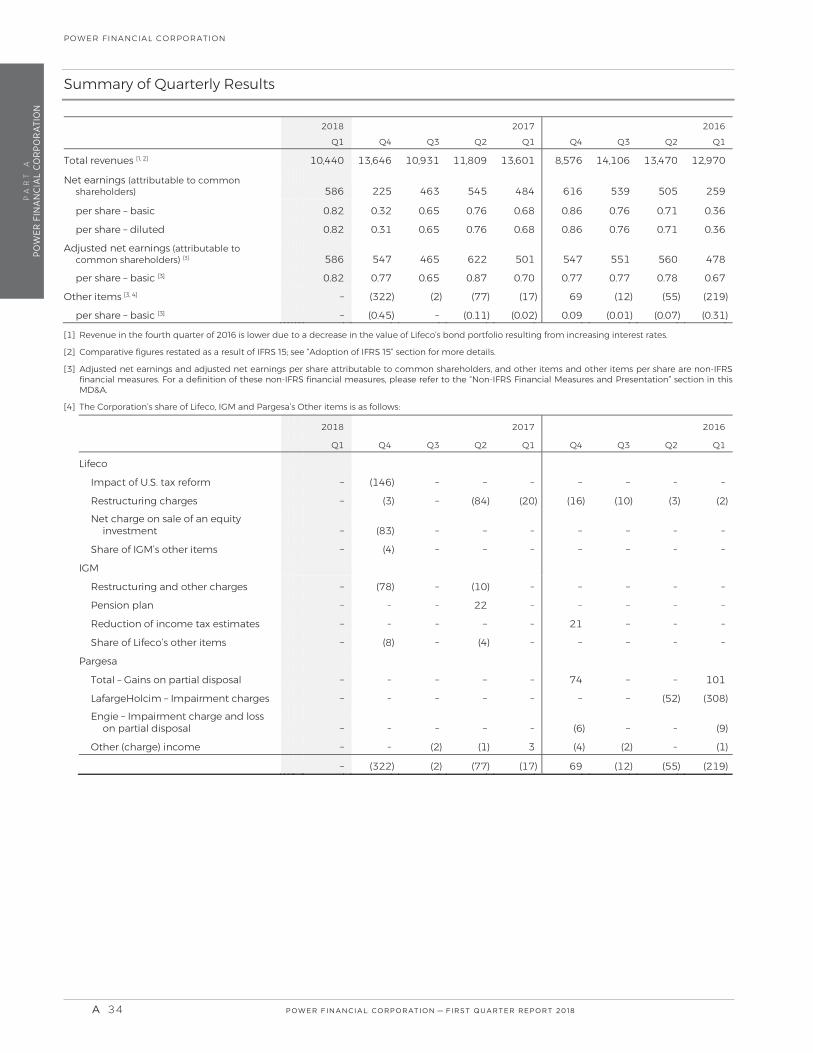
PA
RT
AP
OW
ER F
INA
NC
IAL
CO
RP
OR
ATI
ON
POWER FINANCIAL CORPORATION
Summary of Quarterly Results
Total revenues [1, 2]
Net earnings (attributable to common shareholders)
per share – basic
per share – diluted
Adjusted net earnings (attributable to common shareholders) [3]
per share – basic [3]
Other items [3, 4] ) ) ) ) ) ) )
per share – basic [3] ) ) ) ) ) )
[ ] Revenue in the fourth quarter of 2016 is lower due to a decrease in the value of Lifeco’s bond portfolio resulting from increasing interest rates.
[ ] Comparative figures restated as a result of IFRS 15; see “Adoption of IFRS 15” section for more details.
[ ] Adjusted net earnings and adjusted net earnings per share attributable to common shareholders, and other items and other items per share are non-IFRS financial measures. For a definition of these non-IFRS financial measures, please refer to the “Non-IFRS Financial Measures and Presentation” section in this MD&A.
[ ] The Corporation’s share of Lifeco, IGM and Pargesa’s Other items is as follows:
Lifeco Impact of U.S. tax reform ) Restructuring charges ) ) ) ) ) ) )
Net charge on sale of an equity investment ) Share of IGM’s other items ) IGM Restructuring and other charges ) ) Pension plan Reduction of income tax estimates Share of Lifeco’s other items ) ) Pargesa Total – Gains on partial disposal LafargeHolcim – Impairment charges ) )
Engie – Impairment charge and loss on partial disposal ) ) Other (charge) income ) ) ) ) ) ) ) ) ) ) ) )
A 34 POWER FINANCIAL CORPORATION�— �FIRST QUARTER REPORT 2018
PFC_QUAT1_Eng01_PFC_2018-05-09_v1.indd B34PFC_QUAT1_Eng01_PFC_2018-05-09_v1.indd B34 18-05-09 10:54 PM18-05-09 10:54 PM

PA
RT
AP
OW
ER FIN
AN
CIA
L CO
RP
OR
ATIO
NPOWER FINANCIAL CORPORATION
Condensed Consolidated Balance Sheets
(unaudited) [in millions of Canadian dollars]
March , December ,
Assets Cash and cash equivalents , ,Investments [Note 5]
Bonds , ,Mortgage loans , ,Shares , ,Investment properties , ,Loans to policyholders , ,
, ,Funds held by ceding insurers , ,Reinsurance assets [Note 8] , ,Investments in jointly controlled corporations and associates [Note 6] , ,Owner-occupied properties and capital assets , ,Derivative financial instruments Other assets , ,Deferred tax assets ,Intangible assets , ,Goodwill , ,Investments on account of segregated fund policyholders [Note 7] , ,Total assets , ,
Liabilities Insurance contract liabilities [Note 8] , ,Investment contract liabilities [Note 8] , ,Obligations to securitization entities , ,Debentures and other debt instruments [Note 9] , ,Derivative financial instruments , ,Other liabilities , ,Deferred tax liabilities , ,Insurance and investment contracts on account of segregated fund policyholders [Note 7] , ,Total liabilities , ,
Equity Stated capital [Note 10]
Perpetual preferred shares , ,Common shares
Retained earnings , ,Reserves , ,Total shareholders’ equity , ,Non-controlling interests , ,Total equity , ,Total liabilities and equity , ,
POWER FINANCIAL CORPORATION�— �FIRST QUARTER REPORT 2018 A 35
PFC_QUAT1_Eng01_PFC_2018-05-09_v1.indd B35PFC_QUAT1_Eng01_PFC_2018-05-09_v1.indd B35 18-05-09 10:54 PM18-05-09 10:54 PM

PA
RT
AP
OW
ER F
INA
NC
IAL
CO
RP
OR
ATI
ON
POWER FINANCIAL CORPORATION
Condensed Consolidated Statements of Earnings
(unaudited) [in millions of Canadian dollars, except per share amounts]
Three months ended March ,
[Note ]
Revenues Premium income
Gross premiums written , ,Ceded premiums ( , ) ( , )
Premium income, net , ,Net investment income
Regular net investment income , ,Change in fair value through profit or loss ( , )
Net investment income , Fee income , ,Total revenues , ,
Expenses Policyholder benefits
Insurance and investment contracts Gross , ,Ceded ( ) ( )
Total net policyholder benefits , ,Policyholder dividends and experience refunds Change in insurance and investment contract liabilities ( , ) ,Total paid or credited to policyholders , ,Commissions ,Operating and administrative expenses , ,Financing charges Total expenses , ,Earnings before investments in jointly controlled corporations and associates, and income taxesShare of earnings of investments in jointly controlled corporations and associates [Note 6]Earnings before income taxes ,Income taxes [Note 15] Net earnings Attributable to
Non-controlling interests Perpetual preferred shareholders Common shareholders
Earnings per common share [Note 17]
Net earnings attributable to common shareholders– Basic . .– Diluted . .
A 36 POWER FINANCIAL CORPORATION�— �FIRST QUARTER REPORT 2018
PFC_QUAT1_Eng01_PFC_2018-05-09_v1.indd B36PFC_QUAT1_Eng01_PFC_2018-05-09_v1.indd B36 18-05-09 10:54 PM18-05-09 10:54 PM

PA
RT
AP
OW
ER FIN
AN
CIA
L CO
RP
OR
ATIO
NPOWER FINANCIAL CORPORATION
Condensed Consolidated Statements of Comprehensive Income
(unaudited) [in millions of Canadian dollars]
Three months ended March ,
Net earnings Other comprehensive income (loss)
Items that may be reclassified subsequently to net earningsNet unrealized gains (losses) on available-for-sale assets
Unrealized gains (losses) ( )Income tax (expense) benefit ( )Realized (gains) losses transferred to net earnings ( )Income tax expense (benefit) –
( )Net unrealized gains (losses) on cash flow hedges
Unrealized gains (losses) Income tax (expense) benefit ( ) ( )Realized (gains) losses transferred to net earnings –Income tax expense (benefit) ( ) –
Net unrealized foreign exchange gains (losses) on translation of foreign operations
Unrealized gains (losses) on translation ( )Unrealized gains (losses) on euro debt designated as hedge of
net investments in foreign operations ( ) –Income tax (expense) benefit –
( )
Share of other comprehensive income of investments in jointly controlled corporations and associates Income tax (expense) benefit ( ) –
Total – items that may be reclassified
Items that will not be reclassified subsequently to net earningsActuarial gains (losses) on defined benefit plans [Note 14] ( )Income tax (expense) benefit ( ) ( )Share of other comprehensive income (losses) of investments
in jointly controlled corporations and associates – ( )Total – items that will not be reclassified ( )
Other comprehensive income Comprehensive income , , Attributable to
Non-controlling interests Perpetual preferred shareholders Common shareholders ,
, ,
POWER FINANCIAL CORPORATION�— �FIRST QUARTER REPORT 2018 A 37
PFC_QUAT1_Eng01_PFC_2018-05-09_v1.indd B37PFC_QUAT1_Eng01_PFC_2018-05-09_v1.indd B37 18-05-09 10:54 PM18-05-09 10:54 PM

PA
RT
AP
OW
ER F
INA
NC
IAL
CO
RP
OR
ATI
ON
POWER FINANCIAL CORPORATION
Condensed Consolidated Statements of Changes in Equity
Stated capital ReservesThree months ended March 31, 2018 (unaudited) [in millions of Canadian dollars]
Perpetual preferred
sharesCommon
shares Retained earnings
Share-based compensation
Other comprehensive
income[Note ] Total
Non-controlling
interestsTotal
equity Balance, beginning of year
As previously reported , , , , , ,Change in accounting policy
[Note 3] – – ( ) – – – ( ) ( )Restated balance,
beginning of year , , , , , ,Net earnings – – – – – Other comprehensive income – – – – Comprehensive income – – – , Dividends to shareholders
Perpetual preferred shares – – ( ) – – – – ( )Common shares – – ( ) – – – – ( )
Dividends to non-controlling interests – – – – – – ( ) ( )
Share-based compensation [Note 11] – – – –
Stock options exercised – – – ( ) – ( ) –Effects of changes in capital
and ownership of subsidiaries, and other – – ( ) – – – ( ) ( )
Balance, end of period , , , , , ,
Stated capital Reserves Three months ended March 31, 2017 (unaudited) [in millions of Canadian dollars]
Perpetual preferred
sharesCommon
shares Retained earnings
Share-based compensation
Othercomprehensive
income[Note ] Total
Non-controlling
interestsTotal
equity Balance, beginning of year , , , , , ,Net earnings – – – – – Other comprehensive income
(loss) – – – – ( )Comprehensive income – – – , Dividends to shareholders
Perpetual preferred shares – – ( ) – – – – ( )Common shares – – ( ) – – – – ( )
Dividends to non-controlling interests – – – – – – ( ) ( )
Share-based compensation [Note 11] – – – –
Stock options exercised – – ( ) – ( ) Effects of changes in capital
and ownership of subsidiaries, and other – – –
Balance, end of period , , , , , ,
A 38 POWER FINANCIAL CORPORATION�— �FIRST QUARTER REPORT 2018
PFC_QUAT1_Eng01_PFC_2018-05-09_v1.indd B38PFC_QUAT1_Eng01_PFC_2018-05-09_v1.indd B38 18-05-09 10:54 PM18-05-09 10:54 PM

PA
RT
AP
OW
ER FIN
AN
CIA
L CO
RP
OR
ATIO
NPOWER FINANCIAL CORPORATION
Condensed Consolidated Statements of Cash Flows
(unaudited) [in millions of Canadian dollars]
Three months ended March ,
Operating activities Earnings before income taxes ,Income tax paid, net of refunds ( ) ( )Adjusting items
Change in insurance and investment contract liabilities ( ) ,Change in funds held by ceding insurers Change in reinsurance assets Change in fair value through profit or loss , ( )Other ( ) ( )
, ,Financing activities Dividends paid
By subsidiaries to non-controlling interests ( ) ( )Perpetual preferred shares ( ) ( )Common shares ( ) ( ) ( ) ( )
Issue of common shares by the Corporation [Note 10] –Issue of common shares by subsidiaries Repurchase of common shares by subsidiaries ( ) –Issue of debentures [Note 9] Redemption of debentures [Note 9] ( ) ( )Change in other debt instruments ( ) –Change in obligations to securitization entities and other ( ) ( ) ( )Investment activities Bond sales and maturities , ,Mortgage loan repayments Sale of shares Change in loans to policyholders ( )Business acquisitions, net of cash and cash equivalents acquired [Note 4] ( ) –Investment in bonds ( , ) ( , )Investment in mortgage loans ( , ) ( )Investment in shares ( ) ( )Proceeds from assets held for sale [Note 4] –Investment in investment properties and other ( ) ( ) ( , ) ( , )Effect of changes in exchange rates on cash and cash equivalents ( )Increase (decrease) in cash and cash equivalents ( )Cash and cash equivalents, beginning of year , ,Cash and cash equivalents, end of period , , Net cash from operating activities includes Interest and dividends received , ,Interest paid
POWER FINANCIAL CORPORATION�— �FIRST QUARTER REPORT 2018 A 39
PFC_QUAT1_Eng01_PFC_2018-05-09_v1.indd B39PFC_QUAT1_Eng01_PFC_2018-05-09_v1.indd B39 18-05-09 10:54 PM18-05-09 10:54 PM

PA
RT
AP
OW
ER F
INA
NC
IAL
CO
RP
OR
ATI
ON
POWER FINANCIAL CORPORATION
Notes to the Interim Condensed Consolidated Financial Statements (unaudited)
(ALL TABULAR AMOUNTS ARE IN MILLIONS OF CANADIAN DOLLARS, UNLESS OTHERWISE NOTED.)
Note Corporate Information
Note Basis of Presentation
Note Summary of Significant Accounting Policies
Note Business Acquisitions and Disposal
Note Investments
Note Investments in Jointly Controlled Corporations and Associates
Note Segregated Funds
Note Insurance and Investment Contract Liabilities
Note Debentures and Other Debt Instruments
Note Stated Capital
Note Share-Based Compensation
Note Capital Management
Note Risk Management
Note Pension Plans and Other Post-Employment Benefits
Note Income Taxes
Note Other Comprehensive Income
Note Earnings per Share
Note Fair Value Measurement
Note Segmented Information
The following abbreviations are used in these Consolidated Financial Statements:
CALM Canadian Asset Liability Method Canada Life The Canada Life Assurance Company China AMC China Asset Management Co., Ltd. Great-West Life The Great-West Life Assurance Company IFRS International Financial Reporting Standards IGM or IGM Financial IGM Financial Inc. Investors Group Investors Group Inc. Irish Life Irish Life Group Limited Lifeco Great-West Lifeco Inc.
London Life London Life Insurance Company Mackenzie or Mackenzie Financial Corporation
Mackenzie Investments Pargesa Pargesa Holding SA Parjointco Parjointco N.V. Portag3 Portag3 Ventures Limited Partnership Power Corporation Power Corporation of Canada Power Financial or Power Financial Corporation
the Corporation Putnam Putnam Investments, LLC Wealthsimple Wealthsimple Financial Corp.
NOTE 1 Corporate Information
Power Financial Corporation is a publicly listed company (TSX: PWF) incorporated and domiciled in Canada and located at 751 Victoria Square, Montréal, Québec, Canada, H2Y 2J3.
Power Financial is a diversified international management and holding company that holds interests, directly or indirectly, in companies in the financial services sector in Canada, the United States and Europe. Through its investment in Pargesa Holding SA, Power Financial also has significant holdings based in Europe.
The unaudited Interim Condensed Consolidated Financial Statements (financial statements) of Power Financial as at and for the three months ended March 31, 2018 were approved by its Board of Directors on May 10, 2018. The Corporation is controlled by Power Corporation of Canada.
65
6 1
6 1
60
60
59
53
52
5 1
50
49
49
47
46
46
45
42
4 1
40
A 40 POWER FINANCIAL CORPORATION�— �FIRST QUARTER REPORT 2018
PFC_QUAT1_Eng01_PFC_2018-05-09_v1.indd B40PFC_QUAT1_Eng01_PFC_2018-05-09_v1.indd B40 18-05-09 10:54 PM18-05-09 10:54 PM

PA
RT
AP
OW
ER FIN
AN
CIA
L CO
RP
OR
ATIO
NPOWER FINANCIAL CORPORATION
NOTE 2 Basis of Presentation
BASIS OF PRESENTATION The financial statements include the accounts of Power Financial and its subsidiaries on a consolidated basis after elimination of intercompany transactions and balances. Subsidiaries are entities the Corporation controls; (i) when the Corporation has power over the entity; (ii) it is exposed or has rights to variable returns from its involvement; and (iii) has the ability to affect those returns through its use of power over the entity. Subsidiaries of the Corporation are consolidated from the date of acquisition, being the date on which the Corporation obtains control, and continue to be consolidated until the date such control ceases. The Corporation reassesses whether or not it controls an entity if facts and circumstances indicate there are changes to one or more of the elements of control.
The operating subsidiaries of the Corporation are:
Lifeco, a public company in which the Corporation and IGM Financial hold 67.7% and 4.0% of the common shares, respectively (67.7% and 4.0%, respectively, at December 31, 2017). Lifeco’s major operating subsidiary companies are Great-West Life, Great-West Financial, London Life, Canada Life, Irish Life and Putnam.
IGM Financial, a public company in which the Corporation and Great-West Life hold 61.4% and 3.8% of the common shares, respectively (61.5% and 3.8%, respectively, at December 31, 2017). IGM’s major operating subsidiary companies are Investors Group and Mackenzie.
Portag3, an investment fund dedicated to backing innovative financial service companies, in which the Corporation, Lifeco and IGM hold a combined 100% equity interest. Portag3 in turn holds a 23.6% equity interest in Wealthsimple, a technology-driven investment manager. In addition, the Corporation and IGM also hold equity interests in Wealthsimple of 14.7% and 43.3%, respectively.
The financial statements of Power Financial include the results of Lifeco and IGM Financial on a consolidated basis; the amounts shown in the consolidated balance sheets, consolidated statements of earnings, consolidated statements of comprehensive income, consolidated statements of changes in equity and consolidated statements of cash flows are derived from the publicly disclosed consolidated financial statements of Lifeco and IGM Financial, all as at and for the three months ended March 31, 2018. Certain notes to Power Financial’s financial statements are derived from the notes to the financial statements of Lifeco and IGM Financial.
Jointly controlled corporations are entities in which unanimous consent is required for decisions relating to relevant activities. Associates are entities in which the Corporation exercises significant influence over the entity’s operating and financial policies, without having control or joint control. Investments in jointly controlled corporations and associates are accounted for using the equity method. Under the equity method, the Corporation recognizes its share of net earnings (losses), other comprehensive income (loss) and the changes in equity of the jointly controlled corporations and associates.
The Corporation holds a 50% (50% at December 31, 2017) interest in Parjointco, a jointly controlled corporation that is considered to be a joint venture. Parjointco holds a 55.5% (55.5% at December 31, 2017) equity interest in Pargesa, a public company. Accordingly, the Corporation accounts for its investment in Parjointco using the equity method.
POWER FINANCIAL CORPORATION�— �FIRST QUARTER REPORT 2018 A 41
PFC_QUAT1_Eng01_PFC_2018-05-09_v1.indd B41PFC_QUAT1_Eng01_PFC_2018-05-09_v1.indd B41 18-05-09 10:54 PM18-05-09 10:54 PM

PA
RT
AP
OW
ER F
INA
NC
IAL
CO
RP
OR
ATI
ON
POWER FINANCIAL CORPORATION
NOTE 3 Summary of Significant Accounting Policies
The financial statements of Power Financial as at March 31, 2018 have been prepared in accordance with International Accounting Standard 34 – Interim Financial Reporting (IAS 34) using the same accounting policies, which are consistent with IFRS, as set out in Note 2 to the consolidated financial statements of the Corporation for the year ended December 31, 2017 except as described below. These financial statements should be read in conjunction with the Corporation’s consolidated financial statements and notes thereto for the year ended December 31, 2017.
CHANGE IN ACCOUNTING POLICY
IFRS 15 – Revenue from contracts with customers (IFRS 15) Effective January 1, 2018 the Corporation adopted IFRS 15 which outlines a single comprehensive model for entities to use in accounting for revenue arising from contracts with customers. The model requires an entity to recognize revenue as the goods or services are transferred to the customer in an amount that reflects the expected consideration. The revenue recognition requirements in IFRS 15 do not apply to the revenue arising from insurance contracts, leases and financial instruments.
The Corporation’s fee income is within the scope of IFRS 15 and primarily includes fees earned from management of segregated fund assets, management, administration and distribution of mutual fund assets, record keeping, fees earned on administrative services only for Group health contracts, commissions and fees earned from management services. Under IFRS 15, the Corporation recognizes revenue on the transfer of services to customers for the amount that reflects the consideration expected to be received in exchange for those services promised.
IFRS 15 outlines the criteria for the eligibility of capitalizing contract costs as well as provides guidance for costs to fulfill a contract. In the asset management business, when the customer is determined to be the investment fund, contract costs related to the distribution of the investment fund must be assessed as a cost of fulfilling a contract.
The Corporation’s subsidiaries previously capitalized all commissions related to the distribution of investment funds and amortized them over their estimated useful life, not exceeding a period of seven years.
To determine whether sales commissions associated with the distribution of investment funds should be capitalized, the Corporation and its subsidiaries assess whether the customer is the investment fund or the individual investor. Where it is determined that the investment fund is the customer, contract costs are expensed as incurred. Where it is determined that the individual investor is the customer, contract costs are capitalized and amortized over their estimated useful lives, not exceeding a period of seven years.
The Corporation and its subsidiaries have elected to apply the modified retrospective approach, as permitted by the transition provisions within IFRS 15. As a result of changes to the treatment of contract costs, Lifeco and IGM have recorded an adjustment for the derecognition of certain deferred acquisition costs included in other assets, deferred selling commissions included in intangible assets and related income tax liabilities which resulted in a decrease of $360 million in the opening retained earnings of the Corporation as at January 1, 2018.
The impact of the change in accounting policy on the consolidated balance sheet is as follows:
December ,
(as previously reported)Impact of change in
accounting policyJanuary ,
(restated)
Assets Other assets , ( ) ,Intangible assets – Deferred selling commissions ( )
( )
Liabilities and shareholders’ equity Deferred tax liabilities , ( ) ,Retained earnings , ( ) ,Non-controlling interests , ( ) , ( )
A 42 POWER FINANCIAL CORPORATION�— �FIRST QUARTER REPORT 2018
PFC_QUAT1_Eng01_PFC_2018-05-09_v1.indd B42PFC_QUAT1_Eng01_PFC_2018-05-09_v1.indd B42 18-05-09 10:54 PM18-05-09 10:54 PM

PA
RT
AP
OW
ER FIN
AN
CIA
L CO
RP
OR
ATIO
NPOWER FINANCIAL CORPORATION
NOTE 3 Summary of Significant Accounting Policies (continued)
The changes in the carrying value of the deferred selling commissions included in intangible assets on the consolidated balance sheets are as follows:
March ,
December ,
Cost, beginning of year As previously reported , ,Change in accounting policy ( , ) –
Restated cost, beginning of year ,Additions Disposal/redemption – ( )Other, including write-off of assets fully amortized – ( )
Cost, end of period ,
Accumulated amortization, beginning of year As previously reported ( ) ( )Change in accounting policy –
Restated accumulated amortization, beginning of year ( ) ( )Amortization ( ) ( )Disposal/redemption – Other, including write-off of assets fully amortized –
Accumulated amortization, end of period ( ) ( )
Carrying value, end of period Comparative figures In addition, Lifeco has reclassified comparative amounts in the consolidated statements of earnings for the change in presentation of certain revenues and expenses on a gross or net basis. These changes were mostly related to a change in the principal versus agent relationship as a result of the guidance prescribed under IFRS 15 in assessing whether the entity controls the service transferred to the customer. As a result, certain balances within gross premiums written, fee income, commissions, and operating and administrative expenses were reclassified. These reclassifications were not significant and did not have an impact on the net earnings. The impact by line items on the consolidated statements of earnings is as follows:
For the three months ended March 31, 2017 Amount previously
reported Reclassification Revised amount
presented
Gross premiums written , ( ) ,Fee income , ,Commissions , ,Operating and administrative expenses , ( ) ,
POWER FINANCIAL CORPORATION�— �FIRST QUARTER REPORT 2018 A 43
PFC_QUAT1_Eng01_PFC_2018-05-09_v1.indd B43PFC_QUAT1_Eng01_PFC_2018-05-09_v1.indd B43 18-05-09 10:54 PM18-05-09 10:54 PM

PA
RT
AP
OW
ER F
INA
NC
IAL
CO
RP
OR
ATI
ON
POWER FINANCIAL CORPORATION
NOTE 3 Summary of Significant Accounting Policies (continued)
As a result of the adoption of IFRS 15 the following accounting policy has been changed since December 31, 2017:
Intangible assets – Deferred selling commissions Commissions are paid on investment product sales where IGM either receives a fee directly from the client or where it receives a fee directly from the mutual fund.
Commissions paid on investment product sales where IGM receives a fee directly from the client are capitalized and amortized over their estimated useful lives, not exceeding a period of seven years. IGM regularly reviews the carrying value of deferred selling commissions with respect to any events or circumstances that indicate impairment. Among the tests performed by IGM to assess recoverability is the comparison of the future economic benefits derived from the deferred selling commission asset in relation to its carrying value.
All other commissions paid on investment product sales are expensed as incurred.
USE OF SIGNIFICANT JUDGMENTS, ESTIMATES AND ASSUMPTIONS In the preparation of the financial statements, management of the Corporation and management of its subsidiaries are required to make significant judgments, estimates and assumptions that affect the reported amounts of assets, liabilities, net earnings, comprehensive income and related disclosures. Key sources of estimation uncertainty and areas where significant judgments have been made by the management of the Corporation and the management of its subsidiaries are further described in the relevant accounting policies as described in the Corporation’s financial statements and notes thereto for the year ended December 31, 2017.
FUTURE ACCOUNTING CHANGES There have been no significant changes to future accounting policies that could impact the Corporation from what was disclosed in the December 31, 2017 consolidated annual audited financial statements. Current implication of IFRS 9 – Financial Instruments (IFRS 9) In July 2014, the IASB issued a final version of IFRS 9, Financial Instruments, which replaces IAS 39, Financial Instruments: Recognition and Measurement, the current standard for accounting for financial instruments with an effective date of January 1, 2018.
In September 2016, the IASB issued an amendment to IFRS 4, Insurance Contracts (IFRS 4). The amendment “Applying IFRS 9, Financial Instruments with IFRS 4, Insurance Contracts” provides qualifying insurance companies with two options to address the potential volatility associated with implementing the IFRS 9 standard before the new proposed insurance contract standard is effective. The two options are as follows:
Deferral Approach: provides the option to defer implementation of IFRS 9 until the year 2021 or the effective date of the new insurance contract standard, whichever is earlier; or
Overlay Approach: provides the option to recognize the volatility that could arise when IFRS 9 is applied within other comprehensive income, rather than profit or loss.
The Corporation qualifies and has elected to apply the deferral approach which permits the adoption of both IFRS 9 and IFRS 17 Insurance Contracts simultaneously on January 1, 2021.
Pargesa (held through Parjointco), a jointly controlled corporation does not qualify for the exemption and adopted IFRS 9 on January 1, 2018. The Corporation, in accordance with the amendment of IFRS 4 to defer the adoption of IFRS 9, is permitted but not required to retain the accounting policies applied by an associate or a jointly controlled corporation which is accounted for using the equity method. The Corporation has decided to continue applying IAS 39 to Pargesa’s results.
A 44 POWER FINANCIAL CORPORATION�— �FIRST QUARTER REPORT 2018
PFC_QUAT1_Eng01_PFC_2018-05-09_v1.indd B44PFC_QUAT1_Eng01_PFC_2018-05-09_v1.indd B44 18-05-09 10:54 PM18-05-09 10:54 PM
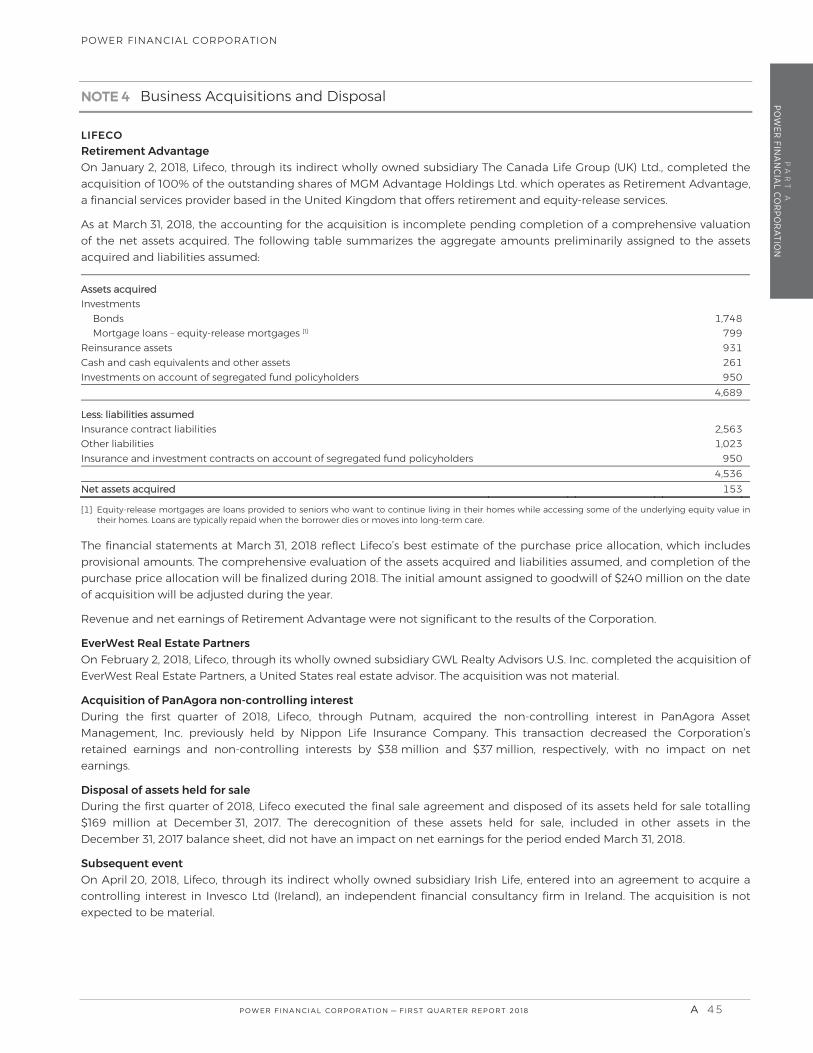
PA
RT
AP
OW
ER FIN
AN
CIA
L CO
RP
OR
ATIO
NPOWER FINANCIAL CORPORATION
NOTE 4 Business Acquisitions and Disposal
LIFECO Retirement Advantage On January 2, 2018, Lifeco, through its indirect wholly owned subsidiary The Canada Life Group (UK) Ltd., completed the acquisition of 100% of the outstanding shares of MGM Advantage Holdings Ltd. which operates as Retirement Advantage, a financial services provider based in the United Kingdom that offers retirement and equity-release services.
As at March 31, 2018, the accounting for the acquisition is incomplete pending completion of a comprehensive valuation of the net assets acquired. The following table summarizes the aggregate amounts preliminarily assigned to the assets acquired and liabilities assumed:
Assets acquired Investments
Bonds ,7Mortgage loans – equity-release mortgages [1] 799
Reinsurance assets 9Cash and cash equivalents and other assets 6Investments on account of segregated fund policyholders 95 ,6 9
Less: liabilities assumed Insurance contract liabilities ,56Other liabilities ,Insurance and investment contracts on account of segregated fund policyholders 95 ,5 6Net assets acquired 5
[ ] Equity-release mortgages are loans provided to seniors who want to continue living in their homes while accessing some of the underlying equity value in their homes. Loans are typically repaid when the borrower dies or moves into long-term care.
The financial statements at March 31, 2018 reflect Lifeco’s best estimate of the purchase price allocation, which includes provisional amounts. The comprehensive evaluation of the assets acquired and liabilities assumed, and completion of the purchase price allocation will be finalized during 2018. The initial amount assigned to goodwill of $240 million on the date of acquisition will be adjusted during the year.
Revenue and net earnings of Retirement Advantage were not significant to the results of the Corporation.
EverWest Real Estate Partners On February 2, 2018, Lifeco, through its wholly owned subsidiary GWL Realty Advisors U.S. Inc. completed the acquisition of EverWest Real Estate Partners, a United States real estate advisor. The acquisition was not material.
Acquisition of PanAgora non-controlling interest During the first quarter of 2018, Lifeco, through Putnam, acquired the non-controlling interest in PanAgora Asset Management, Inc. previously held by Nippon Life Insurance Company. This transaction decreased the Corporation’s retained earnings and non-controlling interests by $38 million and $3 million, respectively, with no impact on net earnings.
Disposal of assets held for sale During the first quarter of 2018, Lifeco executed the final sale agreement and disposed of its assets held for sale totalling $1 million at December 31, 201 . The derecognition of these assets held for sale, included in other assets in the December 31, 201 balance sheet, did not have an impact on net earnings for the period ended March 31, 2018.
Subsequent event On April 20, 2018, Lifeco, through its indirect wholly owned subsidiary Irish Life, entered into an agreement to acquire a controlling interest in Invesco Ltd (Ireland), an independent financial consultancy firm in Ireland. The acquisition is not expected to be material.
POWER FINANCIAL CORPORATION�— �FIRST QUARTER REPORT 2018 A 45
PFC_QUAT1_Eng01_PFC_2018-05-09_v1.indd B45PFC_QUAT1_Eng01_PFC_2018-05-09_v1.indd B45 18-05-10 9:10 AM18-05-10 9:10 AM

PA
RT
AP
OW
ER F
INA
NC
IAL
CO
RP
OR
ATI
ON
POWER FINANCIAL CORPORATION
NOTE 5 Investments
CARRYING VALUES AND FAIR VALUES Carrying values and estimated fair values of investments are as follows:
March , December ,
Carrying
valueFair
value Carrying
valueFair
value
Bonds Designated as fair value through profit or loss , , , ,Classified as fair value through profit or loss , , , ,Available for sale , , , ,Loans and receivables , , , ,
, , , ,Mortgage loans
Loans and receivables , , , ,Designated as fair value through profit or loss [1] – –Classified as fair value through profit or loss [2]
, , , ,Shares
Designated as fair value through profit or loss , , , ,Available for sale
, , , ,Investment properties , , , ,Loans to policyholders , , , , , , , ,
[ ] Equity-release mortgages acquired with the acquisition of Retirement Advantage [Note ] are designated at fair value through profit or loss. There are no market observable prices for equity-release mortgages; therefore an internal discounted cash flow model is used to value these assets. These mortgage loans are included in Level of the fair value hierarchy [Note ].
[ ] Mortgage loans previously classified as fair value through profit or loss and subsequently reclassified to loans and receivables are now initially classified with respect to the intent of the loan on origination.
NOTE 6 Investments in Jointly Controlled Corporations and Associates
The carrying values of the investments in jointly controlled corporations and associates are as follows:
March , March , Parjointco China AMC Other Total Parjointco China AMC Other Total
Carrying value, beginning of year , , , – ,Investments – – – – – – Disposal [1] – – – – – – ( ) ( )Share of earnings – – Share of other comprehensive income – –
Carrying value, end of period , , , – ,
[ ] In the first quarter of , Lifeco disposed of its investment in Allianz Ireland.
A 46 POWER FINANCIAL CORPORATION�— �FIRST QUARTER REPORT 2018
PFC_QUAT1_Eng01_PFC_2018-05-09_v1.indd B46PFC_QUAT1_Eng01_PFC_2018-05-09_v1.indd B46 18-05-09 10:54 PM18-05-09 10:54 PM
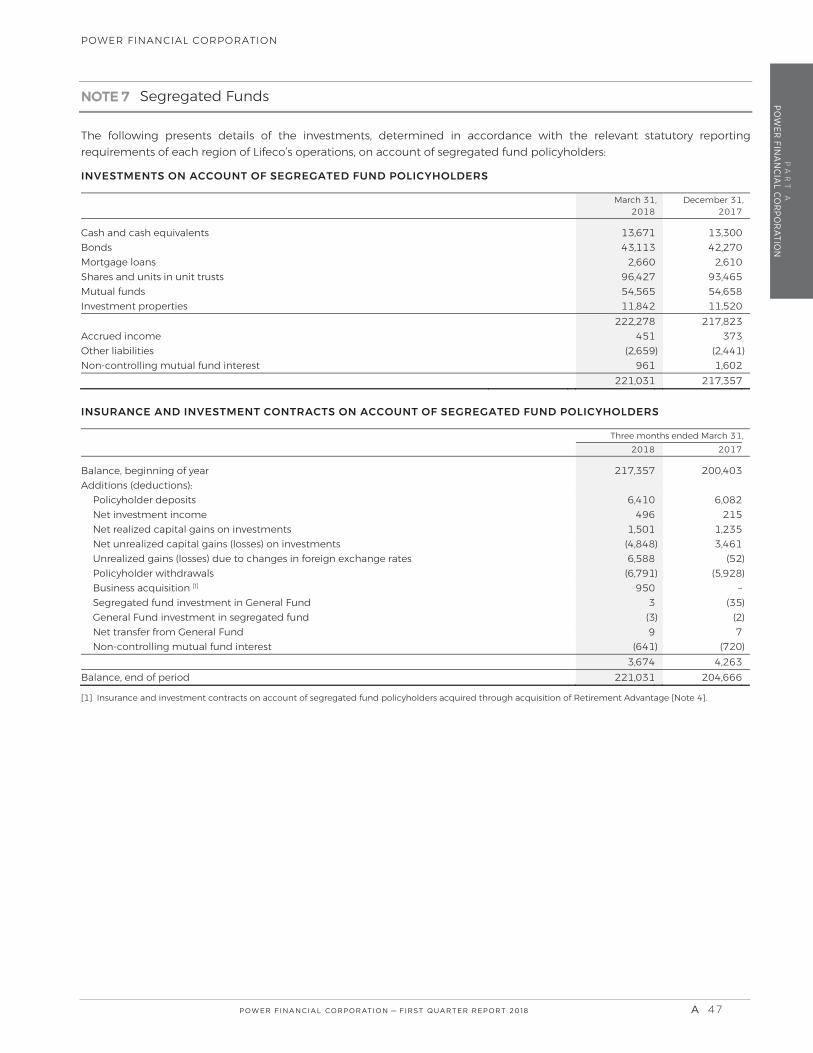
PA
RT
AP
OW
ER FIN
AN
CIA
L CO
RP
OR
ATIO
NPOWER FINANCIAL CORPORATION
NOTE 7 Segregated Funds
The following presents details of the investments, determined in accordance with the relevant statutory reporting requirements of each region of Lifeco’s operations, on account of segregated fund policyholders:
INVESTMENTS ON ACCOUNT OF SEGREGATED FUND POLICYHOLDERS
March ,
December ,
Cash and cash equivalents , ,Bonds , ,Mortgage loans , ,Shares and units in unit trusts , ,Mutual funds , ,Investment properties , , , ,Accrued income Other liabilities ( , ) ( , )Non-controlling mutual fund interest , , ,
INSURANCE AND INVESTMENT CONTRACTS ON ACCOUNT OF SEGREGATED FUND POLICYHOLDERS
Three months ended March ,
Balance, beginning of year , ,Additions (deductions):
Policyholder deposits , ,Net investment income Net realized capital gains on investments , ,Net unrealized capital gains (losses) on investments ( , ) ,Unrealized gains (losses) due to changes in foreign exchange rates , ( )Policyholder withdrawals ( , ) ( , )Business acquisition [1] –Segregated fund investment in General Fund ( )General Fund investment in segregated fund ( ) ( )Net transfer from General Fund Non-controlling mutual fund interest ( ) ( )
, ,Balance, end of period , ,
[ ] Insurance and investment contracts on account of segregated fund policyholders acquired through acquisition of Retirement Advantage [Note ].
POWER FINANCIAL CORPORATION�— �FIRST QUARTER REPORT 2018 A 47
PFC_QUAT1_Eng01_PFC_2018-05-09_v1.indd B47PFC_QUAT1_Eng01_PFC_2018-05-09_v1.indd B47 18-05-09 10:54 PM18-05-09 10:54 PM

PA
RT
AP
OW
ER F
INA
NC
IAL
CO
RP
OR
ATI
ON
POWER FINANCIAL CORPORATION
NOTE 7 Segregated Funds (continued)
INVESTMENTS ON ACCOUNT OF SEGREGATED FUND POLICYHOLDERS (by fair value hierarchy level)
March , Level Level Level Total
Investments on account of segregated fund policyholders [1] , , , ,
[ ] Excludes other liabilities, net of other assets, of $ , million. December , Level Level Level Total
Investments on account of segregated fund policyholders [1] , , , ,
[ ] Excludes other liabilities, net of other assets, of $ , million. During the three months ended March 31, 2018, certain foreign equity holdings valued at $175 million were transferred from Level 1 to Level 2 ($629 million were transferred from Level 1 to Level 2 at December 31, 2017), primarily based on Lifeco utilizing inputs in addition to quoted prices in active markets for certain foreign stock holdings. Level 2 includes assets where fair value is not available from normal market pricing sources and where Lifeco does not have visibility through to the underlying assets. Inputs are utilized in addition to quoted prices in active markets.
The following presents additional information about Lifeco’s investments on account of segregated fund policyholders for which Lifeco has utilized Level 3 inputs to determine fair value:
March , December ,
Balance, beginning of year , ,Total gains included in segregated fund investment income Purchases Sales ( ) ( )Transfers into Level 3 Transfers out of Level 3 ( ) ( )
Balance, end of period , , Transfers into Level 3 are due primarily to decreased observability of inputs in valuation methodologies. Transfers out of Level 3 are due primarily to increased observability of inputs in valuation methodologies as evidenced by corroboration of market prices with multiple pricing vendors.
Refer to the Lifeco section of the Corporation’s Management’s Discussion and Analysis (Part B) for the three-month period ended March 31, 2018 and for the year ended December 31, 2017 for further details on Lifeco’s risk and guarantee exposure and the management of these segregated fund risks.
A 48 POWER FINANCIAL CORPORATION�— �FIRST QUARTER REPORT 2018
PFC_QUAT1_Eng01_PFC_2018-05-09_v1.indd B48PFC_QUAT1_Eng01_PFC_2018-05-09_v1.indd B48 18-05-09 10:54 PM18-05-09 10:54 PM

PA
RT
AP
OW
ER FIN
AN
CIA
L CO
RP
OR
ATIO
NPOWER FINANCIAL CORPORATION
NOTE 8 Insurance and Investment Contract Liabilities
INSURANCE AND INVESTMENT CONTRACT LIABILITIES March , December ,
Grossliability
Reinsurance assets Net
Grossliability
Reinsurance assets Net
Insurance contract liabilities , , , , , ,Investment contract liabilities , – , , – , , , , , , ,
NOTE 9 Debentures and Other Debt Instruments
LIFECO On February 28, 2018, Lifeco issued $500 million of 10-year 3.337% debentures at par, maturing on February 28, 2028. Interest on the debentures is payable semi-annually in arrears on February 28 and August 28, commencing August 28, 2018 until the date on which the debentures are repaid. The debentures are redeemable at any time prior to November 28, 2027 in whole or in part at the greater of the Canada Yield Price and par, and on or after November 28, 2027 in whole or in part at par, together in each case with accrued and unpaid interest.
On March 21, 2018, Lifeco redeemed its 6.14% $200 million debenture notes at their principal amount together with accrued interest.
Subsequent event Subsequent to the first quarter of 2018, Great-West Lifeco Finance (Delaware) LP II announced its intention to redeem all $500 million principal amount of its 7.127% subordinated debentures due June 26, 2068 on June 26, 2018 at a redemption price equal to 100% of the principal amount of the debentures, plus any accrued interest up to but excluding the redemption date.
IGM On March 7, 2018, IGM repaid on maturity, the $150 million 2003 Series 6.58% debentures.
POWER FINANCIAL CORPORATION�— �FIRST QUARTER REPORT 2018 A 49
PFC_QUAT1_Eng01_PFC_2018-05-09_v1.indd B49PFC_QUAT1_Eng01_PFC_2018-05-09_v1.indd B49 18-05-09 10:54 PM18-05-09 10:54 PM

PA
RT
AP
OW
ER F
INA
NC
IAL
CO
RP
OR
ATI
ON
POWER FINANCIAL CORPORATION
NOTE 10 Stated Capital
AUTHORIZED The authorized capital of Power Financial consists of an unlimited number of First Preferred Shares, issuable in series; an unlimited number of Second Preferred Shares, issuable in series; and an unlimited number of common shares.
ISSUED AND OUTSTANDING
March , December ,
Number of shares
Stated capital
Number of shares
Statedcapital
$ $First Preferred Shares (perpetual)
Series A , , , ,Series D , , , ,Series E , , , ,Series F , , , ,Series H , , , ,Series I , , , ,Series K , , , ,Series L , , , ,Series O , , , ,Series P , , , ,Series Q , , , ,Series R , , , ,Series S , , , ,Series T , , , ,Series V , , , ,
, , Common Shares Balance, beginning of year , , , ,
Issued under Stock Option Plan – – ,Balance, end of period , , , , Common Shares During the three months ended March 31, 2018, no common shares were issued under the Corporation’s Employee Stock Option Plan (19,039 common shares issued for the three months ended March 31, 2017).
During the three months ended March 31, 2018, dividends declared on the Corporation’s common shares amounted to $0.4330 per share ($0.4125 per share in 2017).
A 50 POWER FINANCIAL CORPORATION�— �FIRST QUARTER REPORT 2018
PFC_QUAT1_Eng01_PFC_2018-05-09_v1.indd B50PFC_QUAT1_Eng01_PFC_2018-05-09_v1.indd B50 18-05-09 10:54 PM18-05-09 10:54 PM

PA
RT
AP
OW
ER FIN
AN
CIA
L CO
RP
OR
ATIO
NPOWER FINANCIAL CORPORATION
NOTE 11 Share-Based Compensation
STOCK OPTION PLAN Under Power Financial’s Employee Stock Option Plan, 27,723,801 common shares are reserved for issuance.
A summary of the status of Power Financial’s Employee Stock Option Plan as at March 31, 2018 and 2017, and changes during the periods ended on those dates is as follows:
March , March ,
OptionsWeighted-average
exercise price OptionsWeighted-average
exercise price $ $Outstanding at beginning of year , , . , , .
Granted , , . , , .Exercised – – ( , ) .Expired ( , , ) . – –
Outstanding at end of period , , . , , .
Options exercisable at end of period , , . , , . The exercise price of the 12,043,012 outstanding options ranges from $25.07 to $38.35.
Compensation expense During the three months ended March 31, 2018, Power Financial granted 1,809,883 options (1,465,974 options in 2017) under its Employee Stock Option Plan.
The fair value of these options was estimated using the Black-Scholes option-pricing model with the following weighted-average assumptions:
March , March ,
Dividend yield . % . %Expected volatility . % . %Risk-free interest rate . % . %Expected life (years) . .Fair value per stock option ($/option) . .Weighted-average exercise price ($/option) . . Lifeco and IGM have also established stock option plans pursuant to which options may be granted to certain officers and employees. In addition, other subsidiaries of the Corporation have established share-based compensation plans. Compensation expense is recorded based on the fair value of the options or the fair value of the equity investments at the grant date, amortized over the vesting period. For the three months ended March 31, 2018, total compensation expense relating to the stock options granted by the Corporation and its subsidiaries amounted to $18 million ($23 million in 2017) and is recorded in operating and administrative expenses in the statements of earnings.
POWER FINANCIAL CORPORATION�— �FIRST QUARTER REPORT 2018 A 5 1
PFC_QUAT1_Eng01_PFC_2018-05-09_v1.indd B51PFC_QUAT1_Eng01_PFC_2018-05-09_v1.indd B51 18-05-09 10:54 PM18-05-09 10:54 PM

PA
RT
AP
OW
ER F
INA
NC
IAL
CO
RP
OR
ATI
ON
POWER FINANCIAL CORPORATION
NOTE 12 Capital Management
As a holding company, Power Financial’s objectives in managing its capital are to:
provide attractive long-term returns to shareholders of the Corporation; provide sufficient financial flexibility to pursue its growth strategy to invest on a timely basis in its operating companies
and other investments as opportunities present; maintain a capital structure that matches the long-term nature of its investments by maximizing the use of permanent
capital; and maintain an appropriate credit rating to ensure stable access to the capital markets.
The Corporation manages its capital taking into consideration the risk characteristics and liquidity of its holdings. In order to maintain or adjust its capital structure, the Corporation may adjust the amount of dividends paid to shareholders, return capital to shareholders or issue capital.
The capital structure of the Corporation consists of debentures, perpetual preferred shares, common shareholders’ equity and non-controlling interests. The Corporation views perpetual preferred shares as a cost-effective source of permanent capital. The Corporation is a long-term investor and as such holds positions in long-term investments as well as cash and fixed income securities for liquidity purposes.
The Board of Directors of the Corporation is responsible for capital management. Management of the Corporation is responsible for establishing capital management procedures and for implementing and monitoring its capital plans. The Board of Directors of the Corporation reviews and approves capital transactions such as the issuance, redemption and repurchase of common shares, perpetual preferred shares and debentures. The boards of directors of the Corporation’s subsidiaries, as well as those of Pargesa and Groupe Bruxelles Lambert, govern and have the responsibility for their respective company’s capital management.
The Corporation itself is not subject to externally imposed regulatory capital requirements. However, Lifeco and certain of its main subsidiaries and IGM’s subsidiaries are subject to regulatory capital requirements and they manage their capital as described below.
LIFECO Lifeco manages its capital on both a consolidated basis as well as at the individual operating subsidiary level. The primary objectives of Lifeco’s capital management strategy are to:
maintain the capitalization of its regulated operating subsidiaries at a level that will exceed the relevant minimum regulatory capital requirements in the jurisdictions in which they operate;
maintain strong credit and financial strength ratings of Lifeco ensuring stable access to capital markets; and provide an efficient capital structure to maximize shareholder value in the context of Lifeco’s operational risks and
strategic plans.
Lifeco has established policies and procedures designed to identify, measure and report all material risks. Management of Lifeco is responsible for establishing capital management procedures for implementing and monitoring the capital plan.
The target level of capitalization for Lifeco and its subsidiaries is assessed by considering various factors such as the probability of falling below the minimum regulatory capital requirements in the relevant operating jurisdiction, the views expressed by various credit rating agencies that provide financial strength and other ratings to Lifeco, and the desire to hold sufficient capital to be able to honour all policyholder and other obligations of Lifeco with a high degree of confidence.
A 52 POWER FINANCIAL CORPORATION�— �FIRST QUARTER REPORT 2018
PFC_QUAT1_Eng01_PFC_2018-05-09_v1.indd B52PFC_QUAT1_Eng01_PFC_2018-05-09_v1.indd B52 18-05-09 10:54 PM18-05-09 10:54 PM
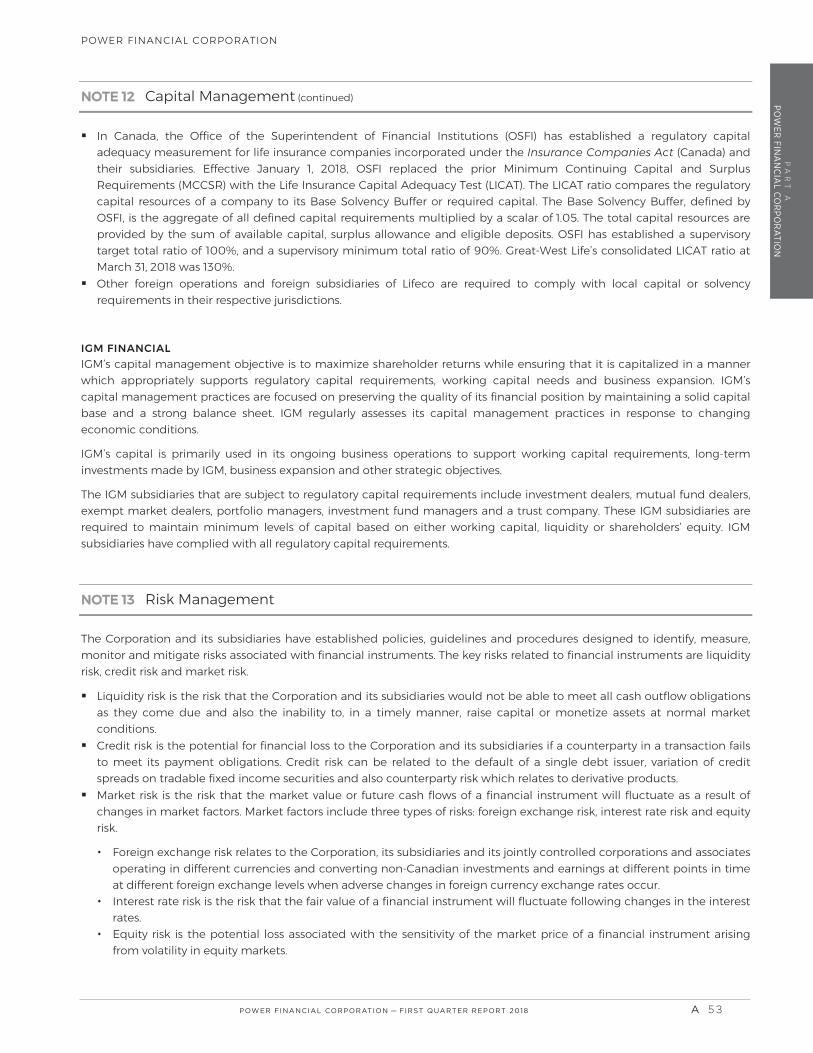
PA
RT
AP
OW
ER FIN
AN
CIA
L CO
RP
OR
ATIO
NPOWER FINANCIAL CORPORATION
NOTE 12 Capital Management (continued)
In Canada, the Office of the Superintendent of Financial Institutions (OSFI) has established a regulatory capital adequacy measurement for life insurance companies incorporated under the Insurance Companies Act (Canada) and their subsidiaries. Effective January 1, 2018, OSFI replaced the prior Minimum Continuing Capital and Surplus Requirements (MCCSR) with the Life Insurance Capital Adequacy Test (LICAT). The LICAT ratio compares the regulatory capital resources of a company to its Base Solvency Buffer or required capital. The Base Solvency Buffer, defined by OSFI, is the aggregate of all defined capital requirements multiplied by a scalar of 1.05. The total capital resources are provided by the sum of available capital, surplus allowance and eligible deposits. OSFI has established a supervisory target total ratio of 100%, and a supervisory minimum total ratio of 90%. Great-West Life’s consolidated LICAT ratio at March 31, 2018 was 130%.
Other foreign operations and foreign subsidiaries of Lifeco are required to comply with local capital or solvency requirements in their respective jurisdictions.
IGM FINANCIAL IGM’s capital management objective is to maximize shareholder returns while ensuring that it is capitalized in a manner which appropriately supports regulatory capital requirements, working capital needs and business expansion. IGM’s capital management practices are focused on preserving the quality of its financial position by maintaining a solid capital base and a strong balance sheet. IGM regularly assesses its capital management practices in response to changing economic conditions.
IGM’s capital is primarily used in its ongoing business operations to support working capital requirements, long-term investments made by IGM, business expansion and other strategic objectives.
The IGM subsidiaries that are subject to regulatory capital requirements include investment dealers, mutual fund dealers, exempt market dealers, portfolio managers, investment fund managers and a trust company. These IGM subsidiaries are required to maintain minimum levels of capital based on either working capital, liquidity or shareholders’ equity. IGM subsidiaries have complied with all regulatory capital requirements.
NOTE 13 Risk Management
The Corporation and its subsidiaries have established policies, guidelines and procedures designed to identify, measure, monitor and mitigate risks associated with financial instruments. The key risks related to financial instruments are liquidity risk, credit risk and market risk.
Liquidity risk is the risk that the Corporation and its subsidiaries would not be able to meet all cash outflow obligations as they come due and also the inability to, in a timely manner, raise capital or monetize assets at normal market conditions.
Credit risk is the potential for financial loss to the Corporation and its subsidiaries if a counterparty in a transaction fails to meet its payment obligations. Credit risk can be related to the default of a single debt issuer, variation of credit spreads on tradable fixed income securities and also counterparty risk which relates to derivative products.
Market risk is the risk that the market value or future cash flows of a financial instrument will fluctuate as a result of changes in market factors. Market factors include three types of risks: foreign exchange risk, interest rate risk and equity risk.
Foreign exchange risk relates to the Corporation, its subsidiaries and its jointly controlled corporations and associates operating in different currencies and converting non-Canadian investments and earnings at different points in time at different foreign exchange levels when adverse changes in foreign currency exchange rates occur.
Interest rate risk is the risk that the fair value of a financial instrument will fluctuate following changes in the interest rates.
Equity risk is the potential loss associated with the sensitivity of the market price of a financial instrument arising from volatility in equity markets.
POWER FINANCIAL CORPORATION�— �FIRST QUARTER REPORT 2018 A 53
PFC_QUAT1_Eng01_PFC_2018-05-09_v1.indd B53PFC_QUAT1_Eng01_PFC_2018-05-09_v1.indd B53 18-05-09 10:54 PM18-05-09 10:54 PM

PA
RT
AP
OW
ER F
INA
NC
IAL
CO
RP
OR
ATI
ON
POWER FINANCIAL CORPORATION
NOTE 13 Risk Management (continued)
This note to the financial statements includes estimates of sensitivities and risk exposure measures for certain risks, such as the sensitivity due to specific changes in interest rate levels projected and market prices as at the valuation date. Actual results can differ significantly from these estimates for a variety of reasons, including:
assessment of the circumstances that led to the scenario may lead to changes in (re)investment approaches and interest rate scenarios considered;
changes in actuarial, investment return and future investment activity assumptions; actual experience differing from the assumptions; changes in business mix, effective tax rates and other market factors; interactions among these factors and assumptions when more than one changes; and the general limitations of internal models.
For these reasons, the sensitivities should only be viewed as directional estimates of the underlying sensitivities for the respective factors based on the assumptions outlined above. Given the nature of these calculations, the Corporation cannot provide assurance that the actual impact on net earnings will be as indicated.
POWER FINANCIAL Liquidity risk, credit risk and market risk of Power Financial are discussed in the first section of this note. In subsequent sections, risks related to Lifeco and IGM are discussed.
Liquidity risk Power Financial is a holding company. As such, corporate cash flows are principally made up of dividends received from its subsidiaries and a jointly controlled corporation, and income from investments, less operating expenses, financing charges, income taxes and payment of dividends to its common and preferred shareholders. The ability of Lifeco, IGM and Parjointco, which are also holding companies, to meet their obligations and pay dividends is dependent upon receipt of dividends from their own subsidiaries.
The Corporation regularly reviews its liquidity requirements and seeks to maintain a sufficient level of liquidity to meet its operating expenses, financing charges and payment of preferred share dividends for a reasonable period of time, as defined in its policies. The ability of Power Financial to arrange additional financing in the future will depend in part upon prevailing market conditions as well as the business performance of Power Financial and its subsidiaries.
Power Financial’s management of liquidity risk has not changed materially since December 31, 2017.
Credit risk Fixed income securities and derivatives are subject to credit risk. The Corporation mitigates credit risk on its fixed income securities by adhering to an investment policy that establishes guidelines which provide exposure limits by defining admissible securities, minimum rating and concentration limits.
Fixed income securities, which are included in investments and in cash and cash equivalents, consist primarily of bonds, bankers’ acceptances and highly liquid temporary deposits with Canadian chartered banks and banks in jurisdictions where Power Financial operates as well as bonds and short-term securities of, or guaranteed by, the Canadian or U.S. governments. The Corporation regularly reviews the credit ratings of its counterparties. The maximum exposure to credit risk on these financial instruments is their carrying value.
Derivatives can be also used mainly to mitigate foreign exchange exposures. The Corporation regularly reviews the credit ratings of derivative financial instrument counterparties. Derivative contracts are over-the-counter with counterparties that are highly rated financial institutions.
Power Financial’s exposure to and management of credit risk related to cash and cash equivalents, fixed income securities and derivatives have not changed materially since December 31, 2017.
A 54 POWER FINANCIAL CORPORATION�— �FIRST QUARTER REPORT 2018
PFC_QUAT1_Eng01_PFC_2018-05-09_v1.indd B54PFC_QUAT1_Eng01_PFC_2018-05-09_v1.indd B54 18-05-09 10:54 PM18-05-09 10:54 PM

PA
RT
AP
OW
ER FIN
AN
CIA
L CO
RP
OR
ATIO
NPOWER FINANCIAL CORPORATION
NOTE 13 Risk Management (continued)
Market risk Power Financial’s financial instruments are comprised of cash and cash equivalents, fixed income securities, derivatives and debentures.
a) Foreign exchange risk In its ongoing operations, Power Financial may hold cash balances denominated in foreign currencies and thus be exposed to fluctuations in exchange rates. In order to protect against such fluctuations, Power Financial may from time to time enter into currency-hedging transactions with highly rated financial institutions. As at March 31, 2018, approximately 3% of Power Financial’s cash and cash equivalents and fixed income securities were denominated in U.S. dollars.
Power Financial is exposed through Parjointco to foreign exchange risk as a result of Parjointco’s investment in Pargesa, a company whose functional currency is the Swiss franc. Pargesa itself is exposed to foreign exchange risk through its subsidiary whose functional currency is the euro. Foreign currency translation gains and losses from Pargesa are recorded in other comprehensive income.
b) Interest rate risk Power Financial’s financial instruments do not have significant exposure to interest rate risk.
c) Equity risk Power Financial’s financial instruments do not have significant exposure to equity risk.
Pargesa indirectly holds substantial investments classified as available for sale; unrealized gains and losses on these investments are recorded in other comprehensive income until realized. These investments are reviewed periodically to determine whether there is objective evidence of an impairment in value.
LIFECO The risk committee of the board of directors of Lifeco is responsible for the oversight of Lifeco’s key risks. Lifeco has established policies and procedures designed to identify, measure and report all material risks. Lifeco’s approach to risk management has not changed significantly since December 31, 2017. A summary of the risks is presented below. For a more detailed discussion of Lifeco’s risk governance structure and risk management approach, refer to the Risk Management note in the Corporation’s December 31, 2017 financial statements.
Liquidity risk Lifeco has the following policies and procedures in place to manage liquidity risk:
Lifeco closely manages operating liquidity through cash flow matching of assets and liabilities and forecasting earned and required yields, to ensure consistency between policyholder requirements and the yield of assets.
Management of Lifeco closely monitors the solvency and capital positions of its principal subsidiaries opposite liquidity requirements at the holding company. Additional liquidity is available through established lines of credit or via capital market transactions. Lifeco maintains committed lines of credit with Canadian chartered banks.
Credit risk Concentrations of credit risk arise from exposures to a single debtor, a group of related debtors or groups of debtors that have similar credit risk characteristics in that they operate in the same geographic region or in similar industries. No significant changes have occurred from the year ended December 31, 2017.
POWER FINANCIAL CORPORATION�— �FIRST QUARTER REPORT 2018 A 55
PFC_QUAT1_Eng01_PFC_2018-05-09_v1.indd B55PFC_QUAT1_Eng01_PFC_2018-05-09_v1.indd B55 18-05-09 10:54 PM18-05-09 10:54 PM
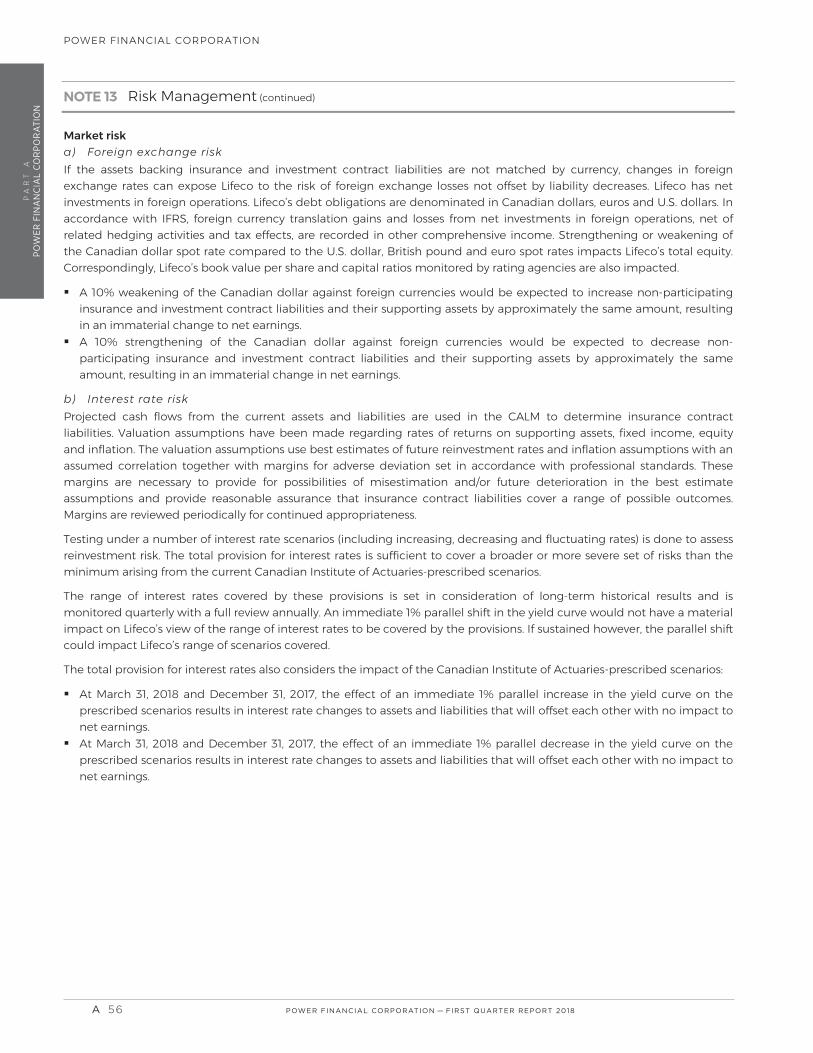
PA
RT
AP
OW
ER F
INA
NC
IAL
CO
RP
OR
ATI
ON
POWER FINANCIAL CORPORATION
NOTE 13 Risk Management (continued)
Market risk a) Foreign exchange risk If the assets backing insurance and investment contract liabilities are not matched by currency, changes in foreign exchange rates can expose Lifeco to the risk of foreign exchange losses not offset by liability decreases. Lifeco has net investments in foreign operations. Lifeco’s debt obligations are denominated in Canadian dollars, euros and U.S. dollars. In accordance with IFRS, foreign currency translation gains and losses from net investments in foreign operations, net of related hedging activities and tax effects, are recorded in other comprehensive income. Strengthening or weakening of the Canadian dollar spot rate compared to the U.S. dollar, British pound and euro spot rates impacts Lifeco’s total equity. Correspondingly, Lifeco’s book value per share and capital ratios monitored by rating agencies are also impacted.
A 10% weakening of the Canadian dollar against foreign currencies would be expected to increase non-participating insurance and investment contract liabilities and their supporting assets by approximately the same amount, resulting in an immaterial change to net earnings.
A 10% strengthening of the Canadian dollar against foreign currencies would be expected to decrease non-participating insurance and investment contract liabilities and their supporting assets by approximately the same amount, resulting in an immaterial change in net earnings.
b) Interest rate risk Projected cash flows from the current assets and liabilities are used in the CALM to determine insurance contract liabilities. Valuation assumptions have been made regarding rates of returns on supporting assets, fixed income, equity and inflation. The valuation assumptions use best estimates of future reinvestment rates and inflation assumptions with an assumed correlation together with margins for adverse deviation set in accordance with professional standards. These margins are necessary to provide for possibilities of misestimation and/or future deterioration in the best estimate assumptions and provide reasonable assurance that insurance contract liabilities cover a range of possible outcomes. Margins are reviewed periodically for continued appropriateness.
Testing under a number of interest rate scenarios (including increasing, decreasing and fluctuating rates) is done to assess reinvestment risk. The total provision for interest rates is sufficient to cover a broader or more severe set of risks than the minimum arising from the current Canadian Institute of Actuaries-prescribed scenarios.
The range of interest rates covered by these provisions is set in consideration of long-term historical results and is monitored quarterly with a full review annually. An immediate 1% parallel shift in the yield curve would not have a material impact on Lifeco’s view of the range of interest rates to be covered by the provisions. If sustained however, the parallel shift could impact Lifeco’s range of scenarios covered.
The total provision for interest rates also considers the impact of the Canadian Institute of Actuaries-prescribed scenarios:
At March 31, 2018 and December 31, 2017, the effect of an immediate 1% parallel increase in the yield curve on the prescribed scenarios results in interest rate changes to assets and liabilities that will offset each other with no impact to net earnings.
At March 31, 2018 and December 31, 2017, the effect of an immediate 1% parallel decrease in the yield curve on the prescribed scenarios results in interest rate changes to assets and liabilities that will offset each other with no impact to net earnings.
A 56 POWER FINANCIAL CORPORATION�— �FIRST QUARTER REPORT 2018
PFC_QUAT1_Eng01_PFC_2018-05-09_v1.indd B56PFC_QUAT1_Eng01_PFC_2018-05-09_v1.indd B56 18-05-09 10:54 PM18-05-09 10:54 PM

PA
RT
AP
OW
ER FIN
AN
CIA
L CO
RP
OR
ATIO
NPOWER FINANCIAL CORPORATION
NOTE 13 Risk Management (continued)
Another way of measuring the interest rate risk associated with this assumption is to determine the effect on the insurance and investment contract liabilities impacting the shareholders’ net earnings of a 1% change in Lifeco’s view of the range of interest rates to be covered by these provisions. The following provides information on the effect of an immediate 1% increase or 1% decrease in the interest rates at both the low and high end of the range of interest rates recognized in the provisions:
March , December , % increase % decrease % increase % decrease
Change in interest rates Increase (decrease) in non-participating insurance
and investment contract liabilities ( ) ( )Increase (decrease) in net earnings ( ) ( ) c) Equity risk Lifeco has investment policy guidelines in place that provide for prudent investment in equity markets with clearly defined limits to mitigate price risk.
The risks associated with segregated fund guarantees have been mitigated through a hedging program for lifetime Guaranteed Minimum Withdrawal Benefit guarantees using equity futures, currency forwards, and interest rate derivatives. For policies with segregated fund guarantees, Lifeco generally determines insurance contract liabilities at a conditional tail expectation of 75 (CTE75) level. In other words, Lifeco determines insurance contract liabilities at a level that covers the average loss in the worst 25% part of the loss distribution.
Some insurance and investment contract liabilities are supported by investment properties, common stocks and private equities, for example, segregated fund products and products with long-tail cash flows. Generally these liabilities will fluctuate in line with equity values. However, there may be additional market and liability impacts as a result of changes in the equity values that will cause the liabilities to fluctuate differently than the equity values. The following provides information on the expected impacts of a 10% increase or 10% decrease in equity values:
March , December , % increase % decrease % increase % decrease
Change in equity values Increase (decrease) in non-participating insurance
and investment contract liabilities ( ) ( )Increase (decrease) in net earnings ( ) ( ) The best estimate return assumptions for equities are primarily based on long-term historical averages. Changes in the current market could result in changes to these assumptions and will impact both asset and liability cash flows. The following provides information on the expected impacts of a 1% increase or 1% decrease in the best estimate assumptions:
March , December , % increase % decrease % increase % decrease
Change in best estimate return assumptions for equities Increase (decrease) in non-participating insurance contract liabilities ( ) ( )Increase (decrease) in net earnings ( ) ( )
POWER FINANCIAL CORPORATION�— �FIRST QUARTER REPORT 2018 A 57
PFC_QUAT1_Eng01_PFC_2018-05-09_v1.indd B57PFC_QUAT1_Eng01_PFC_2018-05-09_v1.indd B57 18-05-09 10:54 PM18-05-09 10:54 PM

PA
RT
AP
OW
ER F
INA
NC
IAL
CO
RP
OR
ATI
ON
POWER FINANCIAL CORPORATION
NOTE 13 Risk Management (continued)
IGM FINANCIAL The risk management policies and procedures of IGM are discussed further in the IGM section of the Corporation’s Management’s Discussion and Analysis for the three months ended March 31, 2018, and have not changed significantly since December 31, 2017. A summary of the risks is presented below:
Liquidity risk IGM’s liquidity management practices include:
Maintaining liquid assets and lines of credit to satisfy near-term liquidity needs. Ensuring effective controls over liquidity management processes. Performing regular cash forecasts and stress testing. Regular assessment of capital market conditions and IGM’s ability to access bank and capital market funding. Ongoing efforts to diversify and expand long-term mortgage funding sources. Oversight of liquidity by management and by committees of the board of directors of IGM.
A key liquidity requirement for IGM is the funding of commissions paid on the sale of investment funds. Commissions on the sale of investment funds continue to be paid from operating cash flows.
IGM also maintains sufficient liquidity to fund and temporarily hold mortgages pending sale or securitization to long-term funding sources and to manage any derivative collateral requirements related to the mortgage banking operation. Through its mortgage banking operations, residential mortgages are sold to third parties including certain mutual funds, institutional investors through private placements, Canadian bank-sponsored securitization trusts, and by issuance and sale of National Housing Act Mortgage-Backed Securities (NHA MBS), including sales to Canada Housing Trust under the Canada Mortgage Bond Program (CMB Program). IGM maintains committed capacity within certain Canadian bank-sponsored securitization trusts.
IGM’s liquidity position and its management of liquidity and funding risk have not changed materially since December 31, 2017.
Credit risk IGM’s cash and cash equivalents, securities holdings, mortgage portfolios and derivatives are subject to credit risk. IGM monitors its credit risk management practices on an ongoing basis to evaluate their effectiveness.
IGM manages credit risk related to cash and cash equivalents by adhering to an investment policy that outlines risk parameters and concentration limits. IGM regularly reviews the credit ratings of its counterparties. The maximum exposure to credit risk on these financial instruments is their carrying value.
IGM manages credit risk related to residential mortgages through:
adhering to its lending policy and underwriting standards; its loan servicing capabilities; use of client-insured mortgage default insurance and mortgage portfolio default insurance held by IGM; and its practice of originating its mortgages exclusively through its own network of Mortgage Planning Specialists and
Investors Group Consultants as part of a client’s comprehensive financial plan.
IGM’s exposure to and management of credit risk related to cash and cash equivalents, fixed income securities, mortgage portfolios and derivatives have not changed materially since December 31, 2017.
Market risk a) Foreign exchange risk IGM is exposed to foreign exchange risk on its investments in Personal Capital Corporation and China AMC.
A 58 POWER FINANCIAL CORPORATION�— �FIRST QUARTER REPORT 2018
PFC_QUAT1_Eng01_PFC_2018-05-09_v1.indd B58PFC_QUAT1_Eng01_PFC_2018-05-09_v1.indd B58 18-05-09 10:54 PM18-05-09 10:54 PM

PA
RT
AP
OW
ER FIN
AN
CIA
L CO
RP
OR
ATIO
NPOWER FINANCIAL CORPORATION
NOTE 13 Risk Management (continued)
b) Interest rate risk IGM is exposed to interest rate risk on its loan portfolio and on certain of the derivative financial instruments used in IGM’s mortgage banking operations.
IGM’s exposure to and management of interest rate risk have not changed materially since December 31, 2017.
c) Equity risk IGM is exposed to equity risk on its equity securities which are classified as either available for sale or fair value through profit or loss.
IGM sponsors a number of deferred compensation arrangements for employees where payments to participants are deferred and linked to the performance of the common shares of IGM Financial Inc. IGM hedges its exposure to this risk through the use of forward agreements and total return swaps.
Risks related to assets under management Risks related to the performance of the equity markets, changes in interest rates and changes in foreign currencies relative to the Canadian dollar can have a significant impact on the level and mix of assets under management. These changes in assets under management directly impact earnings of IGM.
NOTE 14 Pension Plans and Other Post-Employment Benefits
The pension plan and other post-employment benefits expense included in net earnings and other comprehensive income are as follows:
Three months ended March ,
Pension plans Service costs Net interest cost
Post-employment benefits
Service costs Net interest cost
Expense recognized in net earnings Remeasurements
Pension plans Actuarial (gains) losses [1] ( ) Return on assets less (greater) than discount rate ( )Change in the asset ceiling – ( )
Post-employment benefits Actuarial (gains) losses [1] ( )
Expense (recovery) recognized in other comprehensive income ( ) Total expense
[ ] Actuarial gains related to the pension plans and other post-employment benefits for the three months ended March , are due to an increase in discount rates since December , .
POWER FINANCIAL CORPORATION�— �FIRST QUARTER REPORT 2018 A 59
PFC_QUAT1_Eng01_PFC_2018-05-09_v1.indd B59PFC_QUAT1_Eng01_PFC_2018-05-09_v1.indd B59 18-05-09 10:54 PM18-05-09 10:54 PM
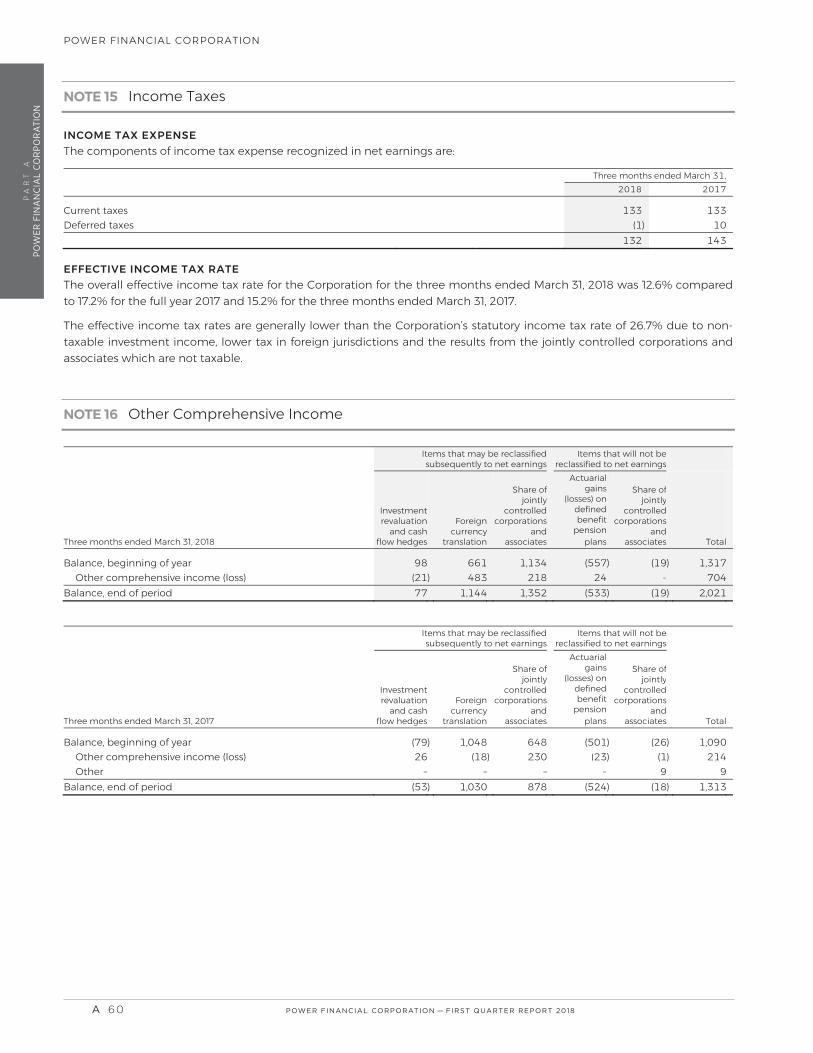
PA
RT
AP
OW
ER F
INA
NC
IAL
CO
RP
OR
ATI
ON
POWER FINANCIAL CORPORATION
NOTE 15 Income Taxes
INCOME TAX EXPENSE The components of income tax expense recognized in net earnings are:
Three months ended March ,
Current taxes Deferred taxes ( ) EFFECTIVE INCOME TAX RATE The overall effective income tax rate for the Corporation for the three months ended March 31, 2018 was 12.6% compared to 17.2% for the full year 2017 and 15.2% for the three months ended March 31, 2017.
The effective income tax rates are generally lower than the Corporation’s statutory income tax rate of 26.7% due to non-taxable investment income, lower tax in foreign jurisdictions and the results from the jointly controlled corporations and associates which are not taxable.
NOTE 16 Other Comprehensive Income
Items that may be reclassified subsequently to net earnings
Items that will not be reclassified to net earnings
Three months ended March 31, 2018
Investment revaluation
and cash flow hedges
Foreigncurrency
translation
Share ofjointly
controlledcorporations
andassociates
Actuarial gains
(losses) on defined benefit
pensionplans
Share ofjointly
controlledcorporations
andassociates Total
Balance, beginning of year , ( ) ( ) ,Other comprehensive income (loss) ( ) –
Balance, end of period , , ( ) ( ) ,
Items that may be reclassifiedsubsequently to net earnings
Items that will not be reclassified to net earnings
Three months ended March 31, 2017
Investment revaluation
and cash flow hedges
Foreigncurrency
translation
Share ofjointly
controlledcorporations
andassociates
Actuarial gains
(losses) on defined benefit
pensionplans
Share ofjointly
controlledcorporations
andassociates Total
Balance, beginning of year ( ) , ( ) ( ) ,Other comprehensive income (loss) ( ) ( ) ( )Other – – – –
Balance, end of period ( ) , ( ) ( ) ,
A 60 POWER FINANCIAL CORPORATION�— �FIRST QUARTER REPORT 2018
PFC_QUAT1_Eng01_PFC_2018-05-09_v1.indd B60PFC_QUAT1_Eng01_PFC_2018-05-09_v1.indd B60 18-05-09 10:54 PM18-05-09 10:54 PM

PA
RT
AP
OW
ER FIN
AN
CIA
L CO
RP
OR
ATIO
NPOWER FINANCIAL CORPORATION
NOTE 17 Earnings per Share
The following is a reconciliation of the numerators and the denominators used in the computations of earnings per share:
Three months ended March ,
Earnings Net earnings attributable to shareholders Dividends on perpetual preferred shares ( ) ( )Net earnings attributable to common shareholders Dilutive effect of subsidiaries’ outstanding stock options ( ) ( )Net earnings adjusted for dilutive effect
Number of common shares [millions] Weighted average number of common shares outstanding – Basic . .
Potential exercise of outstanding stock options . .Weighted average number of common shares outstanding – Diluted . . Net earnings per common share Basic . .Diluted . . For the three months ended March 31, 2018, 7.4 million stock options (3.4 million in 2017) have been excluded from the computation of diluted earnings per share as they were anti-dilutive.
NOTE 18 Fair Value Measurement
The Corporation’s assets and liabilities recorded at fair value have been categorized based upon the following fair value hierarchy:
Level 1 inputs utilize observable, unadjusted quoted prices in active markets for identical assets or liabilities that the Corporation has the ability to access. Assets and liabilities utilizing Level 1 inputs include actively exchange-traded equity securities, exchange-traded futures, and mutual and segregated funds which have available prices in an active market with no redemption restrictions. Level 1 assets also include open-end investment fund units and other liabilities in instances where there are quoted prices available from active markets.
Level 2 inputs utilize other-than-quoted prices included in Level 1 that are observable for the asset or liability, either directly or indirectly. Level 2 inputs include quoted prices for similar assets and liabilities in active markets, and inputs other-than-quoted prices that are observable for the asset or liability, such as interest rates and yield curves that are observable at commonly quoted intervals. The fair values for some Level 2 securities were obtained from a pricing service. The pricing service inputs include, but are not limited to, benchmark yields, reported trades, broker/dealer quotes, issuer spreads, two-sided markets, benchmark securities, offers and reference data. Level 2 assets and liabilities include those priced using a matrix which is based on credit quality and average life, government and agency securities, restricted stock, some private bonds and equities, most investment-grade and high-yield corporate bonds, most asset-backed securities, most over-the-counter derivatives and mortgage loans. Investment contracts that are measured at fair value through profit or loss are mostly included in the Level 2 category.
Level 3 inputs utilize one or more significant inputs that are not based on observable market inputs and include situations where there is little, if any, market activity for the asset or liability. The values of the majority of Level 3 securities were obtained from single-broker quotes, internal pricing models, external appraisers or by discounting projected cash flows. Assets and liabilities utilizing Level 3 inputs include certain bonds, certain asset-backed securities, some private equities, some mortgage loans, investments in mutual and segregated funds where there are redemption restrictions, certain over-the-counter derivatives, investment properties and equity-release mortgages.
POWER FINANCIAL CORPORATION�— �FIRST QUARTER REPORT 2018 A 61
PFC_QUAT1_Eng01_PFC_2018-05-09_v1.indd B61PFC_QUAT1_Eng01_PFC_2018-05-09_v1.indd B61 18-05-09 10:54 PM18-05-09 10:54 PM

PA
RT
AP
OW
ER F
INA
NC
IAL
CO
RP
OR
ATI
ON
POWER FINANCIAL CORPORATION
NOTE 18 Fair Value Measurement (continued)
The following table presents the Corporation’s assets and liabilities recorded at fair value, including their levels in the fair value hierarchy using the valuation methods and assumptions described in the summary of significant accounting policies of the Corporation’s December 31, 2017 financial statements and above. Fair values are management’s estimates and are generally calculated using market information at a specific point in time and may not reflect future fair values. The calculations are subjective in nature, and involve uncertainties and matters of significant judgment.
March 31, 2018 Level Level Level Total
fair value
Assets recorded at fair value Bonds
Fair value through profit or loss – , ,Available for sale – , – ,
Mortgage loans Fair value through profit or loss –
Shares Fair value through profit or loss , – ,Available for sale
Investment properties – – , ,Funds held by ceding insurers , – ,Derivative instruments Other assets – , , , ,
Liabilities recorded at fair value Investment contract liabilities – , ,Derivative instruments , ,Other liabilities , ,
December 31, 2017 Level Level Level Total
fair value
Assets recorded at fair value Bonds
Fair value through profit or loss – , ,Available for sale – , – ,
Mortgage loans Fair value through profit or loss – –
Shares Fair value through profit or loss , ,Available for sale
Investment properties – – , ,Funds held by ceding insurers , – ,Derivative instruments Other assets – , , , ,
Liabilities recorded at fair value Investment contract liabilities – , ,Derivative instruments , ,Other liabilities – , , There were no significant transfers between Level 1 and Level 2 in these periods.
A 62 POWER FINANCIAL CORPORATION�— �FIRST QUARTER REPORT 2018
PFC_QUAT1_Eng01_PFC_2018-05-09_v1.indd B62PFC_QUAT1_Eng01_PFC_2018-05-09_v1.indd B62 18-05-09 10:54 PM18-05-09 10:54 PM

PA
RT
AP
OW
ER FIN
AN
CIA
L CO
RP
OR
ATIO
NPOWER FINANCIAL CORPORATION
NOTE 18 Fair Value Measurement (continued)
The following table presents additional information about assets and liabilities measured at fair value on a recurring basis for which the Corporation and its subsidiaries have utilized Level 3 inputs to determine fair value for the three months ended March 31, 2018 and 2017.
Bonds Mortgages Shares
Three months ended March 31, 2018
Fair value through
profit or loss
Fair value through
profit or loss
Fair value through
profit or lossAvailable
for saleInvestment
properties Derivatives,
net
Otherassets
(liabilities)
Investmentcontractliabilities Total
Balance, beginning of year – , ( ) ( ) ,Total gains (losses)
In net earnings ( ) ( ) – ( ) – –In other comprehensive
income [1] – – –Business acquisition
[Note 4] – – – – – – –Purchases – – – –Sales – ( ) – ( ) ( ) – – – ( )Settlements – – – – – – –Other – – – – – – ( ) ( ) ( )
Balance, end of period , ( ) ( ) ,
Bonds Mortgages Shares
Three months ended March 31, 2017
Fair value through
profit or loss
Fair value through
profit or loss
Fair value through
profit or lossAvailable
for saleInvestment
properties Derivatives,
net
Other assets
(liabilities )
Investment contract liabilities Total
Balance, beginning of year – , ( ) ( ) ,Total gains (losses)
In net earnings – – – ( ) – –In other comprehensive
income [1] – – – ( ) – – –Purchases – – – – –Sales – – ( ) – – – – – ( )Other – – – – – – – ( ) ( )Transfers into Level 3 [2] – – – – – –Transfers out of Level 3 [3] ( ) – – – – – –
Balance, end of period – , ( ) ( ) ,
[ ] Amount of other comprehensive income includes unrealized gains (losses) on foreign exchange.
[ ] Transfers into Level are due primarily to decreased observability of inputs in valuation methodologies.
[ ] Transfers out of Level are due primarily to increased observability of inputs in valuation methodologies as evidenced by corroboration of market prices with multiple pricing vendors or the lifting of redemption restrictions on investments in mutual funds and segregated funds.
POWER FINANCIAL CORPORATION�— �FIRST QUARTER REPORT 2018 A 63
PFC_QUAT1_Eng01_PFC_2018-05-09_v1.indd B63PFC_QUAT1_Eng01_PFC_2018-05-09_v1.indd B63 18-05-09 10:54 PM18-05-09 10:54 PM

PA
RT
AP
OW
ER F
INA
NC
IAL
CO
RP
OR
ATI
ON
POWER FINANCIAL CORPORATION
NOTE 18 Fair Value Measurement (continued)
The following table sets out information about significant unobservable inputs used at period-end in measuring assets and liabilities categorized as Level 3 in the fair value hierarchy.
Type of asset Valuation approach Significant unobservable input Input value
Inter-relationship between key unobservable inputs and fair value measurement
Investment properties
Investment property valuations are generally determined using property valuation models based on expected capitalization rates and models that discount expected future net cash flows. The determination of the fair value of investment property requires the use of estimates such as future cash flows (such as future leasing assumptions, rental rates, capital and operating expenditures) and discount, reversionary and overall capitalization rates applicable to the asset based on current market rates.
Discount rate Range of 2.5% – 10.3% A decrease in the discount rate would result in an increase in fair value.
An increase in the discount rate would result in a decrease in fair value.
Reversionary rate Range of 4.0% – 7.5% A decrease in the reversionary rate would result in an increase in fair value.
An increase in the reversionary rate would result in a decrease in fair value.
Vacancy rate Weighted average of 2.1% A decrease in the expected vacancy rate would generally result in an increase in fair value.
An increase in the expected vacancy rate would generally result in a decrease in fair value.
Mortgage loans (fair value through profit or loss)
The valuation approach for equity-release mortgages is to use an internal valuation model to determine the projected asset cash flows, including the stochastically calculated cost of the no-negative-equity guarantee for each individual loan, to aggregate these across all loans and to discount those cash flows back to the valuation date. The projection is done monthly until expected redemption of the loan either voluntarily or on the death/entering into long-term care of the loanholders.
Discount rate
4.25%
A decrease in the discount rate would result in an increase in fair value.
An increase in the discount rate would result in a decrease in fair value.
A 64 POWER FINANCIAL CORPORATION�— �FIRST QUARTER REPORT 2018
PFC_QUAT1_Eng01_PFC_2018-05-09_v1.indd B64PFC_QUAT1_Eng01_PFC_2018-05-09_v1.indd B64 18-05-09 10:54 PM18-05-09 10:54 PM

PA
RT
AP
OW
ER FIN
AN
CIA
L CO
RP
OR
ATIO
NPOWER FINANCIAL CORPORATION
NOTE 19 Segmented Information
The Corporation’s reportable operating segments are Lifeco, IGM Financial and Pargesa. These reportable segments reflect Power Financial’s management structure and internal financial reporting. The Corporation evaluates the performance based on the operating segment’s contribution to earnings. The following provides a brief description of the three reportable operating segments:
Lifeco is a financial services holding company with interests in life insurance, health insurance, retirement and investment management services, asset management and reinsurance businesses primarily in Canada, the United States and Europe.
IGM Financial is a financial services company operating in Canada primarily within the advice segment of the financial services market. IGM earns revenues from a range of sources, but primarily from management fees, which are charged to its mutual funds for investment advisory and management services. IGM also earns revenues from fees charged to its mutual funds for administrative services.
Pargesa is held through Parjointco. Pargesa is a holding company with diversified interests in Europe-based companies active in various sectors: minerals-based specialty solutions for industry; testing, inspection and certification; cement, aggregates and concrete; wines and spirits; design and distribution of sportswear; materials technology and recycling of precious metals; oil, gas and chemical industries; a global luxury brand; disposable hygiene products; supplier of equipment and project management for a wide range of processing industries primarily in the food and beverage sectors; and operation of regional leisure parks.
The column entitled “Corporate” is comprised of corporate activities of Power Financial and the results of Wealthsimple and Portag3. This column also includes consolidation elimination entries.
The contribution to earnings of each segment includes the share of net earnings resulting from the investments that Lifeco and IGM have in each other as well as certain consolidation adjustments.
POWER FINANCIAL CORPORATION�— �FIRST QUARTER REPORT 2018 A 65
PFC_QUAT1_Eng01_PFC_2018-05-09_v1.indd B65PFC_QUAT1_Eng01_PFC_2018-05-09_v1.indd B65 18-05-09 10:54 PM18-05-09 10:54 PM

PA
RT
AP
OW
ER F
INA
NC
IAL
CO
RP
OR
ATI
ON
POWER FINANCIAL CORPORATION
NOTE 19 Segmented Information (continued)
CONSOLIDATED NET EARNINGS
Three months ended March 31, 2018 Lifeco IGM[ ] Pargesa Corporate Total
Revenues Premium income, net , – – ( ) ,Net investment income – ( )Fee income , – ( ) ,Total revenues , – ( ) ,
Expenses Total paid or credited to policyholders , – – – ,Commissions – ( )Operating and administrative expenses , – ,Financing charges – Total expenses , – ,Earnings before investments in jointly controlled
corporations and associates, and income taxes – ( )
Share of earnings (losses) of investments in jointly controlled corporations and associates – –
Earnings before income taxes ( ) ,Income taxes – Net earnings ( )
Attributable to Non-controlling interests – ( )Perpetual preferred shareholders – – – Common shareholders ( )
( )
[ ] Results reported by IGM include an adjustment for the adoption of IFRS related to the classification of mortgage loans. As the Corporation has not yet adopted IFRS , this impact has been adjusted by the Corporation on consolidation and included in “Corporate”.
Three months ended March 31, 2017 [Note 3] Lifeco IGM Pargesa Corporate Total
Revenues Premium income, net , – – – ,Net investment income , – ( ) ,Fee income , – ( ) ,Total revenues , – ( ) ,
Expenses Total paid or credited to policyholders , – – – ,Commissions – ( ) ,Operating and administrative expenses , – ,Financing charges – Total expenses , – ( ) ,Earnings before investments in jointly controlled
corporations and associates, and income taxes – ( )
Share of earnings (losses) of investments in jointly controlled corporations and associates – ( )
Earnings before income taxes ( )Income taxes – – Net earnings ( )
Attributable to Non-controlling interests – ( )Perpetual preferred shareholders – – – Common shareholders ( )
( )
A 66 POWER FINANCIAL CORPORATION�— �FIRST QUARTER REPORT 2018
PFC_QUAT1_Eng01_PFC_2018-05-09_v1.indd B66PFC_QUAT1_Eng01_PFC_2018-05-09_v1.indd B66 18-05-09 10:54 PM18-05-09 10:54 PM

PA
RT
AP
OW
ER FIN
AN
CIA
L CO
RP
OR
ATIO
NPOWER FINANCIAL CORPORATION
NOTE 19 Segmented Information (continued)
TOTAL ASSETS
March 31, 2018 Lifeco IGM[ ] Pargesa Corporate Total
Invested assets (including cash and cash equivalents) , , – , ,
Investments in jointly controlled corporations and associates , ,
Other assets , , – ,Goodwill and intangible assets , , – ,Investments on account of segregated fund
policyholders , – – – ,Total assets [1] , , , , ,
December 31, 2017 Lifeco IGM Pargesa Corporate Total
Invested assets (including cash and cash equivalents) , , – , ,
Investments in jointly controlled corporations and associates , ,
Other assets , , – ,Goodwill and intangible assets , , – ,Investments on account of segregated fund
policyholders , – – – ,Total assets [1] , , , , ,
[ ] Total assets of Lifeco and IGM operating segments include the allocation of goodwill and certain consolidation adjustments.
[ ] Assets reported by IGM include an adjustment for the adoption of IFRS related to the classification of mortgage loans. As the Corporation has not yet adopted IFRS , this impact has been adjusted by the Corporation on consolidation and included in “Corporate”.
POWER FINANCIAL CORPORATION�— �FIRST QUARTER REPORT 2018 A 67
PFC_QUAT1_Eng01_PFC_2018-05-09_v1.indd B67PFC_QUAT1_Eng01_PFC_2018-05-09_v1.indd B67 18-05-09 10:54 PM18-05-09 10:54 PM

Page intentionally left blank.
A 68 POWER FINANCIAL CORPORATION�— �FIRST QUARTER REPORT 2018
PFC_QUAT1_Eng01_PFC_2018-05-09_v1.indd B68PFC_QUAT1_Eng01_PFC_2018-05-09_v1.indd B68 18-05-09 10:54 PM18-05-09 10:54 PM

MANAGEMENT’S DISCUSSION AND ANALYSIS
PAG E B 2
FINANCIAL STATEMENTS AND NOTES
PAG E B 3 8
GREAT-WEST LIFECO INC.PART B
Please note that the bottom of each page in Part B contains two diff erent page numbers. A page number with the prefi x “B” refers to the number of such page in this document and the page number without any prefi x refers to the number of such page in the original document issued by Great-West Lifeco Inc.
The attached documents concerning Great-West Lifeco Inc. are documents prepared and publicly disclosed by such subsidiary. Certain statements in the attached documents, other than statements of historical fact, are forward-looking statements based on certain assumptions and refl ect the current expectations of the subsidiary as set forth therein. Forward-looking statements are provided for the purposes of assisting the reader in understanding the subsidiary’s fi nancial performance, fi nancial position and cash fl ows as at and for the periods ended on certain dates and to present information about the subsidiary’s management’s current expectations and plans relating to the future and the reader is cautioned that such statements may not be appropriate for other purposes.
By its nature, forward-looking information is subject to inherent risks and uncertainties that may be general or specifi c and which give rise to the possibility that expectations, forecasts, predictions, projections or conclusions will not prove to be accurate, that assumptions may not be correct and that objectives, strategic goals and priorities will not be achieved.
For further information provided by the subsidiary as to the material factors that could cause actual results to diff er materially from the content of forward-looking statements, the material factors and assumptions that were applied in making the forward-looking statements, and the subsidiary’s policy for updating the content of forward-looking statements, please see the attached documents, including the section entitled Cautionary Note Regarding Forward-Looking Information. The reader is cautioned to consider these factors and assumptions carefully and not to put undue reliance on forward-looking statements.
POWER FINANCIAL CORPORATION�— �FIRST QUARTER REPORT 2018 B 1
PA
RT
B
GR
EA
T-WE
ST LIFECO
INC
.
PFC_QUAT1_Eng02_GWL_2018-05-05_v1.indd C1PFC_QUAT1_Eng02_GWL_2018-05-05_v1.indd C1 18-05-09 12:43 PM18-05-09 12:43 PM

B 2 POWER FINANCIAL CORPORATION�— �FIRST QUARTER REPORT 2018
PA
RT
B
GR
EA
T-W
EST
LIF
ECO
INC
.
PFC_QUAT1_Eng02_GWL_2018-05-05_v1.indd C2PFC_QUAT1_Eng02_GWL_2018-05-05_v1.indd C2 18-05-09 12:43 PM18-05-09 12:43 PM

POWER FINANCIAL CORPORATION�— �FIRST QUARTER REPORT 2018 B 3
PA
RT
B
GR
EA
T-WE
ST LIFECO
INC
.
PFC_QUAT1_Eng02_GWL_2018-05-05_v1.indd C3PFC_QUAT1_Eng02_GWL_2018-05-05_v1.indd C3 18-05-09 12:43 PM18-05-09 12:43 PM
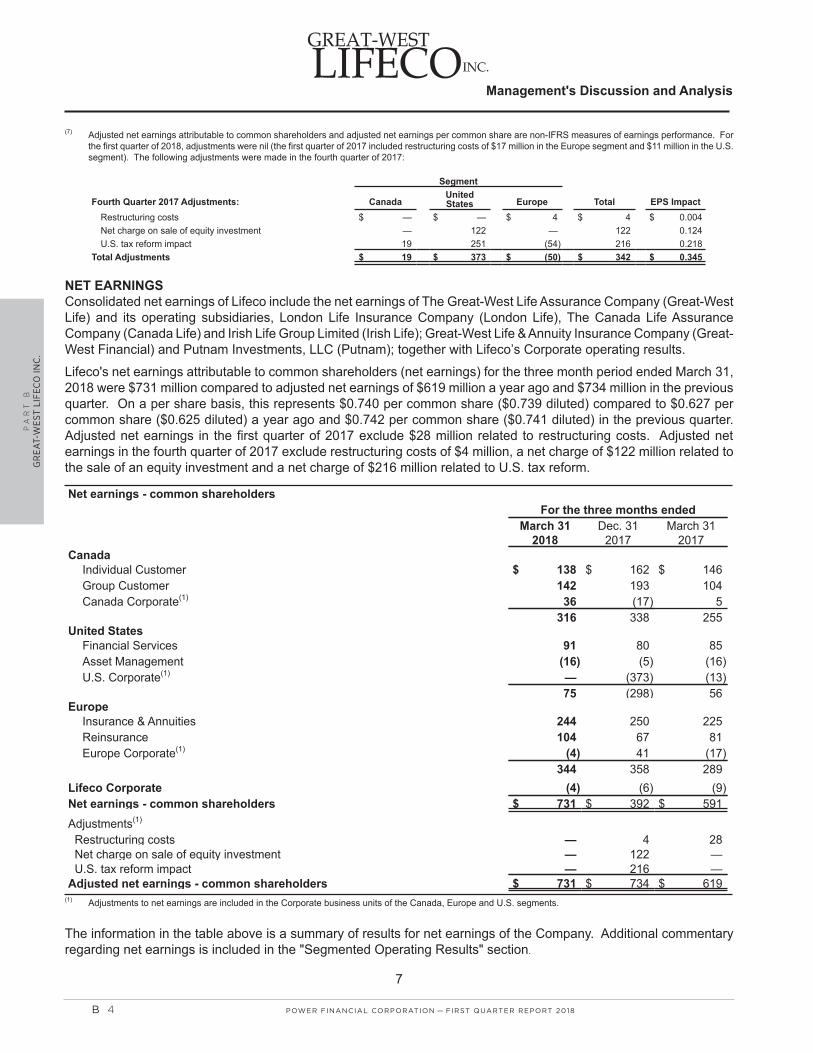
B 4 POWER FINANCIAL CORPORATION�— �FIRST QUARTER REPORT 2018
PA
RT
B
GR
EA
T-W
EST
LIF
ECO
INC
.
PFC_QUAT1_Eng02_GWL_2018-05-05_v1.indd C4PFC_QUAT1_Eng02_GWL_2018-05-05_v1.indd C4 18-05-09 12:43 PM18-05-09 12:43 PM

POWER FINANCIAL CORPORATION�— �FIRST QUARTER REPORT 2018 B 5
PA
RT
B
GR
EA
T-WE
ST LIFECO
INC
.
PFC_QUAT1_Eng02_GWL_2018-05-05_v1.indd C5PFC_QUAT1_Eng02_GWL_2018-05-05_v1.indd C5 18-05-09 12:43 PM18-05-09 12:43 PM

B 6 POWER FINANCIAL CORPORATION�— �FIRST QUARTER REPORT 2018
PA
RT
B
GR
EA
T-W
EST
LIF
ECO
INC
.
PFC_QUAT1_Eng02_GWL_2018-05-05_v1.indd C6PFC_QUAT1_Eng02_GWL_2018-05-05_v1.indd C6 18-05-09 12:43 PM18-05-09 12:43 PM

POWER FINANCIAL CORPORATION�— �FIRST QUARTER REPORT 2018 B 7
PA
RT
B
GR
EA
T-WE
ST LIFECO
INC
.
PFC_QUAT1_Eng02_GWL_2018-05-05_v1.indd C7PFC_QUAT1_Eng02_GWL_2018-05-05_v1.indd C7 18-05-09 12:43 PM18-05-09 12:43 PM
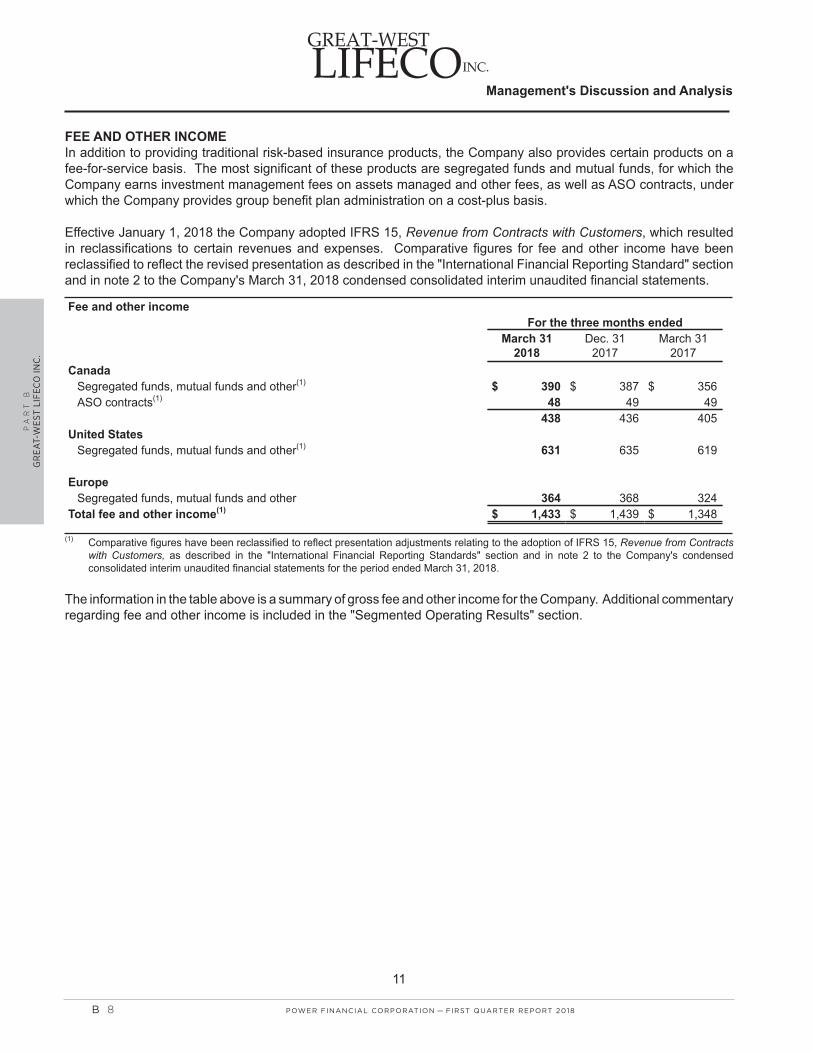
B 8 POWER FINANCIAL CORPORATION�— �FIRST QUARTER REPORT 2018
PA
RT
B
GR
EA
T-W
EST
LIF
ECO
INC
.
PFC_QUAT1_Eng02_GWL_2018-05-05_v1.indd C8PFC_QUAT1_Eng02_GWL_2018-05-05_v1.indd C8 18-05-09 12:43 PM18-05-09 12:43 PM
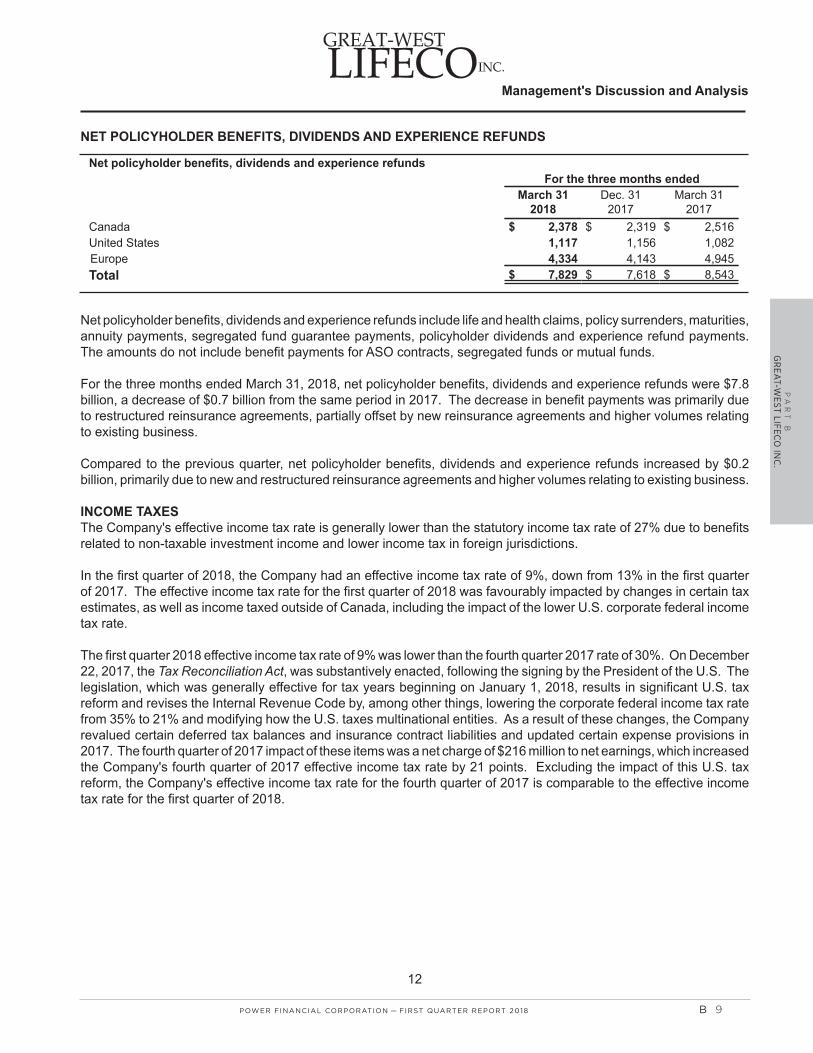
POWER FINANCIAL CORPORATION�— �FIRST QUARTER REPORT 2018 B 9
PA
RT
B
GR
EA
T-WE
ST LIFECO
INC
.
PFC_QUAT1_Eng02_GWL_2018-05-05_v1.indd C9PFC_QUAT1_Eng02_GWL_2018-05-05_v1.indd C9 18-05-09 12:43 PM18-05-09 12:43 PM

B 10 POWER FINANCIAL CORPORATION�— �FIRST QUARTER REPORT 2018
PA
RT
B
GR
EA
T-W
EST
LIF
ECO
INC
.
PFC_QUAT1_Eng02_GWL_2018-05-05_v1.indd C10PFC_QUAT1_Eng02_GWL_2018-05-05_v1.indd C10 18-05-09 12:43 PM18-05-09 12:43 PM

POWER FINANCIAL CORPORATION�— �FIRST QUARTER REPORT 2018 B 1 1
PA
RT
B
GR
EA
T-WE
ST LIFECO
INC
.
PFC_QUAT1_Eng02_GWL_2018-05-05_v1.indd C11PFC_QUAT1_Eng02_GWL_2018-05-05_v1.indd C11 18-05-09 12:43 PM18-05-09 12:43 PM
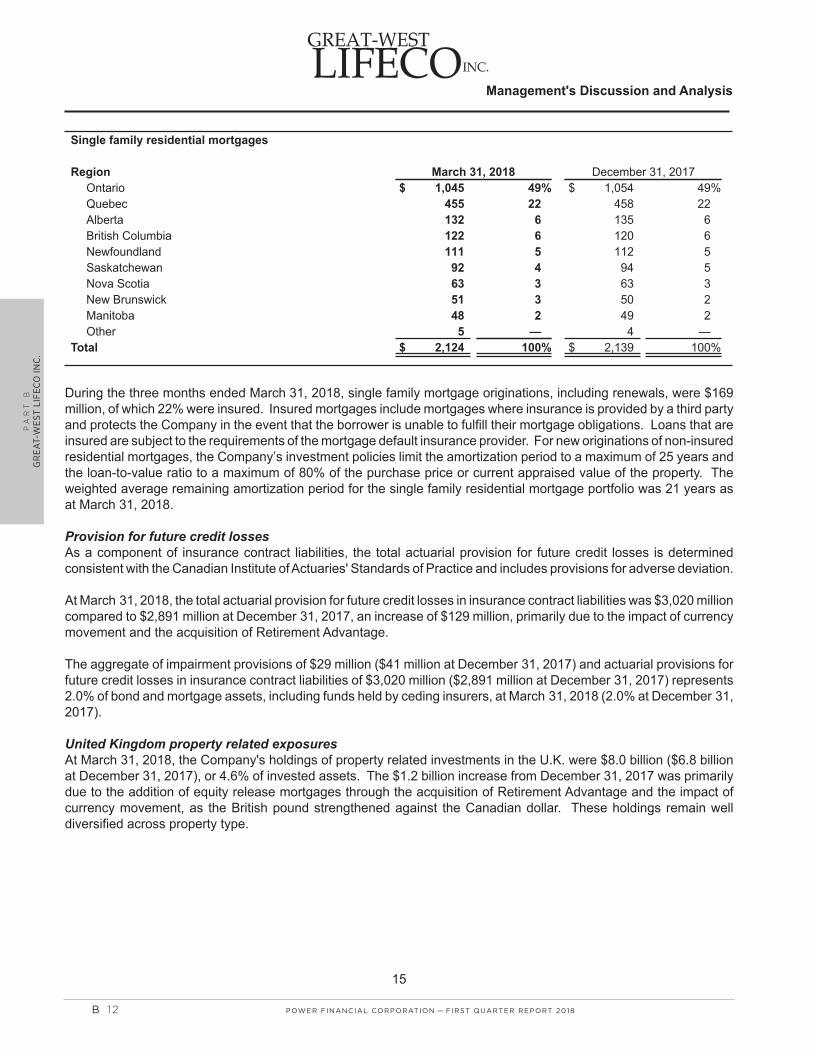
B 12 POWER FINANCIAL CORPORATION�— �FIRST QUARTER REPORT 2018
PA
RT
B
GR
EA
T-W
EST
LIF
ECO
INC
.
PFC_QUAT1_Eng02_GWL_2018-05-05_v1.indd C12PFC_QUAT1_Eng02_GWL_2018-05-05_v1.indd C12 18-05-09 12:43 PM18-05-09 12:43 PM

POWER FINANCIAL CORPORATION�— �FIRST QUARTER REPORT 2018 B 1 3
PA
RT
B
GR
EA
T-WE
ST LIFECO
INC
.
PFC_QUAT1_Eng02_GWL_2018-05-05_v1.indd C13PFC_QUAT1_Eng02_GWL_2018-05-05_v1.indd C13 18-05-09 12:43 PM18-05-09 12:43 PM

B 14 POWER FINANCIAL CORPORATION�— �FIRST QUARTER REPORT 2018
PA
RT
B
GR
EA
T-W
EST
LIF
ECO
INC
.
PFC_QUAT1_Eng02_GWL_2018-05-05_v1.indd C14PFC_QUAT1_Eng02_GWL_2018-05-05_v1.indd C14 18-05-09 12:43 PM18-05-09 12:43 PM

POWER FINANCIAL CORPORATION�— �FIRST QUARTER REPORT 2018 B 1 5
PA
RT
B
GR
EA
T-WE
ST LIFECO
INC
.
PFC_QUAT1_Eng02_GWL_2018-05-05_v1.indd C15PFC_QUAT1_Eng02_GWL_2018-05-05_v1.indd C15 18-05-09 12:43 PM18-05-09 12:43 PM

B 16 POWER FINANCIAL CORPORATION�— �FIRST QUARTER REPORT 2018
PA
RT
B
GR
EA
T-W
EST
LIF
ECO
INC
.
PFC_QUAT1_Eng02_GWL_2018-05-05_v1.indd C16PFC_QUAT1_Eng02_GWL_2018-05-05_v1.indd C16 18-05-09 12:43 PM18-05-09 12:43 PM

POWER FINANCIAL CORPORATION�— �FIRST QUARTER REPORT 2018 B 1 7
PA
RT
B
GR
EA
T-WE
ST LIFECO
INC
.
PFC_QUAT1_Eng02_GWL_2018-05-05_v1.indd C17PFC_QUAT1_Eng02_GWL_2018-05-05_v1.indd C17 18-05-09 12:43 PM18-05-09 12:43 PM

B 18 POWER FINANCIAL CORPORATION�— �FIRST QUARTER REPORT 2018
PA
RT
B
GR
EA
T-W
EST
LIF
ECO
INC
.
PFC_QUAT1_Eng02_GWL_2018-05-05_v1.indd C18PFC_QUAT1_Eng02_GWL_2018-05-05_v1.indd C18 18-05-09 12:43 PM18-05-09 12:43 PM
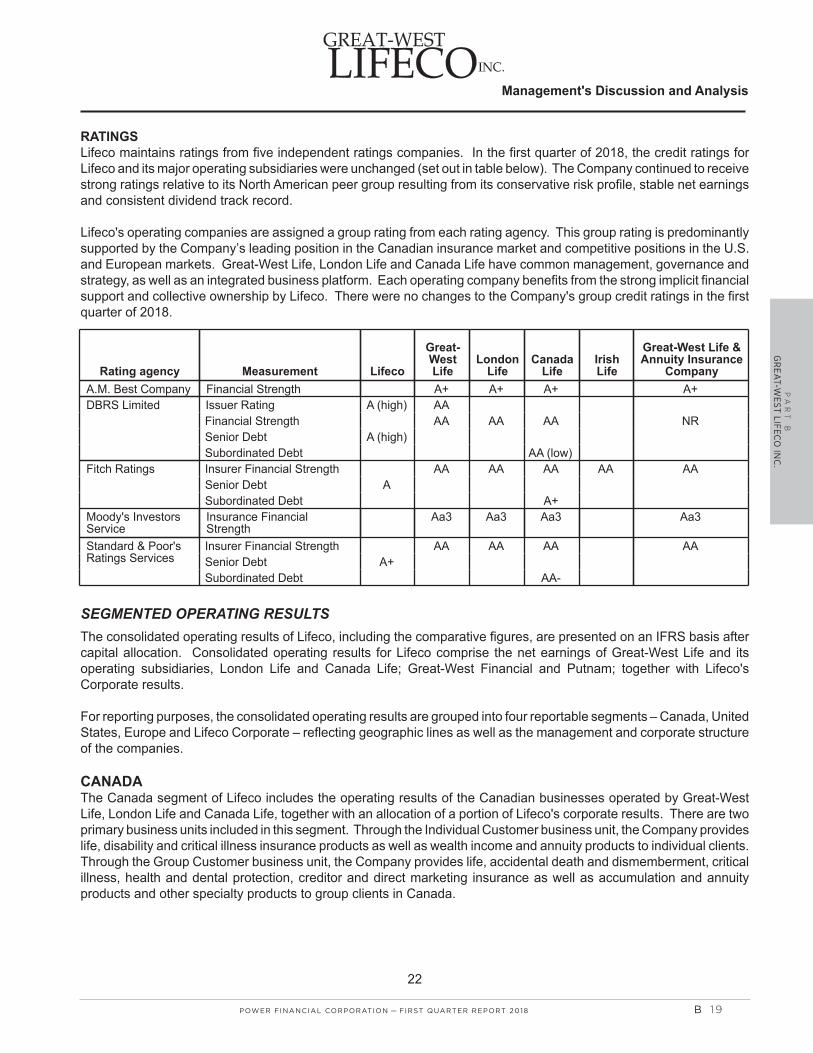
POWER FINANCIAL CORPORATION�— �FIRST QUARTER REPORT 2018 B 1 9
PA
RT
B
GR
EA
T-WE
ST LIFECO
INC
.
PFC_QUAT1_Eng02_GWL_2018-05-05_v1.indd C19PFC_QUAT1_Eng02_GWL_2018-05-05_v1.indd C19 18-05-09 12:43 PM18-05-09 12:43 PM

B 20 POWER FINANCIAL CORPORATION�— �FIRST QUARTER REPORT 2018
PA
RT
B
GR
EA
T-W
EST
LIF
ECO
INC
.
PFC_QUAT1_Eng02_GWL_2018-05-05_v1.indd C20PFC_QUAT1_Eng02_GWL_2018-05-05_v1.indd C20 18-05-09 12:43 PM18-05-09 12:43 PM

POWER FINANCIAL CORPORATION�— �FIRST QUARTER REPORT 2018 B 2 1
PA
RT
B
GR
EA
T-WE
ST LIFECO
INC
.
PFC_QUAT1_Eng02_GWL_2018-05-05_v1.indd C21PFC_QUAT1_Eng02_GWL_2018-05-05_v1.indd C21 18-05-09 12:43 PM18-05-09 12:43 PM

B 22 POWER FINANCIAL CORPORATION�— �FIRST QUARTER REPORT 2018
PA
RT
B
GR
EA
T-W
EST
LIF
ECO
INC
.
PFC_QUAT1_Eng02_GWL_2018-05-05_v1.indd C22PFC_QUAT1_Eng02_GWL_2018-05-05_v1.indd C22 18-05-09 12:43 PM18-05-09 12:43 PM
POWER FINANCIAL CORPORATION�— �FIRST QUARTER REPORT 2018 B 23
PA
RT
B
GR
EA
T-WE
ST LIFECO
INC
.
PFC_QUAT1_Eng02_GWL_2018-05-05_v1.indd C23PFC_QUAT1_Eng02_GWL_2018-05-05_v1.indd C23 18-05-09 12:43 PM18-05-09 12:43 PM

B 24 POWER FINANCIAL CORPORATION�— �FIRST QUARTER REPORT 2018
PA
RT
B
GR
EA
T-W
EST
LIF
ECO
INC
.
PFC_QUAT1_Eng02_GWL_2018-05-05_v1.indd C24PFC_QUAT1_Eng02_GWL_2018-05-05_v1.indd C24 18-05-09 12:43 PM18-05-09 12:43 PM

POWER FINANCIAL CORPORATION�— �FIRST QUARTER REPORT 2018 B 25
PA
RT
B
GR
EA
T-WE
ST LIFECO
INC
.
PFC_QUAT1_Eng02_GWL_2018-05-05_v1.indd C25PFC_QUAT1_Eng02_GWL_2018-05-05_v1.indd C25 18-05-09 12:43 PM18-05-09 12:43 PM

B 26 POWER FINANCIAL CORPORATION�— �FIRST QUARTER REPORT 2018
PA
RT
B
GR
EA
T-W
EST
LIF
ECO
INC
.
PFC_QUAT1_Eng02_GWL_2018-05-05_v1.indd C26PFC_QUAT1_Eng02_GWL_2018-05-05_v1.indd C26 18-05-09 12:43 PM18-05-09 12:43 PM

POWER FINANCIAL CORPORATION�— �FIRST QUARTER REPORT 2018 B 27
PA
RT
B
GR
EA
T-WE
ST LIFECO
INC
.
PFC_QUAT1_Eng02_GWL_2018-05-05_v1.indd C27PFC_QUAT1_Eng02_GWL_2018-05-05_v1.indd C27 18-05-09 12:43 PM18-05-09 12:43 PM

B 28 POWER FINANCIAL CORPORATION�— �FIRST QUARTER REPORT 2018
PA
RT
B
GR
EA
T-W
EST
LIF
ECO
INC
.
PFC_QUAT1_Eng02_GWL_2018-05-05_v1.indd C28PFC_QUAT1_Eng02_GWL_2018-05-05_v1.indd C28 18-05-09 12:43 PM18-05-09 12:43 PM

POWER FINANCIAL CORPORATION�— �FIRST QUARTER REPORT 2018 B 29
PA
RT
B
GR
EA
T-WE
ST LIFECO
INC
.
PFC_QUAT1_Eng02_GWL_2018-05-05_v1.indd C29PFC_QUAT1_Eng02_GWL_2018-05-05_v1.indd C29 18-05-09 12:43 PM18-05-09 12:43 PM

B 30 POWER FINANCIAL CORPORATION�— �FIRST QUARTER REPORT 2018
PA
RT
B
GR
EA
T-W
EST
LIF
ECO
INC
.
PFC_QUAT1_Eng02_GWL_2018-05-05_v1.indd C30PFC_QUAT1_Eng02_GWL_2018-05-05_v1.indd C30 18-05-09 12:43 PM18-05-09 12:43 PM

POWER FINANCIAL CORPORATION�— �FIRST QUARTER REPORT 2018 B 3 1
PA
RT
B
GR
EA
T-WE
ST LIFECO
INC
.
PFC_QUAT1_Eng02_GWL_2018-05-05_v1.indd C31PFC_QUAT1_Eng02_GWL_2018-05-05_v1.indd C31 18-05-09 12:43 PM18-05-09 12:43 PM

B 32 POWER FINANCIAL CORPORATION�— �FIRST QUARTER REPORT 2018
PA
RT
B
GR
EA
T-W
EST
LIF
ECO
INC
.
PFC_QUAT1_Eng02_GWL_2018-05-05_v1.indd C32PFC_QUAT1_Eng02_GWL_2018-05-05_v1.indd C32 18-05-09 12:43 PM18-05-09 12:43 PM

POWER FINANCIAL CORPORATION�— �FIRST QUARTER REPORT 2018 B 33
PA
RT
B
GR
EA
T-WE
ST LIFECO
INC
.
PFC_QUAT1_Eng02_GWL_2018-05-05_v1.indd C33PFC_QUAT1_Eng02_GWL_2018-05-05_v1.indd C33 18-05-09 12:43 PM18-05-09 12:43 PM
B 34 POWER FINANCIAL CORPORATION�— �FIRST QUARTER REPORT 2018
PA
RT
B
GR
EA
T-W
EST
LIF
ECO
INC
.
PFC_QUAT1_Eng02_GWL_2018-05-05_v1.indd C34PFC_QUAT1_Eng02_GWL_2018-05-05_v1.indd C34 18-05-09 12:43 PM18-05-09 12:43 PM
POWER FINANCIAL CORPORATION�— �FIRST QUARTER REPORT 2018 B 35
PA
RT
B
GR
EA
T-WE
ST LIFECO
INC
.
PFC_QUAT1_Eng02_GWL_2018-05-05_v1.indd C35PFC_QUAT1_Eng02_GWL_2018-05-05_v1.indd C35 18-05-09 12:43 PM18-05-09 12:43 PM

B 36 POWER FINANCIAL CORPORATION�— �FIRST QUARTER REPORT 2018
PA
RT
B
GR
EA
T-W
EST
LIF
ECO
INC
.
PFC_QUAT1_Eng02_GWL_2018-05-05_v1.indd C36PFC_QUAT1_Eng02_GWL_2018-05-05_v1.indd C36 18-05-09 12:43 PM18-05-09 12:43 PM
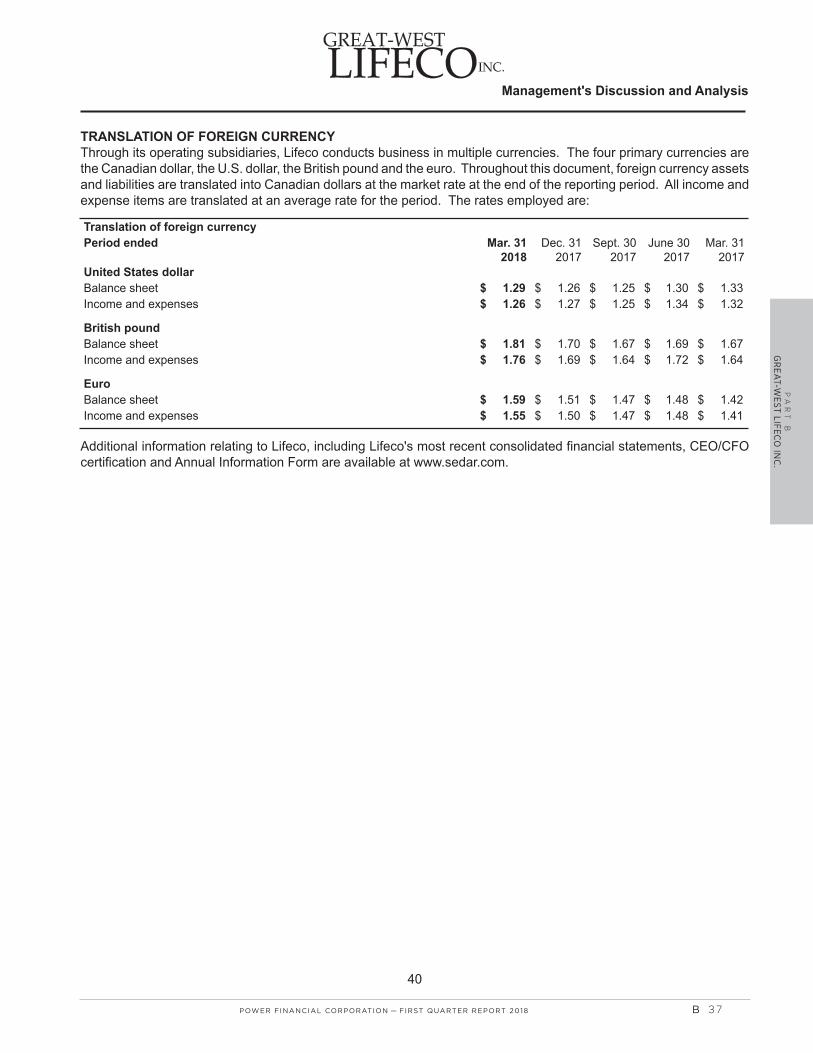
POWER FINANCIAL CORPORATION�— �FIRST QUARTER REPORT 2018 B 37
PA
RT
B
GR
EA
T-WE
ST LIFECO
INC
.
PFC_QUAT1_Eng02_GWL_2018-05-05_v1.indd C37PFC_QUAT1_Eng02_GWL_2018-05-05_v1.indd C37 18-05-09 12:43 PM18-05-09 12:43 PM

B 38 POWER FINANCIAL CORPORATION�— �FIRST QUARTER REPORT 2018
PA
RT
B
GR
EA
T-W
EST
LIF
ECO
INC
.
PFC_QUAT1_Eng02_GWL_2018-05-05_v1.indd C38PFC_QUAT1_Eng02_GWL_2018-05-05_v1.indd C38 18-05-09 12:43 PM18-05-09 12:43 PM

POWER FINANCIAL CORPORATION�— �FIRST QUARTER REPORT 2018 B 39
PA
RT
B
GR
EA
T-WE
ST LIFECO
INC
.
PFC_QUAT1_Eng02_GWL_2018-05-05_v1.indd C39PFC_QUAT1_Eng02_GWL_2018-05-05_v1.indd C39 18-05-09 12:43 PM18-05-09 12:43 PM

B 40 POWER FINANCIAL CORPORATION�— �FIRST QUARTER REPORT 2018
PA
RT
B
GR
EA
T-W
EST
LIF
ECO
INC
.
PFC_QUAT1_Eng02_GWL_2018-05-05_v1.indd C40PFC_QUAT1_Eng02_GWL_2018-05-05_v1.indd C40 18-05-09 12:43 PM18-05-09 12:43 PM

POWER FINANCIAL CORPORATION�— �FIRST QUARTER REPORT 2018 B 41
PA
RT
B
GR
EA
T-WE
ST LIFECO
INC
.
PFC_QUAT1_Eng02_GWL_2018-05-05_v1.indd C41PFC_QUAT1_Eng02_GWL_2018-05-05_v1.indd C41 18-05-09 12:43 PM18-05-09 12:43 PM

B 42 POWER FINANCIAL CORPORATION�— �FIRST QUARTER REPORT 2018
PA
RT
B
GR
EA
T-W
EST
LIF
ECO
INC
.
PFC_QUAT1_Eng02_GWL_2018-05-05_v1.indd C42PFC_QUAT1_Eng02_GWL_2018-05-05_v1.indd C42 18-05-09 12:43 PM18-05-09 12:43 PM

POWER FINANCIAL CORPORATION�— �FIRST QUARTER REPORT 2018 B 43
PA
RT
B
GR
EA
T-WE
ST LIFECO
INC
.
PFC_QUAT1_Eng02_GWL_2018-05-05_v1.indd C43PFC_QUAT1_Eng02_GWL_2018-05-05_v1.indd C43 18-05-09 12:43 PM18-05-09 12:43 PM

B 44 POWER FINANCIAL CORPORATION�— �FIRST QUARTER REPORT 2018
PA
RT
B
GR
EA
T-W
EST
LIF
ECO
INC
.
PFC_QUAT1_Eng02_GWL_2018-05-05_v1.indd C44PFC_QUAT1_Eng02_GWL_2018-05-05_v1.indd C44 18-05-09 12:43 PM18-05-09 12:43 PM

POWER FINANCIAL CORPORATION�— �FIRST QUARTER REPORT 2018 B 45
PA
RT
B
GR
EA
T-WE
ST LIFECO
INC
.
PFC_QUAT1_Eng02_GWL_2018-05-05_v1.indd C45PFC_QUAT1_Eng02_GWL_2018-05-05_v1.indd C45 18-05-09 12:43 PM18-05-09 12:43 PM

B 46 POWER FINANCIAL CORPORATION�— �FIRST QUARTER REPORT 2018
PA
RT
B
GR
EA
T-W
EST
LIF
ECO
INC
.
PFC_QUAT1_Eng02_GWL_2018-05-05_v1.indd C46PFC_QUAT1_Eng02_GWL_2018-05-05_v1.indd C46 18-05-09 12:43 PM18-05-09 12:43 PM

POWER FINANCIAL CORPORATION�— �FIRST QUARTER REPORT 2018 B 47
PA
RT
B
GR
EA
T-WE
ST LIFECO
INC
.
PFC_QUAT1_Eng02_GWL_2018-05-05_v1.indd C47PFC_QUAT1_Eng02_GWL_2018-05-05_v1.indd C47 18-05-09 12:43 PM18-05-09 12:43 PM
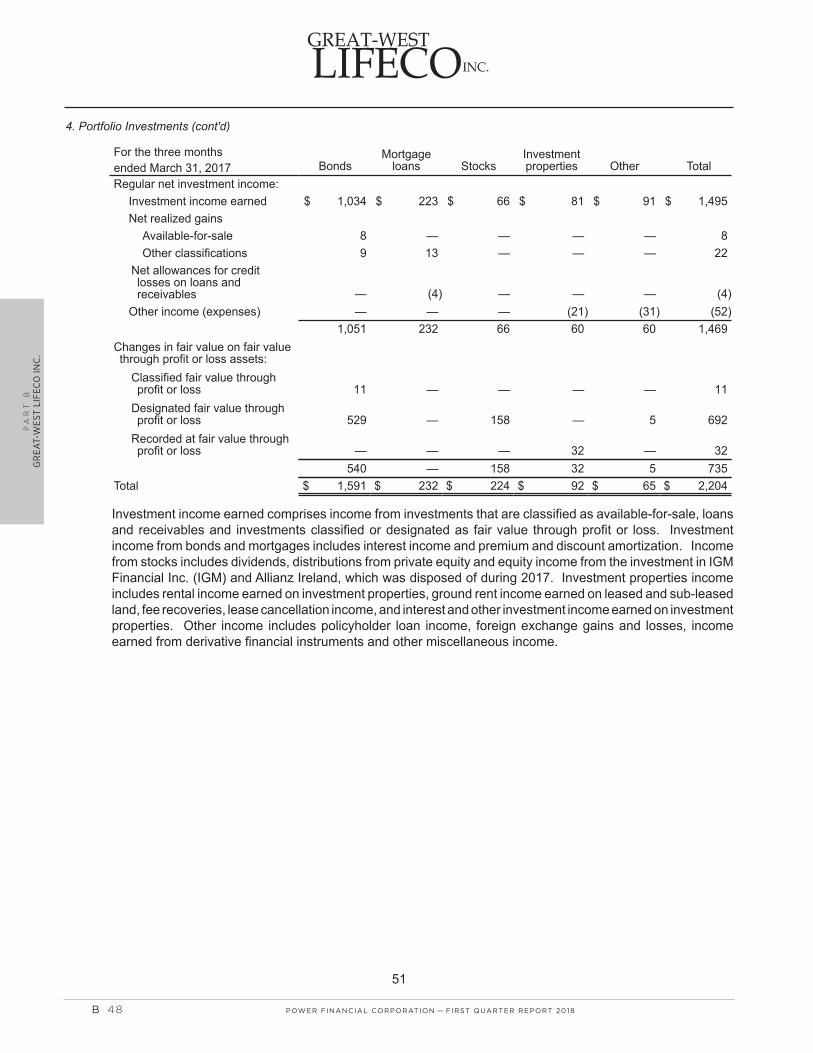
B 48 POWER FINANCIAL CORPORATION�— �FIRST QUARTER REPORT 2018
PA
RT
B
GR
EA
T-W
EST
LIF
ECO
INC
.
PFC_QUAT1_Eng02_GWL_2018-05-05_v1.indd C48PFC_QUAT1_Eng02_GWL_2018-05-05_v1.indd C48 18-05-09 12:43 PM18-05-09 12:43 PM

POWER FINANCIAL CORPORATION�— �FIRST QUARTER REPORT 2018 B 49
PA
RT
B
GR
EA
T-WE
ST LIFECO
INC
.
PFC_QUAT1_Eng02_GWL_2018-05-05_v1.indd C49PFC_QUAT1_Eng02_GWL_2018-05-05_v1.indd C49 18-05-09 12:43 PM18-05-09 12:43 PM

B 50 POWER FINANCIAL CORPORATION�— �FIRST QUARTER REPORT 2018
PA
RT
B
GR
EA
T-W
EST
LIF
ECO
INC
.
PFC_QUAT1_Eng02_GWL_2018-05-05_v1.indd C50PFC_QUAT1_Eng02_GWL_2018-05-05_v1.indd C50 18-05-09 12:43 PM18-05-09 12:43 PM

POWER FINANCIAL CORPORATION�— �FIRST QUARTER REPORT 2018 B 5 1
PA
RT
B
GR
EA
T-WE
ST LIFECO
INC
.
PFC_QUAT1_Eng02_GWL_2018-05-05_v1.indd C51PFC_QUAT1_Eng02_GWL_2018-05-05_v1.indd C51 18-05-09 12:43 PM18-05-09 12:43 PM

B 52 POWER FINANCIAL CORPORATION�— �FIRST QUARTER REPORT 2018
PA
RT
B
GR
EA
T-W
EST
LIF
ECO
INC
.
PFC_QUAT1_Eng02_GWL_2018-05-05_v1.indd C52PFC_QUAT1_Eng02_GWL_2018-05-05_v1.indd C52 18-05-09 12:43 PM18-05-09 12:43 PM

POWER FINANCIAL CORPORATION�— �FIRST QUARTER REPORT 2018 B 53
PA
RT
B
GR
EA
T-WE
ST LIFECO
INC
.
PFC_QUAT1_Eng02_GWL_2018-05-05_v1.indd C53PFC_QUAT1_Eng02_GWL_2018-05-05_v1.indd C53 18-05-09 12:43 PM18-05-09 12:43 PM

B 54 POWER FINANCIAL CORPORATION�— �FIRST QUARTER REPORT 2018
PA
RT
B
GR
EA
T-W
EST
LIF
ECO
INC
.
PFC_QUAT1_Eng02_GWL_2018-05-05_v1.indd C54PFC_QUAT1_Eng02_GWL_2018-05-05_v1.indd C54 18-05-09 12:43 PM18-05-09 12:43 PM

POWER FINANCIAL CORPORATION�— �FIRST QUARTER REPORT 2018 B 55
PA
RT
B
GR
EA
T-WE
ST LIFECO
INC
.
PFC_QUAT1_Eng02_GWL_2018-05-05_v1.indd C55PFC_QUAT1_Eng02_GWL_2018-05-05_v1.indd C55 18-05-09 12:43 PM18-05-09 12:43 PM

B 56 POWER FINANCIAL CORPORATION�— �FIRST QUARTER REPORT 2018
PA
RT
B
GR
EA
T-W
EST
LIF
ECO
INC
.
PFC_QUAT1_Eng02_GWL_2018-05-05_v1.indd C56PFC_QUAT1_Eng02_GWL_2018-05-05_v1.indd C56 18-05-09 12:43 PM18-05-09 12:43 PM

POWER FINANCIAL CORPORATION�— �FIRST QUARTER REPORT 2018 B 57
PA
RT
B
GR
EA
T-WE
ST LIFECO
INC
.
PFC_QUAT1_Eng02_GWL_2018-05-05_v1.indd C57PFC_QUAT1_Eng02_GWL_2018-05-05_v1.indd C57 18-05-09 12:43 PM18-05-09 12:43 PM

B 58 POWER FINANCIAL CORPORATION�— �FIRST QUARTER REPORT 2018
PA
RT
B
GR
EA
T-W
EST
LIF
ECO
INC
.
PFC_QUAT1_Eng02_GWL_2018-05-05_v1.indd C58PFC_QUAT1_Eng02_GWL_2018-05-05_v1.indd C58 18-05-09 12:43 PM18-05-09 12:43 PM

POWER FINANCIAL CORPORATION�— �FIRST QUARTER REPORT 2018 B 59
PA
RT
B
GR
EA
T-WE
ST LIFECO
INC
.
PFC_QUAT1_Eng02_GWL_2018-05-05_v1.indd C59PFC_QUAT1_Eng02_GWL_2018-05-05_v1.indd C59 18-05-09 12:43 PM18-05-09 12:43 PM

B 60 POWER FINANCIAL CORPORATION�— �FIRST QUARTER REPORT 2018
PA
RT
B
GR
EA
T-W
EST
LIF
ECO
INC
.
PFC_QUAT1_Eng02_GWL_2018-05-05_v1.indd C60PFC_QUAT1_Eng02_GWL_2018-05-05_v1.indd C60 18-05-09 12:43 PM18-05-09 12:43 PM

POWER FINANCIAL CORPORATION�— �FIRST QUARTER REPORT 2018 B 61
PA
RT
B
GR
EA
T-WE
ST LIFECO
INC
.
PFC_QUAT1_Eng02_GWL_2018-05-05_v1.indd C61PFC_QUAT1_Eng02_GWL_2018-05-05_v1.indd C61 18-05-09 12:43 PM18-05-09 12:43 PM

B 62 POWER FINANCIAL CORPORATION�— �FIRST QUARTER REPORT 2018
PA
RT
B
GR
EA
T-W
EST
LIF
ECO
INC
.
PFC_QUAT1_Eng02_GWL_2018-05-05_v1.indd C62PFC_QUAT1_Eng02_GWL_2018-05-05_v1.indd C62 18-05-09 12:43 PM18-05-09 12:43 PM

POWER FINANCIAL CORPORATION�— �FIRST QUARTER REPORT 2018 B 63
PA
RT
B
GR
EA
T-WE
ST LIFECO
INC
.
PFC_QUAT1_Eng02_GWL_2018-05-05_v1.indd C63PFC_QUAT1_Eng02_GWL_2018-05-05_v1.indd C63 18-05-09 12:43 PM18-05-09 12:43 PM
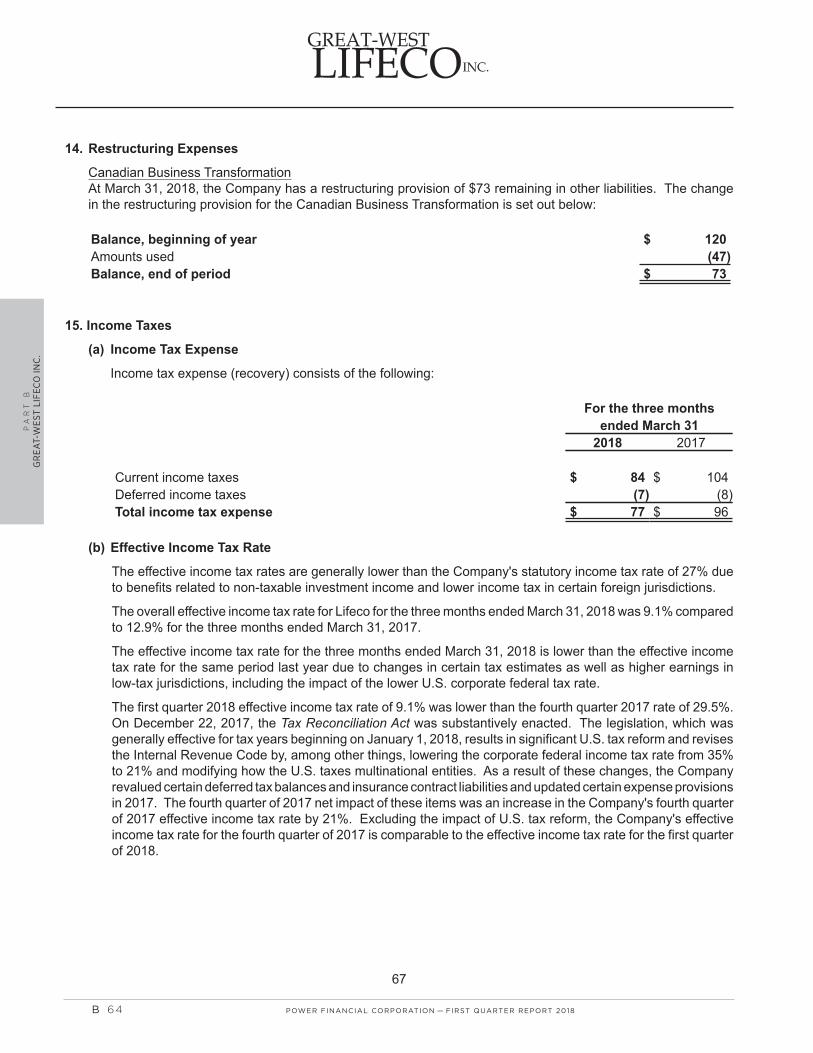
B 64 POWER FINANCIAL CORPORATION�— �FIRST QUARTER REPORT 2018
PA
RT
B
GR
EA
T-W
EST
LIF
ECO
INC
.
PFC_QUAT1_Eng02_GWL_2018-05-05_v1.indd C64PFC_QUAT1_Eng02_GWL_2018-05-05_v1.indd C64 18-05-09 12:43 PM18-05-09 12:43 PM
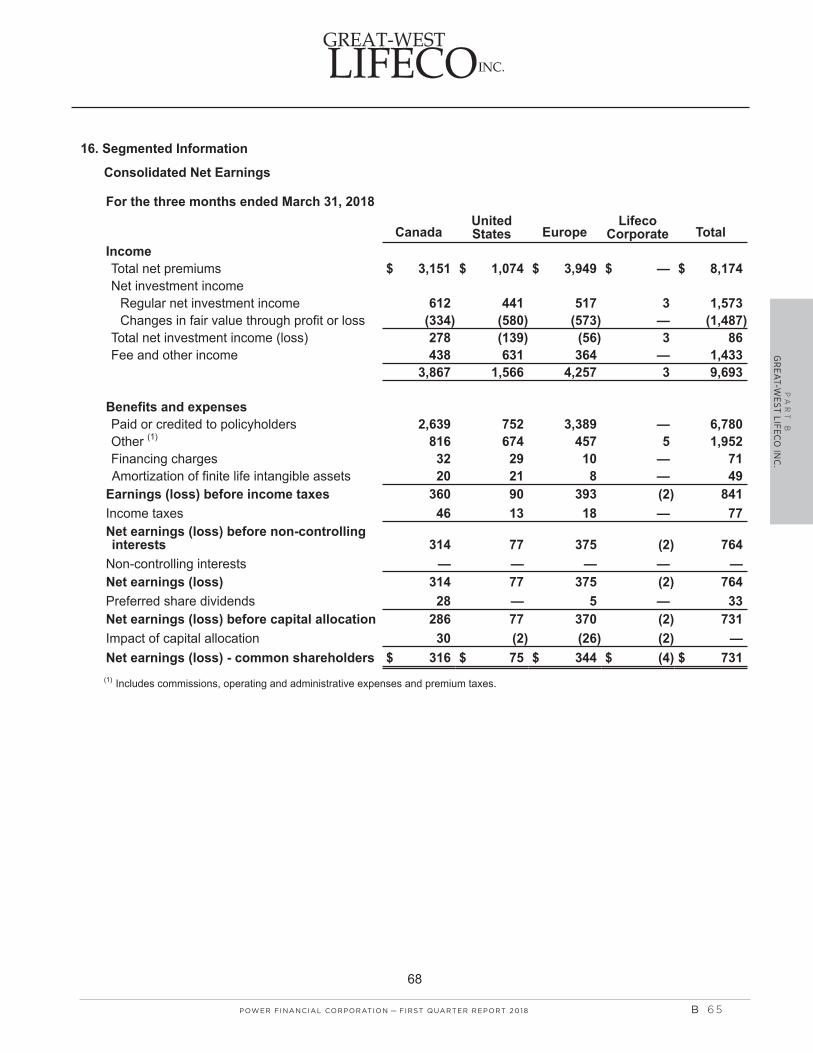
POWER FINANCIAL CORPORATION�— �FIRST QUARTER REPORT 2018 B 65
PA
RT
B
GR
EA
T-WE
ST LIFECO
INC
.
PFC_QUAT1_Eng02_GWL_2018-05-05_v1.indd C65PFC_QUAT1_Eng02_GWL_2018-05-05_v1.indd C65 18-05-09 12:43 PM18-05-09 12:43 PM

B 66 POWER FINANCIAL CORPORATION�— �FIRST QUARTER REPORT 2018
PA
RT
B
GR
EA
T-W
EST
LIF
ECO
INC
.
PFC_QUAT1_Eng02_GWL_2018-05-05_v1.indd C66PFC_QUAT1_Eng02_GWL_2018-05-05_v1.indd C66 18-05-09 12:43 PM18-05-09 12:43 PM

PA
RT
C
IGM
FINA
NC
IAL IN
C.
MANAGEMENT’S DISCUSSION AND ANALYSIS
PAG E C 2
FINANCIAL STATEMENTS AND NOTES
PAG E C 4 8
Please note that the bottom of each page in Part C contains two diff erent page numbers. A page number with the prefi x “C” refers to the number of such page in this document and the page number without any prefi x refers to the number of such page in the original document issued by IGM Financial Inc.
The attached documents concerning IGM Financial Inc. are documents prepared and publicly disclosed by such subsidiary. Certain statements in the attached documents, other than statements of historical fact, are forward-looking statements based on certain assumptions and refl ect the current expectations of the subsidiary as set forth therein. Forward-looking statements are provided for the purposes of assisting the reader in understanding the subsidiary’s fi nancial performance, fi nancial position and cash fl ows as at and for the periods ended on certain dates and to present information about the subsidiary’s management’s current expectations and plans relating to the future and the reader is cautioned that such statements may not be appropriate for other purposes.
By its nature, forward-looking information is subject to inherent risks and uncertainties that may be general or specifi c and which give rise to the possibility that expectations, forecasts, predictions, projections or conclusions will not prove to be accurate, that assumptions may not be correct and that objectives, strategic goals and priorities will not be achieved.
For further information provided by the subsidiary as to the material factors that could cause actual results to diff er materially from the content of forward-looking statements, the material factors and assumptions that were applied in making the forward-looking statements, and the subsidiary’s policy for updating the content of forward-looking statements, please see the attached documents, including the section entitled Forward-Looking Statements. The reader is cautioned to consider these factors and assumptions carefully and not to put undue reliance on forward-looking statements.
IGM FINANCIAL INC.PART C
POWER FINANCIAL CORPORATION�— �FIRST QUARTER REPORT 2018 C 1
PFC_QUAT1_Eng03_IGM_2018-05-05_v1.indd D1PFC_QUAT1_Eng03_IGM_2018-05-05_v1.indd D1 18-05-09 1:39 PM18-05-09 1:39 PM
PA
RT
C
IGM
FIN
AN
CIA
L IN
C.
IGM FINANCIAL INC. FIRST QUARTER REPORT 2018 / MANAGEMENT’S DISCUSSION AND ANALYSIS 5
MANAGEMENT’S DISCUSSION AND ANALYSIS
The Management’s Discussion and Analysis (MD&A) presents management’s view of the results of operations and financial condition of IGM Financial Inc. (IGM Financial or the Company) as at and for the three months ended March 31, 2018 and should be read in conjunction with the unaudited Interim
Condensed Consolidated Financial Statements (Interim Financial Statements) as well as the 2017 IGM Financial Inc. Annual Report filed on www.sedar.com. Commentary in the MD&A as at and for the three months ended March 31, 2018 is as of May 4, 2018.
Certain statements in this MD&A, other than statements of historical fact, are forward-looking statements based on certain assumptions and reflect IGM Financial’s current expectations. Forward-looking statements are provided to assist the reader in understanding the Company’s financial position and results of operations as at and for the periods ended on certain dates and to present information about management’s current expectations and plans relating to the future. Readers are cautioned that such statements may not be appropriate for other purposes. These statements may include, without limitation, statements regarding the operations, business, financial condition, expected financial results, performance, prospects, opportunities, priorities, targets, goals, ongoing objectives, strategies and outlook of the Company, as well as the outlook for North American and international economies, for the current fiscal year and subsequent periods. Forward-looking statements include statements that are predictive in nature, depend upon or refer to future events or conditions, or include words such as “expects”, “anticipates”, “plans”, “believes”, “estimates”, “seeks”, “intends”, “targets”, “projects”, “forecasts” or negative versions thereof and other similar expressions, or future or conditional verbs such as “may”, “will”, “should”, “would” and “could”.
This information is based upon certain material factors or assumptions that were applied in drawing a conclusion or making a forecast or projection as reflected in the forward-looking statements, including the perception of historical trends, current conditions and expected future developments, as well as other factors that are believed to be appropriate in the circumstances. While the Company considers these assumptions to be reasonable based on information currently available to management, they may prove to be incorrect.
By its nature, this information is subject to inherent risks and uncertainties that may be general or specific and which give rise to the possibility that expectations, forecasts, predictions, projections or conclusions will not prove to be accurate, that assumptions may not be correct and that objectives, strategic goals and priorities will not be achieved.
A variety of material factors, many of which are beyond the Company’s and its subsidiaries’ control, affect the operations, performance and results of the Company, and
its subsidiaries, and their businesses, and could cause actual results to differ materially from current expectations of estimated or anticipated events or results. These factors include, but are not limited to: the impact or unanticipated impact of general economic, political and market factors in North America and internationally, interest and foreign exchange rates, global equity and capital markets, management of market liquidity and funding risks, changes in accounting policies and methods used to report financial condition (including uncertainties associated with critical accounting assumptions and estimates), the effect of applying future accounting changes, operational and reputational risks, business competition, technological change, changes in government regulations and legislation, changes in tax laws, unexpected judicial or regulatory proceedings, catastrophic events, the Company’s ability to complete strategic transactions, integrate acquisitions and implement other growth strategies, and the Company’s and its subsidiaries’ success in anticipating and managing the foregoing factors.
The reader is cautioned that the foregoing list is not exhaustive of the factors that may affect any of the Company’s forward-looking statements. The reader is also cautioned to consider these and other factors, uncertainties and potential events carefully and not place undue reliance on forward-looking statements.
Other than as specifically required by applicable Canadian law, the Company undertakes no obligation to update any forward-looking statements to reflect events or circumstances after the date on which such statements are made, or to reflect the occurrence of unanticipated events, whether as a result of new information, future events or results, or otherwise.
Additional information about the risks and uncertainties of the Company’s business and material factors or assumptions on which information contained in forward-looking statements is based is provided in its disclosure materials, including this Management’s Discussion and Analysis and its most recent Annual Information Form, filed with the securities regulatory authorities in Canada, available at www.sedar.com.
FORWARD-LOOKING STATEMENTS
BASIS OF PRESENTATION AND SUMMARY OF ACCOUNTING POLICIES
The Interim Financial Statements of IGM Financial, which are the basis of the information presented in the Company’s MD&A, have been prepared in accordance with International
Accounting Standard 34, Interim Financial Reporting (IFRS) and are presented in Canadian dollars (Note 2 of the Interim Financial Statements).
Net earnings available to common shareholders, which is an additional measure in accordance with IFRS, may be subdivided into two components consisting of:
• Adjusted net earnings available to common shareholders; and
• Other items, which include the after-tax impact of any item that management considers to be of a non-recurring nature or that could make the period-over-period comparison of results from operations less meaningful.
“Adjusted net earnings available to common shareholders”, “adjusted diluted earnings per share” (EPS) and “adjusted return on average common equity” (ROE) are non-IFRS financial measures which are used to provide management and investors with additional measures to assess earnings performance. These non-IFRS financial measures do not have standard meanings prescribed by IFRS and may not be directly comparable to similar measures used by other companies.
“Earnings before interest and taxes” (EBIT), “earnings before interest, taxes, depreciation and amortization before sales commissions” (EBITDA before sales commissions), and “earnings before interest, taxes, depreciation and amortization after sales commissions” (EBITDA after sales commissions) are also non-IFRS financial measures. EBIT, EBITDA before sales commissions and EBITDA after sales commissions are alternative measures
of performance utilized by management, investors and investment analysts to evaluate and analyze the Company’s results. The two EBITDA measures have been introduced following the adoption of IFRS 15. EBITDA before sales commissions excludes all mutual fund sales commissions and is comparable to prior periods. EBITDA after sales commissions includes all sales commissions and highlights aggregate cash flows. Other items of a non-recurring nature, or that could make the period-over-period comparison of results from operations less meaningful, are further excluded to arrive at EBITDA before sales commissions and EBITDA after sales commissions. These non-IFRS financial measures do not have standard meanings prescribed by IFRS and may not be directly comparable to similar measures used by other companies.
“Earnings before income taxes” and “net earnings available to common shareholders” are additional IFRS measures which are used to provide management and investors with additional measures to assess earnings performance. These measures are considered additional IFRS measures as they are in addition to the minimum line items required by IFRS and are relevant to an understanding of the entity’s financial performance.
Refer to the appropriate reconciliations of non-IFRS financial measures to reported results in accordance with IFRS in Tables 1, 2 and 3.
NON-IFRS FINANCIAL MEASURES AND ADDITIONAL IFRS MEASURES
C 2 POWER FINANCIAL CORPORATION�— �FIRST QUARTER REPORT 2018
PFC_QUAT1_Eng03_IGM_2018-05-05_v1.indd D2PFC_QUAT1_Eng03_IGM_2018-05-05_v1.indd D2 18-05-09 1:39 PM18-05-09 1:39 PM

PA
RT
C
IGM
FINA
NC
IAL IN
C.
6 IGM FINANCIAL INC. FIRST QUARTER REPORT 2018 / MANAGEMENT’S DISCUSSION AND ANALYSIS
IGM FINANCIAL INC.SUMMARY OF CONSOLIDATED OPERATING RESULTS
IGM Financial Inc. (TSX:IGM) is one of Canada’s premier financial services companies. The Company’s principal businesses are Investors Group Inc. and Mackenzie Financial Corporation, each operating distinctly primarily within the advice segment of the financial services market.
Total assets under management were $155.8 billion at March 31, 2018 compared with $147.5 billion at March 31, 2017 and $156.5 billion at December 31, 2017. Average total assets under management for the first quarter of 2018 were $156.8 billion compared to $145.3 billion in the first quarter of 2017.
Investment fund assets under management were $149.2 billion at March 31, 2018 compared with $142.1 billion at March 31, 2017 and $149.8 billion at December 31, 2017. Average investment fund assets under management for the first quarter of 2018 were $150.1 billion compared to $140.1 billion in the first quarter of 2017.
Net earnings available to common shareholders for the three months ended March 31, 2018 were $185.5 million or 77 cents per share compared with net earnings available to common shareholders of $177.1 million or 74 cents per share for the comparative period in 2017.
Shareholders’ equity was $4.4 billion as at March 31, 2018, compared to $4.8 billion at December 31, 2017. Return on average common equity for the three months ended March 31, 2018 was 17.5% compared with 15.3% for the comparative period in 2017. The reduction in Shareholders’ equity in the quarter was largely due to the adoption of IFRS 15 which resulted in an adjustment to opening retained earnings of $514.6 million in the quarter. The quarterly dividend per common share declared in the first quarter of 2018 was 56.25 cents, unchanged from the fourth quarter of 2017.
ADOPTION OF IFRS 15 REVENUE FROM CONTRACTS WITH CUSTOMERSOn January 1, 2018, the Company adopted a change in accounting policy (IFRS 15 Revenue from contracts with Customers) which outlines a single comprehensive model for entities to use in accounting for revenue arising from contracts with customers (Note 2 to the Interim Financial Statements). The standard outlines various criteria for the eligibility of capitalizing contract costs.
Commissions are paid on investment product sales where the Company either receives a fee directly from the client or where it receives a fee directly from the mutual fund. The application of IFRS 15 has resulted in a change to the accounting policy related to the Company’s commission expense as follows:
• Commissions that are paid on investment product sales where the Company receives a fee directly from the client are capitalized and amortized over their estimated useful lives, not exceeding a period of seven years.
• All other commissions paid on investment product sales are expensed as incurred.
The changes to the Company’s current year financial statements included a decrease of $703.5 million in the opening balance of the capitalized sales commission asset, a reduction in deferred income taxes of $188.9 million, and an opening retained earnings adjustment of $514.6 million.
This change in accounting standard will impact net earnings and earnings before taxes (“EBT”). Due to an ongoing shift from sales-based compensation towards asset-based compensation, sales-based commission payments are expected to decline in 2018 and subsequent years in relation to the last several years. As a result, expensing sales commissions as incurred will result in lower commission expense than our previous approach of amortizing these amounts over an expected life of up to seven years.
The 2018 impact of IFRS 15 is expected to increase net earnings by approximately $39 million (pre-tax $53 million).
The first quarter 2018 impact of the new standard increased net earnings by approximately $6 million (pre-tax $9 million).
In the fourth quarter of 2017, we announced that Investors Group had introduced changes to its Consultant Network compensation arrangements effective January 1, 2018, and that these changes would result in a greater proportion of compensation being asset-based and expensed as incurred and a lower proportion being sales-based and subject to amortization. We disclosed that the expected impact of this earlier recognition of expense would be to decrease net earnings by approximately $19 million ($25 million before tax) for full year 2018 and $5 million ($7 million before tax) in the first quarter of 2018 (with total compensation paid unaffected). The expected impact of adoption of IFRS 15 described above was established after consideration of these compensation changes announced during the fourth quarter of 2017, with a net impact of increasing net earnings in the first quarter of 2018 by $1 million ($2 million before tax).
This new accounting standard has no impact on the economics of our business. The implementation of IFRS 15 will result in a change in timing of the recognition of commission expenses but has no effect on the cash flows of the Company.
On adoption of IFRS 15, the Company has introduced two measures of EBITDA (Table 1). EBITDA before sales commissions excludes all mutual fund sales commissions and is comparable to prior periods and EBITDA after sales commissions includes all sales commissions and highlights aggregate cash flows.
POWER FINANCIAL CORPORATION�— �FIRST QUARTER REPORT 2018 C 3
PFC_QUAT1_Eng03_IGM_2018-05-05_v1.indd D3PFC_QUAT1_Eng03_IGM_2018-05-05_v1.indd D3 18-05-09 1:39 PM18-05-09 1:39 PM

PA
RT
C
IGM
FIN
AN
CIA
L IN
C.
IGM FINANCIAL INC. FIRST QUARTER REPORT 2018 / MANAGEMENT’S DISCUSSION AND ANALYSIS 7
REPORTABLE SEGMENTSIGM Financial’s reportable segments are:
• Investors Group
• Mackenzie Investments (Mackenzie Investments or Mackenzie)
• Corporate and Other
These segments, as shown in Tables 2 and 3 reflect the Company’s internal financial reporting and performance measurement. In 2017, the Company announced the combination of investment management functions of Investors Group and Mackenzie resulting in the formation of a single global investment management organization. As a result, the Company changed the definition of the Mackenzie segment to exclude investment advisory mandates to Investors Group effective October 1, 2017. These mandates are no longer reflected within
the Mackenzie segment’s assets under management, net sales and revenues. With these changes, the Investors Group and Mackenzie segments each reflect their proportionate share of the expenses of the investment management function to better align with internal reporting. Segment operations are discussed in each of their respective Review of Segment Operating Results sections of the MD&A.
Certain items reflected in Tables 2 and 3 are not allocated to segments:
• Interest expense – represents interest expense on long-term debt.
• 2017 Restructuring and other – charges recorded in the fourth quarter resulting from efforts in respect of the implementation of a number of initiatives to assist in the Company’s operational effectiveness.
TABLE 1: RECONCILIATION OF NON-IFRS FINANCIAL MEASURES(1)
2018 2017 2017 THREE MONTHS ENDED MARCH 31 DECEMBER 31 MARCH 31 ($ millions) EARNINGS EPS(2) EARNINGS EPS(2) EARNINGS EPS(2)
Adjusted net earnings available to common shareholders – Non-IFRS measure $ 185.5 $ 0.77 $ 191.4 $ 0.79 $ 177.1 $ 0.74 Restructuring and other, net of tax – – (126.8) (0.52) – – Proportionate share of associate’s one-time charges – – (14.0) (0.06) – –
Net earnings available to common shareholders – IFRS $ 185.5 $ 0.77 $ 50.6 $ 0.21 $ 177.1 $ 0.74
EBITDA before sales commissions – Non-IFRS measure $ 333.2 $ 353.8 $ 324.6 Sales-based commissions paid (62.3) (63.6) (81.4)
EBITDA after sales commissions – Non-IFRS measure 270.9 290.2 243.2 Sales-based commissions paid subject to amortization 16.3 63.6 81.4 Amortization of capitalized sales commissions (2.9) (57.6) (58.9) Amortization of capital assets and intangible assets and other (13.9) (17.9) (12.2) Interest expense on long-term debt (30.3) (29.7) (26.8)
Adjusted earnings before income taxes – Non-IFRS measure 240.1 248.6 226.7 Restructuring and other – (172.3) – Proportionate share of associate’s one-time charges – (14.0) –
Earnings before income taxes 240.1 62.3 226.7 Income taxes (52.4) (9.5) (47.4) Perpetual preferred share dividends (2.2) (2.2) (2.2)
Net earnings available to common shareholders – IFRS $ 185.5 $ 50.6 $ 177.1
(1) On January 1, 2018, the Company adopted IFRS 15 which resulted in an increase in certain sales commissions which are expensed immediately, offset by a decrease in capitalized sales commissions and related amortization.
(2) Diluted earnings per share
C 4 POWER FINANCIAL CORPORATION�— �FIRST QUARTER REPORT 2018
PFC_QUAT1_Eng03_IGM_2018-05-05_v1.indd D4PFC_QUAT1_Eng03_IGM_2018-05-05_v1.indd D4 18-05-09 1:39 PM18-05-09 1:39 PM

PA
RT
C
IGM
FINA
NC
IAL IN
C.
8 IGM FINANCIAL INC. FIRST QUARTER REPORT 2018 / MANAGEMENT’S DISCUSSION AND ANALYSIS
TABLE 2: CONSOLIDATED OPERATING RESULTS BY SEGMENT – Q1 2018 VS. Q1 2017
INVESTORS GROUP MACKENZIE CORPORATE & OTHER TOTAL THREE MONTHS ENDED 2018 2017 2018 2017 2018 2017 2018 2017 ($ millions) MAR. 31 MAR. 31 MAR. 31 MAR. 31 MAR. 31 MAR. 31 MAR. 31 MAR. 31
Revenues Fee income $ 482.2 $ 478.1 $ 202.9 $ 198.5 $ 72.4 $ 65.3 $ 757.5 $ 741.9 Net investment income and other 10.3 18.0 (0.2) 0.1 42.0 29.7 52.1 47.8
492.5 496.1 202.7 198.6 114.4 95.0 809.6 789.7
Expenses Commission 164.8 169.6 75.3 74.6 46.0 45.1 286.1 289.3 Non-Commission 144.7 147.7 85.8 82.5 22.6 16.7 253.1 246.9
309.5 317.3 161.1 157.1 68.6 61.8 539.2 536.2
Earnings before interest and taxes $ 183.0 $ 178.8 $ 41.6 $ 41.5 $ 45.8 $ 33.2 270.4 253.5
Interest expense (30.3) (26.8)
Earnings before income taxes 240.1 226.7Income taxes 52.4 47.4
Net earnings 187.7 179.3Perpetual preferred share dividends 2.2 2.2
Net earnings available to common shareholders $ 185.5 $ 177.1
Adjusted net earnings available to common shareholders(1) $ 185.5 $ 177.1
(1) Refer to Non-IFRS Financial Measures and Additional IFRS Measures in this MD&A for an explanation of the Company’s use of non-IFRS financial measures.
TABLE 3: CONSOLIDATED OPERATING RESULTS BY SEGMENT – Q1 2018 VS. Q4 2017
INVESTORS GROUP MACKENZIE CORPORATE & OTHER TOTAL THREE MONTHS ENDED 2018 2017 2018 2017 2018 2017 2018 2017 ($ millions) MAR. 31 DEC. 31 MAR. 31 DEC. 31 MAR. 31 DEC. 31 MAR. 31 DEC. 31
Revenues Fee income $ 482.2 $ 493.1 $ 202.9 $ 204.5 $ 72.4 $ 72.4 $ 757.5 $ 770.0 Net investment income and other 10.3 (3.7) (0.2) 3.3 42.0 37.1 52.1 36.7
492.5 489.4 202.7 207.8 114.4 109.5 809.6 806.7
Expenses Commission 164.8 165.7 75.3 75.7 46.0 46.7 286.1 288.1 Non-Commission 144.7 138.8 85.8 82.0 22.6 19.5 253.1 240.3
309.5 304.5 161.1 157.7 68.6 66.2 539.2 528.4
Earnings before interest and taxes $ 183.0 $ 184.9 $ 41.6 $ 50.1 $ 45.8 $ 43.3 270.4 278.3
Interest expense (30.3) (29.7)Restructuring and other – (172.3)Proportionate share of associate’s one-time charges – (14.0)
Earnings before income taxes 240.1 62.3Income taxes 52.4 9.5
Net earnings 187.7 52.8Perpetual preferred share dividends 2.2 2.2
Net earnings available to common shareholders $ 185.5 $ 50.6
Adjusted net earnings available to common shareholders(1) $ 188.5 $ 191.4
(1) Refer to Non-IFRS Financial Measures and Additional IFRS Measures in this MD&A for an explanation of the Company’s use of non-IFRS financial measures.
POWER FINANCIAL CORPORATION�— �FIRST QUARTER REPORT 2018 C 5
PFC_QUAT1_Eng03_IGM_2018-05-05_v1.indd D5PFC_QUAT1_Eng03_IGM_2018-05-05_v1.indd D5 18-05-09 1:39 PM18-05-09 1:39 PM

PA
RT
C
IGM
FIN
AN
CIA
L IN
C.
IGM FINANCIAL INC. FIRST QUARTER REPORT 2018 / MANAGEMENT’S DISCUSSION AND ANALYSIS 9
• 2017 Proportionate share of associate’s one-time charges – represents the Company’s proportionate share in Great-West Lifeco Inc.’s charges recorded in the fourth quarter related to the impact of United States tax reforms and the pending sale of an equity investment.
• Income taxes – changes in the effective tax rates are shown in Table 4.
Tax planning may result in the Company recording lower levels of income taxes. Management monitors the status of its income tax filings and regularly assesses the overall adequacy of its provision for income taxes and, as a result, income taxes recorded in prior years may be adjusted in the current year. The effect of changes in management’s best estimates reported in adjusted net earnings is reflected in Other items, which also includes, but is not limited to, the effect of lower effective income tax rates on foreign operations.
• Perpetual preferred share dividends – represents the dividends declared on the Company’s 5.90% non-cumulative first preferred shares.
SUMMARY OF CHANGES IN TOTAL ASSETS UNDER MANAGEMENTTotal assets under management were $155.8 billion at March 31, 2018 compared to $147.5 billion at March 31, 2017. Changes in total assets under management are detailed in Table 5.
Changes in assets under management for Investors Group and Mackenzie are discussed further in each of their respective Review of the Business sections in the MD&A.
SUMMARY OF QUARTERLY RESULTSThe Summary of Quarterly Results in Table 6 includes the eight most recent quarters and the reconciliation of non-IFRS financial measures to net earnings in accordance with IFRS.
Changes in average daily investment fund assets under management over the eight most recent quarters, as shown in Table 6, largely reflect the impact of strong net sales of the Company and changes in domestic and foreign markets.
TABLE 4: EFFECTIVE INCOME TAX RATE
2018 2017 2017 THREE MONTHS ENDED MAR. 31 DEC. 31 MAR. 31
Income taxes at Canadian federal and provincial statutory rates 26.81 % 26.85 % 26.84 % Effect of: Proportionate share of associates’ earnings (3.38) (14.94) (3.33) Tax loss consolidation(1) (1.41) (5.11) (2.64) Other items (0.20) 2.38 0.03
Effective income tax rate – adjusted net earnings 21.82 9.18 20.90 Proportionate share of associate’s one-time charges – 6.04 –
Effective income tax rate – net earnings 21.82 % 15.22 % 20.90 %
(1) See Note 25 – Related Party Transactions of the Consolidated Financial Statements included in the 2017 IGM Financial Inc. Annual Report (Annual Financial Statements).
C 6 POWER FINANCIAL CORPORATION�— �FIRST QUARTER REPORT 2018
PFC_QUAT1_Eng03_IGM_2018-05-05_v1.indd D6PFC_QUAT1_Eng03_IGM_2018-05-05_v1.indd D6 18-05-09 1:39 PM18-05-09 1:39 PM

PA
RT
C
IGM
FINA
NC
IAL IN
C.
10 IGM FINANCIAL INC. FIRST QUARTER REPORT 2018 / MANAGEMENT’S DISCUSSION AND ANALYSIS
TABLE 5: CHANGE IN TOTAL ASSETS UNDER MANAGEMENT – Q1 2018 VS. Q1 2017(1)
INVESTMENT INVESTORS GROUP MACKENZIE PLANNING COUNSEL CONSOLIDATED(2)
THREE MONTHS ENDED 2018 2017 2018 2017 2018 2017 2018 2017 ($ millions) MAR. 31 MAR. 31 MAR. 31 MAR. 31 MAR. 31 MAR. 31 MAR. 31 MAR. 31
Investment funds Mutual funds(3)
Total mutual fund gross sales $ 2,859 $ 2,932 $ 2,630 $ 2,861 $ 260 $ 245 $ 5,749 $ 6,038 Total mutual fund net sales 784 890 286 76 48 39 1,118 1,005
ETFs Net creations 715 114 474 114
Total investment fund net sales(2) 784 890 768 139 48 39 1,359 1,068
Sub-advisory, institutional and other accounts Net sales 229 117 (2) 119
Combined net sales $ 784 $ 890 $ 997 $ 256 $ 48 $ 39 $ 1,357 $ 1,187
Change in total assets under management Net sales $ 784 $ 890 $ 997 $ 256 $ 48 $ 39 $ 1,357 $ 1,187 Investment returns (1,689) 1,768 (345) 1,739 27 141 (2,112) 3,621
Net change in assets (905) 2,658 652 1,995 75 180 (755) 4,808 Beginning assets 88,008 81,242 64,509 57,657 5,377 4,908 156,513 142,688
Ending assets $ 87,103 $ 83,900 $ 65,161 $ 59,652 $ 5,452 $ 5,088 $ 155,758 $ 147,496
Total assets under management consists of: Investment funds Mutual funds(3) $ 87,103 $ 83,900 $ 55,586 $ 52,934 $ 5,452 $ 5,088 $ 148,141 $ 141,922 ETFs – – 2,004 234 – – 1,658 234
Total investment funds(2) 87,103 83,900 56,994 53,099 5,452 5,088 149,203 142,087 Sub-advisory, institutional and other accounts 8,167 6,553 6,555 5,409
Ending assets $ 87,103 $ 83,900 $ 65,161 $ 59,652 $ 5,452 $ 5,088 $ 155,758 $ 147,496
(1) Effective October 1, 2017, the Mackenzie segment has been redefined to exclude advisory mandates to Investors Group from its assets under management and revenues. Within Table 5, this change has been applied retroactively to provide comparability of results.
(2) Consolidated results eliminate double counting where business is reflected within multiple segments:
– Included with Mackenzie’s results were advisory mandates to other segments with assets of $2.0 billion at March 31, 2018 (March 31, 2017 – $1.1 billion) and net sales of $472 million for the first quarter of 2018 (2017 – ($2) million).
– Included in ETFs are mutual fund investments in ETFs totalling $596 million at March 31, 2018 (March 31, 2017 – $69 million) and net sales of $233 million for the first quarter of 2018 (2017 – $51 million).
(3) Investors Group and Investment Planning Counsel AUM and net sales includes separately managed accounts.
POWER FINANCIAL CORPORATION�— �FIRST QUARTER REPORT 2018 C 7
PFC_QUAT1_Eng03_IGM_2018-05-05_v1.indd D7PFC_QUAT1_Eng03_IGM_2018-05-05_v1.indd D7 18-05-09 1:39 PM18-05-09 1:39 PM

PA
RT
C
IGM
FIN
AN
CIA
L IN
C.
IGM FINANCIAL INC. FIRST QUARTER REPORT 2018 / MANAGEMENT’S DISCUSSION AND ANALYSIS 11
TABLE 6: SUMMARY OF QUARTERLY RESULTS
2018 2017 2017 2017 2017 2016 2016 2016 Q1 Q4 Q3 Q2 Q1 Q4 Q3 Q2
Consolidated statements of earnings ($ millions)
Revenues Management fees $ 556.6 $ 564.4 $ 541.9 $ 547.0 $ 527.7 $ 525.7 $ 518.3 $ 497.4 Administration fees 107.6 110.4 109.1 111.2 109.0 109.0 107.9 104.4 Distribution fees 93.3 95.2 89.8 94.8 105.2 117.7 101.1 96.3 Net investment income and other 52.1 36.7 32.5 50.3 47.8 48.7 49.1 46.3
809.6 806.7 773.3 803.3 789.7 801.1 776.4 744.4
Expenses Commission 286.1 288.1 276.0 284.4 289.3 288.2 273.1 267.2 Non-commission 253.1 240.3 238.8 246.5 246.9 231.1 224.9 231.7 Interest 30.3 29.7 28.9 28.7 26.8 23.2 23.2 22.9
569.5 558.1 543.7 559.6 563.0 542.5 521.2 521.8
Earnings before undernoted 240.1 248.6 229.6 243.7 226.7 258.6 255.2 222.6Restructuring and other – (172.3) – (23.0) – – – –Pension plan – – – 50.4 – – – –Proportionate share of associate’s one-time charges – (14.0) – – – – – –Proportionate share of associate’s provision – – – (5.1) – – – –
Earnings before income taxes 240.1 62.3 229.6 266.0 226.7 258.6 255.2 222.6Income taxes 52.4 9.5 54.0 63.0 47.4 23.4 55.4 47.5
Net earnings 187.7 52.8 175.6 203.0 179.3 235.2 199.8 175.1Perpetual preferred share dividends 2.2 2.2 2.2 2.2 2.2 2.2 2.2 2.2
Net earnings available to common shareholders $ 185.5 $ 50.6 $ 173.4 $ 200.8 $ 177.1 $ 233.0 $ 197.6 $ 172.9
Reconciliation of Non-IFRS financial measures(1) ($ millions)
Adjusted net earnings available to common shareholders – non-IFRS measure $ 185.5 $ 191.4 $ 173.4 $ 185.9 $ 177.1 $ 199.0 $ 197.6 $ 172.9Other items: Restructuring and other, net of tax – (126.8) – (16.8) – – – – Pension plan, net of tax – – – 36.8 – – – – Proportionate share of associate’s one-time charges – (14.0) – – – – – – Proportionate share of associate’s provision – – – (5.1) – – – – Reduction in income tax estimates related to certain tax filings – – – – – 34.0 – –
Net earnings available to common shareholders – IFRS $ 185.5 $ 50.6 $ 173.4 $ 200.8 $ 177.1 $ 233.0 $ 197.6 $ 172.9
Earnings per Share (¢)
Adjusted net earnings available to common shareholders(1)
– Basic 77 80 72 77 74 83 82 72 – Diluted 77 79 72 77 74 83 82 72Net earnings available to common shareholders – Basic 77 21 72 83 74 97 82 72 – Diluted 77 21 72 83 74 97 82 72
Average daily investment fund assets ($ billions) $ 150.1 $ 148.1 $ 142.4 $ 144.3 $ 140.1 $ 135.2 $ 132.6 $ 128.2
Total investment fund assets under management ($ billions) $ 149.2 $ 149.8 $ 144.6 $ 143.3 $ 142.1 $ 137.6 $ 134.1 $ 129.1
Total assets under management ($ billions) $ 155.8 $ 156.5 $ 150.0 $ 148.6 $ 147.5 $ 142.7 $ 140.7 $ 135.5
(1) Refer to Non-IFRS Financial Measures and Additional IFRS Measures in addition to the Summary of Consolidated Operating Results section included in this MD&A for an explanation of Other items used to calculate the Company’s Non-IFRS financial measures.
C 8 POWER FINANCIAL CORPORATION�— �FIRST QUARTER REPORT 2018
PFC_QUAT1_Eng03_IGM_2018-05-05_v1.indd D8PFC_QUAT1_Eng03_IGM_2018-05-05_v1.indd D8 18-05-09 1:39 PM18-05-09 1:39 PM

PA
RT
C
IGM
FINA
NC
IAL IN
C.
12 IGM FINANCIAL INC. FIRST QUARTER REPORT 2018 / MANAGEMENT’S DISCUSSION AND ANALYSIS
INVESTORS GROUPREVIEW OF THE BUSINESS
INVESTORS GROUP STRATEGYInvestors Group’s promise is to inspire financial confidence.
Our strategic mandate is to be Canada’s financial partner of choice.
Our value proposition is to deliver better Gamma, better Beta and better Alpha:
• Gamma – the value of all efforts that sit outside of investment portfolio construction. This includes the value that a financial advisor adds to a client relationship, and comes from the creation and follow through of a well constructed financial plan.
• Beta – the value created by well constructed investment portfolios – achieving expected investment returns for the lowest possible risk.
• Alpha – the value of active management – achieving returns superior to passive benchmarks with a similar composition and risk profile.
We seek to deliver our value proposition through:
• Superior Advice – Acquiring a deep knowledge of Canadian investors and using those insights to shape everything we do.
• Segmented Client Experiences – Creating segmented experiences personalized throughout our clients’ lifetimes.
• Entrepreneurial Advisors – Inspiring our entrepreneurial advisors to constantly deliver an engaging experience and a holistic plan that seeks to deliver superior outcomes.
• Powerful Financial Solutions – Providing the most powerful, competitively priced, comprehensive suite of solutions.
• Business processes that are simple, easy and digitized – Redesigning client and advisor interactions to simplify processes, reduce errors, and digitize the experience with an appropriate cost structure.
• Enabled by a high-performing and diverse culture.
CONSULTANT NETWORKInvestors Group distinguishes itself from its competition by offering comprehensive planning to its clients within the context of long-term relationships. This approach is consistent with studies in recent years which indicate that client households receiving advice from a financial advisor have higher assets than non-advised households, and that this advantage increases based on the length of the relationship with the financial advisor. At the centre of these relationships is a national distribution network of Consultants based in region offices across Canada.
The following provides a breakdown of the Investors Group’s Consultant network into its significant components at March 31, 2018:
• 2,114 Consultant practices (2,262 at March 31, 2017), which reflect Consultants with more than four years of Investors Group experience. These practices may include Associates as described below. The level of Consultant practices is a key measurement of our business as they serve clientele representing approximately 95% of AUM.
• 887 New Consultants (1,482 at March 31, 2017), which are those Consultants with less than four years of Investors Group experience.
• 1,080 Associates and Regional Directors (1,010 at March 31, 2017). Associates are licensed team members of Consultant practices who provide financial planning services and advice to the clientele served by the team.
• Investors Group had a total Consultant network of 4,081 (4,754 at March 31, 2017).
Starting in the first quarter of 2017, Investors Group accelerated the departure of Consultants who were not expected to develop a successful practice. We also enhanced recruiting standards to achieve greater likelihood of success while also enhancing our culture and brand. This has resulted in us reducing the overall size of our region office footprint from 115 at December 31, 2016 to 94 offices.
In 2017, Investors Group made it mandatory that all Consultants with more than four years of experience are required to have or be enrolled to achieve the Certified Financial Planner (CFP) or its Quebec equivalent, Financial Planner (F.Pl.) designations. The CFP and F.Pl. designations are nationally recognized financial planning qualifications that require an individual to demonstrate financial planning competence through education, standardized examinations, continuing education requirements, and accountability to ethical standards. The Financial Planning Standards Council published in 2017 that Investors Group has more CFP designation holders than any other organization in Canada.
Over 57% of Consultant practices have professionals who are qualified as Certified Financial Planners (CFP) or its Quebec equivalent, Financial Planners (F.Pl.) and 100% of Consultant practices are qualified or enrolled to be qualified. At March 31, 2018, 1,599 individuals in our Consultant network held the CFP designation or the F.Pl. designation. In addition, there were 2,345 individuals enrolled in these programs to gain these designations. The total of 3,944 of those studying to be or qualified as CFP or F.Pl. represents 97% of total Consultants compared to 87% at March 31, 2017.
POWER FINANCIAL CORPORATION�— �FIRST QUARTER REPORT 2018 C 9
PFC_QUAT1_Eng03_IGM_2018-05-05_v1.indd D9PFC_QUAT1_Eng03_IGM_2018-05-05_v1.indd D9 18-05-09 1:39 PM18-05-09 1:39 PM

PA
RT
C
IGM
FIN
AN
CIA
L IN
C.
IGM FINANCIAL INC. FIRST QUARTER REPORT 2018 / MANAGEMENT’S DISCUSSION AND ANALYSIS 13
ADMINISTRATIVE SUPPORT AND COMMUNICATION FOR CONSULTANTS AND CLIENTS Administrative support for Consultants and clients includes timely and accurate client account record-keeping and reporting, effective problem resolution support, and continuous improvements to servicing systems.
This administrative support is provided from both Investors Group’s Quebec General Office located in Montreal for Consultants and clients residing in Quebec and from Investors Group’s head office in Winnipeg, Manitoba for Consultants and clients in the rest of Canada. The Quebec General Office has over 200 employees and operating units for most functions supporting approximately 875 Consultants throughout Quebec. Mutual fund assets under management in Quebec were approximately $15 billion as at March 31, 2018.
DEALER PLATFORM
A dealer platform was launched in the fourth quarter of 2016 which delivers an enhanced service experience to Consultants and clients. This dealer platform has allowed us to internalize carrying broker functionality and client statement preparation for Investment Industry Regulatory Organization of Canada (IIROC) and Mutual Fund Dealers Association of Canada (MFDA) nominee accounts, which were previously performed by a third party service provider, and has provided increased automation of transaction activity. This platform supports the introduction of new IIROC based products designed to support the high net worth segment of our client base. The platform is expected to result in efficiencies over the long term.
CLIENT STATEMENTS
Regular communication with our clients includes quarterly reporting of their Investors Group mutual fund holdings and the change in asset values of these holdings during the quarter. Individual clients experience different returns as a result of having different composition of their portfolios in each quarter as illustrated on the accompanying charts. The first chart reflects in-quarter client account median rates of return for the current year. The second chart reflects the client account median rates of return based on one, three and five year timeframes as at March 31, 2018. Both charts also illustrate upper and lower ranges of rates of return around the median for 90% of Investors Group client accounts.
For the three months ended March 31, 2018, the client account median rate of return was approximately (1.4)%.
Investors Group has long believed that providing our clients with personal account level performance and rate of return information over multiple time periods is a meaningful benefit to our clients and further demonstrates the value provided through advice over the history of our client relationships.
Our clients’ statements include a multiple-period view of their performance, including one year, three year and five year rates of return.
ASSETS UNDER MANAGEMENTAt March 31, 2018, Investors Group’s mutual fund assets under management were $87.1 billion. The level of assets under management is influenced by three factors: sales, redemptions and investment returns of our funds. Changes in mutual fund assets under management for the periods under review are reflected in Table 7.
MedianReturns - %
-10
0
-5
5
10
15
RO
R %
5.3
2017 Annual
(1.4)
Q1 18
90% ofclients rate of returnrange
Client Account Rate of Return (ROR) Experience
MedianReturns - % 0.9
1 Year
2.6
3 Year
5.2
5 Year
90% ofclients rate of returnrange
-10
0
-5
5
10
15
RO
R %
Client Account Rate of Return (ROR) ExperienceAs at March 31, 2018
C 10 POWER FINANCIAL CORPORATION�— �FIRST QUARTER REPORT 2018
PFC_QUAT1_Eng03_IGM_2018-05-05_v1.indd D10PFC_QUAT1_Eng03_IGM_2018-05-05_v1.indd D10 18-05-09 1:39 PM18-05-09 1:39 PM

PA
RT
C
IGM
FINA
NC
IAL IN
C.
14 IGM FINANCIAL INC. FIRST QUARTER REPORT 2018 / MANAGEMENT’S DISCUSSION AND ANALYSIS
FUND PERFORMANCE
At March 31, 2018, 54.5% of Investors Group mutual funds had a rating of three stars or better from the Morningstar† fund ranking service and 19.9% had a rating of four or five stars. This compared to the Morningstar† universe of 69.2% for three stars or better and 34.5% for four and five star funds at March 31, 2018. Morningstar Ratings† are an objective, quantitative measure of a fund’s three, five and ten year risk-adjusted performance relative to comparable funds.
CHANGES TO MUTUAL FUND PRODUCT OFFERING
Investors Group continues to enhance the performance, scope and diversity of our investment offering with the introduction of new funds and other product changes that are well-suited to the long-term diverse needs of Canadian investors.
HIGH NET WORTH OFFERINGS
High net worth clients represent a growing segment of our client base. Investors Group has several offerings to address the needs of high net worth clients and continues to look at ways to provide further offerings to this segment. Assets under management for clients in this category totalled $41.2 billion at March 31, 2018, an increase of 18.1% from one year ago, and represented 47% of total assets under management. Sales to high net worth clients totalled $1,210 million for the first quarter of 2018, an increase of 10.5% from the first quarter of 2017, and represented 42% of total sales.
Pricing for Households with Investment Assets in Excess of $500,000
Investors Group has investment solutions with differentiated pricing for households with investments in Investors Group funds in excess of $500,000. Assets under management for
clients in this category totalled $34.6 billion, an increase of 9.3% from $31.6 billion at March 31, 2017.
• Series J had assets of $19.2 billion at March 31, 2018, a decrease of 18.6% from $23.5 billion at March 31, 2017, largely as a result of transfer activity from Series J to Series U.
• Series U provides a pricing structure which separates the advisory fee, which is charged directly to a client’s account, from the fees charged to the underlying investment funds. At March 31, 2018, Series U assets under management had increased to $15.4 billion, compared to $8.1 billion at March 31, 2017, an increase of 91%.
iProfile™
This is a unique portfolio management program, that is available for households with assets held at Investors Group in excess of $250,000. iProfile investment portfolios have been designed to maximize returns and manage risk by diversifying across asset classes, management styles and geographic regions. The iProfile program has a pricing structure which separates the advisory fee, which is charged directly to a client’s account, from the fees charged to the underlying investment funds.
At March 31, 2018, the iProfile program assets under management were $6.6 billion, an increase of 103% from $3.3 billion at March 31, 2017.
Unbundled Fee Structures
A growing portion of Investors Group’s client assets are in Series U and iProfile, which are products with unbundled fee structures where a separate advisory fee is charged to the client account by the dealer. At March 31, 2018, $22.0 billion, or 25.3% of Investors Group’s mutual fund assets under management, were in products with unbundled fee structures, up 94.3%
TABLE 7: CHANGE IN MUTUAL FUND ASSETS UNDER MANAGEMENT – INVESTORS GROUP
% CHANGE
THREE MONTHS ENDED 2018 2017 2017 2017 2017 ($ millions) MAR. 31 DEC. 31 MAR. 31 DEC. 31 MAR. 31
Sales $ 2,859 $ 2,314 $ 2,932 23.6 % (2.5) %Redemptions 2,075 1,982 2,042 4.7 1.6
Net sales (redemptions) 784 332 890 136.1 (11.9)Investment returns (1,689) 2,450 1,768 N/M N/M
Net change in assets (905) 2,782 2,658 N/M N/M
Beginning assets 88,008 85,226 81,242 3.3 8.3
Ending assets $ 87,103 $ 88,008 $ 83,900 (1.0) % 3.8 %
Average daily assets $ 87,845 $ 87,195 $ 82,751 0.7 % 6.2 %
POWER FINANCIAL CORPORATION�— �FIRST QUARTER REPORT 2018 C 1 1
PFC_QUAT1_Eng03_IGM_2018-05-05_v1.indd D11PFC_QUAT1_Eng03_IGM_2018-05-05_v1.indd D11 18-05-09 1:39 PM18-05-09 1:39 PM

PA
RT
C
IGM
FIN
AN
CIA
L IN
C.
IGM FINANCIAL INC. FIRST QUARTER REPORT 2018 / MANAGEMENT’S DISCUSSION AND ANALYSIS 15
from $11.4 billion at March 31, 2017 which represented 13.5% of assets under management. Sales of these products to high net worth clients totalled $851 million for the first quarter of 2018, an increase of $269 million from the first quarter of 2017 representing 70% of total high net worth sales and 30% of total mutual fund sales.
In the fourth quarter of 2017, the Company indicated it would provide access for all clients to Series U in 2018 with the goal of eliminating all embedded fee purchase options.
Separately Managed Accounts and Fee-Based Brokerage Account
Investors Group’s separately managed account program, Azure Managed InvestmentsTM, as well as its Fee-Based Account program, are both offered through Investors Group’s brokerage services firm, Investors Group Securities Inc.
Azure Managed Investments are discretionary dealer-managed accounts that allow clients to delegate responsibility for day-to-day investment decisions to a portfolio manager. There are seven different investment mandates available that provide core equity exposure in Canadian, U.S., North American and International equity markets.
Investors Group’s Fee-Based Account program is a non-discretionary, fee-based brokerage account offering clients the benefits of a holistic approach to managing their portfolio.
CHANGE IN ASSETS UNDER MANAGEMENT – Q1 2018 VS. Q1 2017
Investors Group’s mutual fund assets under management were $87.1 billion at March 31, 2018, representing an increase of 3.8% from $83.9 billion at March 31, 2017. Average daily mutual fund assets were $87.8 billion in the first quarter of 2018, up 6.2% from $82.8 billion in the first quarter of 2017.
For the quarter ended March 31, 2018, sales of Investors Group mutual funds through its Consultant network were $2.9 billion, a decrease of 2.5% from the comparable period in 2017. Mutual fund redemptions totalled $2.1 billion, an increase of 1.6% from 2017. Investors Group mutual fund net sales for the first quarter of 2018 were $784 million compared with net sales of $890 million in 2017. During the first quarter, investment returns resulted in a decrease of $1.7 billion in mutual fund assets compared to an increase of $1.8 billion in the first quarter of 2017.
Investors Group’s annualized quarterly redemption rate for long-term funds was 9.0% in the first quarter of 2018, compared to 9.2% in the first quarter of 2017. Investors Group’s twelve month trailing redemption rate for long-term funds was 8.4% at March 31, 2018 compared to 8.8% at March 31, 2017, and
remains well below the corresponding average redemption rate for all other members of the Investment Funds Institute of Canada (IFIC) of approximately 16.1% at March 31, 2018.
CHANGE IN ASSETS UNDER MANAGEMENT – Q1 2018 VS. Q4 2017
Investors Group’s mutual fund assets under management were $87.1 billion at March 31, 2018, a decrease of 1.0% from $88.0 billion at December 31, 2017. Average daily mutual fund assets were $87.8 billion in the first quarter of 2018 compared to $87.2 billion in the fourth quarter of 2017, an increase of 0.7%.
For the quarter ended March 31, 2018, sales of Investors Group mutual funds through its Consultant network were $2.9 billion, an increase of 23.6% from the fourth quarter of 2017. Mutual fund redemptions, which totalled $2.1 billion for the first quarter, increased 4.7% from the previous quarter and the annualized quarterly redemption rate was 9.0% in the first quarter compared to 8.3% in the fourth quarter of 2017. Investors Group mutual fund net sales were $784 million for the current quarter compared to net sales of $332 million in the previous quarter.
OTHER PRODUCTS AND SERVICESSEGREGATED FUNDS
Investors Group offers segregated funds which include the Investors Group Series of Guaranteed Investment Funds (GIFs). GIFs are segregated fund policies issued by The Great-West Life Assurance Company and include 14 fund-of-fund segregated portfolios and six individual segregated funds. These segregated funds provide for long-term investment growth potential combined with risk management, full and partial maturity and death benefit guarantee features, potential creditor protection and estate planning efficiencies. Select GIF policies allow for a Lifetime Income Benefit (LIB) option to provide guaranteed retirement income for life. The investment components of these segregated funds are managed by Investors Group. At March 31, 2018, total segregated fund assets were $1.8 billion, unchanged from March 31, 2017.
INSURANCE
Investors Group distributes insurance products through I.G. Insurance Services Inc. The average number of policies sold by each insurance-licensed Consultant was 2.2 for the quarter ended March 31, 2018, compared to 3.1 in 2017. Distribution of insurance products is enhanced through Investors Group’s Insurance Planning Specialists, located throughout Canada, who assist Consultants with advanced estate planning solutions for high net worth clients.
C 12 POWER FINANCIAL CORPORATION�— �FIRST QUARTER REPORT 2018
PFC_QUAT1_Eng03_IGM_2018-05-05_v1.indd D12PFC_QUAT1_Eng03_IGM_2018-05-05_v1.indd D12 18-05-09 1:39 PM18-05-09 1:39 PM

PA
RT
C
IGM
FINA
NC
IAL IN
C.
16 IGM FINANCIAL INC. FIRST QUARTER REPORT 2018 / MANAGEMENT’S DISCUSSION AND ANALYSIS
SECURITIES OPERATIONS
Investors Group Securities Inc. is an investment dealer registered in all Canadian provinces and territories providing clients with securities services to complement their financial and investment planning. Investors Group Consultants can refer clients to one of our Wealth Planning Specialists available through Investors Group Securities Inc. In addition, there are a growing number of IIROC licensed Consultants using this platform.
MORTGAGE OPERATIONS
Investors Group is a national mortgage lender that offers residential mortgages to Investors Group clients as part of a comprehensive financial plan. Investors Group Mortgage Planning Specialists are located throughout each province in Canada, and work with our clients and their Consultants as permitted by the regulations to develop mortgage strategies that meet the individual needs and goals of each client.
Through its mortgage banking operations, mortgages originated by Investors Group Mortgage Planning Specialists are sold to the Investors Mortgage and Short Term Income Fund, Investors Canadian Corporate Bond Fund, securitization programs, and institutional investors. Certain subsidiaries of Investors Group are Canada Mortgage and Housing Corporation (CMHC)-approved issuers of National Housing Act Mortgage-Backed Securities (NHA MBS) and are approved sellers of NHA MBS into the Canada Mortgage Bond Program (CMB Program). Securitization programs also include certain bank-sponsored asset-backed commercial paper (ABCP) programs. Residential mortgages are also held by Investors Group’s intermediary operations.
Mortgage fundings for the first quarter of 2018 were $171 million, compared to $311 million in 2017, a decrease of 45.0%. At March 31, 2018, mortgages serviced by Investors Group related to its mortgage banking operations totalled
$10.7 billion, compared to $11.1 billion at March 31, 2017, a decrease of 3.5%.
SOLUTIONS BANKING†
Investors Group’s Solutions Banking† offering consists of a wide range of products and services provided by the National Bank of Canada under a long-term distribution agreement and includes: investment loans, residential mortgages, lines of credit, personal loans, creditor insurance, deposit accounts, and credit cards. The offering also includes an All-in-One product which is a comprehensive cash management solution that integrates the features of a mortgage, term loan, revolving line of credit and deposit account to meet the needs of our clients while minimizing overall interest costs. Through Solutions Banking†, clients have access to a network of banking machines, as well as a private labeled client website and client service centre. The Solutions Banking† offering supports Investors Group’s approach to delivering total financial solutions for our clients through a broad financial planning platform. Total lending products of Investors Group clients in the Solutions Banking† offering totalled $3.6 billion at March 31, 2018, compared to $3.2 billion at March 31, 2017.
Available credit associated with Solutions Banking† All-in-One accounts originated for the quarter ended March 31, 2018 were $199 million, compared to $149 million in 2017. At March 31, 2018, the balance outstanding of Solutions Banking All-in-One products was $2.3 billion, compared to $1.8 billion one year ago, and represented approximately 50% of total available credit associated with these accounts.
ADDITIONAL PRODUCTS AND SERVICES
Investors Group also provides its clients with guaranteed investment certificates offered by Investors Group Trust Co. Ltd., as well as a number of other financial institutions.
POWER FINANCIAL CORPORATION�— �FIRST QUARTER REPORT 2018 C 13
PFC_QUAT1_Eng03_IGM_2018-05-05_v1.indd D13PFC_QUAT1_Eng03_IGM_2018-05-05_v1.indd D13 18-05-09 1:39 PM18-05-09 1:39 PM

PA
RT
C
IGM
FIN
AN
CIA
L IN
C.
IGM FINANCIAL INC. FIRST QUARTER REPORT 2018 / MANAGEMENT’S DISCUSSION AND ANALYSIS 17
REVIEW OF SEGMENT OPERATING RESULTS
Investors Group’s earnings before interest and taxes are presented in Table 8.
Q1 2018 VS. Q1 2017
FEE INCOME
Fee income is generated from the management, administration and distribution of Investors Group mutual funds. The distribution of insurance and Solutions Banking† products and the provision of securities services provide additional fee income.
Investors Group earns management fees for investment management services provided to its mutual funds, which depend largely on the level and composition of mutual fund assets under management. Management fees were $360.8 million in the first quarter of 2018, an increase of $19.7 million or 5.8% from $341.1 million in 2017. The net increase in management fees in the first quarter of 2018 was primarily due to the increase in average assets under management of 6.2%, as shown in Table 7. The average management fee rate in the first quarter of 2018 was 166.6 basis points of average assets under management compared to 166.8 basis points in 2017.
Investors Group receives administration fees for providing administrative services to its mutual funds and trusteeship services to its unit trust mutual funds, which also depend largely
on the level and composition of mutual fund assets under management. Administration fees totalled $78.1 million in the current quarter compared to $79.9 million a year ago, a decrease of 2.3%. This decrease resulted primarily from changes in the composition of average assets under management.
Distribution fees are earned from:
• Redemption fees on mutual funds that were sold with a deferred sales charge.
• Portfolio fund distribution fees.
• Distribution of insurance products through I.G. Insurance Services Inc.
• Securities trading services provided through Investors Group Securities Inc.
• Banking services provided through Solutions Banking†.
Distribution fee income of $43.3 million for the first quarter of 2018 decreased by $13.8 million from $57.1 million in 2017, primarily due to a decrease in distribution fee income from insurance products. Insurance revenue in 2017 was higher as a result of sales in advance of changes to the way permanent insurance was taxed. Redemption fees were also lower in the quarter ended March 31, 2018. Redemption fee income varies depending on the level of deferred sales charge attributable to fee-based redemptions.
TABLE 8: OPERATING RESULTS – INVESTORS GROUP
% CHANGE
THREE MONTHS ENDED 2018 2017 2017 2017 2017 ($ millions) MAR. 31 DEC. 31 MAR. 31 DEC. 31 MAR. 31
Revenues Management fees $ 360.8 $ 366.8 $ 341.1 (1.6) % 5.8 % Administration fees 78.1 80.9 79.9 (3.5) (2.3) Distribution fees 43.3 45.4 57.1 (4.6) (24.2)
482.2 493.1 478.1 (2.2) 0.9 Net investment income and other 10.3 (3.7) 18.0 N/M (42.8)
492.5 489.4 496.1 0.6 (0.7)
Expenses Commission Commission amortization 2.9 45.6 45.2 N/M N/M
Mutual fund sales commissions expensed as incurred 35.9 – – N/M N/M
Other commissions 30.4 30.7 45.7 (1.0) (33.5)
69.2 76.3 90.9 (9.3) (23.9) Asset-based compensation 95.6 89.4 78.7 6.9 21.5 Non-commission 144.7 138.8 147.7 4.3 (2.0)
309.5 304.5 317.3 1.6 (2.5)
Earnings before interest and taxes $ 183.0 $ 184.9 $ 178.8 (1.0) % 2.3 %
C 14 POWER FINANCIAL CORPORATION�— �FIRST QUARTER REPORT 2018
PFC_QUAT1_Eng03_IGM_2018-05-05_v1.indd D14PFC_QUAT1_Eng03_IGM_2018-05-05_v1.indd D14 18-05-09 1:39 PM18-05-09 1:39 PM
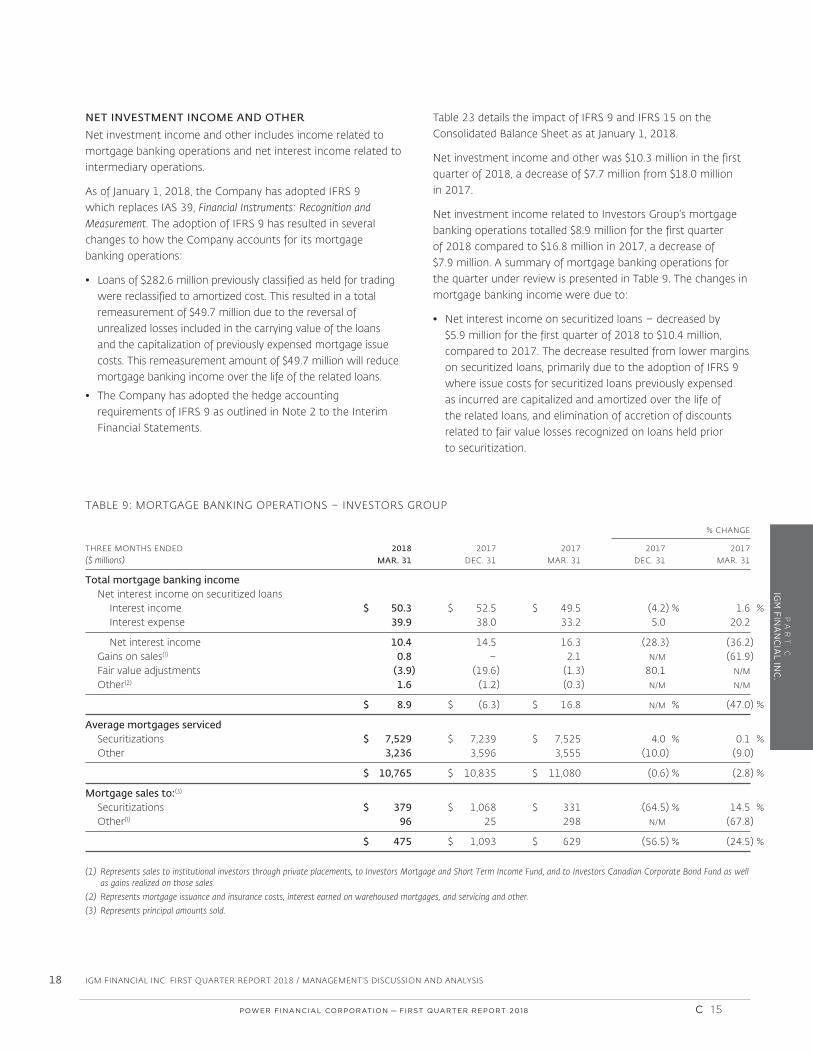
PA
RT
C
IGM
FINA
NC
IAL IN
C.
18 IGM FINANCIAL INC. FIRST QUARTER REPORT 2018 / MANAGEMENT’S DISCUSSION AND ANALYSIS
NET INVESTMENT INCOME AND OTHER
Net investment income and other includes income related to mortgage banking operations and net interest income related to intermediary operations.
As of January 1, 2018, the Company has adopted IFRS 9 which replaces IAS 39, Financial Instruments: Recognition and Measurement. The adoption of IFRS 9 has resulted in several changes to how the Company accounts for its mortgage banking operations:
• Loans of $282.6 million previously classified as held for trading were reclassified to amortized cost. This resulted in a total remeasurement of $49.7 million due to the reversal of unrealized losses included in the carrying value of the loans and the capitalization of previously expensed mortgage issue costs. This remeasurement amount of $49.7 million will reduce mortgage banking income over the life of the related loans.
• The Company has adopted the hedge accounting requirements of IFRS 9 as outlined in Note 2 to the Interim Financial Statements.
Table 23 details the impact of IFRS 9 and IFRS 15 on the Consolidated Balance Sheet as at January 1, 2018.
Net investment income and other was $10.3 million in the first quarter of 2018, a decrease of $7.7 million from $18.0 million in 2017.
Net investment income related to Investors Group’s mortgage banking operations totalled $8.9 million for the first quarter of 2018 compared to $16.8 million in 2017, a decrease of $7.9 million. A summary of mortgage banking operations for the quarter under review is presented in Table 9. The changes in mortgage banking income were due to:
• Net interest income on securitized loans – decreased by $5.9 million for the first quarter of 2018 to $10.4 million, compared to 2017. The decrease resulted from lower margins on securitized loans, primarily due to the adoption of IFRS 9 where issue costs for securitized loans previously expensed as incurred are capitalized and amortized over the life of the related loans, and elimination of accretion of discounts related to fair value losses recognized on loans held prior to securitization.
TABLE 9: MORTGAGE BANKING OPERATIONS – INVESTORS GROUP
% CHANGE
THREE MONTHS ENDED 2018 2017 2017 2017 2017 ($ millions) MAR. 31 DEC. 31 MAR. 31 DEC. 31 MAR. 31
Total mortgage banking income Net interest income on securitized loans Interest income $ 50.3 $ 52.5 $ 49.5 (4.2) % 1.6 % Interest expense 39.9 38.0 33.2 5.0 20.2
Net interest income 10.4 14.5 16.3 (28.3) (36.2) Gains on sales(1) 0.8 – 2.1 N/M (61.9) Fair value adjustments (3.9) (19.6) (1.3) 80.1 N/M
Other(2) 1.6 (1.2) (0.3) N/M N/M
$ 8.9 $ (6.3) $ 16.8 N/M % (47.0) %
Average mortgages serviced Securitizations $ 7,529 $ 7,239 $ 7,525 4.0 % 0.1 % Other 3,236 3,596 3,555 (10.0) (9.0)
$ 10,765 $ 10,835 $ 11,080 (0.6) % (2.8) %
Mortgage sales to:(3)
Securitizations $ 379 $ 1,068 $ 331 (64.5) % 14.5 % Other(1) 96 25 298 N/M (67.8)
$ 475 $ 1,093 $ 629 (56.5) % (24.5) %
(1) Represents sales to institutional investors through private placements, to Investors Mortgage and Short Term Income Fund, and to Investors Canadian Corporate Bond Fund as well as gains realized on those sales.
(2) Represents mortgage issuance and insurance costs, interest earned on warehoused mortgages, and servicing and other.
(3) Represents principal amounts sold.
POWER FINANCIAL CORPORATION�— �FIRST QUARTER REPORT 2018 C 15
PFC_QUAT1_Eng03_IGM_2018-05-05_v1.indd D15PFC_QUAT1_Eng03_IGM_2018-05-05_v1.indd D15 18-05-09 1:39 PM18-05-09 1:39 PM

PA
RT
C
IGM
FIN
AN
CIA
L IN
C.
IGM FINANCIAL INC. FIRST QUARTER REPORT 2018 / MANAGEMENT’S DISCUSSION AND ANALYSIS 19
• Gains realized on the sale of residential mortgages – decreased by $1.3 million for the first quarter of 2018 to $0.8 million, compared to 2017. The decrease in gains resulted from lower sales activity.
• Fair value adjustments – decreased by $2.6 million for the first quarter of 2018 to ($3.9) million, compared to 2017. The decrease was primarily due to unfavorable fair value adjustments on certain securitization related financial instruments.
• Other – increased by $1.9 million for the first quarter of 2018 to $1.6 million compared to 2017 primarily due to the adoption of IFRS 9 where issue costs for securitized loans previously expensed as incurred are amortized over the life of the related loans.
EXPENSES
Investors Group incurs commission expense in connection with the distribution of its mutual funds and other financial services and products. Commissions are paid on the sale of these products and fluctuate with the level of sales. Prior to January 1, 2018, commissions paid on the sale of mutual funds were capitalized and amortized over a maximum period of seven years. As of January 1, 2018, as a result of the adoption of IFRS 15 (Note 2 to the Interim Financial Statements) commissions paid on the sale of investment products are capitalized and amortized over their estimated useful lives where the Company receives a fee directly from the client. All other commissions paid on investment product sales are expensed as incurred.
Commission expense was $69.2 million for the first quarter of 2018, a decrease of $21.7 million from $90.9 million in 2017. The Company’s implementation of IFRS 15 in the quarter resulted in less cash commissions paid being expensed in the quarter as compared to the amortization of commissions in 2017 which were previously capitalized and amortized. In addition, the decrease in other commissions resulted in part from compensation related to the distribution of other insurance products.
Asset-based compensation, which is based on the value of assets under management, increased by $16.9 million for the first quarter ended March 31, 2018 to $95.6 million, compared to 2017. The increase was primarily due to the increase in assets under management and to compensation changes announced in the fourth quarter of 2017.
Non-commission expenses incurred by Investors Group primarily relate to the support of the Consultant network, the administration, marketing and management of its mutual funds and other products, as well as sub-advisory fees related to mutual fund assets under management. Non-commission
expenses were $144.7 million for the first quarter of 2018 compared to $147.7 million in 2017, a decrease of $3.0 million or 2.0%. The decrease resulted from lower sub-advisory fees and the realization of certain initiatives that were announced in the previous quarter.
Q1 2018 VS. Q4 2017
FEE INCOME
Management fee income decreased by $6.0 million or 1.6% to $360.8 million in the first quarter of 2018 compared with the fourth quarter of 2017. The net decrease in management fees in the first quarter was primarily due to a decrease of approximately $7.0 million resulting from two fewer calendar days in the first quarter compared to the prior quarter, offset in part by the increase in average assets under management of 0.7% for the quarter, as shown in Table 7.
Administration fees decreased to $78.1 million in the first quarter of 2018 from $80.9 million in the fourth quarter of 2017 largely due to changes in the composition of average mutual fund assets under management in the period, as well as two fewer calendar days in the first quarter as compared to the prior quarter.
Distribution fee income of $43.3 million in the first quarter of 2018 decreased by $2.1 million from $45.4 million in the fourth quarter primarily due to a decrease in distribution fee income from insurance product sales, primarily as a result of the seasonal nature of insurance sales.
NET INVESTMENT INCOME AND OTHER
Net investment income and other was $10.3 million in the first quarter of 2018 compared to ($3.7) million in the previous quarter, an increase of $14.0 million primarily related to Investors Group’s mortgage banking operations.
Net investment income related to Investors Group’s mortgage banking operations totalled $8.9 million in the first quarter of 2018, an increase of $15.2 million from ($6.3) million in the previous quarter as shown in Table 9. The changes in mortgage banking income were due to:
• Net interest income on securitized loans – decreased by $4.1 million for the first quarter of 2018 to $10.4 million, compared to $14.5 million in the previous quarter. The decrease resulted primarily due to the adoption of IFRS 9 where issue costs for securitized loans previously expensed as incurred are now capitalized and amortized over the life of the related loans and elimination of accretion of discounts related to fair value losses recognized on loans held prior to securitization.
C 16 POWER FINANCIAL CORPORATION�— �FIRST QUARTER REPORT 2018
PFC_QUAT1_Eng03_IGM_2018-05-05_v1.indd D16PFC_QUAT1_Eng03_IGM_2018-05-05_v1.indd D16 18-05-09 1:39 PM18-05-09 1:39 PM

PA
RT
C
IGM
FINA
NC
IAL IN
C.
20 IGM FINANCIAL INC. FIRST QUARTER REPORT 2018 / MANAGEMENT’S DISCUSSION AND ANALYSIS
• Gains realized on the sale of residential mortgages – increased by $0.8 million for the first quarter of 2018, compared to the previous quarter. The increase in gains resulted from higher sales activity.
• Fair value adjustments – increased by $15.7 million for the first quarter of 2018 to ($3.9) million compared to ($19.6) million in the previous quarter primarily due to negative fair value adjustments in 2017 on loans held temporarily pending sale or securitization to third parties, as a result of interest rate increases in the period.
• Other – increased by $2.8 million for the first quarter of 2018 to $1.6 million compared to the previous quarter primarily due to the adoption of IFRS 9 where issue costs for securitized loans previously expensed as incurred are amortized over the life of the related loans.
EXPENSES
Commission expense in the current quarter was $69.2 million compared with $76.3 million in the previous quarter. The decrease primarily related to less cash commissions paid being expensed in the quarter as compared to the amortization of commissions in the prior quarter that had previously been capitalized and amortized, prior to the implementation of IFRS 15. Asset-based compensation increased by $6.2 million to $95.6 million in the first quarter of 2018, due to higher assets under management and compensation changes announced in the fourth quarter of 2017.
Non-commission expenses were $144.7 million in the current quarter, compared to $138.8 million in the prior quarter. The increase was partially due to the seasonal nature of certain expenses normally incurred in the first quarter.
POWER FINANCIAL CORPORATION�— �FIRST QUARTER REPORT 2018 C 17
PFC_QUAT1_Eng03_IGM_2018-05-05_v1.indd D17PFC_QUAT1_Eng03_IGM_2018-05-05_v1.indd D17 18-05-09 1:39 PM18-05-09 1:39 PM

PA
RT
C
IGM
FIN
AN
CIA
L IN
C.
IGM FINANCIAL INC. FIRST QUARTER REPORT 2018 / MANAGEMENT’S DISCUSSION AND ANALYSIS 21
MACKENZIE STRATEGYMackenzie strives to ensure that the interests of clients, shareholders, dealers, advisors and employees are closely aligned.
Mackenzie’s vision: We are committed to the financial success of investors, through their eyes. This impacts the strategic priorities we select to fulfil that commitment and drive future business growth. Our strategic mandate is two-fold: win in the Canadian retail space, and build meaningful strategic relationships, both in support of our goal to be the company of choice for individual investors, financial advisors and institutional investors. We aim to achieve this mandate by attracting and fostering the best minds in the investment industry, responding to changing needs of financial advisors and investors with distinctive and innovative solutions, and continuing to deliver institutional quality in everything we do.
Supporting this vision and strategic mandate are six key foundational capabilities that our employees strive to achieve:
• Delivering competitive and consistent risk-adjusted performance
• Offering innovative and high quality investment solutions
• Accelerating distribution
• Advancing brand leadership
• Driving operational excellence and discipline
• Enabling a high-performing and diverse culture
Mackenzie seeks to maximize returns on business investment by focusing resources in areas that directly impact the success of our strategic mandate: investment management, distribution and client experience.
Founded in 1967, Mackenzie continues to build an investment advisory business through proprietary investment research and portfolio management while utilizing strategic partners in a selected sub-advisory capacity. Our business focuses on multiple distribution channels: Retail, Strategic Alliances and Institutional.
Mackenzie primarily distributes its retail investment products through third party financial advisors. Mackenzie’s sales teams work with many of the more than 30,000 independent financial advisors and their firms across Canada. In addition to its retail distribution team, Mackenzie also has specialty teams focused on strategic alliances and the institutional marketplace. Within the strategic alliance channel, Mackenzie offers certain series of its mutual funds and provides sub-advisory services to third party and related party investment programs offered by banks, insurance companies and other investment companies. Strategic alliances with related parties include providing advisory services to Investors Group, Investment Planning Counsel and
Great-West Lifeco Inc. (Lifeco) subsidiaries, and also include a private label mutual fund arrangement with Lifeco subsidiary Quadrus. Within the strategic alliance channel, Mackenzie’s primary distribution relationship is with the head office of the respective bank, insurance company or investment company. In the institutional channel, Mackenzie provides investment management services to pension plans, foundations and other institutions. Mackenzie attracts new institutional business through its relationships with pension and management consultants.
Gross sales and redemption activity in strategic alliance and institutional accounts can be more pronounced than in the retail channel given the relative size and the nature of the distribution relationships of these accounts. These accounts are also subject to ongoing reviews and rebalance activities which may result in a significant change in the level of assets under management.
Mackenzie is positioned to continue to build and enhance its distribution relationships given its team of experienced investment professionals, strength of its distribution network, broad product shelf, competitively priced products and its focus on client experience and investment excellence.
ASSETS UNDER MANAGEMENTThe changes in investment fund assets under management are summarized in Table 10 and the changes in total assets under management are summarized in Table 11.
In October 2017, the investment management functions of Investors Group and Mackenzie consolidated to form a single global investment management organization under Mackenzie to support both companies. Effective October 1, 2017, Mackenzie’s segment excludes investment advisory mandates to Investors Group funds and investments into Mackenzie mutual funds by Investors Group mutual funds. These mandates are no longer reflected within Mackenzie’s segment assets under management and net sales. To ensure comparability of results, prior period assets under management and net sales have been adjusted to remove these mandates.
At March 31, 2018, Mackenzie’s investment fund assets under management were $57.0 billion, an all-time quarter end high, and total assets under management were $65.2 billion. The change in Mackenzie’s assets under management is determined by the increase or decrease in the market value of the securities held in the portfolios of investments and by the level of net sales.
FUND PERFORMANCE
Long-term investment performance is a key measure of Mackenzie’s ongoing success. At March 31, 2018, 40.8% of
MACKENZIE INVESTMENTSREVIEW OF THE BUSINESS
C 18 POWER FINANCIAL CORPORATION�— �FIRST QUARTER REPORT 2018
PFC_QUAT1_Eng03_IGM_2018-05-05_v1.indd D18PFC_QUAT1_Eng03_IGM_2018-05-05_v1.indd D18 18-05-09 1:39 PM18-05-09 1:39 PM

PA
RT
C
IGM
FINA
NC
IAL IN
C.
22 IGM FINANCIAL INC. FIRST QUARTER REPORT 2018 / MANAGEMENT’S DISCUSSION AND ANALYSIS
Mackenzie mutual fund assets were rated in the top two performance quartiles for the one year time frame, 48.8% for the three year time frame and 43.4% for the five year time frame. Mackenzie also monitors its fund performance relative to the ratings it receives on its mutual funds from the Morningstar† fund ranking service. At March 31, 2018, 75.2% of Mackenzie mutual fund assets measured by Morningstar† had a rating of three stars or better and 38.9% had a rating of four or five stars. This compared to the Morningstar† universe of 76.4% for three stars or better and 39.6% for four and five star funds at March 31, 2018. These ratings exclude the Quadrus Group of Funds†.
CHANGES TO PRODUCT OFFERINGS
Mackenzie continues to evolve its product shelf by providing enhanced investment solutions for financial advisors to offer their clients. In 2018, Mackenzie launched a number of new products, announced a new simplified and more accessible pricing structure, which includes fee reductions, and proposed mergers to streamline and strengthen its product shelf.
Exchange Traded Funds
The addition of Exchange Traded Funds (ETF) has complemented Mackenzie’s broad and innovative fund line-up and reflects its investor-focus vision to provide advisors and investors with new solutions to drive investor outcomes and achieve their personal goals. These ETFs offer investors another investment option to utilize in building long-term diversified portfolios. Mackenzie’s current line-up consists of twenty-eight ETFs: fifteen active and strategic beta ETFs launched during 2016 and 2017 and an additional thirteen traditional index ETFs launched in the first quarter of 2018.
Mutual Funds
In 2018, Mackenzie launched Exchange Traded Fund (ETF) Portfolios, a series of five mutual fund portfolios in a single solution that provides access to a full spectrum of Mackenzie ETFs. Each portfolio has the ability to invest in Mackenzie’s active, strategic beta and traditional ETFs, and is professionally managed and monitored by the Mackenzie Asset Allocation Team. This new line-up makes ETFs more accessible to Canadian advisors and investors:
TABLE 10: CHANGE IN INVESTMENT FUND ASSETS UNDER MANAGEMENT – MACKENZIE(1)
% CHANGE
THREE MONTHS ENDED 2018 2017 2017 2017 2017 ($ millions) MAR. 31 DEC. 31 MAR. 31 DEC. 31 MAR. 31
Sales $ 2,630 $ 2,234 $ 2,861 17.7 % (8.1) %Redemptions 2,344 2,097 2,785 11.8 (15.8)
Mutual fund net sales (redemptions)(2) 286 137 76 108.8 276.3ETF net creations 715 367 114 94.8 N/M
Investment fund net sales (redemptions)(3) 768 477 139 61.0 N/M
Investment returns (317) 1,850 1,535 N/M N/M
Net change in assets 451 2,327 1,674 (80.6) (73.1)Beginning assets 56,543 54,216 51,425 4.3 10.0
Ending assets $ 56,994 $ 56,543 $ 53,099 0.8 % 7.3 %
Consists of: Mutual funds $ 55,586 $ 55,615 $ 52,934 (0.1) % 5.0 % ETFs 2,004 1,296 234 54.6 N/M
Investment funds(4) $ 56,994 $ 56,543 $ 53,099 0.8 % 7.3 %
Daily average investment fund assets $ 57,070 $ 55,687 $ 52,330 2.5 % 9.1 %
(1) Effective October 1, 2017, Mackenzie segment has been redefined to exclude investments into Mackenzie mutual funds by Investors Group mutual funds from its assets under management and net sales. This change has been applied retroactively to provide comparability of results.
(2) During the first quarter of 2017, certain third party programs which include Mackenzie mutual funds made fund allocation changes which resulted in Mackenzie mutual fund gross sales of $313 million, redemptions of $618 million and net redemptions of $305 million.
(3) Total investment fund net sales exclude Mackenzie mutual fund investments in ETFs of $233 million for the first quarter of 2018, $27 million for the fourth quarter of 2017 and $51 million for the first quarter of 2017.
(4) Excludes Mackenzie mutual fund investments in ETFs of $596 million at March 31, 2018, $368 million at December 31, 2017 and $69 million at March 31, 2017.
POWER FINANCIAL CORPORATION�— �FIRST QUARTER REPORT 2018 C 19
PFC_QUAT1_Eng03_IGM_2018-05-05_v1.indd D19PFC_QUAT1_Eng03_IGM_2018-05-05_v1.indd D19 18-05-09 1:39 PM18-05-09 1:39 PM

PA
RT
C
IGM
FIN
AN
CIA
L IN
C.
IGM FINANCIAL INC. FIRST QUARTER REPORT 2018 / MANAGEMENT’S DISCUSSION AND ANALYSIS 23
• Mackenzie Conservative Income ETF Portfolio
• Mackenzie Conservative ETF Portfolio
• Mackenzie Balanced ETF Portfolio
• Mackenzie Moderate Growth ETF Portfolio
• Mackenzie Growth ETF Portfolio
On March 28, 2018, Mackenzie announced a new simplified and more accessible pricing structure for investors, which includes some fee reductions. For investors in fee-based series, Mackenzie is eliminating Private Wealth Series and aligning fees to offer the same competitive management and administration fee for all account sizes. For investors in retail series with embedded dealer compensation, Mackenzie is simplifying Private Wealth series pricing to align management and administration fees with the fee-based series. As a result of these changes, most investors in Series F and Private Wealth series will receive lower fees and no investor will experience a fee increase. In addition, Private Wealth series will also be accessible to more investors, with a lower
minimum eligibility requirement of $100,000 (from $250,000) per household. The lower and simplified pricing structure will be available to investors June 1, 2018.
On March 28, 2018, Mackenzie announced thirteen proposed mutual fund mergers to streamline and strengthen its product shelf and make it easier for investors to navigate. The proposed mergers are expected to be implemented on or about July 6, 2018, subject to investor approval.
In May, 2018, Mackenzie announced the upcoming launch of the Mackenzie Multi-Strategy Absolute Return Fund. This fund, a first for Canadian retail investors, provides investors with access to alternative investment strategies within a mutual fund structure and offers a one-stop solution for retail investors. By diversifying in new and alternative ways, the goal of the fund is to add a component to investors’ portfolios that is not correlated with the markets and to reduce volatility by leveraging sophisticated risk allocation methodology. This fund will be managed by
TABLE 11: CHANGE IN TOTAL ASSETS UNDER MANAGEMENT – MACKENZIE(1)
% CHANGE
THREE MONTHS ENDED 2018 2017 2017 2017 2017 ($ millions) MAR. 31 DEC. 31 MAR. 31 DEC. 31 MAR. 31
Net sales (redemptions) Mutual funds(2) $ 286 $ 137 $ 76 108.8 % 276.3 % ETF net creations 715 367 114 94.8 N/M
Investment funds(3) 768 477 139 61.0 N/M
Sub-advisory, institutional and other accounts 229 1,080 117 (78.8) 95.7
Total net sales 997 1,557 256 (36.0) 289.5Investment returns (345) 2,112 1,739 N/M N/M
Net change in assets 652 3,669 1,995 (82.2) (67.3)Beginning assets 64,509 60,840 57,657 6.0 11.9
Ending assets $ 65,161 $ 64,509 $ 59,652 1.0 % 9.2 %
Consists of: Mutual funds $ 55,586 $ 55,615 $ 52,934 (0.1) % 5.0 % ETFs 2,004 1,296 234 54.6 N/M
Investment funds(4) 56,994 56,543 53,099 0.8 7.3 Sub-advisory, institutional and other accounts 8,167 7,966 6,553 2.5 24.6
Total assets under management $ 65,161 $ 64,509 $ 59,652 1.0 % 9.2 %
Average total assets(5) $ 65,233 $ 63,029 $ 58,691 3.5 % 11.1 %
(1) Effective October 1, 2017, Mackenzie segment has been redefined to exclude advisory mandates to Investors Group and investments into Mackenzie mutual funds by Investors Group mutual funds from its assets under management and net sales. These changes have been applied retroactively to provide comparability of results.
(2) During the first quarter of 2017, certain third party programs which include Mackenzie mutual funds made fund allocation changes which resulted in Mackenzie mutual fund gross sales of $313 million, redemptions of $618 million and net redemptions of $305 million.
(3) Investment fund net sales and total net sales exclude Mackenzie mutual fund investments in ETFs of $233 million for the first quarter of 2018, $27 million for the fourth quarter of 2017 and $51 million for the first quarter of 2017.
(4) Excludes Mackenzie mutual fund investments in ETFs of $596 million at March 31, 2018, $368 million at December 31, 2017 and $69 million at March 31, 2017.
(5) Based on daily average investment fund assets and month-end average sub-advisory, institutional and other assets.
C 20 POWER FINANCIAL CORPORATION�— �FIRST QUARTER REPORT 2018
PFC_QUAT1_Eng03_IGM_2018-05-05_v1.indd D20PFC_QUAT1_Eng03_IGM_2018-05-05_v1.indd D20 18-05-09 1:39 PM18-05-09 1:39 PM

PA
RT
C
IGM
FINA
NC
IAL IN
C.
24 IGM FINANCIAL INC. FIRST QUARTER REPORT 2018 / MANAGEMENT’S DISCUSSION AND ANALYSIS
Mackenzie’s Asset Allocation, Fixed Income and Systematic Strategies teams. Mackenzie’s Asset Allocation team will allocate among multiple and non-traditional strategies including long/short equity, opportunistic credit and global macro.
CHANGE IN ASSETS UNDER MANAGEMENT – Q1 2018 VS. Q1 2017
Mackenzie’s total assets under management at March 31, 2018 were $65.2 billion, an increase of 9.2% from $59.7 billion at March 31, 2017. Mackenzie’s sub-advisory, institutional and other accounts at March 31, 2018 were $8.2 billion, an increase of 24.6% from $6.6 billion last year.
Mackenzie’s investment fund assets under management were $57.0 billion at March 31, 2018, an increase of 7.3% from March 31, 2017. Mackenzie’s mutual fund assets under management were $55.6 billion at March 31, 2018, an increase of 5.0% from $52.9 billion at March 31, 2017. Mackenzie’s ETF assets were $2.0 billion at March 31, 2018, inclusive of $596 million in investments from Mackenzie mutual funds, compared to $234 million at March 31, 2017, inclusive of $69 million in investments from Mackenzie mutual funds.
In the three months ended March 31, 2018, Mackenzie’s mutual fund gross sales were $2.6 billion, a decrease of 8.1% from $2.9 billion in the comparative period last year. Mutual fund redemptions in the current quarter were $2.3 billion, a decrease of 15.8% from last year. Mutual fund net sales for the three months ended March 31, 2018 were $286 million, as compared to net sales of $76 million last year. In the three months ended March 31, 2018, ETF net creations were $715 million, inclusive of $233 million in investments from Mackenzie mutual funds compared to ETF net creations of $114 million last year, inclusive of $51 million in investments from Mackenzie mutual funds. Investment fund net sales in the current quarter were $768 million compared to net sales of $139 million last year. During the current quarter, investment returns resulted in investment fund assets decreasing by $317 million as compared to an increase of $1.5 billion last year.
During the three months ended March 31, 2017, certain third party programs, which include Mackenzie mutual funds, made fund allocation changes resulting in gross sales of $313 million, redemptions of $618 million and net redemptions of $305 million. Excluding these transactions, mutual fund gross sales increased 3.2% and mutual fund redemptions increased 8.2% in the three months ended March 31, 2018 compared to last year and mutual fund net sales were $286 million compared to mutual fund net sales of $381 million last year.
Total net sales for the three months ended March 31, 2018 were $997 million, compared to net sales of $256 million last
year. During the current quarter, investment returns resulted in assets decreasing by $345 million compared to an increase of $1.7 billion last year. Excluding the mutual fund allocation changes made by third party programs during the first quarter of 2017 discussed previously, total net sales were $997 million in the current quarter compared to net sales of $561 million last year.
Redemptions of long-term mutual funds in the three months ended March 31, 2018, were $2.2 billion compared to $2.7 billion last year. Redemptions of long-term mutual funds in the three months ended March 31, 2017 excluding the mutual fund allocation changes made by third party programs were $2.1 billion. Mackenzie’s annualized quarterly redemption rate for long-term mutual funds was 16.5% in the first quarter of 2018, compared to 21.3% in the first quarter of 2017. Mackenzie’s annualized quarterly redemption rate for long-term mutual funds excluding rebalance transactions was 16.4% in the first quarter of 2017. Mackenzie’s twelve-month trailing redemption rate for long-term mutual funds was 13.7% at March 31, 2018, as compared to 16.2% last year. Mackenzie’s twelve month trailing redemption rate for long-term funds, excluding rebalance transactions, was 13.7% at March 31, 2018 and 14.8% at March 31, 2017. The corresponding average twelve-month trailing redemption rate for long-term mutual funds for all other members of IFIC was approximately 15.8% at March 31, 2018. Mackenzie’s twelve-month trailing redemption rate is comprised of the weighted average redemption rate for front-end load assets, deferred sales charge and low load assets with redemption fees, and deferred sales charge assets without redemption fees (matured assets). Generally, redemption rates for front-end load assets and matured assets are higher than the redemption rates for deferred sales charge and low load assets with redemption fees.
CHANGE IN ASSETS UNDER MANAGEMENT – Q1 2018 VS. Q4 2017
Mackenzie’s total assets under management at March 31, 2018, were $65.2 billion, an increase of 1.0% from $64.5 billion at December 31, 2017. Mackenzie’s sub-advisory, institutional and other accounts at March 31, 2018 were $8.2 billion, an increase of 2.5% from $8.0 billion at December 31, 2017.
Mackenzie’s investment fund assets under management were $57.0 billion at March 31, 2018, an increase of 0.8% from $56.5 billion at December 31, 2017. Mackenzie’s mutual fund assets under management were $55.6 billion at March 31, 2018, a decrease of 0.1% from $55.6 billion at December 31, 2017. Mackenzie’s ETF assets were $2.0 billion at March 31, 2018, an increase of 54.6% from $1.3 billion at December 31, 2017. ETF assets include investments from Mackenzie mutual
POWER FINANCIAL CORPORATION�— �FIRST QUARTER REPORT 2018 C 21
PFC_QUAT1_Eng03_IGM_2018-05-05_v1.indd D21PFC_QUAT1_Eng03_IGM_2018-05-05_v1.indd D21 18-05-09 1:39 PM18-05-09 1:39 PM

PA
RT
C
IGM
FIN
AN
CIA
L IN
C.
IGM FINANCIAL INC. FIRST QUARTER REPORT 2018 / MANAGEMENT’S DISCUSSION AND ANALYSIS 25
funds of $596 million at March 31, 2018 and $368 million at December 31, 2017.
For the quarter ended March 31, 2018, Mackenzie mutual fund gross sales were $2.6 billion, an increase of 17.7% from the fourth quarter of 2017. Mutual fund redemptions, which totalled $2.3 billion for the first quarter, increased by 11.8% from the previous quarter. Net sales of Mackenzie mutual funds for the current quarter were $286 million compared with net sales of $137 million in the previous quarter.
Redemptions of long-term mutual fund assets in the current quarter were $2.2 billion, compared to $2.0 billion in the fourth quarter of 2017. Mackenzie’s annualized quarterly redemption rate for long-term mutual funds for the current quarter was
16.5% compared to 14.7% for the fourth quarter of 2017. Net sales of long-term funds for the current quarter were $264 million compared to net sales of $111 million in the previous quarter.
For the quarter ended March 31, 2018, Mackenzie ETF net creations were $715 million, an increase of $348 million from the fourth quarter of 2017. In the current quarter, ETF net creations were inclusive of $233 million in investments from Mackenzie mutual funds compared to $27 million in the fourth quarter.
Investment fund net sales in the current quarter were $768 million compared to net sales of $477 million in the fourth quarter.
REVIEW OF SEGMENT OPERATING RESULTS
In October 2017, the investment management functions of Investors Group and Mackenzie consolidated to form a single global investment management organization under Mackenzie to support both companies. As previously discussed, effective October 1, 2017, Mackenzie’s segment excludes investment advisory mandates to Investors Group funds and investments into Mackenzie mutual funds by Investors Group mutual funds. Revenue earned on these mandates are no longer reflected
within Mackenzie’s segment revenues. With these changes, Mackenzie’s segment will reflect its proportionate share of the expenses of the investment management function which better aligns with internal management reporting. The impact of these changes in segment earnings is not significant. Prior period earnings have not been restated.
Mackenzie’s earnings before interest and taxes are presented in Table 12.
TABLE 12: OPERATING RESULTS – MACKENZIE
% CHANGE
THREE MONTHS ENDED 2018 2017 2017 2017 2017 ($ millions) MAR. 31 DEC. 31 MAR. 31 DEC. 31 MAR. 31
Revenues Management fees $ 175.9 $ 177.4 $ 171.8 (0.8) % 2.4 % Administration fees 24.9 25.3 24.4 (1.6) 2.0 Distribution fees 2.1 1.8 2.3 16.7 (8.7)
202.9 204.5 198.5 (0.8) 2.2 Net investment income and other (0.2) 3.3 0.1 N/M N/M
202.7 207.8 198.6 (2.5) 2.1
Expenses Commission 9.9 11.1 12.6 (10.8) (21.4) Trailing commission 65.4 64.6 62.0 1.2 5.5 Non-commission 85.8 82.0 82.5 4.6 4.0
161.1 157.7 157.1 2.2 2.5
Earnings before interest and taxes $ 41.6 $ 50.1 $ 41.5 (17.0) % 0.2 %
C 22 POWER FINANCIAL CORPORATION�— �FIRST QUARTER REPORT 2018
PFC_QUAT1_Eng03_IGM_2018-05-05_v1.indd D22PFC_QUAT1_Eng03_IGM_2018-05-05_v1.indd D22 18-05-09 1:39 PM18-05-09 1:39 PM

PA
RT
C
IGM
FINA
NC
IAL IN
C.
26 IGM FINANCIAL INC. FIRST QUARTER REPORT 2018 / MANAGEMENT’S DISCUSSION AND ANALYSIS
Q1 2018 VS. Q1 2017
REVENUES
The largest component of Mackenzie’s revenues is management fees. The amount of management fees depends on the level and composition of assets under management. Management fee rates vary depending on the investment objective and the account type of the underlying assets under management. For example, equity-based mandates have higher management fee rates than fixed income mandates and retail mutual fund accounts have higher management fee rates than sub-advised and institutional accounts. The majority of Mackenzie’s mutual fund assets are purchased on a retail basis.
Within Mackenzie’s retail mutual fund offering, certain series are offered for fee-based programs of participating dealers whereby dealer compensation on such series is charged directly by the dealer to a client (primarily Series F and PWF). As Mackenzie does not pay the dealer compensation, these series have lower management fees. At March 31, 2018, these series had $7.4 billion in assets, an increase of 34.3% from the prior year.
Management fees were $175.9 million for the three months ended March 31, 2018, an increase of $4.1 million or 2.4% from $171.8 million last year. As discussed earlier, advisory mandates to Investors Group funds and investments into Mackenzie mutual funds by Investors Group mutual funds were excluded from the Mackenzie segment effective October 1, 2017. When adjusted to remove these fees from Investors Group, prior period management fees were $167.2 million. Average assets under management were $65.2 billion during the current quarter compared to $58.7 billion last year, an increase of 11.1%. Mackenzie’s average management fee rate was 109.4 basis points during the current quarter compared to 115.5 basis points in 2017 when adjusted to exclude these fees from Investors Group funds. The decrease in the average management fee rate in the current quarter was due to a change in the composition of assets under management, including the impact of having a greater share in non-retail priced products and Series F, the impact of automatic switching of qualified investors into its Private Wealth Series and a 24.6% increase in lower margin sub-advisory, institutional and other accounts.
Mackenzie earns administration fees primarily from providing services to its investment funds. Administration fees were $24.9 million for the three months ended March 31, 2018, an increase of $0.5 million or 2.0% from $24.4 million last year.
Mackenzie earns distribution fee income on redemptions of mutual fund assets sold on a deferred sales charge purchase option and on a low load purchase option. Redemption fees charged for deferred sales charge assets range from 5.5% in the
first year and decrease to zero after seven years. Redemption fees for low load assets range from 2.0% to 3.0% in the first year and decrease to zero after two or three years, depending on the purchase option. Distribution fee income in the three months ended March 31, 2018 was $2.1 million, compared to $2.3 million last year.
Net investment income and other includes investment returns related to Mackenzie’s investments in proprietary funds. These investments are generally made in the process of launching a fund and are sold as third party investors subscribe. Net investment income and other was ($0.2) million for the three months ended March 31, 2018 compared to $0.1 million last year.
EXPENSES
Mackenzie’s expenses were $161.1 million for the three months ended March 31, 2018, an increase of $4.0 million or 2.5% from $157.1 million in 2017.
Mackenzie pays selling commissions to the dealers that sell its mutual funds on a deferred sales charge and low load purchase option. Prior to January 1, 2018, commissions paid on the sale of mutual funds were capitalized and amortized over a maximum period of seven years. As of January 1, 2018, as a result of the adoption of IFRS 15, commissions paid are expensed as incurred.
Commission expense was $9.9 million in the three months ended March 31, 2018, as compared to $12.6 million last year. The decrease related to less cash commissions paid being expensed in the current quarter as compared to the amortization of commissions in 2017 that had previously been capitalized and amortized, prior to the implementation of IFRS 15.
Trailing commissions paid to dealers are paid on certain classes of retail mutual funds and are calculated as a percentage of mutual fund assets under management. These fees vary depending on the fund type and the purchase option upon which the fund was sold: front-end, deferred sales charge or low load. Trailing commissions were $65.4 million in the three months ended March 31, 2018, an increase of $3.4 million or 5.5% from $62.0 million last year. The increase in trailing commissions in the three months ended March 31, 2018 resulted from the period over period increase in average mutual fund assets offset, in part, by a decline in the effective trailing commission rate. Trailing commissions as a percentage of average mutual fund assets under management was 46.8 basis points in the three months ended March 31, 2018 compared to 47.5 basis points in the three months ended March 31, 2017. The decline was due to a change in composition of mutual fund assets towards series of mutual funds that do not pay trail commissions.
POWER FINANCIAL CORPORATION�— �FIRST QUARTER REPORT 2018 C 23
PFC_QUAT1_Eng03_IGM_2018-05-05_v1.indd D23PFC_QUAT1_Eng03_IGM_2018-05-05_v1.indd D23 18-05-09 1:39 PM18-05-09 1:39 PM

PA
RT
C
IGM
FIN
AN
CIA
L IN
C.
IGM FINANCIAL INC. FIRST QUARTER REPORT 2018 / MANAGEMENT’S DISCUSSION AND ANALYSIS 27
Non-commission expenses are incurred by Mackenzie in the administration, marketing and management of its assets under management. Non-commission expenses were $85.8 million in the three months ended March 31, 2018, an increase of $3.3 million or 4.0% from $82.5 million in 2017.
Q1 2018 VS. Q4 2017
REVENUES
Mackenzie’s revenues were $202.7 million for the current quarter, a decrease of $5.1 million or 2.5% from $207.8 million in the fourth quarter.
Management fees were $175.9 million for the current quarter, a decrease of $1.5 million or 0.8% from $177.4 million in the fourth quarter. Factors contributing to the net decrease in management fees are as follows:
• Average assets under management were $65.2 billion in the current quarter, a 3.5% increase from $63.0 billion in the prior quarter.
• Mackenzie’s average management fee rate was 109.4 basis points in the current quarter compared to 111.6 basis points in the fourth quarter.
• There were two fewer calendar days in the first quarter of 2018 compared to the fourth quarter of 2017, which resulted in a decrease of $3.9 million.
Administration fees were $24.9 million in the current quarter, a decrease of $0.4 million or 1.6% from $25.3 million in the prior quarter.
Net investment income and other includes investment returns related to Mackenzie’s investments in proprietary funds. Net investment income and other was ($0.2) million for the current quarter compared to $3.3 million in the fourth quarter.
EXPENSES
Mackenzie’s expenses were $161.1 million for the current quarter, an increase of $3.4 million or 2.2% from $157.7 million in the fourth quarter.
Commission expense related to the amortization of selling commissions was $9.9 million in the quarter ended March 31, 2018, a decrease of 10.8% from the fourth quarter. The decrease primarily related to less cash commissions paid being expensed in the current quarter as compared to the amortization of commissions in the prior quarter that had previously been capitalized and amortized, prior to the implementation of IFRS 15.
Trailing commissions were $65.4 million in the current quarter, an increase of $0.8 million or 1.2% from $64.6 million in the fourth quarter. The change in trailing commissions reflects the 1.8% period over period increase in average mutual fund assets under management, offset, in part, by a decline in the effective trailing commission rate. The effective trailing commission rate was 46.8 basis points in the current quarter compared to 47.0 basis points in the fourth quarter.
Non-commission expenses were $85.8 million in the current quarter, compared to $82.0 million in the fourth quarter. The increase was partially due to the seasonal nature of certain expenses normally incurred in the first quarter.
C 24 POWER FINANCIAL CORPORATION�— �FIRST QUARTER REPORT 2018
PFC_QUAT1_Eng03_IGM_2018-05-05_v1.indd D24PFC_QUAT1_Eng03_IGM_2018-05-05_v1.indd D24 18-05-09 1:39 PM18-05-09 1:39 PM

PA
RT
C
IGM
FINA
NC
IAL IN
C.
28 IGM FINANCIAL INC. FIRST QUARTER REPORT 2018 / MANAGEMENT’S DISCUSSION AND ANALYSIS
CORPORATE AND OTHERREVIEW OF SEGMENT OPERATING RESULTS
The Corporate and Other segment includes net investment income not allocated to the Investors Group or Mackenzie segments, the Company’s proportionate share of earnings of its associates, Great-West Lifeco Inc. (Lifeco) and China Asset Management Co., Ltd. (China AMC), operating results for Investment Planning Counsel Inc., other income, as well as consolidation elimination entries.
The Company’s investment in China AMC closed on August 31, 2017.
The Company also has investments in Personal Capital Corporation, Wealthsimple Financial Corporation and Portag3 Ventures LP.
Corporate and other earnings before interest and taxes are presented in Table 13.
Q1 2018 VS. Q1 2017The proportionate share of associates’ earnings increased by $10.0 million in the first quarter of 2018 compared to 2017.
These earnings reflect equity earnings from Lifeco for both periods under review and from China AMC in 2018, as discussed in the Consolidated Financial Position section of this MD&A. Net investment income and other increased to $4.0 million in the first quarter of 2018 compared to $1.7 million in 2017.
Earnings before interest and taxes related to Investment Planning Counsel were $1.3 million higher in the first quarter of 2018 compared to the same period in 2017.
Q1 2018 VS. Q4 2017The proportionate share of associates’ earnings were $38.0 million in the first quarter of 2018, an increase of $1.1 million from the fourth quarter of 2017. Net investment income and other increased to $4.0 million in the first quarter of 2018 compared to $0.2 million in the fourth quarter.
Earnings before interest and taxes related to Investment Planning Counsel were $2.1 million lower in the first quarter of 2018 compared to the prior quarter.
TABLE 13: OPERATING RESULTS – CORPORATE AND OTHER
% CHANGE
THREE MONTHS ENDED 2018 2017 2017 2017 2017 ($ millions) MAR. 31 DEC. 31 MAR. 31 DEC. 31 MAR. 31
Revenues Fee income $ 72.4 $ 72.4 $ 65.3 – % 10.9 % Net investment income and other 4.0 0.2 1.7 N/M 135.3 Proportionate share of associates’ earnings 38.0 36.9 28.0 3.0 35.7
114.4 109.5 95.0 4.5 20.4
Expenses Commission 46.0 46.7 45.1 (1.5) 2.0 Non-commission 22.6 19.5 16.7 15.9 35.3
68.6 66.2 61.8 3.6 11.0
Earnings before interest and taxes $ 45.8 $ 43.3 $ 33.2 5.8 % 38.0 %
POWER FINANCIAL CORPORATION�— �FIRST QUARTER REPORT 2018 C 25
PFC_QUAT1_Eng03_IGM_2018-05-05_v1.indd D25PFC_QUAT1_Eng03_IGM_2018-05-05_v1.indd D25 18-05-09 1:39 PM18-05-09 1:39 PM

PA
RT
C
IGM
FIN
AN
CIA
L IN
C.
IGM FINANCIAL INC. FIRST QUARTER REPORT 2018 / MANAGEMENT’S DISCUSSION AND ANALYSIS 29
IGM Financial’s total assets were $15.7 billion at March 31, 2018, compared to $16.5 billion at December 31, 2017.
SECURITIESThe composition of the Company’s securities holdings is detailed in Table 14.
As a result of the adoption of IFRS 9 (Note 2 to the Interim Financial Statements), securities of $19.9 million were reclassified from available for sale to fair value through profit or loss (FVTPL) and the Company elected to classify securities of $262.8 million at fair value through other comprehensive income (FVTOCI).
FAIR VALUE THROUGH OTHER COMPREHENSIVE INCOME
Gains and losses on FVTOCI securities are recorded in Other comprehensive income.
Corporate Investments
Corporate investments is primarily comprised of the Company’s investments in Personal Capital Corporation (Personal Capital), Wealthsimple Financial Corporation (Wealthsimple) and Portag3 Ventures LP (Portag3).
In the first quarter of 2018, the Company increased its investment in Wealthsimple by a total of $45.0 million including the conversion of a $15.0 million loan to equity.
FAIR VALUE THROUGH PROFIT OR LOSS
Securities classified as FVTPL include equity securities and proprietary investment funds. Gains and losses are recorded in Net investment income and other in the Consolidated Statements of Earnings.
Certain proprietary investment funds are consolidated where the Company has made the assessment that it controls the investment fund. The underlying securities of these funds are classified as FVTPL.
LOANS The composition of the Company’s loans is detailed in Table 15.
Loans consisted of residential mortgages and represented 50.2% of total assets at March 31, 2018, compared to 47.6% at December 31, 2017.
Loans measured at amortized cost are primarily comprised of residential mortgages sold to securitization programs sponsored by third parties that in turn issue securities to investors. An offsetting liability, Obligations to securitization entities, has been recorded and totalled $7.6 billion at March 31, 2018, unchanged from December 31, 2017.
Loans measured at fair value through profit or loss are residential mortgages held temporarily by the Company pending sale. Upon adoption of IFRS 9, $282.6 million of the $286.7 million loans classified as held for trading at fair value through profit or loss were reclassified to loans measured at amortized cost.
Residential mortgages originated by Investors Group are funded primarily through sales to third parties on a fully serviced basis, including Canada Mortgage and Housing Corporation (CMHC) or Canadian bank sponsored securitization programs. Investors Group services $13.2 billion of residential mortgages, including $2.5 billion originated by subsidiaries of Lifeco.
IGM FINANCIAL INC.CONSOLIDATED FINANCIAL POSITION
TABLE 14: SECURITIES
MARCH 31, 2018 DECEMBER 31, 2017 ($ millions) COST FAIR VALUE COST FAIR VALUE
Available for sale Corporate investments $ N/A $ N/A $ 215.0 $ 262.8 Proprietary investment funds N/A N/A 19.6 19.9
N/A N/A 234.6 282.7
Fair value through other comprehensive income Corporate investments 262.2 306.8 N/A N/A
Fair value through profit or loss Equity securities 18.4 17.3 17.1 17.1 Proprietary investment funds 97.8 97.8 79.6 79.9
116.2 115.1 96.7 97.0
$ 378.4 $ 421.9 $ 331.3 $ 379.7
C 26 POWER FINANCIAL CORPORATION�— �FIRST QUARTER REPORT 2018
PFC_QUAT1_Eng03_IGM_2018-05-05_v1.indd D26PFC_QUAT1_Eng03_IGM_2018-05-05_v1.indd D26 18-05-09 1:39 PM18-05-09 1:39 PM

PA
RT
C
IGM
FINA
NC
IAL IN
C.
30 IGM FINANCIAL INC. FIRST QUARTER REPORT 2018 / MANAGEMENT’S DISCUSSION AND ANALYSIS
interest rate risk, can be found in the Financial Risk section of this MD&A and in Note 5 of the Interim Financial Statements.
INVESTMENT IN ASSOCIATESGREAT-WEST LIFECO INC. (LIFECO)
At March 31, 2018 the Company held a 4% equity interest in Lifeco. IGM Financial and Lifeco are controlled by Power Financial Corporation.
The equity method is used to account for IGM Financial’s investment in Lifeco, as it exercises significant influence. The Company’s proportionate share of Lifeco’s earnings is recorded in Net investment income and other in the Corporate and other reportable segment (Tables 2-3). Changes in the carrying value for the three months ended March 31, 2018 compared with 2017 are shown in Table 16.
CHINA ASSET MANAGEMENT CO., LTD. (CHINA AMC)
Founded in 1998 as one of the first fund management companies in China, China AMC has developed and maintained a position among the market leaders in China’s asset management industry.
China AMC’s total assets under management, excluding subsidiary assets under management, were RMB¥ 869.6 billion ($167.9 billion) at December 31, 2017, representing an increase of 4.0% (CAD$ increase of 5.0%) from RMB¥ 836.4 billion ($159.9 billion) at June 30, 2017.
The equity method is used to account for the Company’s 13.9% equity interest in China AMC, as it exercises significant influence. The Company’s proportionate share of China AMC’s earnings is recorded in Net investment income and other in the Corporate and other reportable segment (Tables 2-3). Changes in the carrying value for the quarter ended March 31, 2018 are shown in Table 16.
SECURITIZATION ARRANGEMENTSThrough the Company’s mortgage banking operations, residential mortgages originated by Investors Group mortgage planning specialists are sold to securitization trusts sponsored by third parties that in turn issue securities to investors. The Company securitizes residential mortgages through the CMHC sponsored National Housing Act Mortgage-Backed Securities (NHA MBS) and the Canada Mortgage Bond Program (CMB Program) and through Canadian bank-sponsored asset-backed commercial paper (ABCP) programs. The Company retains servicing responsibilities and certain elements of credit risk and prepayment risk associated with the transferred assets. The Company’s credit risk on its securitized mortgages is mitigated through the use of insurance. Derecognition of financial assets in accordance with IFRS is based on the transfer of risks and rewards of ownership. As the Company has retained prepayment risk and certain elements of credit risk associated with the Company’s securitization transactions through the CMB and ABCP programs, they are accounted for as secured borrowings. The Company records the transactions under these programs as follows: (i) the mortgages and related obligations are carried at amortized cost, with interest income and interest expense, utilizing the effective interest rate method, recorded over the term of the mortgages, (ii) the component of swaps entered into under the CMB Program whereby the Company pays coupons on Canada Mortgage Bonds and receives investment returns on the reinvestment of repaid mortgage principal, are recorded at fair value, and (iii) cash reserves held under the ABCP program are carried at amortized cost.
In the first quarter of 2018, the Company securitized loans through its mortgage banking operations with cash proceeds of $369.4 million compared to $323.2 million in 2017. Additional information related to the Company’s securitization activities, including the Company’s hedges of related reinvestment and
TABLE 15: LOANS
2018 2017 ($ millions) MARCH 31 DECEMBER 31
Amortized cost $ 7,869.3 $ 7,564.0 Less: Allowance for expected credit losses 0.8 0.8
7,868.5 7,563.2Fair value through profit or loss 14.8 286.7
$ 7,883.3 $ 7,849.9
POWER FINANCIAL CORPORATION�— �FIRST QUARTER REPORT 2018 C 27
PFC_QUAT1_Eng03_IGM_2018-05-05_v1.indd D27PFC_QUAT1_Eng03_IGM_2018-05-05_v1.indd D27 18-05-09 1:39 PM18-05-09 1:39 PM

PA
RT
C
IGM
FIN
AN
CIA
L IN
C.
IGM FINANCIAL INC. FIRST QUARTER REPORT 2018 / MANAGEMENT’S DISCUSSION AND ANALYSIS 31
LIQUIDITYCash and cash equivalents totalled $778.2 million at March 31, 2018 compared with $966.8 million at December 31, 2017. Cash and cash equivalents related to the Company’s deposit operations were $2.4 million at March 31, 2018, compared to $3.3 million at December 31, 2017, as shown in Table 17.
Working capital totalled $560.0 million at March 31, 2018 compared with $786.1 million at December 31, 2017 and $1,021.8 million at March 31, 2017. Working capital excludes the Company’s deposit operations. The decrease in the first
quarter resulted primarily from the adoption of IFRS 9 which included the reclassification of certain loans from current assets to long-term assets.
Working capital is utilized to:
• Finance ongoing operations, including the funding of sales commissions.
• Temporarily finance mortgages in its mortgage banking operations.
• Pay interest and dividends related to long-term debt and preferred shares.
CONSOLIDATED LIQUIDITY AND CAPITAL RESOURCES
TABLE 17: DEPOSIT OPERATIONS – FINANCIAL POSITION
2018 2017 2017 ($ millions) MAR. 31 DEC. 31 MAR. 31
Assets Cash and cash equivalents $ 2.4 $ 3.3 $ 2.3 Client funds on deposit 454.8 489.6 431.5 Accounts and other receivables 4.2 0.8 1.6 Loans 22.5 21.7 26.7
Total assets $ 483.9 $ 515.4 $ 462.1
Liabilities and shareholders’ equity Deposit liabilities $ 473.1 $ 505.0 $ 451.3 Other liabilities 0.5 0.5 0.5 Shareholders’ equity 10.3 9.9 10.3
Total liabilities and shareholders’ equity $ 483.9 $ 515.4 $ 462.1
TABLE 16: INVESTMENT IN ASSOCIATES
THREE MONTHS ENDED 2018 2017 ($ millions) MAR. 31 MAR. 31
LIFECO CHINA AMC TOTAL TOTAL
Carrying value, beginning of period As previously reported $ 903.1 $ 647.9 $ 1,551.0 $ 888.9 Change in accounting policy (IFRS 15) (1.7) – (1.7) –
901.4 647.9 1,549.3 888.9 Proportionate share of earnings 30.3 7.8 38.1 28.0 Dividends received (15.5) – (15.5) (14.6) Proportionate share of other comprehensive income (loss) and other adjustments 5.8 38.8 44.6 9.0
Carrying value, end of period $ 922.0 $ 694.5 $ 1,616.5 $ 911.3
C 28 POWER FINANCIAL CORPORATION�— �FIRST QUARTER REPORT 2018
PFC_QUAT1_Eng03_IGM_2018-05-05_v1.indd D28PFC_QUAT1_Eng03_IGM_2018-05-05_v1.indd D28 18-05-09 1:39 PM18-05-09 1:39 PM
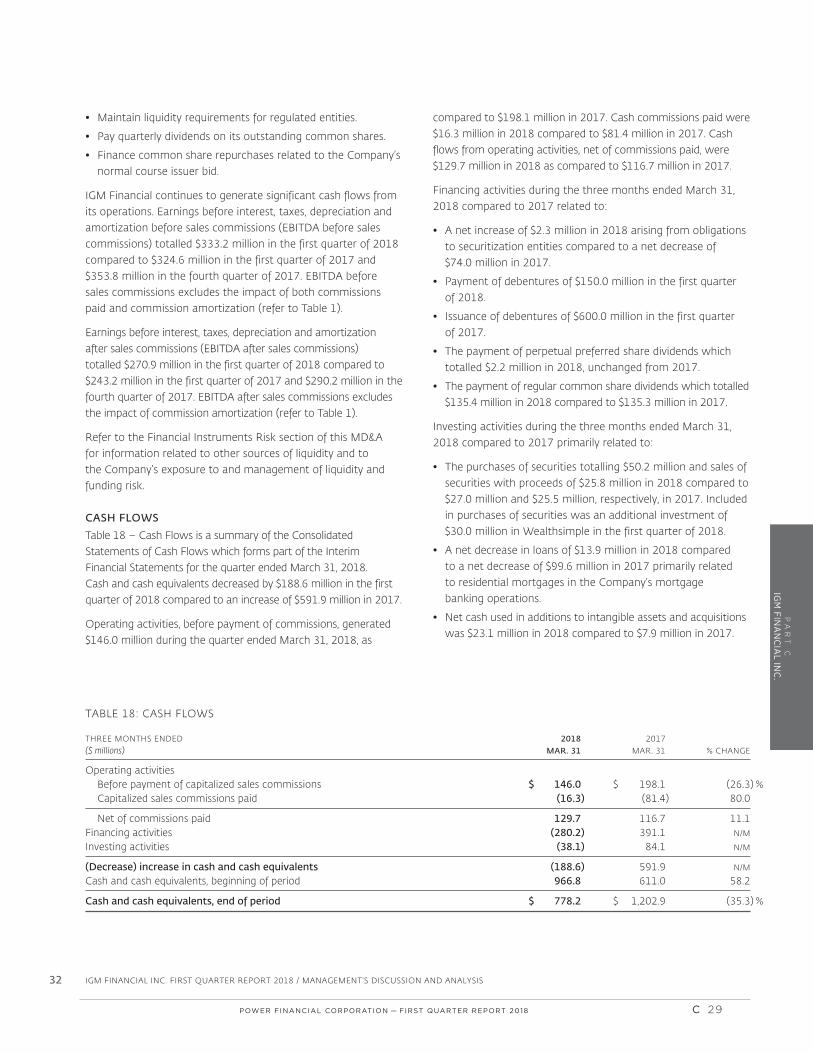
PA
RT
C
IGM
FINA
NC
IAL IN
C.
32 IGM FINANCIAL INC. FIRST QUARTER REPORT 2018 / MANAGEMENT’S DISCUSSION AND ANALYSIS
• Maintain liquidity requirements for regulated entities.
• Pay quarterly dividends on its outstanding common shares.
• Finance common share repurchases related to the Company’s normal course issuer bid.
IGM Financial continues to generate significant cash flows from its operations. Earnings before interest, taxes, depreciation and amortization before sales commissions (EBITDA before sales commissions) totalled $333.2 million in the first quarter of 2018 compared to $324.6 million in the first quarter of 2017 and $353.8 million in the fourth quarter of 2017. EBITDA before sales commissions excludes the impact of both commissions paid and commission amortization (refer to Table 1).
Earnings before interest, taxes, depreciation and amortization after sales commissions (EBITDA after sales commissions) totalled $270.9 million in the first quarter of 2018 compared to $243.2 million in the first quarter of 2017 and $290.2 million in the fourth quarter of 2017. EBITDA after sales commissions excludes the impact of commission amortization (refer to Table 1).
Refer to the Financial Instruments Risk section of this MD&A for information related to other sources of liquidity and to the Company’s exposure to and management of liquidity and funding risk.
CASH FLOWS
Table 18 – Cash Flows is a summary of the Consolidated Statements of Cash Flows which forms part of the Interim Financial Statements for the quarter ended March 31, 2018. Cash and cash equivalents decreased by $188.6 million in the first quarter of 2018 compared to an increase of $591.9 million in 2017.
Operating activities, before payment of commissions, generated $146.0 million during the quarter ended March 31, 2018, as
compared to $198.1 million in 2017. Cash commissions paid were $16.3 million in 2018 compared to $81.4 million in 2017. Cash flows from operating activities, net of commissions paid, were $129.7 million in 2018 as compared to $116.7 million in 2017.
Financing activities during the three months ended March 31, 2018 compared to 2017 related to:
• A net increase of $2.3 million in 2018 arising from obligations to securitization entities compared to a net decrease of $74.0 million in 2017.
• Payment of debentures of $150.0 million in the first quarter of 2018.
• Issuance of debentures of $600.0 million in the first quarter of 2017.
• The payment of perpetual preferred share dividends which totalled $2.2 million in 2018, unchanged from 2017.
• The payment of regular common share dividends which totalled $135.4 million in 2018 compared to $135.3 million in 2017.
Investing activities during the three months ended March 31, 2018 compared to 2017 primarily related to:
• The purchases of securities totalling $50.2 million and sales of securities with proceeds of $25.8 million in 2018 compared to $27.0 million and $25.5 million, respectively, in 2017. Included in purchases of securities was an additional investment of $30.0 million in Wealthsimple in the first quarter of 2018.
• A net decrease in loans of $13.9 million in 2018 compared to a net decrease of $99.6 million in 2017 primarily related to residential mortgages in the Company’s mortgage banking operations.
• Net cash used in additions to intangible assets and acquisitions was $23.1 million in 2018 compared to $7.9 million in 2017.
TABLE 18: CASH FLOWS
THREE MONTHS ENDED 2018 2017 ($ millions) MAR. 31 MAR. 31 % CHANGE
Operating activities Before payment of capitalized sales commissions $ 146.0 $ 198.1 (26.3) % Capitalized sales commissions paid (16.3) (81.4) 80.0
Net of commissions paid 129.7 116.7 11.1Financing activities (280.2) 391.1 N/M
Investing activities (38.1) 84.1 N/M
(Decrease) increase in cash and cash equivalents (188.6) 591.9 N/M
Cash and cash equivalents, beginning of period 966.8 611.0 58.2
Cash and cash equivalents, end of period $ 778.2 $ 1,202.9 (35.3) %
POWER FINANCIAL CORPORATION�— �FIRST QUARTER REPORT 2018 C 29
PFC_QUAT1_Eng03_IGM_2018-05-05_v1.indd D29PFC_QUAT1_Eng03_IGM_2018-05-05_v1.indd D29 18-05-09 1:39 PM18-05-09 1:39 PM

PA
RT
C
IGM
FIN
AN
CIA
L IN
C.
IGM FINANCIAL INC. FIRST QUARTER REPORT 2018 / MANAGEMENT’S DISCUSSION AND ANALYSIS 33
CAPITAL RESOURCESThe Company’s capital management objective is to maximize shareholder returns while ensuring that the Company is capitalized in a manner which appropriately supports regulatory requirements, working capital needs and business expansion. The Company’s capital management practices are focused on preserving the quality of its financial position by maintaining a solid capital base and a strong balance sheet. Capital of the Company consists of long-term debt, perpetual preferred shares and common shareholders’ equity which totalled $6.5 billion at March 31, 2018, compared to $7.0 billion at December 31, 2017. The reduction in Shareholders’ equity in the quarter was largely due to the adoption of IFRS 15 which resulted in an adjustment to opening retained earnings of $514.6 million in the quarter. The Company regularly assesses its capital management practices in response to changing economic conditions.
The Company’s capital is primarily utilized in its ongoing business operations to support working capital requirements, long-term investments made by the Company, business expansion and other strategic objectives. Subsidiaries subject to regulatory capital requirements include investment dealers, mutual fund dealers, exempt market dealers, portfolio managers, investment fund managers and a trust company. These subsidiaries are required to maintain minimum levels of capital based on either working capital, liquidity or shareholders’ equity. The Company’s subsidiaries have complied with all regulatory capital requirements.
The total outstanding long-term debt was $2,025.0 million at March 31, 2018, compared to $2,175.0 million at December 31, 2017. The decrease of $150.0 million is related to the maturity of the Company’s 6.58% debentures which were due and repaid on March 7, 2018. Long-term debt is comprised of debentures which are senior unsecured debt obligations of the Company subject to standard covenants, including negative pledges, but which do not include any specified financial or operational covenants.
Perpetual preferred shares of $150 million at March 31, 2018 remain unchanged from December 31, 2017.
The Company commenced a normal course issuer bid on March 20, 2017, which was effective until March 19, 2018, to purchase up to 5% of its common shares in order to mitigate the dilutive effect of stock options issued under the Company’s stock option plan and for other capital management purposes. There were no common shares purchased by the Company during 2017 and 2018 (refer to Note 9 to the Interim Financial Statements).
Other activities in 2018 included the declaration of perpetual preferred share dividends of $2.2 million or $0.36875 per share and common share dividends of $135.5 million or $0.5625 per
share. Changes in common share capital are reflected in the Consolidated Statements of Changes in Shareholders’ Equity.
Standard & Poor’s (S&P) current rating on the Company’s senior unsecured debentures is “A” with a stable outlook. Dominion Bond Rating Service’s (DBRS) current rating on the Company’s senior unsecured debentures is “A (High)” with a stable rating trend.
Credit ratings are intended to provide investors with an independent measure of the credit quality of the securities of a company and are indicators of the likelihood of payment and the capacity of a company to meet its obligations in accordance with the terms of each obligation. Descriptions of the rating categories for each of the agencies set forth below have been obtained from the respective rating agencies’ websites.
These ratings are not a recommendation to buy, sell or hold the securities of the Company and do not address market price or other factors that might determine suitability of a specific security for a particular investor. The ratings also may not reflect the potential impact of all risks on the value of securities and are subject to revision or withdrawal at any time by the rating organization.
The A rating assigned to IGM Financial’s senior unsecured debentures by S&P is the sixth highest of the 22 ratings used for long-term debt. This rating indicates S&P’s view that the Company’s capacity to meet its financial commitment on the obligation is strong, but the obligation is somewhat more susceptible to the adverse effects of changes in circumstances and economic conditions than obligations in higher rated categories.
The A (High) rating assigned to IGM Financial’s senior unsecured debentures by DBRS is the fifth highest of the 26 ratings used for long-term debt. Under the DBRS long-term rating scale, debt securities rated A (High) are of good credit quality and the capacity for the payment of financial obligations is substantial. While this is a favourable rating, entities in the A (High) category may be vulnerable to future events, but qualifying negative factors are considered manageable.
FINANCIAL INSTRUMENTS Table 19 presents the carrying amounts and fair values of financial assets and financial liabilities. The table excludes fair value information for financial assets and financial liabilities not measured at fair value if the carrying amount is a reasonable approximation of fair value. These items include cash and cash equivalents, accounts and other receivables, certain other financial assets, accounts payable and accrued liabilities, and certain other financial liabilities.
C 30 POWER FINANCIAL CORPORATION�— �FIRST QUARTER REPORT 2018
PFC_QUAT1_Eng03_IGM_2018-05-05_v1.indd D30PFC_QUAT1_Eng03_IGM_2018-05-05_v1.indd D30 18-05-09 1:39 PM18-05-09 1:39 PM
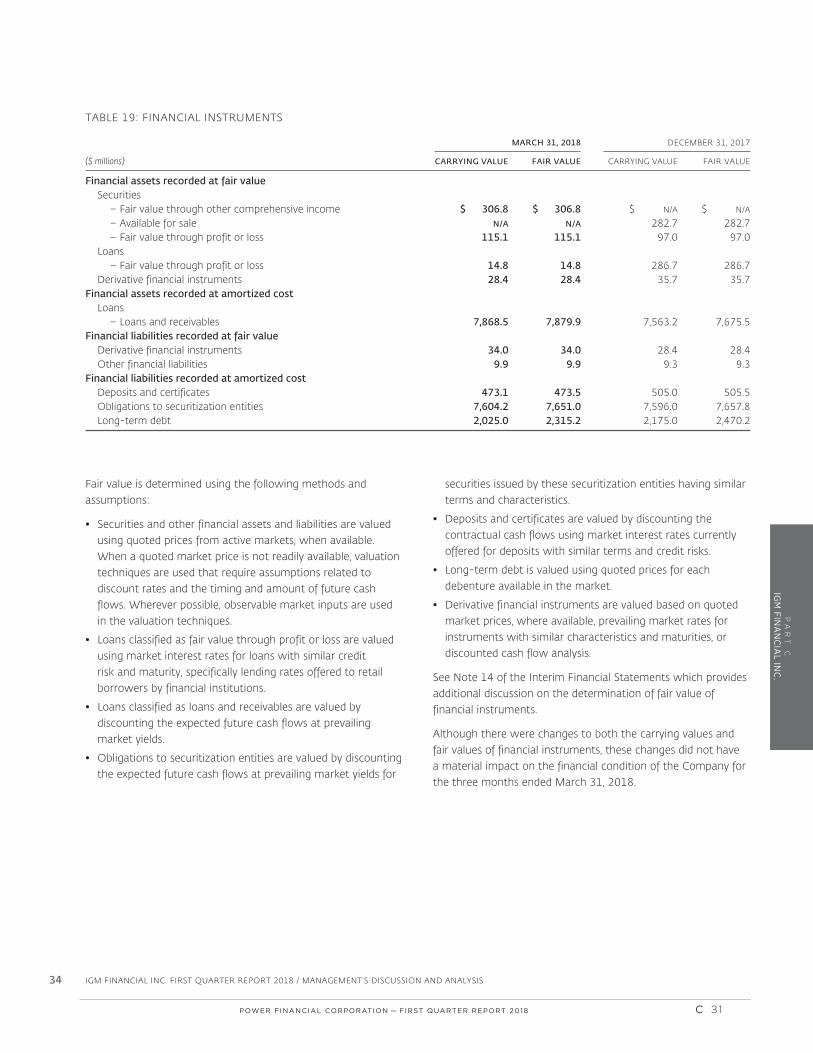
PA
RT
C
IGM
FINA
NC
IAL IN
C.
34 IGM FINANCIAL INC. FIRST QUARTER REPORT 2018 / MANAGEMENT’S DISCUSSION AND ANALYSIS
Fair value is determined using the following methods and assumptions:
• Securities and other financial assets and liabilities are valued using quoted prices from active markets, when available. When a quoted market price is not readily available, valuation techniques are used that require assumptions related to discount rates and the timing and amount of future cash flows. Wherever possible, observable market inputs are used in the valuation techniques.
• Loans classified as fair value through profit or loss are valued using market interest rates for loans with similar credit risk and maturity, specifically lending rates offered to retail borrowers by financial institutions.
• Loans classified as loans and receivables are valued by discounting the expected future cash flows at prevailing market yields.
• Obligations to securitization entities are valued by discounting the expected future cash flows at prevailing market yields for
securities issued by these securitization entities having similar terms and characteristics.
• Deposits and certificates are valued by discounting the contractual cash flows using market interest rates currently offered for deposits with similar terms and credit risks.
• Long-term debt is valued using quoted prices for each debenture available in the market.
• Derivative financial instruments are valued based on quoted market prices, where available, prevailing market rates for instruments with similar characteristics and maturities, or discounted cash flow analysis.
See Note 14 of the Interim Financial Statements which provides additional discussion on the determination of fair value of financial instruments.
Although there were changes to both the carrying values and fair values of financial instruments, these changes did not have a material impact on the financial condition of the Company for the three months ended March 31, 2018.
TABLE 19: FINANCIAL INSTRUMENTS
MARCH 31, 2018 DECEMBER 31, 2017 ($ millions) CARRYING VALUE FAIR VALUE CARRYING VALUE FAIR VALUE
Financial assets recorded at fair value Securities – Fair value through other comprehensive income $ 306.8 $ 306.8 $ N/A $ N/A
– Available for sale N/A N/A 282.7 282.7 – Fair value through profit or loss 115.1 115.1 97.0 97.0 Loans – Fair value through profit or loss 14.8 14.8 286.7 286.7 Derivative financial instruments 28.4 28.4 35.7 35.7Financial assets recorded at amortized cost Loans – Loans and receivables 7,868.5 7,879.9 7,563.2 7,675.5Financial liabilities recorded at fair value Derivative financial instruments 34.0 34.0 28.4 28.4 Other financial liabilities 9.9 9.9 9.3 9.3Financial liabilities recorded at amortized cost Deposits and certificates 473.1 473.5 505.0 505.5 Obligations to securitization entities 7,604.2 7,651.0 7,596.0 7,657.8 Long-term debt 2,025.0 2,315.2 2,175.0 2,470.2
POWER FINANCIAL CORPORATION�— �FIRST QUARTER REPORT 2018 C 31
PFC_QUAT1_Eng03_IGM_2018-05-05_v1.indd D31PFC_QUAT1_Eng03_IGM_2018-05-05_v1.indd D31 18-05-09 1:39 PM18-05-09 1:39 PM

PA
RT
C
IGM
FIN
AN
CIA
L IN
C.
IGM FINANCIAL INC. FIRST QUARTER REPORT 2018 / MANAGEMENT’S DISCUSSION AND ANALYSIS 35
The Company is exposed to a variety of risks that are inherent in its business activities. Its ability to manage these risks is key to its ongoing success. The Company emphasizes a strong risk management culture and the implementation of an effective risk management approach. The risk management approach coordinates risk management across the organization and its business units and seeks to ensure prudent and measured risk-taking in order to achieve an appropriate balance between risk and return. Fundamental to our enterprise risk management program is protecting and enhancing our reputation.
RISK MANAGEMENT FRAMEWORKThe Company’s risk management approach is undertaken through its Enterprise Risk Management (ERM) Framework which includes five core elements: risk governance, risk appetite, risk principles, a defined risk management process, and risk management culture. The ERM Framework is established under the Company’s ERM Policy, which is approved by the Risk Management Committee.
RISK GOVERNANCE
The Company’s risk governance structure emphasizes a comprehensive and consistent framework throughout the Company and its subsidiaries, with identified ownership of risk management in each business unit and oversight by an executive Risk Management Committee accountable to the Executive Committee of the Board. Additional oversight is provided by the Enterprise Risk Management (ERM) Department, corporate and distribution compliance groups, and the Company’s Internal Audit Department.
The Board of Directors provides oversight and carries out its risk management mandate primarily through the following committees:
• The Executive Committee is responsible for the oversight of enterprise risk management by: i) ensuring that appropriate procedures are in place to identify and manage risks and establish risk tolerances, ii) ensuring that appropriate policies, procedures and controls are implemented to manage risks, and iii) reviewing the risk management process on a regular basis to ensure that it is functioning effectively.
• The Investment Committee oversees management of the Company’s financial risks, being market risk, credit risk, and liquidity and funding risk by: i) ensuring that appropriate procedures are in place to identify and manage financial risks in accordance with tolerances, ii) monitoring the implementation and maintenance of appropriate policies, procedures and controls to manage financial risks, and iii) reviewing the financial risk management process on a regular basis to ensure that it is functioning effectively.
• The Audit Committee has specific risk oversight responsibilities in relation to financial disclosure, internal controls and the control environment as well as the Company’s compliance activities.
• Other committees having specific risk oversight responsibilities include: i) the Compensation Committee which oversees compensation policies and practices, ii) the Governance and Nominating Committee which oversees corporate governance practices, and iii) the Related Party and Conduct Review Committee which oversees conflicts of interest as well as the administration of the Code of Business Conduct and Ethics for Directors, Officers and Employees (Code of Conduct).
Management oversight for risk management resides with the executive Risk Management Committee which is comprised of the President and Chief Executive Officer, IGM Financial and Investors Group, the President and Chief Executive Officer, Mackenzie Investments, the Chief Financial Officer, and the General Counsel and Chief Compliance Officer. The committee is responsible for providing oversight of the Company’s risk management process by: i) establishing and maintaining the risk framework and policy, ii) defining the Company’s risk appetite, iii) ensuring the Company’s risk profile and processes are aligned with corporate strategy and risk appetite, and iv) establishing “tone at the top” and reinforcing a strong culture of risk management.
The Chief Executive Officers of the operating companies have overall responsibility for overseeing risk management of their respective companies.
The Company has assigned responsibility for risk management using the Three Lines of Defence model, with the First Line reflecting the business units having primary responsibility for risk management, supported by Second Line risk management functions and a Third Line Internal Audit function providing assurance and validation of the design and effectiveness of the ERM Framework.
First Line of Defence
The leaders of the various business units and support functions have primary ownership and accountability for the ongoing risk management associated with their respective activities. Responsibilities of business unit and support function leaders include: i) establishing and maintaining procedures for the identification, assessment, documentation and escalation of risks, ii) implementing control activities to mitigate risks, iii) identifying opportunities for risk reduction or transfer, and iv) aligning business and operational strategies with the risk culture and risk appetite of the organization as established by the Risk Management Committee.
RISK MANAGEMENT
C 32 POWER FINANCIAL CORPORATION�— �FIRST QUARTER REPORT 2018
PFC_QUAT1_Eng03_IGM_2018-05-05_v1.indd D32PFC_QUAT1_Eng03_IGM_2018-05-05_v1.indd D32 18-05-09 1:39 PM18-05-09 1:39 PM

PA
RT
C
IGM
FINA
NC
IAL IN
C.
36 IGM FINANCIAL INC. FIRST QUARTER REPORT 2018 / MANAGEMENT’S DISCUSSION AND ANALYSIS
Second Line of Defence
The Enterprise Risk Management (ERM) Department provides oversight, analysis and reporting to the Risk Management Committee on the level of risks relative to the established risk appetite for all activities of the Company. Other responsibilities include: i) developing and maintaining the enterprise risk management program and framework, ii) managing the enterprise risk management process, and iii) providing guidance and training to business unit and support function leaders.
The Company has a number of committees of senior business leaders which provide oversight of specific business risks, including the Financial Risk Management and Operational Risk Management committees. These committees perform critical reviews of risk assessments, risk management practices and risk response plans developed by business units and support functions.
Other oversight accountabilities reside with the Company’s corporate and compliance groups which are responsible for ensuring compliance with policies, laws and regulations.
Third Line of Defence
The Internal Audit Department is the third line of defence and provides independent assurance to senior management and the Board of Directors on the effectiveness of risk management policies, processes and practices.
RISK APPETITE AND RISK PRINCIPLES
The Risk Management Committee establishes the Company’s appetite for different types of risk through the Risk Appetite Framework. Under the Risk Appetite Framework, one of four appetite levels is established for each risk type and business activity of the Company. These appetite levels range from those where the Company has no appetite for risk and seeks to minimize any losses, to those where the Company readily accepts exposure while seeking to ensure that risks are well understood and managed. These appetite levels guide our business units as they engage in business activities, and inform them in establishing policies, limits, controls and risk transfer activities.
A Risk Appetite Statement and Risk Principles provide further guidance to business leaders and employees as they conduct risk management activities. The Risk Appetite Statement’s emphasis is to maintain the Company’s reputation and brand, ensure financial flexibility, and focus on mitigating operational risk.
RISK MANAGEMENT PROCESS
The Company’s risk management process is designed to foster:
• Ongoing assessment of risks and tolerance in a changing operating environment.
• Appropriate identification and understanding of existing and emerging risks and risk response.
• Timely monitoring and escalation of risks based upon changing circumstances.
Significant risks that may adversely affect the Company’s ability to achieve its strategic and business objectives are identified through the Company’s ongoing risk management process.
We use a consistent methodology across our organizations and business units for identification and assessment of risks. Risks are assessed by evaluating the impact and likelihood of the potential risk event after consideration of controls and any risk transfer activities. The results of these assessments are considered relative to risk appetite and tolerances and may result in action plans to adjust the risk profile.
Risk assessments are monitored and reviewed on an ongoing basis by business units and by oversight areas including the ERM Department. The ERM Department promotes and coordinates communication and consultation to support effective risk management and escalation. The ERM Department regularly reports on the results of risk assessments and on the assessment process to the Risk Management Committee and to the Executive Committee of the Board.
RISK MANAGEMENT CULTURE
Risk management is intended to be everyone’s responsibility within the organization. The ERM Department engages all business units in workshops to foster awareness and incorporation of our risk framework into our business activities.
We have an established business planning process which reinforces our risk management culture. Our compensation programs are typically objectives-based, and do not encourage or reward excessive or inappropriate risk taking, and often are aligned specifically with risk management objectives.
Our risk management program emphasizes integrity, ethical practices, responsible management and measured risk-taking with a long-term view. Our standards of integrity and ethics are reflected within our Code of Conduct which applies to directors, officers and employees.
KEY RISKS OF THE BUSINESSThe Company identifies risks to which its businesses and operations could be exposed considering factors both internal and external to the organization. These risks are broadly grouped into six categories.
POWER FINANCIAL CORPORATION�— �FIRST QUARTER REPORT 2018 C 33
PFC_QUAT1_Eng03_IGM_2018-05-05_v1.indd D33PFC_QUAT1_Eng03_IGM_2018-05-05_v1.indd D33 18-05-09 1:39 PM18-05-09 1:39 PM
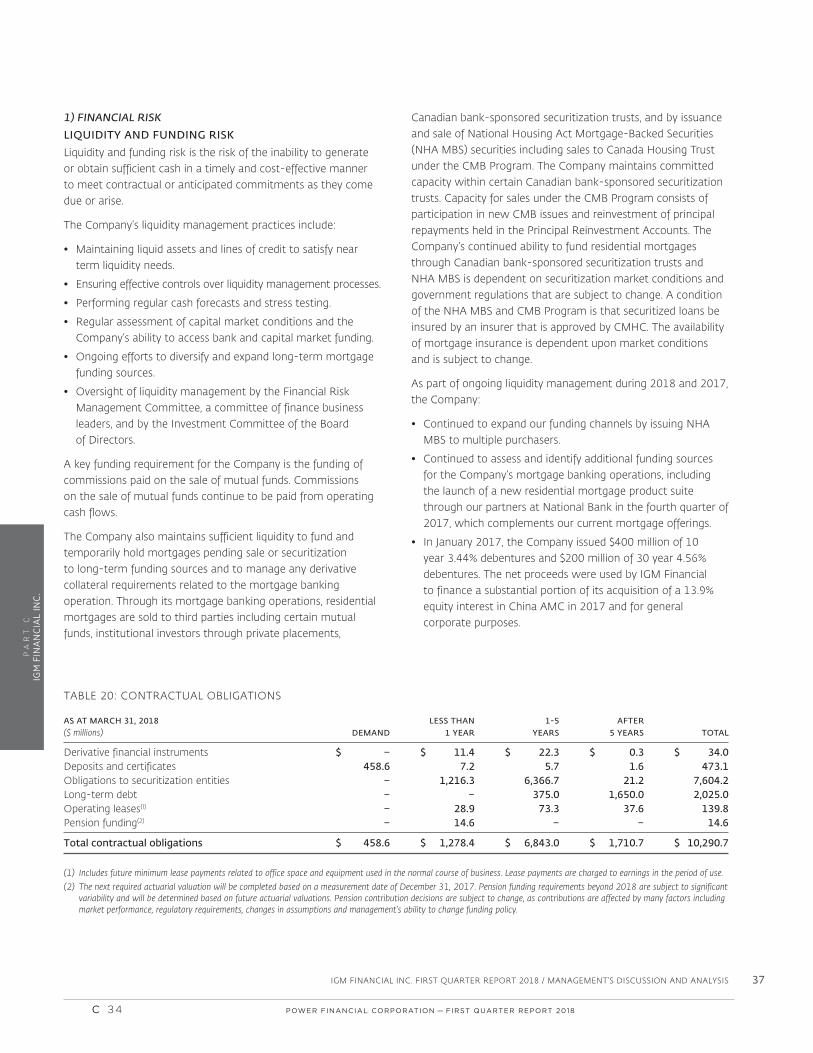
PA
RT
C
IGM
FIN
AN
CIA
L IN
C.
IGM FINANCIAL INC. FIRST QUARTER REPORT 2018 / MANAGEMENT’S DISCUSSION AND ANALYSIS 37
1) FINANCIAL RISK
LIQUIDITY AND FUNDING RISK
Liquidity and funding risk is the risk of the inability to generate or obtain sufficient cash in a timely and cost-effective manner to meet contractual or anticipated commitments as they come due or arise.
The Company’s liquidity management practices include:
• Maintaining liquid assets and lines of credit to satisfy near term liquidity needs.
• Ensuring effective controls over liquidity management processes.
• Performing regular cash forecasts and stress testing.
• Regular assessment of capital market conditions and the Company’s ability to access bank and capital market funding.
• Ongoing efforts to diversify and expand long-term mortgage funding sources.
• Oversight of liquidity management by the Financial Risk Management Committee, a committee of finance business leaders, and by the Investment Committee of the Board of Directors.
A key funding requirement for the Company is the funding of commissions paid on the sale of mutual funds. Commissions on the sale of mutual funds continue to be paid from operating cash flows.
The Company also maintains sufficient liquidity to fund and temporarily hold mortgages pending sale or securitization to long-term funding sources and to manage any derivative collateral requirements related to the mortgage banking operation. Through its mortgage banking operations, residential mortgages are sold to third parties including certain mutual funds, institutional investors through private placements,
Canadian bank-sponsored securitization trusts, and by issuance and sale of National Housing Act Mortgage-Backed Securities (NHA MBS) securities including sales to Canada Housing Trust under the CMB Program. The Company maintains committed capacity within certain Canadian bank-sponsored securitization trusts. Capacity for sales under the CMB Program consists of participation in new CMB issues and reinvestment of principal repayments held in the Principal Reinvestment Accounts. The Company’s continued ability to fund residential mortgages through Canadian bank-sponsored securitization trusts and NHA MBS is dependent on securitization market conditions and government regulations that are subject to change. A condition of the NHA MBS and CMB Program is that securitized loans be insured by an insurer that is approved by CMHC. The availability of mortgage insurance is dependent upon market conditions and is subject to change.
As part of ongoing liquidity management during 2018 and 2017, the Company:
• Continued to expand our funding channels by issuing NHA MBS to multiple purchasers.
• Continued to assess and identify additional funding sources for the Company’s mortgage banking operations, including the launch of a new residential mortgage product suite through our partners at National Bank in the fourth quarter of 2017, which complements our current mortgage offerings.
• In January 2017, the Company issued $400 million of 10 year 3.44% debentures and $200 million of 30 year 4.56% debentures. The net proceeds were used by IGM Financial to finance a substantial portion of its acquisition of a 13.9% equity interest in China AMC in 2017 and for general corporate purposes.
TABLE 20: CONTRACTUAL OBLIGATIONS
AS AT MARCH 31, 2018 LESS THAN 1-5 AFTER ($ millions) DEMAND 1 YEAR YEARS 5 YEARS TOTAL
Derivative financial instruments $ – $ 11.4 $ 22.3 $ 0.3 $ 34.0Deposits and certificates 458.6 7.2 5.7 1.6 473.1Obligations to securitization entities – 1,216.3 6,366.7 21.2 7,604.2Long-term debt – – 375.0 1,650.0 2,025.0Operating leases(1) – 28.9 73.3 37.6 139.8Pension funding(2) – 14.6 – – 14.6
Total contractual obligations $ 458.6 $ 1,278.4 $ 6,843.0 $ 1,710.7 $ 10,290.7
(1) Includes future minimum lease payments related to office space and equipment used in the normal course of business. Lease payments are charged to earnings in the period of use.
(2) The next required actuarial valuation will be completed based on a measurement date of December 31, 2017. Pension funding requirements beyond 2018 are subject to significant variability and will be determined based on future actuarial valuations. Pension contribution decisions are subject to change, as contributions are affected by many factors including market performance, regulatory requirements, changes in assumptions and management’s ability to change funding policy.
C 34 POWER FINANCIAL CORPORATION�— �FIRST QUARTER REPORT 2018
PFC_QUAT1_Eng03_IGM_2018-05-05_v1.indd D34PFC_QUAT1_Eng03_IGM_2018-05-05_v1.indd D34 18-05-09 1:39 PM18-05-09 1:39 PM
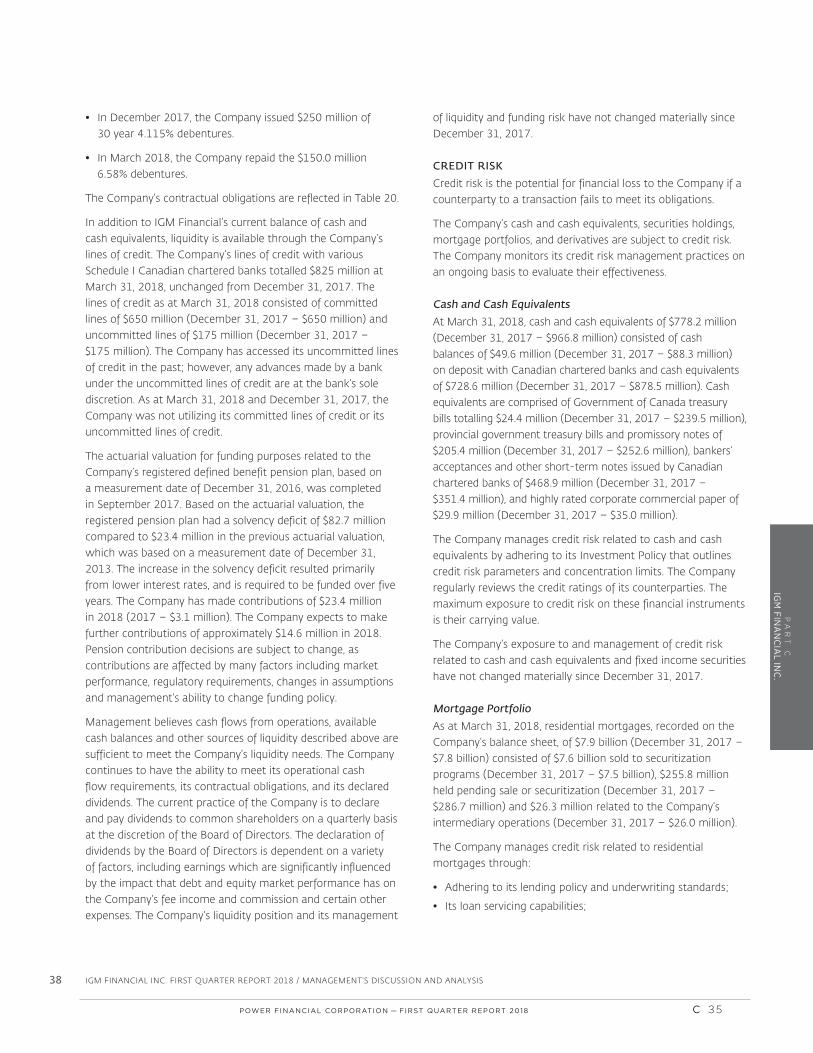
PA
RT
C
IGM
FINA
NC
IAL IN
C.
38 IGM FINANCIAL INC. FIRST QUARTER REPORT 2018 / MANAGEMENT’S DISCUSSION AND ANALYSIS
• In December 2017, the Company issued $250 million of 30 year 4.115% debentures.
• In March 2018, the Company repaid the $150.0 million 6.58% debentures.
The Company’s contractual obligations are reflected in Table 20.
In addition to IGM Financial’s current balance of cash and cash equivalents, liquidity is available through the Company’s lines of credit. The Company’s lines of credit with various Schedule I Canadian chartered banks totalled $825 million at March 31, 2018, unchanged from December 31, 2017. The lines of credit as at March 31, 2018 consisted of committed lines of $650 million (December 31, 2017 – $650 million) and uncommitted lines of $175 million (December 31, 2017 – $175 million). The Company has accessed its uncommitted lines of credit in the past; however, any advances made by a bank under the uncommitted lines of credit are at the bank’s sole discretion. As at March 31, 2018 and December 31, 2017, the Company was not utilizing its committed lines of credit or its uncommitted lines of credit.
The actuarial valuation for funding purposes related to the Company’s registered defined benefit pension plan, based on a measurement date of December 31, 2016, was completed in September 2017. Based on the actuarial valuation, the registered pension plan had a solvency deficit of $82.7 million compared to $23.4 million in the previous actuarial valuation, which was based on a measurement date of December 31, 2013. The increase in the solvency deficit resulted primarily from lower interest rates, and is required to be funded over five years. The Company has made contributions of $23.4 million in 2018 (2017 – $3.1 million). The Company expects to make further contributions of approximately $14.6 million in 2018. Pension contribution decisions are subject to change, as contributions are affected by many factors including market performance, regulatory requirements, changes in assumptions and management’s ability to change funding policy.
Management believes cash flows from operations, available cash balances and other sources of liquidity described above are sufficient to meet the Company’s liquidity needs. The Company continues to have the ability to meet its operational cash flow requirements, its contractual obligations, and its declared dividends. The current practice of the Company is to declare and pay dividends to common shareholders on a quarterly basis at the discretion of the Board of Directors. The declaration of dividends by the Board of Directors is dependent on a variety of factors, including earnings which are significantly influenced by the impact that debt and equity market performance has on the Company’s fee income and commission and certain other expenses. The Company’s liquidity position and its management
of liquidity and funding risk have not changed materially since December 31, 2017.
CREDIT RISK
Credit risk is the potential for financial loss to the Company if a counterparty to a transaction fails to meet its obligations.
The Company’s cash and cash equivalents, securities holdings, mortgage portfolios, and derivatives are subject to credit risk. The Company monitors its credit risk management practices on an ongoing basis to evaluate their effectiveness.
Cash and Cash Equivalents
At March 31, 2018, cash and cash equivalents of $778.2 million (December 31, 2017 – $966.8 million) consisted of cash balances of $49.6 million (December 31, 2017 – $88.3 million) on deposit with Canadian chartered banks and cash equivalents of $728.6 million (December 31, 2017 – $878.5 million). Cash equivalents are comprised of Government of Canada treasury bills totalling $24.4 million (December 31, 2017 – $239.5 million), provincial government treasury bills and promissory notes of $205.4 million (December 31, 2017 – $252.6 million), bankers’ acceptances and other short-term notes issued by Canadian chartered banks of $468.9 million (December 31, 2017 – $351.4 million), and highly rated corporate commercial paper of $29.9 million (December 31, 2017 – $35.0 million).
The Company manages credit risk related to cash and cash equivalents by adhering to its Investment Policy that outlines credit risk parameters and concentration limits. The Company regularly reviews the credit ratings of its counterparties. The maximum exposure to credit risk on these financial instruments is their carrying value.
The Company’s exposure to and management of credit risk related to cash and cash equivalents and fixed income securities have not changed materially since December 31, 2017.
Mortgage Portfolio
As at March 31, 2018, residential mortgages, recorded on the Company’s balance sheet, of $7.9 billion (December 31, 2017 – $7.8 billion) consisted of $7.6 billion sold to securitization programs (December 31, 2017 – $7.5 billion), $255.8 million held pending sale or securitization (December 31, 2017 – $286.7 million) and $26.3 million related to the Company’s intermediary operations (December 31, 2017 – $26.0 million).
The Company manages credit risk related to residential mortgages through:
• Adhering to its lending policy and underwriting standards;
• Its loan servicing capabilities;
POWER FINANCIAL CORPORATION�— �FIRST QUARTER REPORT 2018 C 35
PFC_QUAT1_Eng03_IGM_2018-05-05_v1.indd D35PFC_QUAT1_Eng03_IGM_2018-05-05_v1.indd D35 18-05-09 1:39 PM18-05-09 1:39 PM

PA
RT
C
IGM
FIN
AN
CIA
L IN
C.
IGM FINANCIAL INC. FIRST QUARTER REPORT 2018 / MANAGEMENT’S DISCUSSION AND ANALYSIS 39
• Use of client-insured mortgage default insurance and mortgage portfolio default insurance held by the Company; and
• Its practice of originating its mortgages exclusively through its own network of Mortgage Planning Specialists and Investors Group Consultants as part of a client’s comprehensive financial plan.
In certain instances, credit risk is also limited by the terms and nature of securitization transactions as described below:
• Under the NHA MBS program totalling $4.5 billion (December 31, 2017 – $4.5 billion), the Company is obligated to make timely payment of principal and coupons irrespective of whether such payments were received from the mortgage borrower. However, as required by the NHA MBS program, 100% of the loans are insured by an approved insurer.
• Credit risk for mortgages securitized by transfer to bank-sponsored securitization trusts totalling $3.1 billion (December 31, 2017 – $3.1 billion) is limited to amounts held in cash reserve accounts and future net interest income, the fair values of which were $70.5 million (December 31, 2017 – $69.7 million) and $39.6 million (December 31, 2017 – $42.4 million), respectively, at March 31, 2018. Cash reserve accounts are reflected on the balance sheet, whereas rights to future net interest income are not reflected on the balance sheet and will be recorded over the life of the mortgages. This risk is further mitigated by insurance with 14.8% of mortgages held in ABCP Trusts insured at March 31, 2018 (December 31, 2017 – 16.4%).
At March 31, 2018, residential mortgages recorded on balance sheet were 64.8% insured (December 31, 2017 – 65.5%). As at March 31, 2018, impaired mortgages on these portfolios were $4.5 million, compared to $2.8 million at December 31, 2017. Uninsured non-performing mortgages over 90 days on these portfolios were $1.4 million at March 31, 2018, compared to $0.8 million at December 31, 2017.
The Company also retains certain elements of credit risk on mortgage loans sold to the Investors Mortgage and Short Term Income Fund and to the Investors Canadian Corporate Bond Fund through an agreement to repurchase mortgages in certain circumstances benefiting the funds. These loans are not recorded on the Company’s balance sheet as the Company has transferred substantially all of the risks and rewards of ownership associated with these loans.
The Company regularly reviews the credit quality of the mortgages and the adequacy of the allowance for expected credit losses.
The Company’s allowance for expected credit losses was $0.8 million at March 31, 2018, unchanged from December 31, 2017, and is considered adequate by management to absorb
all credit-related losses in the mortgage portfolios based on: i) historical credit performance experience and recent trends, ii) current portfolio credit metrics and other relevant characteristics, and iii) regular stress testing of losses under adverse real estate market conditions.
The Company’s exposure to and management of credit risk related to mortgage portfolios have not changed materially since December 31, 2017.
Derivatives
The Company is exposed to credit risk through derivative contracts it utilizes to hedge interest rate risk, to facilitate securitization transactions and to hedge market risk related to certain stock-based compensation arrangements. These derivatives are discussed more fully under the Market Risk section of this MD&A.
To the extent that the fair value of the derivatives is in a gain position, the Company is exposed to credit risk that its counterparties fail to fulfil their obligations under these arrangements.
The Company’s derivative activities are managed in accordance with its Investment Policy which includes counterparty limits and other parameters to manage counterparty risk. The aggregate credit risk exposure related to derivatives that are in a gain position of $28.3 million (December 31, 2017 – $33.8 million) does not give effect to any netting agreements or collateral arrangements. The exposure to credit risk, considering netting agreements and collateral arrangements and including rights to future net interest income, was $0.5 million at March 31, 2018 (December 31, 2017 – $1.2 million). Counterparties are all Canadian Schedule I chartered banks and, as a result, management has determined that the Company’s overall credit risk related to derivatives was not significant at March 31, 2018. Management of credit risk related to derivatives has not changed materially since December 31, 2017.
Additional information related to the Company’s securitization activities and utilization of derivative contracts can be found in Notes 2, 6 and 21 to the Annual Financial Statements.
MARKET RISK
Market risk is the potential for loss to the Company from changes in the values of its financial instruments due to changes in foreign exchange rates, interest rates or equity prices.
Interest Rate Risk
The Company is exposed to interest rate risk on its mortgage portfolio and on certain of the derivative financial instruments used in the Company’s mortgage banking operations.
C 36 POWER FINANCIAL CORPORATION�— �FIRST QUARTER REPORT 2018
PFC_QUAT1_Eng03_IGM_2018-05-05_v1.indd D36PFC_QUAT1_Eng03_IGM_2018-05-05_v1.indd D36 18-05-09 1:39 PM18-05-09 1:39 PM

PA
RT
C
IGM
FINA
NC
IAL IN
C.
40 IGM FINANCIAL INC. FIRST QUARTER REPORT 2018 / MANAGEMENT’S DISCUSSION AND ANALYSIS
The Company manages interest rate risk associated with its mortgage banking operations by entering into interest rate swaps with Canadian Schedule I chartered banks as follows:
• The Company has in certain instances funded floating rate mortgages with fixed rate Canada Mortgage Bonds as part of the securitization transactions under the CMB Program. As previously discussed, as part of the CMB Program, the Company is party to a swap whereby it is entitled to receive investment returns on reinvested mortgage principal and is obligated to pay Canada Mortgage Bond coupons. This swap had a positive fair value of $5.4 million (December 31, 2017 – positive $4.1 million) and an outstanding notional amount of $1.3 billion at March 31, 2018 (December 31, 2017 – $1.2 billion). The Company enters into interest rate swaps with Canadian Schedule I chartered banks to hedge the risk that the interest rates earned on floating rate mortgages and reinvestment returns decline. The negative fair value of these swaps totalled $9.1 million (December 31, 2017 – negative $4.5 million), on an outstanding notional amount of $2.0 billion at March 31, 2018 (December 31, 2017 – $1.9 billion). The net fair value of these swaps of negative $3.7 million at March 31, 2018 (December 31, 2017 – negative $0.4 million) are recorded on balance sheet and have an outstanding notional amount of $3.3 billion (December 31, 2017 – $3.1 billion).
• The Company is exposed to the impact that changes in interest rates may have on the value of mortgages committed to or held pending sale or securitization to long-term funding sources. The Company enters into interest rate swaps to hedge the interest rate risk related to funding costs for mortgages held by the Company pending sale or securitization. The fair value of these swaps were nil (December 31, 2017 – $0.9 million) on an outstanding notional amount of $110.3 million at March 31, 2018 (December 31, 2017 – $137.0 million).
As at March 31, 2018, the impact to annual net earnings of a 100 basis point increase in interest rates would have been a decrease of approximately $0.4 million (December 31, 2017 – a decrease of $0.9 million). The Company’s exposure to and management of interest rate risk have not changed materially since December 31, 2017.
Equity Price Risk
The Company is exposed to equity price risk on its equity securities which are classified as either fair value through other comprehensive income or fair value through profit or loss. The fair value of the equity securities was $421.9 million at March 31, 2018 (December 31, 2017 – $379.7 million), as shown in Table 14.
The Company sponsors a number of deferred compensation arrangements for employees where payments to participants are deferred and linked to the performance of the common shares of IGM Financial Inc. The Company hedges its exposure to this risk through the use of forward agreements and total return swaps.
Foreign Exchange Risk
The Company is exposed to foreign exchange risk on its investments in Personal Capital and China AMC.
RISKS RELATED TO ASSETS UNDER MANAGEMENT
At March 31, 2018, IGM Financial’s total assets under management were $155.8 billion compared to $156.5 billion at December 31, 2017.
The Company’s primary sources of revenues are management, administration and other fees which are applied as an annual percentage of the level of assets under management. As a result, the level of the Company’s revenues and earnings are indirectly exposed to a number of financial risks that affect the value of assets under management on an ongoing basis. These include market risks, such as changes in equity prices, interest rates and foreign exchange rates, as well as credit risk on debt securities, loans and credit exposures from other counterparties within our client portfolios.
Changing financial market conditions may also lead to a change in the composition of the Company’s assets under management between equity and fixed income instruments, which could result in lower revenues depending upon the management fee rates associated with different asset classes and mandates.
The Company’s exposure to the value of assets under management aligns it with the experience of its clients. Assets under management are broadly diversified by asset class, geographic region, industry sector, investment team and style. The Company regularly reviews the sensitivity of its assets under management, revenues, earnings and cash flow to changes in financial markets. The Company believes that over the long term, exposure to investment returns on its client portfolios is beneficial to the Company’s results and consistent with stakeholder expectations, and generally it does not engage in risk transfer activities such as hedging in relation to these exposures.
2) OPERATIONAL RISK
Operational risks relating to people and processes are mitigated through policies and process controls. Oversight of risks and ongoing evaluation of the effectiveness of controls is provided by the Company’s compliance department, ERM Department and Internal Audit Department.
POWER FINANCIAL CORPORATION�— �FIRST QUARTER REPORT 2018 C 37
PFC_QUAT1_Eng03_IGM_2018-05-05_v1.indd D37PFC_QUAT1_Eng03_IGM_2018-05-05_v1.indd D37 18-05-09 1:39 PM18-05-09 1:39 PM
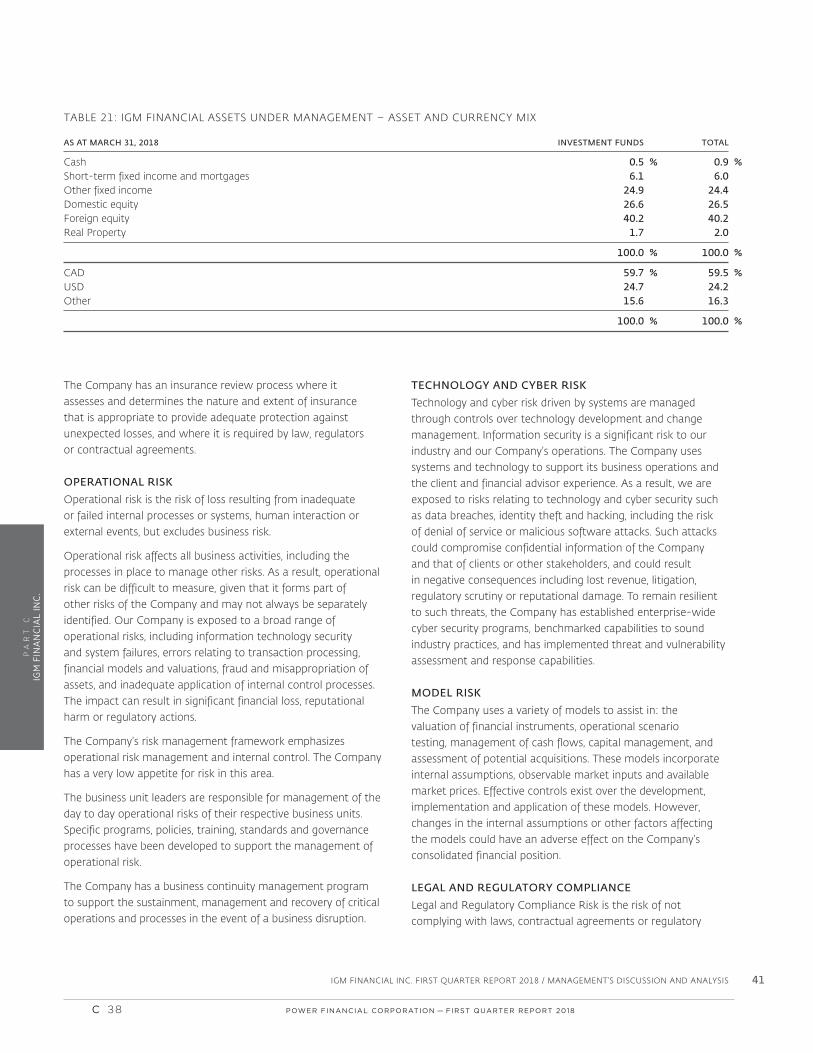
PA
RT
C
IGM
FIN
AN
CIA
L IN
C.
IGM FINANCIAL INC. FIRST QUARTER REPORT 2018 / MANAGEMENT’S DISCUSSION AND ANALYSIS 41
The Company has an insurance review process where it assesses and determines the nature and extent of insurance that is appropriate to provide adequate protection against unexpected losses, and where it is required by law, regulators or contractual agreements.
OPERATIONAL RISK
Operational risk is the risk of loss resulting from inadequate or failed internal processes or systems, human interaction or external events, but excludes business risk.
Operational risk affects all business activities, including the processes in place to manage other risks. As a result, operational risk can be difficult to measure, given that it forms part of other risks of the Company and may not always be separately identified. Our Company is exposed to a broad range of operational risks, including information technology security and system failures, errors relating to transaction processing, financial models and valuations, fraud and misappropriation of assets, and inadequate application of internal control processes. The impact can result in significant financial loss, reputational harm or regulatory actions.
The Company’s risk management framework emphasizes operational risk management and internal control. The Company has a very low appetite for risk in this area.
The business unit leaders are responsible for management of the day to day operational risks of their respective business units. Specific programs, policies, training, standards and governance processes have been developed to support the management of operational risk.
The Company has a business continuity management program to support the sustainment, management and recovery of critical operations and processes in the event of a business disruption.
TECHNOLOGY AND CYBER RISK
Technology and cyber risk driven by systems are managed through controls over technology development and change management. Information security is a significant risk to our industry and our Company’s operations. The Company uses systems and technology to support its business operations and the client and financial advisor experience. As a result, we are exposed to risks relating to technology and cyber security such as data breaches, identity theft and hacking, including the risk of denial of service or malicious software attacks. Such attacks could compromise confidential information of the Company and that of clients or other stakeholders, and could result in negative consequences including lost revenue, litigation, regulatory scrutiny or reputational damage. To remain resilient to such threats, the Company has established enterprise-wide cyber security programs, benchmarked capabilities to sound industry practices, and has implemented threat and vulnerability assessment and response capabilities.
MODEL RISK
The Company uses a variety of models to assist in: the valuation of financial instruments, operational scenario testing, management of cash flows, capital management, and assessment of potential acquisitions. These models incorporate internal assumptions, observable market inputs and available market prices. Effective controls exist over the development, implementation and application of these models. However, changes in the internal assumptions or other factors affecting the models could have an adverse effect on the Company’s consolidated financial position.
LEGAL AND REGULATORY COMPLIANCE
Legal and Regulatory Compliance Risk is the risk of not complying with laws, contractual agreements or regulatory
TABLE 21: IGM FINANCIAL ASSETS UNDER MANAGEMENT – ASSET AND CURRENCY MIX
AS AT MARCH 31, 2018 INVESTMENT FUNDS TOTAL
Cash 0.5 % 0.9 %Short-term fixed income and mortgages 6.1 6.0Other fixed income 24.9 24.4Domestic equity 26.6 26.5Foreign equity 40.2 40.2Real Property 1.7 2.0
100.0 % 100.0 %
CAD 59.7 % 59.5 %USD 24.7 24.2Other 15.6 16.3
100.0 % 100.0 %
C 38 POWER FINANCIAL CORPORATION�— �FIRST QUARTER REPORT 2018
PFC_QUAT1_Eng03_IGM_2018-05-05_v1.indd D38PFC_QUAT1_Eng03_IGM_2018-05-05_v1.indd D38 18-05-09 1:39 PM18-05-09 1:39 PM

PA
RT
C
IGM
FINA
NC
IAL IN
C.
42 IGM FINANCIAL INC. FIRST QUARTER REPORT 2018 / MANAGEMENT’S DISCUSSION AND ANALYSIS
requirements. This includes distribution compliance, investment management compliance, accounting and internal controls, and reporting and communications.
IGM Financial is subject to complex and changing legal, taxation and regulatory requirements, including the requirements of agencies of the federal, provincial and territorial governments in Canada which regulate the Company and its activities. The Company and its subsidiaries are also subject to the requirements of self-regulatory organizations to which they belong. These and other regulatory bodies regularly adopt new laws, rules, regulations and policies that apply to the Company and its subsidiaries. These requirements include those that apply to IGM Financial as a publicly traded company and those that apply to the Company’s subsidiaries based on the nature of their activities. They include regulations related to securities markets, the provision of financial products and services, including fund management, distribution, insurance and mortgages, and other activities carried on by the Company in the markets in which it operates. Regulatory standards affecting the Company and the financial services industry are significant and are being continually changed. The Company and its subsidiaries are subject to reviews as part of the normal ongoing process of oversight by the various regulators.
Failure to comply with laws, rules or regulations could lead to regulatory sanctions and civil liability, and may have an adverse reputational or financial effect on the Company. The Company manages legal and regulatory compliance risk through its efforts to promote a strong culture of compliance. The monitoring of regulatory developments and their impact on the Company is overseen by the Regulatory Initiatives Committee chaired by the Senior Vice-President, Client and Regulatory Affairs. The Company also continues to develop and maintain compliance policies, processes and oversight, including specific communications on compliance and legal matters, training, testing, monitoring and reporting. The Audit Committee of the Company receives regular reporting on compliance initiatives and issues.
IGM Financial promotes a strong culture of ethics and integrity through its Code of Conduct approved by the Board of Directors, which outlines standards of conduct that apply to all IGM Financial directors, officers and employees. The Code of Conduct incorporates many policies relating to the conduct of directors, officers and employees, and covers a variety of relevant topics, such as anti-money laundering and privacy. Individuals subject to the Code of Conduct attest annually that they understand the requirements and have complied with its provisions.
Business units are responsible for management of legal and regulatory compliance risk, and implementing appropriate
policies, procedures and controls. The Company has a number of different compliance departments responsible for providing oversight of investment management and distribution-related compliance activities. The Internal Audit Department also provides oversight and investigations concerning regulatory compliance matters.
CONTINGENCIES
The Company is subject to legal actions arising in the normal course of its business. Although it is difficult to predict the outcome of any such legal actions, based on current knowledge and consultation with legal counsel, management does not expect the outcome of any of these matters, individually or in aggregate, to have a material adverse effect on the Company’s consolidated financial position.
3) GOVERNANCE, OVERSIGHT AND STRATEGIC RISK
Governance, oversight and strategic risk is the risk of potential adverse impacts resulting from inadequate or inappropriate governance, oversight, management of incentives and conflicts, and strategic planning.
IGM Financial believes in the importance of good corporate governance and the central role played by directors in the governance process. We believe that sound corporate governance is essential to the well being of the Company and its shareholders.
Oversight of IGM Financial is performed by the Board of Directors directly and through its seven committees. The Company’s President and Chief Executive Officer has overall responsibility for management of the Company. The Company’s activities are carried out principally by three operating companies – Investors Group Inc., Mackenzie Financial Corporation and Investment Planning Counsel Inc. – each of which are managed by a President and Chief Executive Officer.
The Company has a business planning process that supports development of an annual business plan, approved by the Board of Directors, which incorporates objectives and targets for the Company. Components of management compensation are associated with the achievement of earnings targets and other objectives associated with the plan. Strategic plans and direction are part of this planning process and are integrated into the Company’s risk management program.
ACQUISITION RISK
The Company is also exposed to risks related to its acquisitions. The Company undertakes thorough due diligence prior to completing an acquisition, but there is no assurance that the Company will achieve the expected strategic objectives or cost and revenue synergies subsequent to an acquisition. Subsequent
POWER FINANCIAL CORPORATION�— �FIRST QUARTER REPORT 2018 C 39
PFC_QUAT1_Eng03_IGM_2018-05-05_v1.indd D39PFC_QUAT1_Eng03_IGM_2018-05-05_v1.indd D39 18-05-09 1:39 PM18-05-09 1:39 PM
PA
RT
C
IGM
FIN
AN
CIA
L IN
C.
IGM FINANCIAL INC. FIRST QUARTER REPORT 2018 / MANAGEMENT’S DISCUSSION AND ANALYSIS 43
changes in the economic environment and other unanticipated factors may affect the Company’s ability to achieve expected earnings growth or expense reductions. The success of an acquisition is dependent on retaining assets under management, clients, and key employees of an acquired company.
4) REGULATORY DEVELOPMENTS
Regulatory development risk is the potential for changes to regulatory, legal, or tax requirements that may have an adverse impact upon the Company’s business activities or financial results.
The Company is exposed to the risk of changes in laws, taxation and regulation that could have an adverse impact on the Company. Particular regulatory initiatives may have the effect of making the products of the Company’s subsidiaries appear to be less competitive than the products of other financial service providers, to third party distribution channels and to clients. Regulatory differences that may impact the competitiveness of the Company’s products include regulatory costs, tax treatment, disclosure requirements, transaction processes or other differences that may be as a result of differing regulation or application of regulation. Regulatory developments may also impact product structures, pricing, and dealer and advisor compensation. While the Company and its subsidiaries actively monitor such initiatives, and where feasible comment upon or discuss them with regulators, the ability of the Company and its subsidiaries to mitigate the imposition of differential regulatory treatment of financial products or services is limited.
BEST INTEREST STANDARD, TARGETED REFORMS AND MUTUAL FUND EMBEDDED COMMISSIONS
In May 2017, the Canadian Securities Administrators (the CSA) published Staff Notice 33-319 (the Staff Notice) Status Report on CSA Consultation Paper 33-404 Proposals to Enhance the Obligations of Advisers, Dealers and Representatives Toward Their Clients (the BIS Consultation Paper), which provided an update on the CSA’s proposal for a set of targeted reforms relating to the client-registrant relationship and a regulatory best interest standard. The Company’s subsidiaries submitted comment letters on the BIS Consultation Paper and also participated in a series of roundtables hosted by certain jurisdictions to further explore the proposals in the BIS Consultation Paper.
The Staff Notice specifies that only the Ontario Securities Commission and the Financial and Consumer Services Commission of New Brunswick will continue to pursue further work to articulate a regulatory best interest standard. The Staff Notice further indicates that over the 2017-2018 fiscal year, the CSA will prioritize the work on many of the targeted reforms. This work will culminate in rule proposals that will be published
for comment, providing the Company’s subsidiaries further opportunity for meaningful input.
In January 2017, the CSA published Consultation Paper 81-408 Consultation on the Option of Discontinuing Embedded Commissions (the Fees Consultation Paper) which sought input on the option of discontinuing embedded commissions and the potential impacts of such a change on Canadian investors and market participants. The Company’s subsidiaries submitted comment letters on the Fees Consultation Paper. The Company’s subsidiaries also participated in the roundtables hosted by some members of the CSA in the fall to facilitate further stakeholder input on the Fees Consultation Paper.
The Company will continue its active dialogue and engagement with regulators on these subjects.
COOPERATIVE CAPITAL MARKETS REGULATORY SYSTEM
Since 2013, the Government of Canada and participating provincial jurisdictions have been working to establish a common securities regulator for Canada’s capital markets. Of note, there has been opposition from Quebec, Alberta and Manitoba. In response to a reference from the Quebec government, in May 2017 the Quebec Court of Appeal ruled in favour of the Quebec government and held that the governance framework for the pan-Canadian securities regulation under the proposed Capital Markets Regulatory Authority (CMRA) was unconstitutional.
The decision has been appealed to the Supreme Court of Canada which heard arguments in March, 2018. The Company is continuing to monitor this initiative and any impact it may have on its activities and those of its subsidiaries, particularly in the area of the regulation of mutual funds.
5) BUSINESS RISK
GENERAL BUSINESS CONDITIONS
General Business Conditions Risk refers to the potential for an unfavourable impact on IGM Financial resulting from competitive or other external factors relating to the marketplace.
Global economic conditions, changes in equity markets, demographics and other factors including political and government instability, can affect investor confidence, income levels and savings decisions. This could result in reduced sales of IGM Financial’s products and services and/or result in investors redeeming their investments. These factors may also affect the level of financial markets and the value of the Company’s assets under management, as described more fully under the Risks Related to Assets Under Management section of this MD&A.
The Company, across its operating subsidiaries, is focused on communicating with clients and emphasizing the importance of
C 40 POWER FINANCIAL CORPORATION�— �FIRST QUARTER REPORT 2018
PFC_QUAT1_Eng03_IGM_2018-05-05_v1.indd D40PFC_QUAT1_Eng03_IGM_2018-05-05_v1.indd D40 18-05-09 1:39 PM18-05-09 1:39 PM

PA
RT
C
IGM
FINA
NC
IAL IN
C.
44 IGM FINANCIAL INC. FIRST QUARTER REPORT 2018 / MANAGEMENT’S DISCUSSION AND ANALYSIS
financial planning across economic cycles. The Company and the industry continue to take steps to educate Canadian investors on the merits of financial planning, diversification and long-term investing. In periods of volatility Consultants and independent financial advisors play a key role in assisting investors in maintaining perspective and focus on their long-term objectives.
Redemption rates for long-term funds are summarized in Table 22 and are discussed in the Investors Group and Mackenzie Segment Operating Results sections of this MD&A.
PRODUCT / SERVICE OFFERING
There is potential for unfavourable impacts on IGM Financial resulting from inadequate product or service performance, quality or breadth.
IGM Financial and its subsidiaries operate in a highly competitive environment, competing with other financial service providers, investment managers and product and service types. Client development and retention can be influenced by a number of factors, including products and services offered by competitors, relative service levels, relative pricing, product attributes, reputation and actions taken by competitors. This competition could have an adverse impact upon the Company’s financial position and operating results. Please refer to The Competitive Landscape section of this MD&A for a further discussion.
The Company provides Consultants, independent financial advisors, as well as retail and institutional clients with a high level of service and support and a broad range of investment products, with a focus on building enduring relationships. The Company’s subsidiaries also continually review their respective product and service offering, and pricing, to ensure competitiveness in the marketplace.
The Company strives to deliver strong investment performance on its products relative to benchmarks and peers. Poor investment performance relative to benchmarks or peers could reduce the level of assets under management and sales and asset retention, as well as adversely impact our brands. Meaningful and/or sustained underperformance could affect the Company’s results. The Company’s objective is to cultivate investment processes and disciplines that provide it with a
competitive advantage, and does so by diversifying its assets under management and product shelf by investment team, brand, asset class, mandate, style and geographic region.
BUSINESS / CLIENT RELATIONSHIPS
Business/Client relationships risk refers to the risk potential for unfavourable impacts on IGM Financial resulting from changes to other key relationships. These relationships primarily include Investors Group clients and consultants, Mackenzie retail distribution, strategic and significant business partners, clients of Mackenzie funds, and sub-advisors and other product suppliers.
Investors Group Consultant network – Investors Group derives all of its mutual fund sales through its Consultant network. Investors Group Consultants have regular direct contact with clients which can lead to a strong and personal client relationship based on the client’s confidence in that individual Consultant. The market for financial advisors is extremely competitive. The loss of a significant number of key Consultants could lead to the loss of client accounts which could have an adverse effect on Investors Group’s results of operations and business prospects. Investors Group is focused on strengthening its distribution network of Consultants and on responding to the complex financial needs of its clients by delivering a diverse range of products and services in the context of personalized financial advice, as discussed in the Investors Group Review of the Business section of this MD&A.
Mackenzie – Mackenzie derives the majority of its mutual fund sales through third party financial advisors. Financial advisors generally offer their clients investment products in addition to, and in competition with Mackenzie. Mackenzie also derives sales of its investment products and services from its strategic alliance and institutional clients. Due to the nature of the distribution relationship in these relationships and the relative size of these accounts, gross sale and redemption activity can be more pronounced in these accounts than in a retail relationship. Mackenzie’s ability to market its investment products is highly dependent on continued access to these distribution networks. The inability to have such access could have a material adverse effect on Mackenzie’s operating results and business prospects. Mackenzie is well positioned to manage this risk and to
TABLE 22: TWELVE MONTH TRAILING REDEMPTION RATE FOR LONG-TERM FUNDS
2018 2017 MAR. 31 MAR. 31
IGM Financial Inc. Investors Group 8.4 % 8.8 % Mackenzie 13.7 % 16.2 % Counsel 16.7 % 15.7 %
POWER FINANCIAL CORPORATION�— �FIRST QUARTER REPORT 2018 C 41
PFC_QUAT1_Eng03_IGM_2018-05-05_v1.indd D41PFC_QUAT1_Eng03_IGM_2018-05-05_v1.indd D41 18-05-09 1:40 PM18-05-09 1:40 PM
PA
RT
C
IGM
FIN
AN
CIA
L IN
C.
IGM FINANCIAL INC. FIRST QUARTER REPORT 2018 / MANAGEMENT’S DISCUSSION AND ANALYSIS 45
continue to build and enhance its distribution relationships. Mackenzie’s diverse portfolio of financial products and its long-term investment performance record, marketing, educational and service support has made Mackenzie one of Canada’s leading investment management companies. These factors are discussed further in the Mackenzie Review of the Business section of this MD&A.
PEOPLE RISK
People risk refers to the potential inability to attract or retain key employees or Consultants, develop to an appropriate level of proficiency, or manage personnel succession or transition.
Management, investment and distribution personnel play an important role in developing, implementing, managing and distributing products and services offered by IGM Financial. The loss of these individuals or an inability to attract, retain and motivate sufficient numbers of qualified personnel could affect IGM Financial’s business and financial performance.
6) ENVIRONMENTAL RISK
Environmental risk is the risk of loss resulting from environmental issues involving our business activities and our operations.
Environmental risk covers a broad spectrum of issues, such as climate change, biodiversity and ecosystem health, pollution, waste and the unsustainable use of water and other resources. Key environmental risks to IGM Financial include:
• Direct risks associated with the ownership and operation of our businesses, which includes management and operation of company-owned or managed assets and business operations;
• Indirect risks as a result of the products and services we offer and our procurement practices;
• Identification and management of emerging environmental regulatory issues; and
• Failure to understand and appropriately leverage environment related trends to meet client demands for products and services.
IGM Financial has a long-standing commitment to responsible management, as articulated in the Company’s Corporate Responsibility Statement approved by the Board of Directors and also within the Company’s Environmental Policy which commit us to responsibly manage our environmental footprint.
Failure to adequately manage environmental risks could adversely impact our results or our reputation.
IGM Financial manages environmental risks across the Company, with business unit management having responsibility for identifying, assessing, controlling and monitoring environmental risks pertaining to their operations. IGM Financial’s Executive Management Corporate Responsibility Committee oversees its commitment to environmental responsibility and risk management.
Investors Group and Mackenzie are signatories to the Principles for Responsible Investment (PRI). Under the PRI, investors formally commit to incorporate environmental, social and governance (ESG) issues into their investment processes. In addition, Investors Group, Mackenzie and Investment Planning Counsel have implemented investing policies which provide information on how these ESG issues are implemented at each company.
IGM Financial reports on its environmental management and performance in its Corporate Responsibility Report. In addition, the Company participates in the Carbon Disclosure Project (CDP) survey, which promotes corporate disclosures on greenhouse gas emissions and climate change management.
C 42 POWER FINANCIAL CORPORATION�— �FIRST QUARTER REPORT 2018
PFC_QUAT1_Eng03_IGM_2018-05-05_v1.indd D42PFC_QUAT1_Eng03_IGM_2018-05-05_v1.indd D42 18-05-09 1:40 PM18-05-09 1:40 PM

PA
RT
C
IGM
FINA
NC
IAL IN
C.
46 IGM FINANCIAL INC. FIRST QUARTER REPORT 2018 / MANAGEMENT’S DISCUSSION AND ANALYSIS
THE FINANCIAL SERVICES ENVIRONMENTCanadians held $4.1 trillion in discretionary financial assets with financial institutions at December 31, 2016 based on the most recent report from Investor Economics. The nature of holdings was diverse, ranging from demand deposits held for short-term cash management purposes to longer-term investments held for retirement purposes. Approximately 66% ($2.7 trillion) of these financial assets are held within the context of a relationship with a financial advisor, and this is the primary channel serving the longer-term savings needs of Canadians. Of the $1.4 trillion held outside of a financial advisory relationship, approximately 60% consisted of bank deposits.
Financial advisors represent the primary distribution channel for the Company’s products and services, and the core emphasis of the Company’s business model is to support these financial advisors as they work with clients to plan for and achieve their financial goals. Multiple sources of emerging research show significantly better financial outcomes for Canadians who use financial advisors compared to those who do not. The Company actively promotes the value of financial advice and the importance of a relationship with an advisor to develop and remain focused on long-term financial plans and goals.
Approximately 41% of Canadian discretionary financial assets or $1.7 trillion resided in investment funds at December 31, 2016, making it the largest financial asset class held by Canadians. Other asset types include deposit products and direct securities such as stocks and bonds. Approximately 78% of investment funds are comprised of mutual fund products, with other product categories including segregated funds, hedge funds, pooled funds, closed end funds and exchange traded funds. With $149 billion in investment fund assets under management, the Company is among the country’s largest investment fund managers. Management believes that investment funds are likely to remain the preferred savings vehicle of Canadians. Investment funds provide investors with the benefits of diversification, professional management, flexibility and convenience, and are available in a broad range of mandates and structures to meet most investor requirements and preferences.
Competition and technology have fostered a trend towards financial service providers offering a comprehensive range of proprietary products and services. Traditional distinctions between bank branches, full service brokerages, financial planning firms and insurance agent sales forces have become obscured as many of these financial service providers strive to offer comprehensive financial advice implemented through access to a broad product shelf. Accordingly, the Canadian financial services industry is characterized by a number of large, diversified, vertically-integrated participants, similar to IGM Financial, who offer both financial planning and investment management services.
Canadian banks distribute financial products and services through their traditional bank branches, as well as through their full service and discount brokerage subsidiaries. Bank branches continue to place increased emphasis on both financial planning and mutual funds. In addition, each of the “big six” banks has one or more mutual fund management subsidiaries. Collectively, mutual fund assets of the “big six” bank-owned mutual fund managers and affiliated firms represented 45% of total industry long-term mutual fund assets at March 31, 2018.
The Canadian mutual fund industry continues to be very concentrated, with the ten largest firms and their subsidiaries representing 74% of industry long-term mutual fund assets and 74% of total mutual fund assets under management at March 31, 2018. Management anticipates continuing consolidation in this segment of the industry as smaller participants are acquired by larger organizations.
Management believes that the financial services industry will continue to be influenced by the following trends:
• Shifting demographics as the number of Canadians in their prime savings and retirement years continue to increase.
• Changes in investor attitudes based on economic conditions.
• Continued importance of the role of the financial advisor.
• Public policy related to retirement savings.
• Changes in the regulatory environment.
• An evolving competitive landscape.
• Advancing and changing technology.
THE COMPETITIVE LANDSCAPEIGM Financial and its subsidiaries operate in a highly competitive environment. Investors Group and Investment Planning Counsel compete directly with other retail financial service providers, including other financial planning firms, as well as full service brokerages, banks and insurance companies. Investors Group, Mackenzie and Investment Planning Counsel compete directly with other investment managers for assets under management, and their products compete with stocks, bonds and other asset classes for a share of the investment assets of Canadians.
Competition from other financial service providers, alternative product types or delivery channels, and changes in regulations or public preferences could impact the characteristics of product and service offerings of the Company, including pricing, product structures, dealer and advisor compensation and disclosure. The Company monitors developments on an ongoing basis, and engages in policy discussions and develops product and service responses as appropriate.
OUTLOOK
POWER FINANCIAL CORPORATION�— �FIRST QUARTER REPORT 2018 C 43
PFC_QUAT1_Eng03_IGM_2018-05-05_v1.indd D43PFC_QUAT1_Eng03_IGM_2018-05-05_v1.indd D43 18-05-09 1:40 PM18-05-09 1:40 PM

PA
RT
C
IGM
FIN
AN
CIA
L IN
C.
IGM FINANCIAL INC. FIRST QUARTER REPORT 2018 / MANAGEMENT’S DISCUSSION AND ANALYSIS 47
IGM Financial continues to focus on its commitment to provide quality investment advice and financial products, service innovations, effective management of the Company and long-term value for its clients and shareholders. Management believes that the Company is well-positioned to meet competitive challenges and capitalize on future opportunities.
The Company enjoys several competitive strengths, including:
• Broad and diversified distribution with an emphasis on those channels emphasizing comprehensive financial planning through a relationship with a financial advisor.
• Broad product capabilities, leading brands and quality sub-advisory relationships.
• Enduring client relationships and the long-standing heritages and cultures of its subsidiaries.
• Benefits of being part of the Power Financial group of companies.
BROAD AND DIVERSIFIED DISTRIBUTION
IGM Financial’s distribution strength is a competitive advantage. In addition to owning two of Canada’s largest financial planning organizations, Investors Group and Investment Planning Counsel, IGM Financial has, through Mackenzie, access to distribution through over 30,000 independent financial advisors.
Mackenzie also, in its growing strategic alliance business, partners with Canadian and U.S. manufacturing and distribution complexes to provide investment management to a number of retail investment fund mandates.
BROAD PRODUCT CAPABILITIES
IGM Financial’s subsidiaries continue to develop and launch innovative products and strategic investment planning tools to assist advisors in building optimized portfolios for clients.
ENDURING RELATIONSHIPS
IGM Financial enjoys significant advantages as a result of the enduring relationships that advisors enjoy with clients. In addition, the Company’s subsidiaries have strong heritages and cultures which are challenging for competitors to replicate.
BENEFITS OF BEING PART OF THE POWER FINANCIAL GROUP OF COMPANIES
As part of the Power Financial group of companies, IGM Financial benefits through expense savings from shared service arrangements, as well as through access to distribution, products and capital.
C 44 POWER FINANCIAL CORPORATION�— �FIRST QUARTER REPORT 2018
PFC_QUAT1_Eng03_IGM_2018-05-05_v1.indd D44PFC_QUAT1_Eng03_IGM_2018-05-05_v1.indd D44 18-05-09 1:40 PM18-05-09 1:40 PM
PA
RT
C
IGM
FINA
NC
IAL IN
C.
48 IGM FINANCIAL INC. FIRST QUARTER REPORT 2018 / MANAGEMENT’S DISCUSSION AND ANALYSIS
SUMMARY OF CRITICAL ACCOUNTING ESTIMATESThere were no changes to the Company’s assumptions related to critical accounting estimates from those reported at December 31, 2017.
CHANGES IN ACCOUNTING POLICIESIFRS 9 FINANCIAL INSTRUMENTS (IFRS 9)
As of January 1, 2018, the Company has adopted IFRS 9 which replaces IAS 39, Financial Instruments: Recognition and Measurement (IAS 39). IFRS 9 was completed in three separate phases:
• Classification and measurement: This phase requires that financial assets be classified at either amortized cost or fair value on the basis of the entity’s business model for managing the financial assets and the contractual cash flow characteristics of the financial assets.
• Impairment methodology: This phase replaces the incurred loss model for impairment of financial assets with an expected credit loss model.
• Hedge accounting: This phase replaces the rule-based hedge accounting requirements with guidance that more closely aligns the accounting with an entity’s risk management activities.
The Company has elected not to restate its comparative financial information for the effect of applying IFRS 9, as permitted by the transitional provisions within IFRS 9. The cumulative impact of applying IFRS 9 has therefore been recognized as an adjustment to the current period’s opening retained earnings and comparative information continues to be presented in accordance with IAS 39.
The cumulative impact relating to classification and measurement under IFRS 9 has resulted in an after tax increase to opening retained earnings of approximately $36.3 million ($49.7 million before tax) as at January 1, 2018.
Loans of $282.6 million previously classified as held for trading were reclassified to amortized cost as a result of the Company’s business model and contractual cash flow characteristics assessment.
A total remeasurement of $49.7 million was recorded due to the reversal of discounts related to fair value losses recognized on the loans and the capitalization of previously expensed mortgage issue costs.
Securities of $19.9 million were reclassified from available for sale to fair value through profit or loss (FVTPL).
The Company elected to classify securities of $262.8 million at fair value through other comprehensive income (FVTOCI). This
reclassification had no impact to opening retained earnings, however under this election, unrealized gains and losses on these investments will never be recycled through profit or loss.
The Company has adopted the hedge accounting requirements of IFRS 9. As a result of the business model assessment, mortgages previously classified as held for trading and subsequently reclassified to loans and receivables are now classified at amortized cost when originated. The Company has therefore designated certain derivative instruments as hedging instruments to avoid an accounting mismatch between derivative instruments and associated loans. Application of IFRS 9 hedge accounting requirements did not have a material impact in the first quarter of 2018.
The application of the expected credit loss model did not have a material impact to the Company’s loan loss provision.
Table 23 details the impact of IFRS 9 and IFRS 15 on the Consolidated Balance Sheet as at January 1, 2018.
IFRS 15 REVENUE FROM CONTRACTS WITH CUSTOMERS (IFRS 15)
As of January 1, 2018, the Company has adopted IFRS 15 which outlines a single comprehensive model for entities to use in accounting for revenue arising from contracts with customers. The model requires an entity to recognize revenue as the goods or services are transferred to the customer in an amount that reflects the expected consideration.
IFRS 15 outlines various criteria for the eligibility of capitalizing contract costs. Determining whether the customer is the fund or the end investor impacts whether costs should be capitalized as a cost of obtaining a contract with a customer or whether they should be assessed as a cost of fulfilling a contract with a customer.
To determine whether sales commissions associated with the distribution of investment funds should be capitalized, the Company assesses whether the customer is the investment fund or the individual investor. Where it is determined that the investment fund is the customer, contract costs are expensed as incurred. Where it is determined that the individual investor is the customer, contract costs are capitalized and amortized over a period not exceeding seven years.
The Company has elected not to restate its comparative financial information for the effect of applying IFRS 15, as permitted by the transitional provisions within IFRS 15. The cumulative impact of applying IFRS 15 has therefore been recognized as an adjustment to the current period’s opening retained earnings and comparative information continues to be presented in accordance with the Company’s accounting policies in effect as at December 31, 2017.
CRITICAL ACCOUNTING ESTIMATES AND POLICIES
POWER FINANCIAL CORPORATION�— �FIRST QUARTER REPORT 2018 C 45
PFC_QUAT1_Eng03_IGM_2018-05-05_v1.indd D45PFC_QUAT1_Eng03_IGM_2018-05-05_v1.indd D45 18-05-09 1:40 PM18-05-09 1:40 PM

PA
RT
C
IGM
FIN
AN
CIA
L IN
C.
IGM FINANCIAL INC. FIRST QUARTER REPORT 2018 / MANAGEMENT’S DISCUSSION AND ANALYSIS 49
The cumulative impact from the application of IFRS 15 has resulted in an after tax decrease to opening retained earnings of approximately $514.6 million ($703.5 million before tax) as at January 1, 2018.
Capitalized sales commissions of $703.5 million were derecognized as they related to commissions paid on sales where the customer was the investment fund. This resulted in a decrease to the Company’s Deferred income taxes liability of $188.9 million.
On January 1, 2018, Great-West Lifeco Inc. (Lifeco) also adopted IFRS 15 (Note 6). The impact from Lifeco’s application of IFRS 15 has resulted in a decrease in the Company’s investment in associates of $1.7 million and a decrease in opening retained earnings of $1.7 million as at January 1, 2018.
Table 23 details the impact of IFRS 9 and IFRS 15 on the Consolidated Balance Sheet as at January 1, 2018.
FUTURE ACCOUNTING CHANGESThe Company continuously monitors the potential changes proposed by the International Accounting Standards Board
TABLE 23: IMPACT OF IFRS 9 AND IFRS 15 ON BALANCE SHEET
DECEMBER 31, 2017 ADJUSTMENT DUE TO CHANGES IN : JANUARY 1, 2018 CARRYING CARRYING ($ millions) CLASSIFICATION VALUE CLASSIFICATION MEASUREMENT VALUE CLASSIFICATION
Assets Loans(1) Held for trading 286.7 (282.6) – 4.1 FVTPL Loans & receivables 7,563.2 282.6 49.7 7,895.5 Amortized Cost
7,849.9 – 49.7 7,899.6
Securities(1) Available for sale 282.7 (19.9) – 262.8 FVTOCI FVTPL 97.0 19.9 – 116.9 FVTPL
Investment in associates(2) 1,551.0 – (1.7) 1,549.3Capitalized sales commissions(2) 767.3 – (703.5) 63.8
– (655.5)
Liabilities & Shareholders’ Equity Income tax payable(1) 8.0 – 6.9 14.9 Deferred income taxes(1)(2) 463.9 – (182.4) 281.5 Retained earnings(1)(2) 3,100.8 – (480.0) 2,620.8 AOCI(1) (71.1) – – (71.1)
– (655.5)
(1) Transition to IFRS 9
(2) Transition to IFRS 15
(IASB) and analyzes the effect that changes in the standards may have on the Company’s operations.
IFRS 16 LEASES
The IASB issued IFRS 16 which requires a lessee to recognize a right-of-use asset representing its right to use the underlying leased asset and a corresponding lease liability representing its obligation to make lease payments for all leases. A lessee recognizes the related expense as depreciation on the right-of-use asset and interest on the lease liability. Short-term (less than 12 months) and low-value asset leases are exempt from these requirements. The standard is effective for annual reporting periods beginning on or after January 1, 2019. The impact of this standard is currently being assessed.
OTHER
The IASB is currently undertaking a number of projects which will result in changes to existing IFRS standards that may affect the Company. Updates will be provided as the projects develop.
C 46 POWER FINANCIAL CORPORATION�— �FIRST QUARTER REPORT 2018
PFC_QUAT1_Eng03_IGM_2018-05-05_v1.indd D46PFC_QUAT1_Eng03_IGM_2018-05-05_v1.indd D46 18-05-09 1:40 PM18-05-09 1:40 PM
PA
RT
C
IGM
FINA
NC
IAL IN
C.
50 IGM FINANCIAL INC. FIRST QUARTER REPORT 2018 / MANAGEMENT’S DISCUSSION AND ANALYSIS
TRANSACTIONS WITH RELATED PARTIESThere were no changes to the types of related party transactions from those reported at December 31, 2017. For further information on transactions involving related parties, see Notes 8 and 25 to the Company’s Annual Financial Statements.
OUTSTANDING SHARE DATAOutstanding common shares of IGM Financial as at March 31, 2018 totalled 240,805,907. Outstanding stock options as at March 31, 2018 totalled 9,920,491, of which 4,786,733 were
exercisable. As at April 30, 2018, outstanding common shares totalled 240,805,907 and outstanding stock options totalled 9,914,708 of which 4,781,368 were exercisable.
Perpetual preferred shares of $150 million were outstanding as at March 31, 2018, unchanged at April 30, 2018.
SEDARAdditional information relating to IGM Financial, including the Company’s most recent financial statements and Annual Information Form, is available at www.sedar.com.
OTHER INFORMATION
During the first quarter of 2018, there have been no changes in the Company’s internal control over financial reporting that have materially affected, or are reasonably likely to materially affect, the Company’s internal control over financial reporting.
INTERNAL CONTROL OVER FINANCIAL REPORTING
POWER FINANCIAL CORPORATION�— �FIRST QUARTER REPORT 2018 C 47
PFC_QUAT1_Eng03_IGM_2018-05-05_v1.indd D47PFC_QUAT1_Eng03_IGM_2018-05-05_v1.indd D47 18-05-09 1:40 PM18-05-09 1:40 PM

PA
RT
C
IGM
FIN
AN
CIA
L IN
C.
IGM FINANCIAL INC. FIRST QUARTER REPORT 2018 | INTERIM CONDENSED CONSOLIDATED FINANCIAL STATEMENTS 51
CONSOLIDATED STATEMENTS OF EARNINGS
INTERIM CONDENSED CONSOLIDATED FINANCIAL STATEMENTS
(unaudited) THREE MONTHS ENDED MARCH 31
(in thousands of Canadian dollars, except shares and per share amounts) 2018 2017
Revenues Management fees $ 556,601 $ 527,701 Administration fees 107,534 108,964 Distribution fees 93,320 105,260 Net investment income and other 14,209 19,757 Proportionate share of associates’ earnings 37,984 28,019
809,648 789,701
Expenses Commission 286,098 289,307 Non-commission 253,145 246,901 Interest 30,264 26,787
569,507 562,995
Earnings before income taxes 240,141 226,706Income taxes 52,390 47,374
Net earnings 187,751 179,332Perpetual preferred share dividends 2,213 2,213
Net earnings available to common shareholders $ 185,538 $ 177,119
Earnings per share (in dollars) (Note 15)
– Basic $ 0.77 $ 0.74 – Diluted $ 0.77 $ 0.74
(See accompanying notes to interim condensed consolidated financial statements.)
C 48 POWER FINANCIAL CORPORATION�— �FIRST QUARTER REPORT 2018
PFC_QUAT1_Eng03_IGM_2018-05-05_v1.indd D48PFC_QUAT1_Eng03_IGM_2018-05-05_v1.indd D48 18-05-09 1:40 PM18-05-09 1:40 PM

PA
RT
C
IGM
FINA
NC
IAL IN
C.
IGM FINANCIAL INC. FIRST QUARTER REPORT 2018 | INTERIM CONDENSED CONSOLIDATED FINANCIAL STATEMENTS52
CONSOLIDATED STATEMENTS OF COMPREHENSIVE INCOME
(unaudited) THREE MONTHS ENDED MARCH 31
(in thousands of Canadian dollars) 2018 2017
Net earnings $ 187,751 $ 179,332
Other comprehensive income (loss), net of tax Items that will not be reclassified to Net earnings Fair value through other comprehensive income securities Other comprehensive income (loss), net of tax of $429 (2,746) N/A
Employee benefits Net actuarial gains (losses), net of tax of $1,269 and $2,939 (3,427) (7,948) Investment in associates – employee benefits and other Other comprehensive income (loss), net of tax of nil (2,875) 13,590
Items that may be reclassified subsequently to Net earnings Available for sale securities Net unrealized gains (losses), net of tax of $(193) N/A 1,007 Reclassification of realized (gains) losses to net earnings, net of tax of $7 N/A (19)
N/A 988 Investment in associates and other Other comprehensive income (loss), net of tax of $(4,422) and $(1,663) 40,937 6,333
31,889 12,963
Total comprehensive income $ 219,640 $ 192,295
(See accompanying notes to interim condensed consolidated financial statements.)
POWER FINANCIAL CORPORATION�— �FIRST QUARTER REPORT 2018 C 49
PFC_QUAT1_Eng03_IGM_2018-05-05_v1.indd D49PFC_QUAT1_Eng03_IGM_2018-05-05_v1.indd D49 18-05-09 1:40 PM18-05-09 1:40 PM

PA
RT
C
IGM
FIN
AN
CIA
L IN
C.
IGM FINANCIAL INC. FIRST QUARTER REPORT 2018 | INTERIM CONDENSED CONSOLIDATED FINANCIAL STATEMENTS 53
CONSOLIDATED BALANCE SHEETS
(unaudited) MARCH 31 DECEMBER 31 (in thousands of Canadian dollars) 2018 2017
Assets Cash and cash equivalents $ 778,243 $ 966,843 Securities (Note 3) 421,922 379,696 Client funds on deposit 454,754 489,626 Accounts and other receivables 310,793 305,062 Income taxes recoverable 32,273 33,928 Loans (Note 4) 7,883,307 7,849,873 Derivative financial instruments 28,415 35,692 Other assets 47,444 64,558 Investment in associates (Note 6) 1,616,489 1,551,013 Capital assets 148,983 150,468 Capitalized sales commissions (Note 7) 77,168 767,315 Deferred income taxes 50,953 60,661 Intangible assets 1,184,469 1,184,451 Goodwill 2,660,267 2,660,267
$ 15,695,480 $ 16,499,453
Liabilities Accounts payable and accrued liabilities $ 359,264 $ 406,821 Income taxes payable 12,210 8,018 Derivative financial instruments 33,967 28,444 Deposits and certificates 473,133 504,996 Other liabilities 468,536 491,280 Obligations to securitization entities (Note 5) 7,604,249 7,596,028 Deferred income taxes 286,186 463,862 Long-term debt (Note 8) 2,025,000 2,175,000
11,262,545 11,674,449
Shareholders’ Equity Share capital Perpetual preferred shares 150,000 150,000 Common shares 1,608,960 1,602,726 Contributed surplus 42,877 42,633 Retained earnings 2,670,322 3,100,775 Accumulated other comprehensive income (loss) (39,224) (71,130)
4,432,935 4,825,004
$ 15,695,480 $ 16,499,453
These interim condensed consolidated financial statements were approved and authorized for issuance by the Board of Directors on May 4, 2018.
(See accompanying notes to interim condensed consolidated financial statements.)
C 50 POWER FINANCIAL CORPORATION�— �FIRST QUARTER REPORT 2018
PFC_QUAT1_Eng03_IGM_2018-05-05_v1.indd D50PFC_QUAT1_Eng03_IGM_2018-05-05_v1.indd D50 18-05-09 1:40 PM18-05-09 1:40 PM

PA
RT
C
IGM
FINA
NC
IAL IN
C.
IGM FINANCIAL INC. FIRST QUARTER REPORT 2018 | INTERIM CONDENSED CONSOLIDATED FINANCIAL STATEMENTS54
CONSOLIDATED STATEMENTS OF CHANGES IN SHAREHOLDERS’ EQUITY
THREE MONTHS ENDED MARCH 31
SHARE CAPITAL
ACCUMULATED PERPETUAL OTHER PREFERRED COMMON COMPREHENSIVE TOTAL (unaudited) SHARES SHARES CONTRIBUTED RETAINED INCOME (LOSS) SHAREHOLDERS’ (in thousands of Canadian dollars) (Note 9) (Note 9) SURPLUS EARNINGS (Note 12) EQUITY
2018
Balance, beginning of period As previously reported $ 150,000 $ 1,602,726 $ 42,633 $ 3,100,775 $ (71,130) $ 4,825,004 Change in accounting policy (Note 2)
IFRS 9 – – – 36,334 17 36,351 IFRS 15 – – – (516,312) – (516,312)
As restated 150,000 1,602,726 42,633 2,620,797 (71,113) 4,345,043
Net earnings – – – 187,751 – 187,751Other comprehensive income (loss), net of tax – – – – 31,889 31,889
Total comprehensive income – – – 187,751 31,889 219,640
Common shares Issued under stock option plan – 6,234 – – – 6,234Stock options Current period expense – – 906 – – 906 Exercised – – (662) – – (662)Perpetual preferred share dividends – – – (2,213) – (2,213)Common share dividends – – – (135,451) – (135,451)Other – – – (562) – (562)
Balance, end of period $ 150,000 $ 1,608,960 $ 42,877 $ 2,670,322 $ (39,224) $ 4,432,935
2017
Balance, beginning of period $ 150,000 $ 1,597,208 $ 39,552 $ 3,042,442 $ (82,442) $ 4,746,760
Net earnings – – – 179,332 – 179,332Other comprehensive income (loss), net of tax – – – – 12,963 12,963
Total comprehensive income – – – 179,332 12,963 192,295
Common shares Issued under stock option plan – 1,961 – – – 1,961Stock options Current period expense – – 906 – – 906 Exercised – – (104) – – (104)Perpetual preferred share dividends – – – (2,213) – (2,213)Common share dividends – – – (135,329) – (135,329)Other – – – (80) – (80)
Balance, end of period $ 150,000 $ 1,599,169 $ 40,354 $ 3,084,152 $ (69,479) $ 4,804,196
(See accompanying notes to interim condensed consolidated financial statements.)
POWER FINANCIAL CORPORATION�— �FIRST QUARTER REPORT 2018 C 51
PFC_QUAT1_Eng03_IGM_2018-05-05_v1.indd D51PFC_QUAT1_Eng03_IGM_2018-05-05_v1.indd D51 18-05-09 1:40 PM18-05-09 1:40 PM

PA
RT
C
IGM
FIN
AN
CIA
L IN
C.
IGM FINANCIAL INC. FIRST QUARTER REPORT 2018 | INTERIM CONDENSED CONSOLIDATED FINANCIAL STATEMENTS 55
CONSOLIDATED STATEMENTS OF CASH FLOWS
(unaudited) THREE MONTHS ENDED MARCH 31
(in thousands of Canadian dollars) 2018 2017
Operating activities Earnings before income taxes $ 240,141 $ 226,706 Income taxes paid (38,373) (43,770) Adjustments to determine net cash from operating activities Capitalized sales commission amortization 2,928 58,893 Amortization of capital and intangible assets 13,872 11,630 Changes in operating assets and liabilities and other (72,544) (55,405)
Cash from operating activities before payment of capitalized sales commissions 146,024 198,054 Capitalized sales commissions paid (16,275) (81,383)
129,749 116,671
Financing activities Net (decrease) increase in deposits and certificates (551) 718 Net increase (decrease) in obligations to securitization entities 2,324 (74,004) Issue of debentures – 600,000 Repayment of debentures (150,000) – Issue of common shares 5,572 1,857 Perpetual preferred share dividends paid (2,213) (2,213) Common share dividends paid (135,375) (135,290)
(280,243) 391,068
Investing activities Purchase of securities (50,240) (27,034) Proceeds from the sale of securities 25,805 25,450 Net decrease in loans 13,898 99,618 Net additions to capital assets (4,512) (5,989) Net cash used in additions to intangible assets and acquisitions (23,057) (7,943)
(38,106) 84,102
(Decrease) increase in cash and cash equivalents (188,600) 591,841Cash and cash equivalents, beginning of period 966,843 611,032
Cash and cash equivalents, end of period $ 778,243 $ 1,202,873
Cash $ 49,566 $ 65,945Cash equivalents 728,677 1,136,928
$ 778,243 $ 1,202,873
Supplemental disclosure of cash flow information related to operating activities Interest and dividends received $ 69,925 $ 67,227 Interest paid $ 65,917 $ 48,348
(See accompanying notes to interim condensed consolidated financial statements.)
C 52 POWER FINANCIAL CORPORATION�— �FIRST QUARTER REPORT 2018
PFC_QUAT1_Eng03_IGM_2018-05-05_v1.indd D52PFC_QUAT1_Eng03_IGM_2018-05-05_v1.indd D52 18-05-09 1:40 PM18-05-09 1:40 PM

PA
RT
C
IGM
FINA
NC
IAL IN
C.
IGM FINANCIAL INC. FIRST QUARTER REPORT 2018 | NOTES TO THE INTERIM CONDENSED CONSOLIDATED FINANCIAL STATEMENTS56
NOTES TO THE INTERIM CONDENSED CONSOLIDATED FINANCIAL STATEMENTSMarch 31, 2018 (unaudited) (In thousands of Canadian dollars, except shares and per share amounts)
NOTE 1 CORPORATE INFORMATION
IGM Financial Inc. (the Company) is a publicly listed company (TSX: IGM), incorporated and domiciled in Canada. The registered address of the Company is 447 Portage Avenue, Winnipeg, Manitoba, Canada. The Company is controlled by Power Financial Corporation.
IGM Financial Inc. is a financial services company which serves the financial needs of Canadians through its principal subsidiaries, each operating distinctly within the advice segment of the financial services market. The Company’s wholly-owned principal subsidiaries are Investors Group Inc. and Mackenzie Financial Corporation.
NOTE 2 SUMMARY OF SIGNIFICANT ACCOUNTING POLICIES
The unaudited Interim Condensed Consolidated Financial Statements of the Company (Interim Financial Statements) have been prepared in accordance with International Accounting Standard 34, Interim Financial Reporting, using the accounting policies as set out in this note and in Note 2 to the Consolidated Financial Statements for the year ended December 31, 2017. The Interim Financial Statements should be read in conjunction with the Consolidated Financial Statements in the 2017 IGM Financial Inc. Annual Report.
CHANGES IN ACCOUNTING POLICIES
IFRS 9 FINANCIAL INSTRUMENTS (IFRS 9)
As of January 1, 2018, the Company has adopted IFRS 9 which replaces IAS 39, Financial Instruments: Recognition and Measurement (IAS 39). IFRS 9 was completed in three separate phases:
• Classification and measurement: This phase requires that financial assets be classified at either amortized cost or fair value on the basis of the entity’s business model for managing the financial assets and the contractual cash flow characteristics of the financial assets.
• Impairment methodology: This phase replaces the incurred loss model for impairment of financial assets with an expected credit loss model.
• Hedge accounting: This phase replaces the rule-based hedge accounting requirements with guidance that more closely aligns the accounting with an entity’s risk management activities.
The Company has elected not to restate its comparative financial information for the effect of applying IFRS 9, as permitted by the transitional provisions within IFRS 9. The cumulative impact of applying IFRS 9 has therefore been recognized as an adjustment to the current period’s opening retained earnings and comparative information continues to be presented in accordance with IAS 39.
The cumulative impact relating to classification and measurement under IFRS 9 has resulted in an after tax increase to opening retained earnings of approximately $36.3 million ($49.7 million before tax) as at January 1, 2018.
Loans of $282.6 million previously classified as held for trading were reclassified to amortized cost as a result of the Company’s business model and contractual cash flow characteristics assessment.
A total remeasurement of $49.7 million was recorded due to the reversal of discounts related to fair value losses recognized on the loans and the capitalization of previously expensed mortgage issue costs.
Securities of $19.9 million were reclassified from available for sale to fair value through profit or loss (FVTPL).
The Company elected to classify securities of $262.8 million at fair value through other comprehensive income (FVTOCI). This reclassification had no impact to opening retained earnings, however under this election, unrealized gains and losses on these investments will never be recycled through profit or loss.
POWER FINANCIAL CORPORATION�— �FIRST QUARTER REPORT 2018 C 53
PFC_QUAT1_Eng03_IGM_2018-05-05_v1.indd D53PFC_QUAT1_Eng03_IGM_2018-05-05_v1.indd D53 18-05-09 1:40 PM18-05-09 1:40 PM

PA
RT
C
IGM
FIN
AN
CIA
L IN
C.
IGM FINANCIAL INC. FIRST QUARTER REPORT 2018 | NOTES TO THE INTERIM CONDENSED CONSOLIDATED FINANCIAL STATEMENTS 57
NOTE 2 SUMMARY OF SIGNIFICANT ACCOUNTING POLICIES (continued)
CHANGES IN ACCOUNTING POLICIES (continued)
IFRS 9 FINANCIAL INSTRUMENTS (IFRS 9) (continued)
The Company has adopted the hedge accounting requirements of IFRS 9. As a result of the business model assessment, mortgages previously classified as held for trading and subsequently reclassified to loans and receivables are now classified at amortized cost when originated. The Company has therefore designated certain derivative instruments as hedging instruments to avoid an accounting mismatch between derivative instruments and associated loans. Application of IFRS 9 hedge accounting requirements did not have a material impact in the first quarter of 2018.
The application of the expected credit loss model did not have a material impact to the Company’s loan loss provision.
IFRS 15 REVENUE FROM CONTRACTS WITH CUSTOMERS (IFRS 15)
As of January 1, 2018, the Company has adopted IFRS 15 which outlines a single comprehensive model for entities to use in accounting for revenue arising from contracts with customers. The model requires an entity to recognize revenue as the goods or services are transferred to the customer in an amount that reflects the expected consideration.
IFRS 15 outlines various criteria for the eligibility of capitalizing contract costs. Determining whether the customer is the fund or the end investor impacts whether costs should be capitalized as a cost of obtaining a contract with a customer or whether they should be assessed as a cost of fulfilling a contract with a customer.
To determine whether sales commissions associated with the distribution of investment funds should be capitalized, the Company assesses whether the customer is the investment fund or the individual investor. Where it is determined that the investment fund is the customer, contract costs are expensed as incurred. Where it is determined that the individual investor is the customer, contract costs are capitalized and amortized over a period not exceeding seven years.
The Company has elected not to restate its comparative financial information for the effect of applying IFRS 15, as permitted by the transitional provisions within IFRS 15. The cumulative impact of applying IFRS 15 has therefore been recognized as an adjustment to the current period’s opening retained earnings and comparative information continues to be presented in accordance with the Company’s accounting policies in effect as at December 31, 2017.
The cumulative impact from the Company’s application of IFRS 15 has resulted in an after tax decrease to opening retained earnings of approximately $514.6 million ($703.5 million before tax) as at January 1, 2018.
Capitalized sales commissions of $703.5 million were derecognized as they related to commissions paid on sales where the customer was the investment fund. This resulted in a decrease to the Company’s Deferred income taxes liability of $188.9 million.
On January 1, 2018, Great-West Lifeco Inc. (Lifeco) also adopted IFRS 15 (Note 6). The impact from Lifeco’s application of IFRS 15 has resulted in a decrease in the Company’s investment in associates of $1.7 million and a decrease in opening retained earnings of $1.7 million as at January 1, 2018.
C 54 POWER FINANCIAL CORPORATION�— �FIRST QUARTER REPORT 2018
PFC_QUAT1_Eng03_IGM_2018-05-05_v1.indd D54PFC_QUAT1_Eng03_IGM_2018-05-05_v1.indd D54 18-05-09 1:40 PM18-05-09 1:40 PM
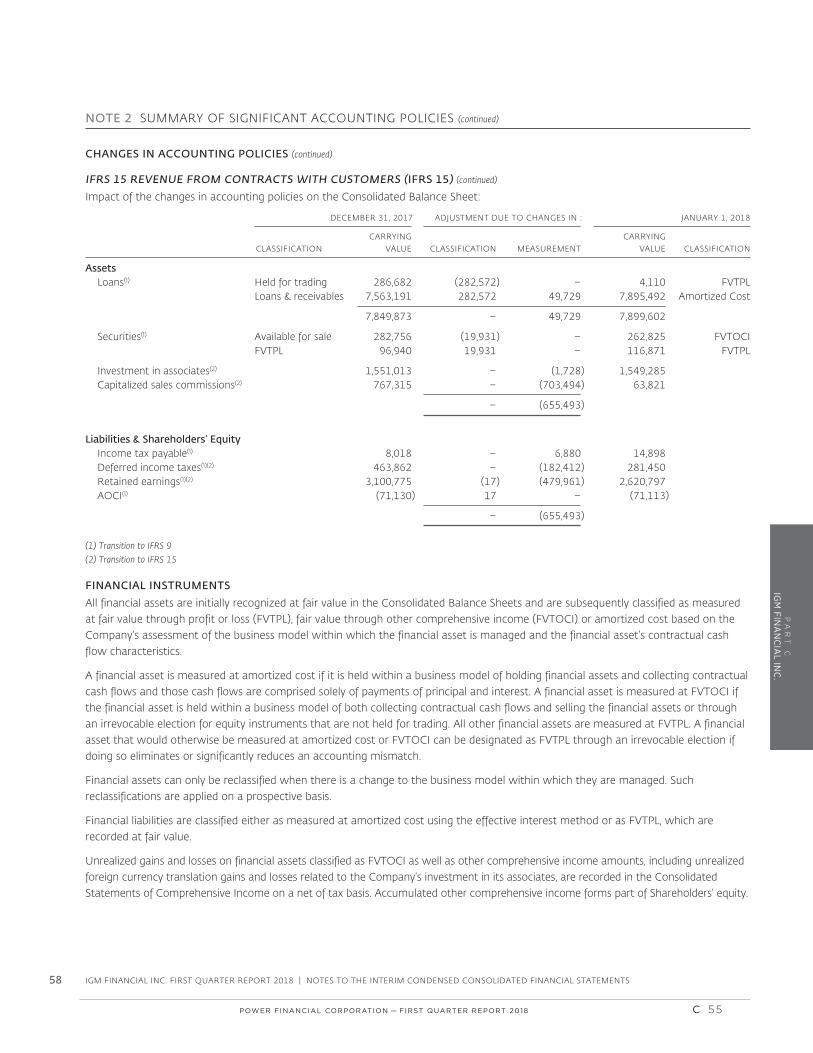
PA
RT
C
IGM
FINA
NC
IAL IN
C.
IGM FINANCIAL INC. FIRST QUARTER REPORT 2018 | NOTES TO THE INTERIM CONDENSED CONSOLIDATED FINANCIAL STATEMENTS58
NOTE 2 SUMMARY OF SIGNIFICANT ACCOUNTING POLICIES (continued)
CHANGES IN ACCOUNTING POLICIES (continued)
IFRS 15 REVENUE FROM CONTRACTS WITH CUSTOMERS (IFRS 15) (continued)
Impact of the changes in accounting policies on the Consolidated Balance Sheet:
DECEMBER 31, 2017 ADJUSTMENT DUE TO CHANGES IN : JANUARY 1, 2018 CARRYING CARRYING CLASSIFICATION VALUE CLASSIFICATION MEASUREMENT VALUE CLASSIFICATION
Assets Loans(1) Held for trading 286,682 (282,572) – 4,110 FVTPL Loans & receivables 7,563,191 282,572 49,729 7,895,492 Amortized Cost
7,849,873 – 49,729 7,899,602
Securities(1) Available for sale 282,756 (19,931) – 262,825 FVTOCI FVTPL 96,940 19,931 – 116,871 FVTPL
Investment in associates(2) 1,551,013 – (1,728) 1,549,285 Capitalized sales commissions(2) 767,315 – (703,494) 63,821
– (655,493)
Liabilities & Shareholders’ Equity Income tax payable(1) 8,018 – 6,880 14,898 Deferred income taxes(1)(2) 463,862 – (182,412) 281,450 Retained earnings(1)(2) 3,100,775 (17) (479,961) 2,620,797 AOCI(1) (71,130) 17 – (71,113)
– (655,493)
(1) Transition to IFRS 9
(2) Transition to IFRS 15
FINANCIAL INSTRUMENTS
All financial assets are initially recognized at fair value in the Consolidated Balance Sheets and are subsequently classified as measured at fair value through profit or loss (FVTPL), fair value through other comprehensive income (FVTOCI) or amortized cost based on the Company’s assessment of the business model within which the financial asset is managed and the financial asset’s contractual cash flow characteristics.
A financial asset is measured at amortized cost if it is held within a business model of holding financial assets and collecting contractual cash flows and those cash flows are comprised solely of payments of principal and interest. A financial asset is measured at FVTOCI if the financial asset is held within a business model of both collecting contractual cash flows and selling the financial assets or through an irrevocable election for equity instruments that are not held for trading. All other financial assets are measured at FVTPL. A financial asset that would otherwise be measured at amortized cost or FVTOCI can be designated as FVTPL through an irrevocable election if doing so eliminates or significantly reduces an accounting mismatch.
Financial assets can only be reclassified when there is a change to the business model within which they are managed. Such reclassifications are applied on a prospective basis.
Financial liabilities are classified either as measured at amortized cost using the effective interest method or as FVTPL, which are recorded at fair value.
Unrealized gains and losses on financial assets classified as FVTOCI as well as other comprehensive income amounts, including unrealized foreign currency translation gains and losses related to the Company’s investment in its associates, are recorded in the Consolidated Statements of Comprehensive Income on a net of tax basis. Accumulated other comprehensive income forms part of Shareholders’ equity.
POWER FINANCIAL CORPORATION�— �FIRST QUARTER REPORT 2018 C 55
PFC_QUAT1_Eng03_IGM_2018-05-05_v1.indd D55PFC_QUAT1_Eng03_IGM_2018-05-05_v1.indd D55 18-05-09 1:40 PM18-05-09 1:40 PM
PA
RT
C
IGM
FIN
AN
CIA
L IN
C.
IGM FINANCIAL INC. FIRST QUARTER REPORT 2018 | NOTES TO THE INTERIM CONDENSED CONSOLIDATED FINANCIAL STATEMENTS 59
SECURITIES
Securities, which are recorded on a trade date basis, are classified as either FVTOCI or FVTPL.
The Company has elected to classify equity securities held for long-term investments as FVTOCI. Unrealized gains and losses on FVTOCI securities are recorded in Other comprehensive income and transferred directly to Retained earnings when realized without being recorded through profit or loss. Dividends declared are recorded in Net investment income and other in the Consolidated Statements of Earnings.
FVTPL securities are held for trading and are comprised of fixed income and equity securities and investments in proprietary investment funds. Unrealized and realized gains and losses, dividends declared, and interest income on these securities are recorded in Net investment income and other in the Consolidated Statements of Earnings.
LOANS
Loans are classified as either FVTPL or amortized cost, based on the Company’s assessment of the business model within which the loan is managed.
Changes in fair value of loans measured at FVTPL are recorded in Net investment income and other in the Consolidated Statements of Earnings. Loans measured at amortized cost are recorded net of an allowance for expected credit losses. Interest income is accounted for on the accrual basis using the effective interest method for all loans and is recorded in Net investment income and other in the Consolidated Statements of Earnings.
The Company applies a three-stage impairment approach to measure expected credit losses on loans: 1) On origination, an allowance for 12-month expected credit losses is established, 2) Lifetime expected credit losses are recognized where there is a significant deterioration of credit quality, and 3) A loan is considered credit impaired when there is no longer reasonable assurance of collection.
SALES COMMISSIONS
Commissions are paid on investment product sales where the Company either receives a fee directly from the client or where it receives a fee directly from the mutual fund.
Commissions paid on investment product sales where the Company receives a fee directly from the client are capitalized and amortized over their estimated useful lives, not exceeding a period of seven years. The Company regularly reviews the carrying value of capitalized sales commissions with respect to any events or circumstances that indicate impairment. Among the tests performed by the Company to assess recoverability is the comparison of the future economic benefits derived from the capitalized sales commission asset in relation to its carrying value.
All other commissions paid on investment product sales are expensed as incurred.
FUTURE ACCOUNTING CHANGES
The Company continuously monitors the potential changes proposed by the International Accounting Standards Board (IASB) and analyzes the effect that changes in the standards may have on the Company’s operations.
IFRS 16 LEASES
The IASB issued IFRS 16 which requires a lessee to recognize a right-of-use asset representing its right to use the underlying leased asset and a corresponding lease liability representing its obligation to make lease payments for all leases. A lessee recognizes the related expense as depreciation on the right-of-use asset and interest on the lease liability. Short-term (less than 12 months) and low-value asset leases are exempt from these requirements. The standard is effective for annual reporting periods beginning on or after January 1, 2019. The impact of this standard is currently being assessed.
NOTE 2 SUMMARY OF SIGNIFICANT ACCOUNTING POLICIES (continued)
C 56 POWER FINANCIAL CORPORATION�— �FIRST QUARTER REPORT 2018
PFC_QUAT1_Eng03_IGM_2018-05-05_v1.indd D56PFC_QUAT1_Eng03_IGM_2018-05-05_v1.indd D56 18-05-09 1:40 PM18-05-09 1:40 PM

PA
RT
C
IGM
FINA
NC
IAL IN
C.
IGM FINANCIAL INC. FIRST QUARTER REPORT 2018 | NOTES TO THE INTERIM CONDENSED CONSOLIDATED FINANCIAL STATEMENTS60
NOTE 3 SECURITIES
MARCH 31, 2018 DECEMBER 31, 2017 FAIR FAIR COST VALUE COST VALUE
Available for sale: Corporate investments $ N/A $ N/A $ 215,050 $ 262,825 Proprietary investment funds N/A N/A 19,601 19,931
N/A N/A 234,651 282,756
Fair value through other comprehensive income Corporate investments 262,182 306,782 N/A N/A
Fair value through profit or loss: Equity securities 18,468 17,365 17,115 17,062 Proprietary investment funds 97,788 97,775 79,575 79,878
116,256 115,140 96,690 96,940
$ 378,438 $ 421,922 $ 331,341 $ 379,696
FAIR VALUE THROUGH OTHER COMPREHENSIVE INCOME
CORPORATE INVESTMENTS
In January 2018, the Company increased its investment in Wealthsimple by a total of $45.0 million including the conversion of a $15.0 million loan to equity. The loan was recorded in Other assets at December 31, 2017.
NOTE 4 LOANS
CONTRACTUAL MATURITY
MARCH 31 DECEMBER 31 1 YEAR 1 – 5 OVER 2018 2017 OR LESS YEARS 5 YEARS TOTAL TOTAL
Amortized cost Residential mortgages $ 1,236,046 $ 6,622,245 $ 10,983 $ 7,869,274 $ 7,563,997
Less: Allowance for expected credit losses 781 806
7,868,493 7,563,191Fair value through profit or loss 14,814 286,682
$ 7,883,307 $ 7,849,873
The change in the collective allowance for expected credit losses is as follows: Balance, beginning of period $ 806 $ 722Write-offs, net of recoveries (213) (612)Provision for credit losses 188 696
Balance, end of period $ 781 $ 806
Total credit impaired loans as at March 31, 2018 were $4,492 (December 31, 2017 – $2,842).
Total interest income on loans was $52.0 million (2017 – $51.5 million). Total interest expense on obligations to securitization entities, related to securitized loans, was $39.9 million (2017 – $33.2 million). Gains realized on the sale of residential mortgages totalled $0.8 million (2017 – $2.1 million). Fair value adjustments related to mortgage banking operations totalled negative $3.9 million (2017 – negative $1.3 million). These amounts were included in Net investment income and other. Net investment income and other also includes other mortgage banking related items including portfolio insurance, issue costs, and other items.
POWER FINANCIAL CORPORATION�— �FIRST QUARTER REPORT 2018 C 57
PFC_QUAT1_Eng03_IGM_2018-05-05_v1.indd D57PFC_QUAT1_Eng03_IGM_2018-05-05_v1.indd D57 18-05-09 1:40 PM18-05-09 1:40 PM
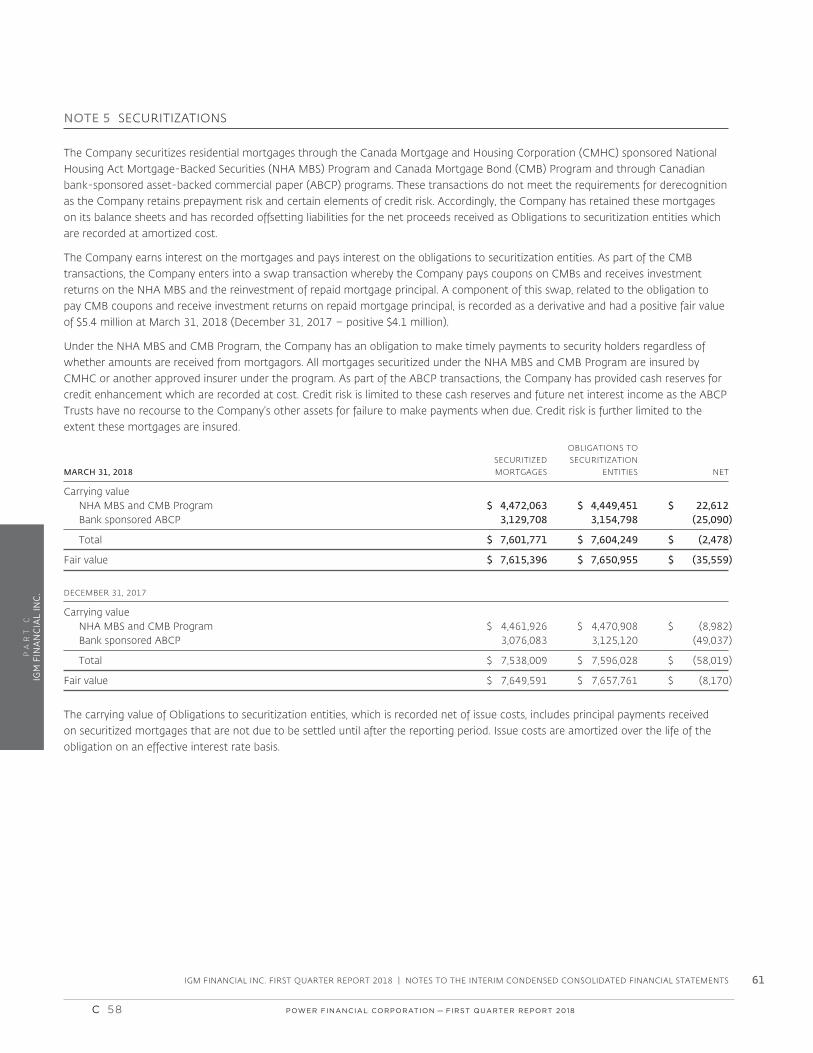
PA
RT
C
IGM
FIN
AN
CIA
L IN
C.
IGM FINANCIAL INC. FIRST QUARTER REPORT 2018 | NOTES TO THE INTERIM CONDENSED CONSOLIDATED FINANCIAL STATEMENTS 61
NOTE 5 SECURITIZATIONS
The Company securitizes residential mortgages through the Canada Mortgage and Housing Corporation (CMHC) sponsored National Housing Act Mortgage-Backed Securities (NHA MBS) Program and Canada Mortgage Bond (CMB) Program and through Canadian bank-sponsored asset-backed commercial paper (ABCP) programs. These transactions do not meet the requirements for derecognition as the Company retains prepayment risk and certain elements of credit risk. Accordingly, the Company has retained these mortgages on its balance sheets and has recorded offsetting liabilities for the net proceeds received as Obligations to securitization entities which are recorded at amortized cost.
The Company earns interest on the mortgages and pays interest on the obligations to securitization entities. As part of the CMB transactions, the Company enters into a swap transaction whereby the Company pays coupons on CMBs and receives investment returns on the NHA MBS and the reinvestment of repaid mortgage principal. A component of this swap, related to the obligation to pay CMB coupons and receive investment returns on repaid mortgage principal, is recorded as a derivative and had a positive fair value of $5.4 million at March 31, 2018 (December 31, 2017 – positive $4.1 million).
Under the NHA MBS and CMB Program, the Company has an obligation to make timely payments to security holders regardless of whether amounts are received from mortgagors. All mortgages securitized under the NHA MBS and CMB Program are insured by CMHC or another approved insurer under the program. As part of the ABCP transactions, the Company has provided cash reserves for credit enhancement which are recorded at cost. Credit risk is limited to these cash reserves and future net interest income as the ABCP Trusts have no recourse to the Company’s other assets for failure to make payments when due. Credit risk is further limited to the extent these mortgages are insured.
OBLIGATIONS TO SECURITIZED SECURITIZATION MARCH 31, 2018 MORTGAGES ENTITIES NET
Carrying value NHA MBS and CMB Program $ 4,472,063 $ 4,449,451 $ 22,612 Bank sponsored ABCP 3,129,708 3,154,798 (25,090)
Total $ 7,601,771 $ 7,604,249 $ (2,478)
Fair value $ 7,615,396 $ 7,650,955 $ (35,559)
DECEMBER 31, 2017
Carrying value NHA MBS and CMB Program $ 4,461,926 $ 4,470,908 $ (8,982) Bank sponsored ABCP 3,076,083 3,125,120 (49,037)
Total $ 7,538,009 $ 7,596,028 $ (58,019)
Fair value $ 7,649,591 $ 7,657,761 $ (8,170)
The carrying value of Obligations to securitization entities, which is recorded net of issue costs, includes principal payments received on securitized mortgages that are not due to be settled until after the reporting period. Issue costs are amortized over the life of the obligation on an effective interest rate basis.
C 58 POWER FINANCIAL CORPORATION�— �FIRST QUARTER REPORT 2018
PFC_QUAT1_Eng03_IGM_2018-05-05_v1.indd D58PFC_QUAT1_Eng03_IGM_2018-05-05_v1.indd D58 18-05-09 1:40 PM18-05-09 1:40 PM
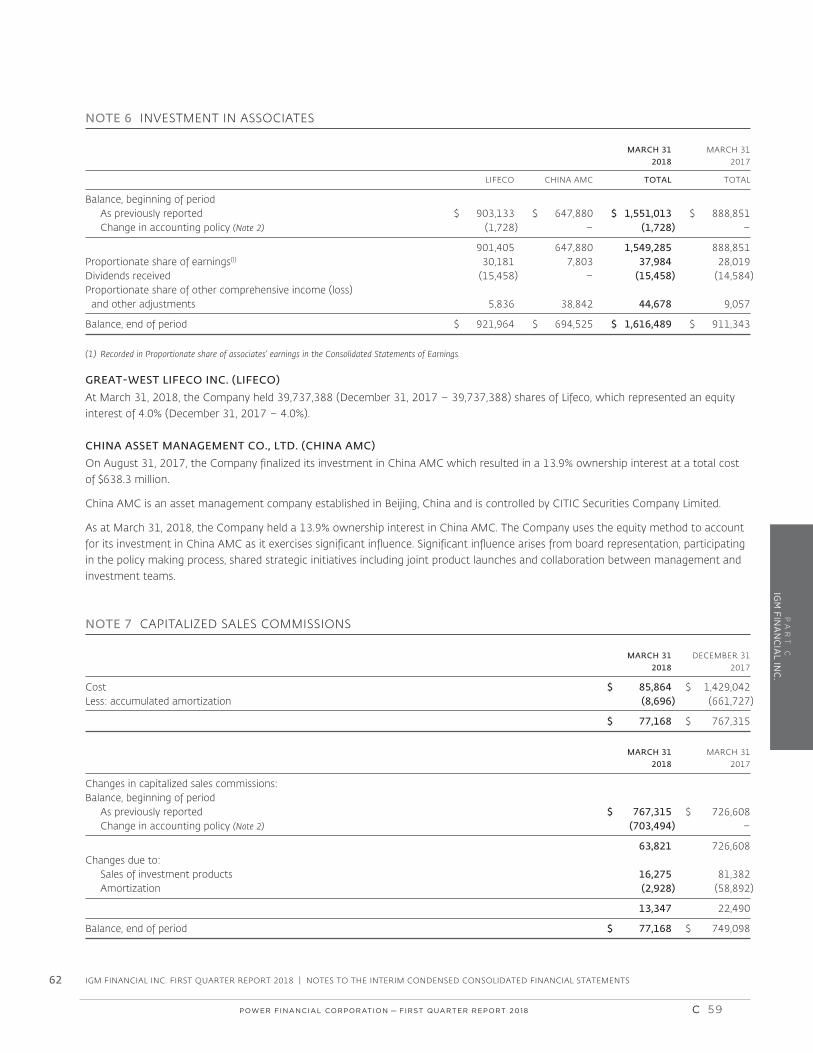
PA
RT
C
IGM
FINA
NC
IAL IN
C.
IGM FINANCIAL INC. FIRST QUARTER REPORT 2018 | NOTES TO THE INTERIM CONDENSED CONSOLIDATED FINANCIAL STATEMENTS62
NOTE 6 INVESTMENT IN ASSOCIATES
MARCH 31 MARCH 31 2018 2017
LIFECO CHINA AMC TOTAL TOTAL
Balance, beginning of period As previously reported $ 903,133 $ 647,880 $ 1,551,013 $ 888,851 Change in accounting policy (Note 2) (1,728) – (1,728) –
901,405 647,880 1,549,285 888,851Proportionate share of earnings(1) 30,181 7,803 37,984 28,019Dividends received (15,458) – (15,458) (14,584)Proportionate share of other comprehensive income (loss) and other adjustments 5,836 38,842 44,678 9,057
Balance, end of period $ 921,964 $ 694,525 $ 1,616,489 $ 911,343
(1) Recorded in Proportionate share of associates’ earnings in the Consolidated Statements of Earnings.
GREAT-WEST LIFECO INC. (LIFECO)
At March 31, 2018, the Company held 39,737,388 (December 31, 2017 – 39,737,388) shares of Lifeco, which represented an equity interest of 4.0% (December 31, 2017 – 4.0%).
CHINA ASSET MANAGEMENT CO., LTD. (CHINA AMC)
On August 31, 2017, the Company finalized its investment in China AMC which resulted in a 13.9% ownership interest at a total cost of $638.3 million.
China AMC is an asset management company established in Beijing, China and is controlled by CITIC Securities Company Limited.
As at March 31, 2018, the Company held a 13.9% ownership interest in China AMC. The Company uses the equity method to account for its investment in China AMC as it exercises significant influence. Significant influence arises from board representation, participating in the policy making process, shared strategic initiatives including joint product launches and collaboration between management and investment teams.
NOTE 7 CAPITALIZED SALES COMMISSIONS
MARCH 31 DECEMBER 31 2018 2017
Cost $ 85,864 $ 1,429,042Less: accumulated amortization (8,696) (661,727)
$ 77,168 $ 767,315
MARCH 31 MARCH 31 2018 2017
Changes in capitalized sales commissions:Balance, beginning of period As previously reported $ 767,315 $ 726,608 Change in accounting policy (Note 2) (703,494) –
63,821 726,608Changes due to: Sales of investment products 16,275 81,382 Amortization (2,928) (58,892)
13,347 22,490
Balance, end of period $ 77,168 $ 749,098
POWER FINANCIAL CORPORATION�— �FIRST QUARTER REPORT 2018 C 59
PFC_QUAT1_Eng03_IGM_2018-05-05_v1.indd D59PFC_QUAT1_Eng03_IGM_2018-05-05_v1.indd D59 18-05-09 1:40 PM18-05-09 1:40 PM

PA
RT
C
IGM
FIN
AN
CIA
L IN
C.
IGM FINANCIAL INC. FIRST QUARTER REPORT 2018 | NOTES TO THE INTERIM CONDENSED CONSOLIDATED FINANCIAL STATEMENTS 63
NOTE 8 LONG-TERM DEBT
The Company’s $150.0 million 6.58% debentures were due and repaid on March 7, 2018.
NOTE 9 SHARE CAPITAL
AUTHORIZED
Unlimited number of: First preferred shares, issuable in series Second preferred shares, issuable in series Class 1 non-voting shares Common shares, no par value
ISSUED AND OUTSTANDING MARCH 31, 2018 MARCH 31, 2017 STATED STATED SHARES VALUE SHARES VALUE
Perpetual preferred shares – classified as equity: First preferred shares, Series B 6,000,000 $ 150,000 6,000,000 $ 150,000
Common shares: Balance, beginning of period 240,666,131 $ 1,602,726 240,515,968 $ 1,597,208 Issued under Stock Option Plan 139,776 6,234 67,955 1,961
Balance, end of period 240,805,907 $ 1,608,960 240,583,923 $ 1,599,169
NORMAL COURSE ISSUER BID
The Company commenced a normal course issuer bid on March 20, 2017 which was effective until March 19, 2018. Pursuant to this bid, the Company was authorized to purchase up to 12.0 million or 5% of its common shares outstanding as at February 28, 2017. There were no common shares purchased through the normal course issuer bid during 2017 and 2018.
NOTE 10 CAPITAL MANAGEMENT
The capital management policies, procedures and activities of the Company are discussed in the Capital Resources section of the Company’s Management’s Discussion and Analysis contained in the First Quarter 2018 Report to Shareholders and in Note 17 to the Consolidated Financial Statements in the 2017 IGM Financial Inc. Annual Report and have not changed significantly since December 31, 2017.
C 60 POWER FINANCIAL CORPORATION�— �FIRST QUARTER REPORT 2018
PFC_QUAT1_Eng03_IGM_2018-05-05_v1.indd D60PFC_QUAT1_Eng03_IGM_2018-05-05_v1.indd D60 18-05-09 1:40 PM18-05-09 1:40 PM

PA
RT
C
IGM
FINA
NC
IAL IN
C.
IGM FINANCIAL INC. FIRST QUARTER REPORT 2018 | NOTES TO THE INTERIM CONDENSED CONSOLIDATED FINANCIAL STATEMENTS64
NOTE 11 SHARE-BASED PAYMENTS
STOCK OPTION PLAN MARCH 31 DECEMBER 31 2018 2017
Common share options – Outstanding 9,920,491 8,912,748 – Exercisable 4,786,733 4,063,668
In the first quarter of 2018, the Company granted 1,318,390 options to employees (2017 – 1,396,455). The weighted-average fair value of options granted during the three months ended March 31, 2018 has been estimated at $2.56 per option (2017 – $2.53) using the Black-Scholes option pricing model. The weighted-average closing share price at the grant dates was $39.10. The assumptions used in these valuation models include:
THREE MONTHS ENDED MARCH 31
2018 2017
Exercise price $ 39.29 $ 41.74Risk-free interest rate 2.35% 1.53%Expected option life 6 years 6 yearsExpected volatility 17.00% 17.00%Expected dividend yield 5.73% 5.39%
Expected volatility has been estimated based on the historic volatility of the Company’s share price over six years which is reflective of the expected option life. Options vest over a period of up to 7.5 years from the grant date and are exercisable no later than 10 years after the grant date.
NOTE 12 ACCUMULATED OTHER COMPREHENSIVE INCOME (LOSS)
INVESTMENT EMPLOYEE IN ASSOCIATES MARCH 31, 2018 BENEFITS SECURITIES AND OTHER TOTAL
Balance, beginning of period As previously reported $ (132,529) $ 39,051 $ 22,348 $ (71,130) Change in accounting policy (Note 2) – 17 – 17
(132,529) 39,068 22,348 (71,113)Other comprehensive income (loss) (3,427) (2,746) 38,062 31,889
Balance, end of period $ (135,956) $ 36,322 $ 60,410 $ (39,224)
MARCH 31, 2017
Balance, beginning of period $ (110,913) $ 8,617 $ 19,854 $ (82,442)Other comprehensive income (loss) (7,948) 988 19,923 12,963
Balance, end of period $ (118,861) $ 9,605 $ 39,777 $ (69,479)
Amounts are recorded net of tax.
NOTE 13 RISK MANAGEMENT
The risk management policies and procedures of the Company are discussed in the Financial Instruments Risk section of the Company’s Management’s Discussion and Analysis contained in the First Quarter 2018 Report to Shareholders and in Note 20 to the Consolidated Financial Statements in the 2017 IGM Financial Inc. Annual Report and have not changed significantly since December 31, 2017.
POWER FINANCIAL CORPORATION�— �FIRST QUARTER REPORT 2018 C 61
PFC_QUAT1_Eng03_IGM_2018-05-05_v1.indd D61PFC_QUAT1_Eng03_IGM_2018-05-05_v1.indd D61 18-05-09 1:40 PM18-05-09 1:40 PM

PA
RT
C
IGM
FIN
AN
CIA
L IN
C.
IGM FINANCIAL INC. FIRST QUARTER REPORT 2018 | NOTES TO THE INTERIM CONDENSED CONSOLIDATED FINANCIAL STATEMENTS 65
NOTE 14 FAIR VALUE OF FINANCIAL INSTRUMENTS
Fair values are management’s estimates and are calculated using market conditions at a specific point in time and may not reflect future fair values. The calculations are subjective in nature, involve uncertainties and are matters of significant judgment.
All financial instruments measured at fair value and those for which fair value is disclosed are classified into one of three levels that distinguish fair value measurements by the significance of the inputs used for valuation.
Fair value is determined based on the price that would be received for an asset or paid to transfer a liability in the most advantageous market, utilizing a hierarchy of three different valuation techniques, based on the lowest level input that is significant to the fair value measurement in its entirety.
Level 1 – Unadjusted quoted prices in active markets for identical assets or liabilities;
Level 2 – Observable inputs other than Level 1 quoted prices for similar assets or liabilities in active markets; quoted prices for identical or similar assets or liabilities in markets that are not active; or inputs other than quoted prices that are observable or corroborated by observable market data; and
Level 3 – Unobservable inputs that are supported by little or no market activity. Valuation techniques are primarily model-based.
Markets are considered inactive when transactions are not occurring with sufficient regularity. Inactive markets may be characterized by a significant decline in the volume and level of observed trading activity or through large or erratic bid/offer spreads. In those instances where traded markets are not considered sufficiently active, fair value is measured using valuation models which may utilize predominantly observable market inputs (Level 2) or may utilize predominantly non-observable market inputs (Level 3). Management considers all reasonably available information including indicative broker quotations, any available pricing for similar instruments, recent arm’s length market transactions, any relevant observable market inputs, and internal model-based estimates. Management exercises judgment in determining the most appropriate inputs and the weighting ascribed to each input as well as in the selection of valuation methodologies.
Fair value is determined using the following methods and assumptions:
Securities and other financial assets and financial liabilities are valued using quoted prices from active markets, when available. When a quoted market price is not readily available, valuation techniques are used that require assumptions related to discount rates and the timing and amount of future cash flows. Wherever possible, observable market inputs are used in the valuation techniques.
Loans classified as Level 2 are valued using market interest rates for loans with similar credit risk and maturity.
Loans classified as Level 3 are valued by discounting the expected future cash flows at prevailing market yields.
Obligations to securitization entities are valued by discounting the expected future cash flows at prevailing market yields for securities issued by these securitization entities having similar terms and characteristics.
Deposits and certificates are valued by discounting the contractual cash flows using market interest rates currently offered for deposits with similar terms and credit risks.
Long-term debt is valued using quoted prices for each debenture available in the market.
Derivative financial instruments are valued based on quoted market prices, where available, prevailing market rates for instruments with similar characteristics and maturities, or discounted cash flow analysis.
Level 1 financial instruments include exchange-traded equity securities and open-end investment fund units and other financial liabilities in instances where there are quoted prices available from active markets.
Level 2 assets and liabilities include fixed income securities, loans, derivative financial instruments, deposits and certificates and long-term debt. The fair value of fixed income securities is determined using quoted market prices or independent dealer price quotes. The fair value of derivative financial instruments and deposits and certificates are determined using valuation models, discounted cash flow methodologies, or similar techniques using primarily observable market inputs. The fair value of long-term debt is determined using indicative broker quotes.
C 62 POWER FINANCIAL CORPORATION�— �FIRST QUARTER REPORT 2018
PFC_QUAT1_Eng03_IGM_2018-05-05_v1.indd D62PFC_QUAT1_Eng03_IGM_2018-05-05_v1.indd D62 18-05-09 1:40 PM18-05-09 1:40 PM

PA
RT
C
IGM
FINA
NC
IAL IN
C.
IGM FINANCIAL INC. FIRST QUARTER REPORT 2018 | NOTES TO THE INTERIM CONDENSED CONSOLIDATED FINANCIAL STATEMENTS66
Level 3 assets and liabilities include securities with little or no trading activity valued using broker-dealer quotes, loans, other financial assets, obligations to securitization entities and derivative financial instruments. Derivative financial instruments consist of principal reinvestment account swaps which represent the component of a swap entered into under the CMB Program whereby the Company pays coupons on Canada Mortgage Bonds and receives investment returns on the reinvestment of repaid mortgage principal. Fair value is determined by discounting the projected cashflows of the swaps. The notional amount, which is an input used to determine the fair value of the swap, is determined using an average unobservable prepayment rate of 15% which is based on historical prepayment patterns. An increase (decrease) in the assumed mortgage prepayment rate increases (decreases) the notional amount of the swap.
The following table presents the carrying amounts and fair values of financial assets and financial liabilities, including their levels in the fair value hierarchy. The table distinguishes between those financial instruments recorded at fair value and those recorded at amortized cost. The table also excludes fair value information for financial assets and financial liabilities not measured at fair value if the carrying amount is a reasonable approximation of fair value. These items include cash and cash equivalents, accounts and other receivables, certain other financial assets, accounts payable and accrued liabilities, and certain other financial liabilities.
FAIR VALUE
CARRYING VALUE LEVEL 1 LEVEL 2 LEVEL 3 TOTAL
MARCH 31, 2018
Financial assets recorded at fair value Securities – FVTOCI $ 306,782 $ – $ – $ 306,782 $ 306,782 – FVTPL 115,140 113,854 605 681 115,140 Loans – FVTPL 14,814 – 14,814 – 14,814 Derivative financial instruments 28,415 – 15,067 13,348 28,415Financial assets recorded at amortized cost Loans – Amortized cost 7,868,493 – 264,525 7,615,396 7,879,921Financial liabilities recorded at fair value Derivative financial instruments 33,967 – 26,043 7,924 33,967 Other financial liabilities 9,913 9,840 73 – 9,913Financial liabilities recorded at amortized cost Deposits and certificates 473,133 – 473,475 – 473,475 Obligations to securitization entities 7,604,249 – – 7,650,955 7,650,955 Long-term debt 2,025,000 – 2,315,208 – 2,315,208
DECEMBER 31, 2017
Financial assets recorded at fair value Securities – Available for sale $ 282,756 $ 19,931 $ – $ 262,825 $ 282,756 – Held for trading 96,940 95,390 889 661 96,940 Loans – Held for trading 286,682 – 286,682 – 286,682 Derivative financial instruments 35,692 – 22,879 12,813 35,692Financial assets recorded at amortized cost Loans – Loans and receivables 7,563,191 – 25,917 7,649,591 7,675,508Financial liabilities recorded at fair value Derivative financial instruments 28,444 – 19,726 8,718 28,444 Other financial liabilities 9,262 9,146 116 – 9,262Financial liabilities recorded at amortized cost Deposits and certificates 504,996 – 505,486 – 505,486 Obligations to securitization entities 7,596,028 – – 7,657,761 7,657,761 Long-term debt 2,175,000 – 2,470,182 – 2,470,182
NOTE 14 FAIR VALUE OF FINANCIAL INSTRUMENTS (continued)
POWER FINANCIAL CORPORATION�— �FIRST QUARTER REPORT 2018 C 63
PFC_QUAT1_Eng03_IGM_2018-05-05_v1.indd D63PFC_QUAT1_Eng03_IGM_2018-05-05_v1.indd D63 18-05-09 1:40 PM18-05-09 1:40 PM

PA
RT
C
IGM
FIN
AN
CIA
L IN
C.
IGM FINANCIAL INC. FIRST QUARTER REPORT 2018 | NOTES TO THE INTERIM CONDENSED CONSOLIDATED FINANCIAL STATEMENTS 67
There were no significant transfers between Level 1 and Level 2 in 2018 and 2017.
The following table provides a summary of changes in Level 3 assets and liabilities measured at fair value on a recurring basis.
GAINS/(LOSSES) GAINS/ INCLUDED IN (LOSSES) OTHER PURCHASES BALANCE INCLUDED IN COMPREHENSIVE AND TRANSFERS BALANCE JANUARY 1 NET EARNINGS(1) INCOME(2) ISSUANCES SETTLEMENTS IN/OUT MARCH 31
MARCH 31, 2018
Assets Securities – FVTOCI $ 262,825 $ – $ (3,175) $ 47,132 $ – $ – $ 306,782 – FVTPL 661 20 – – – – 681 Derivative financial instruments, net 4,095 (2,685) – 194 3,820 – 5,424
MARCH 31, 2017
Assets Securities – Available for sale $ 151,949 $ – $ 962 $ 420 $ – $ – $ 153,331 – Held for trading 1,438 (101) – – – – 1,337Liabilities Derivative financial instruments, net 23,055 (3,502) – 36 4,207 – 22,386
(1) Included in Net investment income in the Consolidated Statements of Earnings.
(2) Available for sale securities – Included in net unrealized gains (losses) in the Consolidated Statements of Comprehensive Income.
NOTE 15 EARNINGS PER COMMON SHARE
THREE MONTHS ENDED MARCH 31
2018 2017
Earnings Net earnings $ 187,751 $ 179,332 Perpetual preferred share dividends 2,213 2,213
Net earnings available to common shareholders $ 185,538 $ 177,119
Number of common shares (in thousands) Weighted average number of common shares outstanding 240,759 240,542 Add: Potential exercise of outstanding stock options(1) 322 275
Average number of common shares outstanding – Diluted basis 241,081 240,817
Earnings per common share (in dollars) Basic $ 0.77 $ 0.74 Diluted $ 0.77 $ 0.74
(1) Excludes 720 thousand shares in 2018 related to outstanding stock options that were anti-dilutive (2017 – 962 thousand).
NOTE 14 FAIR VALUE OF FINANCIAL INSTRUMENTS (continued)
C 64 POWER FINANCIAL CORPORATION�— �FIRST QUARTER REPORT 2018
PFC_QUAT1_Eng03_IGM_2018-05-05_v1.indd D64PFC_QUAT1_Eng03_IGM_2018-05-05_v1.indd D64 18-05-09 1:40 PM18-05-09 1:40 PM

PA
RT
C
IGM
FINA
NC
IAL IN
C.
IGM FINANCIAL INC. FIRST QUARTER REPORT 2018 | NOTES TO THE INTERIM CONDENSED CONSOLIDATED FINANCIAL STATEMENTS68
NOTE 16 SEGMENTED INFORMATION
The Company’s reportable segments are:
• Investors Group
• Mackenzie
• Corporate and Other
These segments reflect the Company’s internal financial reporting and performance measurement. In 2017, the Company announced the combination of investment management functions of Investors Group and Mackenzie resulting in the formation of a single global investment management organization. As a result, the Company has changed the methodology used to charge its segments the costs associated with the single investment management function to better align it with internal reporting.
Investors Group earns fee-based revenues in the conduct of its core business activities which are primarily related to the distribution, management and administration of its investment funds. It also earns fee revenues from the provision of brokerage services and the distribution of insurance and banking products. In addition, Investors Group earns intermediary revenues primarily from mortgage banking and servicing activities and from the assets funded by deposit and certificate products.
Mackenzie earns fee-based revenues from services it provides as fund manager to its investment funds and as investment advisor to sub-advisory and institutional accounts.
Corporate and Other includes Investment Planning Counsel, equity income from its investment in Lifeco and China AMC (Note 6), net investment income on unallocated investments, other income, and also includes consolidation elimination entries.
2018
INVESTORS CORPORATE THREE MONTHS ENDED MARCH 31 GROUP MACKENZIE AND OTHER TOTAL
Revenues Management fees $ 360,807 $ 175,930 $ 19,864 $ 556,601 Administration fees 78,041 24,882 4,611 107,534 Distribution fees 43,318 2,066 47,936 93,320 Net investment income and other 10,336 (174) 4,047 14,209 Proportionate share of associates’ earnings – – 37,984 37,984
492,502 202,704 114,442 809,648
Expenses Commission 164,758 75,273 46,067 286,098 Non-commission 144,726 85,830 22,589 253,145
309,484 161,103 68,656 539,243
Earnings before undernoted $ 183,018 $ 41,601 $ 45,786 270,405
Interest expense 30,264
Earnings before income taxes 240,141Income taxes 52,390
Net earnings 187,751Perpetual preferred share dividends 2,213
Net earnings available to common shareholders $ 185,538
Identifiable assets $ 8,855,206 $ 1,203,987 $ 2,976,020 $ 13,035,213Goodwill 1,347,781 1,168,580 143,906 2,660,267
Total assets $ 10,202,987 $ 2,372,567 $ 3,119,926 $ 15,695,480
POWER FINANCIAL CORPORATION�— �FIRST QUARTER REPORT 2018 C 65
PFC_QUAT1_Eng03_IGM_2018-05-05_v1.indd D65PFC_QUAT1_Eng03_IGM_2018-05-05_v1.indd D65 18-05-09 1:40 PM18-05-09 1:40 PM

PA
RT
C
IGM
FIN
AN
CIA
L IN
C.
IGM FINANCIAL INC. FIRST QUARTER REPORT 2018 | NOTES TO THE INTERIM CONDENSED CONSOLIDATED FINANCIAL STATEMENTS 69
2017
INVESTORS CORPORATE THREE MONTHS ENDED MARCH 31 GROUP MACKENZIE AND OTHER TOTAL
Revenues Management fees $ 341,071 $ 171,761 $ 14,869 $ 527,701 Administration fees 79,868 24,400 4,696 108,964 Distribution fees 57,108 2,339 45,813 105,260 Net investment income and other 18,026 80 1,651 19,757 Proportionate share of associates’ earnings – – 28,019 28,019
496,073 198,580 95,048 789,701
Expenses Commission 169,556 74,585 45,166 289,307 Non-commission 147,759 82,526 16,616 246,901
317,315 157,111 61,782 536,208
Earnings before undernoted $ 178,758 $ 41,469 $ 33,266 253,493
Interest expense 26,787
Earnings before income taxes 226,706Income taxes 47,374
Net earnings 179,332Perpetual preferred share dividends 2,213
Net earnings available to common shareholders $ 177,119
Identifiable assets $ 9,491,761 $ 1,300,493 $ 2,713,604 $ 13,505,858Goodwill 1,347,781 1,168,580 143,906 2,660,267
Total assets $ 10,839,542 $ 2,469,073 $ 2,857,510 $ 16,166,125
NOTE 16 SEGMENTED INFORMATION (continued)
C 66 POWER FINANCIAL CORPORATION�— �FIRST QUARTER REPORT 2018
PFC_QUAT1_Eng03_IGM_2018-05-05_v1.indd D66PFC_QUAT1_Eng03_IGM_2018-05-05_v1.indd D66 18-05-09 1:40 PM18-05-09 1:40 PM

PA
RT
D
PAR
GE
SA H
OLD
ING
SA
PARGESA HOLDING SAPART D
The attached document discloses information relating to the fi nancial results of Pargesa Holding SA as issued by Pargesa Holding SA.
POWER FINANCIAL CORPORATION�— �FIRST QUARTER REPORT 2018 D 1
PFC_QUAT1_Eng04_PAR_2018-05-09_v1.indd E1PFC_QUAT1_Eng04_PAR_2018-05-09_v1.indd E1 18-05-09 10:40 PM18-05-09 10:40 PM

PA
RT
D
PAR
GE
SA H
OLD
ING
SA
Pargesa
PARGESA HOLDING SA
(3)
D 2 POWER FINANCIAL CORPORATION�— �FIRST QUARTER REPORT 2018
PFC_QUAT1_Eng04_PAR_2018-05-09_v1.indd E2PFC_QUAT1_Eng04_PAR_2018-05-09_v1.indd E2 18-05-09 10:40 PM18-05-09 10:40 PM

PA
RT
D
PAR
GE
SA H
OLD
ING
SA
HIGHLIGHTS
Preliminary remark
•
POWER FINANCIAL CORPORATION�— �FIRST QUARTER REPORT 2018 D 3
PFC_QUAT1_Eng04_PAR_2018-05-09_v1.indd E3PFC_QUAT1_Eng04_PAR_2018-05-09_v1.indd E3 18-05-09 10:40 PM18-05-09 10:40 PM

PA
RT
D
PAR
GE
SA H
OLD
ING
SA
•
•
D 4 POWER FINANCIAL CORPORATION�— �FIRST QUARTER REPORT 2018
PFC_QUAT1_Eng04_PAR_2018-05-09_v1.indd E4PFC_QUAT1_Eng04_PAR_2018-05-09_v1.indd E4 18-05-09 10:40 PM18-05-09 10:40 PM

PA
RT
D
PAR
GE
SA H
OLD
ING
SA
PRESENTATION OF RESULTS IN ACCORDANCE WITH IFRS
March 31,2018
1,520.8(1,377.2)
(0.5)Operating profit (loss) 143.1
95.8(44.4)(47.5)14.2
Consolidated net profit 161.2(100.6)
Attributable to Pargesa shareholders 60.6
Basic earnings per share attributable to Pargesa shareholders [SF] 0.72 1.47
84,665
1.165
POWER FINANCIAL CORPORATION�— �FIRST QUARTER REPORT 2018 D 5
PFC_QUAT1_Eng04_PAR_2018-05-09_v1.indd E5PFC_QUAT1_Eng04_PAR_2018-05-09_v1.indd E5 18-05-09 10:40 PM18-05-09 10:40 PM

PA
RT
D
PAR
GE
SA H
OLD
ING
SA
ECONOMIC PRESENTATION OF PARGESA’S FINANCIAL RESULTS
D 6 POWER FINANCIAL CORPORATION�— �FIRST QUARTER REPORT 2018
PFC_QUAT1_Eng04_PAR_2018-05-09_v1.indd E6PFC_QUAT1_Eng04_PAR_2018-05-09_v1.indd E6 18-05-09 10:40 PM18-05-09 10:40 PM

PA
RT
D
PAR
GE
SA H
OLD
ING
SA
•
•
•
•
•
POWER FINANCIAL CORPORATION�— �FIRST QUARTER REPORT 2018 D 7
PFC_QUAT1_Eng04_PAR_2018-05-09_v1.indd E7PFC_QUAT1_Eng04_PAR_2018-05-09_v1.indd E7 18-05-09 10:40 PM18-05-09 10:40 PM

PA
RT
D
PAR
GE
SA H
OLD
ING
SA
•
•
D 8 POWER FINANCIAL CORPORATION�— �FIRST QUARTER REPORT 2018
PFC_QUAT1_Eng04_PAR_2018-05-09_v1.indd E8PFC_QUAT1_Eng04_PAR_2018-05-09_v1.indd E8 18-05-09 10:40 PM18-05-09 10:40 PM

PA
RT
D
PAR
GE
SA H
OLD
ING
SA
March 31,2018
Contribution from the portfolio to operating income Consolidated shareholdings (full consolidation or equity accounting):
31.2
Non-consolidated: 49.6
Contribution from private equity and other funds (3.9)Contribution from the portfolio to operating income 76.9per share [SF] 0.91 1.51
(6.5) (8.6)
Economic operating income 61.8per share [SF] 0.73 1.39
(1.2)
Net income 60.6 per share [SF] 0.72 1.47
84,665
1.165
POWER FINANCIAL CORPORATION�— �FIRST QUARTER REPORT 2018 D 9
PFC_QUAT1_Eng04_PAR_2018-05-09_v1.indd E9PFC_QUAT1_Eng04_PAR_2018-05-09_v1.indd E9 18-05-09 10:40 PM18-05-09 10:40 PM

PA
RT
D
PAR
GE
SA H
OLD
ING
SA
CONSOLIDATED HOLDINGS
Imerys
Parques
NON-CONSOLIDATED SHAREHOLDINGS
SGS
CONTRIBUTIONS FROM PRIVATE EQUITY ACTIVITIES AND OTHER FUNDS
D 10 POWER FINANCIAL CORPORATION�— �FIRST QUARTER REPORT 2018
PFC_QUAT1_Eng04_PAR_2018-05-09_v1.indd E10PFC_QUAT1_Eng04_PAR_2018-05-09_v1.indd E10 18-05-09 10:40 PM18-05-09 10:40 PM

PA
RT
D
PAR
GE
SA H
OLD
ING
SA
NET FINANCIAL INCOME AND EXPENSES
GENERAL EXPENSES AND TAXES
NON-OPERATING INCOME (LOSS)
POWER FINANCIAL CORPORATION�— �FIRST QUARTER REPORT 2018 D 1 1
PFC_QUAT1_Eng04_PAR_2018-05-09_v1.indd E11PFC_QUAT1_Eng04_PAR_2018-05-09_v1.indd E11 18-05-09 10:40 PM18-05-09 10:40 PM

PA
RT
D
PAR
GE
SA H
OLD
ING
SA
NET ASSET VALUE
Net asset value of Pargesa
Listed companies:
Other investments:
Total portfolio
Net asset value
Net asset value per share 130.3
Share price Pargesa 84.7
D 12 POWER FINANCIAL CORPORATION�— �FIRST QUARTER REPORT 2018
PFC_QUAT1_Eng04_PAR_2018-05-09_v1.indd E12PFC_QUAT1_Eng04_PAR_2018-05-09_v1.indd E12 18-05-09 10:40 PM18-05-09 10:40 PM

This document is also available on the Corporation’s website
and on SEDAR at www.sedar.com.
Stock ListingsShares of Power Financial Corporation are listed on the
Toronto Stock Exchange:
COMMON SHARES: PWF
FIRST PREFERRED SHARES:
Series A: PWF.PR.A
Series D: PWF.PR.E
Series E: PWF.PR.F
Series F: PWF.PR.G
Series H: PWF.PR.H
Series I: PWF.PR.I
Series K: PWF.PR.K
Series L: PWF.PR.L
Series O: PWF.PR.O
Series P: PWF.PR.P
Series Q: PWF.PR.Q
Series R: PWF.PR.R
Series S: PWF.PR.S
Series T: PWF.PR.T
Series V: PWF.PR.Z
Transfer Agent and RegistrarComputershare Investor Services Inc.
Offices in:
Montréal, Québec; Toronto, Ontario
www.investorcentre.com
Shareholder ServicesShareholders with questions relating to the payment of dividends,
change of address, share certificates, direct registration and estate
transfers should contact the Transfer Agent:
Computershare Investor Services Inc.
Shareholder Services
100 University Avenue, 8th Floor
Toronto, Ontario, Canada M5J 2Y1
Telephone: 1-800-564-6253 (toll-free in Canada and the U.S.)
or 514-982-7555
www.computershare.com
Corporate Information
POWER FINANCIAL CORPORATION
751 Victoria Square
Montréal, Québec, Canada H2Y 2J3
514-286-7430
1-800-890-7440
161 Bay Street, Suite 5000
Toronto, Ontario, Canada M5J 2S1
416-607-2250
www.powerfinancial.com
WE SUPPORT

FIR
ST
QU
AR
TE
R R
EP
OR
T 20
18P
OW
ER
FIN
AN
CIA
L C
OR
PO
RA
TIO
N
PR
INT
ED
IN
CA
NA
DA
![Kapika v Kapika Court/Judgments/Judgments... · Web viewThis information is summarised in paras [6], [7] and [8] above. The report clarified certain aspects including where the maternal](https://img.pdfslide.us/doc/110x75/5ff652d7b382086053623b33/kapika-v-kapika-courtjudgmentsjudgments-web-view-this-information-is-summarised.jpg)


![[AGA] - Report 3 Part 1 (General Equations and Uncertainties)](https://img.pdfslide.us/doc/110x75/552e4b8e5503466e0e8b48bc/aga-report-3-part-1-general-equations-and-uncertainties.jpg)