Embed Size (px)
Citation preview

1
FIRST QUARTER 2021INVESTOR CONFERENCE CALL
April 29, 2021
2
DISCLAIMER
Forward-Looking Statements
Certain statements in this presentation, other than statements of historical facts, including statements regarding our strategy, future operations, future financial position, future revenues, future costs, prospects, plans and objectives of management are "forward-looking statements" within the meaning of the Private Securities Litigation Reform Act of 1995, Section 27A of the Securities Act of 1933, as amended, and Section 21E of the Securities Exchange Act of 1934, as amended. Statements that include the words ”expect,” “estimate,” “anticipate,” “predict,” "believe," “think,” “plan,” “will,” “should,” “intend,” “seek,” “potential” and similar expressions and variations are intended to identify forward-looking statements, although not all forward-looking statements contain these identifying words. All forward-looking statements address matters that involve risks and uncertainties, many of which are beyond our control. Accordingly, there are or will be important factors that could cause actual results to differ materially from those indicated in such statements and, therefore, you should not place undue reliance on any such statements. These factors include, without limitation, economic, business, competitive, market and regulatory conditions and the following: the impact of COVID-19 on our business; decreases in the demand for leased containers; decreases in market leasing rates for containers; difficulties in re-leasing containers after their initial fixed-term leases; customers' decisions to buy rather than lease containers; dependence on a limited number of customers for a substantial portion of our revenues; customer defaults; decreases in the selling prices of used containers; extensive competition in the container leasing industry; difficulties stemming from the international nature of Triton’s businesses; decreases in the demand for international trade; disruption to our operations resulting from political and economic policies of the United States and other countries, particularly China, including but not limited to the impact of trade wars and tariffs; disruption to our operations from failure of or attacks on our information technology systems; disruption to our operations as a result of natural disasters, compliance with laws and regulations related to economic and trade sanctions, security, anti-terrorism, environmental protection and corruption; ability to obtain sufficient capital to support growth; restrictions imposed by the terms of our debt agreements; changes in the tax laws in Bermuda, the United States and other countries; and other risks and uncertainties, including those listed under the caption “Risk Factors” in our Annual Report on Form 10-K for the year ended December 31, 2020 (the “Form 10-K”) or other reports we file with the United States Securities and Exchange Commission.
The foregoing list of important factors should not be construed as exhaustive and should be read in conjunction with the other cautionary statements that are included herein and elsewhere, including the risk factors in our Form 10-K. Any forward-looking statements made herein are qualified in their entirety by these cautionary statements, and there can be no assurance that the actual results or developments anticipated by us will be realized or, even if substantially realized, that they will have the expected consequences to, or effects on, us or our businesses or operations. Except to the extent required by applicable law, we undertake no obligation to update publicly or revise any forward-looking statement, whether as a result of new information, future developments or otherwise. Certain financial measures presented in this presentation are identified as not being prepared in accordance with U.S. generally accepted accounting principles (“GAAP”). Please refer to the Appendix hereto for a reconciliation of such non-GAAP measures to their most comparable GAAP measures.
3
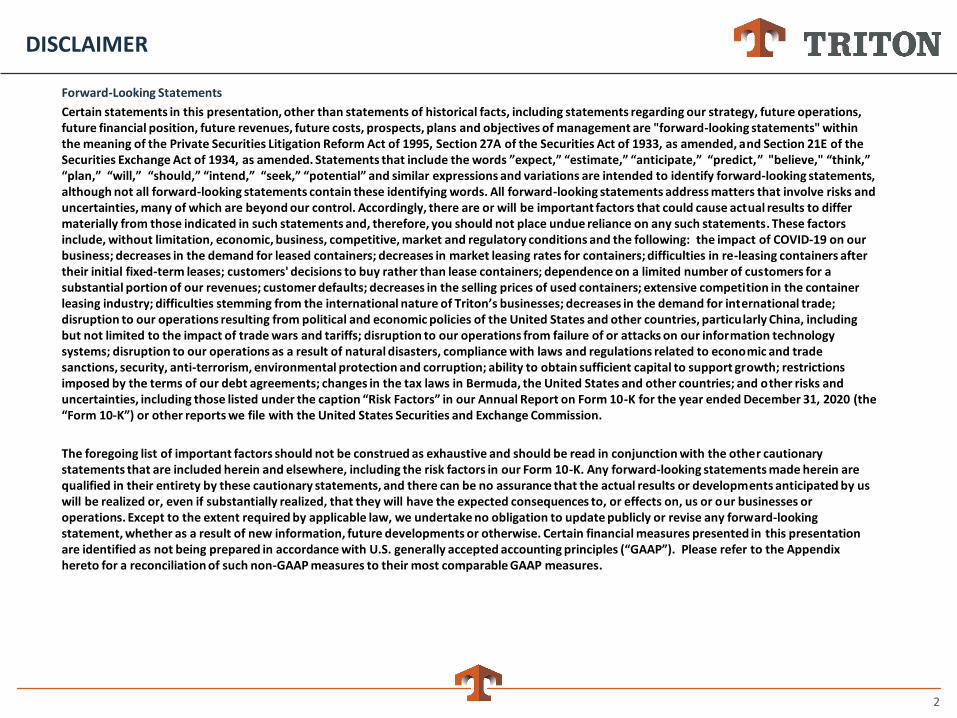
HIGHLIGHTS
Triton achieved outstanding results in the first quarter of 2021
» Adjusted net income of $128.7 million, or $1.91 per share, up 12.4% from Q4 2020
» Q1 annualized return on equity of 25.0%
Market conditions remain exceptionally strong
» Achieving outstanding operational performance
» Locking in durable benefits through aggressive investment program and focus on long-duration leases
Triton’s balance sheet is in great shape
» Leverage remains below historical norms
» Triton's corporate credit rating was upgraded to BBB- by S&P Global Ratings on March 30, 2021
» Completed inaugural $600 million 2.05% senior secured investment grade bond offering on April 15, 2021
Expect Q2 Adjusted EPS to remain near record level despite very low disposal volumes
Triton's Board of Directors announced a quarterly dividend of $0.57 per common share payable on June 24, 2021 to shareholders of record as of June 10, 2021
4
CURRENT MARKET OVERVIEW
The supply / demand environment remains highly favorable
» Demand driven by combination of strong trade volumes and significant logistical disruptions
» Shipping lines relying heavily on leasing to fulfill supply requirements
» Drop-offs exceptionally low and new container prices holding at very high level
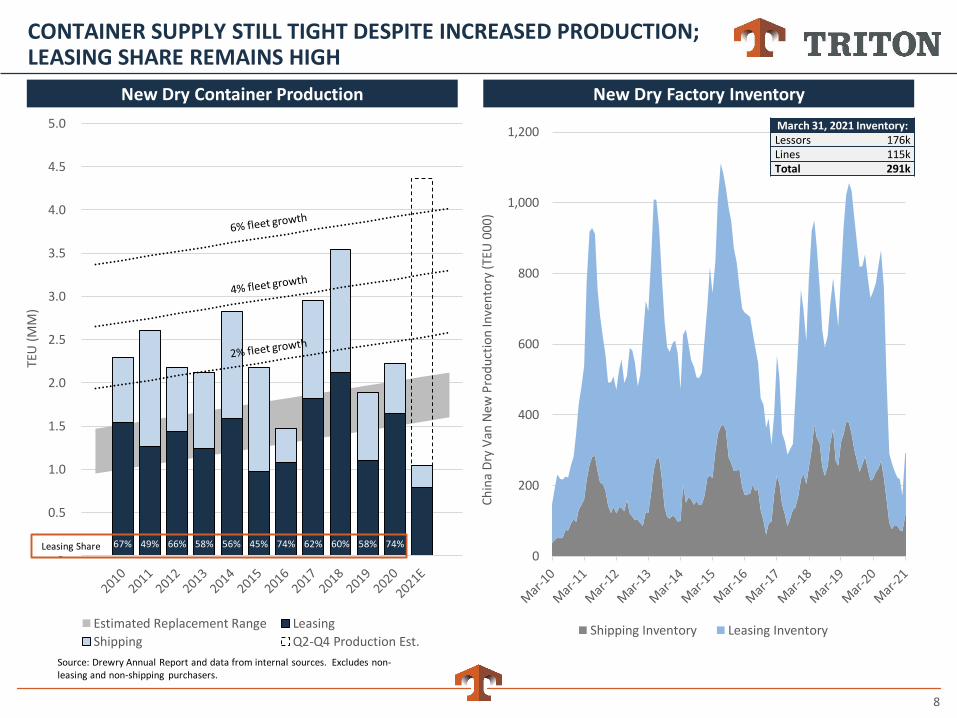
» Dry container factory production now at a record level, but container availability still tight
We have already ordered $2.6 billion of new containers for 2021
» Estimate Triton achieving new container leasing share in range of 35%
» Already locked-in close to 20% asset growth for 2021
» Most ordered containers pre-committed to high-value, very long duration leases
» Accepted $700 million in Q1 and expect a significant increase in deliveries in Q2
Used container sale prices exceptionally high
» Strong demand for used containers, especially for one-way cargo moves
» Remaining inventory of sale containers very low
Triton locking-in durable benefits from current surge
» Sizable investment in new containers on high-IRR, long-duration leases
» Focusing supply of used containers onto lifecycle leases
5
-15%
-10%
-5%
0%
5%
10%
15%
20%
25%
30%
0.0
5.0
10.0
15.0
20.0
25.0
Yo
Y C
han
ge
Thro
ugh
pu
t (TE
U M
illio
ns)
CNYJan 25th
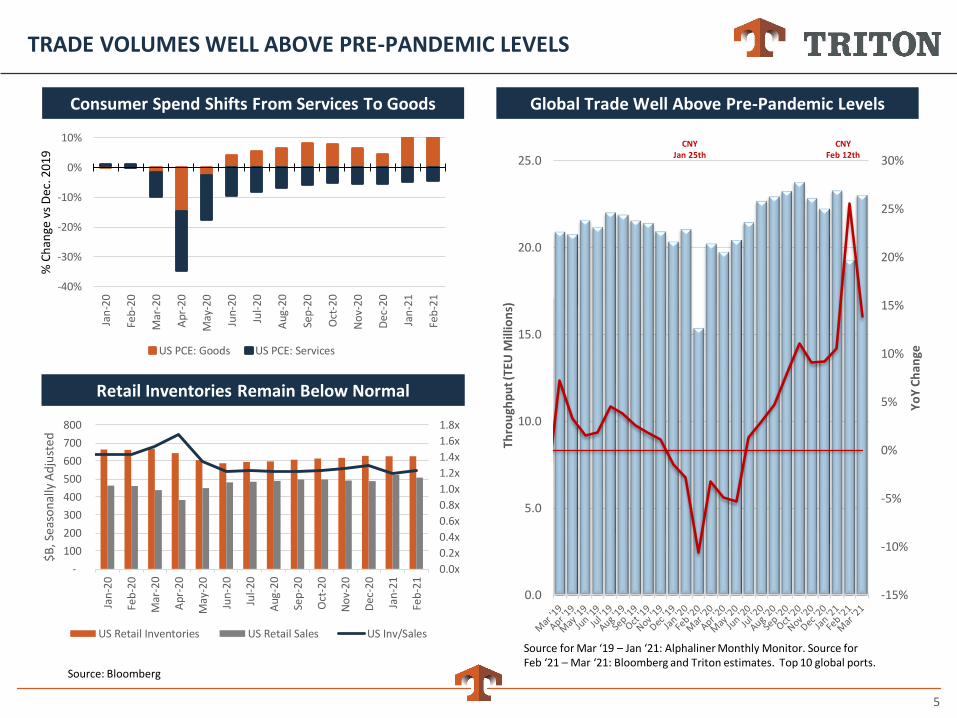
TRADE VOLUMES WELL ABOVE PRE-PANDEMIC LEVELS
Source for Mar ‘19 – Jan ‘21: Alphaliner Monthly Monitor. Source for Feb ‘21 – Mar ‘21: Bloomberg and Triton estimates. Top 10 global ports.
Global Trade Well Above Pre-Pandemic Levels
CNYFeb 12th
0.0x
0.2x
0.4x
0.6x
0.8x
1.0x
1.2x
1.4x
1.6x
1.8x
-
100
200
300
400
500
600
700
800
Jan
-20
Feb
-20
Mar
-20
Apr
-20
May
-20
Jun
-20
Jul-
20
Aug
-20
Sep
-20
Oct
-20
No
v-20
Dec
-20
Jan
-21
Feb
-21
$B
, Sea
son
ally
Ad
just
ed
US Retail Inventories US Retail Sales US Inv/Sales
Retail Inventories Remain Below Normal
Consumer Spend Shifts From Services To Goods
Source: Bloomberg
-40%
-30%
-20%
-10%
0%
10%
Jan
-20
Feb
-20
Mar
-20
Apr
-20
May
-20
Jun
-20
Jul-
20
Aug
-20
Sep
-20
Oct
-20
No
v-2
0
Dec
-20
Jan
-21
Feb
-21
% C
han
ge v
s D
ec. 2
01
9
US PCE: Goods US PCE: Services
6
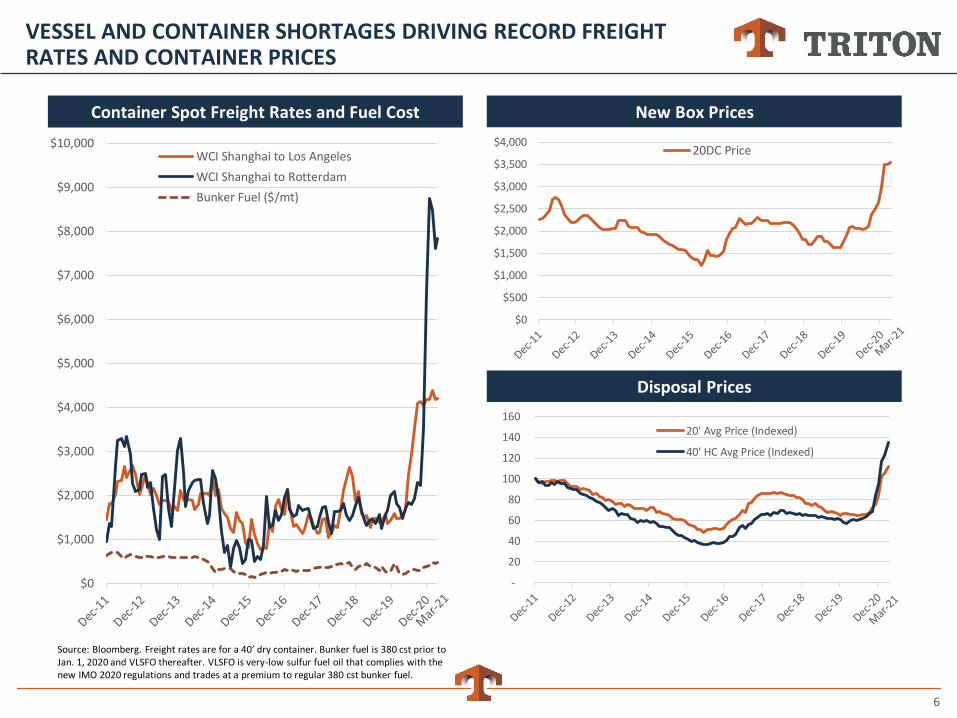
VESSEL AND CONTAINER SHORTAGES DRIVING RECORD FREIGHT RATES AND CONTAINER PRICES
Container Spot Freight Rates and Fuel Cost
Source: Bloomberg. Freight rates are for a 40’ dry container. Bunker fuel is 380 cst prior to Jan. 1, 2020 and VLSFO thereafter. VLSFO is very-low sulfur fuel oil that complies with the new IMO 2020 regulations and trades at a premium to regular 380 cst bunker fuel.
New Box Prices
$0
$1,000
$2,000
$3,000
$4,000
$5,000
$6,000
$7,000
$8,000
$9,000
$10,000WCI Shanghai to Los Angeles
WCI Shanghai to Rotterdam
Bunker Fuel ($/mt)
Disposal Prices
$0
$500
$1,000
$1,500
$2,000
$2,500
$3,000
$3,500
$4,00020DC Price
-
20
40
60
80
100
120
140
16020' Avg Price (Indexed)
40' HC Avg Price (Indexed)
7
(200)
(150)
(100)
(50)
0
50
100
150
200
250
300
350
TE
U (
000)
Pick-Ups Drop-Offs Net
70%
75%
80%
85%
90%
95%
100%
Ending Quarterly Utilization (CEU)
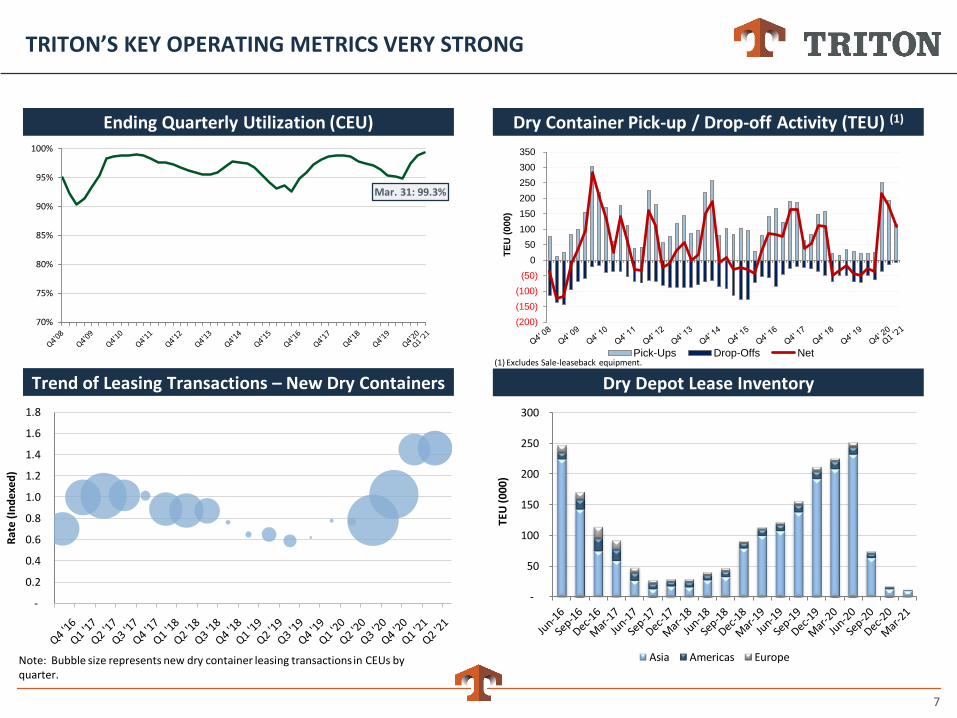
TRITON’S KEY OPERATING METRICS VERY STRONG
Ending Quarterly Utilization (CEU) Dry Container Pick-up / Drop-off Activity (TEU) (1)
Trend of Leasing Transactions – New Dry Containers Dry Depot Lease Inventory(1) Excludes Sale-leaseback equipment.
-
50
100
150
200
250
300
TE
U (
00
0)
Asia Americas Europe
-
0.2
0.4
0.6
0.8
1.0
1.2
1.4
1.6
1.8
Rat
e (I
nd
exed
)
Note: Bubble size represents new dry container leasing transactions in CEUs by quarter.
Mar. 31: 99.3%
8
0
200
400
600
800
1,000
1,200
Ch
ina
Dry
Van
New
Pro
du
ctio
n In
ven
tory
(TE
U 0
00)
Shipping Inventory Leasing Inventory
CONTAINER SUPPLY STILL TIGHT DESPITE INCREASED PRODUCTION; LEASING SHARE REMAINS HIGH
New Dry Factory InventoryNew Dry Container Production
March 31, 2021 Inventory:Lessors 176kLines 115kTotal 291k
Source: Drewry Annual Report and data from internal sources. Excludes non-leasing and non-shipping purchasers.
67% 49% 66% 58% 56% 45% 74% 62% 60% 58% 74% -
0.5
1.0
1.5
2.0
2.5
3.0
3.5
4.0
4.5
5.0
TEU
(M
M)
Estimated Replacement Range Leasing
Shipping Q2-Q4 Production Est.
Leasing Share
9
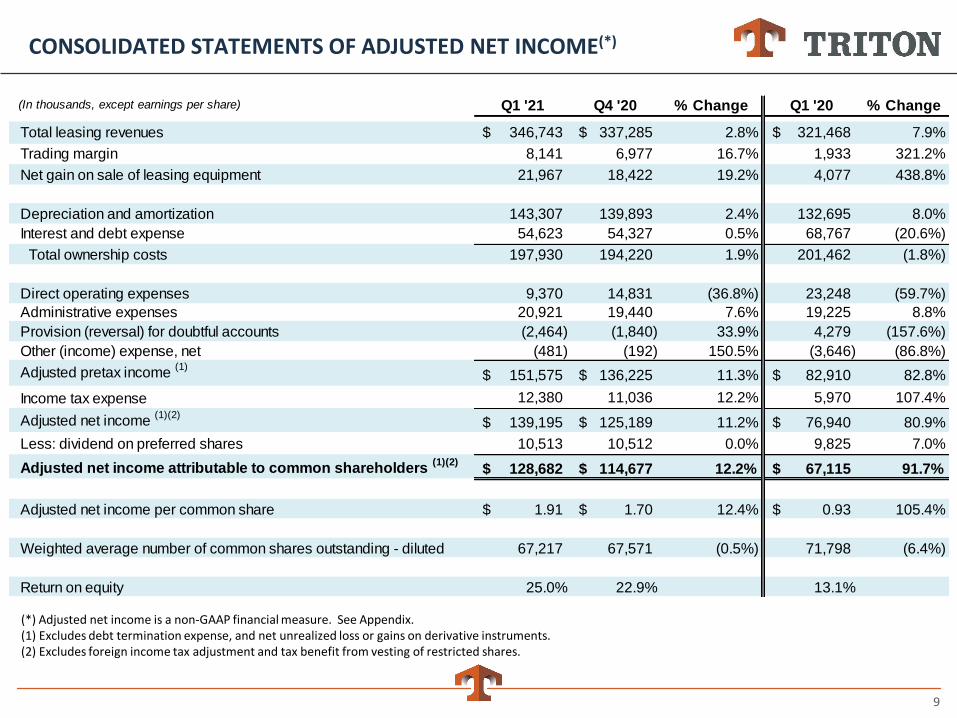
CONSOLIDATED STATEMENTS OF ADJUSTED NET INCOME(*)
(*) Adjusted net income is a non-GAAP financial measure. See Appendix.(1) Excludes debt termination expense, and net unrealized loss or gains on derivative instruments.(2) Excludes foreign income tax adjustment and tax benefit from vesting of restricted shares.
(In thousands, except earnings per share) Q1 '21 Q4 '20 % Change Q1 '20 % Change
Total leasing revenues 346,743$ 337,285$ 2.8% 321,468$ 7.9%
Trading margin 8,141 6,977 16.7% 1,933 321.2%
Net gain on sale of leasing equipment 21,967 18,422 19.2% 4,077 438.8%
Depreciation and amortization 143,307 139,893 2.4% 132,695 8.0%
Interest and debt expense 54,623 54,327 0.5% 68,767 (20.6%)
Total ownership costs 197,930 194,220 1.9% 201,462 (1.8%)
Direct operating expenses 9,370 14,831 (36.8%) 23,248 (59.7%)
Administrative expenses 20,921 19,440 7.6% 19,225 8.8%
Provision (reversal) for doubtful accounts (2,464) (1,840) 33.9% 4,279 (157.6%)
Other (income) expense, net (481) (192) 150.5% (3,646) (86.8%)
Adjusted pretax income (1)
151,575$ 136,225$ 11.3% 82,910$ 82.8%
Income tax expense 12,380 11,036 12.2% 5,970 107.4%
Adjusted net income (1)(2)
139,195$ 125,189$ 11.2% 76,940$ 80.9%
Less: dividend on preferred shares 10,513 10,512 0.0% 9,825 7.0%
Adjusted net income attributable to common shareholders (1)(2)
128,682$ 114,677$ 12.2% 67,115$ 91.7%
Adjusted net income per common share 1.91$ 1.70$ 12.4% 0.93$ 105.4%
Weighted average number of common shares outstanding - diluted 67,217 67,571 (0.5%) 71,798 (6.4%)
Return on equity 25.0% 22.9% 13.1%
10
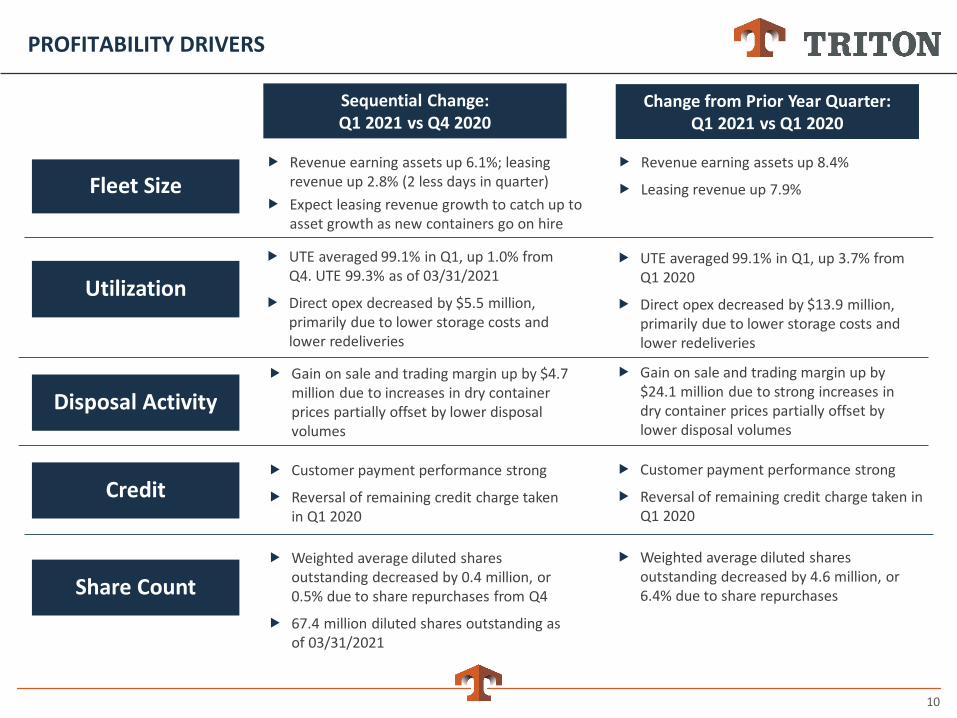
PROFITABILITY DRIVERS
Revenue earning assets up 8.4%
Leasing revenue up 7.9%
UTE averaged 99.1% in Q1, up 3.7% from Q1 2020
Direct opex decreased by $13.9 million, primarily due to lower storage costs and lower redeliveries
Gain on sale and trading margin up by $24.1 million due to strong increases in dry container prices partially offset by lower disposal volumes
Fleet Size
Utilization
Disposal Activity
Credit
Sequential Change:Q1 2021 vs Q4 2020
Change from Prior Year Quarter: Q1 2021 vs Q1 2020
Revenue earning assets up 6.1%; leasing revenue up 2.8% (2 less days in quarter)
Expect leasing revenue growth to catch up to asset growth as new containers go on hire
UTE averaged 99.1% in Q1, up 1.0% from Q4. UTE 99.3% as of 03/31/2021
Direct opex decreased by $5.5 million, primarily due to lower storage costs and lower redeliveries
Gain on sale and trading margin up by $4.7 million due to increases in dry container prices partially offset by lower disposal volumes
Customer payment performance strong
Reversal of remaining credit charge taken in Q1 2020
Customer payment performance strong
Reversal of remaining credit charge taken in Q1 2020
Share Count
Weighted average diluted shares outstanding decreased by 4.6 million, or 6.4% due to share repurchases
Weighted average diluted shares outstanding decreased by 0.4 million, or 0.5% due to share repurchases from Q4
67.4 million diluted shares outstanding as of 03/31/2021
11
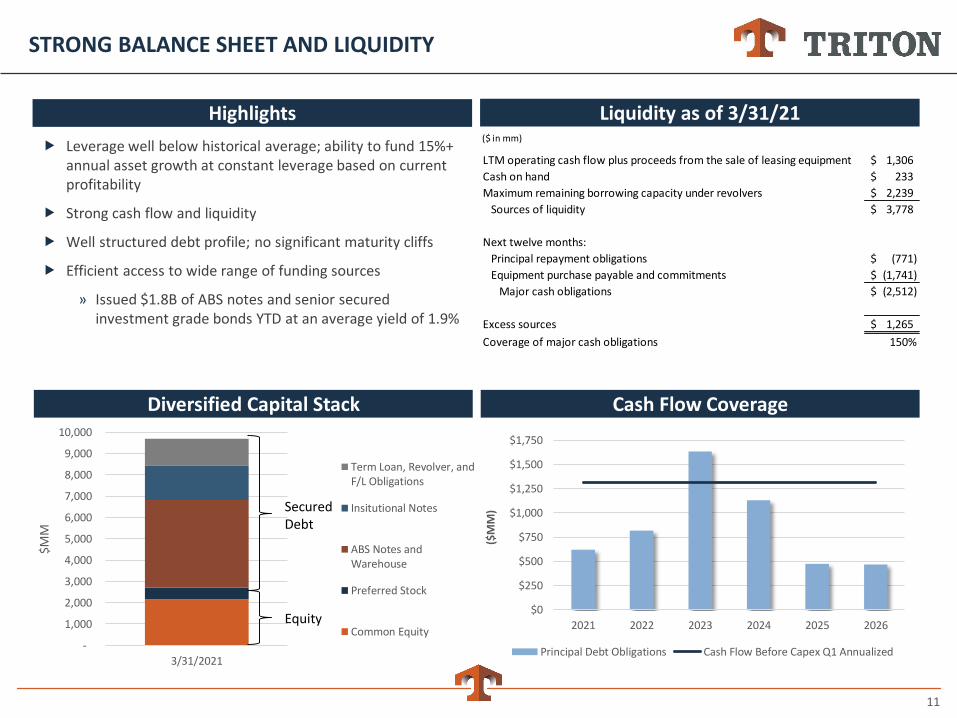
STRONG BALANCE SHEET AND LIQUIDITY
$0
$250
$500
$750
$1,000
$1,250
$1,500
$1,750
2021 2022 2023 2024 2025 2026
($M
M)
Principal Debt Obligations Cash Flow Before Capex Q1 Annualized
Liquidity as of 3/31/21
Cash Flow Coverage
Leverage well below historical average; ability to fund 15%+ annual asset growth at constant leverage based on current profitability
Strong cash flow and liquidity
Well structured debt profile; no significant maturity cliffs
Efficient access to wide range of funding sources
» Issued $1.8B of ABS notes and senior secured investment grade bonds YTD at an average yield of 1.9%
-
1,000
2,000
3,000
4,000
5,000
6,000
7,000
8,000
9,000
10,000
3/31/2021
$MM
Term Loan, Revolver, andF/L Obligations
Insitutional Notes
ABS Notes andWarehouse
Preferred Stock
Common Equity
Diversified Capital Stack
Secured Debt
Equity
Highlights($ in mm)
LTM operating cash flow plus proceeds from the sale of leasing equipment 1,306$
Cash on hand 233$
Maximum remaining borrowing capacity under revolvers 2,239$
Sources of liquidity 3,778$
Next twelve months:
Principal repayment obligations (771)$
Equipment purchase payable and commitments (1,741)$
Major cash obligations (2,512)$
Excess sources 1,265$
Coverage of major cash obligations 150%
12
INVESTMENT GRADE RATING AN OPPORTUNITY FOR FURTHER DIFFERENTIATION
Triton’s corporate rating upgraded to BBB- by S&P Global Ratings
Completed inaugural issuance of senior secured investment grade notes in April
» Raised $600 million in proceeds at a spread of T+120 and a yield of 2.07%
» Introduced Triton to investment grade bond community
» Provides access to deeper pool of debt capital at tighter spreads
We have an opportunity to transition to unsecured investment grade bonds
» Currently constrained by high proportion of assets pledged to secured financings
» Recent secured bond contains collateral fall-away provision that could help create needed pool of unencumbered containers
Would expect additional benefits from access to unsecured investment grade market
» Intend to actively pursue this transition
13
$0
$250
$500
$750
$1,000
$1,250
$1,500
20
05
20
06
20
07
20
08
20
09
20
10
20
11
20
12
20
13
20
14
20
15
20
16
20
17
20
18
20
19
20
20
LTM
Mar
-21
Q1
An
n.
($M
M)
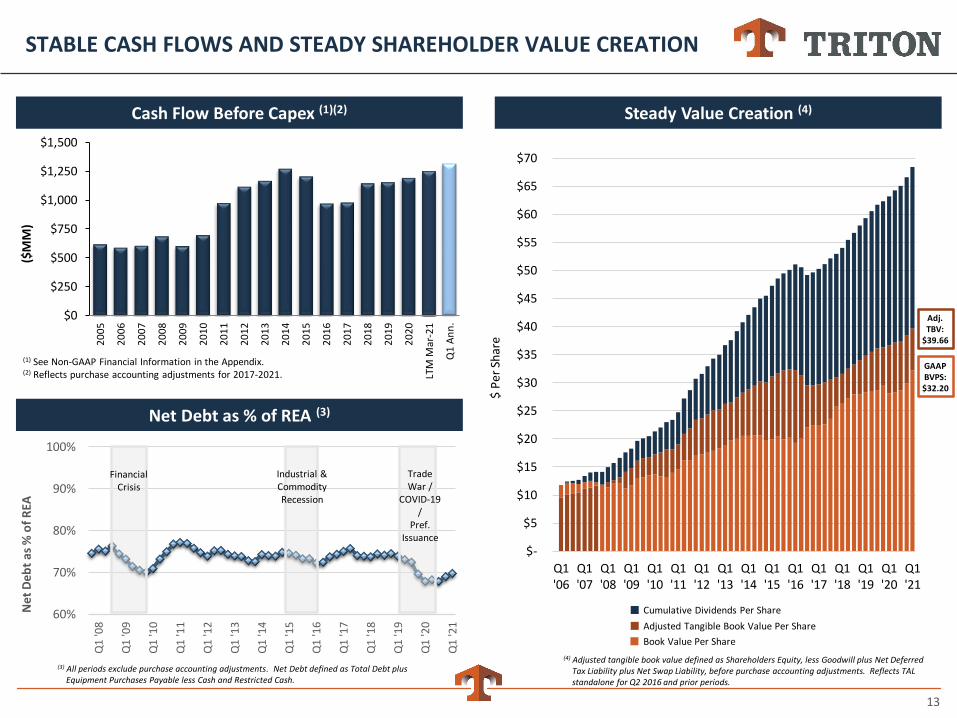
STABLE CASH FLOWS AND STEADY SHAREHOLDER VALUE CREATION
Steady Value Creation (4)
(3) All periods exclude purchase accounting adjustments. Net Debt defined as Total Debt plus Equipment Purchases Payable less Cash and Restricted Cash.
Cash Flow Before Capex (1)(2)
Net Debt as % of REA (3)
60%
70%
80%
90%
100%
Q1
'08
Q1
'09
Q1
'10
Q1
'11
Q1
'12
Q1
'13
Q1
'14
Q1
'15
Q1
'16
Q1
'17
Q1
'18
Q1
'19
Q1
'20
Q1
'21
Net
Deb
t as
% o
f R
EA
FinancialCrisis
$-
$5
$10
$15
$20
$25
$30
$35
$40
$45
$50
$55
$60
$65
$70
Q1'06
Q1'07
Q1'08
Q1'09
Q1'10
Q1'11
Q1'12
Q1'13
Q1'14
Q1'15
Q1'16
Q1'17
Q1'18
Q1'19
Q1'20
Q1'21
$ P
er S
har
e
(4) Adjusted tangible book value defined as Shareholders Equity, less Goodwill plus Net Deferred Tax Liability plus Net Swap Liability, before purchase accounting adjustments. Reflects TAL standalone for Q2 2016 and prior periods.
GAAPBVPS:$32.20
Adj.TBV:
$39.66
Cumulative Dividends Per Share
Adjusted Tangible Book Value Per Share
Book Value Per Share
Industrial & Commodity Recession
Trade War /
COVID-19 /
Pref. Issuance
(1) See Non-GAAP Financial Information in the Appendix.(2) Reflects purchase accounting adjustments for 2017-2021.
14
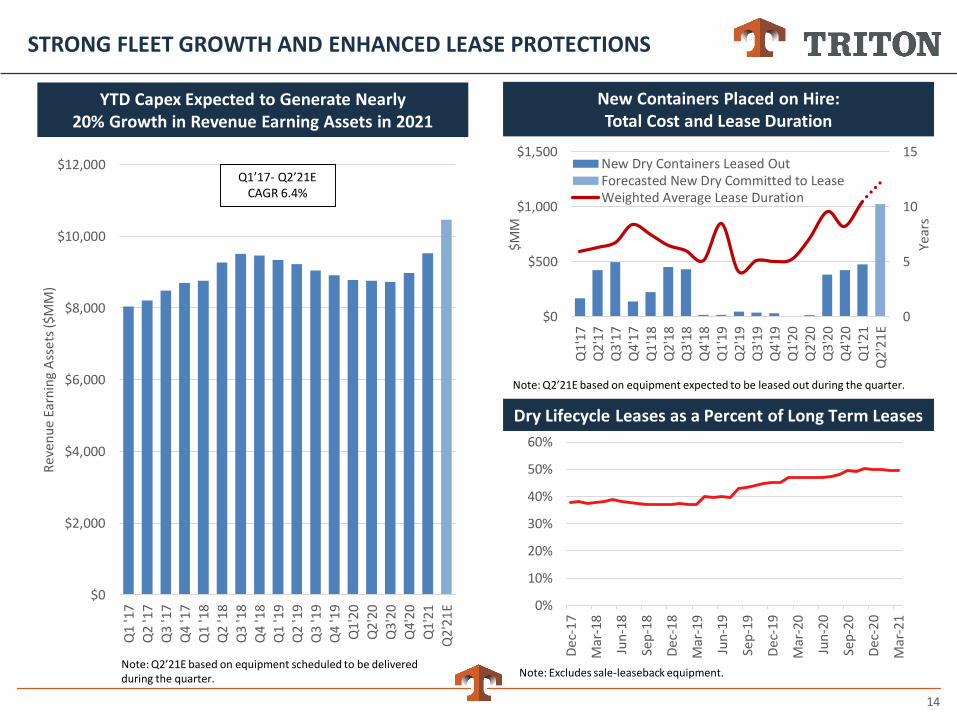
STRONG FLEET GROWTH AND ENHANCED LEASE PROTECTIONS
$0
$2,000
$4,000
$6,000
$8,000
$10,000
$12,000
Q1
'17
Q2
'17
Q3
'17
Q4
'17
Q1
'18
Q2
'18
Q3
'18
Q4
'18
Q1
'19
Q2
'19
Q3
'19
Q4
'19
Q1
'20
Q2
'20
Q3
'20
Q4
'20
Q1
'21
Q2
'21
E
Re
ven
ue
Earn
ing
Ass
ets
($M
M)
Q1’17- Q2’21E CAGR 6.4%
New Containers Placed on Hire:Total Cost and Lease Duration
Note: Q2’21E based on equipment scheduled to be delivered during the quarter.
YTD Capex Expected to Generate Nearly20% Growth in Revenue Earning Assets in 2021
0
5
10
15
$0
$500
$1,000
$1,500
Q1
'17
Q2'
17Q
3'1
7Q
4'17
Q1
'18
Q2'
18Q
3'1
8Q
4'18
Q1
'19
Q2'
19Q
3'1
9Q
4'19
Q1
'20
Q2'
20Q
3'2
0Q
4'20
Q1
'21
Q2'
21E
Year
s
$MM
New Dry Containers Leased OutForecasted New Dry Committed to LeaseWeighted Average Lease Duration
Note: Q2’21E based on equipment expected to be leased out during the quarter.
Dry Lifecycle Leases as a Percent of Long Term Leases
0%
10%
20%
30%
40%
50%
60%
Dec
-17
Mar
-18
Jun
-18
Sep
-18
Dec
-18
Mar
-19
Jun
-19
Sep
-19
Dec
-19
Mar
-20
Jun
-20
Sep
-20
Dec
-20
Mar
-21
Note: Excludes sale-leaseback equipment.
15
OUTLOOK AND CONCLUSIONS
Triton achieved outstanding results in the first quarter of 2021
» Adjusted EPS $1.91 per share, up 12.4% from Q4 2020; annualized ROE 25.0%
» Critical operating metrics at very high levels
Market conditions remain highly favorable
» Container demand remains exceptionally strong and container supply remains tight
» Customers continue to rely heavily on leasing
Triton making substantial investments to provide critically needed containers
» Have already ordered $2.6 billion of containers for delivery in 2021, locking-in close to 20% asset growth
» Most containers are pre-committed to lease
» Further securing position with key customers
Expect Q2 Adjusted EPS to remain near record level despite very low disposal volumes
We expect benefits from the current surge in activity to be durable
» Sizeable investments in new containers locked into long duration leases with attractive returns
» Large number of used containers on lifecycle leases will underpin utilization
16
Appendix
17
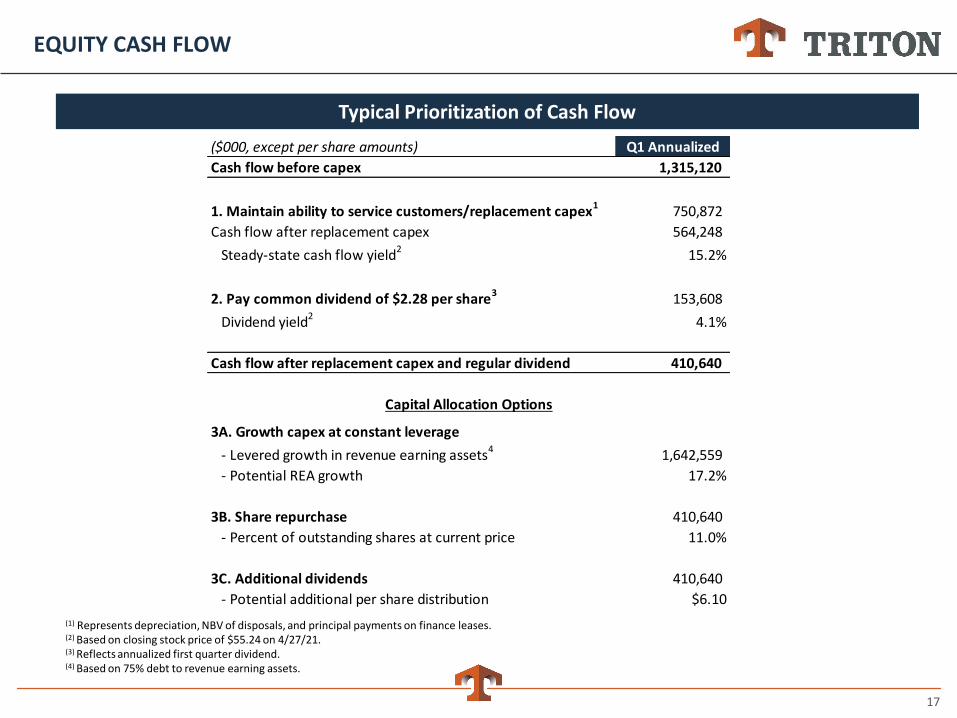
EQUITY CASH FLOW
Typical Prioritization of Cash Flow
(1) Represents depreciation, NBV of disposals, and principal payments on finance leases.(2) Based on closing stock price of $55.24 on 4/27/21.(3) Reflects annualized first quarter dividend.(4) Based on 75% debt to revenue earning assets.
($000, except per share amounts) Q1 Annualized
Cash flow before capex 1,315,120
1. Maintain ability to service customers/replacement capex1 750,872
Cash flow after replacement capex 564,248
Steady-state cash flow yield2 15.2%
2. Pay common dividend of $2.28 per share3
153,608
Dividend yield2 4.1%
Cash flow after replacement capex and regular dividend 410,640
3A. Growth capex at constant leverage
- Levered growth in revenue earning assets4
1,642,559
- Potential REA growth 17.2%
3B. Share repurchase 410,640
- Percent of outstanding shares at current price 11.0%
3C. Additional dividends 410,640
- Potential additional per share distribution $6.10
Capital Allocation Options
18
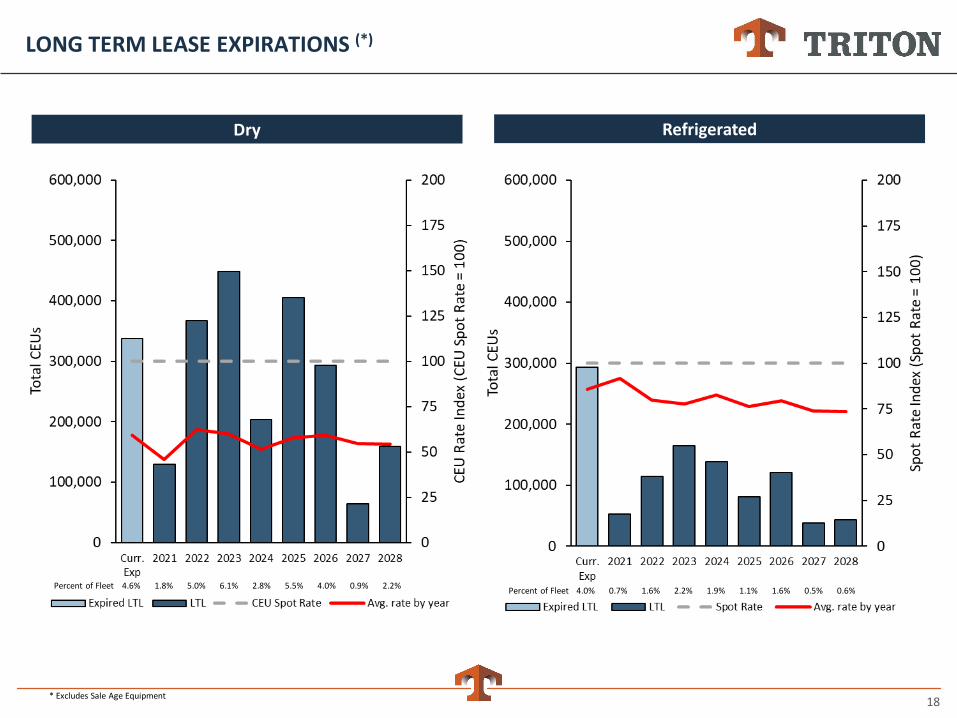
LONG TERM LEASE EXPIRATIONS (*)
Dry
Percent of Fleet 4.6% 1.8% 5.0% 6.1% 2.8% 5.5% 4.0% 0.9% 2.2%
Refrigerated
Percent of Fleet 4.0% 0.7% 1.6% 2.2% 1.9% 1.1% 1.6% 0.5% 0.6%
* Excludes Sale Age Equipment
19
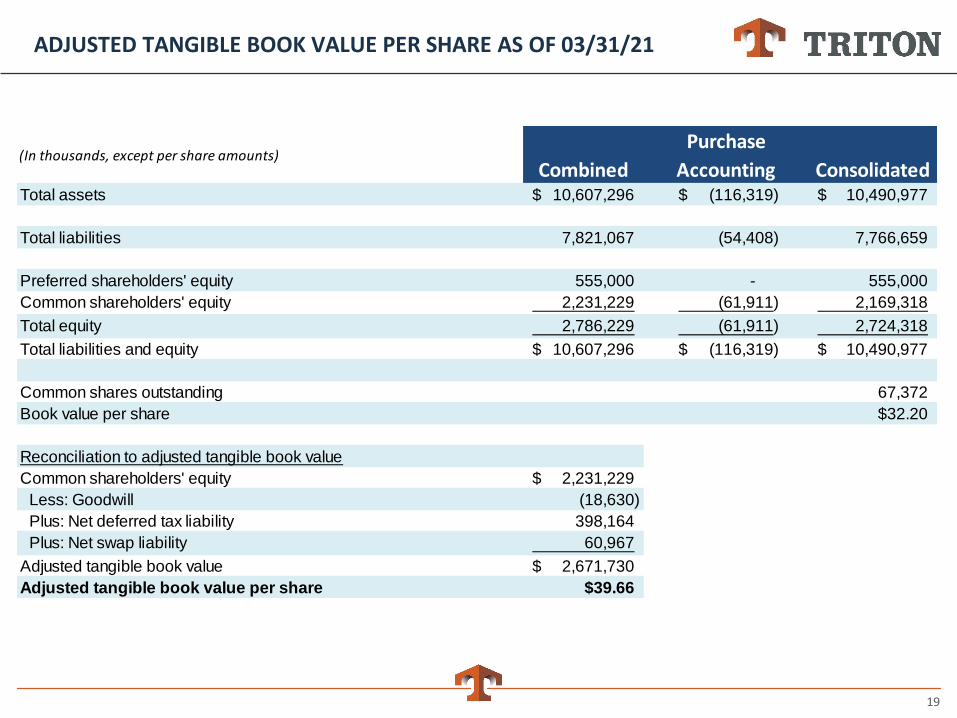
ADJUSTED TANGIBLE BOOK VALUE PER SHARE AS OF 03/31/21
(In thousands, except per share amounts)Combined
Purchase
Accounting ConsolidatedTotal assets 10,607,296$ (116,319)$ 10,490,977$
Total liabilities 7,821,067 (54,408) 7,766,659
Preferred shareholders' equity 555,000 - 555,000
Common shareholders' equity 2,231,229 (61,911) 2,169,318
Total equity 2,786,229 (61,911) 2,724,318
Total liabilities and equity 10,607,296$ (116,319)$ 10,490,977$
Common shares outstanding 67,372
Book value per share $32.20
Reconciliation to adjusted tangible book value
Common shareholders' equity 2,231,229$
Less: Goodwill (18,630)
Plus: Net deferred tax liability 398,164
Plus: Net swap liability 60,967
Adjusted tangible book value 2,671,730$
Adjusted tangible book value per share $39.66
20
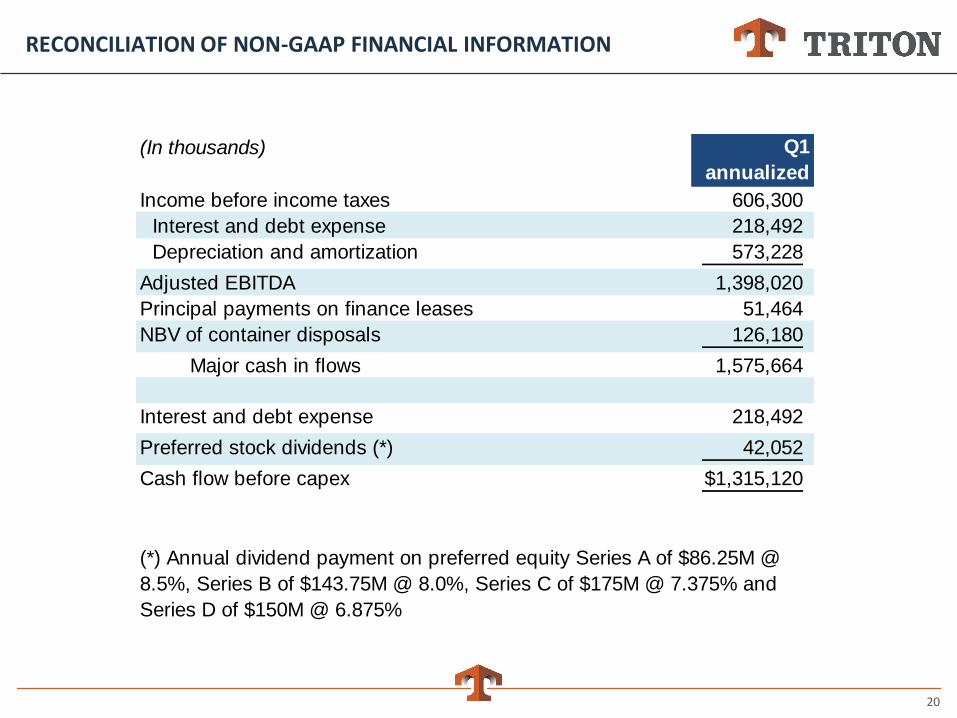
RECONCILIATION OF NON-GAAP FINANCIAL INFORMATION
(In thousands) Q1
annualized
Income before income taxes 606,300
Interest and debt expense 218,492
Depreciation and amortization 573,228
Adjusted EBITDA 1,398,020
Principal payments on finance leases 51,464
NBV of container disposals 126,180
Major cash in flows 1,575,664
Interest and debt expense 218,492
Preferred stock dividends (*) 42,052
Cash flow before capex 1,315,120$
(*) Annual dividend payment on preferred equity Series A of $86.25M @
8.5%, Series B of $143.75M @ 8.0%, Series C of $175M @ 7.375% and
Series D of $150M @ 6.875%
21
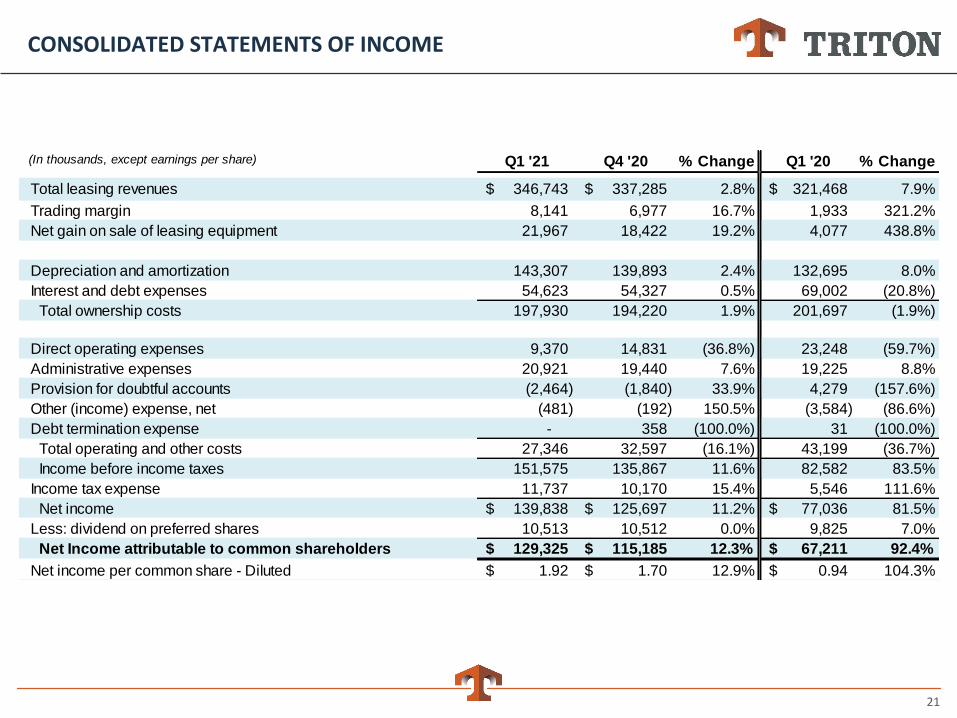
CONSOLIDATED STATEMENTS OF INCOME
(In thousands, except earnings per share) Q1 '21 Q4 '20 % Change Q1 '20 % Change
Total leasing revenues 346,743$ 337,285$ 2.8% 321,468$ 7.9%
Trading margin 8,141 6,977 16.7% 1,933 321.2%
Net gain on sale of leasing equipment 21,967 18,422 19.2% 4,077 438.8%
Depreciation and amortization 143,307 139,893 2.4% 132,695 8.0%
Interest and debt expenses 54,623 54,327 0.5% 69,002 (20.8%)
Total ownership costs 197,930 194,220 1.9% 201,697 (1.9%)
Direct operating expenses 9,370 14,831 (36.8%) 23,248 (59.7%)
Administrative expenses 20,921 19,440 7.6% 19,225 8.8%
Provision for doubtful accounts (2,464) (1,840) 33.9% 4,279 (157.6%)
Other (income) expense, net (481) (192) 150.5% (3,584) (86.6%)
Debt termination expense - 358 (100.0%) 31 (100.0%)
Total operating and other costs 27,346 32,597 (16.1%) 43,199 (36.7%)
Income before income taxes 151,575 135,867 11.6% 82,582 83.5%
Income tax expense 11,737 10,170 15.4% 5,546 111.6%
Net income 139,838$ 125,697$ 11.2% 77,036$ 81.5%
Less: dividend on preferred shares 10,513 10,512 0.0% 9,825 7.0%
Net Income attributable to common shareholders 129,325$ 115,185$ 12.3% 67,211$ 92.4%
Net income per common share - Diluted 1.92$ 1.70$ 12.9% 0.94$ 104.3%
22
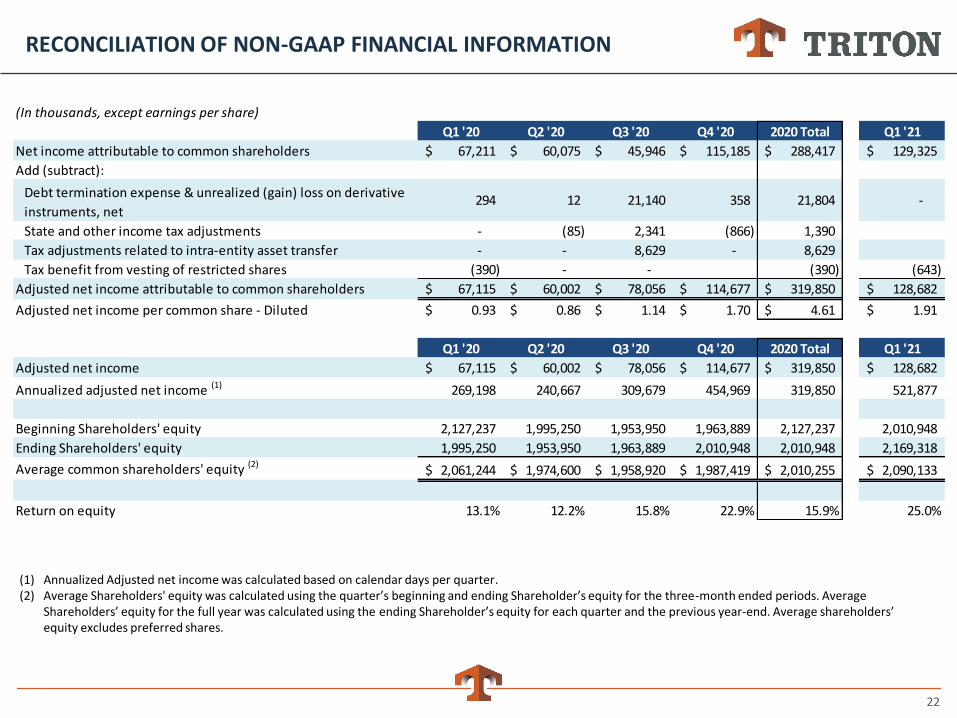
RECONCILIATION OF NON-GAAP FINANCIAL INFORMATION
(1) Annualized Adjusted net income was calculated based on calendar days per quarter.(2) Average Shareholders' equity was calculated using the quarter’s beginning and ending Shareholder’s equity for the three-month ended periods. Average
Shareholders’ equity for the full year was calculated using the ending Shareholder’s equity for each quarter and the previous year-end. Average shareholders’ equity excludes preferred shares.
(In thousands, except earnings per share)
Q1 '20 Q2 '20 Q3 '20 Q4 '20 2020 Total Q1 '21
Net income attributable to common shareholders 67,211$ 60,075$ 45,946$ 115,185$ 288,417$ 129,325$
Add (subtract):
Debt termination expense & unrealized (gain) loss on derivative
instruments, net294 12 21,140 358 21,804 -
State and other income tax adjustments - (85) 2,341 (866) 1,390
Tax adjustments related to intra-entity asset transfer - - 8,629 - 8,629
Tax benefit from vesting of restricted shares (390) - - (390) (643)
Adjusted net income attributable to common shareholders 67,115$ 60,002$ 78,056$ 114,677$ 319,850$ 128,682$
Adjusted net income per common share - Diluted 0.93$ 0.86$ 1.14$ 1.70$ 4.61$ 1.91$
Q1 '20 Q2 '20 Q3 '20 Q4 '20 2020 Total Q1 '21
Adjusted net income 67,115$ 60,002$ 78,056$ 114,677$ 319,850$ 128,682$
Annualized adjusted net income (1) 269,198 240,667 309,679 454,969 319,850 521,877
Beginning Shareholders' equity 2,127,237 1,995,250 1,953,950 1,963,889 2,127,237 2,010,948
Ending Shareholders' equity 1,995,250 1,953,950 1,963,889 2,010,948 2,010,948 2,169,318
Average common shareholders' equity (2)2,061,244$ 1,974,600$ 1,958,920$ 1,987,419$ 2,010,255$ 2,090,133$
Return on equity 13.1% 12.2% 15.8% 22.9% 15.9% 25.0%
23
NON-GAAP FINANCIAL INFORMATION
We use the terms "Adjusted net income," “Adjusted EPS,” “Return on equity,” “cash flow before capex” and other non-GAAP financial measures throughout this presentation. These items are not presented in accordance with U.S. GAAP and should not be considered as alternatives to, or more meaningful than, amounts determined in accordance with U.S. GAAP, including net income or cash flow from operations.
Adjusted net income is adjusted for certain items management believes are not representative of our operating performance. Adjusted net income is defined as net income attributable to common shareholders excluding debt termination expenses net of tax, unrealized gains and losses on derivative instruments net of tax, and foreign and other income tax adjustments.
We believe that Adjusted net income is useful to an investor in evaluating our operating performance because this item:
• is widely used by securities analysts and investors to measure a company's operating performance;
• helps investors to more meaningfully evaluate and compare the results of our operations from period to period by removing the impact of certain non-routine events which we do not expect to occur in the future; and
• is used by our management for various purposes, including as measures of operating performance and liquidity, to assist in comparing performance from period to period on a consistent basis, in presentations to our board of directors concerning our financial performance and as a basis for strategic planning and forecasting.
We have provided a reconciliation of net income attributable to common shareholders, the most directly comparable U.S. GAAP measure, to Adjusted net income in the tables below for the periods presented.
Return on equity is adjusted annualized earnings divided by average shareholders' equity. Management utilizes return on equity in evaluating how much profit the Company generates on the shareholders' equity in the Company and believes it is useful for comparing the profitability of companies in the same industry.
Cash Flow Before CapEx is defined as Adjusted net income plus depreciation and amortization, taxes, principal payments on finance leases and NBV of container disposals.
Certain forward-looking information included in this presentation is provided only on a non-GAAP basis without a reconciliation of these measures to the mostly directly comparable GAAP measure due to the inherent difficulty in forecasting and quantifying certain amounts that are necessary for such reconciliation. These items depend on highly variable factors, many of which may not be in our control, and which could vary significantly from future GAAP financial results.
Additionally, throughout this presentation, the combined financial information from 2016 and prior periods does not reflect results on a GAAP basis. GAAP financial statements reflect only the TAL operations prior to the merger of TCIL and TAL on July 12, 2016, and can be found in the Company’s 10-Q and 10-K filings.