Embed Size (px)
Citation preview

1
49
93
140
112
157
205
160
190
222
55
105
65
95
155
110
209
231
213
Investor Call Presentation 3rd Quarter 2013 Results
November 12, 2013
2
49
93
140
112
157
205
160
190
222
55
105
65
95
155
110
209
231
213
\\IBLNS002VF\KAR2012\12. Ratings Presentation\Altice Materials\Template\Altice Theme1.thmx This is the theme path for Excel
Agenda
Key Highlights Key Highlights 1 1 Key Highlights 1
Group Financials Group Financials 2 2 Group Financials 2
Q&A Q&A 3 3 Q&A 3
3
49
93
140
112
157
205
160
190
222
55
105
65
95
155
110
209
231
213
\\IBLNS002VF\KAR2012\12. Ratings Presentation\Altice Materials\Template\Altice Theme1.thmx This is the theme path for Excel
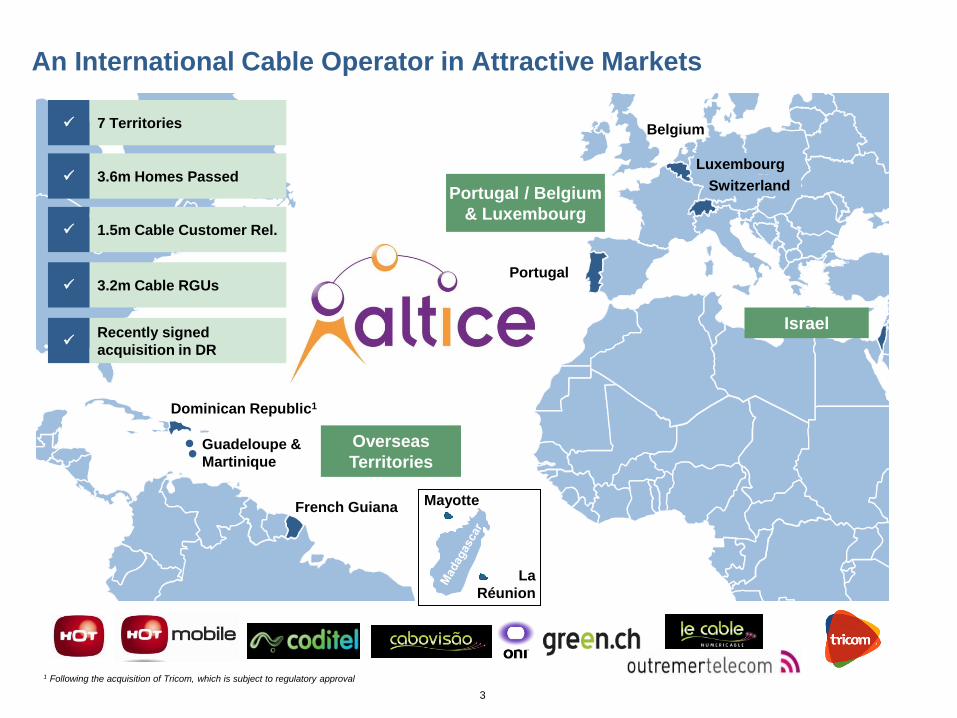
An International Cable Operator in Attractive Markets
Mayotte
La
Réunion
7 Territories
3.6m Homes Passed
1.5m Cable Customer Rel.
3.2m Cable RGUs
Dominican Republic1
French Guiana
Guadeloupe &
Martinique
Belgium
Luxembourg
Switzerland
Portugal
Overseas
Territories
Portugal / Belgium
& Luxembourg
Israel Recently signed
acquisition in DR
1 Following the acquisition of Tricom, which is subject to regulatory approval
4
49
93
140
112
157
205
160
190
222
55
105
65
95
155
110
209
231
213
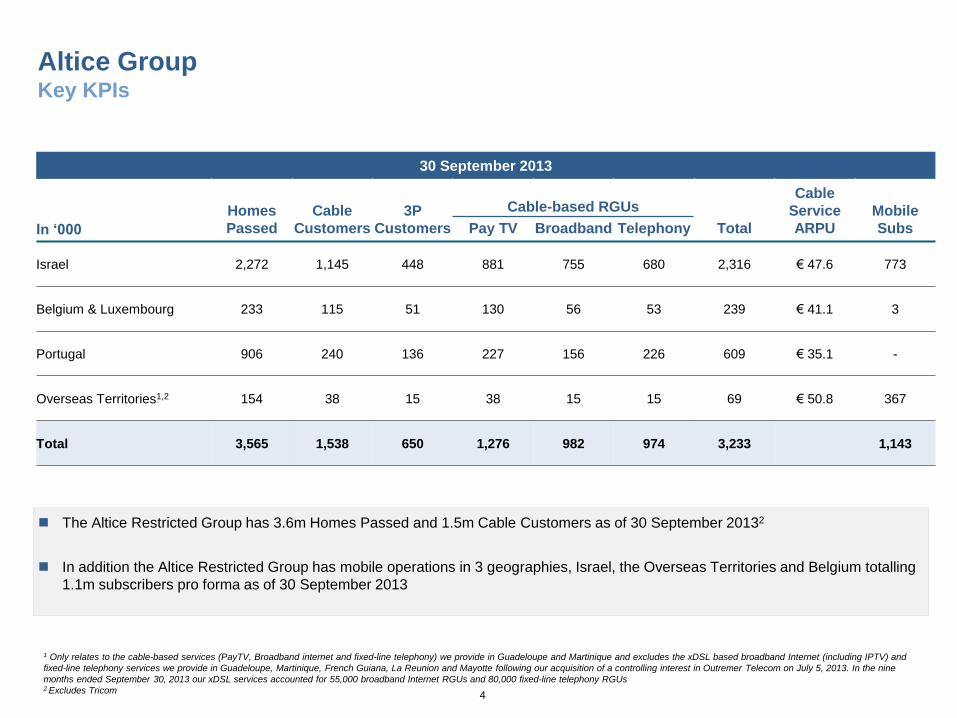
Altice Group Key KPIs
30 September 2013
In ‘000
Homes
Passed
Cable
Customers
3P
Customers Pay TV Broadband Telephony Total
Cable
Service
ARPU
Mobile
Subs
Israel 2,272 1,145 448 881 755 680 2,316 € 47.6 773
Belgium & Luxembourg 233 115 51 130 56 53 239 € 41.1 3
Portugal 906 240 136 227 156 226 609 € 35.1 -
Overseas Territories1,2 154 38 15 38 15 15 69 € 50.8 367
Total 3,565 1,538 650 1,276 982 974 3,233 1,143
The Altice Restricted Group has 3.6m Homes Passed and 1.5m Cable Customers as of 30 September 20132
In addition the Altice Restricted Group has mobile operations in 3 geographies, Israel, the Overseas Territories and Belgium totalling
1.1m subscribers pro forma as of 30 September 2013
1 Only relates to the cable-based services (PayTV, Broadband internet and fixed-line telephony) we provide in Guadeloupe and Martinique and excludes the xDSL based broadband Internet (including IPTV) and
fixed-line telephony services we provide in Guadeloupe, Martinique, French Guiana, La Reunion and Mayotte following our acquisition of a controlling interest in Outremer Telecom on July 5, 2013. In the nine
months ended September 30, 2013 our xDSL services accounted for 55,000 broadband Internet RGUs and 80,000 fixed-line telephony RGUs 2 Excludes Tricom
Cable-based RGUs
5
49
93
140
112
157
205
160
190
222
55
105
65
95
155
110
209
231
213
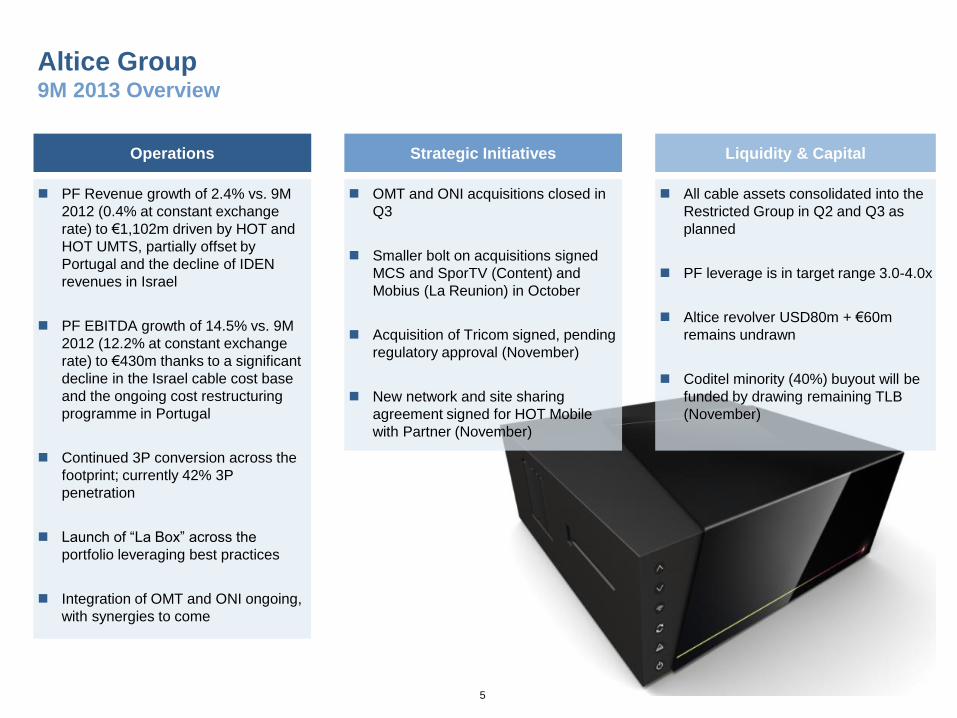
Altice Group 9M 2013 Overview
Operations Strategic Initiatives Liquidity & Capital
PF Revenue growth of 2.4% vs. 9M
2012 (0.4% at constant exchange
rate) to €1,102m driven by HOT and
HOT UMTS, partially offset by
Portugal and the decline of IDEN
revenues in Israel
PF EBITDA growth of 14.5% vs. 9M
2012 (12.2% at constant exchange
rate) to €430m thanks to a significant
decline in the Israel cable cost base
and the ongoing cost restructuring
programme in Portugal
Continued 3P conversion across the
footprint; currently 42% 3P
penetration
Launch of “La Box” across the
portfolio leveraging best practices
Integration of OMT and ONI ongoing,
with synergies to come
OMT and ONI acquisitions closed in
Q3
Smaller bolt on acquisitions signed
MCS and SporTV (Content) and
Mobius (La Reunion) in October
Acquisition of Tricom signed, pending
regulatory approval (November)
New network and site sharing
agreement signed for HOT Mobile
with Partner (November)
All cable assets consolidated into the
Restricted Group in Q2 and Q3 as
planned
PF leverage is in target range 3.0-4.0x
Altice revolver USD80m + €60m
remains undrawn
Coditel minority (40%) buyout will be
funded by drawing remaining TLB
(November)
6
49
93
140
112
157
205
160
190
222
55
105
65
95
155
110
209
231
213
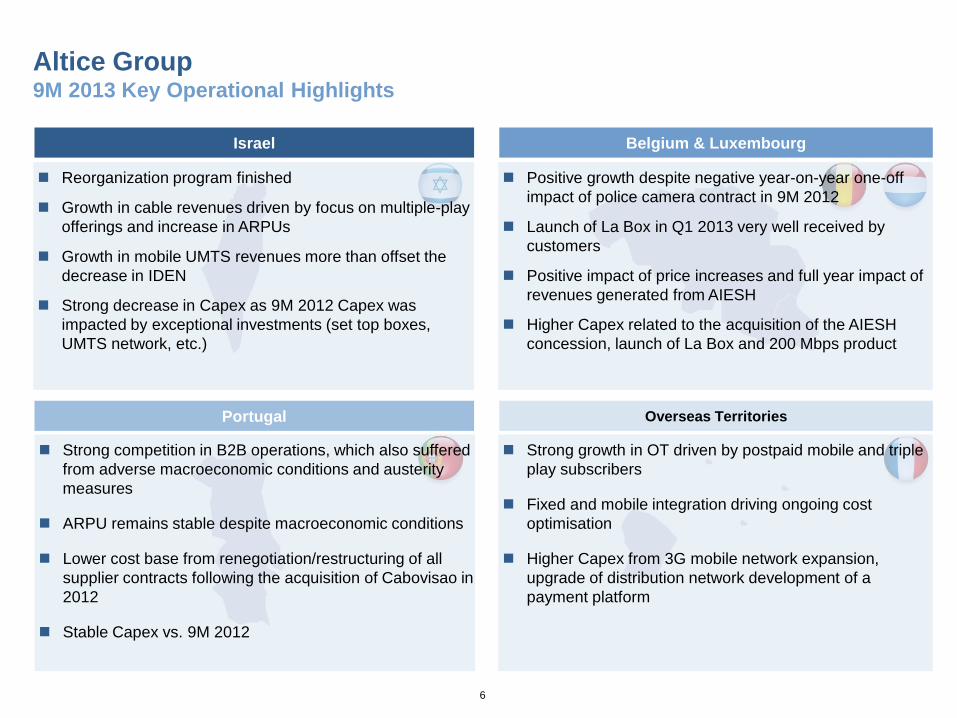
Altice Group 9M 2013 Key Operational Highlights
Israel Belgium & Luxembourg
Portugal Overseas Territories
Reorganization program finished
Growth in cable revenues driven by focus on multiple-play
offerings and increase in ARPUs
Growth in mobile UMTS revenues more than offset the
decrease in IDEN
Strong decrease in Capex as 9M 2012 Capex was
impacted by exceptional investments (set top boxes,
UMTS network, etc.)
Positive growth despite negative year-on-year one-off
impact of police camera contract in 9M 2012
Launch of La Box in Q1 2013 very well received by
customers
Positive impact of price increases and full year impact of
revenues generated from AIESH
Higher Capex related to the acquisition of the AIESH
concession, launch of La Box and 200 Mbps product
Strong competition in B2B operations, which also suffered
from adverse macroeconomic conditions and austerity
measures
ARPU remains stable despite macroeconomic conditions
Lower cost base from renegotiation/restructuring of all
supplier contracts following the acquisition of Cabovisao in
2012
Stable Capex vs. 9M 2012
Strong growth in OT driven by postpaid mobile and triple
play subscribers
Fixed and mobile integration driving ongoing cost
optimisation
Higher Capex from 3G mobile network expansion,
upgrade of distribution network development of a
payment platform
7
49
93
140
112
157
205
160
190
222
55
105
65
95
155
110
209
231
213
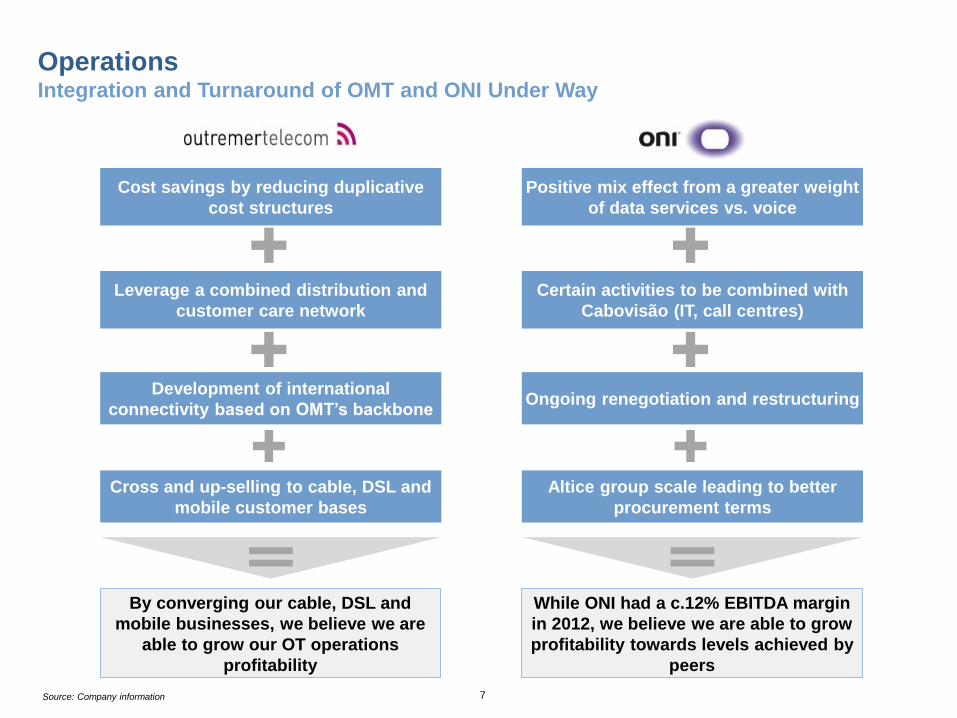
Operations Integration and Turnaround of OMT and ONI Under Way
Source: Company information
Positive mix effect from a greater weight
of data services vs. voice
Certain activities to be combined with
Cabovisão (IT, call centres)
Altice group scale leading to better
procurement terms
While ONI had a c.12% EBITDA margin
in 2012, we believe we are able to grow
profitability towards levels achieved by
peers
Ongoing renegotiation and restructuring
Cost savings by reducing duplicative
cost structures
Leverage a combined distribution and
customer care network
Cross and up-selling to cable, DSL and
mobile customer bases
By converging our cable, DSL and
mobile businesses, we believe we are
able to grow our OT operations
profitability
Development of international
connectivity based on OMT’s backbone
8
49
93
140
112
157
205
160
190
222
55
105
65
95
155
110
209
231
213
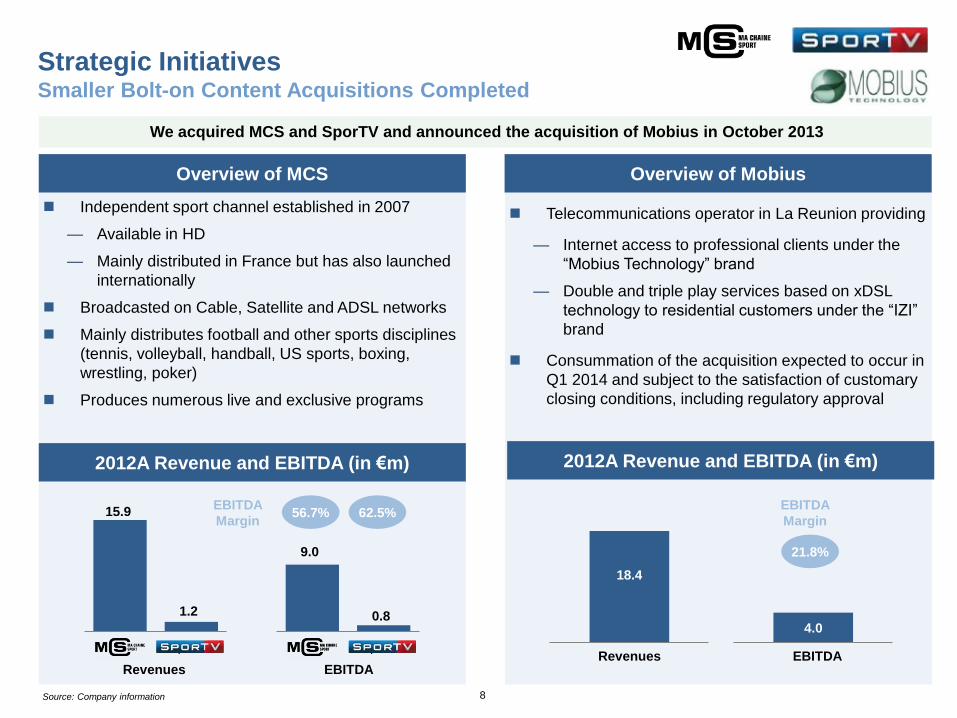
Independent sport channel established in 2007
— Available in HD
— Mainly distributed in France but has also launched
internationally
Broadcasted on Cable, Satellite and ADSL networks
Mainly distributes football and other sports disciplines
(tennis, volleyball, handball, US sports, boxing,
wrestling, poker)
Produces numerous live and exclusive programs
9.0
0.8
MCS SporTV
Telecommunications operator in La Reunion providing
— Internet access to professional clients under the
“Mobius Technology” brand
— Double and triple play services based on xDSL
technology to residential customers under the “IZI”
brand
Consummation of the acquisition expected to occur in
Q1 2014 and subject to the satisfaction of customary
closing conditions, including regulatory approval
Strategic Initiatives Smaller Bolt-on Content Acquisitions Completed
Overview of MCS Overview of Mobius
1.2
MCS SporTV
15.9 56.7% EBITDA
Margin
2012A Revenue and EBITDA (in €m)
We acquired MCS and SporTV and announced the acquisition of Mobius in October 2013
18.4
2012A Revenue and EBITDA (in €m)
4.0
21.8%
EBITDA
Margin
EBITDA Revenues
EBITDA Revenues
62.5%
Source: Company information
9
49
93
140
112
157
205
160
190
222
55
105
65
95
155
110
209
231
213
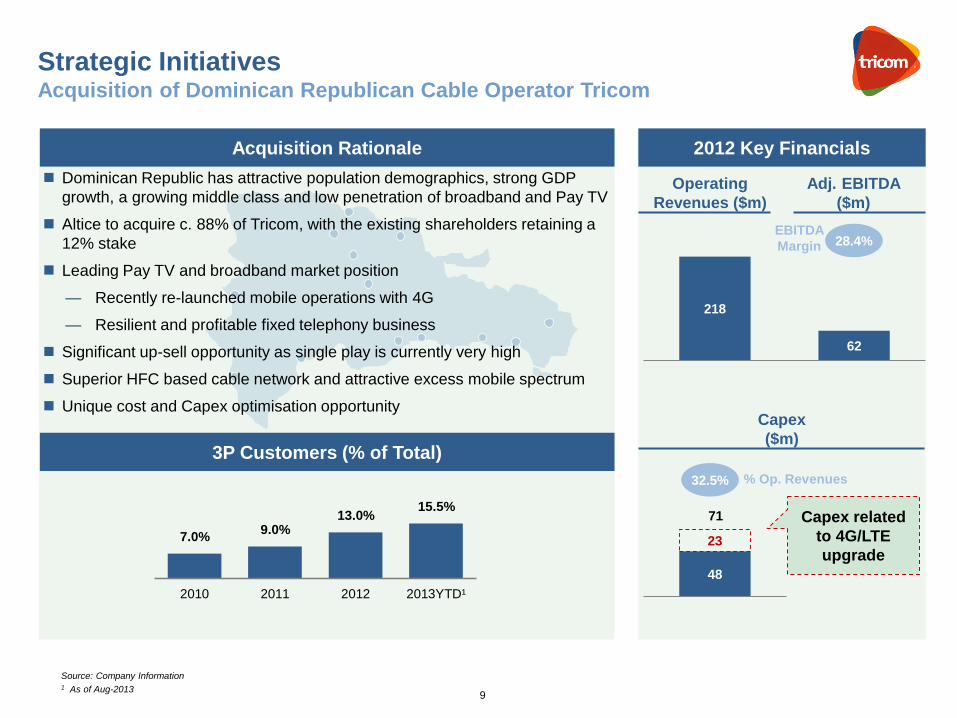
Dominican Republic has attractive population demographics, strong GDP
growth, a growing middle class and low penetration of broadband and Pay TV
Altice to acquire c. 88% of Tricom, with the existing shareholders retaining a
12% stake
Leading Pay TV and broadband market position
— Recently re-launched mobile operations with 4G
— Resilient and profitable fixed telephony business
Significant up-sell opportunity as single play is currently very high
Superior HFC based cable network and attractive excess mobile spectrum
Unique cost and Capex optimisation opportunity
Strategic Initiatives Acquisition of Dominican Republican Cable Operator Tricom
Source: Company Information 1 As of Aug-2013
3P Customers (% of Total)
Acquisition Rationale 2012 Key Financials
218
Operating
Revenues ($m)
Adj. EBITDA
($m)
62
28.4% EBITDA
Margin
48
23
Capex
($m)
Capex related
to 4G/LTE
upgrade
32.5% % Op. Revenues
7.0%9.0%
13.0%15.5%
2010 2011 2012 2013YTD¹
71
10
49
93
140
112
157
205
160
190
222
55
105
65
95
155
110
209
231
213
Strategic Initiatives Network and Site Sharing Agreement at HOT Mobile
HOT Mobile has signed a network and site sharing agreement with Partner with a
duration of 15 years
— Includes sharing of antennas, sites and frequencies
— Maintains operating core network separately, as well as marketing and sales
solely to its own customers
— Allows for right of use on Partner’s 2G and 3G networks
HOT Mobile and Partner have agreed to jointly develop and own a 4G network
Significant savings in roaming, expenses, site costs, network and maintenance
Lower deployment of Capex going forward
11
49
93
140
112
157
205
160
190
222
55
105
65
95
155
110
209
231
213
\\IBLNS002VF\KAR2012\12. Ratings Presentation\Altice Materials\Template\Altice Theme1.thmx This is the theme path for Excel
Agenda
Key Highlights 1
Group Financials 2
Q&A 3
12
49
93
140
112
157
205
160
190
222
55
105
65
95
155
110
209
231
213
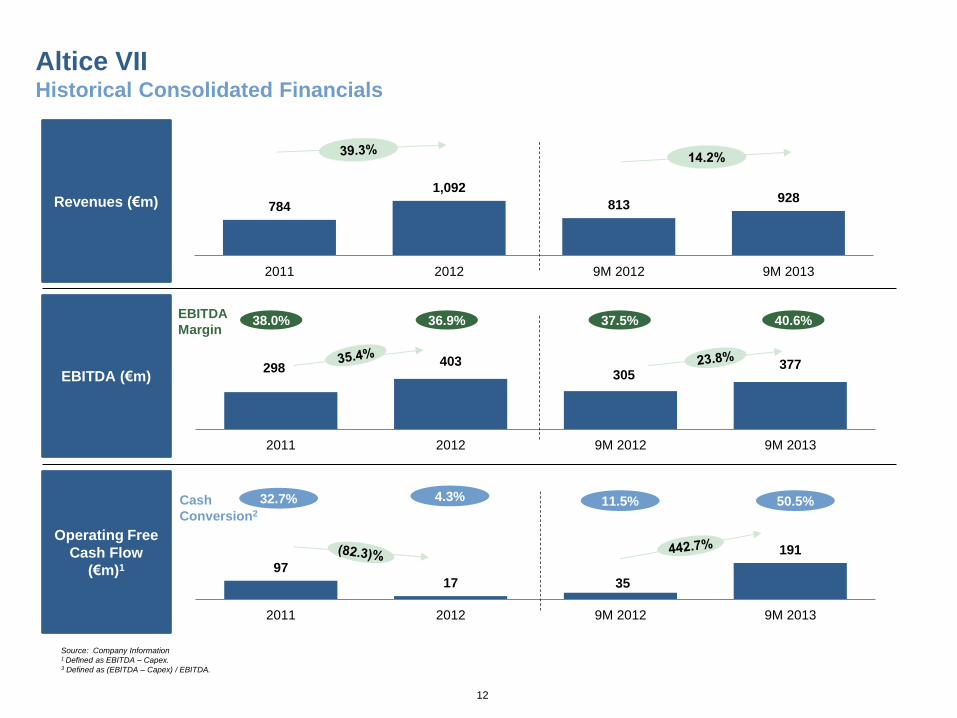
Altice VII Historical Consolidated Financials
Revenues (€m)
Source: Company Information 1 Defined as EBITDA – Capex. 3 Defined as (EBITDA – Capex) / EBITDA.
784
1,092
813 928
2011 2012 9M 2012 9M 2013
298 403
305 377
2011 2012 9M 2012 9M 2013
40.6% 38.0% 36.9% 37.5% EBITDA
Margin
97 17 35
191
2011 2012 9M 2012 9M 2013
50.5% 11.5% 4.3% 32.7% Cash
Conversion2
EBITDA (€m)
Operating Free
Cash Flow
(€m)1
13
49
93
140
112
157
205
160
190
222
55
105
65
95
155
110
209
231
213
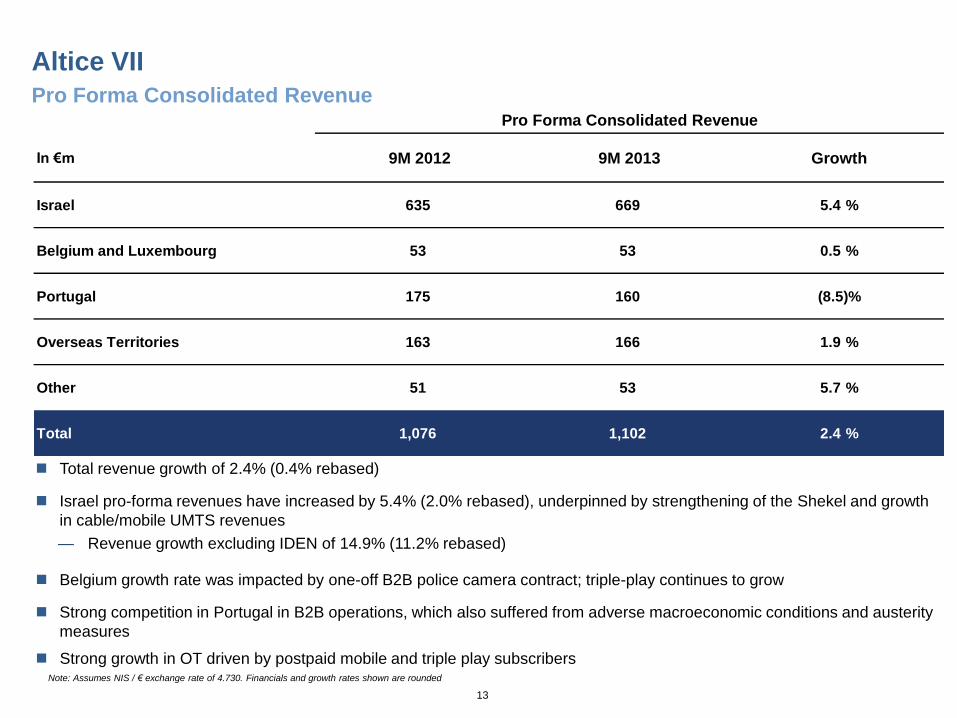
Altice VII
Pro Forma Consolidated Revenue
Total revenue growth of 2.4% (0.4% rebased)
Israel pro-forma revenues have increased by 5.4% (2.0% rebased), underpinned by strengthening of the Shekel and growth
in cable/mobile UMTS revenues
— Revenue growth excluding IDEN of 14.9% (11.2% rebased)
Belgium growth rate was impacted by one-off B2B police camera contract; triple-play continues to grow
Strong competition in Portugal in B2B operations, which also suffered from adverse macroeconomic conditions and austerity
measures
Strong growth in OT driven by postpaid mobile and triple play subscribers Note: Assumes NIS / € exchange rate of 4.730. Financials and growth rates shown are rounded
In €m 9M 2012 9M 2013 Growth
Israel 635 669 5.4 %
Belgium and Luxembourg 53 53 0.5 %
Portugal 175 160 (8.5)%
Overseas Territories 163 166 1.9 %
Other 51 53 5.7 %
Total 1,076 1,102 2.4 %
Pro Forma Consolidated Revenue
14
49
93
140
112
157
205
160
190
222
55
105
65
95
155
110
209
231
213
Altice VII
Pro Forma Consolidated EBITDA
Note: Assumes NIS / € exchange rate of 4.730. Financials and growth rates shown are rounded 1 includes c.€3.8m adjustment for equity based compensation.
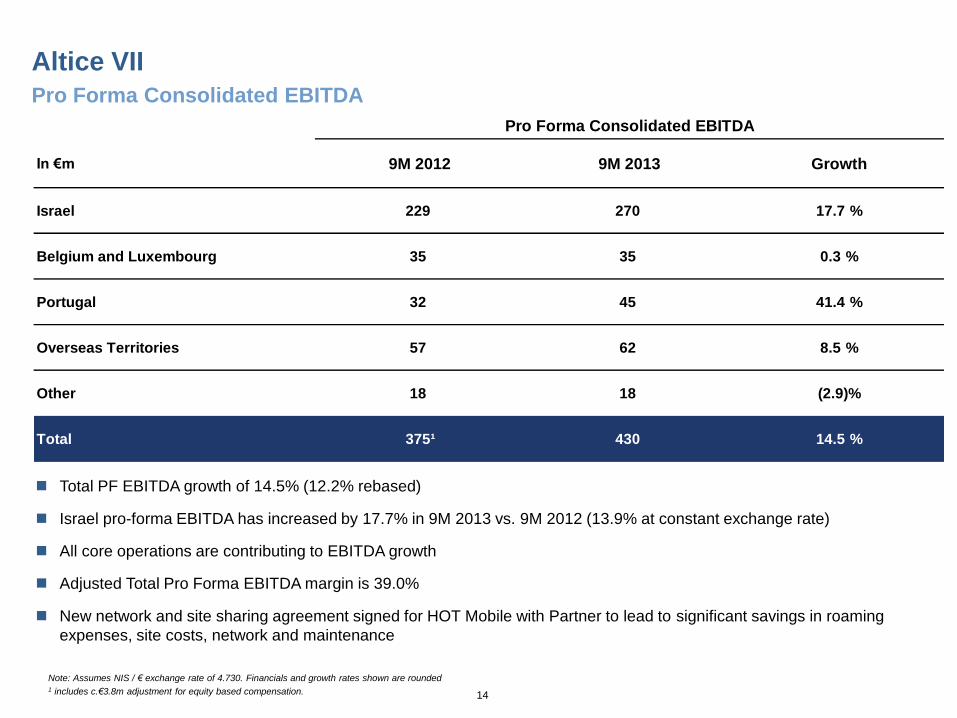
In €m 9M 2012 9M 2013 Growth
Israel 229 270 17.7 %
Belgium and Luxembourg 35 35 0.3 %
Portugal 32 45 41.4 %
Overseas Territories 57 62 8.5 %
Other 18 18 (2.9)%
Total 375¹ 430 14.5 %
Pro Forma Consolidated EBITDA
Total PF EBITDA growth of 14.5% (12.2% rebased)
Israel pro-forma EBITDA has increased by 17.7% in 9M 2013 vs. 9M 2012 (13.9% at constant exchange rate)
All core operations are contributing to EBITDA growth
Adjusted Total Pro Forma EBITDA margin is 39.0%
New network and site sharing agreement signed for HOT Mobile with Partner to lead to significant savings in roaming
expenses, site costs, network and maintenance
15
49
93
140
112
157
205
160
190
222
55
105
65
95
155
110
209
231
213
Altice VII
Pro Forma Consolidated Capex
Note: Assumes NIS / € exchange rate of 4.730. Financials and growth rates shown are rounded
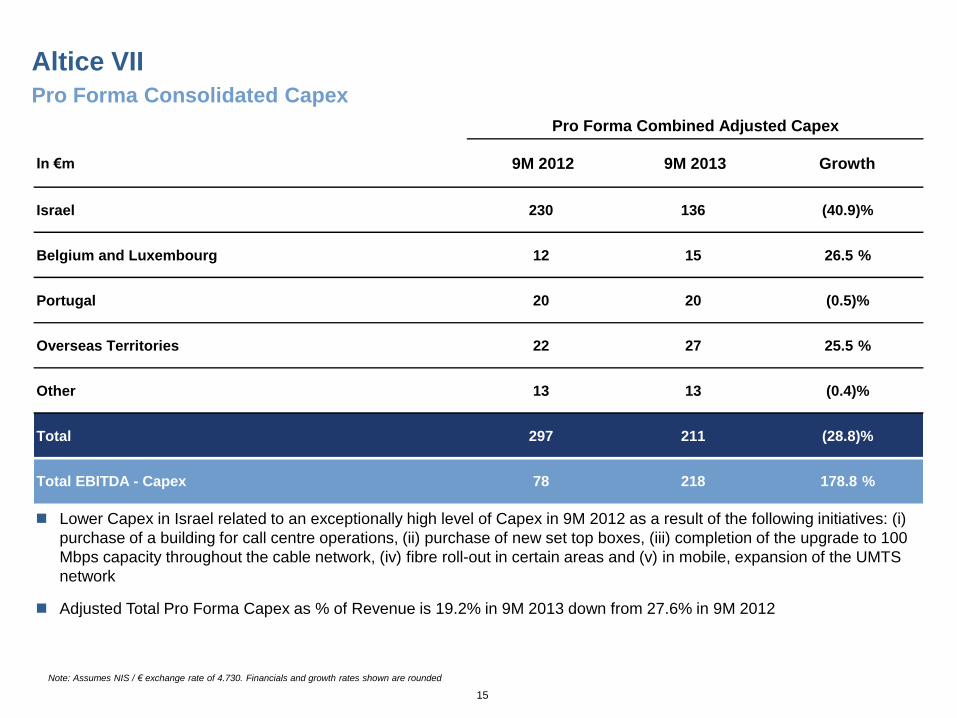
Lower Capex in Israel related to an exceptionally high level of Capex in 9M 2012 as a result of the following initiatives: (i)
purchase of a building for call centre operations, (ii) purchase of new set top boxes, (iii) completion of the upgrade to 100
Mbps capacity throughout the cable network, (iv) fibre roll-out in certain areas and (v) in mobile, expansion of the UMTS
network
Adjusted Total Pro Forma Capex as % of Revenue is 19.2% in 9M 2013 down from 27.6% in 9M 2012
In €m 9M 2012 9M 2013 Growth
Israel 230 136 (40.9)%
Belgium and Luxembourg 12 15 26.5 %
Portugal 20 20 (0.5)%
Overseas Territories 22 27 25.5 %
Other 13 13 (0.4)%
Total 297 211 (28.8)%
Total EBITDA - Capex 78 218 178.8 %
Pro Forma Combined Adjusted Capex
16
49
93
140
112
157
205
160
190
222
55
105
65
95
155
110
209
231
213
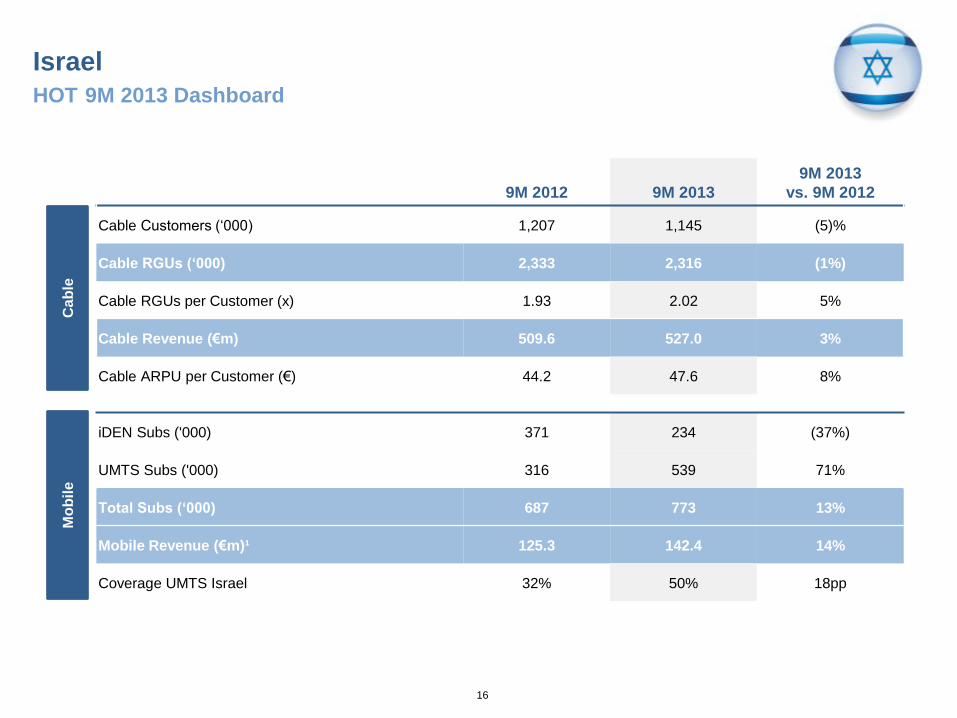
iDEN Subs ('000) 371 234 (37%)
UMTS Subs ('000) 316 539 71%
Total Subs (‘000) 687 773 13%
Mobile Revenue (€m)¹ 125.3 142.4 14%
Coverage UMTS Israel 32% 50% 18pp
Israel
HOT 9M 2013 Dashboard
9M 2012 9M 2013
9M 2013
vs. 9M 2012
Cable Customers (‘000) 1,207 1,145 (5)%
Cable RGUs (‘000) 2,333 2,316 (1%)
Cable RGUs per Customer (x) 1.93 2.02 5%
Cable Revenue (€m) 509.6 527.0 3%
Cable ARPU per Customer (€) 44.2 47.6 8%
Ca
ble
M
ob
ile
17
49
93
140
112
157
205
160
190
222
55
105
65
95
155
110
209
231
213
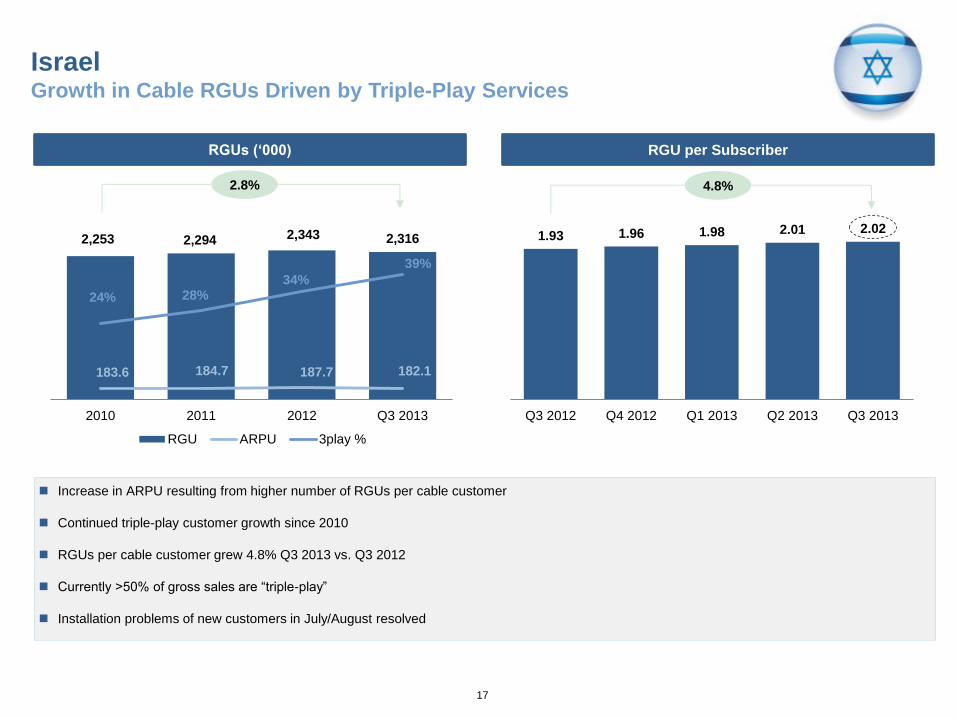
RGU per Subscriber RGUs (‘000)
Israel Growth in Cable RGUs Driven by Triple-Play Services
2,253 2,294 2,343 2,316
183.6 184.7 187.7 182.1
24% 28% 34%
39%
2010 2011 2012 Q3 2013
RGU ARPU 3play %
2.8%
Increase in ARPU resulting from higher number of RGUs per cable customer
Continued triple-play customer growth since 2010
RGUs per cable customer grew 4.8% Q3 2013 vs. Q3 2012
Currently >50% of gross sales are “triple-play”
Installation problems of new customers in July/August resolved
1.93 1.96 1.98 2.01 2.02
Q3 2012 Q4 2012 Q1 2013 Q2 2013 Q3 2013
4.8%
18
49
93
140
112
157
205
160
190
222
55
105
65
95
155
110
209
231
213
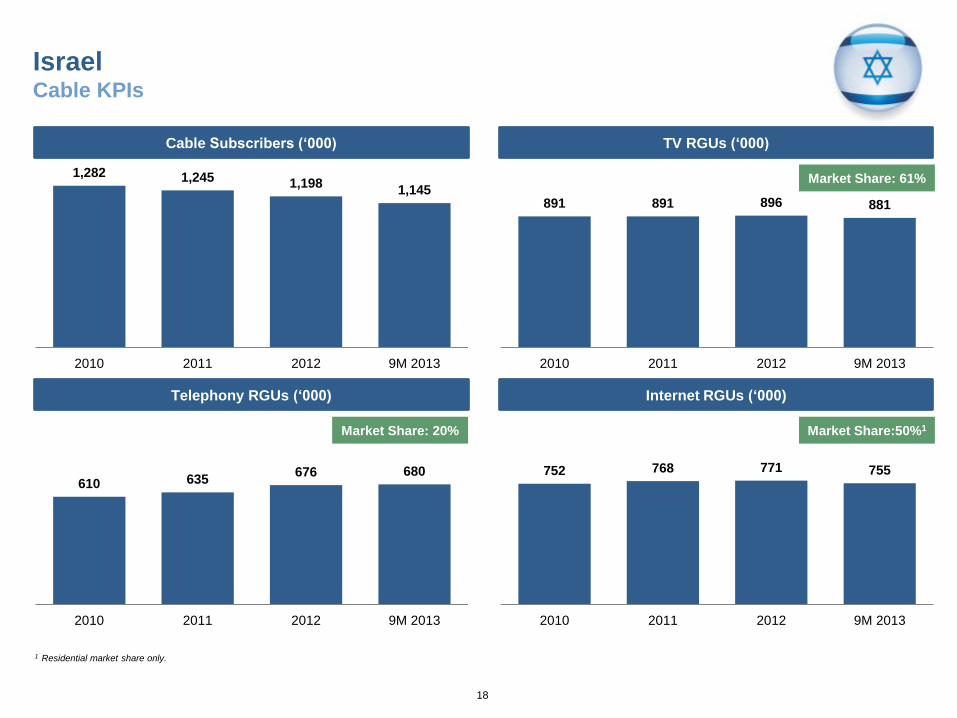
Israel Cable KPIs
Cable Subscribers (‘000) TV RGUs (‘000)
Telephony RGUs (‘000) Internet RGUs (‘000)
1,282 1,245 1,198 1,145
2010 2011 2012 9M 2013
610 635 676 680
2010 2011 2012 9M 2013
1 Residential market share only.
891 891 896 881
2010 2011 2012 9M 2013
752 768 771 755
2010 2011 2012 9M 2013
Market Share: 61%
Market Share:50%1 Market Share: 20%
19
49
93
140
112
157
205
160
190
222
55
105
65
95
155
110
209
231
213
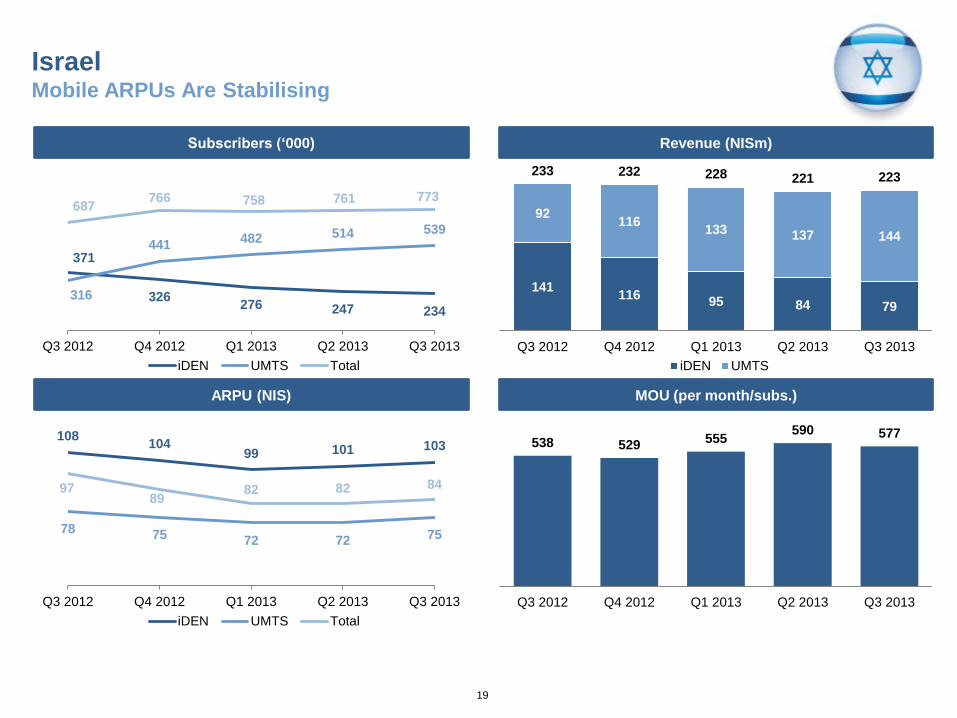
Israel Mobile ARPUs Are Stabilising
Subscribers (‘000) Revenue (NISm)
ARPU (NIS) MOU (per month/subs.)
371
326 276 247 234
316
441 482 514 539
687 766 758 761 773
Q3 2012 Q4 2012 Q1 2013 Q2 2013 Q3 2013
iDEN UMTS Total
108 104
99 101 103
78 75 72 72 75
97 89
82 82 84
Q3 2012 Q4 2012 Q1 2013 Q2 2013 Q3 2013
iDEN UMTS Total
141 116
95 84 79
92 116
133 137 144
233 232 228 221 223
Q3 2012 Q4 2012 Q1 2013 Q2 2013 Q3 2013
iDEN UMTS
538 529 555
590 577
Q3 2012 Q4 2012 Q1 2013 Q2 2013 Q3 2013
20
49
93
140
112
157
205
160
190
222
55
105
65
95
155
110
209
231
213
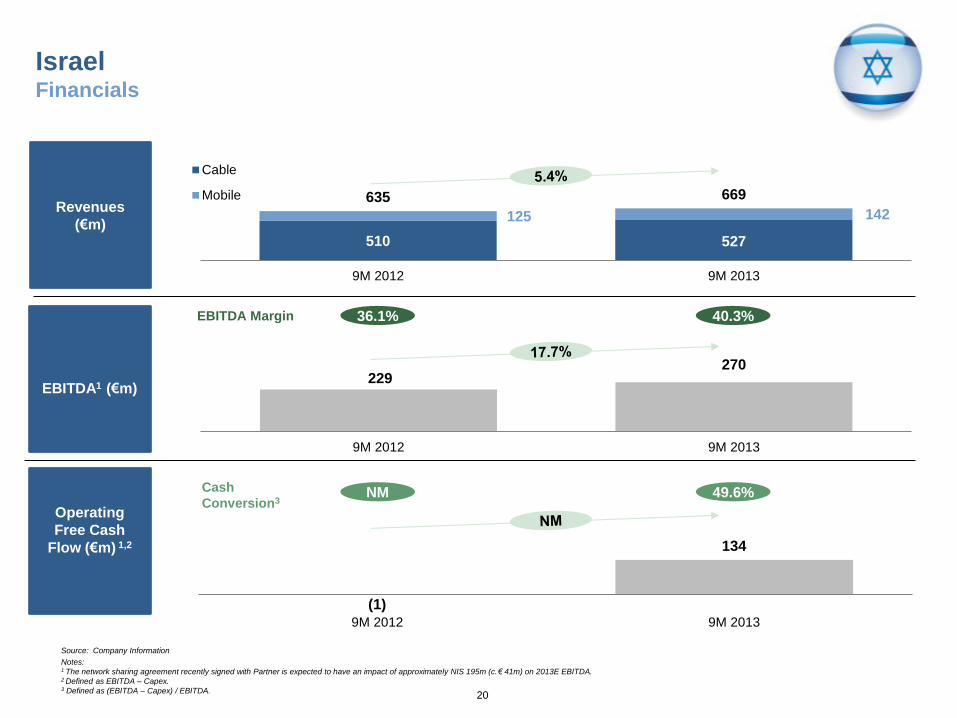
Revenues
(€m)
EBITDA1 (€m)
Operating
Free Cash
Flow (€m) 1,2
(1)
134
9M 2012 9M 2013
Israel Financials
Source: Company Information
Notes: 1 The network sharing agreement recently signed with Partner is expected to have an impact of approximately NIS 195m (c.€ 41m) on 2013E EBITDA. 2 Defined as EBITDA – Capex. 3 Defined as (EBITDA – Capex) / EBITDA.
510 527
125 142
635 669
9M 2012 9M 2013
Cable
Mobile
229 270
9M 2012 9M 2013
EBITDA Margin 36.1% 40.3%
NM 49.6% Cash
Conversion3
21
49
93
140
112
157
205
160
190
222
55
105
65
95
155
110
209
231
213
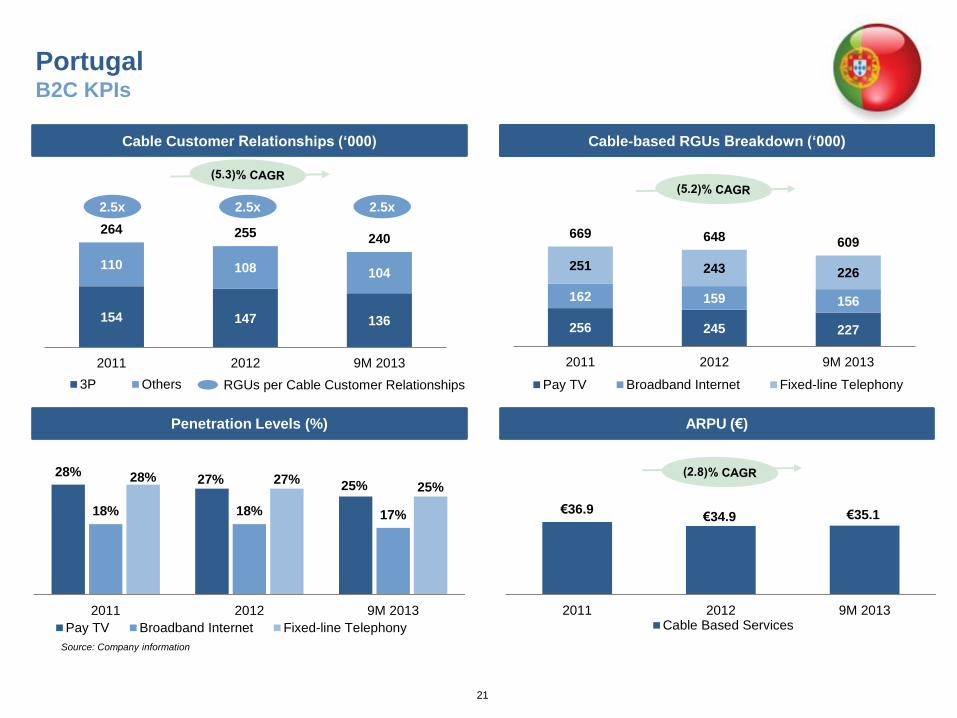
Portugal B2C KPIs
Penetration Levels (%)
Churn Rates Cable Customer Relationships (‘000) Cable-based RGUs Breakdown (‘000)
ARPU (€)
28% 27%
25%
18% 18% 17%
28% 27% 25%
2011 2012 9M 2013
Pay TV Broadband Internet Fixed-line Telephony
€36.9 €34.9 €35.1
2011 2012 9M 2013Cable Based Services
Source: Company information
256 245 227
162 159 156
251 243 226
669 648 609
2011 2012 9M 2013
Pay TV Broadband Internet Fixed-line Telephony
154 147 136
110 108 104
264 255 240
2011 2012 9M 2013
3P Others
2.5x 2.5x 2.5x
RGUs per Cable Customer Relationships
22
49
93
140
112
157
205
160
190
222
55
105
65
95
155
110
209
231
213
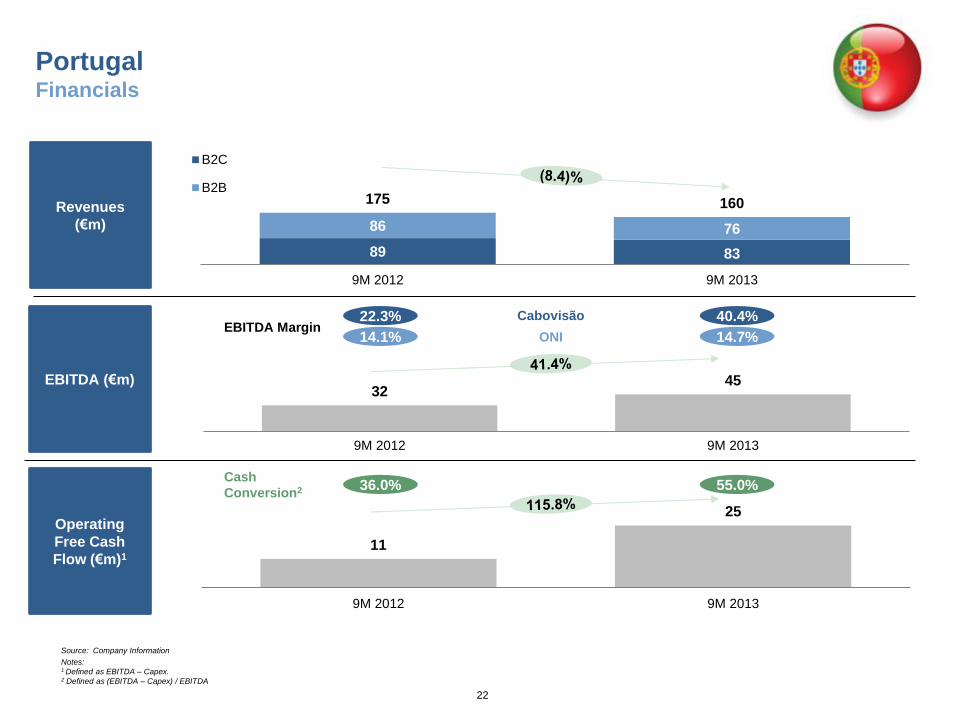
11
25
9M 2012 9M 2013
Portugal Financials
89 83
86 76
175 160
9M 2012 9M 2013
B2C
B2B
32 45
9M 2012 9M 2013
ONI
Cabovisão
Revenues
(€m)
Operating
Free Cash
Flow (€m)1
Source: Company Information
Notes: 1 Defined as EBITDA – Capex. 2 Defined as (EBITDA – Capex) / EBITDA
EBITDA (€m)
36.0% 55.0% Cash
Conversion2
EBITDA Margin 22.3%
14.1%
40.4%
14.7%
23
49
93
140
112
157
205
160
190
222
55
105
65
95
155
110
209
231
213
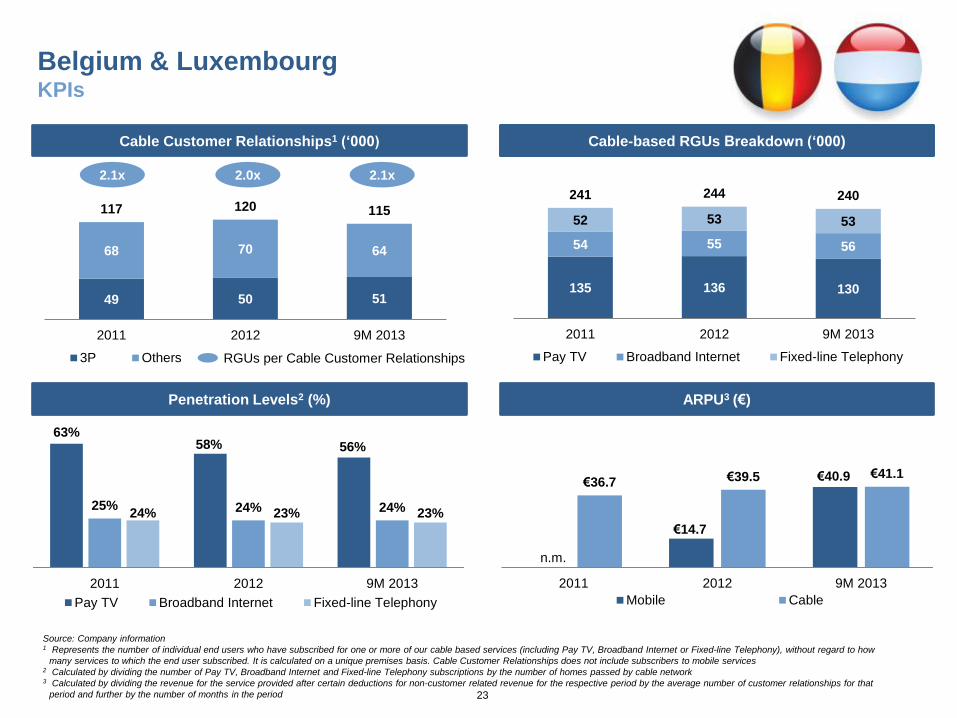
Belgium & Luxembourg KPIs
Churn Rates Cable Customer Relationships1 (‘000) Cable-based RGUs Breakdown (‘000)
135 136 130
54 55 56
52 53 53
241 244 240
2011 2012 9M 2013
Pay TV Broadband Internet Fixed-line Telephony
49 50 51
68 70 64
117 120 115
2011 2012 9M 2013
3P Others
Source: Company information 1 Represents the number of individual end users who have subscribed for one or more of our cable based services (including Pay TV, Broadband Internet or Fixed-line Telephony), without regard to how
many services to which the end user subscribed. It is calculated on a unique premises basis. Cable Customer Relationships does not include subscribers to mobile services 2 Calculated by dividing the number of Pay TV, Broadband Internet and Fixed-line Telephony subscriptions by the number of homes passed by cable network 3 Calculated by dividing the revenue for the service provided after certain deductions for non-customer related revenue for the respective period by the average number of customer relationships for that
period and further by the number of months in the period
2.1x 2.0x 2.1x
RGUs per Cable Customer Relationships
Penetration Levels2 (%) ARPU3 (€)
63% 58% 56%
25% 24% 24% 24% 23% 23%
2011 2012 9M 2013
Pay TV Broadband Internet Fixed-line Telephony
€14.7
€40.9 €36.7 €39.5 €41.1
2011 2012 9M 2013
Mobile Cable
n.m.
24
49
93
140
112
157
205
160
190
222
55
105
65
95
155
110
209
231
213
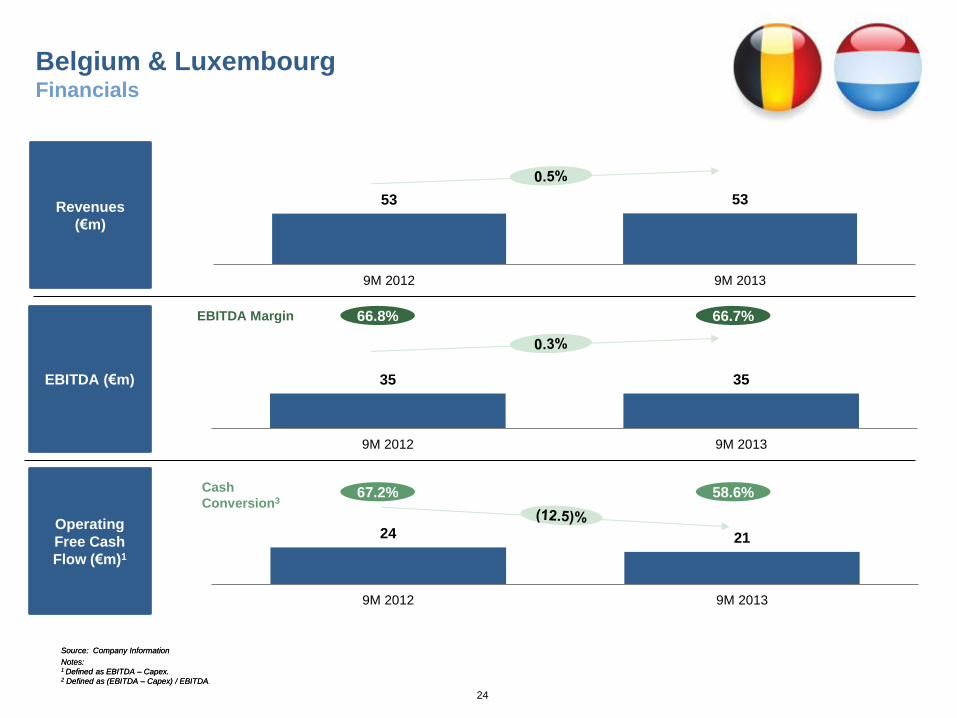
Belgium & Luxembourg Financials
Source: Company Information
Notes: 1 Defined as EBITDA – Capex. 2 Defined as (EBITDA – Capex) / EBITDA.
53 53
9M 2012 9M 2013
35 35
9M 2012 9M 2013
24 21
9M 2012 9M 2013
Revenues
(€m)
Operating
Free Cash
Flow (€m)1
Source: Company Information
Notes: 1 Defined as EBITDA – Capex. 2 Defined as (EBITDA – Capex) / EBITDA
EBITDA (€m)
EBITDA Margin 66.8% 66.7%
67.2% 58.6% Cash
Conversion3
25
49
93
140
112
157
205
160
190
222
55
105
65
95
155
110
209
231
213
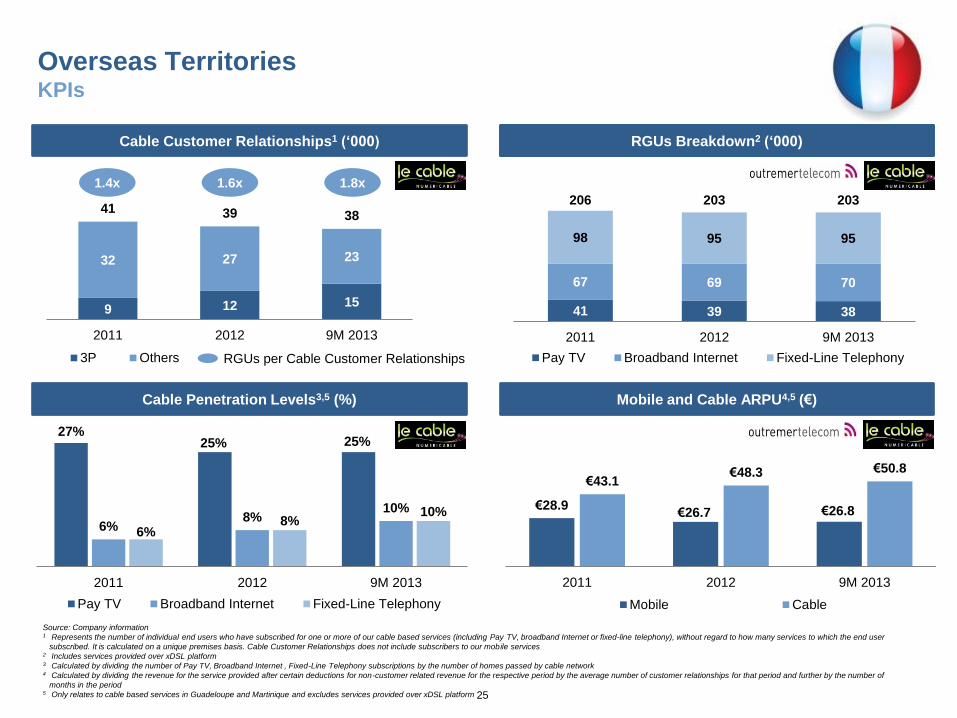
Source: Company information 1 Represents the number of individual end users who have subscribed for one or more of our cable based services (including Pay TV, broadband Internet or fixed-line telephony), without regard to how many services to which the end user
subscribed. It is calculated on a unique premises basis. Cable Customer Relationships does not include subscribers to our mobile services 2 Includes services provided over xDSL platform 3 Calculated by dividing the number of Pay TV, Broadband Internet , Fixed-Line Telephony subscriptions by the number of homes passed by cable network 4 Calculated by dividing the revenue for the service provided after certain deductions for non-customer related revenue for the respective period by the average number of customer relationships for that period and further by the number of
months in the period 5 Only relates to cable based services in Guadeloupe and Martinique and excludes services provided over xDSL platform
Overseas Territories KPIs
Churn Rates Cable Customer Relationships1 (‘000) RGUs Breakdown2 (‘000)
41 39 38
67 69 70
98 95 95
206 203 203
2011 2012 9M 2013
Pay TV Broadband Internet Fixed-Line Telephony
9 12 15
32 27 23
41 39 38
2011 2012 9M 2013
3P Others
1.4x 1.6x 1.8x
RGUs per Cable Customer Relationships
Cable Penetration Levels3,5 (%) Mobile and Cable ARPU4,5 (€)
27% 25% 25%
6% 8%
10%
6% 8%
10%
2011 2012 9M 2013
Pay TV Broadband Internet Fixed-Line Telephony
€28.9 €26.7 €26.8
€43.1 €48.3 €50.8
2011 2012 9M 2013
Mobile Cable
26
49
93
140
112
157
205
160
190
222
55
105
65
95
155
110
209
231
213
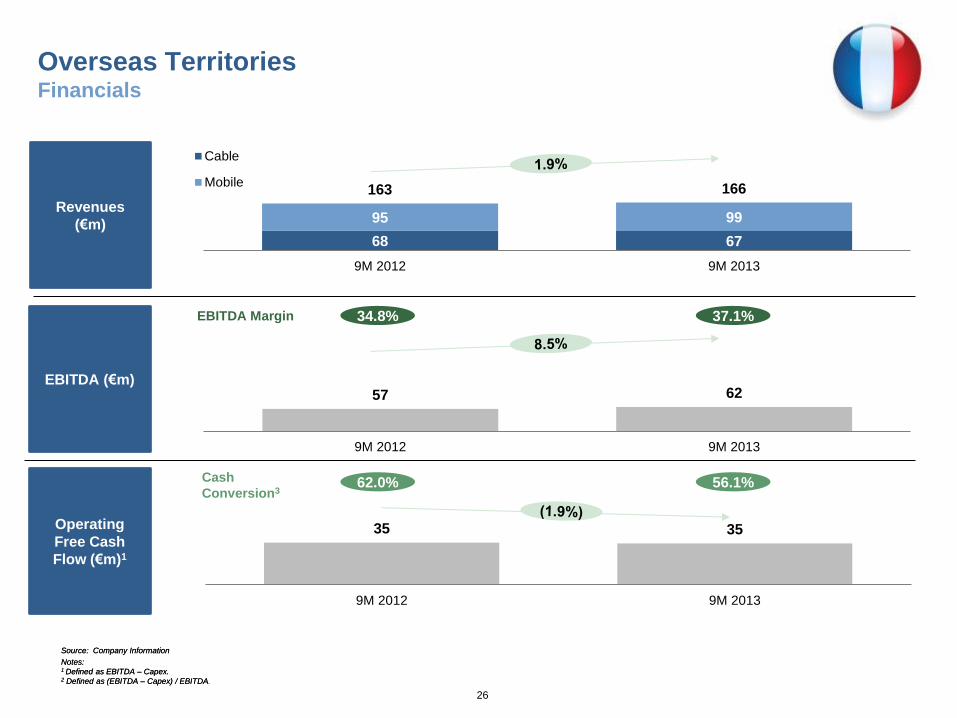
Overseas Territories Financials
57 62
9M 2012 9M 2013
35 35
9M 2012 9M 2013
68 67
95 99
163 166
9M 2012 9M 2013
Cable
Mobile
Source: Company Information
Notes: 1 Defined as EBITDA – Capex. 2 Defined as (EBITDA – Capex) / EBITDA.
Revenues
(€m)
Operating
Free Cash
Flow (€m)1
Source: Company Information
Notes: 1 Defined as EBITDA – Capex. 2 Defined as (EBITDA – Capex) / EBITDA
EBITDA (€m)
EBITDA Margin 34.8% 37.1%
62.0% 56.1% Cash
Conversion3
27
49
93
140
112
157
205
160
190
222
55
105
65
95
155
110
209
231
213
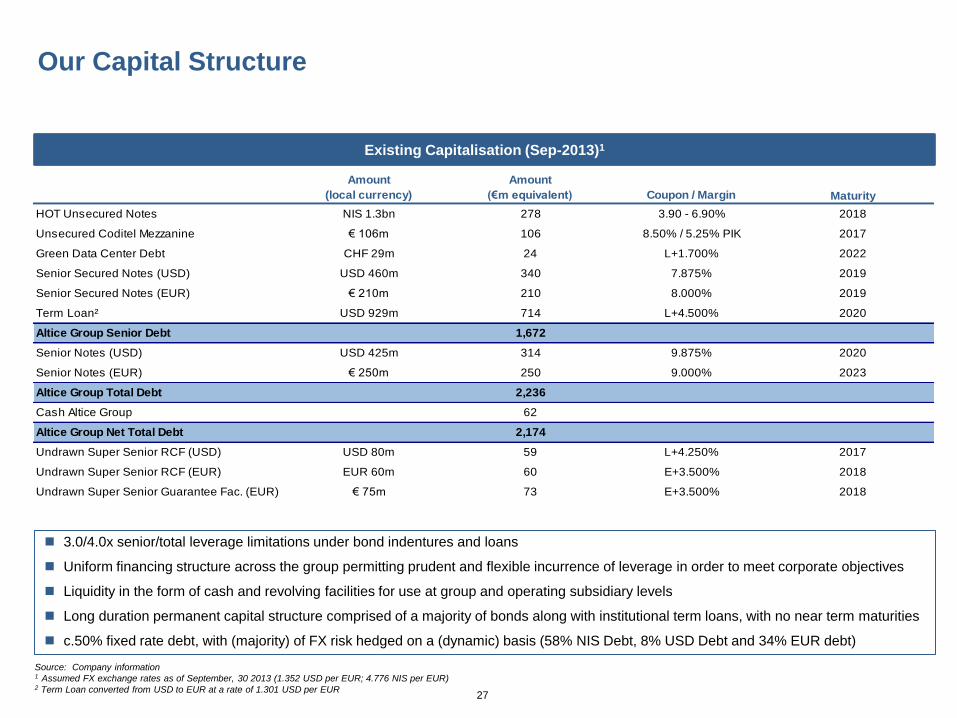
Our Capital Structure
Existing Capitalisation (Sep-2013)1
Source: Company information 1 Assumed FX exchange rates as of September, 30 2013 (1.352 USD per EUR; 4.776 NIS per EUR)
2 Term Loan converted from USD to EUR at a rate of 1.301 USD per EUR
3.0/4.0x senior/total leverage limitations under bond indentures and loans
Uniform financing structure across the group permitting prudent and flexible incurrence of leverage in order to meet corporate objectives
Liquidity in the form of cash and revolving facilities for use at group and operating subsidiary levels
Long duration permanent capital structure comprised of a majority of bonds along with institutional term loans, with no near term maturities
c.50% fixed rate debt, with (majority) of FX risk hedged on a (dynamic) basis (58% NIS Debt, 8% USD Debt and 34% EUR debt)
Amount
(local currency)
Amount
(€m equivalent) Coupon / Margin Maturity
HOT Unsecured Notes NIS 1.3bn 278 3.90 - 6.90% 2018
Unsecured Coditel Mezzanine € 106m 106 8.50% / 5.25% PIK 2017
Green Data Center Debt CHF 29m 24 L+1.700% 2022
Senior Secured Notes (USD) USD 460m 340 7.875% 2019
Senior Secured Notes (EUR) € 210m 210 8.000% 2019
Term Loan² USD 929m 714 L+4.500% 2020
Altice Group Senior Debt 1,672
Senior Notes (USD) USD 425m 314 9.875% 2020
Senior Notes (EUR) € 250m 250 9.000% 2023
Altice Group Total Debt 2,236
Cash Altice Group 62
Altice Group Net Total Debt 2,174
Undrawn Super Senior RCF (USD) USD 80m 59 L+4.250% 2017
Undrawn Super Senior RCF (EUR) EUR 60m 60 E+3.500% 2018
Undrawn Super Senior Guarantee Fac. (EUR) € 75m 73 E+3.500% 2018
28
49
93
140
112
157
205
160
190
222
55
105
65
95
155
110
209
231
213
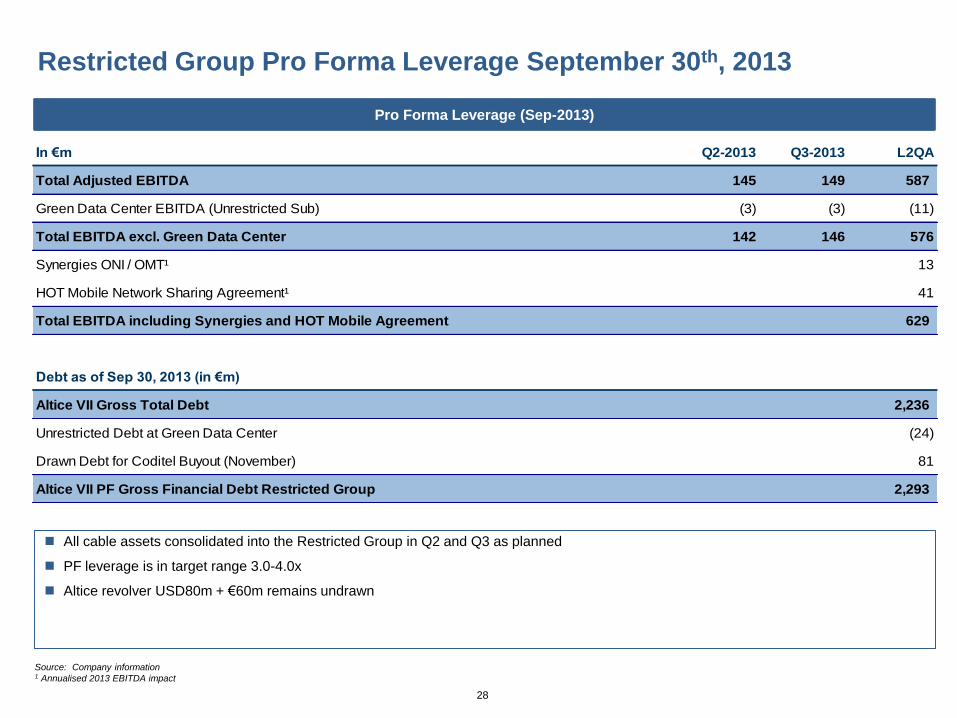
Restricted Group Pro Forma Leverage September 30th, 2013
Pro Forma Leverage (Sep-2013)
Source: Company information 1 Annualised 2013 EBITDA impact
All cable assets consolidated into the Restricted Group in Q2 and Q3 as planned
PF leverage is in target range 3.0-4.0x
Altice revolver USD80m + €60m remains undrawn
In €m Q2-2013 Q3-2013 L2QA
Total Adjusted EBITDA 145 149 587
Green Data Center EBITDA (Unrestricted Sub) (3) (3) (11)
Total EBITDA excl. Green Data Center 142 146 576
Synergies ONI / OMT¹ 13
HOT Mobile Network Sharing Agreement¹ 41
Total EBITDA including Synergies and HOT Mobile Agreement 629
Debt as of Sep 30, 2013 (in €m)
Altice VII Gross Total Debt 2,236
Unrestricted Debt at Green Data Center (24)
Drawn Debt for Coditel Buyout (November) 81
Altice VII PF Gross Financial Debt Restricted Group 2,293
29
49
93
140
112
157
205
160
190
222
55
105
65
95
155
110
209
231
213
\\IBLNS002VF\KAR2012\12. Ratings Presentation\Altice Materials\Template\Altice Theme1.thmx This is the theme path for Excel
Agenda
Key Highlights 1
Group Financials 2
Q&A 3

30
49
93
140
112
157
205
160
190
222
55
105
65
95
155
110
209
231
213
\\IBLNS002VF\KAR2012\12. Ratings Presentation\Altice Materials\Template\Altice Theme1.thmx This is the theme path for Excel
Thank
You