Embed Size (px)
Citation preview
www.airliquide.com
Follow us on Twitter @AirLiquideGroup
PRESS RELEASE
Paris, April 26, 2016
First quarter 2016:
Solid Comparable Gas & Services Sales Growth
Airgas Acquisition on Track
Q1 2016 Key Figures
■ Group Revenue:
3,872 million euros
■ of which Gas & Services:
3,548 million euros
+2.4%*
+4.2%*
Q1 2016 Highlights
■ External factors: lower exchange rates and energy
prices.
■ New contracts in growing markets: air gases for
energy (China), ultra-pure xenon for satellite
propulsion (France), biogas purification units (Europe).
■ Acquisitions in Healthcare (hygiene specialist in
Brazil) and in Industrial Merchant (a UK-based
player in temperature controlled logistics for the
pharmaceutical industry).
■ Innovation and Technologies: project for the plant of
the future certified “technological showcase” in France,
inauguration of the new Research and Technology
Center in Shanghai.
* Change Q1 2016/Q1 2015 on a comparable basis: excluding currency, energy, and significant M&A impacts.
Commenting on the first quarter 2016, Benoît Potier, Chairman and CEO of Air Liquide, said:
“In the first quarter, growth was driven by dynamic sales in Electronics and the ramp-up of our production
units in Large Industries. From a geographic perspective, growth was driven by Asia-Pacific, especially
China. This quarter was also characterized by lower exchange rates and energy prices.
In Western Europe, industrial demand was moderate early in the year, while in North America sales
continued to be affected by the slowdown in the oil & gas and metal fabrication sectors. Conversely,
developing economies posted strong growth.
In addition, the Group continues to generate recurring efficiency gains, strengthen its competitiveness, and
invest in its growth markets.
The Airgas acquisition is on track and in line with our expectations, with the preparatory work for
integration allowing us to confirm synergies of more than $ 300 million, as announced last November. In
addition, the transaction refinancing allows us today to envision a capital increase of between 3 and 3.5
billion euros. Lastly, acquisition timing might shorten, with possible completion by late Q2 2016.
Excluding the impact of Airgas acquisition and financing, and assuming a comparable environment,
Air Liquide is confident in its ability to deliver another year of net profit growth in 2016.”

www.airliquide.com
Follow us on Twitter @AirLiquideGroup
Q1 2016 Group revenue reached € 3,872 million, up +2.4% on a comparable basis and down -3.1% on a
reported basis compared with Q1 2015. Sales in Gas & Services, which amounted to € 3,548 million, rose by
+4.2% on a comparable basis and fell -1.8% on a reported basis. During this quarter, the unfavorable
currency impact (-2.0% for Gas & Services), which was favorable in 2015, added to the negative impact of
energy prices (-4.0% for Gas & Services).
The developing economies posted strong growth, with Gas & Services revenue up +14.1% on a comparable
basis.
Overall, all Gas & Services sales grew on a comparable basis in the 1st quarter, except for Industrial
Merchant, impacted by weak demand in certain industrial sectors. Therefore:
Large Industries strongly increased by +8.6%, benefiting from the ramp-up of our production units,
notably in Germany, in China, and in Saudi Arabia. Hydrogen volumes were up substantially, in
particular due to the ramp-up of the Yanbu site, while demand for air gases remained sustained in all
geographic regions.
Industrial Merchant, down by -2.6%, remains contrasted. Demand for oil services and related
industries in North America was still weak, while in Western Europe, manufacturing activity was
moderate. Conversely, developing economies grew, notably in China, with volumes substantially up.
Overall, the most dynamic end markets this quarter were the Automotive and Food industries. The
price effect was slightly positive at +0.5 % in a low inflation environment.
Electronics continues to record robust growth of +13.4%. It was driven by the strong rise in sales of
equipment and installation, increased demand for specialty gases, and growth in sales of advanced
materials of more than +30%. The Electronics business was particularly vigorous in Japan, in China,
and in Singapore.
Healthcare, up +4.1%, continues to be a growth driver for the Group. All geographic zones had
increased revenue growth. Home healthcare benefited from solid organic growth, while the
contribution to sales from bolt-on acquisitions was moderate this quarter. In Hygiene, sales have
continued to strongly increase (+21.2%).
Engineering and Construction revenue, which reached € 124 million this quarter, was lower due to the
impact of the slowdown in large projects linked to energy in a number of countries.
Global Markets & Technologies revenue totaled € 65 million, an increase of +11.1% on a comparable basis,
driven by markets related to maritime and those related to the energy transition and space.
Efficiency gains amounted to € 63 million, in line with our forecasts for the year. Actions carried out on
production sites as well as in supply chain and procurement management, contributed to the Group’s good
operating performance.
CONTACTS
Corporate Communications Investor Relations
Annie Fournier Aude Rodriguez
+ 33 (0)1 40 62 51 31 +33 (0)1 40 62 57 08
Caroline Philips Erin Sarret
+ 33 (0)1 40 62 50 84 +33 (0)1 40 62 57 37
Louis Laffont
+33 (0)1 40 62 57 18

www.airliquide.com
Follow us on Twitter @AirLiquideGroup
UPCOMING EVENTS
Annual General Meeting
May 12, 2016
Dividend ex-date
May 23, 2016
Dividend payment date
May 25, 2016
2016 First Half results
August 1, 2016
World leader in gases, technologies and services for Industry and Health, Air Liquide is present in 80 countries with more than
50,000 employees and serves more than 2 million customers and patients. Oxygen, nitrogen and hydrogen have been at the core of the
company’s activities since its creation in 1902. Air Liquide’s ambition is to be the leader in its industry, delivering long-term performance
and acting responsibly.
Air Liquide ideas create value over the long term. At the core of the company’s development are the commitment and constant
inventiveness of its people.
Air Liquide anticipates the challenges of its markets, invests locally and globally, and delivers high-quality solutions to its customers and
patients, and the scientific community.
The company relies on competitiveness in its operations, targeted investments in growing markets and innovation to deliver profitable
growth over the long-term.
Air Liquide’s revenues amounted to € 16.4 billion in 2015 and its solutions that protect life and the environment represented more than
40% of sales. Air Liquide is listed on the Paris Euronext stock exchange (compartment A) and is a member of the CAC 40 and Dow
Jones Euro Stoxx 50 indexes.
Air Liquide – First Quarter 2016 Revenue
Page 1/11
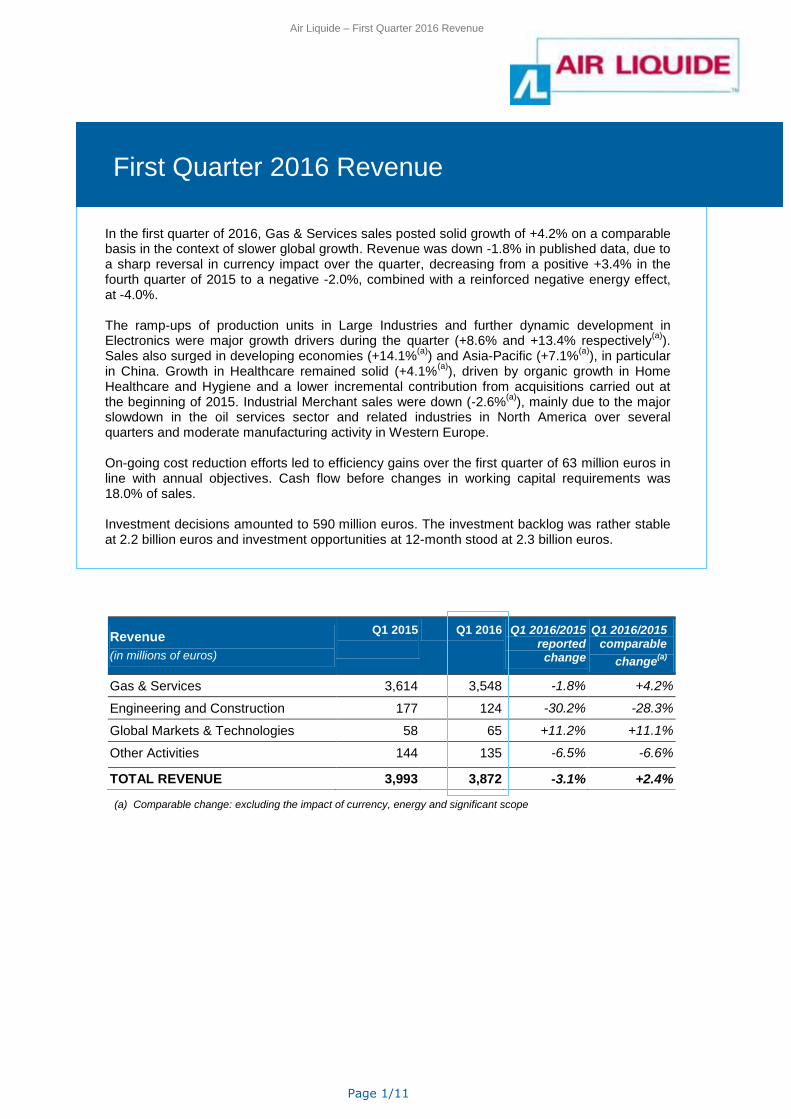
In the first quarter of 2016, Gas & Services sales posted solid growth of +4.2% on a comparable basis in the context of slower global growth. Revenue was down -1.8% in published data, due to a sharp reversal in currency impact over the quarter, decreasing from a positive +3.4% in the fourth quarter of 2015 to a negative -2.0%, combined with a reinforced negative energy effect, at -4.0%. The ramp-ups of production units in Large Industries and further dynamic development in Electronics were major growth drivers during the quarter (+8.6% and +13.4% respectively
(a)).
Sales also surged in developing economies (+14.1%(a)
) and Asia-Pacific (+7.1%(a)
), in particular in China. Growth in Healthcare remained solid (+4.1%
(a)), driven by organic growth in Home
Healthcare and Hygiene and a lower incremental contribution from acquisitions carried out at the beginning of 2015. Industrial Merchant sales were down (-2.6%
(a)), mainly due to the major
slowdown in the oil services sector and related industries in North America over several quarters and moderate manufacturing activity in Western Europe. On-going cost reduction efforts led to efficiency gains over the first quarter of 63 million euros in line with annual objectives. Cash flow before changes in working capital requirements was 18.0% of sales. Investment decisions amounted to 590 million euros. The investment backlog was rather stable at 2.2 billion euros and investment opportunities at 12-month stood at 2.3 billion euros.
(a) Comparable change: excluding the impact of currency, energy and significant scope
Revenue (in millions of euros)
Q1 2015
Q1 2016 Q1 2016/2015 reported
change
Q1 2016/2015 comparable
change(a)
Gas & Services 3,614 3,548 -1.8% +4.2%
Engineering and Construction 177 124 -30.2% -28.3%
Global Markets & Technologies 58 65 +11.2% +11.1%
Other Activities 144 135 -6.5% -6.6%
TOTAL REVENUE 3,993 3,872 -3.1% +2.4%
First quarter 2015 revenue
First Quarter 2016 Revenue
Air Liquide – First Quarter 2016 Revenue
Page 2/11
Revenue Analysis
Group
Group revenue for the first quarter of 2016 totaled 3,872 million euros, up +2.4% on a comparable basis. Reported revenue was down -3.1%, with the highly unfavorable impact of both currency and energy over the period at -1.9% and -3.6% respectively. There was no significant scope impact during the quarter.
Unless mentioned otherwise, all changes in revenue described below are based on a comparable basis which exclude currency, energy (natural gas and electricity) and significant scope impact. The energy impact may include other Large Industries energy feedstocks in the future.
Gas & Services
In the first quarter of 2016, Gas & Services revenue came to 3,548 million euros with sustained comparable growth of +4.2%. Sales were down -1.8% in published data, penalized by negative currency (-2.0%) and energy (-4.0%) impact.
Sales
(in millions of euros)
Q1 2015
Q1 2016 Q1 2016/2015 reported
change
Q1 2016/2015 comparable
change(a)
Europe 1,684 1,614 -4.2% +1.6%
Americas 888 824 -7.2% +1.1%
Asia-Pacific 936 966 +3.2% +7.1%
Middle East and Africa 106 144 +36.6% +44.7%
Gas & Services 3,614 3,548 -1.8% +4.2%
Large Industries 1,264 1,207 -4.5% +8.6%
Industrial Merchant 1,309 1,238 -5.4% -2.6%
Healthcare 685 695 +1.4% +4.1%
Electronics 356 408 +14.4% +13.4%
(a) Comparable change: excluding the impact of currency, energy and significant scope
Air Liquide – First Quarter 2016 Revenue
Page 3/11
Europe
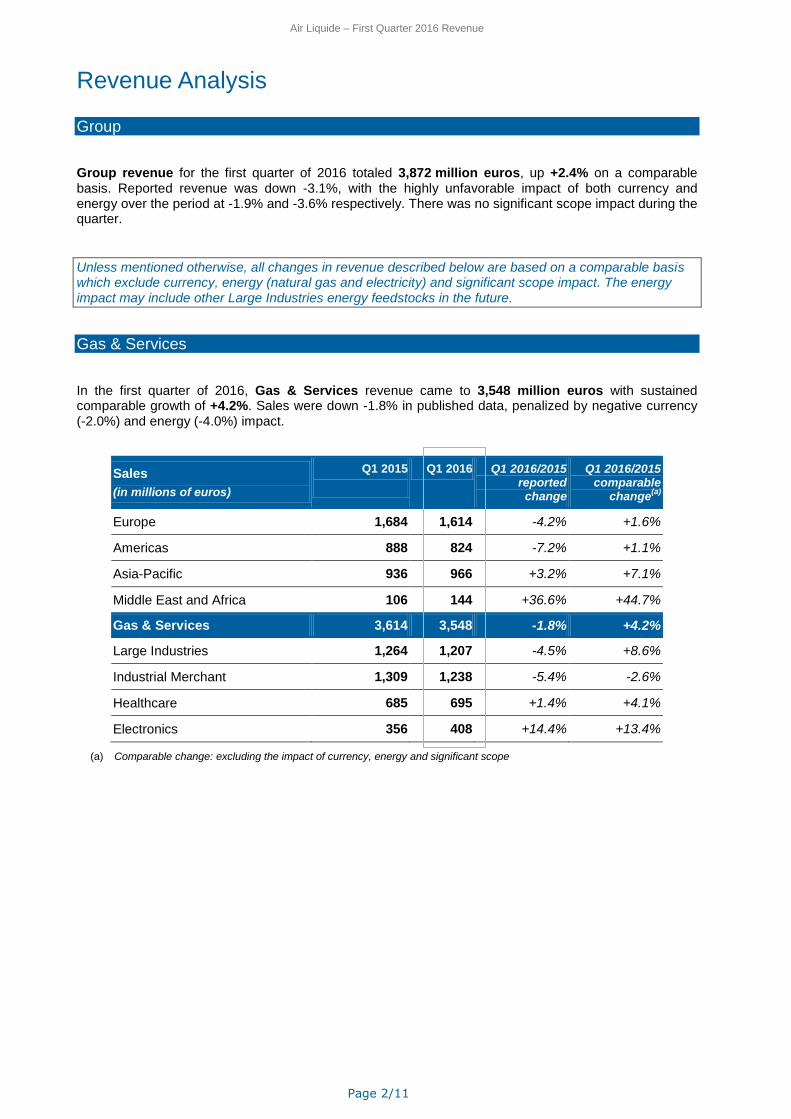
At 1,614 million euros, revenue in Europe was up +1.6%. This growth, inferior to that recorded in the last quarters of 2015, is notably explained by a lower incremental contribution from acquisitions in Healthcare and the persistently difficult environment in Industrial Merchant. Eastern Europe continued its double-digit growth.
Large Industries revenue was up +3.0%, in particular driven by the ramp-up of the Dormagen CO unit in Germany and new hydrogen units in Benelux. Demand in air gases was also stronger. Business in Eastern Europe remained dynamic particularly in Russia and Poland.
In the Industrial Merchant business line, sales were down -1.3% and presented a contrasted situation: liquid volumes continued to rise with greater pressure on prices, notably in Germany, whereas the cylinder activity remained in slight decline. Sales were resilient in Food Processing, but low in Metal Fabrication. In developing economies, sales continued to improve steadily with strong growth in liquid volumes. The regional price impact was -0.6% in a context of weak inflation and a drop in prices for customers with contracts indexed to energy costs.
Healthcare showed growth of +2.7%, lower than in 2015 due to a lesser incremental contribution from acquisitions carried out at the beginning of 2015. Home Healthcare and Hygiene both pursued their solid organic growth, sustained by a continued increase in the number of patients treated in Home Healthcare and by innovative products in Hygiene. The latter also benefited from the integration of acquisitions carried out during 2015. In medical gases for hospitals, pricing pressure continued to impact sales.
Americas
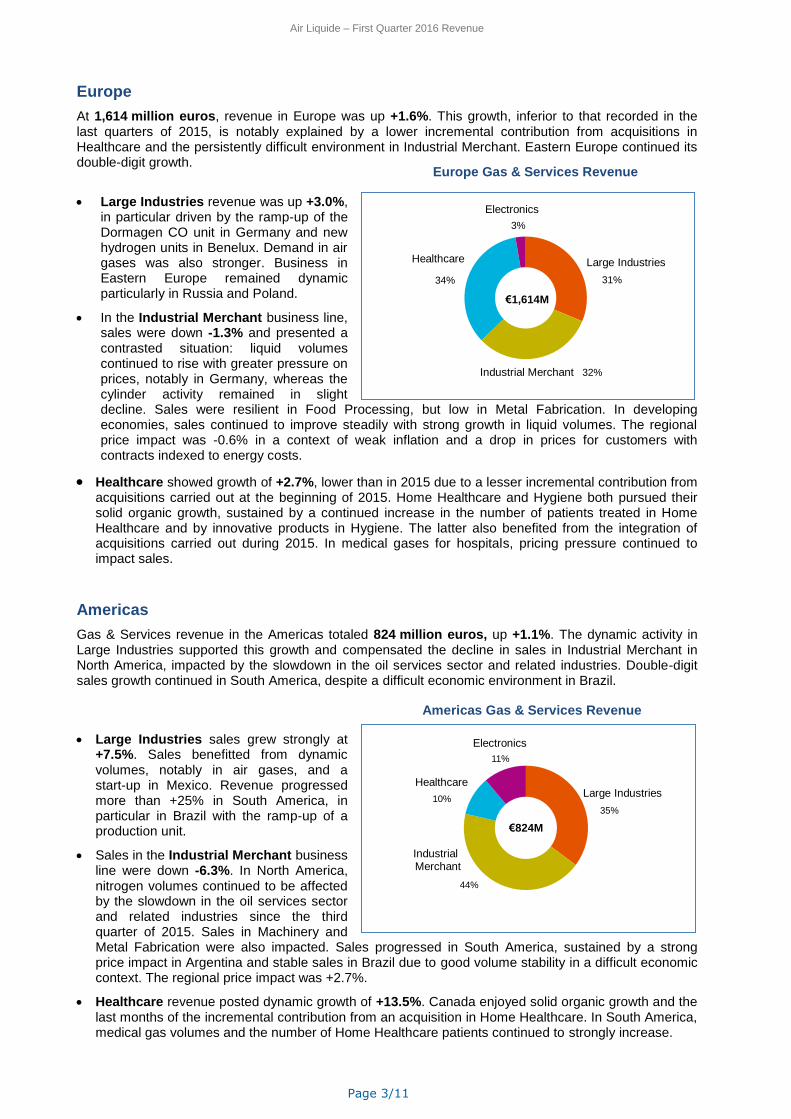
Gas & Services revenue in the Americas totaled 824 million euros, up +1.1%. The dynamic activity in Large Industries supported this growth and compensated the decline in sales in Industrial Merchant in North America, impacted by the slowdown in the oil services sector and related industries. Double-digit sales growth continued in South America, despite a difficult economic environment in Brazil.
Large Industries sales grew strongly at +7.5%. Sales benefitted from dynamic volumes, notably in air gases, and a start-up in Mexico. Revenue progressed more than +25% in South America, in particular in Brazil with the ramp-up of a production unit.
Sales in the Industrial Merchant business line were down -6.3%. In North America, nitrogen volumes continued to be affected by the slowdown in the oil services sector and related industries since the third quarter of 2015. Sales in Machinery and Metal Fabrication were also impacted. Sales progressed in South America, sustained by a strong price impact in Argentina and stable sales in Brazil due to good volume stability in a difficult economic context. The regional price impact was +2.7%.
Healthcare revenue posted dynamic growth of +13.5%. Canada enjoyed solid organic growth and the last months of the incremental contribution from an acquisition in Home Healthcare. In South America, medical gas volumes and the number of Home Healthcare patients continued to strongly increase.
Europe Gas & Services Revenue
Americas Gas & Services Revenue
31%
32%
34%
3%
Large IndustriesHealthcare
Industrial Merchant
Electronics
€1,614M
35%
44%
10%
11%
Large IndustriesHealthcare
Industrial Merchant
Electronics
€824M
Air Liquide – First Quarter 2016 Revenue
Page 4/11
Asia-Pacific Gas & Services Revenue
Electronics sales remained stable over the quarter (+0.5%); revenue excluding Equipment and Installation was up +2.3%.
Asia-Pacific
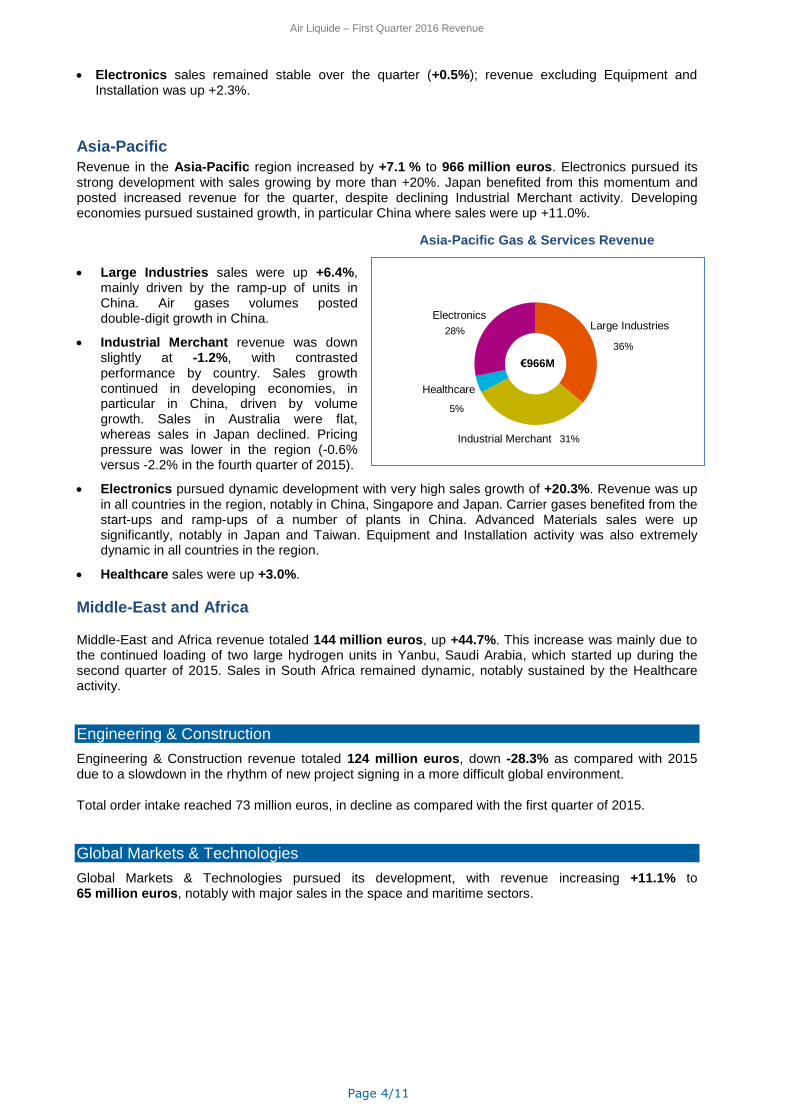
Revenue in the Asia-Pacific region increased by +7.1 % to 966 million euros. Electronics pursued its strong development with sales growing by more than +20%. Japan benefited from this momentum and posted increased revenue for the quarter, despite declining Industrial Merchant activity. Developing economies pursued sustained growth, in particular China where sales were up +11.0%.
Large Industries sales were up +6.4%, mainly driven by the ramp-up of units in China. Air gases volumes posted double-digit growth in China.
Industrial Merchant revenue was down slightly at -1.2%, with contrasted performance by country. Sales growth continued in developing economies, in particular in China, driven by volume growth. Sales in Australia were flat, whereas sales in Japan declined. Pricing pressure was lower in the region (-0.6% versus -2.2% in the fourth quarter of 2015).
Electronics pursued dynamic development with very high sales growth of +20.3%. Revenue was up in all countries in the region, notably in China, Singapore and Japan. Carrier gases benefited from the start-ups and ramp-ups of a number of plants in China. Advanced Materials sales were up significantly, notably in Japan and Taiwan. Equipment and Installation activity was also extremely dynamic in all countries in the region.
Healthcare sales were up +3.0%.
Middle-East and Africa
Middle-East and Africa revenue totaled 144 million euros, up +44.7%. This increase was mainly due to the continued loading of two large hydrogen units in Yanbu, Saudi Arabia, which started up during the second quarter of 2015. Sales in South Africa remained dynamic, notably sustained by the Healthcare activity.
Engineering & Construction
Engineering & Construction revenue totaled 124 million euros, down -28.3% as compared with 2015 due to a slowdown in the rhythm of new project signing in a more difficult global environment.
Total order intake reached 73 million euros, in decline as compared with the first quarter of 2015.
Global Markets & Technologies
Global Markets & Technologies pursued its development, with revenue increasing +11.1% to 65 million euros, notably with major sales in the space and maritime sectors.
36%
31%
5%
28%Large Industries
Healthcare
Industrial Merchant
Electronics
€966M

Air Liquide – First Quarter 2016 Revenue
Page 5/11
Other Activities
Other Activities revenue in the first quarter of 2016 declined by -6.6% to 135 million euros.
Welding sales decreased by -7.1% in the first quarter, due to weak activity, in particular in Western Europe.
Diving (Aqua LungTM) posted -5.7 % decline in sales, as the geopolitical context was not favorable to the growth of diving activities in certain regions.
Sales
(in millions of euros)
Q1 2015 Q1 2016 Q1 2016/2015 reported
change
Q1 2016/2015 comparable
change (a)
Welding 93 86 -7.4% -7.1%
Diving 51 49 -4.9% -5.7%
TOTAL OTHER ACTIVITIES 144 135 -6.5% -6.6%
(a) Comparable change: excluding currency impact
Quarterly Highlights
DEVELOPMENT OF INDUSTRIAL ACTIVITY
During the first quarter 2016, new contracts were signed in Large Industries:
In China, Air Liquide signed a new long-term contract with Xinneng Energy Company, a subsidiary of ENN Ecological Holdings Company (ENN). Under the terms of the new agreement, Air Liquide will invest more than 60 million euros in an ASU (Air Separation Unit), with a total capacity of 2,700 tonnes of oxygen per day. This new unit is expected to start operations in the second quarter of 2018.
Air Liquide also signed a new long-term contract with Maoming Petrochemical Co. (MPCC), a subsidiary of China Petroleum & Chemical Corp. (Sinopec Corp.), one of the largest integrated energy and chemical companies in China. Under the terms of the new agreement, Air Liquide will invest around 40 million euros in a new state-of-the-art ASU (Air Separation Unit), with a total capacity of 850 tonnes of oxygen per day. Expected to start operations in the second quarter of 2017, the new ASU will supply industrial gases including oxygen and nitrogen to the customer’s new ethylene oxide plant as well as to its existing one. MPCC’s decision to outsource their needs for industrial gases on this new project demonstrates their confidence in Air Liquide’s capability to provide innovative solutions and deliver safe operations.
In Industrial Merchant:
Air Liquide has signed two multi-year contracts recently, a total worth of € 20 million, for the supply of high purity xenon in the all-electric propulsion satellite market: one with Airbus Defence and Space, the world leader in high power electric satellites and one with Thales Alenia Space, leader in High Throughput Satellites
CRYO International, an Air Liquide group subsidiary specializing in temperature-controlled logistics solutions, has acquired PDP Couriers, a major player in the customized transport of high value-added products for the pharmaceutical and biotechnology industries. The company generated revenues of approximately €21 million in 2015. PDP Couriers has grown significantly in Eastern Europe, Latin America and Asia over the past few years.
Air Liquide – First Quarter 2016 Revenue
Page 6/11
DEVELOPMENT IN HEALTHCARE During the first quarter of 2016, Air Liquide pursued its external growth strategy in Healthcare. The Group announced the acquisition by its subsidiary Schülke, a specialist in hygiene and hospital disinfection, of Vic Pharma, the second largest independent player in the Brazilian hygiene market. It offers a broad range of hygiene products for disinfecting surfaces, instruments and medical devices, as well as antiseptic solutions for pre- or post-operative care. Present mainly in the hospital and medical settings, the company generated revenue of approximately 8 million euros in 2015. NEW PROJECTS IN INNOVATION AND TECHNOLOGIES
Air Liquide has inaugurated its new Shanghai Research & Technology Center (SRTC). This new center will ultimately host 250 employees, including researchers, experts in customer applications and business development teams. It will become a major center for the Group’s innovation in the Asia-Pacific region. This opening follows the celebration of the twentieth anniversary of the Group’s Engineering & Construction facilities in Hangzhou, a city of Zhejiang province in Eastern China, illustrating the long-term commitment of the Group in China.
A first in the industrial gases sector, Air Liquide’s was certified as a “technological showcase” in France by the Industry of the Future Alliance. Air Liquide will invest, in Large Industries, 20 million euros by 2017, in the project called “Connect”. The Group will create a remote operations and optimization center in France which is unique in the industrial gases industry, able to control and optimize the production, energy, efficiency and reliability of the Large Industries sites, or carry out predictive maintenance actions.
Air Liquide commissioned 12 biogas purification units in the last 12 months in Europe and triples its
biogas purification capacity on the European continent. The Group has developed technologies and
expertise that span the entire biomethane value chain: purification of biogas into biomethane, injection
into the natural gas network, liquefaction, and distribution for clean transportation fleets. The purification
and biogas valorization is a very promising example of a circular economy, which helps reduce
greenhouse gas emissions and which could contribute to solutions for the zero emission transportation of
tomorrow.
MAJOR ACQUISITION PROJECT
The acquisition process of the American company Airgas, announced 17 November 2015, is on track as foreseen. Once the regulatory approval from the American authorities is received, acquisition timing might shorten, with possible completion by late Q2 2016.
The integration plan of the two organizations is progressing: the business lines Large Industries and Electronics will be supervised from the site in Houston, Texas and the business lines Industrial Merchant and Healthcare from the site in Radnor, Pennsylvania.
The synergies, which amount to more than 300 million euros, are confirmed. For approximately 70%, the amounts identified result from optimization in production and logistics and the alignment of administrative processes. For approximately 30%, sales synergies correspond to the deployment of Air Liquide offers through the Airgas network and of Airgas offers in Canada and Mexico. They also include the increase in sales of air gases and helium based on the production capacity of Air Liquide.
The refinancing has been refined: the foreseen range for the equity capital increase through preferential subscription rights has been reduced down to between 3 to 3.5 billion euros. Finally, a contingent hedging (US$/€uro) has been put in place to reduce the currency risk relative to this acquisition in US Dollars.
Air Liquide – First Quarter 2016 Revenue
Page 7/11
Investment Cycle
Investment Opportunities
Investment opportunities at 12-months totaled 2.3 billion euros at the end of March 2016, with new projects in the portfolio partially offsetting those signed by the Group, awarded to the competition or delayed. The global portfolio, constituted of projects which may be signed before or after 12 months, remains solid, amounting between 4.5 to 5 billion euros.
A little over half of the investment opportunities at 12-months are located in developing economies. The weighting of North America and China are comparable and each has approximately 30% of the total opportunities.
The majority of projects in the investment opportunities at 12-months involve investments of less than 50 million euros.
Investment Decisions and Investment Backlog
Industrial and financial investment decisions during the quarter totaled 590 million euros. Industrial decisions accounted for over 90% of this amount. They relate mainly to projects in Large Industries in China in the chemicals sector and in the Electronics business.
The investment backlog totaled 2.2 billion euros, representing a future contribution to yearly sales of approximately 0.9 billion euros, once fully ramped-up.
Start-ups
Four new units started up during the first quarter of 2016, two Air Separation Units in South America and two units in China and Japan for Electronics. The contribution to quarterly sales of ramp-ups and start-ups was very high at 105 million euros and in line with our expectations.
Operating Performance
The Group’s efficiency gains in the first quarter amounted to 63 million euros. This performance was based on continued efforts and integrated many projects throughout the Group, principally this quarter, in industrial operations (production, logistics) and in purchasing. The diverse reorganization of our activities contribute to approximately more than 10% of the efficiencies with a lesser contribution from the alignment plans initiated at the end of 2013.
For the first three months of the year, cash flow from operating activities before changes in working capital was 18.0% of sales, covering net capital expenditures of 501 million euros for this quarter, of which 450 million euros of industrial capital expenditures.

Air Liquide – First Quarter 2016 Revenue
Page 8/11
Outlook In the first quarter, growth was driven by dynamic sales in Electronics and the ramp-up of production units in Large Industries. From a geographic perspective, growth was driven by Asia-Pacific, especially China. This quarter was also characterized by lower exchange rates and energy prices.
In Western Europe, industrial demand was moderate early in the year, while in North America sales continued to be affected by the slowdown in the oil & gas and metal fabrication sectors. Conversely, developing economies posted strong growth.
In addition, the Group continues to generate recurring efficiency gains, strengthen its competitiveness, and invest in its growth markets.
The Airgas acquisition is on track and in line with expectations, with the preparatory work for integration allowing to confirm synergies of more than $ 300 million, as announced last November. In addition, the transaction refinancing allows today to envision a capital increase of between 3 and 3.5 billion euros. Lastly, acquisition timing might shorten, with possible completion by late Q2 2016.
Excluding the impact of Airgas acquisition and financing, and assuming a comparable environment, Air Liquide is confident in its ability to deliver another year of net profit growth in 2016.
Air Liquide – First Quarter 2016 Revenue
Page 9/11
1. Currency, energy (natural gas, electricity) and significant M&A
impacts
In addition to the comparison of published figures, financial information for first quarter 2016 is provided before currency, energy price fluctuations and significant M&A impacts. As of January 1
st, 2015, the
energy impact includes impacts of natural gas and electricity. In the future, it may also include other energy Large Industries feedstocks.
Since gases for industry and health are rarely exported, the impact of currency fluctuations on activity levels and results is limited to euro translation impacts with respect to the financial statements of subsidiaries located outside the Euro zone. Fluctuations in natural gas and electricity prices are transferred to customers through price indexation clauses.
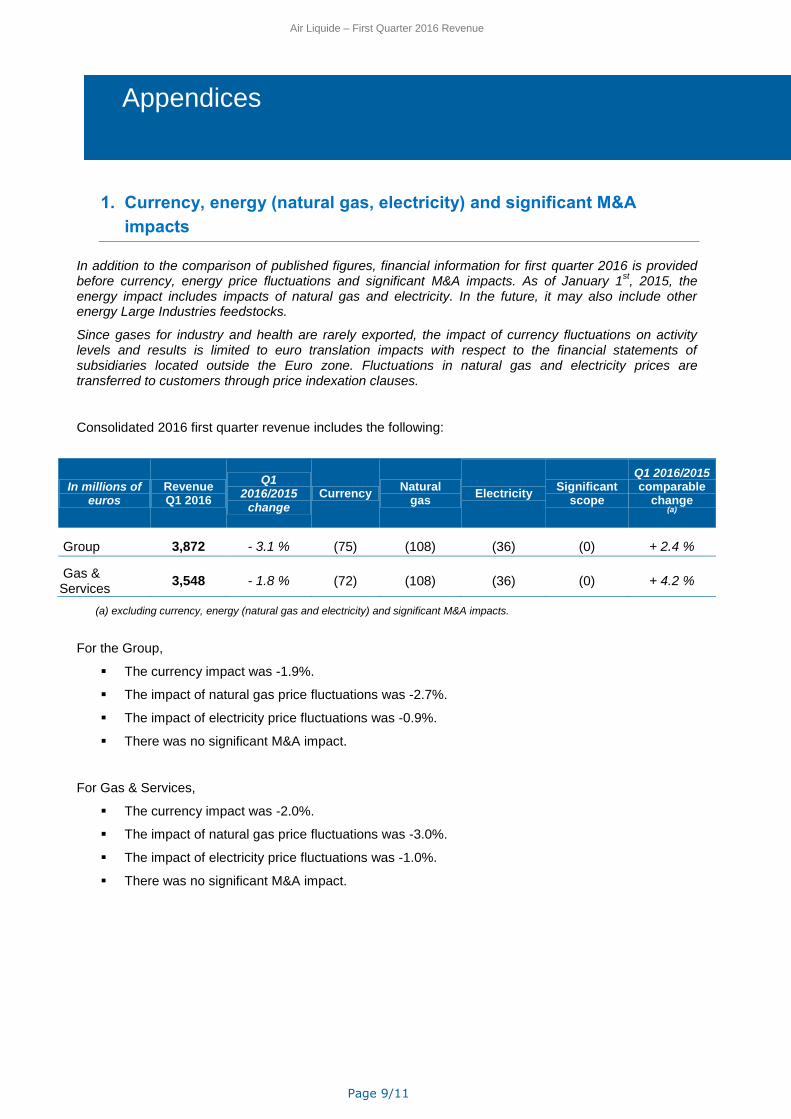
Consolidated 2016 first quarter revenue includes the following:
In millions of euros
Revenue Q1 2016
Q1 2016/2015
change
Currency Natural
gas Electricity
Significant scope
Q1 2016/2015 comparable
change (a)
Group 3,872 - 3.1 % (75) (108) (36) (0) + 2.4 %
Gas & Services
3,548 - 1.8 % (72) (108) (36) (0) + 4.2 %
(a) excluding currency, energy (natural gas and electricity) and significant M&A impacts.
For the Group,
The currency impact was -1.9%.
The impact of natural gas price fluctuations was -2.7%.
The impact of electricity price fluctuations was -0.9%.
There was no significant M&A impact.
For Gas & Services,
The currency impact was -2.0%.
The impact of natural gas price fluctuations was -3.0%.
The impact of electricity price fluctuations was -1.0%.
There was no significant M&A impact.
Appendices
Air Liquide – First Quarter 2016 Revenue
Page 10/11
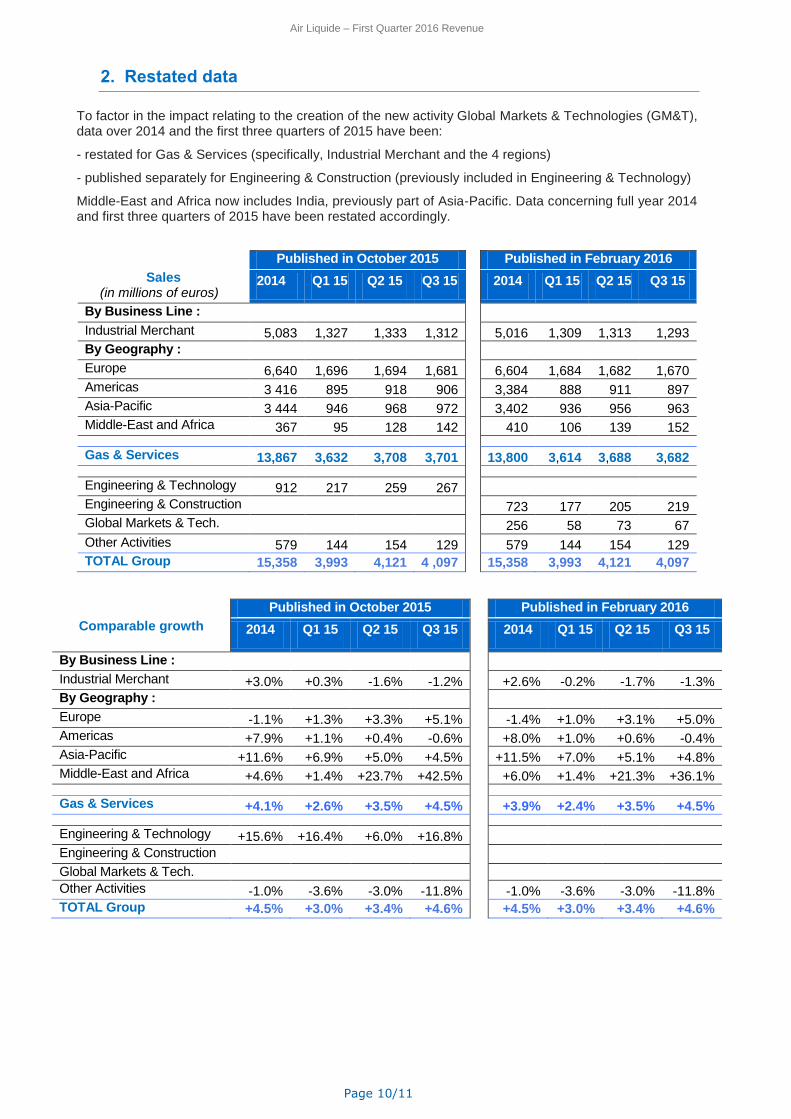
2. Restated data
To factor in the impact relating to the creation of the new activity Global Markets & Technologies (GM&T), data over 2014 and the first three quarters of 2015 have been:
- restated for Gas & Services (specifically, Industrial Merchant and the 4 regions)
- published separately for Engineering & Construction (previously included in Engineering & Technology)
Middle-East and Africa now includes India, previously part of Asia-Pacific. Data concerning full year 2014 and first three quarters of 2015 have been restated accordingly.
Published in October 2015 Published in February 2016
Sales (in millions of euros)
2014 Q1 15 Q2 15 Q3 15 2014 Q1 15 Q2 15 Q3 15
By Business Line :
Industrial Merchant 5,083 1,327 1,333 1,312 5,016 1,309 1,313 1,293
By Geography :
Europe 6,640 1,696 1,694 1,681 6,604 1,684 1,682 1,670
Americas 3 416 895 918 906 3,384 888 911 897
Asia-Pacific 3 444 946 968 972 3,402 936 956 963
Middle-East and Africa 367 95 128 142 410 106 139 152
Gas & Services 13,867 3,632 3,708 3,701 13,800 3,614 3,688 3,682
Engineering & Technology 912 217 259 267
Engineering & Construction 723 177 205 219
Global Markets & Tech. 256 58 73 67
Other Activities 579 144 154 129 579 144 154 129
TOTAL Group 15,358 3,993 4,121 4 ,097 15,358 3,993 4,121 4,097
Published in October 2015 Published in February 2016
Comparable growth
2014 Q1 15 Q2 15 Q3 15 2014 Q1 15 Q2 15 Q3 15
By Business Line :
Industrial Merchant +3.0% +0.3% -1.6% -1.2% +2.6% -0.2% -1.7% -1.3%
By Geography :
Europe -1.1% +1.3% +3.3% +5.1% -1.4% +1.0% +3.1% +5.0%
Americas +7.9% +1.1% +0.4% -0.6% +8.0% +1.0% +0.6% -0.4%
Asia-Pacific +11.6% +6.9% +5.0% +4.5% +11.5% +7.0% +5.1% +4.8%
Middle-East and Africa +4.6% +1.4% +23.7% +42.5% +6.0% +1.4% +21.3% +36.1%
Gas & Services +4.1% +2.6% +3.5% +4.5% +3.9% +2.4% +3.5% +4.5%
Engineering & Technology +15.6% +16.4% +6.0% +16.8%
Engineering & Construction
Global Markets & Tech. Other Activities -1.0% -3.6% -3.0% -11.8% -1.0% -3.6% -3.0% -11.8%
TOTAL Group +4.5% +3.0% +3.4% +4.6% +4.5% +3.0% +3.4% +4.6%
Air Liquide – First Quarter 2016 Revenue
Page 11/11
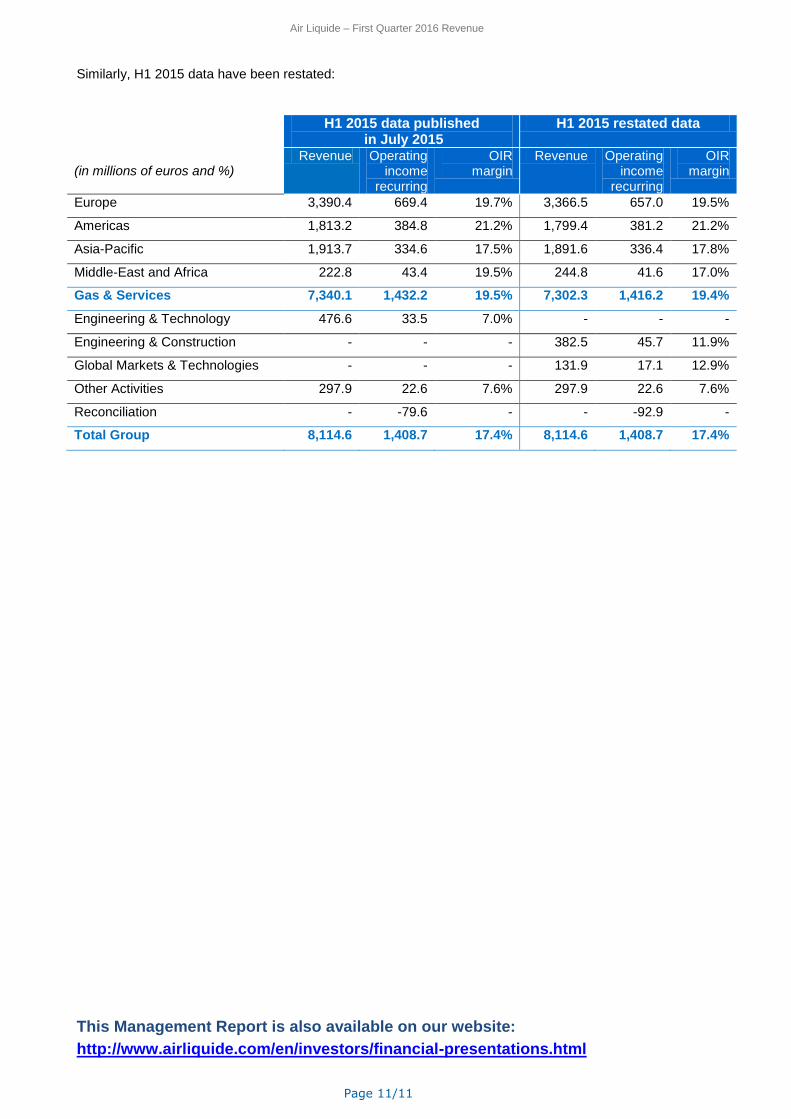
Similarly, H1 2015 data have been restated:
H1 2015 data published
in July 2015 H1 2015 restated data
(in millions of euros and %)
Revenue Operating income
recurring
OIR margin
Revenue Operating income
recurring
OIR margin
Europe 3,390.4 669.4 19.7% 3,366.5 657.0 19.5%
Americas 1,813.2 384.8 21.2% 1,799.4 381.2 21.2%
Asia-Pacific 1,913.7 334.6 17.5% 1,891.6 336.4 17.8%
Middle-East and Africa 222.8 43.4 19.5% 244.8 41.6 17.0%
Gas & Services 7,340.1 1,432.2 19.5% 7,302.3 1,416.2 19.4%
Engineering & Technology 476.6 33.5 7.0% - - -
Engineering & Construction - - - 382.5 45.7 11.9%
Global Markets & Technologies - - - 131.9 17.1 12.9%
Other Activities 297.9 22.6 7.6% 297.9 22.6 7.6%
Reconciliation - -79.6 - - -92.9 -
Total Group 8,114.6 1,408.7 17.4% 8,114.6 1,408.7 17.4%
This Management Report is also available on our website:
http://www.airliquide.com/en/investors/financial-presentations.html