Embed Size (px)
Citation preview

2011 First quarter activity
Paris, April 26, 2011Paris, April 26, 2011
Pierre Dufour, Senior Executive Vice-President
Jean-Pierre Duprieu, Senior Vice-President
Fabienne Lecorvaisier, Chief Financial Officer

2Air Liquide, the world leader in gases for industry, health and the environment Q1 2011 Revenue – April 26, 2011
2011 First Quarter activity
Strong growth
High activity level in all regions
Very limited impact from recent events in Japan andAfrica & Middle-East
Activity and Performance in line with ALMA 2015objectives
High level of investment decisions

3Air Liquide, the world leader in gases for industry, health and the environment Q1 2011 Revenue – April 26, 2011
* Comparable: excluding forex and natural gas
Strong growth
+ 8.8 %+ 12.4 %3,543Group Total
+ 7.8 %+ 8.5 %224Other Activities
- 29.2 %- 27.9 %134Engineering& Construction
+ 11.4 %+ 15.4 %3,185Gas & Services
comparable*as publishedQ1 11
Q1 11/10Q1 11/10SalesIn €m

4Air Liquide, the world leader in gases for industry, health and the environment Q1 2011 Revenue – April 26, 2011
Continued quarterly improvement
+ 11.4%+ 11.3%
- 4.2%
+ 7.9%
- 5.2%- 5.1%
+ 10.7%
+ 8.3%
- 4.6%
+ 11.0%
-6%
-4%
-2%
0%
2%
4%
6%
8%
10%
12%
Q4 2008 Q1 2009 Q2 2009 Q3 2009 Q4 2009 Q1 2010 Q2 2010 Q3 2010 Q4 2010 Q1 2011
Gas & Services comparable Growth*
* Comparable: excluding forex and natural gas
2009 2010 20112008

5Air Liquide, the world leader in gases for industry, health and the environment Q1 2011 Revenue – April 26, 2011
70
80
90
100
110
120
130
Q1
08
Q2
08
Q3
08
Q4
08
Q1
09
Q2
09
Q3
09
Q4
09
Q1
10
Q2
10
Q3
10
Q4
10
Q1
11
70
80
90
100
110
120
130
Q1
08
Q2
08
Q3
08
Q4
08
Q1
09
Q2
09
Q3
09
Q4
09
Q1
10
Q2
10
Q3
10
Q4
10
Q1
11
50
60
70
80
90
100
110
120
130
140
Q108
Q208
Q308
Q408
Q109
Q209
Q309
Q409
Q110
Q210
Q310
Q410
Q111
All volumes above pre-crisis referenceBase 100, average 2008
Oxygen
Hydrogen
O2 Cylinders
ESGs
O2 + N2 Bulk
Electronic specialty gases volumes
Cylinder and Bulk volumesLarge Industries Gas volumes

6Air Liquide, the world leader in gases for industry, health and the environment Q1 2011 Revenue – April 26, 2011
High level of activity
Quarterly G&S activity index
* Comparable revenue, adjusted for the number of days per month
base 100, average 2008*
85
90
95
100
105
110
115
Q1 09 Q2 09 Q3 09 Q4 09 Q1 10 Q2 10 Q3 10 Q4 10 Q1 11
Average 2008
2009 2010 2011

7Air Liquide, the world leader in gases for industry, health and the environment Q1 2011 Revenue – April 26, 2011
+ 20 %
+ 8 % + 30 %
G&S comparable* revenue growth(Q1 2011 / 2010)
Advanced Economies Developing Economies
+ 10 % + 7 %
+ 14 %
+ 43 %
+ 10 %
* Excluding forex and natural gas
Differentiated growth rates
+ 6 %

8Air Liquide, the world leader in gases for industry, health and the environment Q1 2011 Revenue – April 26, 2011
Japan G&S revenue
Focus: Japan
Production sites
Affected regions
Epicenter
Annual sales
€ 289m
+6%*in Q1 2011
* Comparable growth, excluding forex and natural gas
Fukushima
North EastTohoku
Nagoya
Kanto
Kobe Osaka
Tokyo
9Air Liquide, the world leader in gases for industry, health and the environment Q1 2011 Revenue – April 26, 2011 9
Southern Africa
Morocco
TunisiaEgypt
United Arab
Emirates
Saudi Arabia
G&S annual sales Unconsolidated sales
Focus: Africa & Middle-East
Q1 2011 Africa-ME G&S sales
Affected regions
€ 70m+10%*in Q1 2011
Syria
Ivory Coast
* Comparable growth, excluding forex and natural gas

10Air Liquide, the world leader in gases for industry, health and the environment Q1 2011 Revenue – April 26, 2011
0% 5% 10% 15% 20% 25%
Solid progression in all regions
Sales Q1 2011G&S
Q1 2011/2010
G&S Total
ME & Africa
Asia Pacific
Americas
Europe
52%
22%
24%2%
2 %
52 %22 %
24 %
€ 1,647 m
€ 709 m
€ 759 m
€ 70 m
€ 3,185 m
Comparable growth*
Q1 2011
Louisiana site takeover effect, strong H2 volumes
IM and Healthcare: Latin America dynamic
Electronics start-up in the US and E&I sales
Start-ups in Italy and France
IM underlying trend slightly positive and price stabilization
2 Homecare acquisitions and Hygiene back to regular growth
Ramp-ups of new capacities in China and Singapore
Electronics volume growth and strong E&I sales
Limited impact of events in Japan
+7 %
+10 %
+24 %
+10%
+11 %
* Excluding forex and natural gas
Limited impact of events in North Africa and Middle-East
Start-up in South Africa
IM : Industrial Merchant – E&I : Equipment and Installation

11Air Liquide, the world leader in gases for industry, health and the environment Q1 2011 Revenue – April 26, 2011
Quarterly comparable growth, excluding impact of currency and natural gas, relative to the same period in preceding year.
Large Industries
Electronics
Industrial Merchant
Healthcare
Q1 2011
+28%+26%
+21%
+30%+25%
-21%-19%-22%
-27%-30%
-20%
-10%
0%
10%
20%
30%
Q12009
Q22009
Q32009
Q42009
Q12010
Q22010
Q32010
Q42010
Q12011
-8%-9%
+2%
+8%
+5% +5% +4%
-11%
-7%
-12%
-7%
-2%
3%
8%
Q12009
Q22009
Q32009
Q42009
Q12010
Q22010
Q32010
Q42010
Q12011
+2%+1%
-3% -4%
+13%
+21% +22%
+17%
+14%
-5%
0%
5%
10%
15%
20%
Q1
2009
Q2
2009
Q3
2009
Q4
2009
Q1
2010
Q2
2010
Q3
2010
Q4
2010
Q1
2011
+5%+6%
+9%+9%
+6%+5%
+3%
+1%
+8%
0%
2%
4%
6%
8%
10%
12%
Q12009
Q22009
Q32009
Q42009
Q12010
Q22010
Q32010
Q42010
Q12011
16%11%
36%37%
Gas & Services Growth: + 11.4%

12Air Liquide, the world leader in gases for industry, health and the environment Q1 2011 Revenue – April 26, 2011
Third-party sales
247 258282
208185 203 186 177
134
0
50
100
150
200
250
300
350
400
450
Q1 2009 Q2 2009 Q3 2009 Q4 2009 Q1 2010 Q2 2010 Q3 2010 Q4 2010 Q1 2011
In M€
Engineering & Construction recovery expected in 2011
Internal salesOrder intake
(4-quarter moving average)
Order intake and Activity
18 months time lag~

13Air Liquide, the world leader in gases for industry, health and the environment Q1 2011 Revenue – April 26, 2011
+3%+7%
-29%
-34%-35%
-27%
-8%
-2%
+6%
+10%
+12%
+10%
-6%
-40%
-30%
-20%
-10%
0%
10%
20%
Q1
08
Q2
08
Q3
08
Q4
08
Q1
09
Q2
09
Q3
09
Q4
09
Q1
10
Q2
10
Q3
10
Q4
10
Q1
11
Other Activities contribution
Specialty Chemicals andDiving growth
Welding-Cuttingmoderate recovery
Q1 2011 sales: + 12%* Q1 2011 sales: + 4%*
-1%
+3%
-7% -8%
+1%
-1%
+15%+19%
+8%+11%
+4%+4%
+9%
-40%
-30%
-20%
-10%
0%
10%
20%
Q1
08
Q2
08
Q3
08
Q4
08
Q1
09
Q2
09
Q3
09
Q4
09
Q1
10
Q2
10
Q3
10
Q4
10
Q1
11
* Quarterly comparable growth, excluding impact of currency and natural gas, relative to the same period in preceding year.

2011 First Quarter Activity
Activity and Performance
in line with ALMA 2015 objectives
Pierre Dufour, Senior Executive Vice-President

15Air Liquide, the world leader in gases for industry, health and the environment Q1 2011 Revenue – April 26, 2011
+8 to +10%
Sales Growth
in a normal environment
Efficiencies
per year, on average
> € 200 M
ROCE
12 - 13%
range in the period
Responsibilityobjectives
Engagement in
2015 objectives

16Air Liquide, the world leader in gases for industry, health and the environment Q1 2011 Revenue – April 26, 2011
2.93.03.0
0.80.90.7
Dec-09 Dec-10 Mar-11
On-going investment momentum
In €bn
Developing Economies Advanced Economies
12-month Portfolio ofopportunities
* Industrial and financial investments, including minorities ** Industrial projects > €10m
3.7 3.73.9
Net Capex*
Q1 09 Q1 10 Q1 11
444
In €M
380400
Start-ups**
9
18
6
6
2009 2010 2011e 2012e
24
15
43
3 start-ups in Q1 2011
Units
17Air Liquide, the world leader in gases for industry, health and the environment Q1 2011 Revenue – April 26, 2011
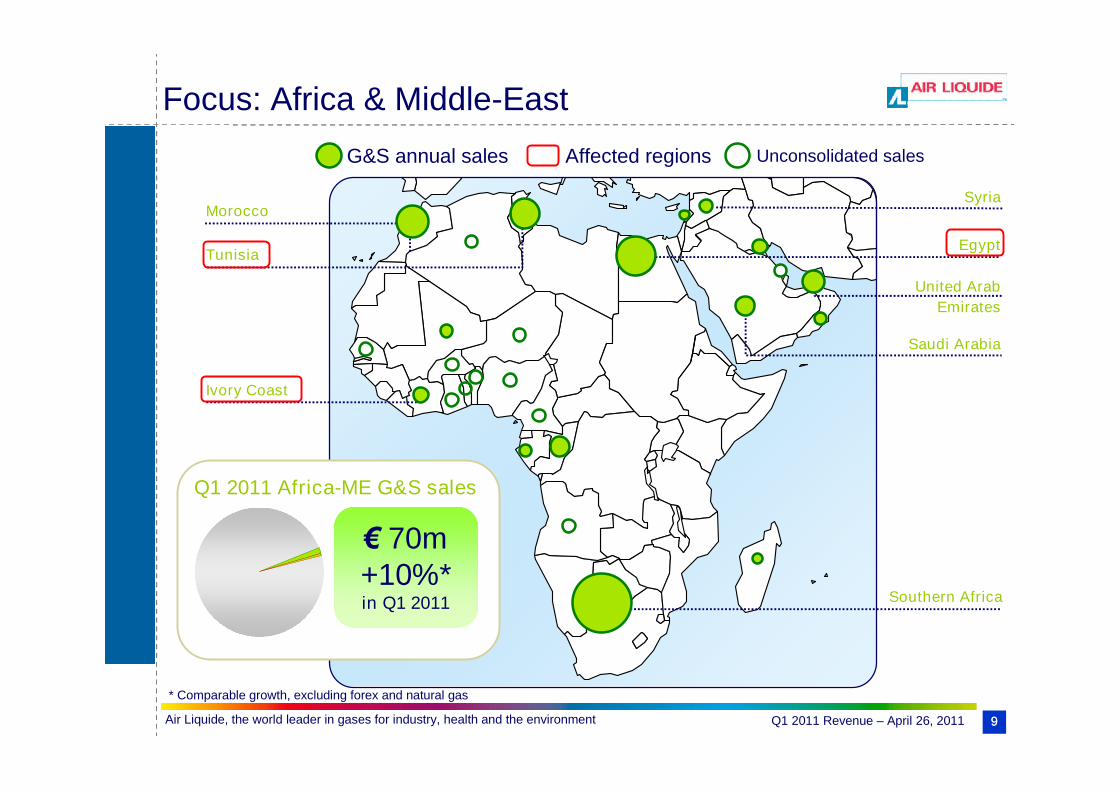
High level of investment decisions
Mexico and RussiaSteel
Saudi ArabiaOil & Gas and Liquid capacity
ChinaGasification
ElectronicsSemi-conductors and photovoltaic
HomecareFrance and GermanyQ1 09 Q1 10 Q1 11
494
In €m
Investment Decisions*
168
350
Large Industries ElectronicsIndustrial Merchant Healthcare Engineering &Construction
Major Q1 2011 Decisions
* Industrial and financial investment decisions, including transactions with minorities

18Air Liquide, the world leader in gases for industry, health and the environment Q1 2011 Revenue – April 26, 2011
Access to new markets
4%
8%
11%
19%20%
0%
5%
10%
15%
20%
1990 2000 2008 2010 Q1 2011
Recent market entries* G&S sales in Developing Economies
Mexico Turkey
Central America
Saudi Arabia
* since 2008
Q1 2011 Air Liquide
Growth**: +30%
** G&S, Q1 2011/2010 comparable growth, in developing economies
Russia
New market size: € 2.5 bn

19Air Liquide, the world leader in gases for industry, health and the environment Q1 2011 Revenue – April 26, 2011
Energy-Environment markets
Sources: IEA Key world energy statistics 2010* Electronic Specialty Gases
World energy production by origin2030 estimates
Oil
Coal
Gas
O2
H2
ESG*
CO2H2
H2
N2
N2
N2
Renewable Nuclear
O2

20Air Liquide, the world leader in gases for industry, health and the environment Q1 2011 Revenue – April 26, 2011
Steady Performance and Solid balance sheet
Net capex (2)
In €bn
Gas & Services sales
In €bn
0
1
2
3
Q1 09 Q1 10 Q1 11
2.52.8
3.2
Net debt
In €bn
+11% (1)
(1) Comparable, excluding forex and natural gas(2) Industrial and financial investments, including transactions with minorities, net of divestitures
280
335
0
100
200
300
2009 2010 2011
In €m
Efficiencies
2011 Objective:> € 200 M
AL
MA
AL
MA
AL
MA
20
15
3
4
5
end 2009 end 2010 end Q1 11
4.9 5.0
0
0,5
1
1,5
2
2009 2010 2011
1.4
Q1 Q1 Q1
1.7
2.05.1
1.5
0.5
60

21Air Liquide, the world leader in gases for industry, health and the environment Q1 2011 Revenue – April 26, 2011
2011 outlook
Strong activity
Performance in line with ALMA 2015 objectives
Q1 2011
Continued steady growth of net profit
in 2011
2011 outlook maintained

Appendices
23Air Liquide, the world leader in gases for industry, health and the environment Q1 2011 Revenue – April 26, 2011
1 000
1 500
2 000
2 500
3 000
3 500
Q1 2010 Comparable
growth*
Natural Gas Change Q1 2011
In €m
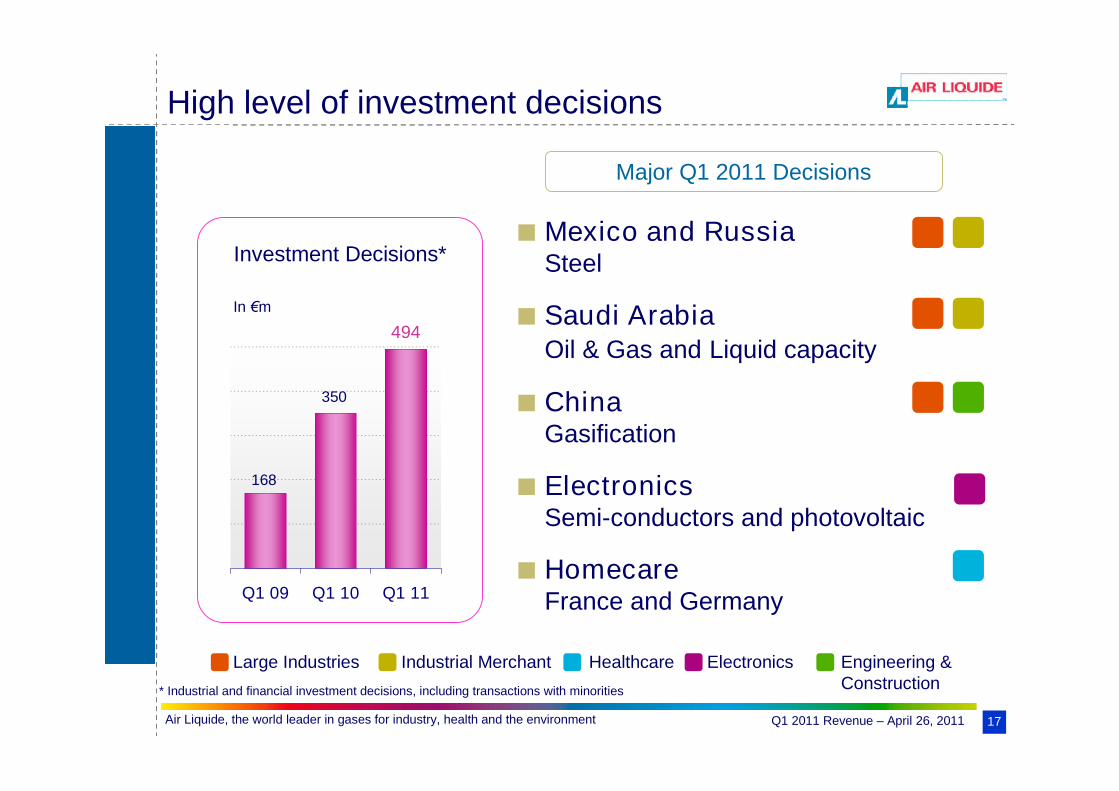
+ 13
0
+ 15.4 %published growth
2,760
3163,185
G&S Q1 2011 revenue growth
+ 11.4 %comparable*
+ 96
* Excluding forex and natural gas

24Air Liquide, the world leader in gases for industry, health and the environment Q1 2011 Revenue – April 26, 2011
-2% 3% 8% 13% 18%
Europe in Q1: IM Recovery still moderate
Industrial Merchant Slightly positive trend excluding
internal reorganization
Developing economies momentum
Average prices stabilized
Large Industries Steady demand level
Site takeover in Germany
Start-ups in Italy and France
Healthcare Homecare activity + 7%
Hygiene back to new regulargrowth
2 Homecare acquisitions
+ 10.0%
Publishedgrowth
+ 7.3%
Comparablegrowth*
1,647
Q12011
Revenue
In €m
Industrial Merchant
Large Industries
Healthcare
Q1 Gas & Services sales:
1,647 €m
Q1 11/10 Comparable change: + 7.3 %*
- 0.8%
+ 12.2%
+ 6.6 %
4%
33%
39%
24%
* Excluding forex and natural gas

25Air Liquide, the world leader in gases for industry, health and the environment Q1 2011 Revenue – April 26, 2011
Americas in Q1: momentum in all activities
0% 5% 10% 15%
+ 7.6 %
+ 10.9 %
+ 9.3 %
Industrial Merchant
Large Industries
Healthcare
+ 10.2%
Publishedgrowth
+ 10.5%
Comparablegrowth*
709
Q12011
Revenue
In €m
Industrial Merchant Positive pricing effect
Strong growth in Latin Americaand Canada
Cylinder activity recovery
Large Industries Start-ups and ramp-ups
Solid H2 volumes
Louisiana site takeover (steamand utilities)
Healthcare Strong growth in Latin America
Steady growth in the US
Q1 Gas & Services sales:
709 €m
Q1 11/10 Comparable change: + 10.5 %*
8%
46%36%
10%
* Excluding forex and natural gas

26Air Liquide, the world leader in gases for industry, health and the environment Q1 2011 Revenue – April 26, 2011
0% 10% 20% 30% 40% 50%
Asia in Q1: strong growth
Industrial Merchant
Large Industries
Electronics
+ 10.5 %
+ 47.1 %
+ 21.3 %
Industrial Merchant Industrial development throughout
the region
New liquid capacities in China
Limited impact of events in Japan
Large Industries Ramp-up of numerous units in
China
Site takeover in South Korea
Electronics Start-ups of new ESG and carrier
gases contracts
Strong Equipment and Installationsales in China and Japan
Q1 Gas & Services sales:
759 €m
Q1 11/10 Comparable change: : + 23.6 %*
+ 35.9 %
Publishedgrowth
+ 23.6 %
Comparablegrowth*
759
Q12011
Revenue
In €m
28%37%
31%4%
* Excluding forex and natural gas

27Air Liquide, the world leader in gases for industry, health and the environment Q1 2011 Revenue – April 26, 2011
+ 12
(26)
+ 14
(7)
+ 31
Q1 10
+ 192
+ 44
+ 20
+ 49
+ 79
Q3 10
+ 157
+ 30
+ 25
+ 31
+ 71
Q2 10
+ 7
+ 9
+ 31
+ 49
+ 35
+ 16
+ 44
+ 75
€/USD
€/CAD
€/JP¥
Others
+ 170
Q4 10
+ 96
Q1 11
Total Currency Impact
In €m
(10) +13+21+61+38Natural Gas Impact
Average exchange rates
1.38
1.44
125.5
Q1 10
1.27
1.31
117.1
Q2 10
1.29
1.34
110.7
Q3 10
1.36
1.38
112.1
Q4 10
1.37
1.35
112.6
Q1 11
€/USD
€/CAD
€/JP¥
Currency
Natural GasIn €m
Currency and natural gas impact on G&S revenue

28Air Liquide, the world leader in gases for industry, health and the environment Q1 2011 Revenue – April 26, 2011
3,152
207
185
2,760
62
558
643
1,497
Q1 10
3,363
226
203
2,934
71
655
703
1,505
Q2 10
3,429
200
186
3,043
83
697
708
1,555
Q3 10
3,543
218
177
3,148
77
733
694
1,644
Q4 10
+ 7.8 %+ 8.5 %224Other Activities
+ 10.5 %+ 10.2 %709Americas
+ 7.3 %+ 10.0 %1,647Europe
+ 23.6 %+ 35.9%759Asia-Pacific
+ 10.4 %+13.5%70Middle-East& Africa
+ 11.4 %+ 15.4 %3,185Gas & Services
- 29.2 %- 27.9 %134Engineering& Construction
3,543
Q1 11
+ 8.8 %
Q1 11/10comparable*
+ 12.4 %
Q1 11/10as published
Group Total
Sales in €m
Revenue analysis by quarter (1)
* Excluding forex and natural gas

29Air Liquide, the world leader in gases for industry, health and the environment Q1 2011 Revenue – April 26, 2011
3,152
207
185
2,760
466
252
936
1,106
Q1 10
3,363
226
203
2,934
484
293
950
1,208
Q2 10
3,429
200
186
3,043
481
309
1,036
1,217
Q3 10
3,543
218
177
3,148
505
324
1,097
1,222
Q4 10
+ 7.8 %+ 8.5 %224Other Activities
+ 4.2 %+ 8.4 %1,200Industrial Merchant
+ 17.4 %+ 21.1 %1,133Large Industries
+ 27.6 %+ 36.1 %343Electronics
+ 7.8 %+ 9.2 %509Healthcare
+ 11.4 %+ 15.4 %3,185Gas & Services
- 29.2 %- 27.9 %134Engineering& Construction
3,543
Q1 11
+ 8.8 %
Q1 11/10comparable*
+ 12.4 %
Q1 11/10as published
Group Total
Sales in €m
Revenue analysis by quarter (2)
* Excluding forex and natural gas

30Air Liquide, the world leader in gases for industry, health and the environment Q1 2011 Revenue – April 26, 2011
+ 11.4 %+ 3.5 %+ 0.5 %+ 15.4 %Q1 2011
+ 11.0 %+ 7.6 %+ 2.4 %+ 21.0 %Q3 2010
Comparable*Growth
ChangeNatural GasPublished
Growth
- 4.6 %- 1.8 %- 2.8 %- 9.2 %Q4 2009
+ 8.3 %+ 0.4 %- 0.4 %+ 8.3 %Q1 2010
+ 10.7 %+ 6.3 %+ 1.6 %+ 18.6 %Q2 2010
+ 0.8 % + 6.4 % + 11.3 %+ 18.5 %Q4 2010
G&S Revenue analysis by quarter (3)
* Excluding forex and natural gas

For further information, please contact:
Investor Relations
Virginia Jeanson + 33 (0)1 40 62 57 37
Annie Fournier + 33 (0)1 40 62 57 18
Bastien Maurice + 33 (0)1 40 62 59 38
www.airliquide.com
L’Air Liquide S.A.
Corporation for the study and application of processes developed by
Georges CLAUDE with registered capital of 1 562 878 850.50 euros
Corporate headquarters:
75, Quai d’Orsay
75321 Paris Cedex 07
Tel : +33 (0)1 40 62 55 55
RCS Paris 552 096 281
Communications
Anne Lechevranton + 33 (0)1 40 62 50 93
Corinne Estrade-Bordry + 33 (0)1 40 62 51 31