Embed Size (px)
Citation preview
First Quarter 2015
Earnings Presentation
May 1, 2015
2 CBOE HOLDINGS
Agenda
Strategic Review Edward Tilly Chief Executive Officer
Financial Review Alan Dean Executive Vice President,
CFO and Treasurer
Questions and Answers Edward Tilly
Alan Dean
Edward Provost President and Chief Operating Officer
3 CBOE HOLDINGS
Forward-Looking Statements
This press release may contain forward-looking statements, within the meaning of the Private
Securities Litigation Reform Act of 1995. Forward-looking statements are those statements that reflect
our expectations, assumptions or projections about the future and involve a number of risks and
uncertainties. These statements are only predictions based on our current expectations and
projections about future events. There are important factors that could cause actual results to differ
materially from that expressed or implied by the forward-looking statements, including: the loss of our
right to exclusively list certain index options and futures products; increasing price competition in our
industry; compliance with legal and regulatory obligations and obligations under agreements with
regulatory agencies; decreases in the amount of trading volumes or a shift in the mix of products
traded on our exchanges; our ability to operate our business, monitor and maintain our systems or
program them so that they operate correctly, including in response to increases in trading volume and
order transaction traffic; the accuracy of our estimates and expectations; legislative or regulatory
changes; increasing competition by foreign and domestic entities; our index providers ability to
perform under our agreements; our ability to operate our business without violating the intellectual
property rights of others and the costs associated with protecting our intellectual property rights; our
ability to maintain access fee revenues; our ability to protect our systems and communication
networks from security risks, including cyber-attacks; economic, political and market conditions; our
ability to attract and retain skilled management and other personnel; our ability to maintain our growth
effectively; our dependence on third party service providers; and the ability of our compliance and risk
management methods to effectively monitor and manage our risks.
More detailed information about factors that may affect our performance may be found in our filings
with the SEC, including in our Annual Report on Form 10-K for the year ended December 31, 2014
and other filings made from time to time with the SEC.

Strategic Review
Edward Tilly
CEO
5 CBOE HOLDINGS
Despite challenging volume conditions, made significant
progress on key initiatives
Secured rights to trade numerous Russell and FTSE Index
products
Began exclusive trading in Russell 2000 Index options at
CBOE and C2 on April 1
Launched options on two well-known MSCI benchmarks on
April 21
Extended trading hours for SPX and VIX® options in March
Expanding Our Suite of Premium Products and Global Reach
6 CBOE HOLDINGS
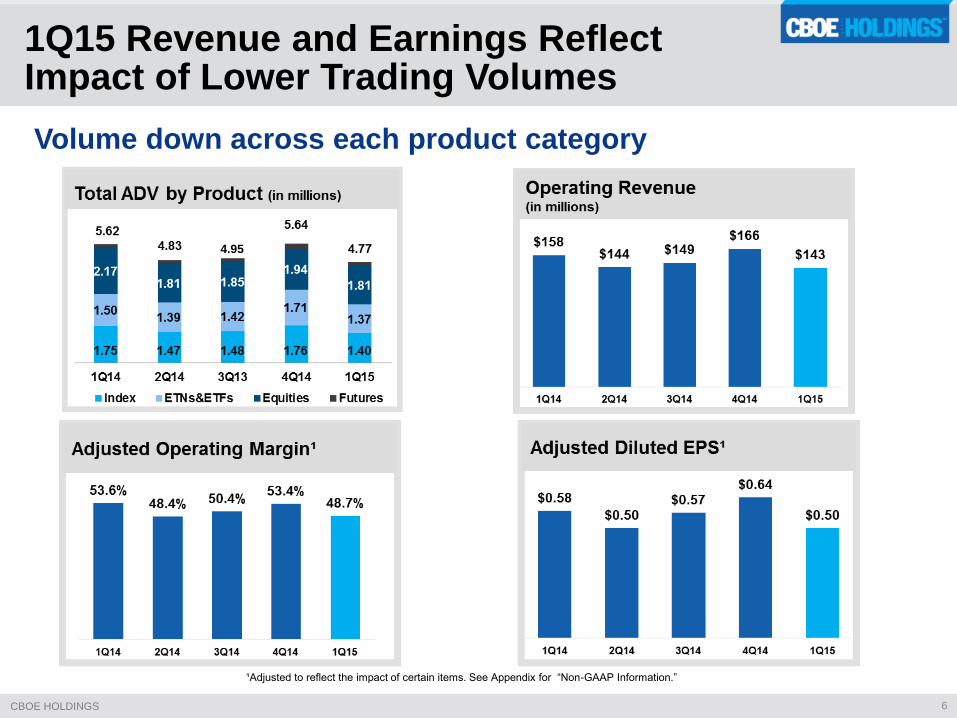
Volume down across each product category
1Q15 Revenue and Earnings Reflect Impact of Lower Trading Volumes
4.95
¹Adjusted to reflect the impact of certain items. See Appendix for “Non-GAAP Information.”
7 CBOE HOLDINGS
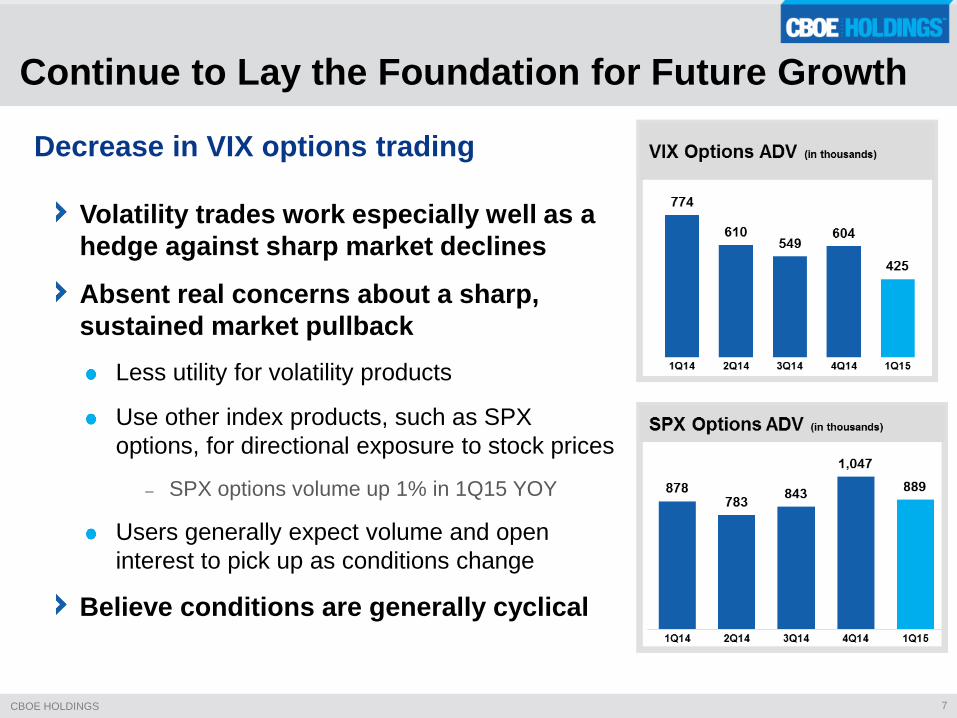
Volatility trades work especially well as a
hedge against sharp market declines
Absent real concerns about a sharp,
sustained market pullback
Less utility for volatility products
Use other index products, such as SPX
options, for directional exposure to stock prices
– SPX options volume up 1% in 1Q15 YOY
Users generally expect volume and open
interest to pick up as conditions change
Believe conditions are generally cyclical
Continue to Lay the Foundation for Future Growth
Decrease in VIX options trading
8 CBOE HOLDINGS
Advancing CBOE’s Index Growth Story
Collaborate Create Connect
9 CBOE HOLDINGS
Collaborate
Growing roster of CBOE indexes
10 CBOE HOLDINGS
Forging collaborative partnerships to expand index complex
December 2014 licensing agreement with MSCI
CBOE exclusive U.S. exchange for trading MSCI Index options
First CBOE MSCI options launched April 21:
MSCI EAFE Index (Europe, Australasia, Far East)
MSCI Emerging Markets Index
Adds global dimension to CBOE’s index options franchise
MSCI volatility products a future possibility
Collaborate With New Index Providers
11 CBOE HOLDINGS
CBOE entered into an exclusive licensing agreement with London Stock Exchange Group
CBOE is the exclusive provider for cash-settled listed options to
trade in the U.S. on more than 24 FTSE and Russell Indexes
On April 1, became sole provider of listed Russell 2000 (RUT)
options
Trades exclusively on CBOE and C2
Plan to launch FTSE 100 index options and other Russell and
FTSE products later this year
Expands our product line across new asset classes and markets
Creates new trading opportunities for customers
Collaborate With New Index Providers
12 CBOE HOLDINGS
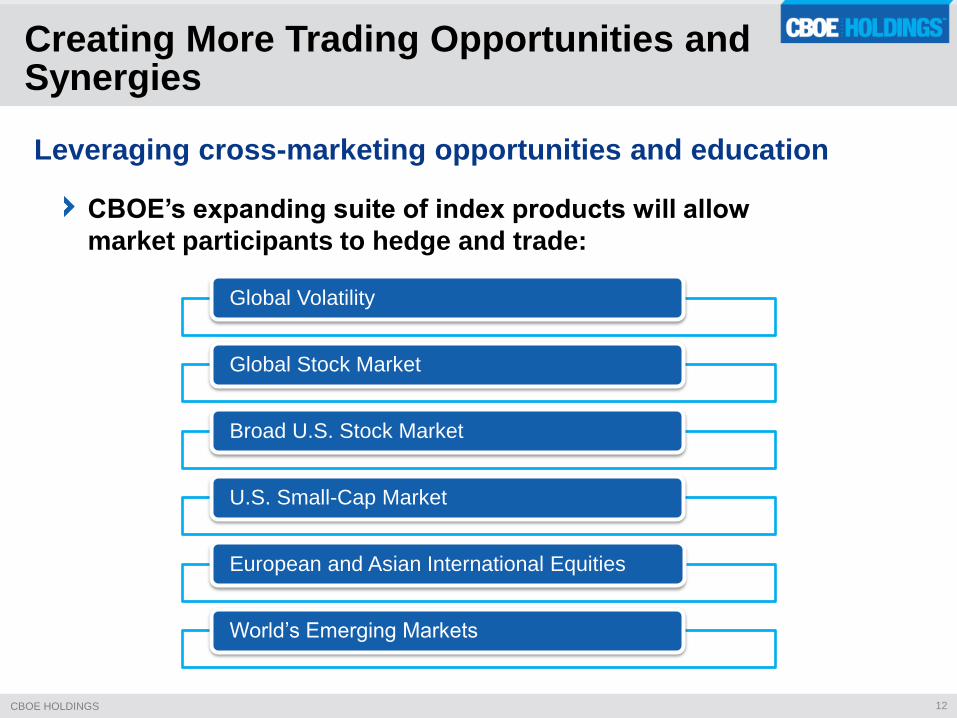
Leveraging cross-marketing opportunities and education
Global Volatility
Global Stock Market
Broad U.S. Stock Market
U.S. Small-Cap Market
European and Asian International Equities
World’s Emerging Markets
CBOE’s expanding suite of index products will allow
market participants to hedge and trade:
Creating More Trading Opportunities and Synergies
13 CBOE HOLDINGS
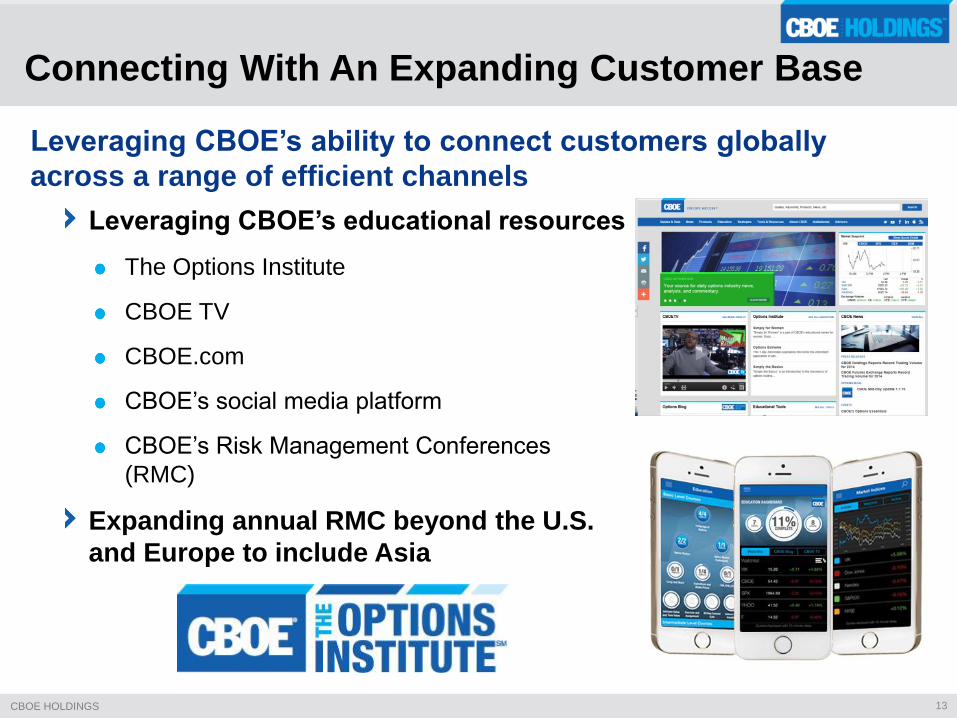
Leveraging CBOE’s ability to connect customers globally
across a range of efficient channels
Connecting With An Expanding Customer Base
Leveraging CBOE’s educational resources
The Options Institute
CBOE TV
CBOE.com
CBOE’s social media platform
CBOE’s Risk Management Conferences
(RMC)
Expanding annual RMC beyond the U.S.
and Europe to include Asia

14 CBOE HOLDINGS
Added extended trading hours session for VIX and SPX options
VIX options started March 2 and SPX options started on March 9
New session runs from 2:00 a.m. to 8:15 a.m. CT, Monday through Friday
About 8% of VIX futures trading during non-U.S. hours YTD¹
Connect: Broadening Access to Our Premium Products
¹Through March 31, 2015
²Extended hours to nearly 24X5 on June 22, 2014

15 CBOE HOLDINGS
Launching Weeklys on VIX options and futures¹
Plan to launch Weeklys on futures this July, with options to follow
VIX Weeklys will complement VIX futures and options
As SPX Weeklys complement our SPX product
Provides volatility exposures that more precisely track our
benchmark VIX index
Allows users to fine tune the timing of their volatility trades and hedge
against event-driven market moves
Investors will be able to trade expiring VIX and SPX contracts each week
– Creates more trading opportunities
Create: Weekly VIX Options and Futures
¹Pending regulatory approval
16 CBOE HOLDINGS
Systems development is deeply embedded in CBOE’s value proposition
Development of next generation of trading technology is
underway
Leveraging our in-house trading and technology expertise
Building a customized, state-of-the-art platform
Responds to the trading needs of our customers
Best supports CBOE’s unique product set
Continue to drive optimal performance of our current system
Build out and implement new systems for CFE first
CFE projected for the second half of 2016, with CBOE and C2 to follow
Create New Trading Platform – CBOE Vector℠
17 CBOE HOLDINGS
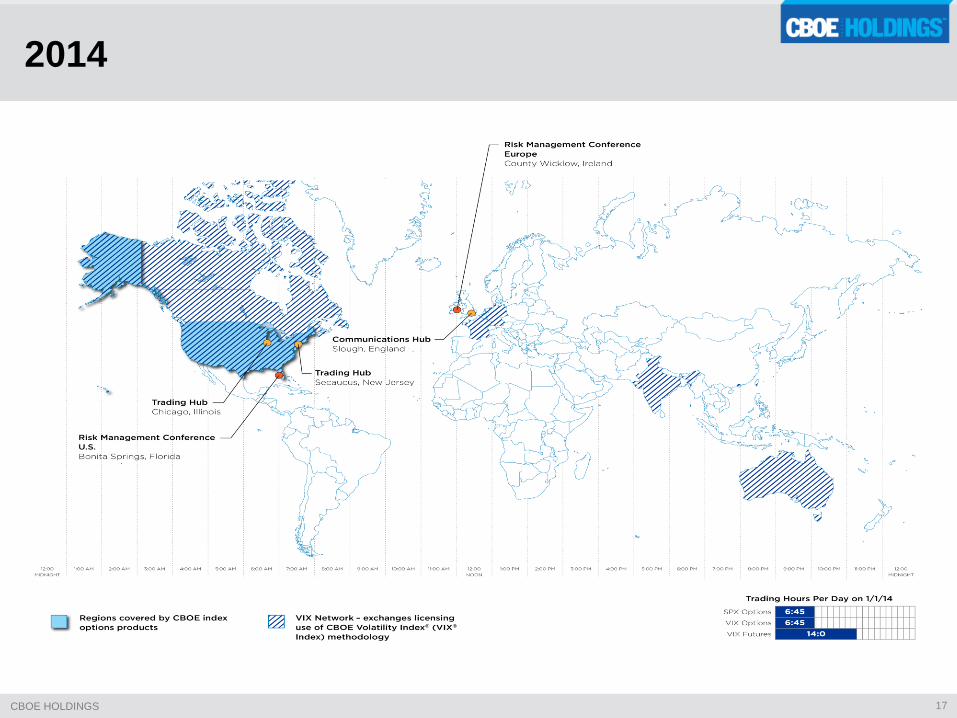
2014
18 CBOE HOLDINGS
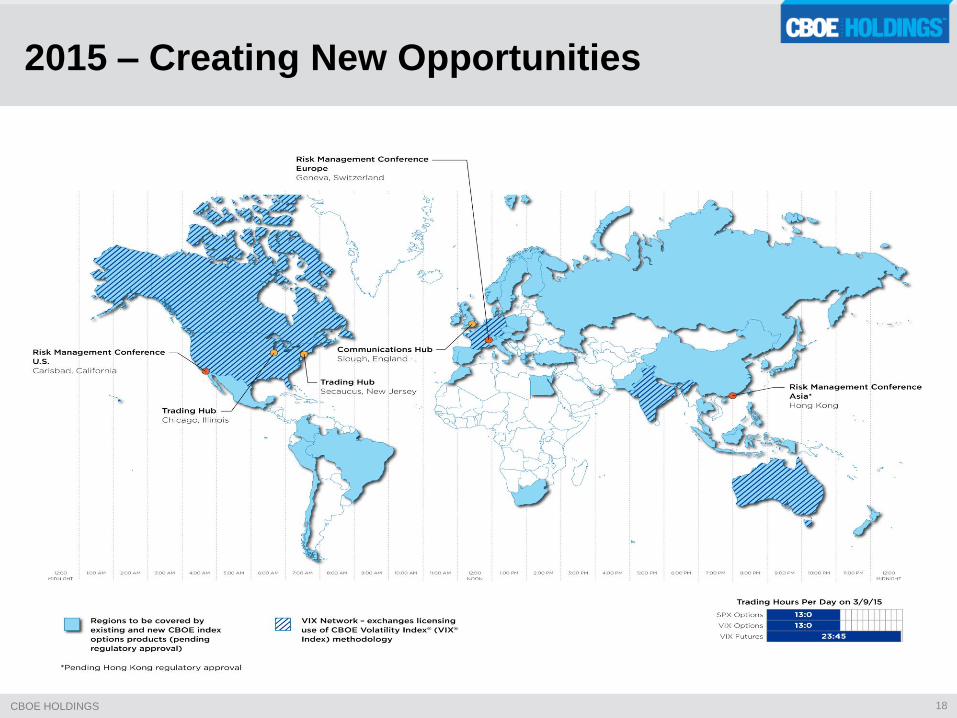
2015 – Creating New Opportunities
Financial Review
Alan Dean
EVP, CFO and Treasurer
20 CBOE HOLDINGS
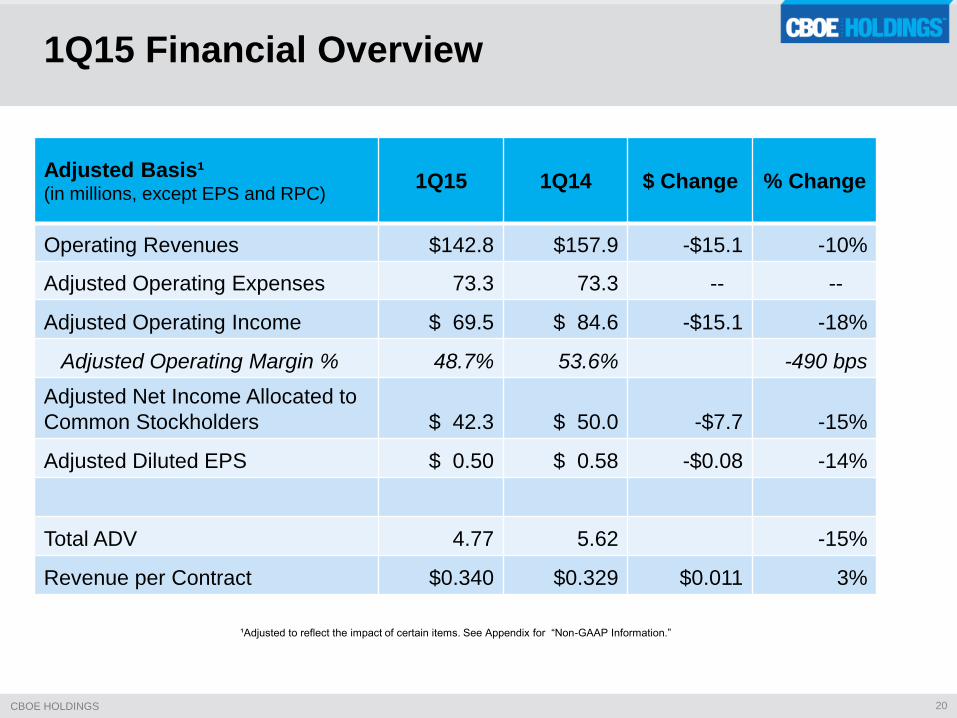
1Q15 Financial Overview
Adjusted Basis¹ (in millions, except EPS and RPC)
1Q15 1Q14 $ Change % Change
Operating Revenues $142.8 $157.9 -$15.1 -10%
Adjusted Operating Expenses 73.3 73.3 -- --
Adjusted Operating Income $ 69.5 $ 84.6 -$15.1 -18%
Adjusted Operating Margin % 48.7% 53.6% -490 bps
Adjusted Net Income Allocated to
Common Stockholders
$ 42.3
$ 50.0
-$7.7
-15%
Adjusted Diluted EPS $ 0.50 $ 0.58 -$0.08 -14%
Total ADV 4.77 5.62 -15%
Revenue per Contract $0.340 $0.329 $0.011 3%
¹Adjusted to reflect the impact of certain items. See Appendix for “Non-GAAP Information.”
21 CBOE HOLDINGS
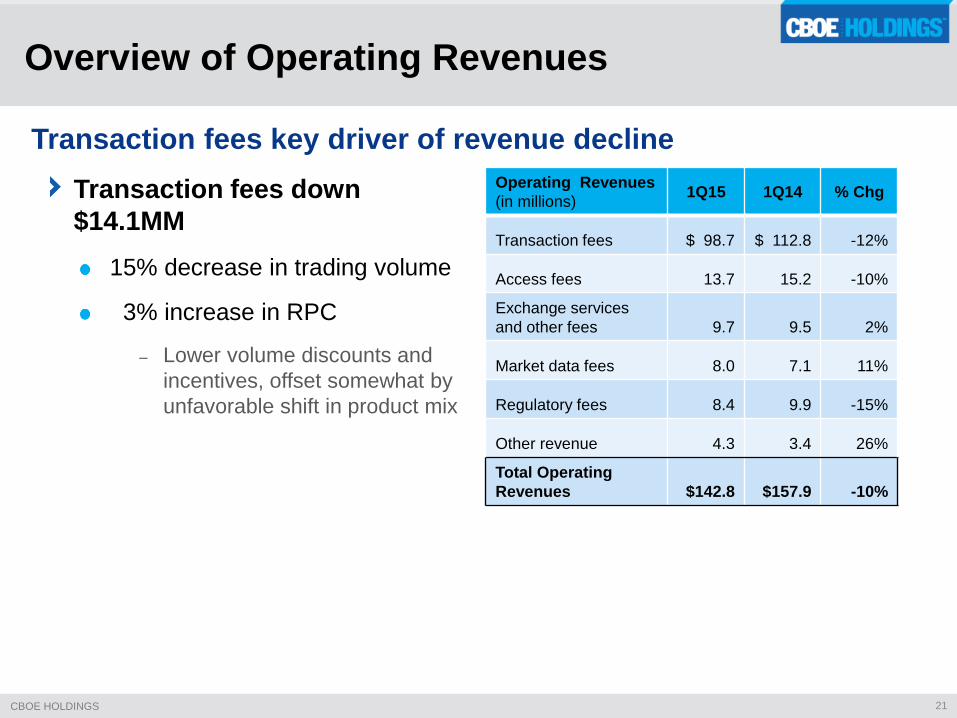
Overview of Operating Revenues
Transaction fees key driver of revenue decline
Transaction fees down
$14.1MM
15% decrease in trading volume
3% increase in RPC
– Lower volume discounts and
incentives, offset somewhat by
unfavorable shift in product mix
Operating Revenues
(in millions) 1Q15 1Q14 % Chg
Transaction fees $ 98.7 $ 112.8 -12%
Access fees 13.7 15.2 -10%
Exchange services
and other fees 9.7 9.5 2%
Market data fees 8.0 7.1 11%
Regulatory fees 8.4 9.9 -15%
Other revenue 4.3 3.4 26%
Total Operating
Revenues $142.8 $157.9 -10%
22 CBOE HOLDINGS
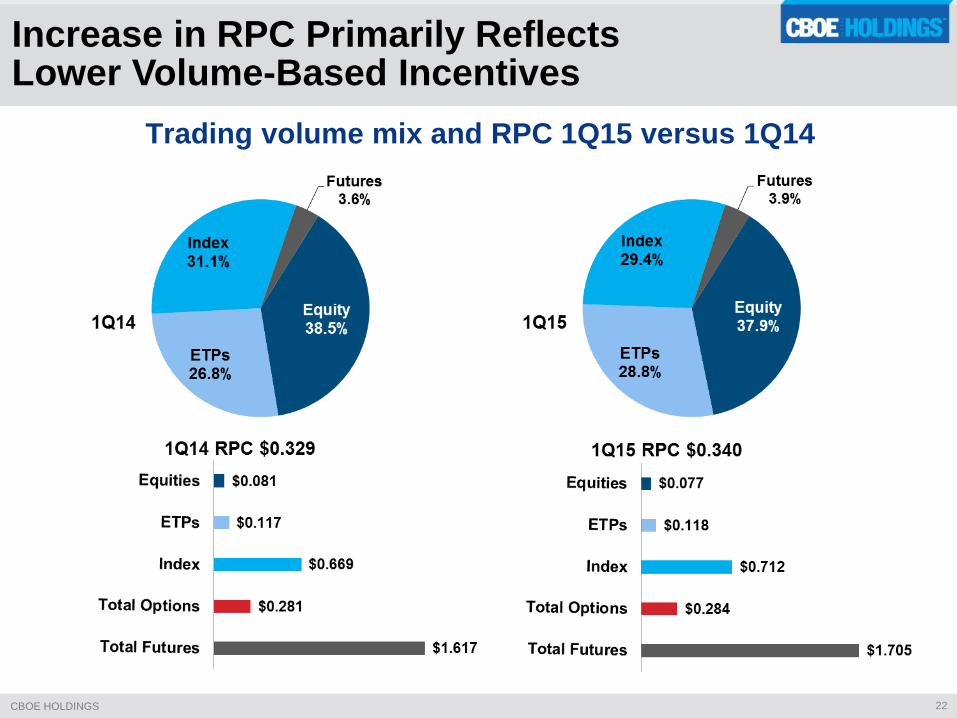
Increase in RPC Primarily Reflects Lower Volume-Based Incentives
Trading volume mix and RPC 1Q15 versus 1Q14
23 CBOE HOLDINGS
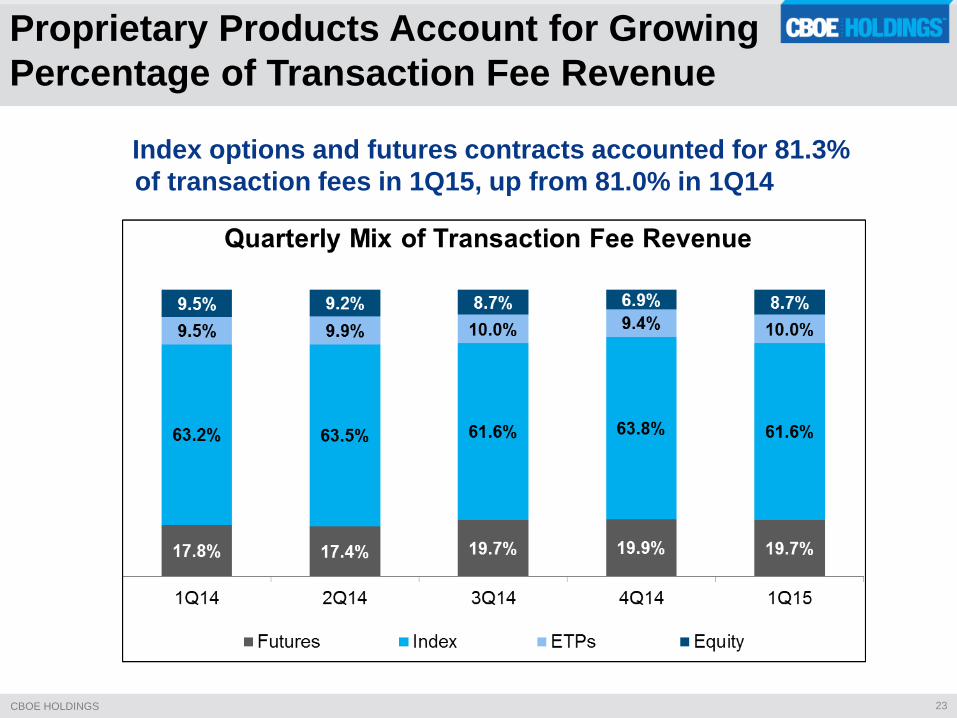
Proprietary Products Account for Growing
Percentage of Transaction Fee Revenue
Index options and futures contracts accounted for 81.3%
of transaction fees in 1Q15, up from 81.0% in 1Q14
24 CBOE HOLDINGS
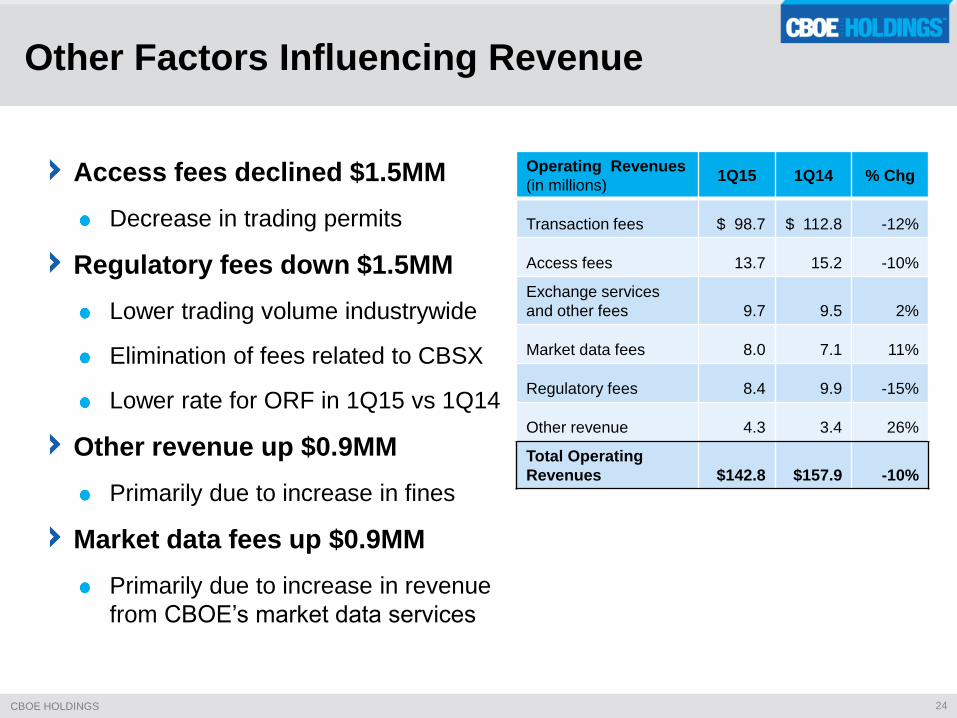
Other Factors Influencing Revenue
Access fees declined $1.5MM
Decrease in trading permits
Regulatory fees down $1.5MM
Lower trading volume industrywide
Elimination of fees related to CBSX
Lower rate for ORF in 1Q15 vs 1Q14
Other revenue up $0.9MM
Primarily due to increase in fines
Market data fees up $0.9MM
Primarily due to increase in revenue
from CBOE’s market data services
Operating Revenues
(in millions) 1Q15 1Q14 % Chg
Transaction fees $ 98.7 $ 112.8 -12%
Access fees 13.7 15.2 -10%
Exchange services
and other fees 9.7 9.5 2%
Market data fees 8.0 7.1 11%
Regulatory fees 8.4 9.9 -15%
Other revenue 4.3 3.4 26%
Total Operating
Revenues $142.8 $157.9 -10%
25 CBOE HOLDINGS
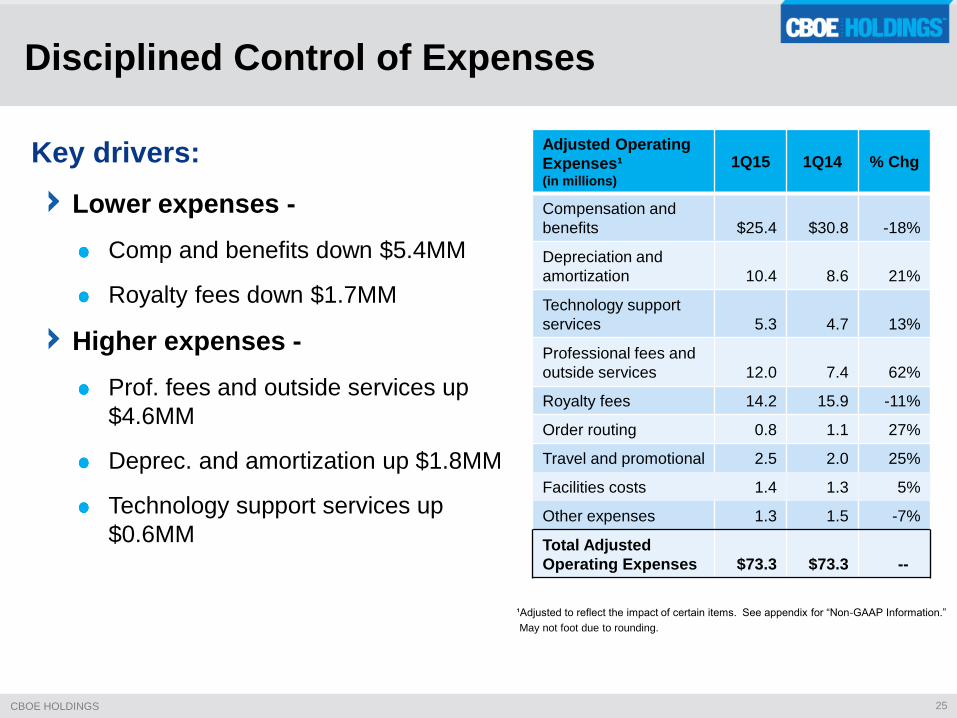
Disciplined Control of Expenses
Key drivers:
Lower expenses -
Comp and benefits down $5.4MM
Royalty fees down $1.7MM
Higher expenses -
Prof. fees and outside services up
$4.6MM
Deprec. and amortization up $1.8MM
Technology support services up
$0.6MM
Adjusted Operating
Expenses¹ (in millions)
1Q15 1Q14 % Chg
Compensation and
benefits $25.4 $30.8 -18%
Depreciation and
amortization 10.4 8.6
21%
Technology support
services 5.3 4.7 13%
Professional fees and
outside services 12.0 7.4 62%
Royalty fees 14.2 15.9 -11%
Order routing 0.8 1.1 27%
Travel and promotional 2.5 2.0 25%
Facilities costs 1.4 1.3 5%
Other expenses 1.3 1.5 -7%
Total Adjusted
Operating Expenses $73.3 $73.3 --
¹Adjusted to reflect the impact of certain items. See appendix for “Non-GAAP Information.”
May not foot due to rounding.
26 CBOE HOLDINGS
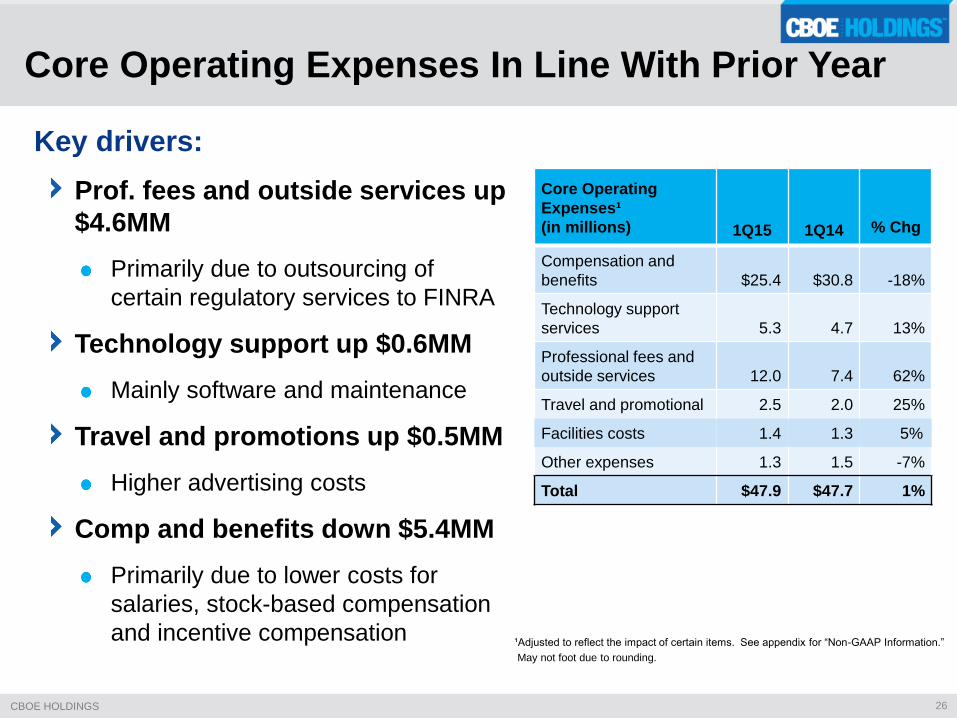
Key drivers:
Core Operating
Expenses¹
(in millions)
1Q15
1Q14
% Chg
Compensation and
benefits $25.4 $30.8 -18%
Technology support
services 5.3 4.7 13%
Professional fees and
outside services 12.0 7.4 62%
Travel and promotional 2.5 2.0 25%
Facilities costs 1.4 1.3 5%
Other expenses 1.3 1.5 -7%
Total $47.9 $47.7 1%
Core Operating Expenses In Line With Prior Year
¹Adjusted to reflect the impact of certain items. See appendix for “Non-GAAP Information.”
May not foot due to rounding.
Prof. fees and outside services up
$4.6MM
Primarily due to outsourcing of
certain regulatory services to FINRA
Technology support up $0.6MM
Mainly software and maintenance
Travel and promotions up $0.5MM
Higher advertising costs
Comp and benefits down $5.4MM
Primarily due to lower costs for
salaries, stock-based compensation
and incentive compensation

27 CBOE HOLDINGS
2015 Full-Year Guidance
As of May 1, 2015 ($ in millions)
Current 2015
Full-Year
Guidance
Prior 2015
Full-Year
Guidance
Core operating expenses $190 to $194 $195 to $199
Continuing stock-based compensation¹ $12 $12
Depreciation and amortization $46 to $48 $46 to $48
Capital expenditures $37 to $40 $37 to $40
Effective tax rate 38.5% to 39.5% 38.5% to 39.5%
1Stock-based compensation expense is included in employee costs.
28 CBOE HOLDINGS
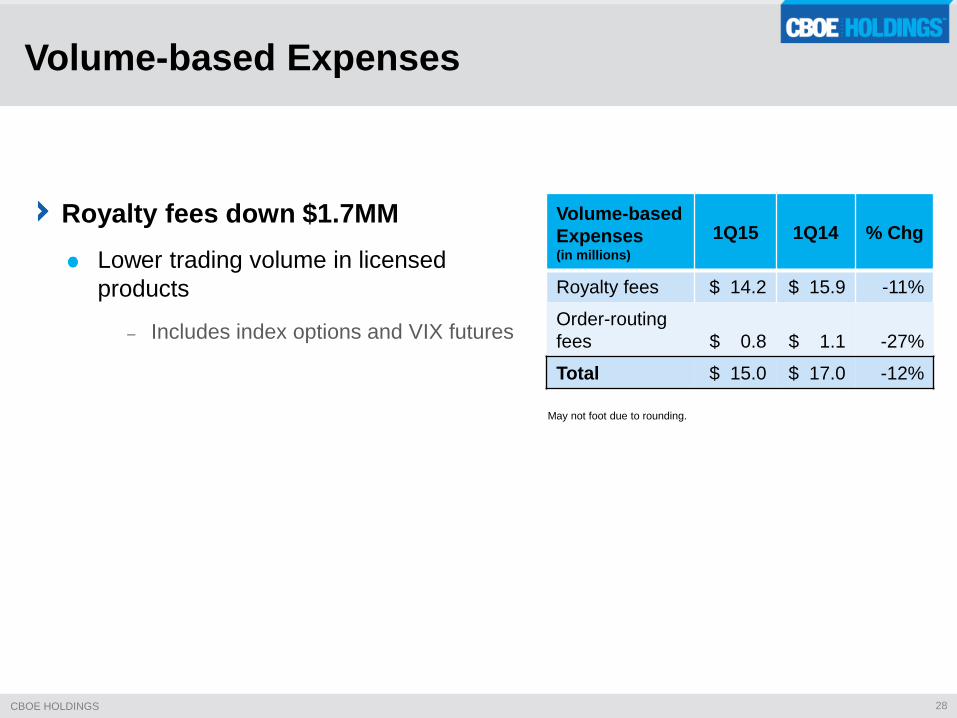
Volume-based Expenses
Royalty fees down $1.7MM
Lower trading volume in licensed
products
– Includes index options and VIX futures
Volume-based
Expenses (in millions)
1Q15 1Q14 % Chg
Royalty fees $ 14.2 $ 15.9 -11%
Order-routing
fees $ 0.8 $ 1.1 -27%
Total $ 15.0 $ 17.0 -12%
May not foot due to rounding.
29 CBOE HOLDINGS
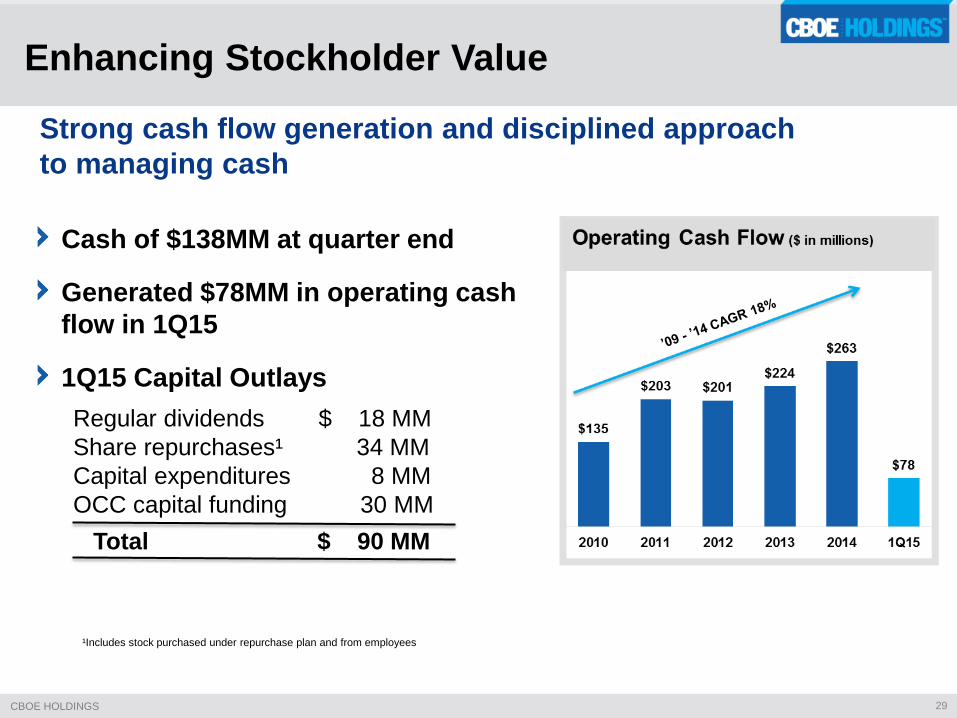
Enhancing Stockholder Value
Strong cash flow generation and disciplined approach
to managing cash
Cash of $138MM at quarter end
Generated $78MM in operating cash
flow in 1Q15
1Q15 Capital Outlays
Regular dividends $ 18 MM
Share repurchases¹ 34 MM
Capital expenditures 8 MM
OCC capital funding 30 MM
Total $ 90 MM
¹Includes stock purchased under repurchase plan and from employees
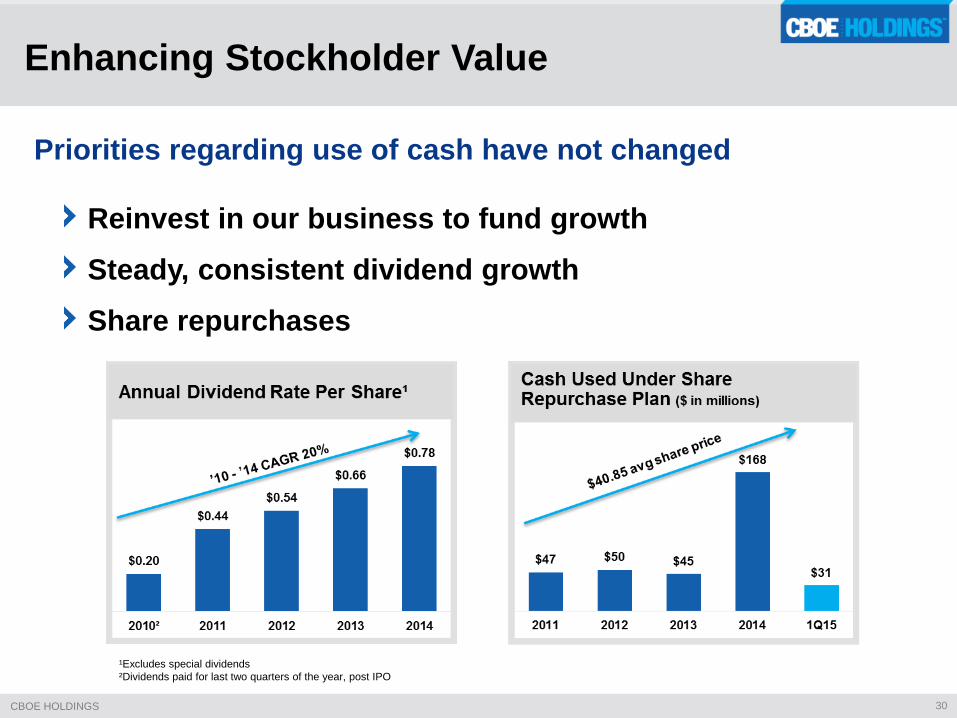
30 CBOE HOLDINGS
Reinvest in our business to fund growth
Steady, consistent dividend growth
Share repurchases
Priorities regarding use of cash have not changed
Enhancing Stockholder Value
¹Excludes special dividends
²Dividends paid for last two quarters of the year, post IPO
31 CBOE HOLDINGS
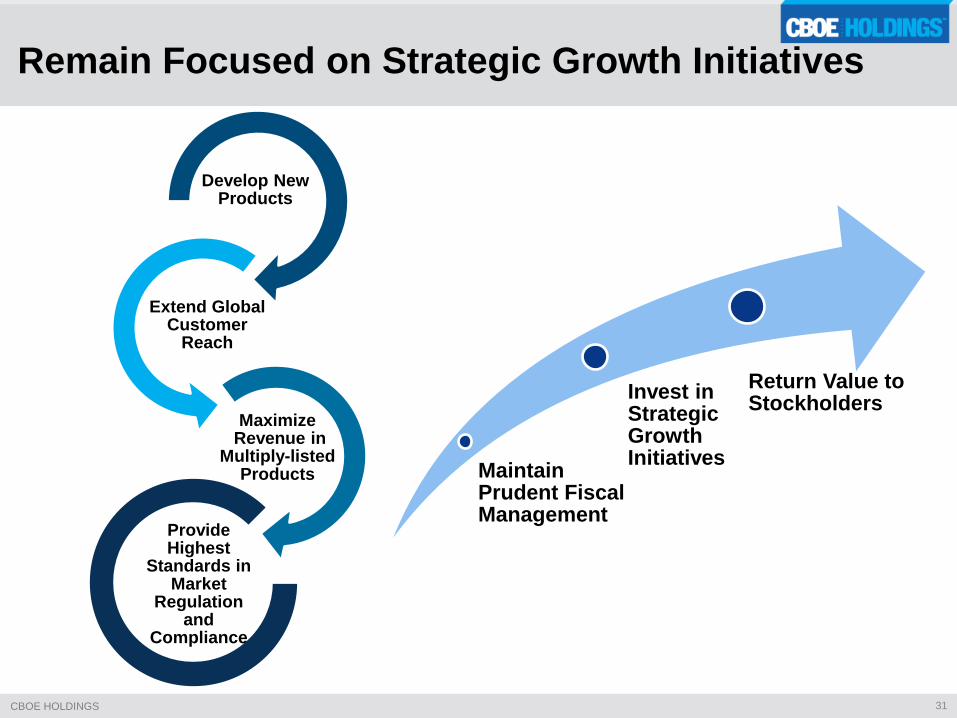
Remain Focused on Strategic Growth Initiatives
Develop New Products
Extend Global Customer
Reach
Maximize Revenue in
Multiply-listed Products
Provide Highest
Standards in Market
Regulation and
Compliance
Maintain Prudent Fiscal Management
Invest in Strategic Growth Initiatives
Return Value to Stockholders

Questions & Answers
Appendix Materials

34 CBOE HOLDINGS
¹Adjusted to reflect the impact of certain items. See Appendix for “Non-GAAP Information.”
Optimistic About Long-term Growth Prospects
$0.20
$0.25
$0.30
$0.35
$0.40
$0.45
$0.50
$0.55
$0.60
$0.65
$0.70
$0
$20
$40
$60
$80
$100
$120
$140
$160
1Q11 2Q11 3Q11 4Q11 1Q12 2Q12 3Q12 4Q12 1Q13 2Q13 3Q13 4Q13 1Q14 2Q14 3Q14 4Q14 1Q15
Quarterly Adjusted Operating Revenue and Diluted EPS¹($ in millions, except EPS)
Adjusted Operating Revenue Adjusted Diluted EPS
35 CBOE HOLDINGS
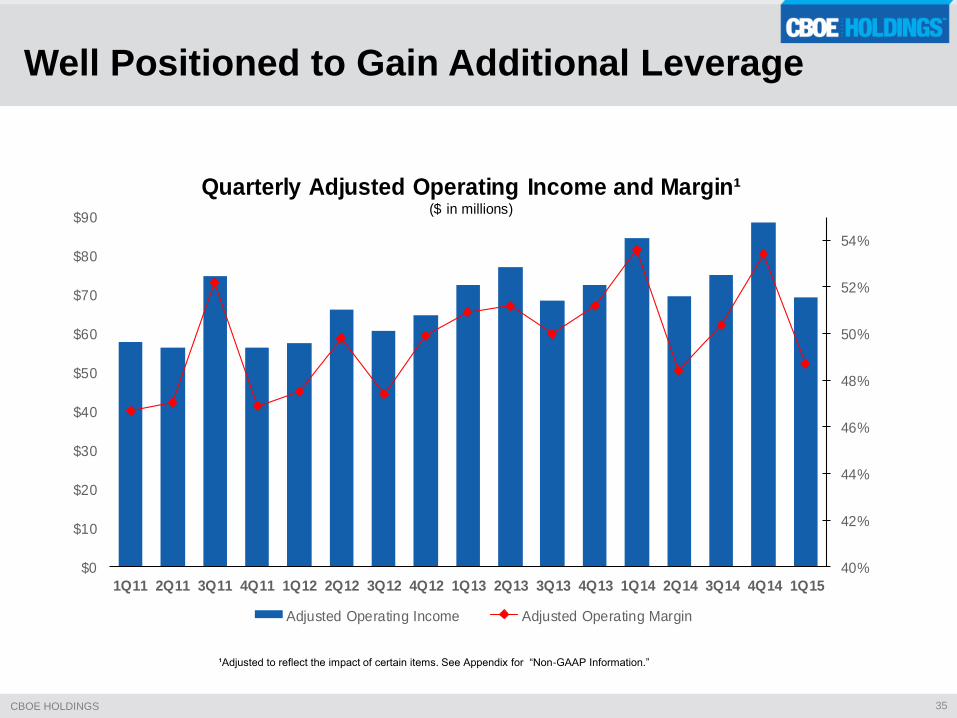
¹Adjusted to reflect the impact of certain items. See Appendix for “Non-GAAP Information.”
Well Positioned to Gain Additional Leverage
40%
42%
44%
46%
48%
50%
52%
54%
$0
$10
$20
$30
$40
$50
$60
$70
$80
$90
1Q11 2Q11 3Q11 4Q11 1Q12 2Q12 3Q12 4Q12 1Q13 2Q13 3Q13 4Q13 1Q14 2Q14 3Q14 4Q14 1Q15
Quarterly Adjusted Operating Income and Margin¹($ in millions)
Adjusted Operating Income Adjusted Operating Margin

36 CBOE HOLDINGS
CBOE Holdings Quarterly Options ADV (contracts in millions)
Quarterly Options ADV

37 CBOE HOLDINGS
Trading Volume Mix and RPC 1Q14 vs 1Q15
RPC change primarily reflects higher volume-based incentives
38 CBOE HOLDINGS
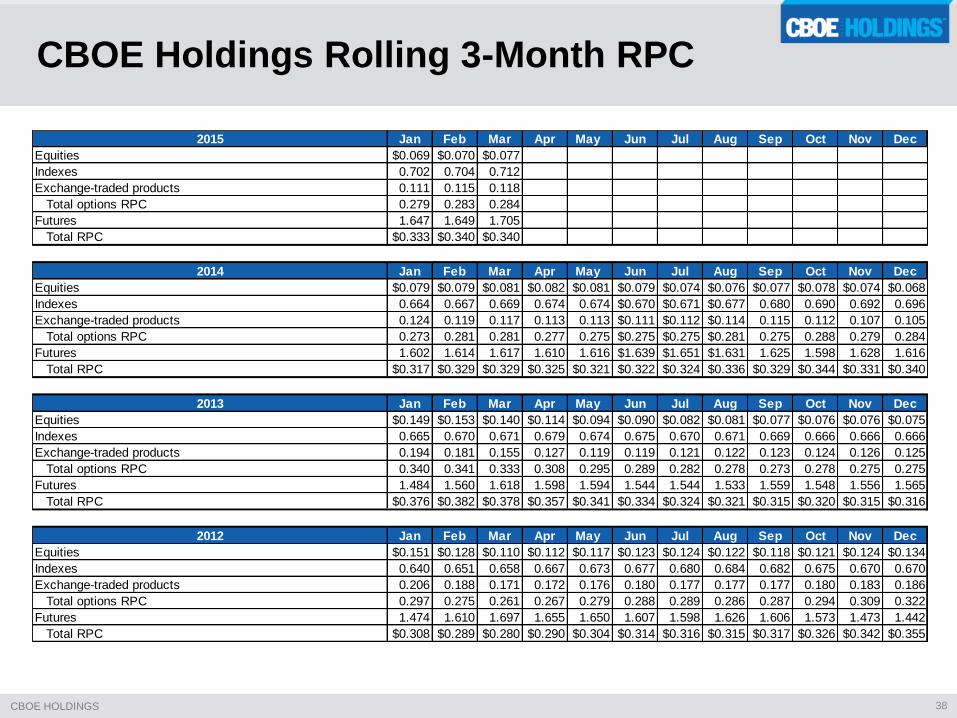
CBOE Holdings Rolling 3-Month RPC
2015 Jan Feb Mar Apr May Jun Jul Aug Sep Oct Nov Dec
Equities $0.069 $0.070 $0.077
Indexes 0.702 0.704 0.712
Exchange-traded products 0.111 0.115 0.118
Total options RPC 0.279 0.283 0.284
Futures 1.647 1.649 1.705
Total RPC $0.333 $0.340 $0.340
2014 Jan Feb Mar Apr May Jun Jul Aug Sep Oct Nov Dec
Equities $0.079 $0.079 $0.081 $0.082 $0.081 $0.079 $0.074 $0.076 $0.077 $0.078 $0.074 $0.068
Indexes 0.664 0.667 0.669 0.674 0.674 $0.670 $0.671 $0.677 0.680 0.690 0.692 0.696
Exchange-traded products 0.124 0.119 0.117 0.113 0.113 $0.111 $0.112 $0.114 0.115 0.112 0.107 0.105
Total options RPC 0.273 0.281 0.281 0.277 0.275 $0.275 $0.275 $0.281 0.275 0.288 0.279 0.284
Futures 1.602 1.614 1.617 1.610 1.616 $1.639 $1.651 $1.631 1.625 1.598 1.628 1.616
Total RPC $0.317 $0.329 $0.329 $0.325 $0.321 $0.322 $0.324 $0.336 $0.329 $0.344 $0.331 $0.340
2013 Jan Feb Mar Apr May Jun Jul Aug Sep Oct Nov Dec
Equities $0.149 $0.153 $0.140 $0.114 $0.094 $0.090 $0.082 $0.081 $0.077 $0.076 $0.076 $0.075
Indexes 0.665 0.670 0.671 0.679 0.674 0.675 0.670 0.671 0.669 0.666 0.666 0.666
Exchange-traded products 0.194 0.181 0.155 0.127 0.119 0.119 0.121 0.122 0.123 0.124 0.126 0.125
Total options RPC 0.340 0.341 0.333 0.308 0.295 0.289 0.282 0.278 0.273 0.278 0.275 0.275
Futures 1.484 1.560 1.618 1.598 1.594 1.544 1.544 1.533 1.559 1.548 1.556 1.565
Total RPC $0.376 $0.382 $0.378 $0.357 $0.341 $0.334 $0.324 $0.321 $0.315 $0.320 $0.315 $0.316
2012 Jan Feb Mar Apr May Jun Jul Aug Sep Oct Nov Dec
Equities $0.151 $0.128 $0.110 $0.112 $0.117 $0.123 $0.124 $0.122 $0.118 $0.121 $0.124 $0.134
Indexes 0.640 0.651 0.658 0.667 0.673 0.677 0.680 0.684 0.682 0.675 0.670 0.670
Exchange-traded products 0.206 0.188 0.171 0.172 0.176 0.180 0.177 0.177 0.177 0.180 0.183 0.186
Total options RPC 0.297 0.275 0.261 0.267 0.279 0.288 0.289 0.286 0.287 0.294 0.309 0.322
Futures 1.474 1.610 1.697 1.655 1.650 1.607 1.598 1.626 1.606 1.573 1.473 1.442
Total RPC $0.308 $0.289 $0.280 $0.290 $0.304 $0.314 $0.316 $0.315 $0.317 $0.326 $0.342 $0.355

39 CBOE HOLDINGS
2014 % rev 2013 % rev 2012 % rev 2011 % rev 2010 % rev
Total Operating Expenses $303,424 49% $286,236 50% $268,241 52% $266,512 52% $269,763 62%
Less:
Depreciation and Amortization 39,913 6% 34,488 6% 31,485 6% 34,094 7% 29,891 7%
Accelerated stock-based compensation 2,530 - 3,996 1% 343 - 453 - 12,968 3%
Severance 1,863 - - - - - 3,709 1% - -
Estimated liability/expense related to SEC investigation 0 - 1,000 - 5,000 1% - - - -
Volume-based Expense:
Royalty Fees 66,110 11% 56,576 10% 46,135 9% 47,822 9% 41,353 10%
Trading Volume Incentives 4,080 1% 4,355 1% 6,275 1% 14,239 3% 21,294 5%
Core Operating Expenses (non-GAAP)¹: $188,928 31% $185,821 32% $179,003 35% $166,195 33% $164,257 38%
Less: Continuing stock-based compensation 13,047 2% 16,828 3% 12,005 2% 12,166 2% 7,833 2%
Core Operating Expenses excluding continuing stock-
based compensation (non-GAAP)¹: $175,881 28% $168,993 30% $166,998 33% $154,029 30% $156,424 36%
Core Operating Expense Detail:
Employee Costs $117,341 19% $114,087 20% $103,853 20% $100,292 20% $93,275 22%
Data Processing 19,189 3% 17,898 3% 19,603 4% 17,933 4% 19,501 5%
Outside Services 31,976 5% 34,473 6% 36,300 7% 27,310 5% 31,245 7%
Travel and Promotion Expenses 9,046 1% 9,806 2% 10,006 2% 9,812 2% 9,569 2%
Facilities Costs 5,721 1% 5,053 1% 5,066 1% 5,400 1% 5,801 1%
Other Expenses 5,655 1% 4,504 1% 4,175 1% 5,448 1% 4,866 1%
Number of Full Time Employees at year end 520 650 605 596 581
May not foot due to rounding
¹Please see our disclaimer regarding non-GAAP financial measures.
($ in thousands)
Annual Core Operating Expenses¹

40 CBOE HOLDINGS
Quarterly Core Operating Expenses¹
1Q 2015 % rev 4Q 2014 % rev 3Q 2014 % rev 2Q 2014 % rev 1Q 2014 % rev
Total Operating Expenses $73,286 51% $79,525 48% $73,826 50% $74,226 52% $75,847 48%
Less:
Depreciation and amortization 10,402 7% 11,053 7% 10,361 7% 9,895 7% 8,604 5%
Accelerated stock-based compensation - - - - - - - - 2,530 2%
Severance expense - - 1,863 1% - - - - - -
Volume-based expense:
Royalty fees 14,150 10% 19,266 12% 16,235 11% 14,707 10% 15,902 10%
Trading volume incentives 787 1% 874 1% 961 1% 1,120 1% 1,126 1%
Core Operating Expenses (non-GAAP)¹: $47,947 34% $46,469 28% $46,269 31% $48,504 34% $47,685 30%
Less: Continuing stock-based compensation 2,655 2% 2,098 1% 2,109 1% 4,457 3% 4,383 3%
Core Operating Expenses excluding continuing stock-
based compensation (non-GAAP)¹: $45,292 32% $44,371 27% $44,160 30% $44,047 31% $43,302 27%
Core Operating Expense Detail:
Employee costs $25,439 18% $27,493 17% $28,698 19% $30,306 21% $30,844 20%
Data processing 5,325 4% 4,915 3% 4,769 3% 4,783 3% 4,721 3%
Outside services 11,950 8% 8,539 5% 8,204 6% 7,855 5% 7,378 5%
Travel and promotional expenses 2,501 2% 2,727 2% 1,885 1% 2,446 2% 1,987 1%
Facilities costs 1,384 1% 1,445 1% 1,373 1% 1,590 1% 1,313 1%
Other expenses 1,348 1% 1,350 1% 1,340 1% 1,524 1% 1,442 1%
Total $47,947 $46,469 $46,269 $48,504 $47,685
Number of full-time employees at quarter end 520 520 639 661 656
May not foot due to rounding
¹Please see our disclaimer regarding non-GAAP financial measures.
($ in thousands)

41 CBOE HOLDINGS
May not foot due to rounding and/or change in shares outstanding
GAAP to Non-GAAP Reconciliation
For Years 2010 and 2011 GAAP to Non-GAAP Reconciliation
(in thousands, except per share amounts)
3Q10 4Q10 1Q11 2Q11 3Q11 4Q11 FY2010 FY2011
Reconciliation of GAAP Net Income Allocated to Common Stockholder to Non-GAAP
GAAP net income allocated to common stockholders 20,020$ 30,687$ 32,089$ 32,609$ 40,597$ 31,287$ 98,166$ 136,582$
Less: Recognition of prior-period revenue (4,406) (4,406)
Add: Accelerated stock-based compensation 10,965 2,004 340 113 12,968 453
Add: Severance expense pursuant to an executive employment agreement 3,709 3,709
Add: Impairment change 1,620 460 1,620 460
Income tax benefit/(expense) related to the items above (4,461) 291 (337) (46) (1,478) (4,034) (1,861)
Add: Income tax provision adjustment 4,223 (322) 3,901
Net income allocated to participating securities - effect on reconciling items (144) 11 (11) (2) (75) (32) (76) (109)
Adjusted net income allocated to common stockholders 26,380$ 30,207$ 32,540$ 32,674$ 44,745$ 33,164$ 104,238$ 143,134$
Reconciliation of GAAP Diluted EPS to Non-GAAP
GAAP diluted earnings per common share 0.20$ 0.31$ 0.36$ 0.36$ 0.45$ 0.35$ 1.03$ 1.52$
Per share impact of items above 0.06 0.05 0.02 0.06 0.07
Non-GAAP diluted earnings per common share 0.26$ 0.31$ 0.36$ 0.36$ 0.50$ 0.37$ 1.09$ 1.59$
GAAP operating revenue 106,015$ 117,391$ 124,042$ 120,290$ 143,604$ 120,208$ 437,104$ 508,144$
Non-GAAP adjustments noted above (4,406) (4,406)
Adjusted operating revenue 106,015$ 112,985$ 124,042$ 120,290$ 143,604$ 120,208$ 432,698$ 508,144$
GAAP operating income 34,933$ 51,854$ 57,535$ 56,452$ 74,966$ 52,679$ 167,341$ 241,632$
Non-GAAP adjustments noted above 10,965 (2,402) 340 113 - 3,709 8,562 4,162
Adjusted operating income 45,898$ 49,452$ 57,875$ 56,565$ 74,966$ 56,388$ 175,903$ 245,794$
Adjusted operating margin 43.3% 43.8% 46.7% 47.0% 52.2% 46.9% 40.7% 48.4%
For further information go to cboe.com/Investor Relations
Reconciliation of GAAP Operating Margin to Non-GAAP
42 CBOE HOLDINGS
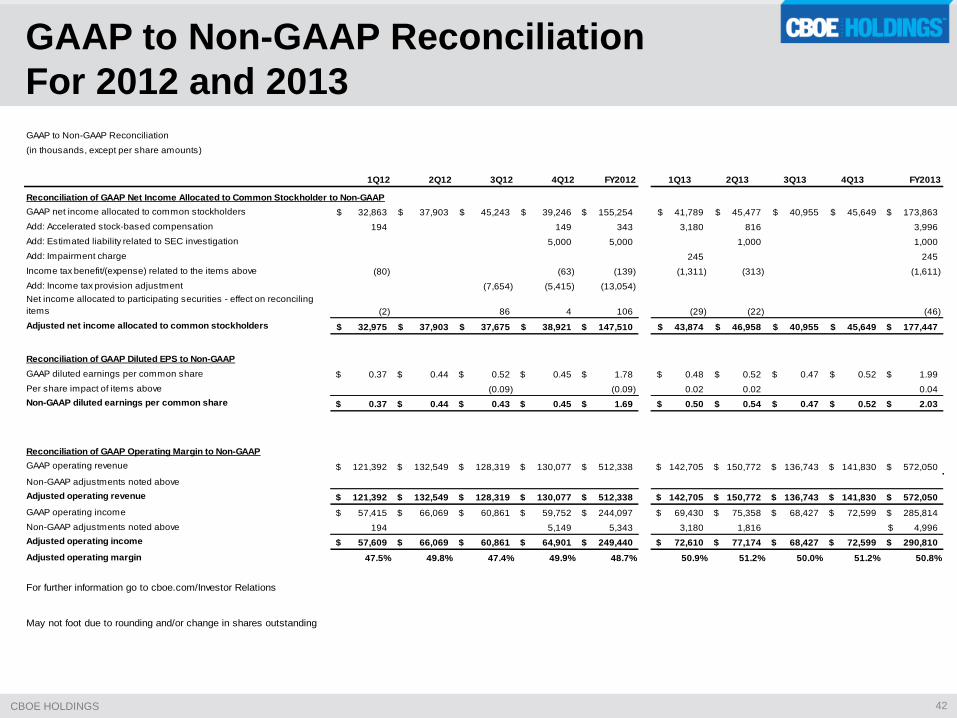
GAAP to Non-GAAP Reconciliation
For 2012 and 2013
GAAP to Non-GAAP Reconciliation
(in thousands, except per share amounts)
1Q12 2Q12 3Q12 4Q12 FY2012 1Q13 2Q13 3Q13 4Q13 FY2013
Reconciliation of GAAP Net Income Allocated to Common Stockholder to Non-GAAP
GAAP net income allocated to common stockholders 32,863$ 37,903$ 45,243$ 39,246$ 155,254$ 41,789$ 45,477$ 40,955$ 45,649$ 173,863$
Add: Accelerated stock-based compensation 194 149 343 3,180 816 3,996
Add: Estimated liability related to SEC investigation 5,000 5,000 1,000 1,000
Add: Impairment charge 245 245
Income tax benefit/(expense) related to the items above (80) (63) (139) (1,311) (313) (1,611)
Add: Income tax provision adjustment (7,654) (5,415) (13,054)
Net income allocated to participating securities - effect on reconciling
items (2) 86 4 106 (29) (22) (46)
Adjusted net income allocated to common stockholders 32,975$ 37,903$ 37,675$ 38,921$ 147,510$ 43,874$ 46,958$ 40,955$ 45,649$ 177,447$
Reconciliation of GAAP Diluted EPS to Non-GAAP
GAAP diluted earnings per common share 0.37$ 0.44$ 0.52$ 0.45$ 1.78$ 0.48$ 0.52$ 0.47$ 0.52$ 1.99$
Per share impact of items above (0.09) (0.09) 0.02 0.02 0.04
Non-GAAP diluted earnings per common share 0.37$ 0.44$ 0.43$ 0.45$ 1.69$ 0.50$ 0.54$ 0.47$ 0.52$ 2.03$
Reconciliation of GAAP Operating Margin to Non-GAAP
GAAP operating revenue 121,392$ 132,549$ 128,319$ 130,077$ 512,338$ 142,705$ 150,772$ 136,743$ 141,830$ 572,050$
Non-GAAP adjustments noted above
Adjusted operating revenue 121,392$ 132,549$ 128,319$ 130,077$ 512,338$ 142,705$ 150,772$ 136,743$ 141,830$ 572,050$
GAAP operating income 57,415$ 66,069$ 60,861$ 59,752$ 244,097$ 69,430$ 75,358$ 68,427$ 72,599$ 285,814$
Non-GAAP adjustments noted above 194 5,149 5,343 3,180 1,816 4,996$
Adjusted operating income 57,609$ 66,069$ 60,861$ 64,901$ 249,440$ 72,610$ 77,174$ 68,427$ 72,599$ 290,810$
Adjusted operating margin 47.5% 49.8% 47.4% 49.9% 48.7% 50.9% 51.2% 50.0% 51.2% 50.8%
For further information go to cboe.com/Investor Relations
May not foot due to rounding and/or change in shares outstanding
43 CBOE HOLDINGS
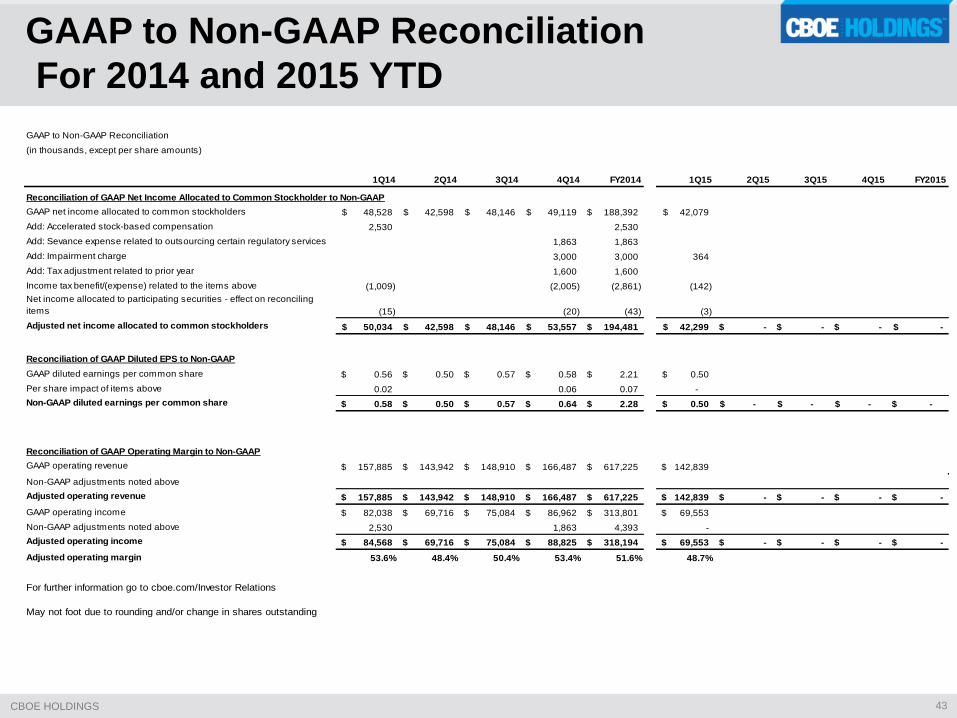
GAAP to Non-GAAP Reconciliation
For 2014 and 2015 YTD
GAAP to Non-GAAP Reconciliation
(in thousands, except per share amounts)
1Q14 2Q14 3Q14 4Q14 FY2014 1Q15 2Q15 3Q15 4Q15 FY2015
Reconciliation of GAAP Net Income Allocated to Common Stockholder to Non-GAAP
GAAP net income allocated to common stockholders 48,528$ 42,598$ 48,146$ 49,119$ 188,392$ 42,079$
Add: Accelerated stock-based compensation 2,530 2,530
Add: Sevance expense related to outsourcing certain regulatory services 1,863 1,863
Add: Impairment charge 3,000 3,000 364
Add: Tax adjustment related to prior year 1,600 1,600
Income tax benefit/(expense) related to the items above (1,009) (2,005) (2,861) (142)
Net income allocated to participating securities - effect on reconciling
items (15) (20) (43) (3)
Adjusted net income allocated to common stockholders 50,034$ 42,598$ 48,146$ 53,557$ 194,481$ 42,299$ -$ -$ -$ -$
Reconciliation of GAAP Diluted EPS to Non-GAAP
GAAP diluted earnings per common share 0.56$ 0.50$ 0.57$ 0.58$ 2.21$ 0.50$
Per share impact of items above 0.02 0.06 0.07 -
Non-GAAP diluted earnings per common share 0.58$ 0.50$ 0.57$ 0.64$ 2.28$ 0.50$ -$ -$ -$ -$
Reconciliation of GAAP Operating Margin to Non-GAAP
GAAP operating revenue 157,885$ 143,942$ 148,910$ 166,487$ 617,225$ 142,839$
Non-GAAP adjustments noted above
Adjusted operating revenue 157,885$ 143,942$ 148,910$ 166,487$ 617,225$ 142,839$ -$ -$ -$ -$
GAAP operating income 82,038$ 69,716$ 75,084$ 86,962$ 313,801$ 69,553$
Non-GAAP adjustments noted above 2,530 1,863 4,393 -
Adjusted operating income 84,568$ 69,716$ 75,084$ 88,825$ 318,194$ 69,553$ -$ -$ -$ -$
Adjusted operating margin 53.6% 48.4% 50.4% 53.4% 51.6% 48.7%
For further information go to cboe.com/Investor Relations
May not foot due to rounding and/or change in shares outstanding
44 CBOE HOLDINGS
In addition to disclosing results determined in accordance with GAAP, CBOE Holdings has disclosed certain non-GAAP measures of operating performance. The non-GAAP measures provided in this presentation include core operating expenses, adjusted operating revenue, adjusted operating expenses, adjusted operating income, adjusted operating margin, adjusted effective tax rate, adjusted net income, adjusted net income allocated to common stockholders and adjusted diluted earnings per share.
Management believes that the non-GAAP financial measures presented in this presentation, including adjusted net income and core operating expenses, provide useful and comparative information to assess trends in our core operations and a means to evaluate period-to-period comparisons. Non-GAAP financial measures disclosed by management, including adjusted diluted EPS, are provided as additional information to investors in order to provide them with an alternative method for assessing our financial condition and operating results. These measures are not in accordance with, or a substitute for, GAAP, and may be different from or inconsistent with non-GAAP financial measures used by other companies.
Core operating expenses is the company’s operating expenses after excluding (i) volume-based expenses, (ii) depreciation and amortization expense, (iii) accelerated stock-based compensation expense and (iv) other unusual or one-time expenses.
Non-GAAP Information
CBOE
400 South LaSalle Street
Chicago, Illinois 60605
www.cboe.com