Embed Size (px)
Citation preview
Marshall & Ilsley Bank
Central Wisconsin Economic Research Bureau
First Quarter 2009 Economic Indicators
Centergy Region
Presented
June 18, 2009
College of Professional Studies
Randy F. Cray, Ph.D. Professor of Economics CWERB Director
Special Report: U.S Health Systems Reform: The Development of Universal Coverage Dr. Edward Miller, Ph.D. Professor of Political Science University of Wisconsin Stevens Point
Scott Wallace, Ph.D. Associate Professor of Economics CWERB Research Associate
Sarah J. Bauer CWERB Research Assistant

TABLE OF CONTENTS
National Economic Conditions ............................................................................................... 1
Table 1: National Economic Statistics .......................................................................... 1 Centergy Region Part I............................................................................................................ 3 Table 2: Unemployment Rate: Centergy Region ........................................................ 3 Table 3: Employment: Centergy Region ..................................................................... 3 Table 4: Sales Tax Distribution: Centergy Region ....................................................... 3 Table 5: Business Confidence: Centergy Region ......................................................... 4 Table 6: Wisconsin Employment Change by Sector .................................................... 4 Figures 1-6 .................................................................................................................... 5 Employment Level; Wisconsin Unemployment Level; Wisconsin Unemployment Rate; Wisconsin; Percent Labor Force; Wisconsin Wisconsin; Manufacturing; Avg. Weekly Earnings Wisconsin; Education and Health Services; Thousands Centergy Region Part II........................................................................................................... 6 Table 7: Employment Change by Sector: Centergy Region ...................................... 6 Table 8: Retailer Confidence: Centergy Region ........................................................ 6 Table 9: Help Wanted Advertising ............................................................................. 6 Table 10: Public Assistance Claims: Centergy Region ................................................. 7 Table 11: Unemployment Claims: Centergy Region ................................................... 7 Table 12: Residential Construction: Centergy Region ................................................ 7 Table 13: Nonresidential Construction: Centergy Region .......................................... 7
Special Report ........................................................................................................................ 9
U.S. Health Systems Reform: The Development of Universal Coverage
CWERB - Division of Business and Economics
University of Wisconsin-Stevens Point Stevens Point, WI 54481
715/346-3774 715/346-2537 www.uwsp.edu/business/CWERB
Association for University Business and Economic
Research

1
TABLE 1 2008 2009 Percent
NATIONAL ECONOMIC STATISTICS First Quarter First Quarter Change
Nominal Gross Domestic Product (Billions) $14,150.8 $14,075.5 -0.5
Real Gross Domestic Product (Billions of 2000 $) $11,646.0 $11,340.9 -2.6
Industrial Production (2002 = 100) 111.6 97.6 -12.6
Three Month U.S. Treasury Bill Rate 1.44% 0.20% -86.5
Consumer Price Index (1982-84 = 100) 213.5 212.7 -0.4
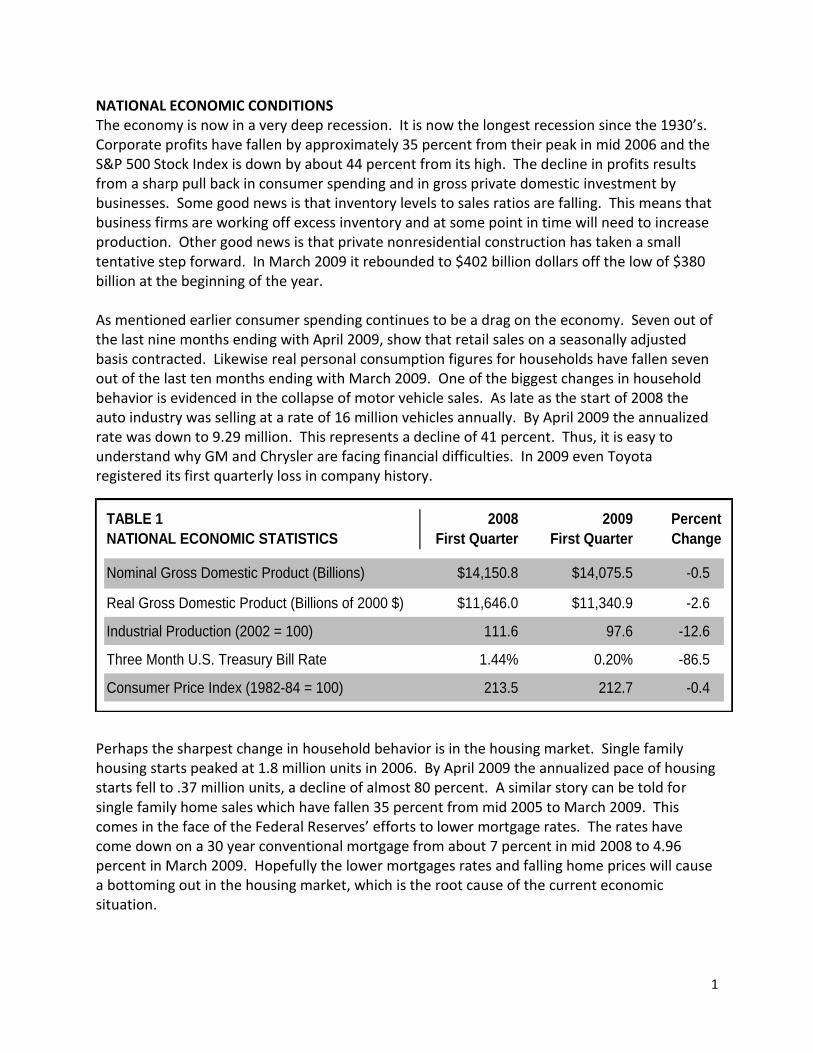
NATIONAL ECONOMIC CONDITIONS The economy is now in a very deep recession. It is now the longest recession since the 1930’s. Corporate profits have fallen by approximately 35 percent from their peak in mid 2006 and the S&P 500 Stock Index is down by about 44 percent from its high. The decline in profits results from a sharp pull back in consumer spending and in gross private domestic investment by businesses. Some good news is that inventory levels to sales ratios are falling. This means that business firms are working off excess inventory and at some point in time will need to increase production. Other good news is that private nonresidential construction has taken a small tentative step forward. In March 2009 it rebounded to $402 billion dollars off the low of $380 billion at the beginning of the year. As mentioned earlier consumer spending continues to be a drag on the economy. Seven out of the last nine months ending with April 2009, show that retail sales on a seasonally adjusted basis contracted. Likewise real personal consumption figures for households have fallen seven out of the last ten months ending with March 2009. One of the biggest changes in household behavior is evidenced in the collapse of motor vehicle sales. As late as the start of 2008 the auto industry was selling at a rate of 16 million vehicles annually. By April 2009 the annualized rate was down to 9.29 million. This represents a decline of 41 percent. Thus, it is easy to understand why GM and Chrysler are facing financial difficulties. In 2009 even Toyota registered its first quarterly loss in company history.
Perhaps the sharpest change in household behavior is in the housing market. Single family housing starts peaked at 1.8 million units in 2006. By April 2009 the annualized pace of housing starts fell to .37 million units, a decline of almost 80 percent. A similar story can be told for single family home sales which have fallen 35 percent from mid 2005 to March 2009. This comes in the face of the Federal Reserves’ efforts to lower mortgage rates. The rates have come down on a 30 year conventional mortgage from about 7 percent in mid 2008 to 4.96 percent in March 2009. Hopefully the lower mortgages rates and falling home prices will cause a bottoming out in the housing market, which is the root cause of the current economic situation.
2
On a brighter note consumers, or households, seem to be a little more optimistic about the economic situation. Surveys by the University of Michigan and the Conference Board suggest an upturn in sentiment. Households seem to be thinking that the economy is near a bottom and should improve later this year. Just recently the National Association for Business Economics Outlook’s panel of 45 economists predicted the recession will end in the second half of 2009. Let’s hope both groups are correct in their assessments that Real GDP, the amount of goods and services produced, will expand. This is welcome news in light of the fact that Real GDP has fallen dramatically, at an annualized rate of over 6 percent during the Fourth Quarter 2008 and the First Quarter 2009. Moreover, it is very likely that the results for Second Quarter 2009 will also be very disappointing. Simply stated households continue to be under a great deal of financial stress. The rise in unemployment and the decline in home values and investment portfolios have taken a toll on consumers. One of the curious facts about recessions is that unemployment rates typically rise even after Real GDP starts to expand. This happens because firms continue to be in a cost cutting mentality even after demand picks up for their products. The U.S. employment rates bottomed out about 4.5 percent in early 2006 and have climbed to 8.9 percent on a seasonally adjusted basis in April 2009. I believe we are most likely to see a continuation in the rise in the unemployment rate and contraction of nonfarm payroll employment into the year 2010. I hope that I am wrong about these important measures of family financial distress; but the historic record suggests that when we are coming out of a recession the unemployment rate and payroll numbers tend to lag the overall economy and take longer to recover. Lastly, the special report by Professor Edward Miller will address changes in the medical services area. This is a very important sector to the U.S. economy and the Centergy Region. To make my point please consider the following. Nationally, medical care expenditures as a percent of personal consumption expenditures by households reached nearly 22 percent in the First Quarter 2009, compared with 13.5 percent in 1982. Moreover, medical care expenditures have risen from about 9 percent of GDP in 1982 to 15.5 percent of GDP in the First Quarter 2009. Even though total nonfarm employment has contracted by 4 percent over the past year, health care employment is actually 2.3 percent higher over the same period. The importance of health care employment is underscored by the fact that health care employment as a percent of total nonfarm employment has risen from 7.6 percent in 1991 to 10.2 percent in April 2009. Any understanding of the future direction of the economy requires an understanding of the role this key industry is likely to play.
3
TABLE 2
UNEMPLOYMENT RATE Unemployment Rate Unemployment Rate Percent
CENTERGY REGION March 2008 March 2009 Change
Centergy Region* 5.0% 9.2% +84.0
Portage County 5.0% 8.2% +65.9
Marathon County 4.8% 9.4% +96.2
Wood County 5.6% 9.7% +74.1
Wisconsin 5.0% 9.4% +87.5
United States 5.2% 9.0% +72.4
*Centergy Region = Marathon, Portage, and Wood Counties
TABLE 3 Total Employment Total Employment Percent
EMPLOYMENT March 2008 March 2009 Change
CENTERGY REGION (Thousands) (Thousands)
Centergy Region* 151.0 146.3 -3.1
Portage County 39.7 39.1 -1.7
Marathon County 72.0 68.5 -4.8
Wood County 39.3 38.7 -1.5
Wisconsin 2,911.8 2,796.1 -4.0
United States 145,108 139,833 -3.6
*Centergy Region = Marathon, Portage, and Wood Counties
TABLE 4 2008 2009 Percent
SALES TAX DISTRIBUTION First Quarter First Quarter Change
CENTERGY REGION (Thousands) (Thousands)
Centergy Region* $5,213.8 $3,001.0 -42.4
Marathon County $2,751.9 $1,545.3 -43.8
Portage County $1,284.7 $768.2 -40.2
Wood County $1,177.1 $687.6 -41.6
*Centergy Region = Marathon, Portage, and Wood Counties
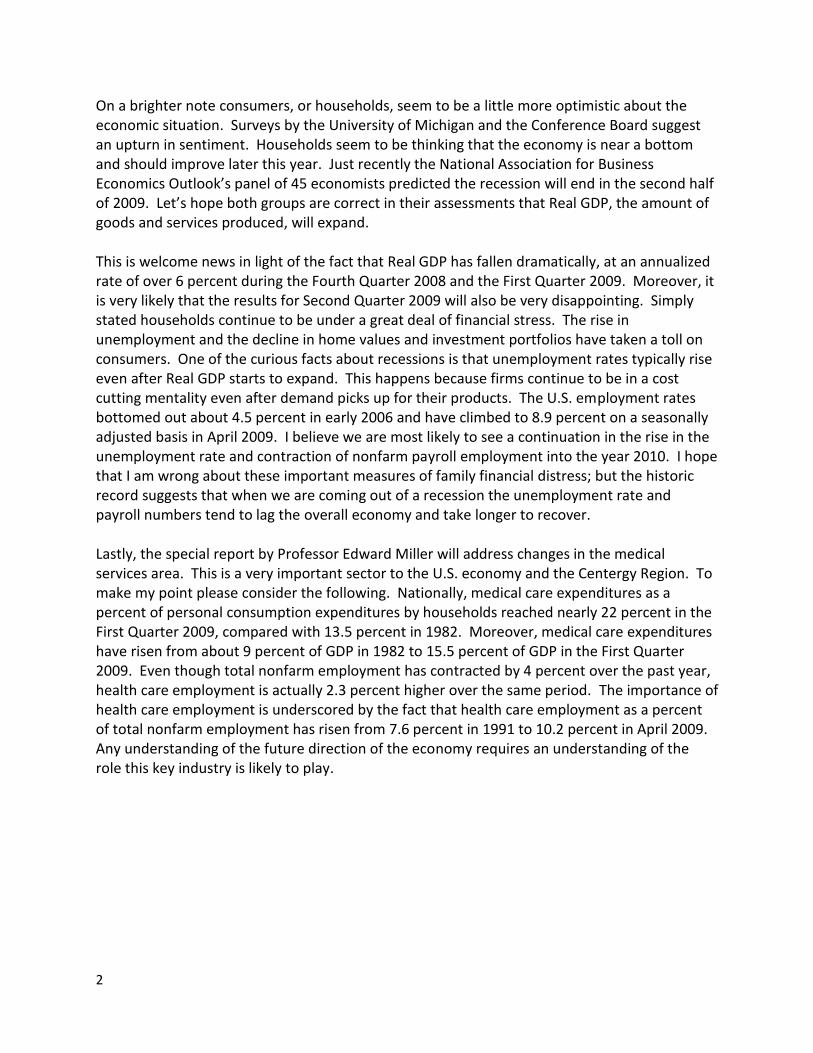
CENTERGY REGION PART I The seasonally unadjusted unemployment rates are given in Table 2. Seasonality is controlled for by comparing this period to last year’s data. The unemployment rate in the Centergy Region is a labor force weighted measure. We see that the unemployment rate in the region rose from 5.0 percent to 9.2 percent over the twelve month period. This represents a substantial increase in the unemployment rate for our region. Likewise the state and nation experienced large increases in unemployment. The unemployment rate for the state rose over the year to 9.4 percent. The nation saw a similar increase rising from 5.2 percent to 9.0 percent. Centergy Region total employment took a large tumble over the year. Adjusted for seasonality, employment in the region fell from 151 thousand to 146.3 thousand over the past twelve months, a decline of 3.1 percent. We also see declines at the state level. Wisconsin employment contracted from 2.9 million to 2.8 million, an actual decline of 115,700 positions, or 4.0 percent. The U.S. fared slightly better losing 3.6 percent of its employment, representing a loss of 5.3 million jobs over the past twelve months.
Sales tax distributions in the Centergy Region took a sharp tumble. This year compared to last saw sales tax distribution fall from $5.2 million to $3.0 million, a decline of 42.4
percent. This decline in retail activity is clearly reflected in the results. Area governments are going to have to scramble to make up for the short fall in this important revenue source.
4
TABLE 5
BUSINESS CONFIDENCE
CENTERGY REGION December 2008 March 2009
Recent Change in National
Economic Conditions
Recent Change in
Local Economic Conditions
Expected Change in
National Economic Conditions
Expected Change in
Local Economic Conditions
Expected Change in
Industry Conditions
Index Value
6 19
44
50
49
50
24 29
42
44
TABLE 6 Employment Employment Percent
WISCONSIN EMPLOYMENT March 2008 March 2009 Change
CHANGE BY SECTOR (Thousands) (Thousands)
Total Nonfarm 2,836.9 2,723.5 -4.0
Total Private 2,409.7 2,290.5 -4.9
Construction & Natural Resources 109.8 93.9 -14.5
Manufacturing 493.8 445.5 -9.8
Trade 424.7 411.0 -3.2
Transportation & Utilities 108.5 101.9 -6.1
Financial Activities 163.0 160.0 -1.8
Education & Health Services 402.5 412.8 +2.6
Information & Business Services 325.9 296.0 -9.2
* Percent change figures reflect data before rounding
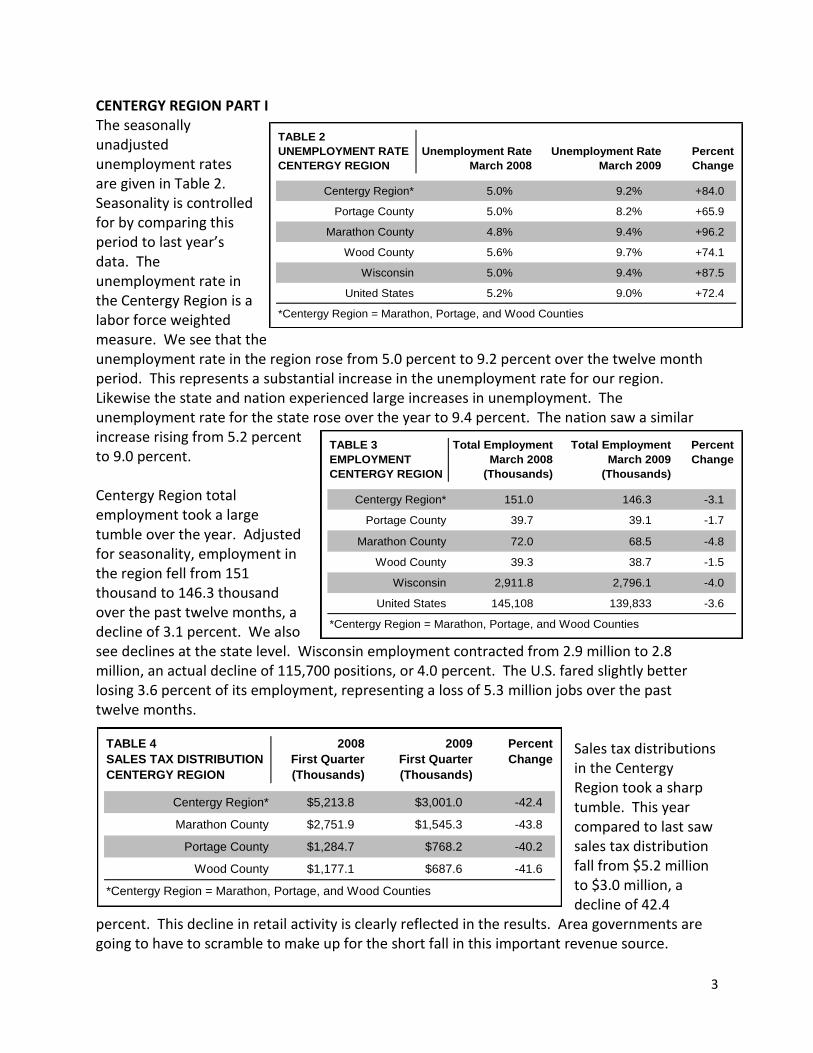
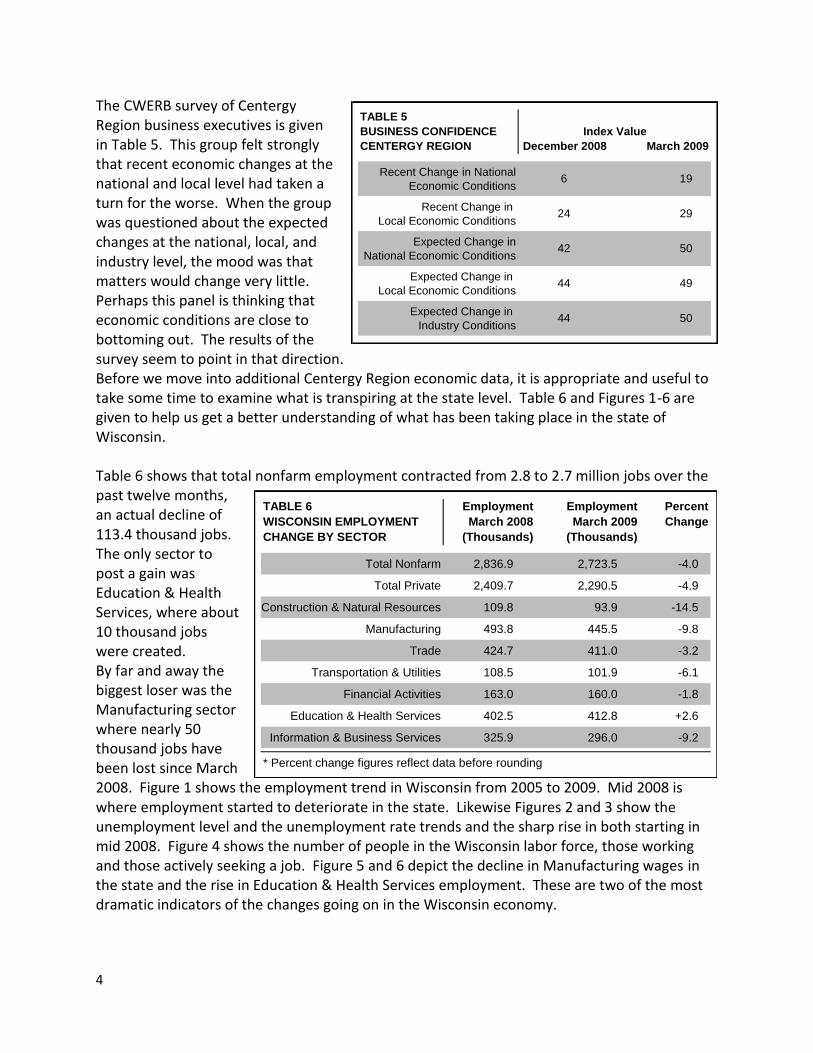
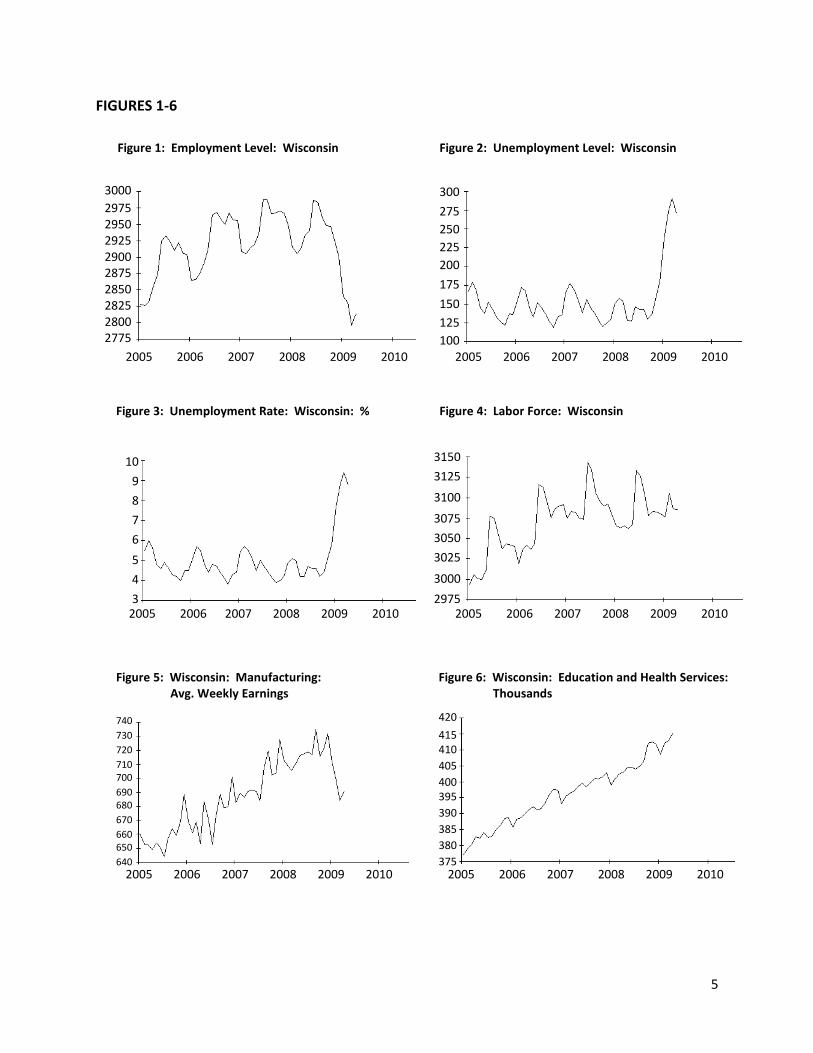
The CWERB survey of Centergy Region business executives is given in Table 5. This group felt strongly that recent economic changes at the national and local level had taken a turn for the worse. When the group was questioned about the expected changes at the national, local, and industry level, the mood was that matters would change very little. Perhaps this panel is thinking that economic conditions are close to bottoming out. The results of the survey seem to point in that direction. Before we move into additional Centergy Region economic data, it is appropriate and useful to take some time to examine what is transpiring at the state level. Table 6 and Figures 1-6 are given to help us get a better understanding of what has been taking place in the state of Wisconsin. Table 6 shows that total nonfarm employment contracted from 2.8 to 2.7 million jobs over the past twelve months, an actual decline of 113.4 thousand jobs. The only sector to post a gain was Education & Health Services, where about 10 thousand jobs were created. By far and away the biggest loser was the Manufacturing sector where nearly 50 thousand jobs have been lost since March 2008. Figure 1 shows the employment trend in Wisconsin from 2005 to 2009. Mid 2008 is where employment started to deteriorate in the state. Likewise Figures 2 and 3 show the unemployment level and the unemployment rate trends and the sharp rise in both starting in mid 2008. Figure 4 shows the number of people in the Wisconsin labor force, those working and those actively seeking a job. Figure 5 and 6 depict the decline in Manufacturing wages in the state and the rise in Education & Health Services employment. These are two of the most dramatic indicators of the changes going on in the Wisconsin economy.
5
FIGURES 1-6
Figure 1: Employment Level: Wisconsin Figure 2: Unemployment Level: Wisconsin
Figure 4: Labor Force: Wisconsin Figure 3: Unemployment Rate: Wisconsin: %
Figure 5: Wisconsin: Manufacturing: Avg. Weekly Earnings
Figure 6: Wisconsin: Education and Health Services: Thousands
2005 2006 2007 2008 2009 2010
3000
2975 2950 2925 2900 2875 2850 2825 2800 2775
2005 2006 2007 2008 2009 2010
300
275
250
225
200
175
150
125
100
2005 2006 2007 2008 2009 2010
10
9
8
7
6
5
4
3
2005 2006 2007 2008 2009 2010
3150
3125
3100
3075
3050
3025
3000
2975
2005 2006 2007 2008 2009 2010
740
730
720
710 700
690 680
670
660 650
640
2005 2006 2007 2008 2009 2010
420
415 410
405
400 395
390
385
380
375

6
TABLE 7 Employment Employment Percent
EMPLOYMENT CHANGE BY SECTOR March 2008 March 2009 Change
CENTERGY REGION (Thousands) (Thousands)
Total Nonfarm 156.3 155.5 -0.5
Total Private 136.0 135.7 -0.2
Construction & Natural Resources 5.4 4.6 -13.6
Manufacturing 27.6 25.7 -6.8
Trade 28.7 27.6 -4.1
Transportation & Utilities 8.5 8.4 -1.8
Financial Activities 11.6 12.0 +3.8
Education & Health Services 23.0 24.4 +6.1
Leisure & Hospitality 12.6 13.1 +4.2
Information & Business Services 18.6 19.9 +7.3
Total Government 20.4 19.7 -3.1
* Percent change figures reflect data before rounding.
TABLE 8
RETAILER CONFIDENCE
CENTERGY REGION Marshfield SP-Plover Wausau Centergy Region Marshfield SP-Plover Wausau Centergy Region
Total Sales Compared
to Previous Year
Store Traffic Compared
to Previous Year
Expected Sales Three
Months From Now
Expected Store Traffic
Three Months From Now
100=Substantially Better 50=Same 0=Substantially Worse
33 33 58
47
40
31 59
27 29 61
54
56
35 36 5843
42
33
27
29 37 60
612933
December 2008 March 2009
Index Value
45
48
47
46
45
43
46
TABLE 9
HELP WANTED ADVERTISING
CENTERGY REGION 2008 2009
Marshfield (September)
Stevens Point 1980=300
Wausau
U.S. (February)
1987=100
1221
Index Value
163 58
CENTERGY REGION PART II Centergy Region total nonfarm employment is given in Table 7. Nonfarm employment in our region fell from 156.3 to 155.5 a loss of 800 jobs or about 0.5 percent of our jobs. Four sectors managed to register some growth. They include Financial Activities, Education & Health Services, Leisure & Hospitality, and Information & Business Services. The other five sectors registered declines in employment. They were Construction, Manufacturing, Trade, Transportation & Utilities, and Government. Table 8 gives the Centergy Region retailer confidence survey. The CWERB survey shows the employment weighted results. Merchants in the Centergy Region believe that total sales and store traffic are lower than a year ago at the same time. The Centergy Region marks for expected sales and store traffic of 46 and 45 indicates that this group does not expect retail matters to improve in the next quarter.
Help wanted advertising in Table 9 shows that the advertising index in the region has dropped from 163 to 58 over the past twelve months. This is a good barometer of the likely direction of the unemployment rate. In other words it is very likely that the unemployment rate will continue its upwards ascent. The U.S. help wanted index also experienced a sharp decline over the period.
7
TABLE 10 2008 2009
PUBLIC ASSISTANCE CLAIMS* First Quarter First Quarter Percent
CENTERGY REGION Total Caseload Total Caseload Change
Centergy Region* 447 522 +16.8
Marathon County 179 172 -3.9
Portage County 84 78 -7.1
Wood County 184 272 +47.8
* Data according to W-2 total caseload (January, February, and March) with
payment placement and without payment placement.
* Centergy Region = Marathon, Portage, and Wood Counties
TABLE 11 2008 2009
UNEMPLOYMENT CLAIMS First Quarter First Quarter Percent
CENTERGY REGION (Weekly Avg.) (Weekly Avg.) Change
New Claims 976 1,674 +71.5
Total Claims 6,977 12,979 +86.0
TABLE 12
RESIDENTIAL CONSTRUCTION 2008 2009 Percent
CENTERGY REGION First Quarter First Quarter Change
Residential Permits Issued 39 14 -64.1
Estimated Value of New Homes (thousands) $10,980.5 $3,648.0 -66.8
Number of Housing Units 109 42 -61.5
Residential Alteration Permits Issued 207 156 -24.6
Estimated Value of Alterations (thousands) $1,964.8 $1,275.4 -35.1
TABLE 13
NONRESIDENTIAL CONSTRUCTION 2008 2009
CENTERGY REGION First Quarter First Quarter
Number of Permits Issued 8 8
Estimated Value of New Structures (thousands) $1,588.0 $6,818.6
Number of Business Alteration Permits 121 97
Estimated Value of Business Alterations (thousands) $10,454.7 $6,487.8
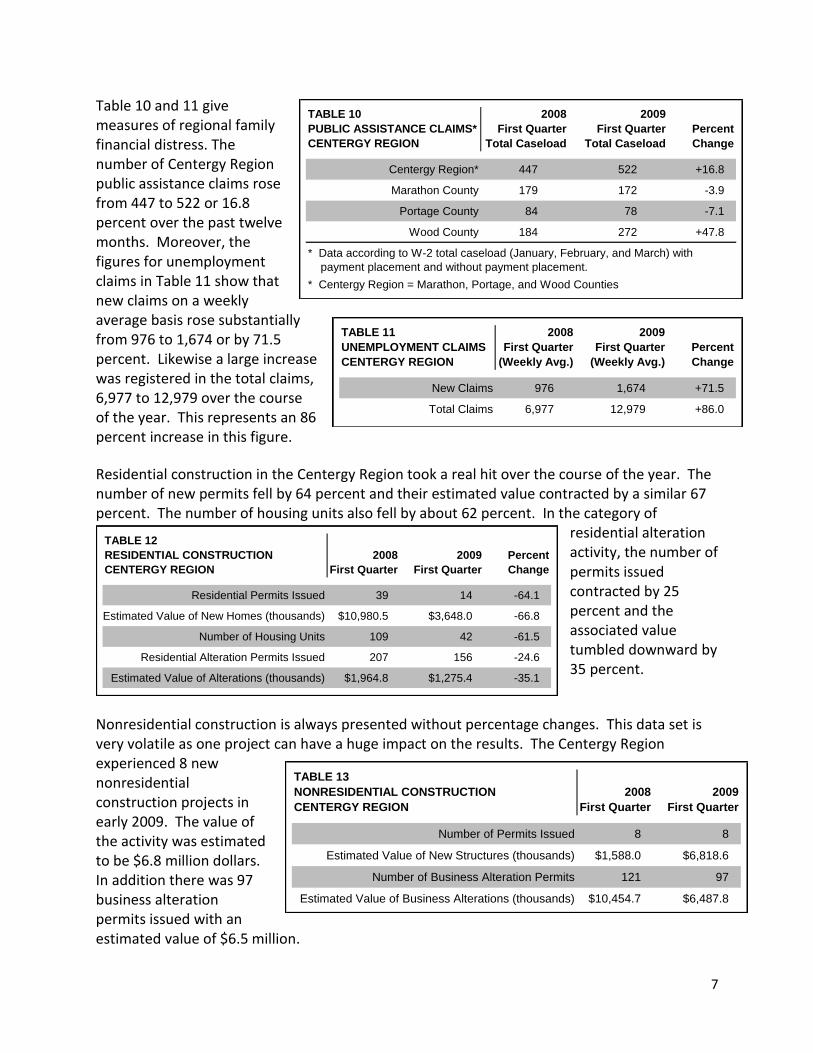
Table 10 and 11 give measures of regional family financial distress. The number of Centergy Region public assistance claims rose from 447 to 522 or 16.8 percent over the past twelve months. Moreover, the figures for unemployment claims in Table 11 show that new claims on a weekly average basis rose substantially from 976 to 1,674 or by 71.5 percent. Likewise a large increase was registered in the total claims, 6,977 to 12,979 over the course of the year. This represents an 86 percent increase in this figure.
Residential construction in the Centergy Region took a real hit over the course of the year. The number of new permits fell by 64 percent and their estimated value contracted by a similar 67 percent. The number of housing units also fell by about 62 percent. In the category of
residential alteration activity, the number of permits issued contracted by 25 percent and the associated value tumbled downward by 35 percent.
Nonresidential construction is always presented without percentage changes. This data set is very volatile as one project can have a huge impact on the results. The Centergy Region experienced 8 new nonresidential construction projects in early 2009. The value of the activity was estimated to be $6.8 million dollars. In addition there was 97 business alteration permits issued with an estimated value of $6.5 million.

8
9
U.S. Health Systems Reform: The Development of Universal Coverage Edward J. Miller, Ph.D. Professor of Political Science University of Wisconsin-Stevens Point HEALTH POLICY ON THE AGENDA OF GOVERNMENT Medical costs and access to medical care are among the top domestic issues that voters feel need to be addressed. In a December 2006 Gallup poll, 69% of the respondents thought that healthcare should be a federal government concern.1 In Gallup’s March 2007 poll, 44% advocated some form of universal coverage with 12% saying that the system should be a government run single payer system. Other respondents said that costs needed to be constrained. In a March 2007 NBC News/Wall Street Journal poll, 52% said they were willing to pay higher taxes for a universal health care system while 42% of the respondents were unwilling to pay more taxes. With health care costs consistently increasing beyond the rate of inflation and the number and percent of uninsured rising, the public wants government action. Even with the severe recession, the Kaiser Family Foundation poll, taken in April 2009, showed that 59% say that health reform cannot wait until the economy improves. However, the lack of consensus on a specific policy approach and the involvement of powerful interest groups have made it impossible for the Congress to enact significant reforms.
Although proposals for government provided health insurance have been proposed since the early part of the 20th century (especially at the time that Social Security was formulated) it was not until 1965 after the Democratic presidential and congressional landslide in the 1964 election that Congress enacted Medicare, health care for seniors, and Medicaid for the poor.2 Medicare is an entirely federal program while Medicaid’s costs are shared between the federal and state governments with states differing as to benefits and provider reimbursements beyond federally established minimums. The last major attempt at the national level to go beyond a targeted population to achieve something approaching universal coverage was in the Clinton administration. Interest group opposition, multiple alternatives, opposition by some to what was perceived to be government control of health care, and the charge that the Clinton program was too complex led to its failure to gain majorities in the legitimization process. Many medical organizations, especially the American Medical Association, view government involvement as a threat to physician independence and income. 3 Following the defeat of Clinton’s program, proposals were enacted to extend medical coverage to vulnerable populations, particularly to children from families with low income (State Children’s Health Care Program, known as SCHIP), but the movement to adopt universal coverage was stymied. A focus on reducing the federal deficit in the 1990s blocked consideration of universal health coverage. Despite the lack of national health insurance, the U.S. government primarily through its Medicare and Medicaid programs still pays 45% of all health care expenses. The largest growth in government reimbursement in recent years was the addition of Medicare Part D, which helps seniors pay for pharmaceuticals. Government coverage of prescription drugs jumped from just 2% in 2005 to 35.5% in 2007, an increase reflecting the implementation of drug coverage as part of Medicare. Thus, health care financing in the U.S. is more accurately described as a “mixed” system than a private one.
10
DEFINING THE HEALTH INSURANCE PROBLEM
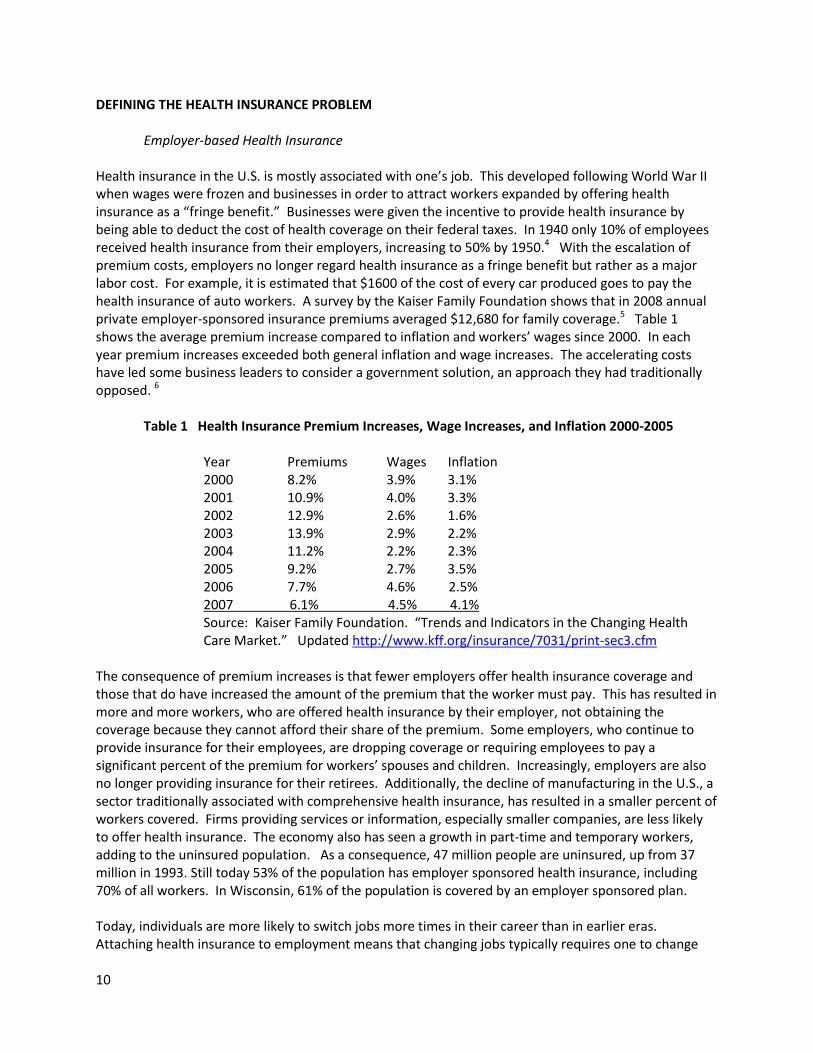
Employer-based Health Insurance Health insurance in the U.S. is mostly associated with one’s job. This developed following World War II when wages were frozen and businesses in order to attract workers expanded by offering health insurance as a “fringe benefit.” Businesses were given the incentive to provide health insurance by being able to deduct the cost of health coverage on their federal taxes. In 1940 only 10% of employees received health insurance from their employers, increasing to 50% by 1950.4 With the escalation of premium costs, employers no longer regard health insurance as a fringe benefit but rather as a major labor cost. For example, it is estimated that $1600 of the cost of every car produced goes to pay the health insurance of auto workers. A survey by the Kaiser Family Foundation shows that in 2008 annual private employer-sponsored insurance premiums averaged $12,680 for family coverage.5 Table 1 shows the average premium increase compared to inflation and workers’ wages since 2000. In each year premium increases exceeded both general inflation and wage increases. The accelerating costs have led some business leaders to consider a government solution, an approach they had traditionally opposed. 6
Table 1 Health Insurance Premium Increases, Wage Increases, and Inflation 2000-2005 Year Premiums Wages Inflation 2000 8.2% 3.9% 3.1% 2001 10.9% 4.0% 3.3% 2002 12.9% 2.6% 1.6% 2003 13.9% 2.9% 2.2% 2004 11.2% 2.2% 2.3% 2005 9.2% 2.7% 3.5% 2006 7.7% 4.6% 2.5% 2007 6.1% 4.5% 4.1% Source: Kaiser Family Foundation. “Trends and Indicators in the Changing Health
Care Market.” Updated http://www.kff.org/insurance/7031/print-sec3.cfm
The consequence of premium increases is that fewer employers offer health insurance coverage and those that do have increased the amount of the premium that the worker must pay. This has resulted in more and more workers, who are offered health insurance by their employer, not obtaining the coverage because they cannot afford their share of the premium. Some employers, who continue to provide insurance for their employees, are dropping coverage or requiring employees to pay a significant percent of the premium for workers’ spouses and children. Increasingly, employers are also no longer providing insurance for their retirees. Additionally, the decline of manufacturing in the U.S., a sector traditionally associated with comprehensive health insurance, has resulted in a smaller percent of workers covered. Firms providing services or information, especially smaller companies, are less likely to offer health insurance. The economy also has seen a growth in part-time and temporary workers, adding to the uninsured population. As a consequence, 47 million people are uninsured, up from 37 million in 1993. Still today 53% of the population has employer sponsored health insurance, including 70% of all workers. In Wisconsin, 61% of the population is covered by an employer sponsored plan. Today, individuals are more likely to switch jobs more times in their career than in earlier eras. Attaching health insurance to employment means that changing jobs typically requires one to change
11
health insurer, providing different benefit levels, restrictions, and physician groups participating in the plan. Unlike markets for consumer goods, employees cannot shop around for health insurance but are restricted to the policy adopted by their employer. Typically the employer in deciding on a health plan for the firm’s employees focuses more on cost than on benefits.
Lack of Health Coverage Hits Minorities the Hardest Minorities are less likely to have employer sponsored health insurance. In 2005 while 69% of whites were covered by their employer, only 40% of Hispanics and 48% of African Americans were. Among minority groups, Hispanics were least likely to be insured by either an employer or Medicaid or other public program. About one-third of the Hispanic population had no insurance, closely followed by Native Americans at 30%. For African-Americans, 21% had no insurance in contrast to 12% for whites.7 Without health insurance, these individuals are less likely to see a doctor regularly, delaying diagnosis and treatment of conditions until they are at a more advanced stage. Lacking health insurance, these individuals are more likely to seek medical attention in hospital emergency rooms, a costly venue to receive care, where the continuity of care that could be received from a regular physician is lacking. The life span for minorities is shorter than that for non-Hispanic whites with diseases such as diabetes and high blood pressure. Thus on average an African-American at birth in 2004 could expect to live 73.3 years while the average life expectancy for whites was 78.3 years. Access to prenatal care is less, leading to higher rates of premature, low-weight babies, and higher infant mortality. For African-Americans, infant mortality was 13.65 per 1,000 live births in 2004 while for whites it was 5.65 per 1,000 live births. While 88.9% of non-Hispanic whites received prenatal care in their first month, only 76.5% of African Americans did. 8
Hispanics face multiple access problems. A smaller percentage are insured, they tend to live in areas with fewer physicians, and Hispanics face cultural and language barriers in receiving care. The U.S. Office of Minority Health has issued cultural and linguistic standards to try to meet this problem.9 However, the limited availability of translators, especially in physicians’ offices, impedes doctor-patient interaction. Some communities have experimented with “patient navigators” to assist minority populations, such as Hispanics and Hmong, to make and keep appointments, especially if there are multiple providers that must be seen such as with cancer; and to ensure these populations understand how they need to take their medications.10 In 2005 Congress enacted a national patient navigator program, but little funding was provided for the program in President Bush’s budget. Senator Menendez (D., NJ) and Rep. Deborah Price (R, Ohio) urged the Secretary of Health and Human Services to use discretionary funds for the program.
Underinsured Population
In addition to the uninsured population there are a large number who are underinsured. Although these individuals have health insurance, their insurance has significant limits. Common is a life-time limit, which can be reached relatively quickly for a significant disease or injury. Further, coverage for services for mental illnesses often had been less than those covered for physical problems. A federal requirement for parity for mental health treatment, enacted in the 1990s, had expired but a new parity act, with broader coverage, was signed by President Obama.
Another problem has been insurance companies denying coverage of conditions that individuals had prior to obtaining the insurance. Treatments for these preexisting conditions have often been excluded
12
from coverage under the new policy or a waiting time is imposed. The Health Insurance Portability and Accountability Act, passed in 1996, requires that if a person who has a condition changes jobs, the new insurer cannot exclude conditions that were covered by the individual’s previous employer. However, there are still individuals seeking individual policies with exclusions. A further problem, especially for those with lower incomes, is that many policies require the patient to pay a co-payment and/or a deductible for physician visits and services. These can be significant. For example, if the patient must pay 20% of a hospitalization, this could easily run into thousands of dollars. Individuals with catastrophic only policies would also be responsible for considerable expense before the insurance pays any charges. Studies have shown that cost sharing reduces or delays seeking medical services, which can lead to more complicated problems.11 A large percent of personal bankruptcies are due to medical expenses.
The Escalating Costs of Health Care A principal reason for the increases in health insurance premiums is the rapid rise in health care costs. In the U.S. the health sector comprises 16% of the Gross Domestic Product (GDP), which represents all goods and services produced in the country. This is far more than other nations. Switzerland and Germany are the closest at around 11% of their GDP. At the current rate of growth, health care is projected to be 20% of GDP in the U.S. by 2015. It should be noted that Americans do not necessarily receive more health services than other development nations. Because the metric is in currency, the higher cost of health care in the U.S relative to other services leads to the greater GDP percent spent on health than other nations. When quality of health care based on outcome measures is compared among nations, the U.S. scores lower than many other countries despite the myth of the best health care in the world. Advances in technology, new treatments and drugs, increases in malpractice costs, and the aging of the population are among the reasons for the increases in health care costs. Most notable in the U.S. is the large administration cost associated with health care and health insurance, far larger than single payer plans such as Canada’s.12 Multiple insurers and extensive billing operations are responsible for the significant cost of administration. About 30% of total expenditures go to hospitals with 21% to physician services, and 10% for pharmaceuticals. The public often places more emphasis on drug costs, despite their percent of total costs, because individuals are less likely to have insurance covering drugs than hospitals or physicians. Government has struggled with the problem of health cost escalation. In Medicare, the federal government changed how hospitals and physicians are paid in an attempt to limit costs. For hospitals, the basis of reimbursement was changed in 1983. Rather than paying hospitals essentially what the hospital billed for seniors on Medicare, Medicare now pays hospitals a specific amount based upon the problem for which the patient was admitted. The problem classification is known as Diagnostic Related Groups (DRGs) in a system called the Prospective Payment System, meaning that the payment determination was made at the time of admission, rather than looking back over the charges incurred, a retrospective system. The idea was that cost would be contained because hospitals no longer would make more money if a patient stayed longer.13 The incentive would be to discharge the patient as quickly as possible, thus reducing costs. Data show that this is exactly what happened. The average number of days in the hospital fell significantly in the 1980s. In payment for physician services, Congress had essentially made a deal with physicians when Medicare was enacted in 1965 to pay for services based upon typical fees, known as customary and usual fees. However, by the early 1990s the cost of physician services had increased and there was a strong belief
13
that services involving interventions, such as surgery and invasive tests, were being paid too much and those involved with physicians examining patients and making diagnoses were being reimbursed too little. The law was changed and physicians are now paid on the basis of a fee schedule, known formally as Resource-based Relative Value Scale (RBRVS).14 Change in the way the fee schedule was calculated was included in the 1997 Balance Budget Amendment, which would have resulted in some reduction in fees. However, lobbying by physician groups, especially the American Medical Association, have convinced Congress to enact delays in the implementation of this change. In an attempt to reduce costs to non-Medicare patients, President Nixon supported legislation that encouraged the formation of Health Maintenance Organizations (HMO), which would pay physicians a fixed fee per year to take care of a patient.15 The HMO concept has its origins in the 1920s in the development of the Farmers-Union Cooperative Health Association in Elk City, Oklahoma, and the Ross-Loos Clinic in Los Angeles.16 Kaiser-Permanente Health Plan, originating in California, is probably the best known HMO. With prepaid health care (capitation), the concept was that by not having a reimbursement plan tied to the number of services, physicians would only order necessary tests and services. Providing cost efficient care became known as “managed care” and was intended to constrain costs. In addition, the thought was that if care were prepaid rather than serviced based, physicians would give more attention to preventive medicine because by preventing problems, fewer services to treat sick patients would be needed. In the decades since its expansion, managed care though successful in restraining costs by reducing hospital stays has received strong criticism from patients. HMOs often require patients to get approval from the organization before having costly tests (such as MRIs); mandating that patients get a referral from their primary care doctor, acting as a “gatekeeper,” before seeing a specialist; and restricting the number of days a patient can be admitted to a hospital for a particular problem. Tight restrictions resulted in a backlash with patient dissatisfaction and physicians concerned that their professional judgments were being limited.17 Reacting to concerns of patients, states enacted laws protecting patients’ rights. For example, many states passed a “prudent layman” rule. The rule states that if to a prudent layman, a condition seems to require emergency care, the health insurer is required to pay for treatment in a hospital emergency department regardless of the ultimate diagnosis. A more comprehensive federal “patient bill of rights” was blocked over the issue of whether patients, denied service, would have a right to sue their HMO, which currently they do not have. For Medicare the federal government had been reluctant to enter the prepaid mode of reimbursement. However, the Bush Administration supported this approach and has encouraged the prepaid option in Medicare, known as Medicare Advantage. Medical organizations were less willing to offer the Advantage Plan option until the Medicare Modernization Act in 2003 increased yearly payments. Medicare beneficiaries have the option of joining these plans, which substitute for traditional Medicare and a supplemental policy, which pay charges not covered by Medicare. In Medicaid, many states require enrollees to receive care from a managed care organization. Other regulatory approaches have been used to restrain costs. One frequently adopted policy is requiring hospitals to obtain a certificate of need from a state sponsored planning committee to build new or expand existing facilities, to purchase expensive new equipment, or to begin to provide new services such as heart bypass surgeries. The purpose of this requirement is to avoid duplicative services or overbuilt facilities, resulting in excess costs. Until the early 1980s, the federal government required
14
states to have certificate of need requirements (CON), but under President Reagan this federal mandate was eliminated and a significant reduction in federal money for health planning occurred. Some states chose to retain this regulatory approach. 18 Although the certificate of need regulation had a compelling logic to it, evaluations were negative. One problem that CON encountered was that agencies were often captured by health interest groups, especially hospital associations, which would freely grant approvals.19 Further barriers to cost reductions were that hospitals controlled the information provided planning agencies and that by restricting the facilities, services, or equipment available, an oligopoly, if not a monopoly, situation arose leading to higher costs, the reverse of the regulation’s intention.20 States have also worked to control costs by establishing a requirement that hospitals seek regulatory approval before they could increase their rates. This approach is used for public utilities, such as for electric companies, considered to be natural monopolies. Wisconsin’s hospital rate setting commission was considered highly successful in constraining hospital cost increases. However, with the advent of more conservative forces in the 1980s in Wisconsin, the rate approval requirement lapsed, followed by a wave of increases. THE OBAMA ADMINISTRATION With extending heath coverage a leading priority in the campaign, President Barack Obama and the Democrats in Congress took several actions. Of prime importance was the reauthorization of the State Child Health Insurance Program (SCHIP), which had been vetoed by President Bush because he disagreed with the eligibility criterion. Bush argued that the compromised bill, which extended eligibility to children in families with incomes up to 300% of the poverty line, was too high and would result in families canceling private health insurance for their children in favor of SCHIP, a phenomenon known as “crowding out.” In emphasizing the importance of providing health insurance for children, Obama signed the bill soon after coming to office. In addition as part of the government response to the severe recession and rising unemployment, Obama recommended and ultimately signed legislation that provided 65% government subsidy of COBRA coverage of those losing their jobs who can continue their employer sponsored health insurance and broadened the eligibility of the unemployed for Medicaid. As noted above, Obama also signed a bill that reinstituted mental health insurance parity. Unlike the elaborate and failed health insurance reform plan submitted by President Bill Clinton, the Obama administration pushed more of a reform framework that the president hopes to develop with members of Congress. Obama has strongly emphasized the need to consult with interest groups and consumers to develop a widely accepted proposal in contrast to Clinton’s approach where the managed competitive program was based upon the work of health policy specialists and formulated in the Executive Office of the President. Congressional committees have established a short timeline for the passage of a bill. The heart of the Obama framework is the use of private insurers, who would provide insurance through a government administered hub in which insurers would compete for business and would act in administering payments, an institution similar to that developed by former Governor Mitt Romney in Massachusetts. Businesses above a specified size would be required to provide health insurance or pay a fee, the pay or play alternative. Although businesses have an option to provide insurance, individuals may be required to have health insurance or at minimum be required to insure their children, the latter alternative was the Obama position in the campaign in contrast to Hillary Clinton’s universal health insurance requirement. Government subsidies would be provided to low income individuals to help them purchase insurance. Insurance offered would be community rather than experience rated, which
15
may be stratified by factors such as age. The law would prohibit excluding preexisting conditions, which is now the law for those moving from one group plan to another under HIPPA enacted in 1996, but not applicable to individual or new group coverage. Most controversial is whether a choice available would be a government plan. Insurers argue that a government plan would be so favorable that most individuals would choose that plan, resulting in the establishment of a single payer plan by the backdoor. Insurance companies further contend that they would accept stratified community rating and no exclusion of preexisting conditions provided that they have the volume to spread the risk. The availability of a government plan would make it difficult for them to meet these conditions. One compromise being suggested is that a government plan would only be implemented if there were not private plans available that meet specified requirements. Integral to the passage and success of health care reform is financing the plan. The Obama administration has stressed that in order to finance the plan and to reinvigorate the economy, health care cost containment is essential. The continued escalation in health care costs, exceeding both inflation and economic growth for most years, is unsustainable. First and foremost in containing cost are greater adoption of treatments that work and use of appropriate tests known as “evidence-based medicine.” Studies have shown that nearly half of all treatments diverge from medical research findings and are not recommended. Central to reducing costs in the long run and greater application of evidence based medicine is the electronic medical record (EMR). This application of information technology, when done correctly, would not only give physicians easy access to a patient’s history and tests, (even when ordered by other providers) but would also prompt doctors as to the correct tests to run and question inappropriate, interactive, or incorrect drug doses. The EMR is often cited both in terms of improved medical efficacy and cost savings; however, others note that the huge cost of installing and maintaining these systems and the additional preventative measures prompted could cancel cost savings, at least for the next decade. A further Obama proposal is to reduce Medicare reimbursements to hospitals that have high readmission rates, suggestive of a lack of quality. In an experiment, Marshfield Clinic was one of the few medical institutions that met the Medicare quality benchmarks and was rewarded with higher reimbursements as an incentive to review and maintain quality controls. The intent of pay for performance plans is to improve medical care and reduce costs. A further savings that Obama included in his budget is the reduction in capitation payments for Medicare Advantage Plans. The plans, also known as private Medicare, receive a fixed payment per year for each Medicare patient enrolled. Enrollees are covered for Medicare services and other services typically covered by a Medicare supplemental policy. However, there were many complaints that the capitation payment, calculated at 95% of the average cost of Medicare recipients, was too low. In Wisconsin, several ended their plans in the Milwaukee area as a consequence of what the insurers said were inadequate payments. As part of the Medicare Modernization Act of 2003, Medicare Advantage plans had their reimbursement increased, resulting in the expansion of these policies. Today, the Office of Management and Budgets estimates that they pay 14% too much. Thus the Obama budget seeks to reduce these costs by having these plans put in a bid in each area, a competitive market approach to contain costs.
Other methods of financing the plans being suggested are even more controversial. Especially contentious is the idea to limit charitable and itemized deductions to 28% tax bracket for those earning more than $250,000. Opponents believe this would reduce charitable giving, make its passage dubious. Taking an idea offered by the conservative Heritage Foundation, George H. Bush, and John McCain, Obama suggested the possibility of limiting the tax exemption for employer sponsored health insurance.
16
The rationale is that this would both produce revenue needed to expand coverage and limit health plans that have paid for most medical expenditures, using the power of the market to make consumers more discerning in the purchase of health services. This exemption limitation would be consistent with the goals of the consumer driven health care movement. Some have suggested that the exemption’s limitation should be based upon the employee’s income while others suggest that the exemption should be based upon the value of the insurance. Either opinion is controversial but seems to be still viable in congressional deliberations.
A further source of revenue may be taxation of hospitals. It has been widely noted that many non-profit hospitals that are exempt from federal taxes provide charity care to only a small percentage of patients treated. The broadening definition of how these hospitals could provide community service to be considered non-profit resulted in their ability to reduce the amount of charity care provided. Thus it was suggested that unless they provide a given amount of charity care, they would have to pay taxes, which would help with revenues needed to finance broader coverage. Moreover, charity care would be needed only for the small number of people who “fell through the cracks” since most individuals would now be covered by insurance that would pay hospitals. Uncompensated care would significantly drop. In Canada, for example, their universal health system results in hospitals and physicians knowing that they would be paid for all services, eliminating the need to shift costs, a process endemic in the U.S. PROSPECTS There are a number of advantages in passing a health care bill this year. Especially important is that both the president and vice president are former members of Congress, giving them an advantage in understanding strategy and personally knowing members of both parties. President Clinton was at a particular disadvantage in never having been a legislator. Although Vice President Gore was, it was Hillary Clinton who lobbied for the bill and at the time she also had no legislative experience. Learning from the experience of the Clinton administration, Obama brought both members of Congress and various groups into the initial formulation. Although the cost of health insurance was significant in the early 1990s, 15 years later it has proven to be a major burden on businesses and individuals. Some smaller businesses, which had provided health insurance, no longer do or only provide it to the worker and not the worker’s dependents, who in some cases could buy in if they paid the full cost. Where insurance is provided, an increasing number of workers cannot afford the higher premiums, thus being unable to pick up the insurance offered by their employers. The situation is ripe for businesses to support health insurance reform. Providers, who once feared government and opposed government involvement, are increasingly exasperated in dealing with insurance companies: having to resubmit bills, justify treatments, and have reimbursements cut or denied. Even Medicare has become a burden. An increasing number of physicians have decided to not deal with insurance companies or Medicare and establish “boutique” practices. Others, who still file insurance and Medicare claims, are now willing to see a major transformation of the health insurance system, including the possibility a single payer plan. The national political situation also provides a window of opportunity to the passage of a health reform bill. A new administration with a Democratic majority in both houses provides an opportune time to submit major new programs. Medicare and Medicaid were similarly enacted after the landslide 1964 election. The economic crisis provides urgency to the enactment as more people lose health insurance and firms/individuals are less able to pay for the insurance they have. With greatly enhanced spending
17
throughout the government to meet the severe recession, spending on a revamped heath insurance system is more palatable, especially if coupled with the argument that the current health insurance increases are unsustainable and that spending up front for the transformation will ultimately result in long term cost containment. On the other hand, prospects are dimmer if insurers, pharmaceutical companies, physicians, and hospitals make demands that they are unwilling to give up or compromise. A politically acceptable package will then be hard to develop. One example is whether a resolution over the availability of a government plan can be reached. Although this appears to be a zero-sum issue, it is conceivable that insurers could agree to a government plan that they administer similar to Medicare. Another large roadblock rates to funding. Several proposals such as a tax on employer sponsored health insurance for either high income taxpayers or high end policies will probably not be enacted. Others such as limiting itemized and charitable deductions for high income taxpayers may be a possibility. If ultimately funding is inadequate, a reformed health insurance system will be defeated. In this case, some portion of it may survive in incremental changes similar to that which occurred in the Clinton administration. Several other contentious issues will need to be addressed. One key issue is the role of state regulation. Currently, states mandate services that need to be covered by health insurance. Most likely the federal government will require a basic package, but could states require additional services? One problem noted with the plan advocated by John McCain in the 2008 campaign is that he would have allowed cross state sales of insurance, resulting in insurers being able to write policies based in states with minimum requirements. Although Democrats now have majorities in both houses, more conservative Democrats may not go along with the ultimate proposed plan. Thus, some Republicans will need to join the effort. Despite Obama’s attempts to gain bipartisan support for his proposal, Republicans, as illustrated in the passage of the stimulus package and budget, have refused to vote for the bills. Similar partisan opposition could doom the reform effort. If comprehensive reform does not take place this year, one Clinton recommendation that was not enacted during his term could be considered. This would be an earlier buy-in to Medicare, especially important for individuals below 65 who have retired without health insurance or have lost their job. As the economy improves, action would again shift to the states, where health reform had begun to gain traction. WISCONSIN Under Governor Thompson, Wisconsin enacted Badger Care, which allowed for the coverage of parents whose children were insured under Medicaid. Governor Doyle’s proposal to extend this to lower income individuals without children, known as Badger Care Plus, was approved during the 2008 legislative session and is being implemented this year. Several proposals to more significantly overhaul health insurance coverage have been discussed for several years, including a single payer system and one called “Healthy Wisconsin.” Healthy Wisconsin is a plan, a version of which had been approved by the state Senate in 2007, is based upon state employees’ health insurance.21 Similar to the state plan, there would be a minimum benefits package that all insurers must meet or exceed. However, unlike the state plan, employees would have to pay a percentage of their income with the social security tax maximum as a ceiling. (State employees
18
now pay a fixed amount regardless of income.) All businesses would also have to pay a specified percentage based upon the income of the employee. Businesses could choose and unions could negotiate contracts whereby the employer pays a percent of the employee’s premium. The percentage of salary contribution for employees is estimated to be from 9% to 12% and the employee’s portion 2% to 4%. The ceiling upon which payments would be based ($106,800 in 2009) would be a pooled amount for both spouses if married. For the average family ($42,000 a year), the estimated cost would be $140 a month payroll deduction. If the individual chooses a plan with more coverage, then that person would be responsible for any additional premium, which will be capped depending on the number of competing plans in the region. Employees with incomes below 150% of the Federal Poverty Line (FPL) would not have to pay into the plan while those between 150% and 300% would pay based on a sliding scale. Individuals will have the choice of network alternatives, which is defined as a coordinator of a group of primary care, specialty providers, and hospitals, in a region or of a state-wide fee for service plan. Except for children for which there is no deductible or co-pay, the yearly deductible would be $300 per person with a co-pay of $20 per physician visit or hospital admission. Total out of pocket expenses would be capped at $2000 per adult and $3000 per family. Preventative care would not be subject to co-pay. Pharmaceuticals would be included in the plan with co-pays of $5 for generics and $15 for brand names. By harnessing the large purchasing power of the group, savings should be achieved on drug expenditures. With the considerable expenses of a federal plan and the dire fiscal shape of the state, it is doubt that a state plan will be enacted this year.
19
1 Gallup Poll. http://www.galloppoll.com. Accessed 05/2/2007
2 Paul Starr. The Social Transformation of American Medicine. New York: Basic Books, Inc., 1982. pp. 369-370.
3 Julius B. Richmond and Rashi Fein. The Health Care Mess. Cambridge, Mass.: Harvard University Press, 2005. p.
130. 4 Nick Timiraos, “Health Care: Time for Universal Coverage.” Wall Street Journal. June 2, 2007. p. A9.
5 Kaiser Family Foundation. “Trends in Health Care Premiums.” http://www.kff.org/insurance/7031/print-
sec3.cfm. Accessed 05/24/2007. 6 Jackie Calmes. “ Why Health Care No Longer Makes Politicians Leery.” The Wall Street Journal. May 30, 2007.
p. A1. 7 The Henry J. Kaiser Family Foundation. Key Facts: Race, Ethnicity, and Medical Care. Jan. 2007.
http://www.kff.org/minorityhealth/upload/6069-02.pdf. Accessed 5/24/2007. 8 Center for Disease Control (CDC) Health United States, 2006. 2006 Table 7
http://www.cdc.gov/nchs/data/hus/hus06.pdf 9 Office of Minority Health. (OMH) National Standards for Culturally and Linguistically Appropriate Services in
Health Care Final Report, OMH, 2001. 10
For the role of patient navigators, see the National Cancer Institute at
http://www.cancer.gov/cancertopics/factsheet/PatientNavigator. Accessed: 07/09/2007. 11
Thomas S. Bodenheimer and Kevin Grumbach. Understanding Health Policy: A Clinical Approach. New York:
Lange Medical Books/McGraw-Hill. 2002. pp. 22-25. 12
Steffie Woolhandler., Terry Campbell., and David U. Himmelstein. “Costs of Health Care Administration in the
United States and Canada.” N. Eng. J. Med. 349:768-775, August 21, 2003. 13
Kant Patel and Mark Rushefsky. Health Care Politics and Policy in America. Armonk, NY: M.E. Sharpe, 2006.
pp. 153-155 14
Patel and Rushefsky, pp. 155-156. 15
HMO Act of 1973 16
Jan Gregoire Coombs, The Rise and Fall of HMOs. Madison, WI: The University of Wisconsin Press, 2005, pp. 3-
4. 17
Walter A. Zelman and Robert A. Berenson, The Managed Care Blues & How to Cure Them. Washington, D.C.:
Georgetown University Press, 1998. pp. 102-118. 18
Required by The National Health Planning and Resource Development Act of 1974 (PL 93-641) 19
John Goodman. The Regulation of Medical Care: Is the Price Too High? San Francisco: Cato Institute, 1980. 20
Patel and Rushefsky, pp. 235-236. 21
HealthyWisconsin.net. http://healthywisconsin.net/Healthy_Wisconsin_The_Deta.html