Embed Size (px)
Citation preview

Author Contact: Donna Feir, Dept. of Economics, University of Victoria, P.O. Box 1700, STN CSC, Victoria, B.C., Canada
V8W 2Y2; E-mail: [email protected]; Voice: (250) 721-8533; FAX: (250) 721-6214
Department Discussion Paper DDP1802
ISSN 1914-2838
FIRST PEOPLE LOST: DETERMINING THE STATE OF STATUS FIRST NATIONS MORTALITY IN CANADA USING ADMINISTRATIVE DATA
Randall Akee Department of Public Policy, University of California, Los Angeles
Los Angeles, California., United States 90095-1656
&
Donna Feir Department of Economics, University of Victoria
Victoria, B.C., Canada V8W 2Y2
February 2018
Abstract
We present the most comprehensive set of estimates to date for Status First Nations mortality in
Canada. We use administrative data from Indigenous and Northern Affairs Canada to establish a
set of stylized facts regarding Status First Nations mortality rates from 1974 to 2013. Between
2010 to 2013, the mortality rates of Status First Nations men and boys are highest in nearly all
age groups considered with the exception of Status girls between the ages of 10 to 14. On
reserve, Status boys between the ages of 15 to 19 have mortality rates nearly four times that in
the general population, while Status girls between the ages of 15 to 19 have mortality rates five
times that in the general population. We demonstrate substantial regional variation in mortality
rates which are correlated with economic factors. We document that there has been no
improvement in mortality among Status women and girls living on-reserve in the last 30 years
and relative mortality rates for all Status people on-reserve has not changed in 40 years.
Mortality rates may be worsening among some age groups.
Keywords: Mortality, First Nations, Native American, Status First Nation, gender bias JEL Classifications: J15, J16, I15, I14

First People Lost: Determining the State of Status FirstNations Mortality in Canada using Administrative Data
Randall AkeeDepartment of Public Policy
University of California, Los [email protected]
Donna FeirDepartment of Economics
University of [email protected]
February 14, 2018
Abstract
We present the most comprehensive set of estimates to date for Status First Nationsmortality in Canada. We use administrative data from Indigenous and NorthernAffairs Canada to establish a set of stylized facts regarding Status First Nationsmortality rates from 1974 to 2013. Between 2010 to 2013, the mortality rates ofStatus First Nations men and boys are highest in nearly all age groups consideredwith the exception of Status girls between the ages of 10 to 14. On reserve, Statusboys between the ages of 15 to 19 have mortality rates nearly four times that in thegeneral population, while Status girls between the ages of 15 to 19 have mortalityrates five times that in the general population. We demonstrate substantial regionalvariation in mortality rates which are correlated with economic factors. We docu-ment that there has been no improvement in mortality among Status women andgirls living on-reserve in the last 30 years and relative mortality rates for all Statuspeople on-reserve has not changed in 40 years. Mortality rates may be worseningamong some age groups.
Keywords: Mortality, First Nations, Native American, Status First Nation, gender bias.JEL classification:J15, J16, I15, I14
Acknowledgments. We would like to thank two anonymous referees for invaluable feedback.
We would also like to thank Siwan Anderson, Patrick Button, Pascal Courty, David Green,
Robert L. A. Hancock, Stephen Hume, Anke Kessler, Eric McGregor, Kevin Milligan, David
Scoones, Manisha Shah, Erin O’Sullivan, Steven Stillman, Jacqueline Quinless and all those
who commented on this work along the way. We would also like to thank Statistics Canada’s
Research Data Centers Staff and Indigenous and Northern Affairs for the access they granted
to the data. Any errors or omissions are ours alone.

1 Introduction
Avoiding an early death is one of the greatest advantages of being born in a wealthy
country (Deaton, 2013). However, this advantage is not shared equally. In Canada there
is evidence of substantial health disparities between First Nations peoples and the general
population, but existing statistics are at best sparse (Truth and Reconciliation Commis-
sion of Canada (TRC), 2015, p 161). In this work we provide the most comprehensive
analysis of the patterns and trends in mortality rates for the largest First Nation’s pop-
ulation in Canada – Status First Nations – to date.1 We do this by using administrative
data from Indigenous and Northern Affairs Canada (INAC) from 1974 to 2013 which, to
our knowledge, is the most complete and consistent source of First Nations vital statis-
tics data available. Our goal in this work is to provide a benchmark set of stylized facts
on Status First Nation’s mortality in Canada that can be used for future academic and
policy research.
This work was conducted in response to the recent calls in Canada for reconciliation
between Indigenous and non-Indigenous peoples by the Truth and Reconciliation Com-
mission of Canada: the commission called for all Canadians to contribute to the process
of reconciliation and called for the establishment of comprehensive measures of well-being
for Indigenous peoples (TRC, 2015, p 161). The commission also called for cooperation
between the federal government and Indigenous groups to establish measurable goals to
identify and close the gaps in health outcomes between Indigenous and non-Indigenous
communities and to publish annual progress reports and assess long-term trends (TRC,
2015, p 322). It is our hope that this work helps to establish a foundation for the dialogue
and that it takes a step towards establishing comprehensive measures of well-being for
Indigenous peoples.
Using administrative data on births and deaths for Status First Nations people that
1“Status First Nations” are individuals who are governed explicitly under the Indian Act as “Indians”.“Indian Status” is determined through genetic relation to the first peoples classified by the federalgovernment as “Indians.”
1
includes information on the gender, age, band of membership, and whether an individual
resides on or off reserve, allows us to create measures of mortality rates at the national
level and by location on and off reserves. We also link patterns in mortality over time,
and at the regional level, with data available from the 1991-2006 Canadian Census and
2011 National Household Survey.2 With this data we make three main contributions:
1) we provide the first national and regional level estimates of mortality among Status
youth; 2) we provide the first modern estimates of how Status mortality rates differ by
reserve residence and province and the correlation with province-level economic factors;
and 3) we provide the first description of how Status mortality rates have changed since
the 1970s and how this is correlated with economic changes and to changes in Status
First Nations definitions. Despite the relative simplicity of our analysis, we find striking
and unsettling results.
We begin by confirming the findings of earlier, less comprehensive studies using our
data: age-standardized mortality is higher for Status males than Status females, and Sta-
tus First Nations age-standardized mortality are always higher than for the general popu-
lation. Using the most recent data available, 2010 to 2013, we find that age-standardized
mortality rates are close to twice that of the general population. However these aggre-
gate statistics mask significant differences by age: Status women and girls have mortality
rates that are three to four times that of the general female mortality rates between the
ages of 10 and 44. These relative mortality rates are statistically higher than the rel-
ative mortality rates for Status males, which are themselves two to two and half times
that of the general population. While previous researchers have found higher rates of
relative mortality for Status women, to our knowledge no one has identified the dispro-
portionately high mortality rates borne by Status women and girls at such young ages
at the national level (Health Canada, 2008, 2014; Mao et al., 1992; Park et al., 2015;
Tjepkema et al., 2009). We also demonstrate that the proportional difference in mor-
2Unfortunately, the data does not provide information on cause of death or detailed individual socio-economic characteristics and we do not report on these causes in the current analysis.
2

tality between Status peoples and the general Canadian population is larger than the
proportional difference in mortality between Native Americans and non-Hispanic Whites
and the difference between African Americans and non-Hispanic Whites in the United
States. We also demonstrate that the gender bias in relative mortality rates for Status
First Nations women and girls is not present among either Native Americans or African
Americans relative to non-Hispanic American Whites.3
Next, we examine the patterns in mortality by place of residence. We show mortality
rates are higher on-reserve relative to off-reserve: between the ages of 15 and 19 in
2010 and 2013, the mortality rate of Status First Nations girls was five times the rate
for girls in the general population. The mortality rates of boys on-reserve was also
notably higher, nearly four times that of boys in the general population. We also show
that absolute and relative mortality vary significantly by province and age. While First
Nations mortality rates are highest in Alberta, Manitoba and Saskatchewan, we find that
Alberta and Ontario exhibit the highest relative mortality rates. We provide evidence
that this regional variation is associated with economic differences between Status peoples
and the general population.
Finally, we examine trends in mortality rates from 1974 to 2013 (the years for which
we have data). We find that here has been no improvement in relative, age standardized
mortality rates between Status peoples on-reserve and the general population in the past
40 years. In absolute terms, mortality rates for Status women and girls below age 40
have not changed in the past 30 years and may have even increased for some age groups.
We present suggestive evidence that this lack of convergence in female mortality rates
relative to male mortality rates is not easily explained by differential convergence in
economic characteristics. If anything, Status women have converged economically to the
general population more quickly than Status men. While off-reserve mortality rates have
exhibited some improvement, this change occurs primarily in the Status First Nation
3This is not simply due to relatively higher female, non-Hispanic white mortality rates in the UnitedStates.
3

male population.
We believe our findings have implications for the recently called Canadian National
Inquiry into Missing and Murdered Indigenous Women and Girls which has gained in-
ternational attention (Amnesty International, 2015; Levin, 2016; The Economist, 2014;
The Government of Canada, 2015). The inquiry was called to investigate the extremely
high rates of disappearance and homicide experienced by Indigenous women and girls.
Our findings suggest that the marginalization of Indigenous women and girls is more
widespread and systemic than previously documented; our mortality rate estimates are
generally larger than previous analysis for Status First Nations females. We are also able
to document relatively high mortality rates for Status men relative to the general male
population as well; the on-reserve Status male probability of death was 31 percent on av-
erage by age 64, while it was only 14 percent for the general population. The on-reserve
Status female probability of death was 21 percent before the age of 65 while it was 13
percent for the general population.
This work also makes a more general contribution to the literature on “missing
women.”4 Since the seminal work of Sen (1992) nearly 30 years ago, high male-to-female
gender ratios in the developing world have been associated with excess female mortality
(Bulte et al., 2011; Das-Gupta, 2005, 2006; Duflo, 2012; Jha et al., 2006; Klasen and
Wink., 2002; Rosenblum, 2013; Sen, 1992).5 However in our context, we see notably low
male-to-female gender ratios in survey data, but high rates of relative female mortal-
ity.6 This is a similar result as found by Anderson and Ray (2010) who identify excess
mortality among women in developing countries with relatively balanced gender ratios;
our results are novel in that we identify relatively high female mortality in a wealthy,
4The term “missing women” has been used differential in the demography, economics, and sociologyliterature than recently in Canada in the National Inquiry for Missing and Murdered Indigenous Womenand Girls. The term missing in this literature has tended to refer to excess female mortality from allsources, not just murder or women who have gone missing from their communities.
5This effect has also been observed among Asian immigrant families in Canada and the United States(Abrevaya, 2009; Almond and Edlund, 2008; Almond et al., 2009).
6See Akee and Feir (2016) for an early working paper that includes previous mortality estimates andargues that high rates of institutionalization and homelessness of Status men skew result in the low maleto female gender ratio.
4

developed country with low male-to-female gender ratios.
In the next section, we provide some important background information on Status
First Nations in Canada and discuss prior estimates of Indigenous mortality in Canada.
In Section 3 we discuss the data that we use to estimate First Nation mortality rates and
note both the benefits and drawbacks of the data. We also briefly discuss the economic
characteristics data that we use in an associative manner with the estimated mortality
rates. In Section 4 we discuss the methods used to estimate the Status First Nation and
general mortality rates. In Section 5 we present our main results. We discuss variation
in mortality by age, gender, location, and discuss the factors that are closely associated
with observed mortality rates. Finally, we contrast our results with previous estimates
of Status First Nations mortality. In the last section, Section 6, we summarize the set of
facts we establish, the questions they raise, and conclude.
2 The Canadian Context and Existing Estimates of
Registered Indian Mortality
As of 2016, the Status First Nations Population in Canada was approximately 744,855
which represents roughly 76 percent of the total First Nations population in the country.7
Overall, this figure represents about two percent of the Canadian population (Statistics
Canada, 2017).
It is well established that First Nations are among the most economically marginal-
ized populations in Canada – in 2006, 37 percent of First Nations women off-reserve were
living below the low income cut-off, compared to 16 percent of non-Aboriginal women
(O’Donnell and Wallace, 2011). For other figures on the degree of First Nations in-
come disparity see, for example, AANDC (2015); George and Kuhn (1994); Pendakur
and Pendakur (1998, 2011). Indigenous peoples elsewhere also face economic and social
7Some First Nations people may not meet the full legal requirement for Status under Canada’s IndianAct which is largely based on ancestry yet still either ethnically, culturally, or politically identify as FirstNations (Feir and Hancock, 2016).
5
marginalization.8 Status First Nations, especially those living on-reserve are systemat-
ically poorer than non-Aboriginal people, or the Metis or Inuit in terms of health and
income (Pendakur and Pendakur, 2011; Tjepkema et al., 2009).9 However, much of the
work in Aboriginal health and mortality rates in Canada suffers from major data limita-
tions (Feir and Hancock, 2016).
We first begin by defining important terms for the First Nations population in Canada.
The Indian Act is the legal framework that defines who has “Status” and outlines the
set of laws that govern “Status Indians” (referred to here as Status First Nations). Sta-
tus confers certain rights and benefits. For example, Status confers the right to live
on-reserve, vote in band elections, receive money from one’s band, and own or inherit
property on-reserve (Furi and Wherrett, 2003). However, Status has also historically
limited other rights and access to benefits available to non-Status peoples. Until 1960
Status peoples were unable to vote in Canadian elections, did not have access to usual
opportunities to acquire credit, and were not eligible for the same educational or health
care opportunities (The Government of Canada, 2011). The federal government also has
jurisdiction over many services provided to Status peoples that would typically be pro-
vided by the provinces.10 Status can also be lost through out-marriage with non-Status
peoples. In 1985 all women (and their children) who lost their First Nations Status
through out-marriage had their Status rights reinstated (Hurley and Simeone, 2014). In
2011, there was also reinstatement of the grandchildren of women who lost Status. Both
these points will be important for interpreting the results presented later.
Indigenous and Northern Affairs Canada (INAC) implements the Indian Act and is
the Canadian Federal agency overseeing Indian peoples in Canada. The Indian Act estab-
8See United Nations (2009) for a global discussion of Indigenous economic disparity.9The Metis and Inuit are the two other legally defined “Aboriginal” peoples in Canada under The
Constitution Act 1982. While there are legal infrastructures surrounding these groups as well, to ourknowledge, there is nothing as systematic and pervasive as that governing Status First Nations (Feir andHancock, 2016).
10For example, up until the late 1960s, the provincial health care systems were not the main sourceof medical care and the federal government had responsibility for medical care for Status First Nationsprovided often through Indian Hospitals (Waldram et al., 2006).
6
lishes Status peoples as wards of the state for whom the Canadian Federal government has
the responsibility of managing, defining, and documenting. In 1951, a centralized Indian
Register was established to more consistently document who has “Status”. Before this,
the lists of Status First Nations individuals were created and maintained by government
agents at the band-level.11 The Indian Register is the official record identifying all Status
First Nations in Canada and everyone who is classified as a Status person is listed in the
Indian Register (Indigenous and Northern Affairs Canada (2010)). The Indian Register
is kept up to date by band-level Indian Registry Administrators (IRAs); they are tasked
with collecting and reporting vital statistics event data for their community.12 Death
events must also be reported to the Indian Register in order to execute a will of a Status
person or make other arrangements for the administration of that person’s estate and to
determine appropriate funding levels for the band.
To date, five reports document modern Status First Nation mortality rates in Canada:
Health Canada (2008, 2014); Mao et al. (1992); Park et al. (2015); Tjepkema et al. (2009).
One important advantage of this previous research is that they are able to identify the
cause of death in the cases that they describe. Tjepkema et al. (2009) and Park et al.
(2015) use the 1991 Canadian Census and Cancer follow-up survey and are able to link
mortality and cause of death to individual level demographics available from the long-
form Census in 2001 and 2006.13 Health Canada (2008) and Health Canada (2014) use
vital statistics data from the provinces or sub-provincial areas that have identifiers for
people with Status to examine mortality rates by age and gender averaged over 2001-
2003 and later averaged over 2003-2007. The Health Canada studies include cause of
death but do not include individual level demographics. Mao et al. (1992) uses data from
11Bands are the political unit defined in the Indian Act that the federal government uses to discerndifferent groups of First Nations peoples.
12This was determined through conversations of the head of the Indian Register through email corre-spondence. No public record of this could be found.
13Tjepkema et al. (2009) and Park et al. (2015) differ in the precise population and time frame theystudy: Tjepkema et al. (2009) focuses on Status First Nations peoples, Metis, and non-Status peoplesand uses data linked between the 1991 and 2001 Census to determine mortality rates. Park et al. (2015)focuses on all First Nations people and non-Status peoples and uses data linked between the 1991 and2006 Census to determine mortality rates.
7

the Indian Register as we do, but their data only includes the two time periods 1979-83
and 1984-88. They match the Indian register with data from the Canadian Generalized
Iterative Record Linkage System to obtain cause of death for 1981.14 To our knowledge,
it is not currently possible to link these records.
A significant drawback to these studies is that they are unable to describe the entire
population of Status First Nations peoples. First, both Tjepkema et al. (2009) and Park
et al. (2015) necessarily exclude First Nations peoples living on reserves that were not
enumerated in the 1991 Census (approximately 98 reserves were not enumerated). Those
two studies include individuals linked across Census data and tax-filer data in order to
obtain their cause of death. The record matching was not complete, however, and differed
significantly by gender and First Nations status. The match rates were 47 percent for
Status men, 59 percent for Status women, 79 percent for non-Aboriginal men, and 75
percent for non-Aboriginal women. Their sample also excludes anyone without an address
or those living in shelters, collective dwellings, or institutions such as prisons. In addition,
both Tjepkema et al. (2009) and Park et al. (2015) consider only the population aged
25 to 75 and thus are unable to estimate mortality rates for the youngest age cohorts
- which we later show have some of the highest mortality rates overall relative to the
general population.
The Health Canada (2008, 2014) analysis includes people of all ages, however, their
data does not cover all Canadian provinces or sub-provincial areas. Their analysis in-
cludes two provinces (British Columbia and Alberta) and the on-reserve population for
Manitoba and Saskatchewan. The substantial difference in population coverage between
these studies makes interpreting the differences in their results difficult for national statis-
tics comparisons. For example, the findings of Health Canada (2008) are most comparable
in time frame to Tjepkema et al. (2009), but the estimates of life expectancy in Health
Canada (2008) are much shorter than those in Tjepkema et al. (2009). It is difficult to
conclude whether the difference is due to the different regions included or due to the
14The match rate for males was 90 percent for males and 88 percent of females.
8

differential population match rates. Similar issues arise when comparing the results of
Health Canada (2014) to Park et al. (2015).
While Mao et al. (1992) used data that covered the entire Status population, there
was a significant change in 1985 in the Status First Nations qualification requirements.
Specifically, all women (and their children) who lost Status through out-marriage had
their Status rights reinstated (Hurley and Simeone, 2014). Therefore, the estimates of
Mao et al. (1992) are not generalizable to the current population governed by the Indian
Act given that there are likely compositional differences between Status women who out-
married and Status women who did not out-marry. We return to the importance of this in
Section 5.4. In Table 1 we summarize how our work differs from prior work and contrasts
the time periods and populations covered in each study.
Despite the literature’s shortcomings, these are important foundational statistics that
provide critical information about Indigenous mortality in Canada. The literature cur-
rently suggests that Status people over the age of 25 have mortality rates one and a half
to two and a half times higher than the average population for both men and women.
The mortality rates of Status men are the highest; Status women’s are the second high-
est and comparable to non-Status men; and non-Status women have the lowest mortality
rates. The existing evidence suggests that the differences between Status and non-Status
peoples’ mortality is higher at younger ages (although this evidence is only available for
specific sub-regions of Canada). While estimates of the ratio of Status to non-Status
mortality rates are often higher for women than for men, there is only sporadic evidence
of statistically significant gender differences (Health Canada, 2008, 2014; Mao et al., 1992;
Park et al., 2015).
The studies summarized here attribute from 50 to 70 percent of the differences in
mortality rates between Status and non-Status peoples to the differential incidence in
endocrine and digestive system diseases and to the differential incidence in death from
external causes (such as accidental death, suicide, or homicide). Tjepkema et al. (2009)
and Park et al. (2015) find that while differences in income, education, occupation, and
9
urban residence can explain two thirds of the differences in the probability of death
between the ages of 25-75 between Status and non-Status men, these factors can explain
less than one third of the difference for women.
10

Table 1: Summary of Previous Literature Regarding Status First Nations Mortality Contrasted with Current Paper
Source Years Population Coverage Data Source Advantages
Health Canada Averaged ; On reserve in SK, and MN, CVSDD+ Information on cause(2008, 2014) 2001/2002; & all off-reserve AB & BC of death
2003/2007
Park et al. Death between 15% Sample of Long-form CCMFS∗ Data on cause of death(2015) 1991 & 2006 Census pop. tax filers & individual level
over 25 demographic data
Tjepkema Death between 15% Sample of Long-form CCMFS∗ Data on cause of deathet al. (2009) 1991 & 2001 Census pop. tax filers & individual level
over 25 demographic data
Mao et al. 1979-83 All Status First Nations Indian Register Data on cause of death(1992) matched via CGIRLS∗∗
1984-1988
This Paper 1974-2013 All Status First Nations, Indian Register Total Status pop byband members gender, band,
and location
+ = Canadian Vital Statistics and Deaths Databases ; *CCMFS = Canadian Census Mortality Follow Up Study; **CGIRLS =Canadian Generalized Iterative Record Linkage System
11

3 Data Description
3.1 Data from the Indian Register
The primary data set for our analysis comes from the Indian Register at INAC. The
register contains two separate types of information: the first data set is a population
count for all Status First Nations for each year from 1974 to 2013 in 5-year age groups for
everyone 64 and below, gender, place of residence (whether they live on or off-reserve),
as well as First Nation band of membership over this time period. The second data set
contains an accounting of every death event by date of birth, year of death, gender, place
of residence at the time of death (whether they live on or off-reserve) and First Nation
band membership. We combine these two data sets and estimate Status mortality by
gender and age group. Unfortunately, the death event data collected by INAC does not
contain the cause of death.
3.2 Indian Register Data Limitations and a Validation Exercise
In this section we discuss the potential limitations of using the Indian Register data and
use supplemental data collected by Health Canada to gauge the accuracy of reporting to
the Indian Register. We conclude from this exercise that the Indian Register data is able
to provide accurate estimates of mortality on-average between the ages of 5 and 64.
While the Indian Register data contains the official count of Status peoples, there
may be concerns about its accuracy as there are often delays in the reporting of births or
deaths. The register relies on band-level Indian Registry Administrators (IRAs) to report
deaths. Births are under reported on average by about three years. Additionally, infants
that die before being registered are not required to have a death certificate submitted to
the Indian Register. Therefore, it is possible that there is an under-reporting of infants
and infant deaths.
A second potential limitation is that if deaths go unreported for adults or older chil-
12

dren, then the Indian Register will have a larger than actual population count since those
who have already died will still be included in the data set. For example, if someone dies
in 1970 at age 69 and their death is not recorded, that individual will still be included in
the Register in 2000 and will be reported as 99 years old. This under-reporting of deaths
would result in an under-estimation of mortality rates at older ages.
A third potential limitation of our data is that while the Indian Register has provided
population counts in five-year age groups for most ages, the population count of those over
age 64 is reported as one large age category. As a result, comparisons of mortality rates
between Status peoples and the general population will be confounded by differential age
distributions within the ”65 and over” age category.
Another concern is that some Status people are not members of a First Nation band
recognized by INAC and therefore vital statistics are not recorded by an IRA in a band
office. The vital statistics for these individuals are administered by a regional adminis-
trative body for multiple bands. This may result in a greater degree of under-reporting
of deaths for this population. In addition, some bands have their governmental affairs
and data administered by a regional body, and thus again, these deaths may be less likely
to be recorded. Thus we will consider only Status peoples who are members of a First
Nation.15
In order to assess the degree of under-reporting of deaths to the Indian Register, we
compare the mortality rates estimates from our data, to the most credible, independently
collected data we are aware of: the data collected by Health Canada Vital Statistics from
Alberta, British Columbia, and on-reserve in Manitoba and Saskatchewan. We restrict
our Indian Register data to the same regions and time periods as that in Health Canada
(2008, 2014). Then we estimate mortality rates from our data by age and gender and
15Including all Status peoples has little impact on our conclusions. Upon the suggestion of INAC IndianRegister officials, we also estimated our results including and excluding First Nations in the Yukon, NorthWest Territories, and Nunavut and there is no effect on our main conclusions. However, when assessingregional or First Nations level variation in mortality rates, we exclude the Territories because of concernswith under-reporting. We inquired about a list of vital statistics data for these Territories, but, accordingto our discussions with Indian Register, no list for these territories and provinces has been kept overtime.
13

calculate a simple ratio of Health Canada’s estimates to our estimates.
Figure A1 depicts the results of restricting the Register sample to the same sub-regions
of Canada and years available in Health Canada (2008, 2014) and generating the ratio of
Health Canada’s mortality rates to our own. The mortality rates are computed in each
year via the estimation method described later in Section 4 and averaged over either 2001-
2002 or 2003-2007. The time variation is used to construct the standard errors for the
estimated ratio. Ratios above one indicates the extent to which the Indian Register data
under-reports deaths in those age groups assuming the Health Canada data is accurate.
We see in Figure A1 that in most age groups, our mortality estimates are statistically
indistinguishable from Health Canada’s. However, as expected, the Indian Register data
likely under-reports both infant mortality and mortality over the age of 65.16 It appears
that on average, the Health Canada estimates of the mortality rate between zero and
four years of age is twice as high as ours. There also seems to be some under-reporting
of deaths over the age of 65 in both periods, with Health Canada’s estimates 1.30 to 1.45
times as large as our estimates. For these reasons, in most of what follows, we focus on
estimating mortality rates between the ages of 5 and 64.17 Overall, however, we find that
our results from the Indian Register align with the independently collected data from
Health Canada and thus we have confidence in our results for the age range 5 to 64 years.
3.3 Additional Data
To construct comparable estimates of mortality for the general population, we use popu-
lation and death count data compiled by gender, province, and five-year age group from
Health Canada Vital Statistics. These data are available for the general population by
age, gender, and province from 1974 to 2013. In order to gain a sense of whether time
and regional patterns in mortality are correlated with basic economic characteristics, we
16The result regarding infant mortality is unsurprising given that if infants die before they are regis-tered, neither their birth nor death will be registered.
17There is also some evidence is marginal under-reporting of deaths over the age of 40 in 2001-2002and over 60 in 2003-2007, particularly for males. However, this small degree of potential under-reportingwould not change the conclusion of this work in a substantive fashion.
14

use data from the 1991, 1996, 2001, and 2006 Long Form Census and the 2011 National
Household Survey. To our knowledge, the Long Form Census and National Household
survey contain the most complete population coverage of Status and non-Status peoples
in Canada. For a more complete description of the advantages and disadvantages of
Census and National Household survey as it relates to Indigenous peoples, see Feir and
Hancock (2016). For a summary of the data sources and how they are used, see Table 2.
Table 2: Summary of Data Sources and Use
Data Source Use
Indian Register Population and death counts used to constructmortality rates for Status peoples
Health Canada Vital Statistics Population and death counts used to constructCompiled by Statistics Canada mortality rates for general Canadian population
1991-2006 Census & 2011 NHS Used to construct basic socio-economic informationby Status, gender, province and age group over timeto assess the correlation with trendsand regional patterns
Notes: INAC is Indigenous and Northern Affairs Canada; NHS is the National Household Survey.
4 Methodology
Our analysis focuses on estimating mortality for Status First Nations. We use the INAC
data with the methods described below to produce First Nations and Canadian average
mortality rates overall, in five-year age-groups, across provinces, First Nations reserves
and over time.
15
4.1 Estimating Mortality By Age Group, Age-Standardized Mor-
tality Rates, and the Probability of Death
We estimate mortality rates for Status peoples and the general population separately by
age and gender by calculating
ηagt =#deathsagt(endofperiod)
populationagt(startofperiod)
× 100, 000 (1)
where a denotes five-year age group, g denotes gender, and t denotes year. Reporting
deaths per 100,000 is consistent with prior literature. Data for the numerator and the
denominator in Equation 1 come from the Indian Register for the Status population and
from Health Canada Vital Statistics for the general population. The Indian Register
provides information on the date of birth, the age of death, and the year of death, thus
even if a death is reported a few years after it occurs, we are still able to identify the
year and age group to which that death belongs. Late reporting of death appears to be
a very minor concern for the age groups we focus on.
In addition to these simple five-year age range mortality rates, we also compute age
standardized mortality rates (ASMR) between the ages of 5 and 64. These age standard-
ized mortality rates are useful when comparing populations over time or across popula-
tions with very different underlying age distributions. Since mortality rates are highly
age-dependent and the Status population is much younger than the general Canadian
population, comparing the overall mortality rates of the general Canada population with
the Status population may provide an overly optimistic view of equality of mortality
rates. This skew towards younger ages in the Status population alone could result in
lower mortality rates for Status populations. Therefore, we calculate a direct age stan-
dardization (Ahmad et al., 2001) using the age distribution approximated in five-year age
bands with the base population of Status First Nations people of all genders in 2010. Let
the proportion of the population age a for all Status First Nations in 2010 be denoted as
pa2010. Thus the age standardized mortality rate (ASMR) is given by:
16

ηgt =60to64∑a=5to9
pa2010 × ηagt. (2)
We compute the ASMR for both genders, for all years, for Status peoples and the
general population. It is worth noting that different base age distributions will emphasize
differences in different parts of the life cycle across the populations. We also present our
results by each five-year age group as well, rather than only the ASMR.
Our final estimates of interest are the estimated probabilities of dying before a par-
ticular age is reached. The probability of dying before one reaches age a+ 1 is computed
as follows with a set of synthetic cohorts:
ρa+1gt = 1 −populationagt(endofperiod)
initialpopulationgt(startofperiod)
(3)
These tables estimate the period life expectancy which provide mortality rates over a
specific time period for each age group of individuals.18 These period life tables (in our
case we invert them to show the probability of death) show the overall mortality conditions
operating over this particular time period (when the deaths occur). This implies that if
all conditions were to remain constant over time and over age cohorts, then a cohort born
in this time period could expect mortality rates as provided in these tables. However,
to interpret these estimates in this way, we need to assume that there are no differential
genetic endowment effects across birth cohorts or time period effects (for example, being
born during a famine, war, or boom periods). We also need to assume that there is no
selection with regard to unobserved characteristics of the individuals in each age cohort.
We acknowledge that these are strong assumptions, but they are standard ones for the
computation of these tables in the literature (Guillot, 2011).
Data used to calculate the probabilities estimated in Equation 3 come from the Indian
18The other alternative method for computing life expectancy tables is to estimate a cohort life ex-pectancy for a single birth cohort over their entire lifetime. We are unable to do this as the data qualityis complete for more recently born cohorts – specifically cohorts born after 1940. Cohort life expectancytables require all or almost all of the cohort to have died in order to conduct such analysis and wouldrequire cohorts born from the early 1900s.
17

Register for the Status population and from Health Canada Vital Statistics for the general
population. These probabilities are presented for each age group up to age 64 by gender
for the Status and general population. Note that to compute the number of deaths from
age zero to four for the Status population, we also inflate the number of deaths in the
register in this age group by the factor computed in 2003-2007 presented in Figure A1
to adjust for under-reporting in the register. In doing this, we assume that the extent
of under-reporting of deaths between the ages of zero and four on-reserve in Manitoba,
Saskatchewan, Alberta and British Columbia are the same as elsewhere in Canada.
4.2 Associative Analysis
We perform two sets of associative exercises. These exercises are not intended to be causal,
but rather useful for identifying potential correlates of mortality rates for the Status
First Nations population. The first exercise creates measures of the ASMR by province,
Status, age,and gender between 2000 to 2011 and measures of economic characteristics by
province, Status, age, and gender from the 2001, 2006 and 2011 Censuses. We then use
this data to examine the association between these economic characteristics and mortality
rates across Canadian provinces.
The second exercise adds in two additional Canadian Censuses for 1991 and 1996.
We regress mortality rates on economic and social characteristics from the Census data
as well. In this analysis, we focus on changes in mortality rates over time by gender
and First Nations Status.19 We focus on the time period 1991-2011 in particular as this
was a period of stability in how First Nations Status was defined; there were changes
in definitions and Status requirements earlier in 1985 and subsequently in 2010-2011.
The covariates of interest in this analysis are educational attainment and income levels,
therefore we only analyze the population over the age of 25 in this exercise.
A third potential analysis would be to conduct a Oaxaca-Blinder decomposition to
19We create mortality rates by averaging over three years spanning each Census year for a more stablemortality estimate. For instance, we average over the years 1990, 1991 and 1992 to create an estimateof the mortality rate for the 1991 Census year
18

explain the differences in mortality rates between the Status and non-Status populations.
There are two reasons that we do not conduct such analysis. First, the finest level available
for Canadian mortality rates is at the health region level and they are aggregated up to
the age of 75. This aggregation makes it difficult to compare to the Status mortality
data we have available. Second, and perhaps more importantly, in order to perform a
meaningful decomposition analysis, the characteristics of the groups one compares must
overlap one another (Fortin et al., 2011). However, in our data there are no Health
Regions with economic characteristics that significantly span the economic characteristics
of First Nations communities. In other words, Status First Nations communities can be
perfectly predicted based on their economic characteristics alone. Thus the results of
any decomposition analysis would be difficult to interpret. As discussed in Section 2, the
studies conducted at the individual level among a more selected population suggest that
differences in income, education, occupational skill, and urban residence can account for
two thirds of the difference in the probability of death between Status men and non-Status
men between the ages of 25-75 and about a third of the difference for women (Park et al.,
2015; Tjepkema et al., 2009).
5 Results
5.1 A Snapshot of Mortality by Gender, Age and Status in
2010-2013
In this section we provide an overview of Status First Nations mortality rates averaged
over 2010 to 2013 and compare them with the mortality rates in the general population
by gender and age.20 Our analysis focuses on the most recent years where there is a
consistent definition of First Nations Status. For the analysis over time we directly
20We focus on these years since they are the most recent years for which we have data. We report theaverage of three years in order to reduce noise in the yearly mortality rate. The results are unchangedif 2010 is excluded.
19
address the issue of changes in the definition of First Nations Status in section 5.3.
In Table 3 we provide the overall age standardized mortality rates calculated as spec-
ified in Equation 2 as well as the five-year age group mortality rates by gender for Status
First Nations and the Canadian average. The age standardized mortality rates (ASMR)
are provided in the first row. Between ages 5 and 65, the ASMR is 226 deaths per 100,000
for the Status First Nations male population, and 161 deaths per 100,000 for the general
Canadian male population averaged over 2010 to 2013. For the Status female population,
the ASMR is 165 deaths per 100,000 and for the general female population it is 101 deaths
per 100,000. Note that these ASMR estimates are not strictly comparable to other stud-
ies because we have age standardized to the Status First Nation age distribution in 2010;
thus we provide the mortality rates in five-year age groups for males and females in the
remaining rows. We find that Status men consistently have the highest mortality rates
at almost all age groups. It is worth noting, however, that the mortality rate of Status
girls between the ages of 10 to 14 is actually higher (36 per 100,000 as compared to 24
per 100,000) than that of Status boys. This is the only age for which the mortality rate
of Status females is above that of Status males. Next, notice that Status females have
mortality rates that are higher than both non-Status males and non-Status females.21
To more clearly illustrate the relative patterns in Table 3, we present in Figure 1 the
ratio of the Status First Nations mortality rate to the General population mortality rate.
The dashed horizontal line at one represents parity with the average Canadian in terms
of mortality rates at the various age groupings. The figure indicates that the relative
mortality rates (or, equivalently, mortality rate ratios) are above one in all cases and above
two in most age and gender groups. This indicates that Status First Nations have nearly
21In Table A1 we show the mortality rates for Status First Nations and the General population byage and gender computed by year and averaged over 2000 to 2009 and demonstrate that the patternsobserved in 2010-2013 are not anomalies. The estimates in this table show that the patterns describedabove are characteristic over the decade of the 2000s: Status male mortality rates are higher than thegeneral population and Status female mortality rates are lower than Status men in most age groups butsignificantly higher than for women and comparable to the general male population in many age groups.In addition, the mortality rate ratios are more significantly biased against Status women between 10 to39.
20

Table 3: Summary of Mortality Rates per 100,000, 2010-2013
Males FemalesAge Canadian All Status Canadian All StatusGroup Average First Nations Average First NationsASMR 160.71 225.89 100.81 165.41(5 to 64) (1.94) (9.26) (0.92) (1.62)05 to 09 9.12 13.51 7.88 12.83
(0.8) (5.67) (0.73) (2.92)10 to 14 11.97 23.85 10.77 35.62
(1.23) (12.08) (1.24) (10.73)15 to 19 46.9 123.22 24.72 92.85
(4.31) (8.66) (1.17) (18.35)20 to 24 73.18 172.05 30.42 113.25
(3.93) (38.84) (0.44) (3.89)25 to 29 75.64 204.53 32.95 112.84
(2.19) (15.5) (0.98) (19.72)30 to 34 81.15 217.34 43.46 165.46
(2.43) (17.09) (1.16) (3.82)35 to 39 101.44 241.24 59.04 191.98
(2.89) (18.74) (1.6) (24.67)40 to 44 149.58 358.6 93.61 257.43
(5.4) (28.48) (2.32) (33.35)45 to 49 232.3 459.84 155 324.95
(4.94) (20.93) (2.81) (18.45)50 to 54 372.6 593.2 247.96 408.75
(9.52) (53.19) (8.35) (41.4)55 to 59 595.89 926.5 383.4 493.62
(10.49) (26.97) (4.18) (52.78)60 to 64 926.3 1,288.04 576.24 883.98
(10.41) (49.34) (9.44) (76.01)
Notes: Data comes from the Indian Register and Health Canada Vital Statis-tics Births and Death Database. The age standardized mortality rates (ASMR)are standardized to the age distribution of Status people in 2010.
21
double the mortality rate as compared to their relevant reference group for the population
as a whole. The mortality rate ratio is particularly high for females (approaching a ratio
of four) starting at age 15 and going through 39 years of age. Status males have higher
levels of mortality in this age range as compared to the average Canadian male and have
a ratio approaching three. We note that the difference in the male and female mortality
ratios shown here are statistically different from one another from ages 10 to 44.22
To our knowledge, we are the first to document these gender-biased mortality rate
ratios at such young ages across Canada. These high rates of female mortality are not
identifiable in survey data through imbalances in male-female gender ratios. Our results
echo the finding of female-bias relative mortality rates in developing countries (Anderson
and Ray, 2010) where there are relatively balanced gender ratios.23
22If we were to inflate our estimates of male and female mortality by fraction suggested in the firstpanel of Figure A1, this conclusion would not change.
23In the case of Status First Nations, the high rates of institutionalization and homelessness amongStatus First Nation men (Akee and Feir, 2016) actually skew the gender ratio in the Status First Nationpopulation towards women.
22
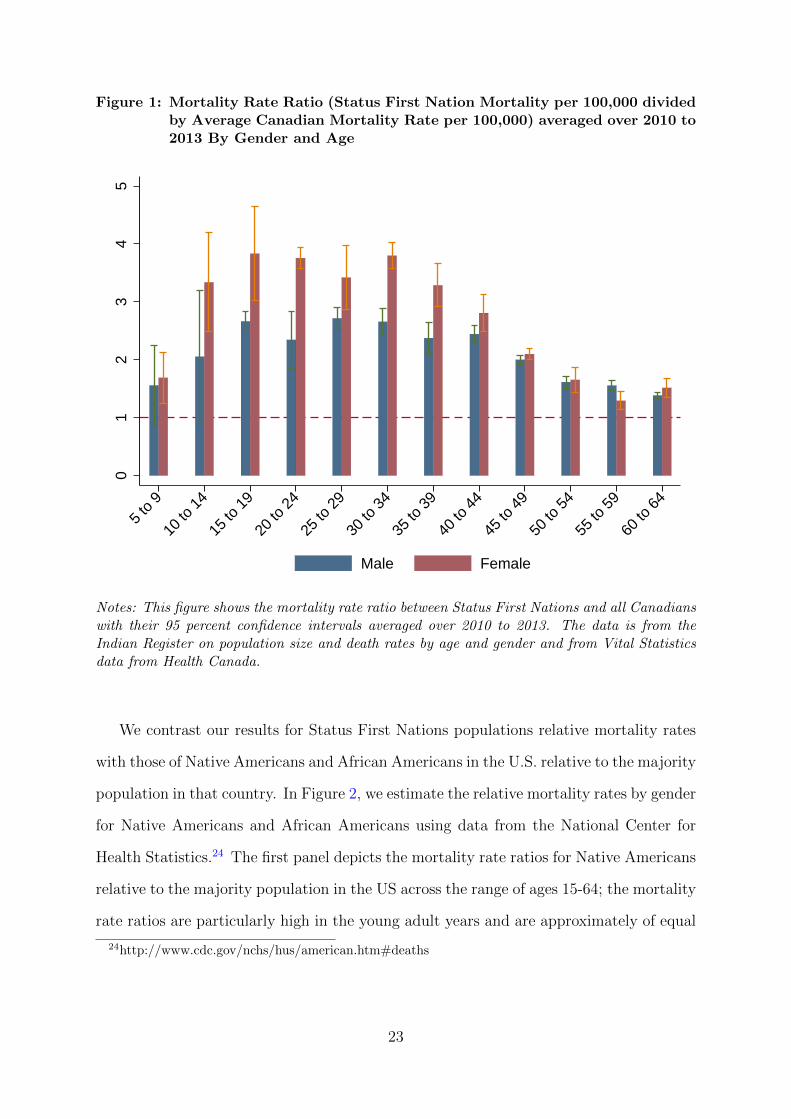
Figure 1: Mortality Rate Ratio (Status First Nation Mortality per 100,000 dividedby Average Canadian Mortality Rate per 100,000) averaged over 2010 to2013 By Gender and Age
01
23
45
5 to
9
10 to
14
15 to
19
20 to
24
25 to
29
30 to
34
35 to
39
40 to
44
45 to
49
50 to
54
55 to
59
60 to
64
Male Female
Notes: This figure shows the mortality rate ratio between Status First Nations and all Canadianswith their 95 percent confidence intervals averaged over 2010 to 2013. The data is from theIndian Register on population size and death rates by age and gender and from Vital Statisticsdata from Health Canada.
We contrast our results for Status First Nations populations relative mortality rates
with those of Native Americans and African Americans in the U.S. relative to the majority
population in that country. In Figure 2, we estimate the relative mortality rates by gender
for Native Americans and African Americans using data from the National Center for
Health Statistics.24 The first panel depicts the mortality rate ratios for Native Americans
relative to the majority population in the US across the range of ages 15-64; the mortality
rate ratios are particularly high in the young adult years and are approximately of equal
24http://www.cdc.gov/nchs/hus/american.htm#deaths
23
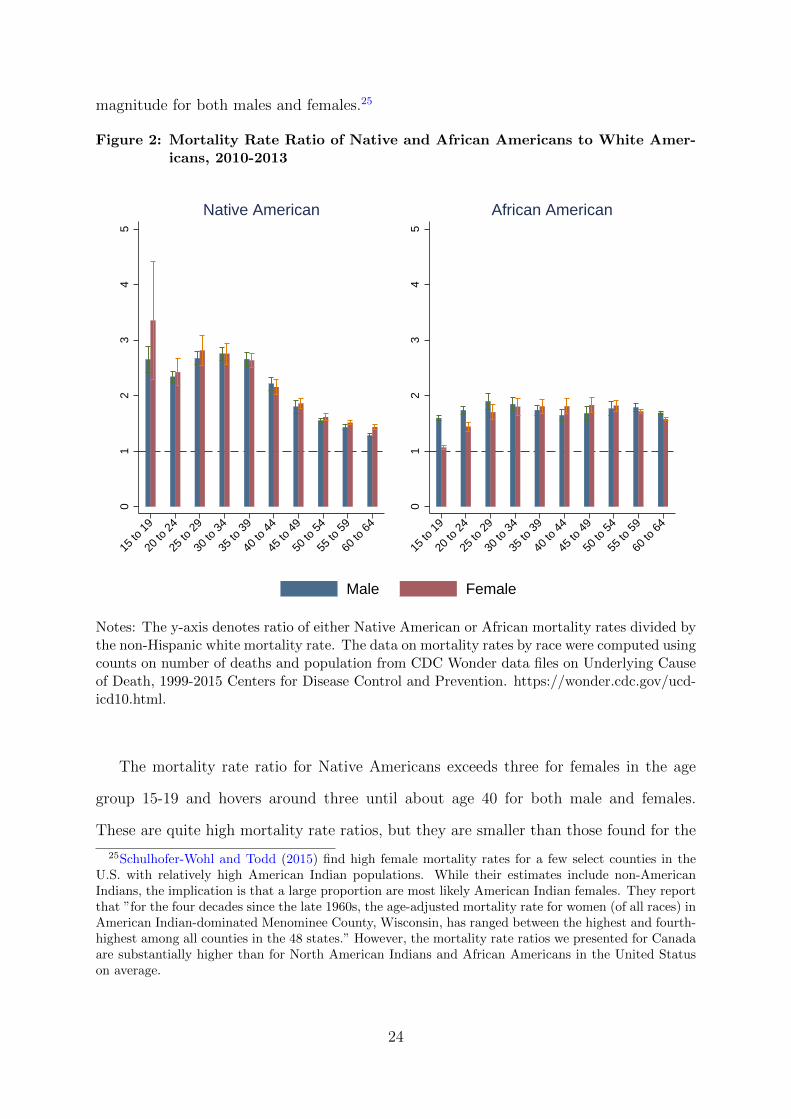
magnitude for both males and females.25
Figure 2: Mortality Rate Ratio of Native and African Americans to White Amer-icans, 2010-2013
01
23
45
15 to
19
20 to
24
25 to
29
30 to
34
35 to
39
40 to
44
45 to
49
50 to
54
55 to
59
60 to
64
Native American
01
23
45
15 to
19
20 to
24
25 to
29
30 to
34
35 to
39
40 to
44
45 to
49
50 to
54
55 to
59
60 to
64
African American
Male Female
Notes: The y-axis denotes ratio of either Native American or African mortality rates divided bythe non-Hispanic white mortality rate. The data on mortality rates by race were computed usingcounts on number of deaths and population from CDC Wonder data files on Underlying Causeof Death, 1999-2015 Centers for Disease Control and Prevention. https://wonder.cdc.gov/ucd-icd10.html.
The mortality rate ratio for Native Americans exceeds three for females in the age
group 15-19 and hovers around three until about age 40 for both male and females.
These are quite high mortality rate ratios, but they are smaller than those found for the
25Schulhofer-Wohl and Todd (2015) find high female mortality rates for a few select counties in theU.S. with relatively high American Indian populations. While their estimates include non-AmericanIndians, the implication is that a large proportion are most likely American Indian females. They reportthat ”for the four decades since the late 1960s, the age-adjusted mortality rate for women (of all races) inAmerican Indian-dominated Menominee County, Wisconsin, has ranged between the highest and fourth-highest among all counties in the 48 states.” However, the mortality rate ratios we presented for Canadaare substantially higher than for North American Indians and African Americans in the United Statuson average.
24

Status First Nations population in Canada, especially for Status First Nations women
and girls.26 The next panel provides similar data for African Americans. At younger ages,
there appears to be higher mortality rate ratios for males than for females especially at
ages 15-19 and the mortality rate ratio hovers around two. The comparison of the Status
First Nations mortality rates to these two US-based groups suggests the extreme nature
of the former’s conditions in Canada. We find that the ratio of the Native Americans’ and
African Americans’ mortality rates compared to white Americans is lower than the ratio
of First Nations mortality to the general population in Canada; it should be noted that
Native Americans and African Americans are among the most at-risk and impoverished
groups in the US. Additionally, the mortality ratios are approximately similar by gender
for these two groups in the US and we do not observe the extreme mortality rate ratios for
First Nations females. However, the mortality rates we estimate (as opposed to mortality
rate ratios) for Status First Nations men are roughly comparable to those in the African
American population before the age of 35 while Status First Nations women have higher
mortality rates than those in the African American population.
Given that we have information on the year of birth and death, we compute the
probability of death for the Status First Nations populations. In Table 4 we provide the
Canadian Average and the First Nations average probability of dying before a certain
age (in five year intervals) for each gender. For this analysis we use the most recent
data available on mortality for 2010-2013. For instance, in the first row of the table, the
probability of dying for a Canadian male by age five is 0.6 percent and it is also 0.6 percent
for Status First Nations males. For females, the probability of death is 0.5 percent for a
Canadian female but it is slightly higher for a Status First Nations female at 0.7 percent.
Differences in the probability of dying before a specific age begin to appear by age 20
with Status First Nations individuals having consistently higher probabilities of death as
26To determine if this simply due to the general female population in Canada having significantlybetter outcomes than their American or Status counterparts, we re-compute Figure 2 using the Canadianmortality rate as the denominator. Figure A2 shows that the differences across countries in the genderbias in the mortality rate ratios are not due to relatively low young female Canadian mortality rates.
25

compared to the general Canadian population. By age 50, a Status First Nation male
has about a 10 percent chance of dying while his Canadian counterpart has about a 5
percent chance of death; for females it is 7.3 percent and 2.8 percent respectively. Finally,
in the bottom row of the table, we find that by age 65 Status First Nations men have a 24
percent chance of dying as compared to a 14 percent chance of dying for their Canadian
counterparts. For Status First Nations women there is a 16.2 percent chance of dying by
age 65 while it is 9 percent for Canadian women. These are quite large differences in the
probability of death and this data has implications on the continuity of households and
communities.
Table 4: Probability of Dying Before Age X, 2010-2013
Male Female
Age General All Status General All Status
5 0.006 0.006 0.005 0.00710 0.007 0.007 0.006 0.00815 0.007 0.008 0.006 0.0120 0.009 0.015 0.007 0.01425 0.013 0.023 0.009 0.0230 0.017 0.033 0.011 0.02635 0.021 0.044 0.013 0.03440 0.026 0.056 0.016 0.04445 0.034 0.075 0.02 0.05750 0.045 0.098 0.028 0.07355 0.064 0.128 0.04 0.09360 0.094 0.174 0.06 0.11865 0.14 0.238 0.088 0.162
Notes: The probability of death before a given age group is given ineach of the cells. The probabilities are calculated over five year agegroups. It is computed from the average mortality rate between 2010to 2013 for each age group. The standard errors are given below inparenthesis. The data is taken from the Indian Registrar.
26
5.2 A Snapshot of Mortality by Location - On- or Off-Reserve
and by Province in 2010-2013
In this section, we examine differences in Status First Nations and average Canadian mor-
tality rates by geographic location. We examine two different geographic areas: Canadian
provinces and location on and off First Nations reserves. Our analysis provides deeper
insight into the differences in mortality rates across these different geographic regions in
Canada. Later, we will conduct analysis to show whether these differences are due to
an association with specific regional or geographic endowments or other characteristics.
While this analysis is not causal, it does illuminate several potential paths for future
research on this topic. This is also the first, to our knowledge, display of differences in
mortality rates between the on- and off-reserve population of Status First Nations.
In Table 5 we provide the mortality rates for Status First Nations males and females
residing on and off of reserves and the average Canadian mortality rates. This analysis
is similar to Table 3 with the added dimension of geographic differences. The first item
to note is that the ASMR for males and females are higher for the on-reserve population
as compared to both the off-reserve and Canadian averages. The off-reserve Status First
Nations population also has a higher ASMR than the Canadian average. Overall the
mortality rates for the on-reserve population tend to be almost always twice that of the
Canadian average for males across most of the five-year age groups; the rate for females
on-reserve is often triple to quadruple the Canadian average at many ages.
We depict these mortality rates in Figure 3 as a ratio of the on and off reserve Status
First Nations’ mortality rates divided by the relevant Canadian average. Once again, the
horizontal line at one indicates parity with the Canadian average mortality for the age
group and location. In the first panel we present the results for males. The on-reserve
mortality rate ratios are consistently above two for ages 10 to 49 for Status First Nations
males. In young adulthood the ratio is above three. The ratios for off-reserve Status First
Nations males is consistently above one except for at ages 60 to 64 where it is slightly
27

Table 5: Summary of Mortality Rates per 100,000, 2010-2013
Males Females
Canadian Average On-Reserve Off-Reserve Canadian Average On-Reserve Off ReserveASMR 160.71 261.06 181.36 100.81 179.79 149.56(5 to 64) (1.94) (9.34) (17.2) (0.92) (12) (10.77)Age Group05 to 09 9.12 16.23 9.25 7.88 11.65 14.80
(0.8) (8.07) (2.99) (0.73) (5.21) (7.01)10 to 14 11.97 29.32 16.00 10.77 42.09 27.20
(1.23) (16.46) (11.38) (1.24) (17.99) (15.66)15 to 19 46.9 152.02 82.75 24.72 114.95 62.49
(4.31) (11.76) (17.61) (1.17) (17.83) (24.29)20 to 24 73.18 204.38 127.88 30.42 129.92 91.97
(3.93) (61.19) (43.21) (0.44) (11.23) (5.98)25 to 29 75.64 233.64 167.65 32.95 121.24 103.39
(2.19) (18.26) (29.05) (0.98) (19.24) (34.67)30 to 34 81.15 244.91 186.93 43.46 182.23 148.54
(2.43) (36.87) (11.77) (1.16) (22.3) (17.56)35 to 39 101.44 296.71 183.17 59.04 228.07 159.53
(2.89) (33.98) (46.44) (1.6) (56.85) (29.68)40 to 44 149.58 448.19 270.6 93.61 328.15 196.95
(5.4) (17.76) (56.65) (2.32) (38.29) (35.48)45 to 49 232.3 590.52 329.79 155 372.12 286.82
(4.94) (57.94) (67.54) (2.81) (43.53) (23.89)50 to 54 372.6 708.02 474.83 247.96 514.52 328.41
(9.52) (54.75) (97.96) (8.35) (132.62) (34.18)55 to 59 595.89 1162.71 675.77 383.4 581.86 425.98
(10.49) (111.74) (108.54) (4.18) (86.86) (50.28)60 to 64 926.3 1657.44 876.77 576.24 1200.03 648.05
(10.41) (105.32) (135.39) (9.44) (128.8) (63.75)
Notes: Data comes from the Indian Register and Health Canada Vital Statistics Births and Death Database. Theage standardized mortality rates (ASMR) are standardized to the age distribution of Status people in 2010.
28

below one. In general the mortality rate ratio for the off-reserve Status First Nations is
more muted than the on-reserve populations.
For females, the on-reserve population has mortality rate ratios that are around four4
for ages 10 through 44. The ratio declines after that but increases again at ages 60 to 64.
The off-reserve Status First Nations women all have high mortality ratios relative to their
Canadian counterparts. Overall, there is evidence that Status First Nations females have
higher relative mortality rates (both on and off reserve) than their male counterparts.
Figure 3: Mortality Rate Ratio (Status First Nation Mortality Rate divided byCanadian Average Mortality Rate) averaged over 2010 to 2013 By Placeof Residence, Gender, and Age
02
46
5 to
9
10 to
14
15 to
19
20 to
24
25 to
29
30 to
34
35 to
39
40 to
44
45 to
49
50 to
54
55 to
59
60 to
64
Male
02
46
5 to
9
10 to
14
15 to
19
20 to
24
25 to
29
30 to
34
35 to
39
40 to
44
45 to
49
50 to
54
55 to
59
60 to
64
Female
On-Reserve Off-Reserve
Notes: This figure shows the difference between women and men in the ratio of mortality ratesbetween Status First Nations and all Canadians with their 95 percent confidence intervals aver-aged over 2010 to 2013 using Data from the Indian Register on population size and death ratesby age and gender and from Vital Statistics data from Health Canada. The label “on-reserve”indicates the figure that provides the relative mortality rates calculated for the population re-ported to be living on legally defined reserve land and the label “off-reserve” indicates the figurethat provides the relative mortality rates calculated for the population reported to be living offlegally defined reserves.
29
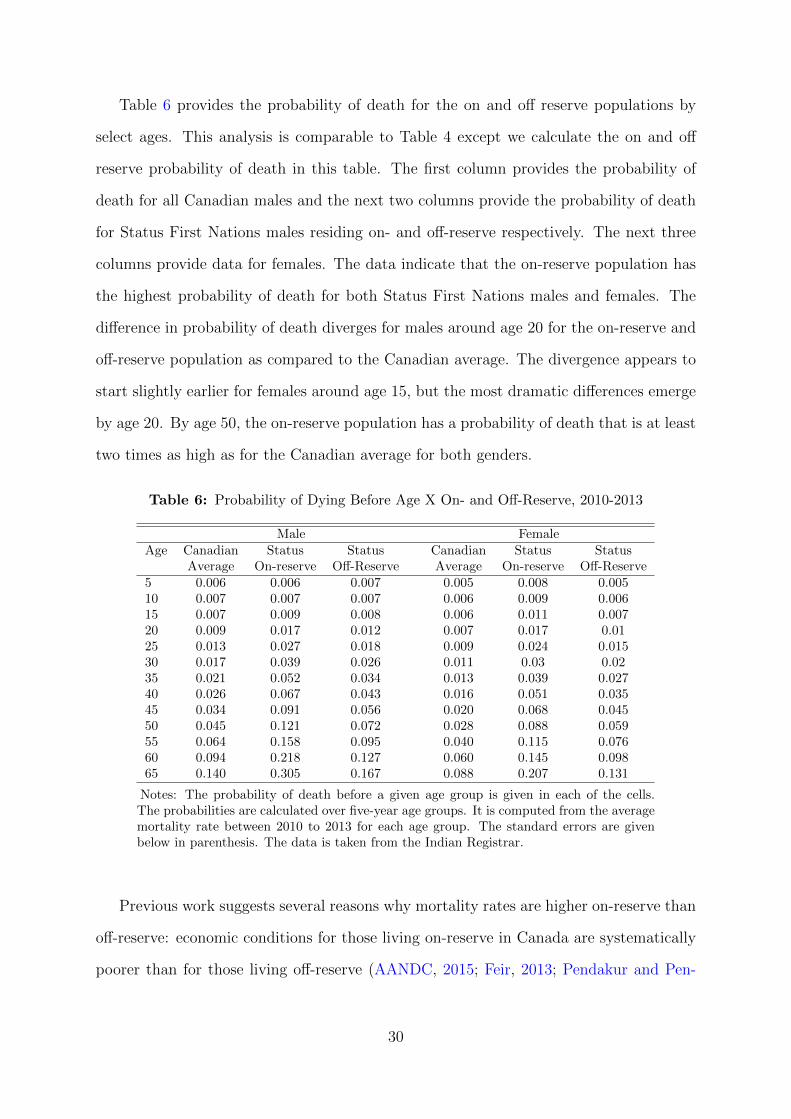
Table 6 provides the probability of death for the on and off reserve populations by
select ages. This analysis is comparable to Table 4 except we calculate the on and off
reserve probability of death in this table. The first column provides the probability of
death for all Canadian males and the next two columns provide the probability of death
for Status First Nations males residing on- and off-reserve respectively. The next three
columns provide data for females. The data indicate that the on-reserve population has
the highest probability of death for both Status First Nations males and females. The
difference in probability of death diverges for males around age 20 for the on-reserve and
off-reserve population as compared to the Canadian average. The divergence appears to
start slightly earlier for females around age 15, but the most dramatic differences emerge
by age 20. By age 50, the on-reserve population has a probability of death that is at least
two times as high as for the Canadian average for both genders.
Table 6: Probability of Dying Before Age X On- and Off-Reserve, 2010-2013
Male FemaleAge Canadian Status Status Canadian Status Status
Average On-reserve Off-Reserve Average On-reserve Off-Reserve5 0.006 0.006 0.007 0.005 0.008 0.00510 0.007 0.007 0.007 0.006 0.009 0.00615 0.007 0.009 0.008 0.006 0.011 0.00720 0.009 0.017 0.012 0.007 0.017 0.0125 0.013 0.027 0.018 0.009 0.024 0.01530 0.017 0.039 0.026 0.011 0.03 0.0235 0.021 0.052 0.034 0.013 0.039 0.02740 0.026 0.067 0.043 0.016 0.051 0.03545 0.034 0.091 0.056 0.020 0.068 0.04550 0.045 0.121 0.072 0.028 0.088 0.05955 0.064 0.158 0.095 0.040 0.115 0.07660 0.094 0.218 0.127 0.060 0.145 0.09865 0.140 0.305 0.167 0.088 0.207 0.131
Notes: The probability of death before a given age group is given in each of the cells.The probabilities are calculated over five-year age groups. It is computed from the averagemortality rate between 2010 to 2013 for each age group. The standard errors are givenbelow in parenthesis. The data is taken from the Indian Registrar.
Previous work suggests several reasons why mortality rates are higher on-reserve than
off-reserve: economic conditions for those living on-reserve in Canada are systematically
poorer than for those living off-reserve (AANDC, 2015; Feir, 2013; Pendakur and Pen-
30

dakur, 2011), unsafe drinking water is a reality for many communities (Simeone, 2010),
and access to emergency medical care is limited (Lavoie et al., 2010).
Next, we present age-standardized mortality rates by province. Figure 4 provides the
observed ASMR for Status First Nations individuals across the Canadian provinces in
the first row and for the average Canadian population in the bottom row. This data
provides an augmented view of geographic differences in mortality rates for the Status
First Nations population. For instance, the mortality rates for the average Canadian is
relatively low across all provinces, but it is particularly low for both males and females
in places such as Alberta. Conversely, Alberta, along with Manitoba and Saskatchewan,
have the highest mortality rates for both Status First Nations males and females; as
a result, the relative mortality rates are exacerbated when one compares First Nations
to average Canadian mortality in different provinces (the results can be see in Figure
A3). We also show that provinces vary in the extent to which Status people have higher
mortality rates than the general population by age group. The details of this can be
found in Figure A4.
31

Figure 4: Age Standardized Mortality Rates by Province, 2010-2013
(270,300] (200,270](170,200] [140,170]
Status Male Mortality Rate
(195,225] (135,195](105,135] [60,105]
Status Female Mortality Rate
(270,300] (200,270](170,200] [140,170]
Non-Status Male Mortality Rate
(195,225] (135,195](105,135] [60,105]
Non-Status Female Mortality Rate
Age-standardized mortality rate: Status First Nations Rate and General population.
Table 7 provides some associative analysis for the differences in mortality rates across
provinces with their respective province-level characteristics. This associative analysis re-
lates the differences in mortality rates between Status and non-Status peoples by province
to the differences between Status and non-Status peoples in the Atlantic provinces (omit-
ted group). The first three columns provide results for male mortality rates for all provin-
cial residents across the time period 2000 to 2011 and the next three columns for females.
We include province and age-group fixed-effects in all analyses.
In the first column we find that Status First Nation males in Alberta, Manitoba and
Saskatchewan have higher relative (Status compared to non-Status) mortality rates as
compared to their counterparts in the Atlantic provinces. Relative mortality rates are
statistically significantly lower for Status First Nations males in Quebec relative to their
counterparts in the Atlantic provinces. Including additional covariates such as average
32

household income percentiles, proportion female and proportion single in column 2 re-
duces the size of the estimated coefficient for Alberta, however, the estimated coefficient
increases in magnitude for both Saskatchewan and Quebec and are still statistically sig-
nificant. In the third column we include measures of the share of provincial employment
in manufacturing or primary industries; this reduces the magnitude and statistical signif-
icance of the estimated coefficients for the Status x Alberta and Status x Saskatchewan
variables but increases the magnitude of the estimated coefficient on the Status x Quebec
variable.
In the next three columns we provide a similar analysis for females. There appears to
be higher relative mortality rates for Status First Nations females in Alberta; however,
this estimated coefficient decreases in magnitude and statistical significance once addi-
tional controls are added in columns 5 and 6. Relative mortality rates are consistently
lower in Quebec for Status First Nations females in all three specifications. These results
show that the high relative mortality rates for Status First Nations females in Alberta and
Saskatchewan are closely tied to economic and social conditions in those two provinces;
the same does not hold for Status First Nations males in those same provinces.
33

Table 7: Regional Variation Explained by Observable Characteristics?
Male Female(1) (2) (3) (4) (5) (6)
AB X Status 137.4∗∗∗ 120.6∗∗∗ 95.49∗ 123.6∗ 38.52 21.02(38.66) (42.534) (51.206) (69.14) (96.117) (105.034)
BC X Status 42.18 30.33 32.97 -70.9 -137.0∗ -116.1(38.184) (37.852) (39.108) (61.84) (75.677) (72.742)
MN X Status 93.82∗∗ 85.35∗∗ 45.52 41.24 -21.72 -66.92(40.733) (38.74) (49.476) (62.766) (89.085) (112.714)
ON X Status 9.37 -22.32 -47.78 -48.71 -97.01 -112.9(37.733) (39.317) (42.851) (54.271) (63.941) (74.449)
QB X Status -67.58∗ -106.5∗∗ -137.7∗∗ -185.7∗∗∗ -218.7∗∗∗ -229.0∗∗∗
(36.277) (50.598) (55.682) (54.464) (79.499) (81.119)SK X Status 142.6∗∗∗ 174.9∗∗∗ 132.1∗∗ 25.6 9.38 -30.51
(50.212) (46.277) (56.697) (59.132) (78.025) (109.77)Dropout 312.4∗∗∗ 361.4∗∗∗ 356.1∗ 397.7∗∗
(118.678) (124.04) (183.917) (187.361)Employed 496.1∗∗∗ 498.4∗∗∗ 368.5∗∗ 336.9∗
(140.216) (134.628) (184.702) (184.536)10-p Family Income -0.345 0.364 0.65 -1.155
(5.31) (5.267) (4.481) (4.748)50-p Family Income -1.596 -1.682 -1.563 -1.398
(1.374) (1.516) (2.214) (2.047)90-p Family Income -1.336 -1.375 0.229 0.214
(1.198) (1.174) (1.216) (1.214)Prop. Lone Parents -278.6 -244.3 -300 -224.5
(200.303) (189.639) (382.977) (383.458)Prop. Female 346.6∗ 370.3∗ -192.6 -249.1
(206.614) (198.674) (316.276) (302.272)Prop. Single -61.27 -48.69 426.5∗∗∗ 396.4∗∗∗
(119.614) (114.214) (137.028) (138.938)Share employed -519.9 -379.8∗∗
in Manufacturing (316.69) (170.127)Share employed -501.4 -171.5in Primary Industries (366.257) (273.853)Status 143.8∗∗∗ 174.7∗∗∗ 160.5∗∗∗ 296.3∗∗∗ 316.1∗∗∗ 280.6∗∗∗
(27.816) (46.03) (45.72) (47.693) (53.738) (63.098)Year -8.737∗∗∗ -6.981∗∗∗ -9.141∗∗∗ -13.34∗∗∗ -11.70∗∗∗ -14.15∗∗∗
(1.525) (1.87) (2.373) (1.812) (2.912) (2.943)Province FE X X X X X XAge Group FE X X X X X X
Observations 378 378 378 378 378 378Adjusted R2 0.877 0.89 0.892 0.899 0.905 0.906
Notes: The outcome variables is the mortality rate obtained from the Indian Register averaged overthe three years surrounding each Census year by Status, gender, age-group, province and year. Censusyears included are 2001, 2006, and 2010. Data on economic characteristics comes from the Censusand the National Household Survey. The omitted provinces are the Atlantic provinces. The omittedage category is 15 to 19. Family income is in 2002 dollars. Robust standard errors in parentheses. ∗
p < 0.10, ∗∗ p < 0.05, ∗∗∗ p < 0.01.
34

5.3 First Nations Mortality across time 2010-2013
In this section we describe changes in the observed mortality rates for Status First Nations
populations in Canada across several decades. In Figure 5 we show the age-standardized
mortality rates for Status males and females and for the general population between 1974
to 2013. The vertical lines indicate the year of Bill C-31 and Bill C-3, which both resulted
in significant changes in the definitions of the Status First Nation population. There are
distinct increases in population counts off-reserve after these changes are made to the
definition of Status First Nations and are shown in Figure A5.27
We first note that mortality has declined significantly for Canadian males from the
1970s onward. A similar decline in mortality rates is observed for both the on and off-
reserve Status First Nations male populations. Two points are worth noting in regard to
the decline for Status First Nations males. First, there is higher variability in mortality
rates primarily due to the fact that these estimates are based off of much smaller pop-
ulations than for the average Canadian male. Second, while it appears that the average
mortality rate has converged for the off-reserve Status First Nation male population, it
is consistently higher for the on-reserve population.
There is a relative reduction in average mortality rates for Canadian females over
time but it is smaller than for men. For the Status First Nation females, before 1985,
there appears to be significant declines in the ASMR but there is quite a lot of variability.
After 1985 there appears to be a level-shift in mortality for Status First Nations females.
There has been virtually no change in ASMR for women subsequently. One reason for this
shift downward in mortality rates could be compositional changes of the First Nations
populations as a result of changes to the definition of First Nations Status in 1985.
27We address the importance of this further in Section 5.4.
35

Figure 5: The Status First Nation Mortality Rates and the General Population per100,000
100
200
300
400
500
600
1970 1980 1990 2000 2010 2020
Male
100
200
300
400
500
600
1970 1980 1990 2000 2010 2020
Female
Off-Reserve On-Reserve Non-Aboriginal
Notes: All populations are standardized to have the age distribution common to all Status FirstNations at the national level in 1991.The vertical lines indicate the year of Bill C-31 and BillC-3.
In Figure 6 we present the ratio of the ASMR in the Status to non-Status ASMR
to highlight the extent to which trends in mortality have mirrored those in the general
population. We have fitted a line to the data by gender and location on or off the reserve.
The first panel presents results for the off-reserve population and the second panel for the
on-reserve population. In the first panel, we observe that the off-reserve population of
both males and females has experienced a significant reduction in the ASMR ratio (which
is indicated by the two downward sloping fitted-lines in the graph). There are still level
differences in the ASMR ratio between males and females (with females having higher
mortality rate ratios), but both appear to have decreased at approximately the same rate
36

from the 1970s onward relative to the general population (allowing for a linear trend).
In the second panel, we fit two lines to the data points for Status female and male
mortality rates for the on-reserve population. These two lines are both horizontal lines.
This result indicates that over time the ratio of the on-reserve Status to non-Status ASMR
has not changed in over 40 years. However, given that there were significant changes in
the definition of Status during the mid-1980s, we next consider what has happened over
time from 1991 to 2011; this time period is subsequent to the largest change to First
Nations Status which occurred in 1985 for women. Our intention in this analysis is to
investigate whether there have been systematic changes in Status First Nations female
mortality over time holding the definition of “Status” constant. Over this period, Status
male mortality rates decreased more quickly than those of Status females. We also include
variation by age group. In Figures A6 and A7 we show trends in the mortality rate by
age group. While generally all figures show a similar pattern, improvements in mortality
tend to be greatest among older age groups and start earlier for men. On the other hand,
in some age groups, on-reserve female mortality appears to be rising.
Table 8 continues this same analysis in a regression setting. We investigate whether
there are associative differences in mortality rates by gender and Status over time. Once
again, we use data for the time period 1991-2011 where there is a single, consistent
definition of ”Status”. The outcome variables in these three regressions are the average
mortality rates by year, gender, and Status. All three models include province and age-
group fixed effects. The first column provides estimated results for the variables Status,
Year and Female and their interactions. Column 2 and 3 add in additional control
variables for income levels, employment, and high school dropout rates and proportion
of the province that is single or female, respectively. There are several points that can
be made from the estimates in this table. First, Status peoples have higher mortality
rates in all three specifications under a time period with consistently defined Status.
Second, mortality rates have been falling for Status and non-Status men over time even
controlling for economic factors. Third, non-Status women have lower mortality rates
37

Figure 6: The Ratio of Status Mortality Rates to General Mortality
1
1.5
2
2.5
3
3.5
1970 1980 1990 2000 2010 2020
Female Male
Female fit Male fit
Off-Reserve
1
1.5
2
2.5
3
3.5
1970 1980 1990 2000 2010 2020
Female Male
Female fit Male fit
On-Reserve
Notes: Ratio of 5 to 64, age-standardized mortality rate: Status First Nations Rate/Generalpopulation.
38

than non-Status men, but their mortality rates are not falling over time at the same rate
as non-Status mens’.
However, we think the estimated coefficient on the interaction term, Status X Female
X Year, is of the most interest. This coefficient suggests that since the 1990s, Status
females have experienced a relative increase in their mortality rates over time relative to
non-Status peoples and Status men. We have noted the relatively higher mortality for
Status females and Table 8 indicates that this difference is increasing over time. This
increase is not explained by readily available, observable factors. In fact, Status women’s
relative economic well-being has been improving faster than for men over this time period
(Feir, 2013) and we would have predicted a reduction in their mortality rates as a result.28
Nor is the increase explained by changes in the composition of the population due to
changes in the definition of First Nations Status after 1985 since this analysis explicitly
holds that factor constant by focusing on the time period 1991-2011.
5.4 Reconciliation and Comparison with Previous Estimates
In this section we compare our estimates of Status First Nations mortality rates to that
of previous research. Our findings are broadly consistent with the patterns observed in
previous work (for example, the age and gender distribution of mortality over the age
of 25). However, we do differ with the Mao et al. (1992) findings that mortality rates
on-reserve are significantly lower than those off-reserve in data. Our results show that
on-reserve mortality rates are much higher than off-reserve mortality rates.
In order to reconcile this stark difference with the findings of Mao et al. (1992), we
restrict analysis to the pre-1985 period prior to the change in the definition of First
Nations Status and a time frame that is consistent with that in Mao et al. (1992). The
data from this time period can be seen in Figure 5. Examining the data points to the
left of 1985 (the first vertical line in the figure) it is immediately clear that the mortality
28We show trends in the employment, the 10th percentile of income, and the proportion of dropoutsfor both Status and non-Status men and women in Figure A8 to illustrate this point.
39

Table 8: Correlation between Mortality rate and ObservableCharacteristics 1991-2011
(1) (2) (3)Status 269.5∗∗∗ 207.6∗∗∗ 209.1∗∗∗
(16.381) (20.086) (20.610)Year -1.951∗∗∗ -3.745∗∗∗ -3.855∗∗∗
(0.404) (0.579) (0.564)Female -81.27∗∗∗ -95.26∗∗∗ -82.93∗∗∗
(7.254) (8.355) (10.909)Status X Year -6.215∗∗∗ -4.623∗∗∗ -5.271∗∗∗
(1.139) (1.102) (1.114)Status X Female -125.3∗∗∗ -120.8∗∗∗ -132.8∗∗∗
(20.087) (19.614) (20.726)Status X Female X Year 4.392∗∗∗ 4.148∗∗∗ 3.843∗∗∗
(1.422) (1.397) (1.367)Female X Year 1.595∗∗∗ 1.984∗∗∗ 1.861∗∗∗
(0.577) (0.570) (0.548)Dropout -14.18 14.22
(43.507) (43.934)Employed -46.60 -38.11
(44.971) (45.750)10-p Family Income -3.170∗∗ -3.306∗∗∗
(1.273) (1.250)50-p Family Income -1.635∗∗∗ -0.949
(0.575) (0.618)90-p Family Income 0.366 0.224
(0.400) (0.402)Prop. Lone Parents 77.81
(71.290)Prop. Female -1.364
(105.389)Prop. Single 153.1∗∗∗
(41.223)Province FE X X XAge Group FE X X XObservations 700 700 700Adjusted R2 0.775 0.786 0.792
Notes: The outcome variables is the mortality rate obtained from theIndian Register averaged over the three years surrounding each Censusyear Status, gender, age-group, and year. Census years included are1991, 1996, 2001, 2006, and 2010. Data on economic characteristicscomes from the Census and the National Household Survey. The omit-ted provinces are the Atlantic provinces. The omitted age category is15 to 19. Family income is in 2002 dollars. Robust standard errors inparentheses. ∗p < 0.10, ∗∗ p < 0.05, ∗∗∗ p < 0.01
40

rates for off-reserve Status females are higher than their on-reserve Status counterparts.
For males, it is a bit more mixed, but there are several high mortality years for off-reserve
Status males prior to 1985. Subsequently, there is an inversion in the mortality rates with
off-reserve Status males experiencing a lower mortality rate over time and approximately
similar result for off-reserve Status females relative to their on-reserve counterparts. We
see this as being primarily driven by compositional changes in the Status First Nations
populations both on and off reserves subsequent to the change in the definition of Status
in 1985.29
A second potential explanation for the observed differences in mortality rates over
time by residence on reserves is the availability and access to quality health care services.
Until the late 1960s, Status peoples’ health care was the responsibility of the Federal
government and Status First Nations people were cared for in racially segregated federal
“Indian hospitals” (Waldram et al., 2006). During the 1960s, 70s and 80s, there was
significant reform in the delivery of health care to Status peoples and a shift of responsi-
bility towards the provinces. We see a constant trend downward in the ASMR during this
period which would be consistent with these reforms improving Status peoples’ health.
These declines are also much stronger for those living off-reserve which is the population
that may gain the most from these reforms (specifically, they would have the greatest de-
gree of access to pre-existing provincial systems of health care). We believe the ultimate
reasons for this decline are of significant interest and would be an interesting and fruitful
area for research.
It is informative to compare our findings to those of Tjepkema et al. (2009) and Park
et al. (2015) and to discuss the Health Canada findings more broadly. As noted earlier,
29Recall that before 1985, if a Status woman married a non-Status man, then she (and her childrenafter the age of 21) would lose their Status, thus implying she (and they) would no longer be included inthe Indian Register. The woman and her children would also lose the right to live on-reserve. Thus, theonly off-reserve First Nations women who are included in the data are women who are either single ormarried to Status men. This applies to their children as well - whether they are male or female. Thus the“off-reserve” population is a very select group. We can see that after 1985, the mortality rates off-reserveplummet rapidly for women and men. This suggests that differential composition of the on/off-reservepopulations is at least in part responsible for the change in mortality rates over time.
41
a significant drawback of the Health Canada studies is that they only have data on
Status peoples’ mortality in British Columbia and Alberta, and on-reserve in Manitoba
and Saskatchewan. As we have shown in Section 5.2, Status mortality rates in Alberta,
Manitoba, and Saskatchewan are the highest in the country, and the on-reserve population
is also subject to higher mortality rates. Thus the national level estimates are lower than
those published by Health Canada for the sub-regions they report on, even accounting
for the potential under-reporting to the Indian Register at older ages.
We also provide evidence that the mortality estimates in Tjepkema et al. (2009) and
Park et al. (2015) likely over-estimate mortality rates for the general Status population.
In Table 9 we show our estimates of Status and non-Status mortality rates relative to
Tjepkema et al. (2009) using the same age standardization to the Status population in
1991 and excluding from our sample members of bands who did not participate in the
1991 Census to make our sample as comparable to Tjepkema et al. (2009) as possible.
We cannot match their sample completely because they excluded individuals that were
not matched between Census records and tax records. This creates an unknown sample
selection and we are unable to replicate this sample in our data for comparison, unfor-
tunately. We exclude the estimates of Park et al. (2015) since they pool both the Status
and non-Status First Nations population and thus are obviously not strictly comparable.
The first thing to note in Table 9 is that between the ages of 25-34 (for both women
and men) our mortality rate estimates are either slightly higher or empirically indistin-
guishable from Tjepkema et al. (2009). Our estimates are lower on average for older age
groups and this difference becomes more pronounced at older ages. If we scaled our esti-
mates up by the amount suggested in Figure A1, it still would not fully account for the
difference between our estimates and Tjepkema’s estimates. Recall that the sample in
Tjepkema et al. (2009) was potentially heavily selected. The table below suggests one of
two things: 1) the sample in (Park et al., 2015; Tjepkema et al., 2009) may be such that
individuals with a higher probability of death are more likely to be observed in their data
due to their sample selection, or 2) the under-reporting in the Indian Register is greater
42

than the comparison with the Health Canada data suggests. Should the latter be the
case, our estimates should be thought of as conservative estimates of Status mortality.
Finally, all of these findings taken together provide an explanation for why the esti-
mates of mortality in Health Canada (2008, 2014) are greater than those in Park et al.
(2015); Tjepkema et al. (2009): the difference is likely due to both the regional selection
inherent in Health Canada (2008, 2014) and the population selection in Park et al. (2015);
Tjepkema et al. (2009).
Table 9: Age Standardized Mortality Rate Reconciliation with (Tjepkema et al.,2009))
Tjepkema et al. 2009 Our Best Comparable EstimatesMen Status General Pop Status General Pop25-34 310.2 105.1 340.8 110.9
(18.02) (1.73) (51.77) (14.82)35-44 508.9 207.3 440.1 175.7
(28.22) (2.39) (82.15) (18.3)45-54 1077 573 760.4 377.9
(54.26) (4.87) (112.32) (26.86)55-64 2411.1 1621.3 1652.3 1053.1
(113.45) (9.34) (223.66) (105.77)Women25-34 168.3 52 175.4 44.1
(11.32) (1.17) (27.78) (3.11)35-44 335.3 131.2 270 94.6
(20.15) (1.88) (47.92) (3.59)45-54 766 336.1 482.1 233.3
(41.17) (3.86) (45.49) (12.05)55-64 1837.5 844 1050.9 607.6
(90.51) (7.26) (126.48) (42.21)
Notes: Age-standardized mortality Rates per 100,000 from 1991 to 2001 age standard-ized to the 1991 Status age distribution as per Tjepkema et al. (2009). Our ”best compa-rable estimates” refer to restricting the analysis to the same time period, standardizingby the closest age distribution we have available (we cannot fully replicate the sampleselection in Tjepkema et al. (2009)) and doing the same age groups.
43
6 Conclusion
In this work we provided novel estimates of Status youth mortality, evidence on vari-
ation in mortality by region and residence, and longitudinal estimates of First Nations
mortality. We established several stylized facts about Status First Nations mortality in
Canada:
1. On-reserve mortality rates are higher on average than off-reserve mortality rates for
Status First Nations peoples.
2. The highest mortality rates are observed for Status youth under the age of 25 – the
mortality rates of on-reserve Status girls between 15 and 19 are nearly five times as
high as the general population.
3. Status women and girls between the ages of 10 to 44 have higher mortality rate
ratios (compared to the general Canadian population) than Status men.
4. With the exception of the 10 to 14 year old age group, Status men have the highest
overall probability of death: while there is 14 percent chance of dying before the age
of 65 for the average Canadian man, there is a 24 percent chance of dying before
the age of 65 for a Status man living on-reserve.
5. There is significant regional variation in mortality rates that are correlated with
economic factors and the highest mortality rates are found in the prairie provinces.
6. Mortality rates have not improved for women and girls on reservation in the last
30 years, and relative mortality rates have not improved on-reserve for all Status
people in the past 40 years. However, absolute and relative mortality rates have
fallen for off-reserve Status men and women over time.
Based on these findings, we believe productive research in the future would examine the
early, most dramatic declines in off-reserve Status mortality rates and discern the effects
44
of dramatic shifts in policy from dramatic shifts in selection. Developing a further un-
derstanding of differences between on- and off-reserve mortality rates and the shockingly
high relative mortality rates of women and girls would also be a major contribution, as
would be a more complete understanding of the regional distribution of mortality. Future
work should continue with the recommendations of the Truth and Reconciliation Com-
mission by tracking trends in mortality and other health statistics and work to improve
the relative state of First Nations’ health in Canada.
45

Compliance with Ethical Standards:
Funding: No grants or other external funding were used for this project.
Conflict of Interest: The authors declare that they have no conflict of interest.
References
AANDC (2015). The Community Well-Being Index: Well-being in First Nations Com-munities, 1981-2011. Aboriginal Affairs and Northern Development Canada, Ottawa.
Abrevaya, J. (2009). Are there missing girls in the United States? Evidence from birthdata. American Economic Journal: Applied Economics 1 (2), 1–34.
Ahmad, O. B., C. Boschi-Pinto, A. D. Lopez, C. J. Murray, R. Lozano, M. Inoue, et al.(2001). Age standardization of rates: a new who standard. Geneva: World HealthOrganization 31, 1–14.
Akee, R. and D. Feir (2016, December). Excess mortality, institutionalization and home-lessness among status indians in canada. Technical Report 10416, Institute of LaborEconomics, Bonn, Germany.
Almond, D. and L. Edlund (2008). Son-biased sex ratios in the 2000 united states census.Proceedings of the National Academy of Sciences 105 (15), 5681–5682.
Almond, D., L. Edlund, and K. Milligan (2009). O sister, where art thou? The role of sonpreference and sex choice: Evidence from immigrants to canada. Technical Report15391, National Bureau of Economic Research.
Amnesty International (2015). No more stolen sisters. Technical report, Amnesty Interna-tional. http://www.amnesty.ca/our-work/campaigns/no-more-stolen-sisters.
Anderson, S. and D. Ray (2010). Missing women: Age and disease. Review of EconomicStudies 77 (4), 1262–1300.
Bulte, E., N. Heerink, and X. Zhang (2011). Chinas one-child policy and the mysteryof missing women: Ethnic minorities and male-biased sex ratios. Oxford Bulletin ofEconomics and Statistics 73 (1), 21–39.
Das-Gupta, M. (2005). Explaining Asias missing women: A new look at the data. Pop-ulation and Development Review 31 (3), 539–535.
Das-Gupta, M. (2006). Cultural versus biological factors in explaining Asias missingwomen: Response to Oster. Population and Development Review 32 (2), 328–332.
Deaton, A. (2013). The Great Escape: Health, wealth, and the origins of inequality.Princeton University Press.
46

Duflo, E. (2012). Women empowerment and economic development. Journal of EconomicLiterature 50 (4), 1051–1079.
Feir, D. (2013). Size, structure, and change: Exploring the sources of Aboriginal earningsgaps in 1995 and 2005. Canadian Public Policy 32 (2), 309–334.
Feir, D. and R. Hancock (2016). Answering the call: A guide for quantitative socialscientists and reconciliation. Canadian Public Policy 42 (3), 350–365.
Fortin, N., T. Lemieux, and S. Firpo (2011). Decomposition methods in economics.Handbook of labor economics 4, 1–102.
Furi, M. and J. Wherrett (2003, February). Indian status and band membership issues.Technical Report BP-410E, Political and Social Affairs Division. Parliamentary Re-search Branch. Library of Parliament, Ottawa. http://www.lloydminster.info/
pdf/ca/YM32-2-410-2003-02E.pdf.
George, P. and P. Kuhn (1994). The size and structure of native-white wage differentialsin canada. Canadian Journal of Economics 27 (1), 20–42.
Guillot, M. (2011). Period versus cohort life expectancy. International Handbook of AdultMortality , 533–549.
Health Canada (2008). A statistical profile on the health of first nations in canada:Vital statistics for atlantic and western canada, 2001/2002. Technical Report 3558,Minister of Health Canada. http://www.hc-sc.gc.ca/fniah-spnia/alt_formats/pdf/pubs/aborig-autoch/stats-profil-atlant/vital-statistics-eng.pdf.
Health Canada (2014, July). A statistical profile on the health of First Nations inCanada: Vital statistics for Atlantic and Western Canada, 20032007. Technical Re-port 140128, Minister of Health Canada, Ottawa, ON. http://publications.gc.
ca/collections/collection_2014/sc-hc/H34-193-3-2014-eng.pdf.
Hurley, M. C. and T. Simeone (2014). Bill c-3: Gender equity in Indian registration act.Aboriginal Policy studies 3 (3).
Indigenous and Northern Affairs Canada (2010). History of Bill C-3. Technical report, TheGovernment of Canada. https://www.aadnc-aandc.gc.ca/eng/1100100032484/
1308161570086.
Jha, P., R. Kumar, P. Vasa, N. Dhingra, D. Thiruchelvam, and R. Moineddin (2006).Low male-to-female sex ratio of children born in India: National survey of 1.1 millionhouseholds. The Lancet 367 (9506), 211–218.
Klasen, S. and C. Wink. (2002). A turning point in gender bias in mortality: An updateon the number of missing women. Population and Development Review 28 (2), 285–312.
Lavoie, J. G., E. L. Forget, A. J. Browne, et al. (2010). Caught at the crossroad: Firstnations, health care, and the legacy of the indian act. Pimatisiwin: A Journal ofAboriginal and Indigenous Community Health 8 (1), 83–100.
47

Levin, D. (2016, May). Tears for missing women and girls stain a highway in Canada.Technical report, New York Times.
Mao, Y., B. W. Moloughney, R. M. Semenciw, and H. I. Morrison (1992). Indian reserveand registered indian mortality in canada. Canadian Journal of Public Health= Revuecanadienne de sante publique 83 (5), 350–353.
O’Donnell, V. and S. Wallace (2011). First nations, Metis and Inuit women. Womenin Canada: a gender-based statistical report. Technical report, Statistics Canada,Ottawa, Canada.
Park, J., M. Tjepkema, N. Goedhuis, and J. Pennock (2015). Avoidable mortalityamong first nations adults in canada: a cohort analysis. Statistics Canada HealthReports 26 (8), 10–16.
Pendakur, K. and R. Pendakur (1998). The colour of money: Earnings differentialsamong ethnic groups in canada. Canadian Journal of Economics 3 (31), 518–548.
Pendakur, K. and R. Pendakur (2011). Aboriginal income disparity in Canada. CanadianPublic Policy 37 (1), 6183.
Rosenblum, D. (2013). The effect of fertility decisions on excess female mortality in India.Journal of Population Economics 26 (1), 147–180.
Schulhofer-Wohl, S. and R. M. Todd (2015, November). High death rates on thehigh plains: A call for better data on American Indian communities. Technical re-port, Center for Indian Country Development, Federal Reserve Bank of Minneapo-lis. https://www.minneapolisfed.org/indiancountry/research-and-articles/
cicd-blog/high-death-rates-on-the-high-plains.
Sen, A. (1992). Missing women. British Medical Journa 304 (6827), 587–588.
Simeone, T. (2010). Safe drinking water in First Nations communities. ParliamentaryInformation and Research Service.
Statistics Canada (2017, November). Data tables, 2016 Census – Aboriginal peoples.Technical Report 98-400-X2016155, Statistics Canada Catalogue.
The Economist (2014, May). A weeping sore. Technical report, TheEconomist. http://www.economist.com/blogs/americasview/2014/05/
canadas-indigenous-peoples.
The Government of Canada (2011). The indian register. Technical report, TheGovernment of Canada. https://www.aadnc-aandc.gc.ca/eng/1100100032475/
1100100032476.
The Government of Canada (2015). Government of canada launches inquiry into missingand murdered indigenous women and girls. Technical report, The Government ofCanada. http://news.gc.ca/web/article-en.do?nid=10239.
48

Tjepkema, M., R. Wilkins, S. Sencal, ric Guimond, and C. Penney (2009). Mortality ofMtis and Registered Indian adults in Canada: an 11-year follow-up study. StatisticsCanada Health Reports 20 (4), 31–63.
TRC (2015). Honouring the truth, reconciling for the future: Summary of the final reportof the Truth and Reconciliation Commission of Canada. Technical report, Truth andReconciliation Commission of Canada.
Truth and Reconciliation Commission of Canada (TRC) (2015). Honouring the truth,reconciling for the future: Summary of the final report of the Truth and ReconciliationCommission of Canada. Technical report, Truth and Reconciliation Commission ofCanada.
United Nations (2009). State of the world’s indigenous peoples, Volume 9. United NationsPublications.
Waldram, J. B., A. Herring, and T. K. Young (2006). Aboriginal health in Canada:Historical, cultural, and epidemiological perspectives. University of Toronto Press.
49

Compliance with Ethical Standards:
Funding: No grants or other external funding was used for this project.
Conflict of Interest: The authors declare that they have no conflict of interest.
50
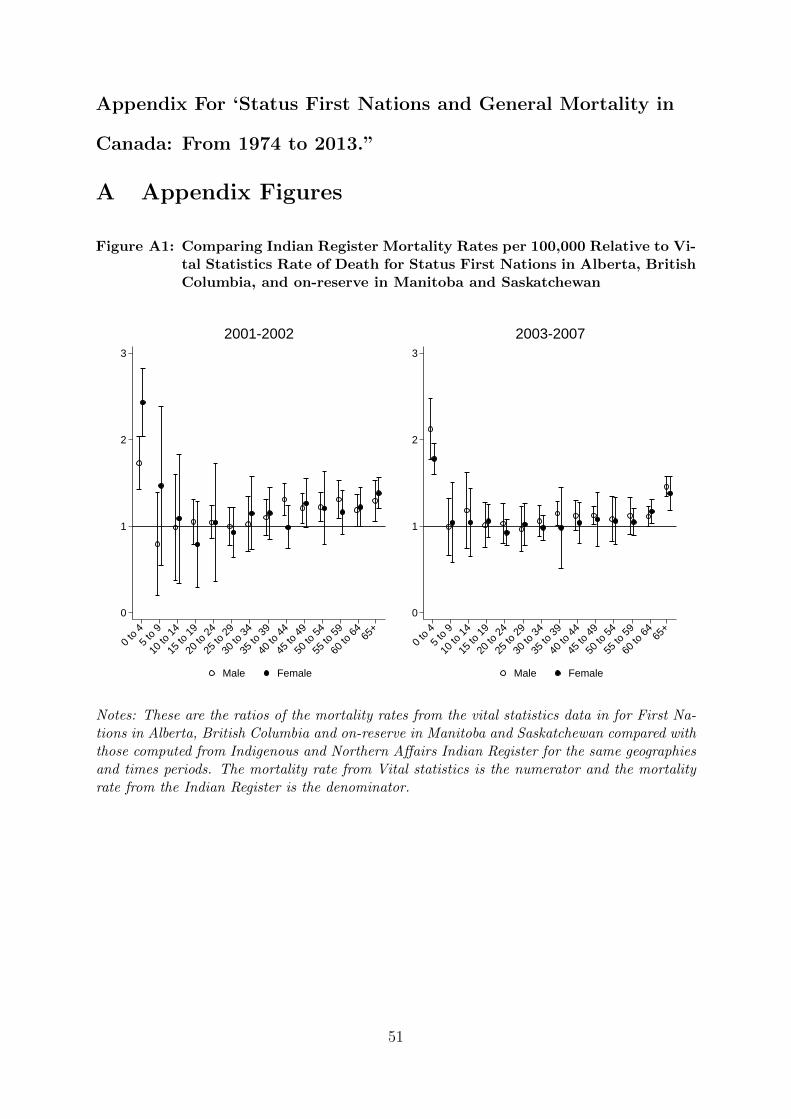
Appendix For ‘Status First Nations and General Mortality in
Canada: From 1974 to 2013.”
A Appendix Figures
Figure A1: Comparing Indian Register Mortality Rates per 100,000 Relative to Vi-tal Statistics Rate of Death for Status First Nations in Alberta, BritishColumbia, and on-reserve in Manitoba and Saskatchewan
0
1
2
3
0 to
45
to 9
10 to
14
15 to
19
20 to
24
25 to
29
30 to
34
35 to
39
40 to
44
45 to
49
50 to
54
55 to
59
60 to
64
65+
Male Female
2001-2002
0
1
2
3
0 to
45
to 9
10 to
14
15 to
19
20 to
24
25 to
29
30 to
34
35 to
39
40 to
44
45 to
49
50 to
54
55 to
59
60 to
64
65+
Male Female
2003-2007
Notes: These are the ratios of the mortality rates from the vital statistics data in for First Na-tions in Alberta, British Columbia and on-reserve in Manitoba and Saskatchewan compared withthose computed from Indigenous and Northern Affairs Indian Register for the same geographiesand times periods. The mortality rate from Vital statistics is the numerator and the mortalityrate from the Indian Register is the denominator.
51

Figure A2: Mortality Rate Ratio of Native and African Americans to GeneralCanadian Population, 2010-2013
12
34
5
15 to
19
20 to
24
25 to
29
30 to
34
35 to
39
40 to
44
45 to
49
50 to
54
55 to
59
60 to
64
Canada
12
34
5
15 to
19
20 to
24
25 to
29
30 to
34
35 to
39
40 to
44
45 to
49
50 to
54
55 to
59
60 to
64
United States
Male Female
Notes: The y-axis denotes ratio of either Native American or African mortality rates divided bythe general Canadian mortality rate. The data on by race mortality rates were computed usingcounts on number of deaths and population from CDC Wonder datafiles on Underlying Causeof Death, 1999-2015 Centers for Disease Control and Prevention. https://wonder.cdc.gov/ucd-icd10.html. The Canadian mortality rates are generated using data from Health Canada VitalStatistics Birth and Death database compiled by Statistics Canada.
52

Figure A3: Age Standardized Mortality Rates by Province, 2010-2013
(2,2.2](1.5,2](1.25,1.5][1,1.25]
Male Mortality Rate Ratio
(2,2.2](1.5,2](1.25,1.5][1,1.25]
Female Mortality Rate Ratio
Age-standardized mortality rate: Status First Nations Rate/General population.
53
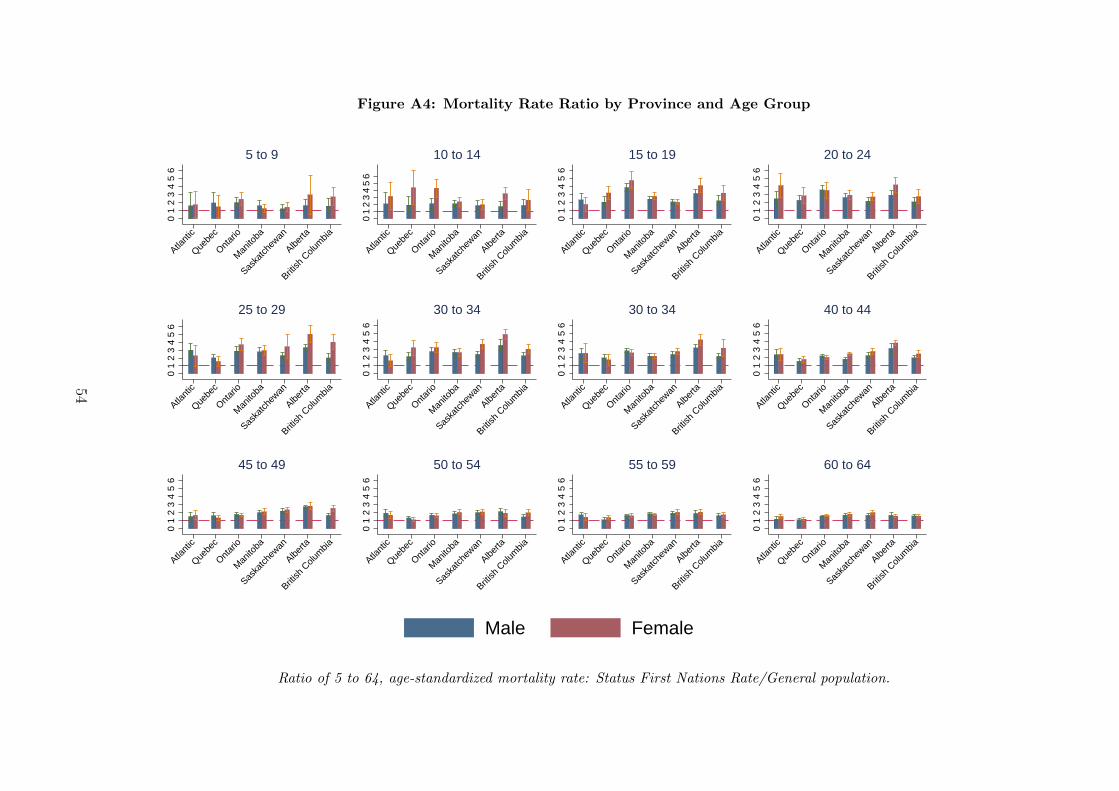
Figure A4: Mortality Rate Ratio by Province and Age Group
01
23
45
6
Atlant
icQue
bec
Ontar
ioM
anito
ba
Saska
tchew
anAlbe
rta
British
Colu
mbia
5 to 9
01
23
45
6
Atlant
icQue
bec
Ontar
ioM
anito
ba
Saska
tchew
anAlbe
rta
British
Colu
mbia
10 to 14
01
23
45
6Atla
ntic
Quebe
cOnt
ario
Man
itoba
Saska
tchew
anAlbe
rta
British
Colu
mbia
15 to 19
01
23
45
6
Atlant
icQue
bec
Ontar
ioM
anito
ba
Saska
tchew
anAlbe
rta
British
Colu
mbia
20 to 240
12
34
56
Atlant
icQue
bec
Ontar
ioM
anito
ba
Saska
tchew
anAlbe
rta
British
Colu
mbia
25 to 29
01
23
45
6
Atlant
icQue
bec
Ontar
ioM
anito
ba
Saska
tchew
anAlbe
rta
British
Colu
mbia
30 to 34
01
23
45
6Atla
ntic
Quebe
cOnt
ario
Man
itoba
Saska
tchew
anAlbe
rta
British
Colu
mbia
30 to 34
01
23
45
6
Atlant
icQue
bec
Ontar
ioM
anito
ba
Saska
tchew
anAlbe
rta
British
Colu
mbia
40 to 44
01
23
45
6
Atlant
icQue
bec
Ontar
ioM
anito
ba
Saska
tchew
anAlbe
rta
British
Colu
mbia
45 to 49
01
23
45
6
Atlant
icQue
bec
Ontar
ioM
anito
ba
Saska
tchew
anAlbe
rta
British
Colu
mbia
50 to 54
01
23
45
6Atla
ntic
Quebe
cOnt
ario
Man
itoba
Saska
tchew
anAlbe
rta
British
Colu
mbia
55 to 59
01
23
45
6
Atlant
icQue
bec
Ontar
ioM
anito
ba
Saska
tchew
anAlbe
rta
British
Colu
mbia
60 to 64
Male Female
Ratio of 5 to 64, age-standardized mortality rate: Status First Nations Rate/General population.
54

Figure A5: The Status First Nation Population, 100,000s
510
1520
25S
tatu
s P
opul
atio
n, 1
0,00
0s
1970 1980 1990 2000 2010 2020
On-reserve Male On-reserve FemaleOff-reserve Male Off-reserve Female
Notes: This figure shows the increase in the Status First Nation population from 1970 to 2016.The vertical lines indicate the year of Bill C-31 and Bill C-3.
55
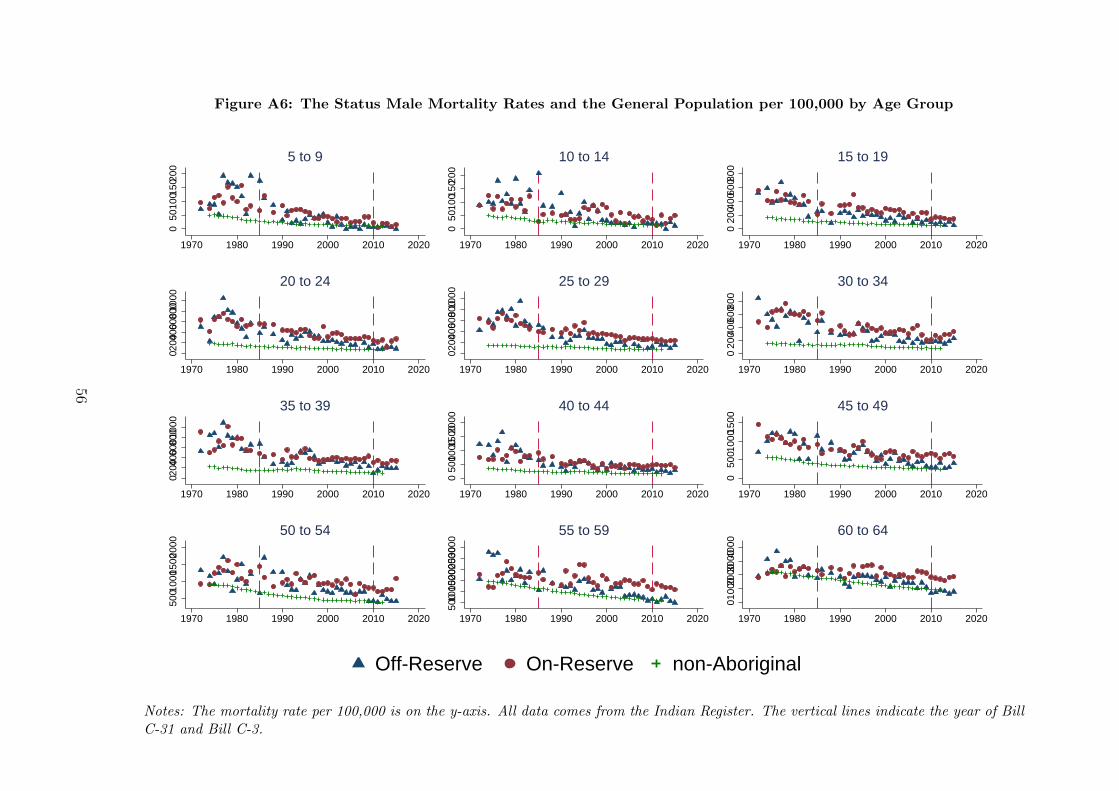
Figure A6: The Status Male Mortality Rates and the General Population per 100,000 by Age Group
050
1001
5020
0
1970 1980 1990 2000 2010 2020
5 to 9
050
1001
5020
0
1970 1980 1990 2000 2010 2020
10 to 14
020
0400
6008
00
1970 1980 1990 2000 2010 2020
15 to 1902
00400 6
008001
000
1970 1980 1990 2000 2010 2020
20 to 24
0200 4
00 6008
00100
0
1970 1980 1990 2000 2010 2020
25 to 29
020
0400
6008
00
1970 1980 1990 2000 2010 2020
30 to 34
0200 4
00 6008
00 100
0
1970 1980 1990 2000 2010 2020
35 to 39
050
010001
50020
00
1970 1980 1990 2000 2010 2020
40 to 44
050
0100
0150
0
1970 1980 1990 2000 2010 2020
45 to 49
5001
000 1
5002
000
1970 1980 1990 2000 2010 2020
50 to 54
50010
00150020
00250030
00
1970 1980 1990 2000 2010 2020
55 to 59
0100
020003
00040
00
1970 1980 1990 2000 2010 2020
60 to 64
Off-Reserve On-Reserve non-Aboriginal
Notes: The mortality rate per 100,000 is on the y-axis. All data comes from the Indian Register. The vertical lines indicate the year of BillC-31 and Bill C-3.
56
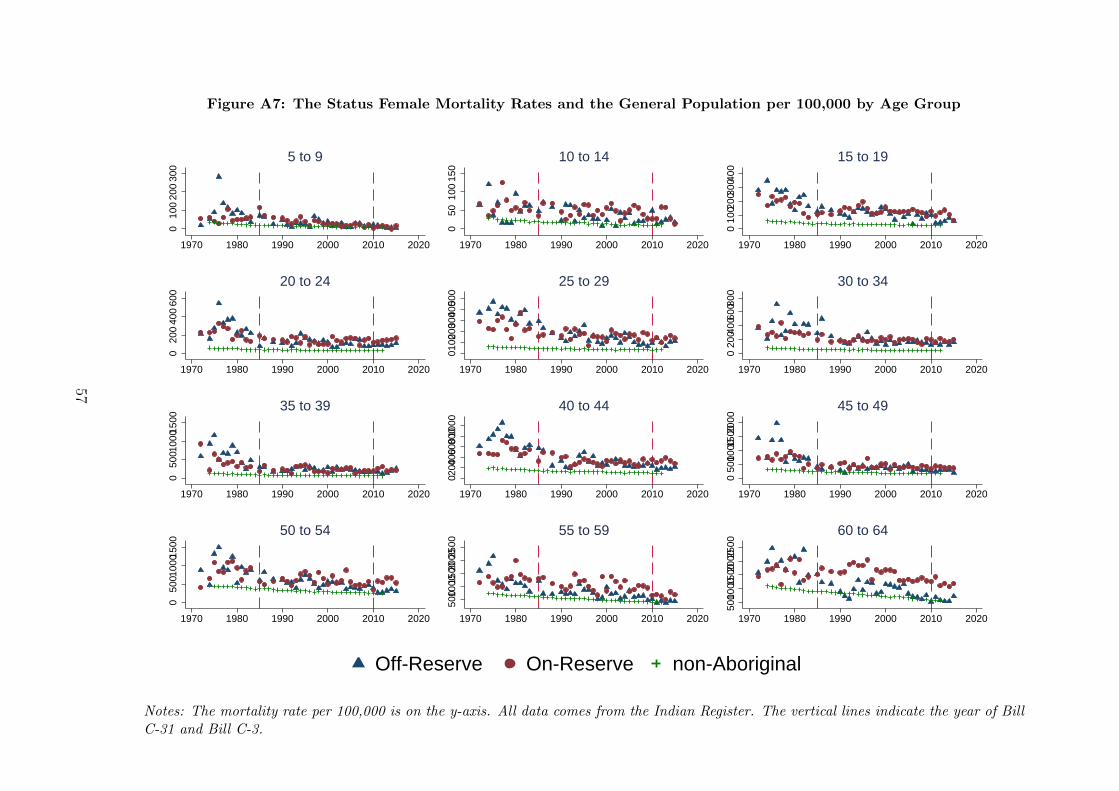
Figure A7: The Status Female Mortality Rates and the General Population per 100,000 by Age Group
010
020
030
0
1970 1980 1990 2000 2010 2020
5 to 9
050
100
150
1970 1980 1990 2000 2010 2020
10 to 14
010
0200
3004
00
1970 1980 1990 2000 2010 2020
15 to 190
200
400
600
1970 1980 1990 2000 2010 2020
20 to 24
0100 2
00 3004
00500
1970 1980 1990 2000 2010 2020
25 to 29
020
0400
6008
00
1970 1980 1990 2000 2010 2020
30 to 34
050
0 100
0150
0
1970 1980 1990 2000 2010 2020
35 to 39
02004
00600 8
00100
0
1970 1980 1990 2000 2010 2020
40 to 44
050
010001
50020
00
1970 1980 1990 2000 2010 2020
45 to 49
050
0 100
0150
0
1970 1980 1990 2000 2010 2020
50 to 54
50010
00150
020002
500
1970 1980 1990 2000 2010 2020
55 to 59
50010
00150
020002
500
1970 1980 1990 2000 2010 2020
60 to 64
Off-Reserve On-Reserve non-Aboriginal
Notes: The mortality rate per 100,000 is on the y-axis. All data comes from the Indian Register. The vertical lines indicate the year of BillC-31 and Bill C-3.
57

Figure A8: Trends in Economic Observable Characteristics by Status and Gender
.4
.5
.6
.7
.8E
mpl
oyed
1990 1995 2000 2005 2010
Male
.3
.4
.5
.6
.7
Em
ploy
ed
1990 1995 2000 2005 2010
Female
95% CI Status95% CI General
8.8
9
9.2
9.4
9.6
9.8
ln(f
amily
inco
me
at 1
0th
perc
entil
e)
1990 1995 2000 2005 2010
Male
9
9.2
9.4
9.6
9.8ln
(fam
ily in
com
e at
10t
h pe
rcen
tile)
1990 1995 2000 2005 2010
Female
95% CI StatusGeneral
0
.2
.4
.6
.8
Pro
port
ion
Dro
p-ou
t
1990 1995 2000 2005 2010
Male
0
.2
.4
.6
.8
Pro
port
ion
Dro
p-ou
t
1990 1995 2000 2005 2010
Female
95% CI Status95% CI General
Data from the 1991, 1996, 2001, and 2006 Census and 2011 NHS.
58

B Appendix Tables
59

Table A1: Summary of Mortality Rates per 100,000, 2000-2009
Males FemalesCanadian All Status Off-Reserve On-Reserve Canadian All Status Off-Reserve On-ReserveAverage First Nations Average First Nations
ASMR 129.89 229.08 199.55 249.72 76.56 154.15 156.16 152.59(05 to 64) (2.22) (18.68) (29.3) (14.5) (1.05) (10.83) (13.56) (12.11)Age Group05 to 09 12.04 24.21 12.26 31.18 9.35 19.81 21.35 18.82
(1.52) (6.36) (11.86) (8.6) (1.56) (6.96) (10.08) (8.06)10 to 14 15.13 33.75 22.78 40.3 10.89 39.12 32.21 43.29
(1.83) (10.07) (12) (12.76) (1.41) (9.73) (14.09) (15.55)15 to 19 58.73 186.73 138.43 216.63 27.41 109.63 94.98 119.01
(5.06) (35.47) (37.55) (45.86) (1.89) (8.67) (24.9) (12.98)20 to 24 82.16 264.89 212.77 299.78 31.37 127.57 108.96 140.9
(4.62) (41.3) (56.06) (46.76) (1.6) (16.64) (34.34) (26.73)25 to 29 79.78 235.26 186.59 271.98 33.69 140.29 119.6 157.59
(3.05) (30.53) (50.16) (29.01) (1.63) (24.35) (35.98) (28.51)30 to 34 88.78 270.35 228.42 306.16 44.45 180.31 176.02 184.38
(5.15) (46.45) (56.42) (69.28) (1.99) (24.56) (30.66) (29.85)35 to 39 116.98 325.96 284.42 363.29 66.92 210.45 211.97 208.87
(7.3) (45.1) (71.76) (31.7) (4.93) (35.85) (42.74) (45.25)40 to 44 167.85 403.76 382.68 423.65 104.15 284.57 276.59 293.42
(8.37) (37.37) (85.69) (42.83) (4.85) (33.36) (49.4) (42.65)45 to 49 264.06 540.13 460.92 609.5 171.69 363.37 352.01 376.38
(14.82) (74.24) (119.59) (71.15) (7.07) (51.45) (77.97) (49.66)50 to 54 421.8 768.91 674.99 843.97 268.26 499.81 466.22 540.03
(17.14) (108) (129.63) (122.53) (7.84) (83.23) (68.74) (144.12)55 to 59 662.51 1123.07 921.67 1279.66 412.69 776.27 624.33 961.25
(34.38) (132.06) (218.51) (138.25) (19.63) (136.6) (121.94) (206.19)60 to 64 1064.92 1707.91 1425.78 1919.47 654.06 1095.68 904.22 1324.76
(90.64) (175.33) (326.69) (161.32) (43.32) (171.82) (223.69) (136.95)
Notes: Data comes from the Indian Register and Health Canada Vital Statistics Births and Death Database. The age standardizedmortality rates (ASMR) are standardized to the age distribution of Status people in 2010.
60
![· PDF filecolorectal cancer risk comes from studies on migrant ... and that age-standardized mortality rates of ... Kune [271 Tuyns [28] Tuyns [29]](https://img.pdfslide.us/doc/110x75/5aa8befa7f8b9a6c188be568/cancer-risk-comes-from-studies-on-migrant-and-that-age-standardized-mortality.jpg)