Embed Size (px)
Citation preview

Statewide Trends
Local sales tax collections in New York State for the first half of 2018 were $8.5 billion, a 6.0 percent increase over the same period last year. This was the highest half-year increase since 2010 and the fourth consecutive period of strengthening local sales tax collections.1 (See Figure 1.)
Regional Trends
In the first half of 2018, sales tax collections grew in every region of the State compared to the first half of 2017. Growth was stronger than in the first half of the previous year in all regions except in the Finger Lakes, where it slowed from 4.0 percent to 3.1 percent.
New York City experienced the strongest growth at 6.9 percent, its highest year-over-year increase since the first half of 2013. Growth was also particularly strong in the Mid-Hudson, Mohawk Valley and Southern Tier regions, which each had increases of 5.8 percent. Collections in the Central New York, Finger Lakes and Western New York regions all grew more slowly in comparison, albeit still at a moderate pace. (See Figure 2.)
Thomas P. DiNapoli, State Comptroller
OFFICE OF THE NEW YORK STATE COMPTROLLER
Division of Local Government and School Accountability August 2018
First Half of 2018: Highest Growth in Local Sales Tax Collections in Almost Eight Years
-9.0%
10.6%
5.7%1.6%
6.0%
-15%-10%-5%0%5%
10%15%
H1 20
08H2
2008
H1 20
09H2
2009
H1 20
10H2
2010
H1 20
11H2
2011
H1 20
12H2
2012
H1 20
13H2
2013
H1 20
14H2
2014
H1 20
15H2
2015
H1 20
16H2
2016
H1 20
17H2
2017
H1 20
18
Recession
Year-Over-Year Percentage Change in Local Sales Tax Collections by Half-Year
Sources: New York State Department of Taxation and Finance, with calculations by the Office of the New York State Comptroller (OSC). Notes: Includes New York City (NYC). Adjusted for correction adding $238 million to collections for NYC in calendar year 2015.
Figure 1
Figure 2
Percentage Change in Local Sales Tax Collections by Region, First Half 2017 to First Half 2018
Source: New York State Department of Taxation and Finance with OSC calculations. Includescounty and city sales taxes.
5.6%4.8%
3.1%
5.8%5.0%
5.8%4.5%
5.5% 5.8%6.9%
Upstate Downstate
Statewide: 6.0%
Percentage Change in Local Sales Tax Collections by Region, First Half 2017 to First Half 2018
Source: New York State Department of Taxation and Finance, with calculations by OSC. Includes county and city sales taxes.
Figure 2
Capital Central Finger Mohawk North Southern Western Long Mid- New District NY Lakes Valley Country Tier NY Island Hudson York
City
Upstate Downstate

2 Office of the New York State Comptroller August 2018
Factors and Influences
Several economic factors may have helped to boost this continued statewide growth in local sales tax collections. The State’s unemployment rate for June 2018 was 4.5 percent, the lowest in over a decade.2 Meanwhile, wage growth in the first half of 2018 has remained mostly steady overall, slightly outpacing last year. Consumer confidence is also quite high, spending is up slightly and tourism remains strong throughout the State.3 Inflation increased by 2.9 percent in June 2018 over June 2017, the highest year-over-year increase since June 2011.4
Motor Fuel Collections
One major factor affecting sales tax collections at the local level, especially in the upstate regions, is the amount generated from the sale of motor fuel. The motor fuel sales tax component increased by 13.9 percent from the first half of 2017, marking the third consecutive half-year increase. (See Figure 3.)
Motor fuel sales tax collections are closely related to gas prices, and over the past year, prices have increased by 12.6 percent, from an average price of $2.56 per gallon in the first half of 2017 to $2.89 in the first half of 2018.
Recent Supreme Court Ruling
In June 2018, the U.S. Supreme Court’s ruling in South Dakota v. Wayfair reversed certain prior decisions (including Quill Corp. v. North Dakota), thereby giving states the authority to require online retailers to collect and remit sales taxes on goods and services whether or not they have a physical presence in the state.5 This ruling may allow states to enact laws to collect from small internet sellers who use marketing and distribution services on marketplace platforms, which they did not have the authority to collect from under Quill. However, under the new ruling, states are still required to establish some standard of economic presence to determine which remote sellers are subject to the collection and remittance of their sales taxes. It is unclear what impact the Supreme Court’s decision will have in New York. The State has previously taken steps to pursue the collection of sales taxes on online sales.
-40%-30%-20%-10%
0%10%20%30%40%
H1 20
09H2
2009
H1 20
10H2
2010
H1 20
11H2
2011
H1 20
12H2
2012
H1 20
13H2
2013
H1 20
14H2
2014
H1 20
15H2
2015
H1 20
16H2
2016
H1 20
17H2
2017
H1 20
18
Gas Prices (New York)Motor Fuel Sales Tax
Year-Over-Year Percentage Change in New York State Gas Prices and Motor Fuel Sales Tax Collections by Half-Year
Figure 3
Sources: New York State Department of Taxation and Finance, Office of Tax Policy Analysis; United States Department of Energy, Energy Information Administration, with calculations by OSC. Notes: Includes New York City. Half-year gas price changes are based on an average of monthly prices.

3August 2018 Division of Local Government and School Accountability
County Collections
In the first half of 2018, sales tax collections grew in 54 of the 57 counties outside of New York City. The strongest growth was in Hamilton County at 38.9 percent, followed by Sullivan (18.0 percent), Fulton (14.7 percent) and Tioga (12.5 percent) counties. Motor fuel collections have been very strong in several upstate counties, including Allegany, Cattaraugus and Tioga. Local officials believe this may be a result of gasoline prices in New York being consistently lower than in neighboring Pennsylvania, which has helped to boost overall sales tax collections in their counties.
Because the total of the sales taxes collected by each of these counties on a monthly basis is relatively small, even modest shifts in dollar amounts can result in large percentage changes. This includes any shifts due to technical adjustments.6 For instance, Hamilton County had a total of $290,241 in technical adjustments in the first half 2018, which equaled 16 percent of its total collections.
Wyoming and Seneca counties both had year-over-year increases of less than 1.0 percent, while collections in Cayuga (-5.8 percent), Oswego (-1.9 percent) and Schenectady (-1.8 percent) counties all declined when compared to the first half of 2017. Technical adjustments hurt overall growth for the counties with collection decreases, particularly in Oswego County, where a total of $1.4 million in technical adjustments caused overall collections to decline compared to the same period last year. (For a list of county and city sales tax collections, please see the Appendix on page 6.)
Wyoming
Westchester
Washington
Warren
St. Lawrence
Seneca
Schoharie
Schenectady
Saratoga
Rockland
Otsego
Oswego
Orleans
Orange
Ontario
OneidaNiagara
New York City Nassau
Montgomery
Monroe
Jefferson
Herkimer
Greene
Franklin
Erie
Dutchess
Delaware
Cortland
Clinton
Chautauqua
Cayuga
Broome
Ulster
Yates
Wayne
Tompkins
Tioga
Sullivan
Suffolk
Steuben
Schuyler
Rensselaer
Putnam
Onondaga
Madison
Livingston
LewisHamilton
GeneseeFulton
Essex
Columbia
Chenango
ChemungCattaraugus Allegany
Albany
Change in County Sales Tax Collections, First-Half 2017 to First-Half 2018County KIP
DeclineIncrease between 3 percent and 6 percentIncrease between 6 percent and 9 percentIncrease less than 3 percentIncrease more than 9 percent
Map based on Longitude (generated) and Latitude (generated) and Latitude (generated). Color shows details about County KIP. Themarks are labeled by Name1. Details are shown for Name2. The view is filtered on Name2, which keeps 62 of 62 members.
Change in County Sales Tax Collections, First Half 2017 to First Half 2018
Source: New York State Department of Taxation and Finance.Notes: Includes county and New York City collections.
Figure 4Figure 4
Change in County Sales Tax Collections, First Half 2017 to First Half 2018
Source: New York State Department of Taxation and Finance.Notes: Includes county and New York City collections.
Decline
Increase less than 3 percent
Increase between 3 percent and 6 percent
Increase between 6 percent and 9 percent
Increase more than 9 percent
Percentage Change Year-Over-Year

4 Office of the New York State Comptroller August 2018
City Collections
Eighteen out of sixty-two cities (including New York City) impose their own sales tax instead of opting to receive a share of what their county collects. There are also five cities that impose a limited sales tax on consumer utilities or hotel occupancy.7
As in the case of small counties, most cities’ sales tax collections are small and therefore prone to greater variance, especially over periods shorter than a full year.
All but three cities that impose their own sales tax experienced an increase in year-over-year collections in the first half of 2018. The City of Gloversville had the strongest growth at 33.2 percent, which local officials suggest is likely due to a large one-time purchase made by a local business in the first quarter of 2018. The cities of Norwich (12.7 percent) and Mount Vernon (10.6 percent) also had strong growth. The cities of Oneida, Rome and Salamanca saw their collections decrease from the same period last year, but this was mostly due to technical adjustments. (See Figure 5.)
-10.1%-4.9%
-0.2%0.8%
2.8%3.5%
4.9%4.9%5.0%
6.5%7.7%8.7%9.3%9.7%10.6%
12.7%33.2%
OneidaSalamanca
RomeOswego
UticaWhite Plains
New RochelleOleanIthaca
YonkersAuburn
JohnstownGlens Falls
Saratoga SpringsMount Vernon
NorwichGloversville
Change in City Sales Tax Collections, First Half 2017 to First Half 2018
Sources: New York State Department of Taxation and Finance, with calculations by OSC.
Figure 5
5August 2018 Division of Local Government and School Accountability
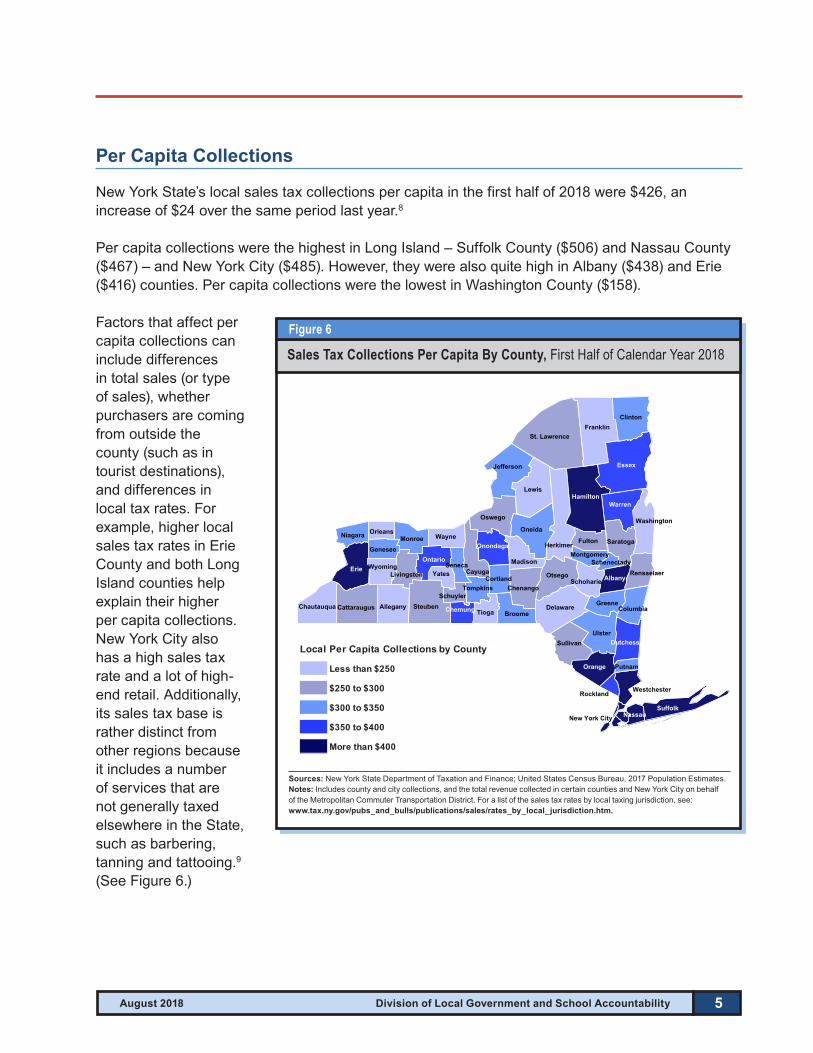
Per Capita Collections
New York State’s local sales tax collections per capita in the first half of 2018 were $426, an increase of $24 over the same period last year.8
Per capita collections were the highest in Long Island – Suffolk County ($506) and Nassau County ($467) – and New York City ($485). However, they were also quite high in Albany ($438) and Erie ($416) counties. Per capita collections were the lowest in Washington County ($158).
Factors that affect per capita collections can include differences in total sales (or type of sales), whether purchasers are coming from outside the county (such as in tourist destinations), and differences in local tax rates. For example, higher local sales tax rates in Erie County and both Long Island counties help explain their higher per capita collections. New York City also has a high sales tax rate and a lot of high-end retail. Additionally, its sales tax base is rather distinct from other regions because it includes a number of services that are not generally taxed elsewhere in the State, such as barbering, tanning and tattooing.9 (See Figure 6.)
YatesWyoming
Westchester
Wayne
Washington
Tompkins
Tioga
Sullivan
Steuben
St. Lawrence
Seneca
Schuyler
Schoharie
Schenectady
Saratoga
Rockland
Rensselaer
Putnam
Otsego
Oswego
Orleans OneidaNiagara
New York City
Montgomery
Monroe
Madison
Livingston
Lewis
Jefferson
HerkimerGeneseeFulton
Franklin
Delaware
Cortland
Columbia
Clinton
Chenango
Chautauqua
Cayuga
CattaraugusBroome
Allegany
Ulster
Greene
Warren
Suffolk
Orange
Ontario
Onondaga
Nassau
Hamilton
Essex
Erie
Dutchess
Chemung
Albany
Change in County Sales Tax Collections, First-Half 2017 to First-Half 2018County KIP
$250 to $300$300 to $350$350 to $400Less than $250More than $400
Map based on Longitude (generated) and Latitude (generated) and Latitude (generated). Color shows details about County KIP. Themarks are labeled by Name1. Details are shown for Name2. The view is filtered on Name2, which keeps 62 of 62 members.
Sales Tax Collections Per Capita By County, First Half of Calendar Year 2018
Sources: New York State Department of Taxation and Finance; United States Census Bureau, 2017 Population Estimates. Notes: Includes county and city collections, and the total revenue collected in certain counties and New York City on behalf of the Metropolitan Commuter Transportation District. For a list of the sales tax rates by local taxing jurisdiction, see: www.tax.ny.gov/pubs_and_bulls/publications/sales/rates_by_local_jurisdiction.htm.
Figure 6Figure 6
Sales Tax Collections Per Capita by County, First Half of Calendar Year 2018
Source: New York State Department of Taxation and Finance; United States Census Bureau, 2017 Population Estimates.Notes: Includes county and city collections. A per capita amount for the Metropolitan Commuter Transportation District is added for the affected counties and New York City. For a list of the sales tax rates by local taxing jurisdiction, see,www.tax.ny.gov/pubs_and_bulls/publications/sales/rates_by_local_jurisdiction.htm.
Less than $250
$250 to $300
$300 to $350
$350 to $400
More than $400
Local Per Capita Collections by County

6 Office of the New York State Comptroller August 2018
Appendix: Sales Tax Collections by Region, First Half 2017 and First Half 2018
Region City/County First Half 2017 First Half 2018Year-Over-Year
Percentage ChangeCapital District $345,711,982 $364,937,098 5.56%Albany County $125,181,310 $135,741,045 8.44%Columbia County $18,731,319 $20,174,577 7.71%Greene County $14,851,909 $15,352,930 3.37%Rensselaer County $40,869,765 $43,347,651 6.06%Saratoga County $56,659,022 $59,694,084 5.36%
Saratoga Springs City $5,054,272 $5,543,429 9.68%Schenectady County $50,464,223 $49,542,076 -1.83%Warren County $23,022,177 $24,166,453 4.97%
Glens Falls City $1,476,089 $1,613,775 9.33%Washington County $9,401,896 $9,761,077 3.82%Central New York $247,239,857 $259,215,681 4.84%Cayuga County $18,661,544 $17,586,570 -5.76%
Auburn City $4,236,249 $4,562,673 7.71%Cortland County $14,313,312 $14,553,534 1.68%Madison County $13,153,400 $13,963,956 6.16%
Oneida City $2,351,777 $2,113,491 -10.13%Onondaga County $164,535,330 $176,805,121 7.46%Oswego County $23,003,849 $22,575,331 -1.86%
Oswego City $6,994,372 $7,052,887 0.84%Finger Lakes $363,274,747 $374,439,522 3.07%Genesee County $18,016,121 $19,726,372 9.49%Livingston County $15,154,704 $16,627,029 9.72%Monroe County $236,964,100 $240,598,963 1.53%Ontario County $38,541,677 $40,751,767 5.73%Orleans County $8,082,896 $8,207,811 1.55%Seneca County $11,761,380 $11,818,413 0.48%Wayne County $20,719,461 $22,198,317 7.14%Wyoming County $8,758,946 $8,827,709 0.79%Yates County $5,273,148 $5,681,314 7.74%Long Island $1,220,285,933 $1,287,209,583 5.48%Nassau County $561,783,233 $587,910,272 4.65%Suffolk County $657,421,282 $698,166,864 6.20%Mid-Hudson $771,989,557 $816,949,185 5.82%Dutchess County $88,958,516 $94,168,063 5.86%Orange County $133,166,278 $141,016,983 5.90%Putnam County $28,140,406 $29,832,752 6.01%Rockland County $103,291,456 $105,484,361 2.12%Sullivan County $18,181,064 $21,459,795 18.03%Ulster County $54,929,547 $56,836,619 3.47%Westchester County $253,263,253 $270,568,509 6.83%
Mount Vernon City $9,591,245 $10,611,179 10.63%New Rochelle City $13,755,837 $14,425,603 4.87%White Plains City $23,747,641 $24,579,479 3.50%Yonkers City $44,271,886 $47,168,425 6.54%

7August 2018 Division of Local Government and School Accountability
Appendix: Sales Tax Collections by Region, First Half 2017 and First Half 2018
Region City/County First Half 2017 First Half 2018Year-Over-Year
Percentage ChangeMohawk Valley $126,033,471 $133,285,379 5.75%Fulton County $9,906,649 $11,360,226 14.67%
Gloversville City $1,688,617 $2,249,616 33.22%Johnstown City $1,838,614 $1,998,244 8.68%
Hamilton County $1,303,779 $1,810,355 38.85%Herkimer County $14,647,130 $15,279,961 4.32%Montgomery County $14,287,829 $14,897,365 4.27%Oneida County $66,547,825 $69,521,553 4.47%
Rome City $3,710,704 $3,704,037 -0.18%Utica City $4,943,625 $5,081,486 2.79%
Schoharie County $7,158,705 $7,382,453 3.13%North Country $117,690,479 $123,617,760 5.04%Clinton County $25,639,872 $27,075,254 5.60%Essex County $12,714,674 $13,720,684 7.91%Franklin County $10,530,543 $11,038,144 4.82%Jefferson County $35,246,594 $36,930,818 4.78%Lewis County $5,798,014 $6,148,005 6.04%St. Lawrence County $27,760,755 $28,704,852 3.40%Southern Tier $198,973,798 $210,423,028 5.75%Broome County $61,385,145 $63,698,571 3.77%Chemung County $28,091,654 $29,953,450 6.63%Chenango County $11,065,287 $12,077,468 9.15%
Norwich City $731,529 $824,174 12.66%Delaware County $10,358,414 $10,533,996 1.70%Otsego County $16,963,245 $17,710,236 4.40%Schuyler County $4,561,259 $4,912,822 7.71%Steuben County $25,961,822 $27,795,904 7.06%Tioga County $10,050,818 $11,306,181 12.49%Tompkins County $24,352,529 $25,887,953 6.30%
Ithaca City $5,429,292 $5,698,666 4.96%Western New York $491,433,258 $513,326,885 4.46%Allegany County $9,689,620 $10,546,162 8.84%
Olean City $2,050,240 $2,150,910 4.91%Salamanca City $332,481 $316,303 -4.87%
Cattaraugus County $17,702,192 $18,844,656 6.45%Chautauqua County $30,533,194 $32,046,452 4.96%Erie County $369,274,674 $385,086,756 4.28%Niagara County $57,375,753 $59,534,089 3.76%New York City $3,603,120,939 $3,853,439,673 6.95%
Other Local $529,666,373 $562,435,669 6.19%
Statewide Total $8,015,420,395 $8,499,279,465 6.04%
Sources: New York State Department of Taxation and Finance, with calculations by OSC.Notes: Other Local includes sales taxes collected on behalf of the New York Convention Center Development Corporation, Mass Transportation Operating Assistance Fund, Metropolitan Transit Authority Aid Trust Account and local school districts. Regional totals do not include taxes collected for these purposes, but do include cities that have a segmented sales tax.
8 Office of the New York State Comptroller August 2018
1 Unless otherwise noted, all sales tax collections data in this report are taken from the New York State Department of Taxation and Finance’s AS570 reports. The AS570 reports distributions, which are called collections in this report. The rates shown in Figure 1 have been adjusted for a major multiyear technical correction to New York City’s collections in 2015. For a more thorough discussion of this adjustment, see: Office of the New York State Comptroller, 2016 Local Sales Tax Collections, (January 31, 2017), www.osc.state.ny.us/reports/economic/2016-local-sales-tax-collections.pdf.
2 New York State Department of Labor, Seasonally Adjusted Labor Force Data – NYS, NYC, and BOS, accessed on July 25, 2018, www.labor.ny.gov/stats/LSLAUS.shtm. Monthly unemployment rates are adjusted for seasonal changes in employment.
3 Federal Reserve District, The Beige Book, July 2018, www.federalreserve.gov/monetarypolicy/beige-book-default.htm.
4 United States Department of Labor, Bureau of Labor Statistics, Consumer Price Index, accessed on July 25, 2018, www.bls.gov/cpi/tables/supplemental-files/home.htm.
5 South Dakota v. Wayfair, 201 L. Ed. 2d 403, 2018 U.S. LEXIS 3835; The U.S. Supreme Court ruled in the case of Quill Corp. v. North Dakota, 504 U.S. 298, that a state can only impose upon a seller the obligation to collect and remit the state’s use tax on sales to state customers if the seller has a “substantial nexus” in the state, meaning a physical presence, as required by the Commerce Clause of the U.S. Constitution.
6 As used in this report, the term “technical adjustments” refers to any of a number of collection or distribution corrections made by the Department of Taxation and Finance that are not related to current economic activity, such as late filings or errors caught on later audit. See Department of Taxation and Finance, AS310 – Quarterly Cash and Collection Distributions with Variances for Assessments, Late-Filed Returns, Rate Adjustments and Prior Period Adjustments, www.tax.ny.gov/research/stats/statistics/sales_tax/government/as310.htm.
7 For a discussion of sales tax pre-emption by cities and segmented sales taxes, see: Office of the New York State Comptroller, Local Government Sales Taxes in New York State: 2015 Update, March 2015, p. 6, www.osc.state.ny.us/localgov/pubs/research/salestax2015.pdf.
8 This amount does not include the State’s share of the sales tax collected for the first half of 2018. However, local per capita collections include the total revenue collected in certain counties and New York City on behalf of the Metropolitan Commuter Transportation District. A per capita amount of $38 is applied to each affected local taxing jurisdiction.
9 For more information on the types of taxable goods and services in New York City, see: www1.nyc.gov/site/finance/taxes/business-nys-sales-tax.page.
Notes

9August 2018 Division of Local Government and School Accountability
Division of Local Government and School Accountability110 State Street, 12th floor, Albany, NY 12236 Tel: 518.474.4037 • Fax: 518.486.6479 Email: [email protected]
www.osc.state.ny.us/localgov
Technical Assistance is available at any of our Regional Offices
BINGHAMTON REGIONAL OFFICE Tel 607.721.8306 • Fax 607.721.8313 • Email [email protected] Counties: Broome, Chenango, Cortland, Delaware, Otsego, Schoharie, Sullivan, Tioga, Tompkins
BUFFALO REGIONAL OFFICE Tel 716.847.3647 • Fax 716.847.3643 • Email [email protected] Counties: Allegany, Cattaraugus, Chautauqua, Erie, Genesee, Niagara, Orleans, Wyoming
GLENS FALLS REGIONAL OFFICE Tel 518.793.0057 • Fax 518.793.5797 • Email [email protected] Counties: Albany, Clinton, Essex, Franklin, Fulton, Hamilton, Montgomery, Rensselaer, Saratoga, Schenectady, Warren, Washington
HAUPPAUGE REGIONAL OFFICE Tel 631.952.6534 • Fax 631.952.6530 • Email [email protected] Counties: Nassau, Suffolk
NEWBURGH REGIONAL OFFICE Tel 845.567.0858 • Fax 845.567.0080 • Email [email protected] Counties: Columbia, Dutchess, Greene, Orange, Putnam, Rockland, Ulster, Westchester
ROCHESTER REGIONAL OFFICE Tel 585.454.2460 • Fax 585.454.3545 • Email [email protected] Counties: Cayuga, Chemung, Livingston, Monroe, Ontario, Schuyler, Seneca, Steuben, Wayne, Yates
SYRACUSE REGIONAL OFFICE Tel 315.428.4192 • Fax 315.426.2119 • Email [email protected] Counties: Herkimer, Jefferson, Lewis, Madison, Oneida, Onondaga, Oswego, St. Lawrence
STATEWIDE AUDIT Tel 607.721.8306 • Fax 607.721.8313
New York State Comptrol ler
THOMAS P. DiNAPOLI
COMPTROLLEROffice of the NEW YORK STATE
Andrew A. SanFilippo, Executive Deputy Comptroller
Executive • 518.474.4037Gabriel F. Deyo, Deputy Comptroller Tracey Hitchen Boyd, Assistant Comptroller
Audits, Local Government Services and Professional Standards • 518.474.5404 (Audits, Technical Assistance, Accounting and Audit Standards)
Local Government and School Accountability Help Line • 866.321.8503 or 518.408.4934 (Electronic Filing, Financial Reporting, Justice Courts, Training)
Division of Legal Services Municipal Law Section • 518.474.5586
New York State & Local Retirement System Retirement Information Services Inquiries on Employee Benefits and Programs 518.474.7736
BUFFALO
BINGHAMTON
ROCHESTER
SYRACUSE GLENS FALLS
NEWBURGH
HAUPPAUGE
Like us on Facebook at facebook.com/nyscomptrollerFollow us on Twitter @nyscomptroller
ContactOffice of the New York State Comptroller Division of Local Government and School Accountability
110 State Street, 12th floor Albany, NY 12236 Tel: (518) 474-4037 Fax: (518) 486-6479 or email us: [email protected]
www.osc.state.ny.us/localgov/index.htm