Embed Size (px)
Citation preview
Firm Performance: Do Non-Executive Directors Have a Mind Of Their
Own? Evidence From UK Panel Data
Roberto Mura♣ University of York
Abstract
This paper investigates the relationship between firm performance and ownership structure for a large panel of UK firms for the period 1991-2001. We focus on managerial ownership and, more in detail, on the role of non-executive directors. Using GMM-SYS estimations, we fail, to detect any significant impact by non-executive ownership, while we find evidence in support of a cubic relationship between executive shareholding and performance. On the other hand, the ratio of non-executives on total board seems to play a significant role in determining higher firm performance. Finally, a negative relationship between performance and block holding is detected.
_____________________________________________________
JEL Classification: G32, G34 Keywords: firm performance, ownership structure, corporate governance, endogeneity, GMM,
panel data.
♣ I would like to thank Antoine Faure-Grimaud, Enrico Perotti and all the participants to the Corporate Finance, Corporate Governance, and Political Economy - CFS Summer School 2004 for useful suggestions on an earlier version of this paper. Special thanks to Aydin Ozkan, Peter Spencer and Marco Realdon for helpful comments and suggestions. The usual disclaimer applies. Address for correspondence: Department of Economics University of York, Heslington, York YO10 5DD, UK, email: [email protected]
1
The connection between ownership structure and firm performance has been the
subject of an important and ongoing debate in corporate finance literature dating back to the
Berle and Means (1932) thesis, which suggests that an inverse correlation should be observed
between dispersed shareholding and firm performance.
Jensen and Meckling (1976) formally derive a model in which the distribution of
shares among the insiders and outsiders in a company can influence its value. Provided that
managers' natural tendency is to allocate the firm's resources in their own best interests, the
greater the managerial ownership the less inclined the managers are to divert resources away
from value maximisation as their interests coincide more closely with those of outside
shareholders. Firm performance then increases uniformly (alignment effect).
However, it is argued that the impact of managerial ownership is likely to be non-
monotonic. Shleifer and Vishny (1989) contend that as the percentage of shares held by the
manager increases, his discretion increases. He may pursue private benefits or use this
discretion to appoint a board of directors that is unlikely to monitor. This in turn would impair
the capacity of outside shareholders to monitor and influence managers (entrenchment effect).
The available empirical evidence on the impact of managerial ownership on firm
performance is mixed. While there are a number of papers which do detect a non-monotonic
relationship between ownership and value, little consensus has been reached on the exact
shape of this relationship. Among others, McConnell and Servaes (1990, 1995) observe an
inverse U-shaped relationship, while Hermalin and Weisbach (1991), Morck et al. (1988),
Short and Keasey (1999) report a significant cubic relation between the two. In a recent study
on the UK, Davies et al. (2004) report a quintic relationship.
On the other hand, there is a growing body of evidence which fails to detect any
significant links between ownership and performance. Among others, Loderer and Martin
(1997) using a simultaneous equation model in which Tobin’s q and insider holdings are
endogenous, report no relationship between managerial shareholding and Q (whilst firm value
is a negative predictor of ownership). Cho (1998) also estimates a system of equations in
which insider ownership and Q are simultaneously determined and suggests that Q affects
ownership structure but not vice-versa. Demsetz and Villalonga (2001) using a 2SLS
approach again show that, once endogeneity is considered, the direction of causality only runs
from value to ownership.
One possible explanation for such variety of results is that they may be driven by the
different empirical approaches adopted.
2
The first set of studies typically does not allow for the endogeneity of managerial
ownership, an issue that was first discussed in Demsetz (1983) 1. It is argued that a positive
sign between managerial ownership and firm performance could be interpreted as evidence
that, to a certain extent, owning ordinary shares makes the interests of managers aligned with
those of external shareholders, resulting in a positive effect in performance. However, it is
also possible that managerial ownership is higher in better performing firms simply because
managers are more willing to accept ordinary shares as a part of their payment scheme in
firms which perform better. As a result, studies which fail to control for this cross causality
may only be capturing a spurious relationship.
Although the second set of studies discussed above adopts appropriate econometric
techniques in order to control for this type of cross causality, it typically neglects another
potentially important issue. As described in Himmelberg et al (1999), the common approach
of estimating the impact of managerial ownership on firm value by regressing Tobin’s q on
such variables as the percentage of equity held by managers “is potentially misspecified
because of the presence of firm unobserved heterogeneity”. To the extent that managerial
ownership is strongly correlated to unobservable firm specific characteristic (i.e. the
contracting environment in the firm), studies which fail to control for this effect would obtain
biased and inconsistent estimates.
As a consequence of the above mentioned issues, we study the relationship between
firm performance and managerial ownership using the GMM methodology (Arellano Bond,
1991). By means of this technique, the endogeneity of all the explanatory variables can be
efficiently addressed. Appropriate lags of the endogenous variables are used to obtain
consistent estimates of the regressors. Furthermore, this methodology enables us to control for
unobservable heterogeneity via first differencing.
In order to carry out this study we hand collected a novel data set of 1100 listed non-
financial UK firms for the period 1991-2001, gathering information on ownership by the
board of directors and by external shareholders as well as on board composition.
The original contribution of our work is to test in an explicit manner whether non-
executive directors play an independent role from executives in determining firm
performance. In fact, past studies in this area have typically used shareholding by the entire
board as a proxy for managerial ownership. However, the fact that different board members
1 Two notable exceptions are Davies et al (2004), who use a SEM and Hermalin and Weisbach (1991) who use a IV approach.
3
are have different incentives has been discussed by a large number of papers. Whereas the
board of directors is supposed to act on behalf of the shareholders, as an important
mechanism to monitor management discretionary behaviour, non-executive directors should
act as “delegated monitors” charged by the shareholders to observe the actions of executive
managers (Hart, 1995). According to Morck et al. (1988), since non-executive (outside)
directors must monitor the performance of the executives (officers), they should be provided
with strong personal financial interests in the firm. In line with this argument, other authors
contend that non-executives do not have sufficient financial interests to be concerned about
company performance (Hart, 1995) and that they may lack the necessary expertise to
participate efficiently in planning the financial aspects that affect corporate value (Jensen,
1993).
From this perspective, we argue that it may be important to make a distinction
between the stakeholding of the two categories to be able to investigate the determinants of
firm performance.
The UK then, provides an excellent case study for this matter. Unlike in the US where
boards generally have a predominance of outside (non-executive) directors, UK boards have
tended until recently to be dominated by a high presence of executives. However, following
the corporate scandals in the early nineties and the consequent issue of the so called “Codes of
Best Practice”, the corporate governance scenario has evolved considerably. In particular, the
number of non-executives has steadily increased over time so that by the end of the decade
the proportion of non-executives to executives was close to one. Furthermore, as we will
show in Section I, while share ownership by executive directors has been steadily decreasing
in time, the opposite holds for non-executives.
In consideration of these arguments, we first test the relationship between board
ownership and firm value. Then, we split the board of directors between executives and non-
executives and test whether ownership by non-executives is also a relevant factor.
Furthermore, we check if the mere presence of outside directors on the board, is significantly
linked to firm value.
In addition, in order to account for the possibility that non-executives may have
stronger incentives to monitor effectively when they own greater amounts of shares, we
introduce an interaction term.
Moreover, we investigate whether the presence of a large shareholder and its identity,
besides firm capital and financial structure have an impact on the determination of firm
4
performance. A number of papers show the interdependence of these agency control
mechanisms (Agrawal and Knoeber, 1996). For example, Stiglitz (1985) and Shleifer-Vishny
(1997) maintain that large shareholders have greater incentives to be involved in the control
process than smaller ones because they can more easily bear the high fixed costs of collecting
information on management behaviour. Some authors also emphasize that different types of
shareholders have different incentives and costs to be active monitors of the business
activities in the firm (Pound, 1988; Brickley et al., 1988).
It is also argued that an appropriate level of external debt (Jensen, 1986) or an
appropriate amount of dividend payments (Easterbrook, 1984) can to some extent curb
managerial discretion because they restrict the amount of free resources.
Our analysis reveals that the alignment/entrenchment effect as detected on the total
board is really driven by the executive positions on the board. Contrary to the available
empirical evidence (Morck et al., 1988) we fail to detect any significant relationship between
ownership by non-executives and performance. On the other hand we detect a positive and
significant impact of the ratio of non-executives to total board. Our results also suggest that
the presence of a large outside shareholder and in particular of large institutional investors is
negatively related to firm performance while investment in physical capital, cash flow and
dividend payments exert a positive impact.
The rest of the work is organized as follows. Section I reviews the hypotheses we test
in this work. Section II presents the data and the methodology. Section III presents the
empirical results and Section IV presents our main conclusions.
I. Hypotheses
A. Managerial ownership and the role of non-executives
As mentioned above, the Berle and Means (1932) argument suggests the presence of a
positive linear relationship between ownership concentration and firm performance since
dispersion creates free riding problems and makes manager monitoring more difficult. From
this perspective, managerial ownership may serve as an alignment mechanism as it provides
managers with the right economic incentives towards firm value maximization (Jensen and
Meckling, 1976). Nonetheless, since Demsetz and Lehn (1985) and Fama and Jensen (1983) a
growing body of studies has started to recognize that the alignment effect may not be a linear
function of managerial ownership. It is argued that increasing shareholding also delivers
5
increasing voting power and effective control over the firm which may enable the manager to
extract company resources.
In order to test the relationship between managerial ownership and firm value we
estimate a cubic model. At low levels of ownership we expect the alignment effect to be
prevalent while at higher levels we expect the entrenchment effect to be the more
predominant one. The cubic specification also allows the possibility that the relationship will
become positive again at very high levels of managerial ownership. This may be due to the
fact that when the degree of ownership concentration in the manager’s hands is so elevated,
the manager effectively becomes the manager-owner.
At first, we approximate managerial ownership as the total shares held by the board of
directors2.
However, as we argued in the introduction, a number of papers have highlighted the
different incentives existing among various board members. This distinction may be
particularly relevant when we consider the institutional differences between the US and the
UK. American boards generally have a predominance of outside directors (non-executives),
while the Chief Executive Officer is usually also the Chairman and strictly controls the board.
In the UK, on the contrary, as a consequence of the corporate scandals in the early nineties, a
lot of emphasis has been placed on the importance of the independent monitoring role by non-
executives. Whereas before and up to the early nineties, UK boards were characterised by a
high presence of executive directors, after the issuing of the Codes of Best Practice, the
number of and average shareholding by non-executives has steadily increased.
So, as a second step in our analysis we explicitly investigate the impact of each of the
two groups of board members in determining firm performance. To the best of our
knowledge, only the paper by Morck et al. (1988) explicitly considers this issue and reports
that “outside board members, like officers, respond to financial incentives and contribute
more to corporate wealth as their ownership stakes rise. In addition[…] outside board
members are capable of becoming entrenched”.
As no theoretical work indicates the exact nature of this relationship we try different
functional forms. While maintaining the cubic relationship for executive directors, we allow
for a cubic, quadratic and finally linear specification for non-executive ownership.
2 In Table 1 we report all the definitions of the variables used in this work.
6
Moreover, some studies have recently focused on how the nature of corporate
governance determines firm value, highlighting the possibility that an effective monitoring
role by non-executives may be played irrespective of any shareholding interests they may
have. It is argued that both the reputation effect in the management labour market and the
expertise acquired from their career history, could give enough incentives to non-executives
to guarantee effective and independent monitoring inside the firm (Fama and Jensen, 1983).
From this viewpoint, we may expect there to be a positive relationship between firm
performance and the presence of non-executives. However, some authors argue that the
reputation effect in the management labour market could also work in an opposite direction.
For example, it is argued that “non-executives may owe their position to management” (Hart,
1995). In addition, Jensen (1993) highlights the relative lack of expertise by non-executives
and also underlines that oversized boards are easier for the Chief Executive to control. If these
phenomena are prevalent, then a null or negative relationship may be anticipated.
A growing number of works have analysed the impact of board composition on firm
performance and the results are not unambiguous. Rosenstein and Wyatt (1990) used an event
study methodology on, U.S. companies and reported a positive (but small) impact on the
stock price following the appointment of an additional outside director. In a panel perspective,
Yermack (1996) finds an inverse association between board size and Tobin’s q. Agrawal and
Knoeber (1996) study the impact of several agency control mechanisms and detect a negative
relationship between the percentage of board seats held by non-officers and Tobin’s q.
Conversely, Bhagat and Black (1998) detect no relationship between the proportion of outside
directors and future performance, concluding that “the direct relationship between board
composition and firm performance, if it exists at all, is weak and perhaps variable over time”.
In addition, Holderness et al. (1999) find that changes in board composition or size do not
account for the changes in the managerial ownership in the US.
As we argued earlier, the codes of best practice which have been issued in the past ten
years give a series of recommendations on the structure and responsibilities of the board of
directors, making the UK case a very interesting setting to test the hypothesis that the
presence of non-executive directors plays a significant role in determining firm performance.
This may be particularly interesting considering the information recently published in the
Higgs Report (2003, P.30, 10.5):”A high level of informality surrounds the process of
appointing non-executive directors. Almost half of the non-executive directors surveyed for
the Review, were recruited to their role through personal contacts or friendships. Only four
7
per cent had a formal interview and one per cent had obtained the job through answering an
advertisement[…]”. The implication might be that the independence of monitoring action by
English non-executives may be blurred and as Hart (1995) surmises, only “quiet non-
executives” are appointed by firms.
Similarly to the US findings, the results of the empirical studies for the UK companies
are not unambiguous. Faccio and Lasfer (1999) find little evidence to support the hypothesis
that firm value is affected by the combination of managerial ownership and board structure.
However, Weir et al. (2002) show that English firms with high performance have a greater
proportion of independent non-executives both in the board and in the audit committees.
Young (2000) shows that there is an increased demand for non-executive directors among
firms with manager-dominated boards and that the compliance with the Cadbury
recommendation concerning the minimum number of non-executives is positively related to
the expected net benefits of adding further non-executives to the board. Peasnell et al. (2003)
show that the potential contribution of outside directors to internal corporate control
mechanisms seems to be important at any level of managerial ownership in the UK and that
boards even in manager-owned companies are far from being passive. In a recent study Dahya
et al. (2002) report a significant increase in management turnover following adoption of the
Cadbury recommendation and an increased sensitivity of turnover to performance due to the
increasing number of non-executives in the board.
In order to test the effectiveness of the presence of non-executives, we use the ratio
(Ratio) of non-executive directors to total board, in line with the argument that “a greater use
of outside directors can lead to more effective internal monitoring” (Agrawal and Knoeber,
1996). Moreover, in order to account for the possibility that the effect exerted on performance
by the presence of non-executives in the board may depend on the (magnitude of) their
shareholding, we also include an interaction term.
B. The role of the external shareholders: Block Holding
Stiglitz (1985) argues that larger shareholders have greater incentives to be involved in
the control process than smaller ones because they can more easily bear the high fixed costs
of collecting information on the behaviour of management. In addition, Shleifer-Vishny
(1997) justify the greater monitoring role of large investors because of the resources they
invest in the firm. These views suggest that a positive relationship should be expected.
8
Yet, the presence of a large shareholder may also lead to higher agency costs inside
the firm since larger shareholders may seek the maximization of their own wealth, to the
detriment of other investors (Shleifer-Vishny, 1997). Additionally, Burkart et al. (1997) show
that the efforts exerted by managers to boost their private benefits may indeed be beneficial
for firms as well. They suggest that even if tight control by shareholders is ex-post efficient, it
may constitute an ex-ante expropriation threat that reduces managerial initiative. As a
consequence, ownership concentration in the hands of external shareholders may also be
detrimental to firm performance.
The empirical literature that analyses the impact of large shareholders on corporate
control processes is quite extensive and generally suggests that the largest shareholders play
an insignificant role. For instance, Holderness-Sheehan (1988), among others, find no
differences in the performance of various firms whether shareholding in their corporations is
concentrated or dispersed. McConnell-Servaes (1990, 1995) also report that the largest single
block holder has an insignificant effect on firm performance. Similar results obtain for all the
block holders and the dummy indicating the presence of a block holder in the firm. In line
with this study, Agrawal and Knoeber (1996) also conclude that no significant role is played
by block holding, while, for the UK companies they analysed, Faccio and Lasfer (1999)
detect a significant negative impact of blockholding. Davies et al. (2004) find little evidence
of a significant impact of the largest stakeholder, but report a strong, negative link between
blockholder ownership and firm value.
We investigate these hypotheses by including the following two different proxies for
ownership concentration: one for block holding (Block Holding), defined as the sum of the
ownership held by non-managerial shareholders with more than 3% of firm stakes and one
representing the shares of the largest non manager owner (Largest non-managerial
ownership).
C. The role of the external shareholders: Institutional Owners
It may be relevant in this contest to distinguish the outside shareholders according to
their identity, as different types of owners may have different incentives.
According to the thesis proposed by Pound (1988), institutional investors are more
efficient monitors than other typologies of shareholders due to their greater expertise
(efficient monitoring hypothesis). On the other hand, he also contends that institutional
investors may find it profitable to cooperate with managers (strategic alignment hypothesis),
9
or may even be forced to cooperate with them in order to protect other business relationships
they may have with the firm (conflict of interest hypothesis).
It does seem important to control for the differences in monitoring incentives among
different categories of shareholders, particularly in the light of the peculiarities of the UK
institutional setting.
First, while private individuals are the largest category of shareholders in the US, UK
financial institutions have increased their ownership of UK equities since 1963 (Stapledon,
1996) 3. As reported in Table II, institutional investors are the largest category of shareholders
over the last decade. Second, UK institutional investors face no legal restrictions on stock
ownership, while US insurance companies are bound not to invest more than 2% of their
assets in a single company. Finally, UK institutions face no legal barrier against activism4.
In spite of this relative institutional freedom, the lack of activism by institutional
investors has been the focus of many debates (see among others, Conyon-Peck, 1997).
Renneboog and Goergen (2001) provide evidence of the fact UK institutional investors tend
not to exercise their voting power effectively, thus increasing “the already significant power
of directors”. Additionally, Faccio and Lasfer (1999) provide evidence of the fact that UK
pension funds are not effective monitors, and Cosh and Hughes (1997) also fail to detect any
strong influence by institutional investors in determining either executive pay or dismissal
policies. These results are borne out in a recent paper by Dahya et al. (2002), who report no
evidence that ownership by institutions is relevant in determining management turnover.
Indeed, the Hampel Code of Best Practice (1998) contains specific recommendations calling
for an increased role for institutional investors in corporate governance issues (Webb et al. ,
2003).
Following the indications from this large body of studies, an insignificant or negative
relationship between institutional ownership and firm value may be expected.
The existing empirical evidence is mixed. Among others, Short and Keasey (1999)
find that while institutional ownership plays no role in determining firm value, ownership by
3 The recent work of Gadhoum et al. (2004) on the ultimate ownership in the US shows that in 1996 about 37% of the all listed firms in the US market are controlled by families, while only 16% are owned by financial institutions. 4 In the US, for example, the schedule 13D filing obliges a shareholder group with more than 5% shares to disclose the group’s plans with respect to the company. However, in trying to understand the institutional governance in the UK it is necessary to take into account the well-developed network of informal communication and coalitions among the institutional investors within the “London Square Mile” (Short-Keasey, 1997) that can contribute to reducing free riding problems for the institutions.
10
non-institutional owners is statistically significant in the UK and is positively related to
performance. Also, Agrawal and Knoeber (1996) detect no influence of institutional
ownership on firm value. Conversely, McConnell and Servaes (1990) not only report that the
percentage of shares owned by institutions is positive and significant, but also that the
inflection point between alignment and entrenchment increases when this proxy is included in
the model. This result is interpreted as evidence in support of Pound’s (1998) efficient
monitoring hypothesis.
We investigate these hypotheses with the inclusion of four proxies. First we split
ownership by all the external shareholders (Block Holding) into ownership by institutional
investors (Institutional Ownership) which comprises banks, pension funds, fund managers and
similar and ownership by non financial institutions (Non-Institutional Ownership) comprising
private individuals, and non financial companies. Additionally, as a robustness check we also
divide ownership by the largest non managerial investor into Institutional (Largest Institutional
Ownership) and non-Institutional ownership (Largest Non-Institutional Ownership).
D. Control variables
We include a number of control variables that current literature has indicated as being
potentially able to influence firm performance.
Total debt (Leverage) is included in order to control for a number of factors. On the
one hand, a positive effect may be expected as a result of monitoring by lenders. As Jensen
(1986) argues, raising external debt limits managerial discretion as managers are committed
to paying out future cash flow in a durable and enforceable way. In a similar way, Stiglitz
(1985) maintains that effective monitoring of managerial behaviour is exercised mainly by
lenders rather than shareholders. Modigliani and Miller (1963) also predict a positive relation
between leverage and performance with the argument of valuable tax shields, as does Ross
(1977) with the argument of leverage as signal. On the other hand, (existing) leverage may
hamper the firm’s capability in raising new debt and as a consequence force it to pass up
valuable investment opportunities. This is related to the problem of underinvestment analysed
by Myers (1977). Furthermore, a higher leverage increases the risk of bankruptcy and this, in
turn, may worsen the market perception of the firm. We define leverage (Leverage) as the
ratio of total debt to total assets.
We control for the effect of firm size as larger firms may find it easier to generate
funds internally and access external resources. Moreover, larger firms could benefit from
11
economies of scales by creating entry barriers with consequent positive effects on
performance (Short-Keasey, 1999). However, average managerial shareholding is larger in
smaller firms and this could create scope for potentially higher managerial entrenchment
(McConnell-Servaes, 1990; 1995). In our work, size (Size) is equal to the natural logarithm of
total assets at 1991 prices.
Following Morck et al. (1988), McConnell and Servaes (1990) and Cho (1998) we
include a proxy for investments, both in intangible assets using reported R&D expenses (RD
Expenditures) and investment in fixed capital (Capital Expenditures). It is argued that
investments may positively affect firm performance (Jensen-Meckling, 1976). Moreover,
there is evidence of a positive reaction by the US stock market to announcements of increases
in planned capital expenditure (McConnell-Muscarella, 1985) and R&D expenses (Chan et
al., 1990). In line with these findings, we expect that an increase in investments has a positive
impact on firm performance.
As argued by Jensen (1986), agency conflicts between managers and shareholders can
become more severe when managers exercise more discretion on liquid assets. From this
perspective, free cash flow we may expected to be a negative predictor of firm performance.
However, a higher cash flow may also mean that firms can finance their investments through
internal funds. This allows firms to reduce the risk of facing underinvestment and bankruptcy
problems. So, a positive relationship between performance and cash flow could be observed.
Furthermore, the inclusion of a proxy for the availability of internal funds may be appropriate
in this context, because it may be strongly correlated with investments (Fazzari et al, 1996).
We approximate the free cash flow (Cash Flow) as the ratio of pre-tax profits plus
depreciation to total assets.
A number of papers contend that, like leverage, dividend payments may in fact reduce
free resources in the firm and mitigate potential manager-shareholder conflicts (Easterbrook,
1984; Jensen, 1986). As a result, a positive relation between dividend payout and firm
performance could be predicted. Nonetheless, it may also be argued that higher dividends are
related to the presence of low growth opportunities. That is to say, firms with low profitable
investment opportunities may pay higher dividends rather than undertake negative net present
value projects (Smith-Warner, 1979; Milgrom-Roberts, 1992). Dividend payouts (Dividends)
are equal to the ratio of ordinary dividends net of Advance Corporation Tax, to total assets.
12
II. Data and methodology
A. Ownership Structure
We hand-collected data on ordinary shareholding by managers and external
shareholders, as well as on board composition for a panel of approximately 1100 non
financial UK listed firms for the period 1991-2001 (Marchica and Mura, 2005). Ownership
data mainly come from the Price Waterhouse Corporate Register (Dec. issue). Among the
external shareholders, ordinary shares held above the 3% threshold are reported5.
Additionally, we collected information regarding the typology of the external owners,
distinguishing between financial firms, non financial firms, individuals and state. Unlike what
applies to external shareholders, ownership by management must always be disclosed, so this
allows us to detect the presence of managers even when they hold no shares.
We have gone to considerable lengths to check for consistency in the dataset. We were
particularly careful in controlling that the sum of all reported shareholding would not exceed
100. Also, we also checked that the sum of all shareholding would equal the reported number
of shares outstanding. Firms which failed these test were dropped from the dataset.
Preliminary descriptive statistics are provided in Table II. The figures suggest that the
distribution of ownership by external shareholders shows a certain degree of volatility but no
clear trend. The average level of block holding remains around 30%, Institutional Ownership
around 20% while ownership by non-institutions is on average around 10% for the ten years
under analysis. What is interesting to underline here, is that average shareholding by the
largest non-managerial owner is increasing over time.
However, the opposite is true for board ownership: on average, the total ordinary
shares held by the board of directors decreased by approximately 5% in ten years, half of
which took place between 1991 and 1993, right after the Cadbury Report was issued (1992).
This general decreasing trend may be partly explained by the escalating number of
outstanding shares in the market as reported in the table6. However, the trend only seems to
involve executive directors, since average shareholding by non-executives is increasing.
Table III provides a detailed analysis of the evolution of board composition in the UK.
In 1991 the average board was composed of 7 individuals, a number that had remained more
5 The requirement to disclose share blocks was introduced in 1967. Until 1976 it was set up at 10%, then lowered to 5% until 1989 and further reduced to 3% from 1990. However, the Corporate Register for the 1991 edition maintains the disclosure threshold at 5%. 6 This is in line with Franks et al. (2003) who show a similar trend for their sample of UK firms over the last century.
13
or less constant over time. Nonetheless, following recommendations outlined in the Codes of
Best Practice, board composition seemed to change quite significantly. In 1991 there were an
average of 4.73 executives and 2.44 non-executives, while by 2001 non-executives
constituted almost half of the average board.
These figures corroborate findings by Faccio and Lasfer (1999), Peasnell et al. (2003),
and Dedman (2003). Similar trends are found when considering the average number of
executives and non-executives who actually do hold shares.
B. Economic Performance
One of the central issues in this literature is what variable should be used to measure
firm performance . The vast majority of existing literature has focused attention on Tobin’s q,
defined as the ratio of the market and replacement values of a firm’s assets, for which various
approximations have been proposed. The original idea by Tobin (1969) was that the
replacement cost of assets would be the logical measure of the “alternative use” of assets. So
if firms cannot employ assets to create as much (market) value as their opportunity cost, then
they are not being efficient.
Calculating the replacement cost of assets however poses a number of problems. As
noted by Claessens (2002): “the data required to calculate the replacement values are
generally not available […]”. As a consequence, various studies have suggested a number of
approximations of this measure, all belonging to the family of “market-to-book-ratios”.
Consistent with Claessens et al. (2002) and La Porta et al. (2002), we approximate Tobin’q
using the following definition: the ratio of the book value of total assets minus the book value
of equity, plus the market value of equity to the book value of assets7.
All economic variables were collected from Datastream. Brief descriptive statistics
are reported in Table IV.
C. Methodology
As argued in the introduction, there are two relevant factors that need to be controlled
for in estimating the relationship between managerial ownership and firm performance, i.e.
unobservable heterogeneity and endogeneity. 7 Robustness checks were conducted using a definition more similar to the one used in Himmelberg et al (1999), Demsetz and Villalonga (2001), Agrawal and Knoeber (1996), where Q is defined as the market value of common equity plus the (estimated) market value of preferred stock plus the book value of total debt all divided by the book value of total assets. Results are virtually unaltered with this slightly different definition of Q.
14
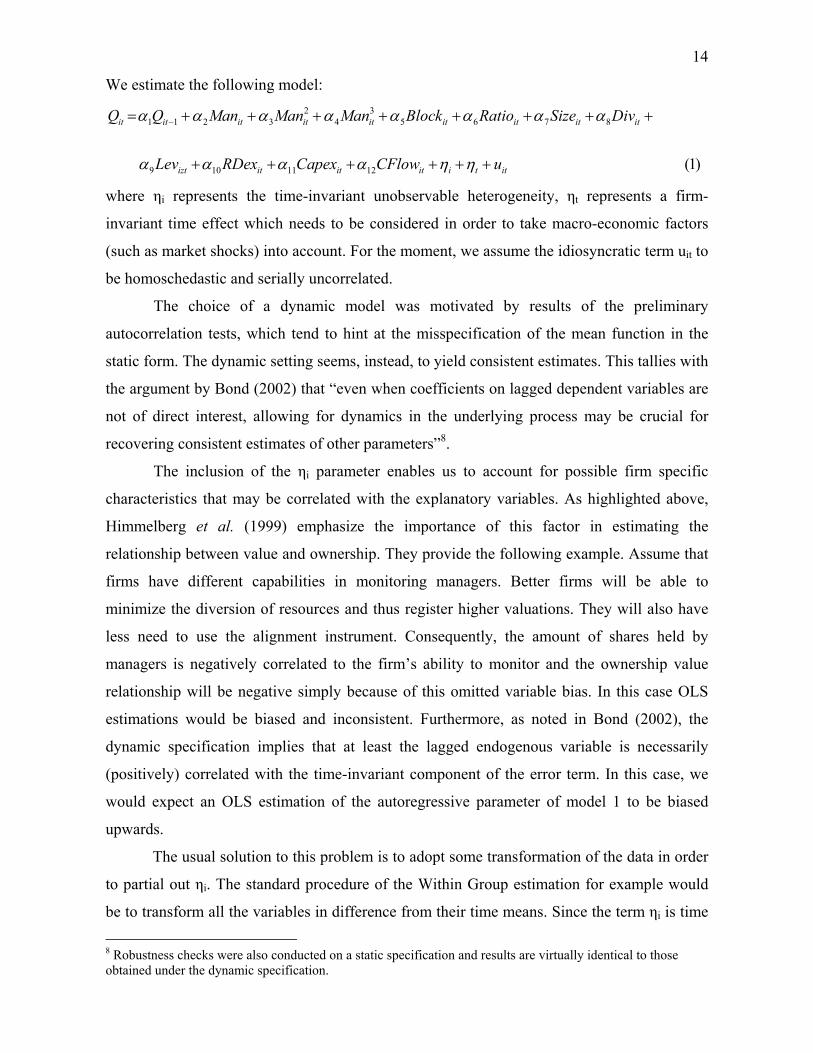
We estimate the following model: 2 3
1 1 2 3 4 5 6 7 8
9 10 11 12 (1)
it it it it it it it it it
izt it it it i t it
Q Q Man Man Man Block Ratio Size Div
Lev RDex Capex CFlow u
α α α α α α α α
α α α α η η
−= + + + + + + + +
+ + + + + +
where ηi represents the time-invariant unobservable heterogeneity, ηt represents a firm-
invariant time effect which needs to be considered in order to take macro-economic factors
(such as market shocks) into account. For the moment, we assume the idiosyncratic term uit to
be homoschedastic and serially uncorrelated.
The choice of a dynamic model was motivated by results of the preliminary
autocorrelation tests, which tend to hint at the misspecification of the mean function in the
static form. The dynamic setting seems, instead, to yield consistent estimates. This tallies with
the argument by Bond (2002) that “even when coefficients on lagged dependent variables are
not of direct interest, allowing for dynamics in the underlying process may be crucial for
recovering consistent estimates of other parameters”8.
The inclusion of the ηi parameter enables us to account for possible firm specific
characteristics that may be correlated with the explanatory variables. As highlighted above,
Himmelberg et al. (1999) emphasize the importance of this factor in estimating the
relationship between value and ownership. They provide the following example. Assume that
firms have different capabilities in monitoring managers. Better firms will be able to
minimize the diversion of resources and thus register higher valuations. They will also have
less need to use the alignment instrument. Consequently, the amount of shares held by
managers is negatively correlated to the firm’s ability to monitor and the ownership value
relationship will be negative simply because of this omitted variable bias. In this case OLS
estimations would be biased and inconsistent. Furthermore, as noted in Bond (2002), the
dynamic specification implies that at least the lagged endogenous variable is necessarily
(positively) correlated with the time-invariant component of the error term. In this case, we
would expect an OLS estimation of the autoregressive parameter of model 1 to be biased
upwards.
The usual solution to this problem is to adopt some transformation of the data in order
to partial out ηi. The standard procedure of the Within Group estimation for example would
be to transform all the variables in difference from their time means. Since the term ηi is time
8 Robustness checks were also conducted on a static specification and results are virtually identical to those obtained under the dynamic specification.
15
invariant, the WG transformation would allow us to eliminate it. Nonetheless one major
shortcoming of this procedure is that unless all right hand side variables are strictly
exogenous, this procedure introduces a non-negligible correlation between non-exogenous
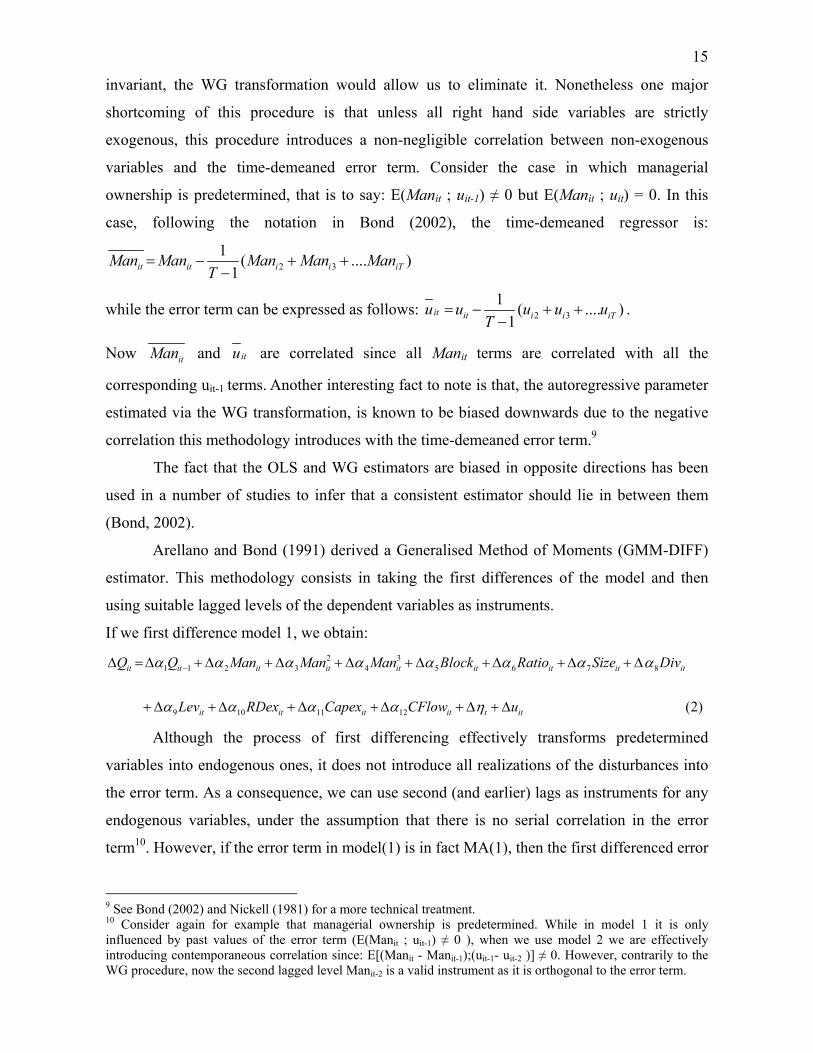
variables and the time-demeaned error term. Consider the case in which managerial
ownership is predetermined, that is to say: E(Manit ; uit-1) ≠ 0 but E(Manit ; uit) = 0. In this
case, following the notation in Bond (2002), the time-demeaned regressor is:
2 31 ( .... )
1it it i i iTMan Man Man Man ManT
= − + +−
while the error term can be expressed as follows: 2 31 ( .... )
1it it i i iTu u u u u
T= − + +
−.
Now itMan and itu are correlated since all Manit terms are correlated with all the
corresponding uit-1 terms. Another interesting fact to note is that, the autoregressive parameter
estimated via the WG transformation, is known to be biased downwards due to the negative
correlation this methodology introduces with the time-demeaned error term.9 The fact that the OLS and WG estimators are biased in opposite directions has been
used in a number of studies to infer that a consistent estimator should lie in between them
(Bond, 2002).
Arellano and Bond (1991) derived a Generalised Method of Moments (GMM-DIFF)
estimator. This methodology consists in taking the first differences of the model and then
using suitable lagged levels of the dependent variables as instruments.
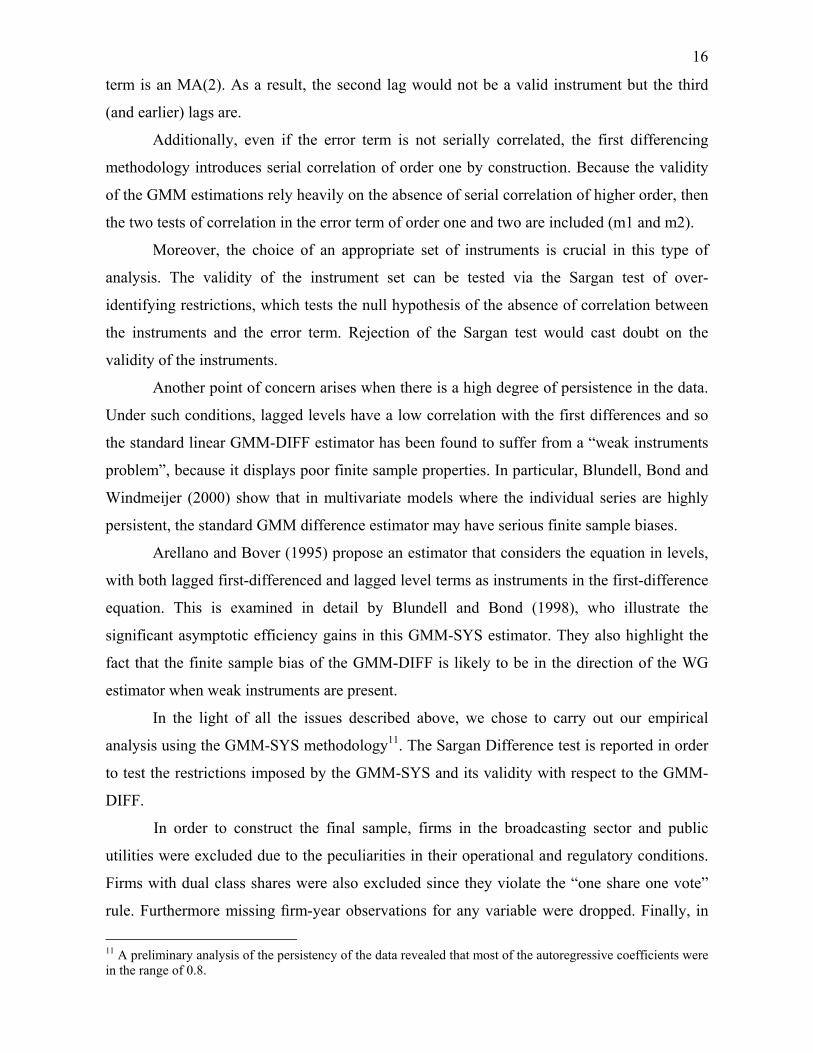
If we first difference model 1, we obtain: 2 3
1 1 2 3 4 5 6 7 8
9 10 11 12 (2)
it it it it it it it it it
it it it it t it
Q Q Man Man Man Block Ratio Size Div
Lev RDex Capex CFlow u
α α α α α α α α
α α α α η
−∆ =∆ + ∆ + ∆ + ∆ + ∆ +∆ +∆ + ∆
+ ∆ +∆ + ∆ +∆ + ∆ + ∆
Although the process of first differencing effectively transforms predetermined
variables into endogenous ones, it does not introduce all realizations of the disturbances into
the error term. As a consequence, we can use second (and earlier) lags as instruments for any
endogenous variables, under the assumption that there is no serial correlation in the error
term10. However, if the error term in model(1) is in fact MA(1), then the first differenced error
9 See Bond (2002) and Nickell (1981) for a more technical treatment. 10 Consider again for example that managerial ownership is predetermined. While in model 1 it is only influenced by past values of the error term (E(Manit ; uit-1) ≠ 0 ), when we use model 2 we are effectively introducing contemporaneous correlation since: E[(Manit - Manit-1);(uit-1- uit-2 )] ≠ 0. However, contrarily to the WG procedure, now the second lagged level Manit-2 is a valid instrument as it is orthogonal to the error term.
16
term is an MA(2). As a result, the second lag would not be a valid instrument but the third
(and earlier) lags are.
Additionally, even if the error term is not serially correlated, the first differencing
methodology introduces serial correlation of order one by construction. Because the validity
of the GMM estimations rely heavily on the absence of serial correlation of higher order, then
the two tests of correlation in the error term of order one and two are included (m1 and m2).
Moreover, the choice of an appropriate set of instruments is crucial in this type of
analysis. The validity of the instrument set can be tested via the Sargan test of over-
identifying restrictions, which tests the null hypothesis of the absence of correlation between
the instruments and the error term. Rejection of the Sargan test would cast doubt on the
validity of the instruments.
Another point of concern arises when there is a high degree of persistence in the data.
Under such conditions, lagged levels have a low correlation with the first differences and so
the standard linear GMM-DIFF estimator has been found to suffer from a “weak instruments
problem”, because it displays poor finite sample properties. In particular, Blundell, Bond and
Windmeijer (2000) show that in multivariate models where the individual series are highly
persistent, the standard GMM difference estimator may have serious finite sample biases.
Arellano and Bover (1995) propose an estimator that considers the equation in levels,
with both lagged first-differenced and lagged level terms as instruments in the first-difference
equation. This is examined in detail by Blundell and Bond (1998), who illustrate the
significant asymptotic efficiency gains in this GMM-SYS estimator. They also highlight the
fact that the finite sample bias of the GMM-DIFF is likely to be in the direction of the WG
estimator when weak instruments are present.
In the light of all the issues described above, we chose to carry out our empirical
analysis using the GMM-SYS methodology11. The Sargan Difference test is reported in order
to test the restrictions imposed by the GMM-SYS and its validity with respect to the GMM-
DIFF. In order to construct the final sample, firms in the broadcasting sector and public
utilities were excluded due to the peculiarities in their operational and regulatory conditions.
Firms with dual class shares were also excluded since they violate the “one share one vote”
rule. Furthermore missing firm-year observations for any variable were dropped. Finally, in
11 A preliminary analysis of the persistency of the data revealed that most of the autoregressive coefficients were in the range of 0.8.
17
line with the indications specified by Arellano Bond (1991), only firms with at least five
consecutive years of observations were kept. This left us with an unbalanced panel of 672
firms and 5667 observations. III. Empirical Results
In Table V, following the sequence of ideas outlined above, we compare the results of
the OLS, WG, GMM-DIFF and GMM-SYS estimations. As expected, while the OLS model
reports positively biased estimates of the autoregressive parameter, results obtained via the
WG methodology are biased in the opposite direction.
In line with the predictions outlined in the previous section, the GMM-DIFF estimator
seems to be biased in the direction of the WG, while the GMM-SYS estimator seems to
provide consistent and efficient estimates as the coefficient of the autoregressive component
now lies between the OLS and WG values. The Wald (joint) test provides evidence that the
regressors included in the model are all jointly significant, while the Wald (time) test provides
support to the inclusion of time dummies. The Sargan statistic confirms the validity of the
instrument set while the Sargan Difference test provides strong evidence in support of the
restrictions imposed by the GMM-SYS. As expected, we detect serial correlation of the first
order but not of order two.
In our work we explicitly allow all regressors to be endogenously determined. Since
instruments lagged at t-2 appear to be correlated with the error term, as indicated by the
Sargan statistic in model 3, all GMM estimations are carried out using the lagged levels at t-3
and t-4 of all the variables for the equations in first difference and the difference lagged at t-2
for all the variables in the level equation12. We adopt this parsimonious specification rather
using than all the available moment conditions in the first differenced equation since this
could result in potentially severe overfitting bias (Bond, 2002). Furthermore, according to
Bowsher (2002) the power of the Sargan statistic of detecting invalid restrictions can decline
dramatically if an excessive number of moment conditions are used.
A. Ownership and control characteristics: Managerial Ownership
12 The result in the Sargan statistic in Model 3 could be due to the persistency in the data. Consider the case of an endogenous variable. If Xit-2 is very similar, or in other words, highly correlated to Xit-1, then this may result in correlation between Xit-2 and ∆Uit.
18
In order to investigate whether the non-monotonic relation between managerial
ownership and firm performance is significant, our first step is to analyse the impact of
ownership held by all directors on the board. In the GMM-SYS model shown in Table V, we
find support for the cubic relationship between insider ownership and firm performance. For
low values of board ownership up to around 15%, consistent with the alignment hypothesis,
we detect a positive effect on firm performance. Alternatively, this may imply that the market
perceives insider ownership as a positive signal of reduced agency problems inside the firm.
Nonetheless, a further rise in managerial ownership increases the likelihood that managers
will become entrenched and this has a negative effect on firm value. Only at very high level
of ownership, between 15% and 45%, does the entrenchment effect seem to be prevalent. This
may be due to the fact that managers actually become the owners of the firm and at this point
manager-shareholder conflicts fade.
Our results tend to suggest that managers become entrenched at higher levels of
ownership than their US counterpart (for instance, Morck at al., 1988). As already argued by
Short-Keasey (1999) and Faccio and Lasfer (1999), this may be a consequence of the
institutional differences between the UK and the US systems in terms of legal restriction on
stock ownership, legal activism in corporate control and board composition.
In our second step, in order to test whether estimated alignment/entrenchment effects
apply to both categories of directors, we split board members between executives and non-
executives (Table VI). As we discussed above, there is no clear theoretical prediction to be
tested in literature on the functional form. Therefore we estimate three different models where
we allow ownership by non-executives to follow a cubic, quadratic and then linear relation to
firm value. Further, in order to account for the possibility that the way ownership by non-
executives influences performance may also depend on their relative presence in the board,
we introduce an interaction term.
All four models in Table VI provide consistent estimates in terms of the control
variables and estimated turning points. No model seems to provide support to the hypothesis
that share ownership by non-executives plays any role in determining firm performance. On
the other hand, results do indicate that executive directors follow the previously detected
cubic relationship and that the relationship between ownership by all board members and
performance is really only linked to the executive positions in the board. The relative stability
in the estimated turning points tends to corroborate this conclusion.
19
Our findings are in contrast with those of Morck et al. (1988) for US companies. Their
results indicate that not only do outside board members respond to financial incentives and
contribute to corporate wealth as officers do, but they also tend to become entrenched.
The figures in our analysis may be consistent with different interpretations. On the one
hand, they may indicate that outside directors are truly independent in the UK and so, are not
subject to any alignment/incentive effects in terms of their shareholding. On the other hand,
this may be interpreted as evidence of executive directors’ ability to create a board that is not
likely to monitor. Alternatively, and in line with the argument by Hart (1995), it may be
interpreted as evidence of the fact that non-executives in the UK still do not have enough
financial incentives to be active monitors of executives decisions. In fact, as reported in Table
II, ownership by non executives is substantially lower than ownership by executives,
especially in the early nineties.
However, according to all our results, the larger the fraction of outside directors in the
board, the better a firm seems to perform. This is in line with the findings in Faccio-Lasfer
(1999) and may further corroborate the hypothesis that UK non-executive directors are
effectively independent. Moreover, this is consistent with findings by Dahya et al. (2002),
who detect an increased sensitivity of turnover to performance due to an increase in the non-
executives presence in the board. Dahya et al. (2003), also concluded that firms which
increased the number of non-executives experienced a significant improvement in
performance. On the contrary, this evidence is in contrast with the study by Franks et al.
(2001) on the determinants of executive board turnover in the UK from 1988 to 1993. Our
results are also in contrast with Agrawal and Knoeber (1996) who reported that in US
companies, more outsiders are actually associated with faltering firm performance.
As a robustness check, we include an interaction term which allows the impact of non-
executive shareholding on value to depend on the proportion of non-executives in the board.
What we find (Table VI model 9) is that there is no a significant improvement in the firm
performance when we interact non-executive ownership and their proportion in the board,
confirming that in UK companies, non-executive directors do not seem to respond to financial
incentives in the way they do in the US market 13.
B. Ownership and control characteristics: Large external shareholders
13 Unreported tables also show that the interaction is insignificant when we include the quadratic and the cubic specification for non-executive ownership.
20
As far as ownership concentration is concerned, we detect a negative relation between
block holders and Tobin’s q, which appears not to be sensitive to the adoption of different
specifications for outsider ownership. Our findings are in line with those in Faccio and Lasfer
(1999) and Davies et al. (2004), but in contrast with Dahya et al. (2002), who fail to detect
any significant role for blockholders in determining CEO turnover in UK companies between
1989 and 1996.
This result seems to tally with the argument of Burkart et al. (1997) who contend that
too much block ownership will overly constrain management and reduce their ability to take
value maximizing investment decisions.
Another possible explanation might be that disclosed shareholding is too dispersed, so
that no individual shareholder has the incentive to actively monitor managerial behaviour
because the coordination costs are higher than the benefits singly received by each of them.
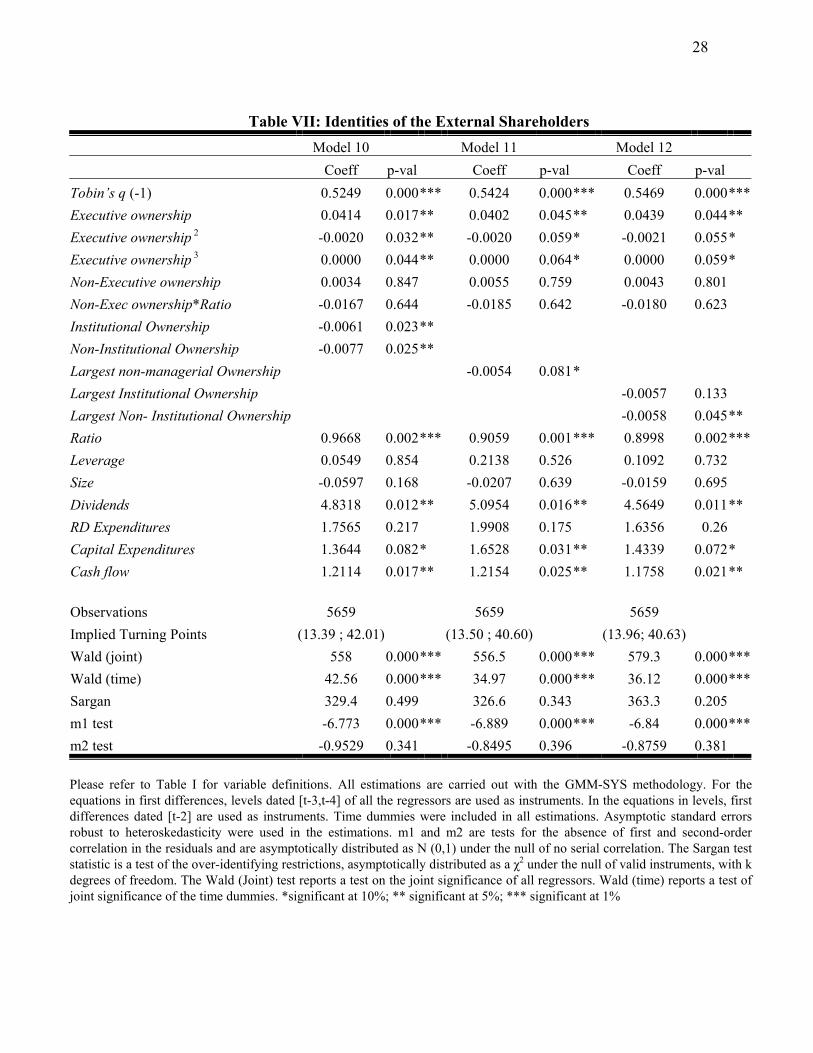
However, this interpretation does not hold when we take into account only the first largest
non-managerial owner. In fact, Table VII model 11 shows, as before, the same negative
relation between the largest non-managerial shareholder and Q. Furthermore, results for both
block holding and individual largest shareholding are in contrast with the findings reported by
McConnell and Servaes (1990; 1995), who fail to detect any significant impact of large
external shareholders on firm performance in the US case14. Our results are also different
from Davies et al. (2004), who also report no significant impact by the largest stakeholder.
The identity of owners also provides further insight into the relationship between
external shareholders and firm performance.
C. Ownership and control characteristics: Identities of large external shareholders
The data we collected allows us to discriminate between the various typologies of
investors. In Table VII we sub-divide ownership by external and largest non-managerial
investors (models 10 and 12) into ownership by institutions and non-institutions. We find no
evidence in support of the hypothesis that different owners have a different impact on firm
value, whether as a group or as a largest shareholder.
Our results suggest that non-institutional owners can negatively affect firm value. This
may happen for instance if they collude with managers in the company at the expense of the
14 With the exception of low-growth firms in the years 1986 and 1988, when all outside shareholders seem to positively contribute to firm value
21
minority investors or in cases when they are passive and unwittingly allow managers to
expropriate firm resources.
This is not in line with the findings presented in Short-Keasey (1999), who report a
positive impact of non-institutional shareholders on firm value. Also Frank et al. (2001)
report a positive relationship between individuals and industrial companies with regard to
executive board turnover for the worst performing English companies. This result is cited in
support of the hypothesis that there is a certain degree of monitoring action by this kind of
shareholder on manager behavior.
On the other hand, results for institutional shareholders seem to support the thesis that
institutional investors are either passive or, alternatively, they connive and collaborate with
managers. In both cases, corporate performance will suffer. For the UK companies, Dahya et
al. (2002) fail to detect any significant impact of institutional shareholders on management
turnover from 1989 through 1996. This figure is also in line with Short-Keasey (1999), who
report no significant positive impact of English institutional owners on their proxy for Tobin’s
q. Instead, McConnell-Servaes (1995) provide evidence that the influence of institutional
investors on Q for US companies is highly significant.
D. Economic variables
We find that dividends, cash flow and capital expenditures are all highly significant in
determining firm value. The positive relation between dividends and Q seems to support the
Easterbrook (1984) and Jensen (1986) argument that dividends are a means to mitigate
manager-shareholder conflict within the firm, producing an improvement in its market
evaluation. This result is partly in line with findings by Farinha (2003) who shows an increase
in dividend payments for UK firms, when managers are entrenched.
On the other hand, the positive impact of cash flow on firm value seems to suggest
that the availability of internal funds may have a positive impact on the valuation of the
company. One interpretation of this result might be that internally generated funds allow the
firm to reduce the risk of underinvestment and pursue valuable growth opportunities. In all
the models we detect a positive relation between investments and firm value though only
expenditures in tangible assets are statistically significant15. Our results are consistent with
15 One explanation for the insignificancy in intangible assets expenses is that a large number of firms reported zero RD expenditures. As a result, the data may not have sufficient variability to show a significant relationship in the econometric specification we adopted.
22
those reported in Davies et al.(2004), while for US firms Morck et al. (1988) and McConnell-
Servaes (1990; 1995) show a significant impact on R&D expenditures as well.
Finally, in none of the models estimated do we detect any significant impact of
leverage or size .
IV. Conclusions
This paper studies the relationship between firm performance and ownership structure
of firms using an original panel data set of around 1100 UK listed non-financial firms for the
period 1991-2001. More in detail, we investigate whether non-executive directors play a
separate role from executives in determining firm performance.
Our analysis fails to detect any evidence of a significant relationship between
ownership by non-executive directors and Tobin’s q. We show that the
alignment/entrenchment effect as detected on the total board is in fact driven by the executive
positions on the board. Nonetheless, our results tend to indicate that the proportion of non-
executives on the board exerts a positive role on corporate value. This result is robust to the
introduction of an interaction effect between the ratio of non-executives and their
shareholding.
These results are consistent with diverse interpretations. On the one hand they may
suggest that non-executive director are truly independent in the UK and as such not sensitive
to incentive mechanisms. On the other hand, in line with the argument by Hart (1995) they
may also indicate that financial incentives for non-executives are still insufficient. This
interpretation is particularly interesting when considering the recent increasing trend in non-
executive shareholding for UK firms.
In line with recent findings for the UK, we also detect a negative relationship between
performance and block holding. We investigate this issue more in depth by separating the
identity of external owners and results show that institutions and private investors seem to
influence corporate value in the same way. We also analyze the role of the largest non-
managerial owner and its identity. Results tend to confirm the negative role played by
external shareholders on firm performance.
Additionally, our results indicate that investment in physical capital, cash flow and
dividend payments play an important positive role in determining firm performance.
Finally, we show that our results are valid after allowing for the presence of individual
heterogeneity and for all dependent variables to be endogenously determined.
23
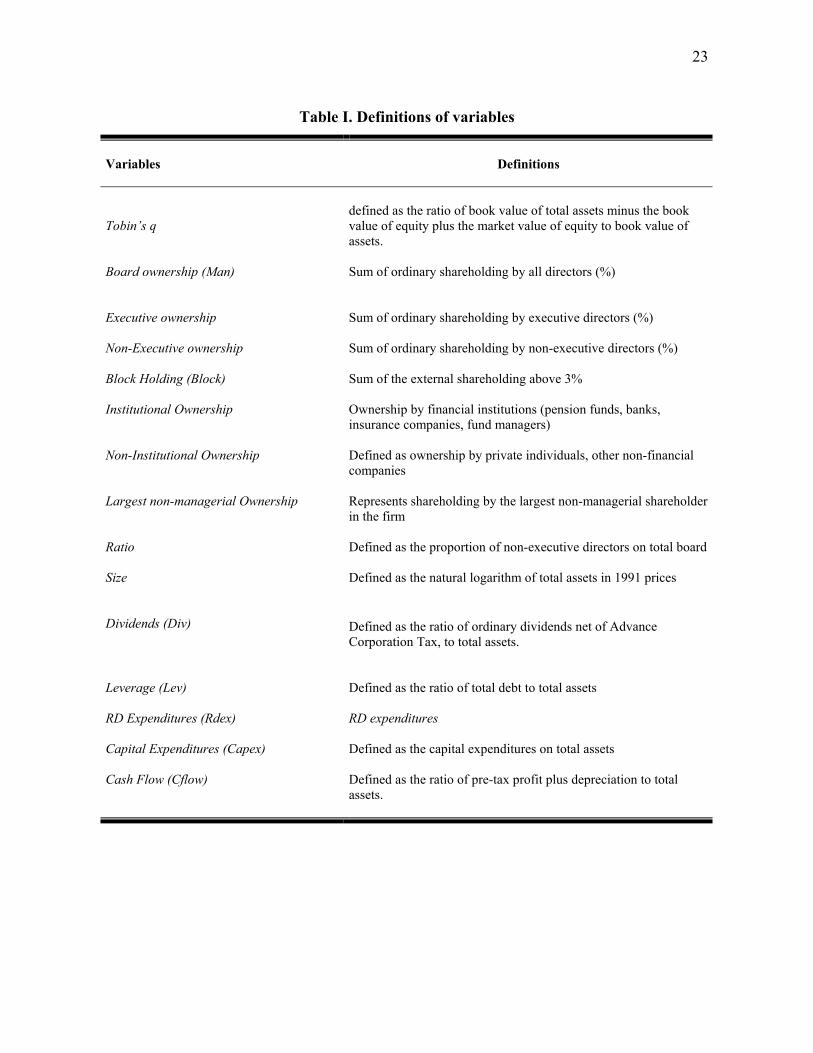
Table I. Definitions of variables
Variables
Definitions
Tobin’s q
defined as the ratio of book value of total assets minus the book value of equity plus the market value of equity to book value of assets.
Board ownership (Man)
Sum of ordinary shareholding by all directors (%)
Executive ownership
Sum of ordinary shareholding by executive directors (%)
Non-Executive ownership
Sum of ordinary shareholding by non-executive directors (%)
Block Holding (Block)
Sum of the external shareholding above 3%
Institutional Ownership
Ownership by financial institutions (pension funds, banks, insurance companies, fund managers)
Non-Institutional Ownership
Defined as ownership by private individuals, other non-financial companies
Largest non-managerial Ownership
Represents shareholding by the largest non-managerial shareholder in the firm
Ratio
Defined as the proportion of non-executive directors on total board
Size
Defined as the natural logarithm of total assets in 1991 prices
Dividends (Div)
Defined as the ratio of ordinary dividends net of Advance Corporation Tax, to total assets.
Leverage (Lev)
Defined as the ratio of total debt to total assets
RD Expenditures (Rdex)
RD expenditures
Capital Expenditures (Capex)
Defined as the capital expenditures on total assets
Cash Flow (Cflow)
Defined as the ratio of pre-tax profit plus depreciation to total assets.
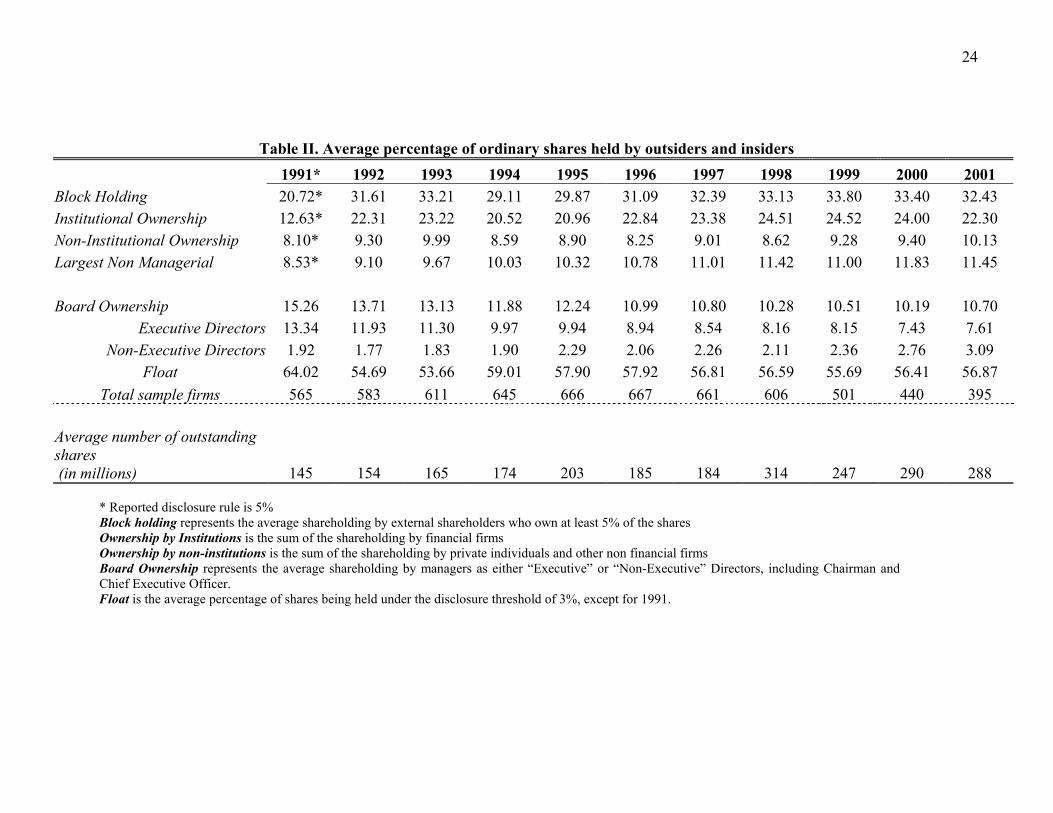
24
Table II. Average percentage of ordinary shares held by outsiders and insiders 1991* 1992 1993 1994 1995 1996 1997 1998 1999 2000 2001 Block Holding 20.72* 31.61 33.21 29.11 29.87 31.09 32.39 33.13 33.80 33.40 32.43 Institutional Ownership 12.63* 22.31 23.22 20.52 20.96 22.84 23.38 24.51 24.52 24.00 22.30 Non-Institutional Ownership 8.10* 9.30 9.99 8.59 8.90 8.25 9.01 8.62 9.28 9.40 10.13 Largest Non Managerial 8.53* 9.10 9.67 10.03 10.32 10.78 11.01 11.42 11.00 11.83 11.45 Board Ownership 15.26 13.71 13.13 11.88 12.24 10.99 10.80 10.28 10.51 10.19 10.70
Executive Directors 13.34 11.93 11.30 9.97 9.94 8.94 8.54 8.16 8.15 7.43 7.61 Non-Executive Directors 1.92 1.77 1.83 1.90 2.29 2.06 2.26 2.11 2.36 2.76 3.09
Float 64.02 54.69 53.66 59.01 57.90 57.92 56.81 56.59 55.69 56.41 56.87 Total sample firms 565 583 611 645 666 667 661 606 501 440 395
Average number of outstanding shares (in millions) 145 154 165 174 203 185 184 314 247 290 288
* Reported disclosure rule is 5% Block holding represents the average shareholding by external shareholders who own at least 5% of the shares Ownership by Institutions is the sum of the shareholding by financial firms Ownership by non-institutions is the sum of the shareholding by private individuals and other non financial firms Board Ownership represents the average shareholding by managers as either “Executive” or “Non-Executive” Directors, including Chairman and Chief Executive Officer. Float is the average percentage of shares being held under the disclosure threshold of 3%, except for 1991.
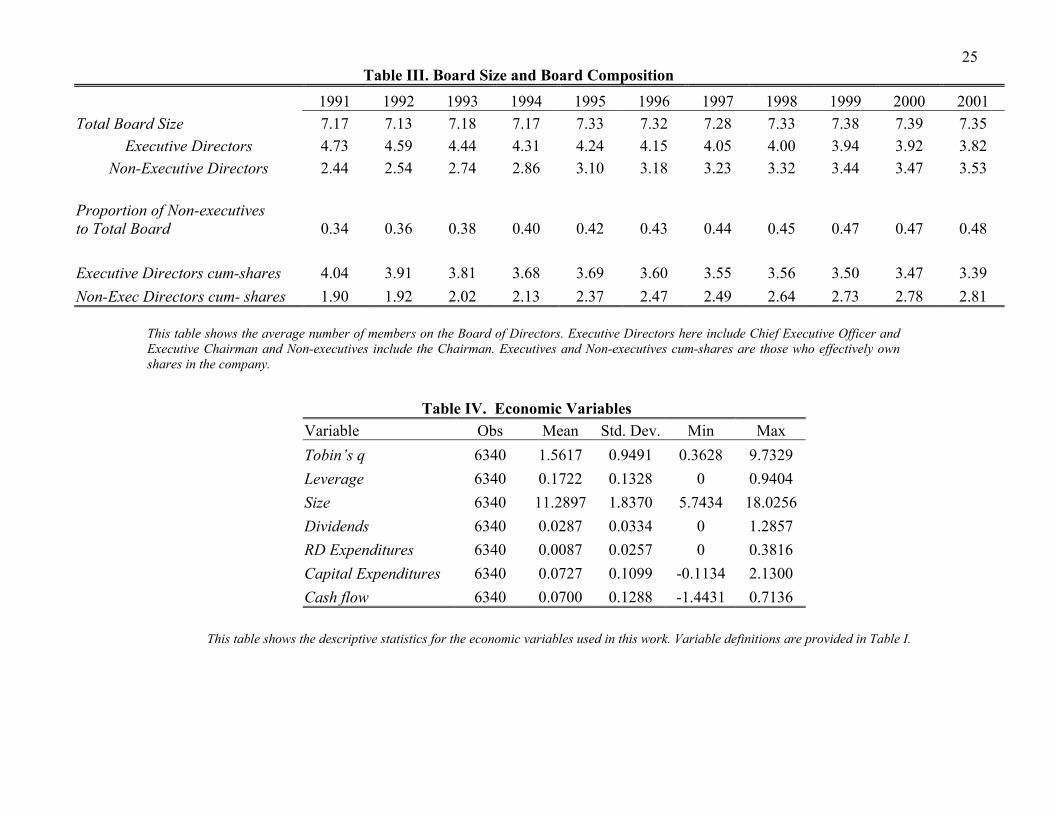
25Table III. Board Size and Board Composition
1991 1992 1993 1994 1995 1996 1997 1998 1999 2000 2001 Total Board Size 7.17 7.13 7.18 7.17 7.33 7.32 7.28 7.33 7.38 7.39 7.35
Executive Directors 4.73 4.59 4.44 4.31 4.24 4.15 4.05 4.00 3.94 3.92 3.82 Non-Executive Directors 2.44 2.54 2.74 2.86 3.10 3.18 3.23 3.32 3.44 3.47 3.53
Proportion of Non-executives to Total Board 0.34 0.36 0.38 0.40 0.42 0.43 0.44 0.45 0.47 0.47 0.48 Executive Directors cum-shares 4.04 3.91 3.81 3.68 3.69 3.60 3.55 3.56 3.50 3.47 3.39 Non-Exec Directors cum- shares 1.90 1.92 2.02 2.13 2.37 2.47 2.49 2.64 2.73 2.78 2.81
This table shows the average number of members on the Board of Directors. Executive Directors here include Chief Executive Officer and Executive Chairman and Non-executives include the Chairman. Executives and Non-executives cum-shares are those who effectively own shares in the company.
Table IV. Economic Variables Variable Obs Mean Std. Dev. Min Max Tobin’s q 6340 1.5617 0.9491 0.3628 9.7329 Leverage 6340 0.1722 0.1328 0 0.9404 Size 6340 11.2897 1.8370 5.7434 18.0256 Dividends 6340 0.0287 0.0334 0 1.2857 RD Expenditures 6340 0.0087 0.0257 0 0.3816 Capital Expenditures 6340 0.0727 0.1099 -0.1134 2.1300 Cash flow 6340 0.0700 0.1288 -1.4431 0.7136
This table shows the descriptive statistics for the economic variables used in this work. Variable definitions are provided in Table I.
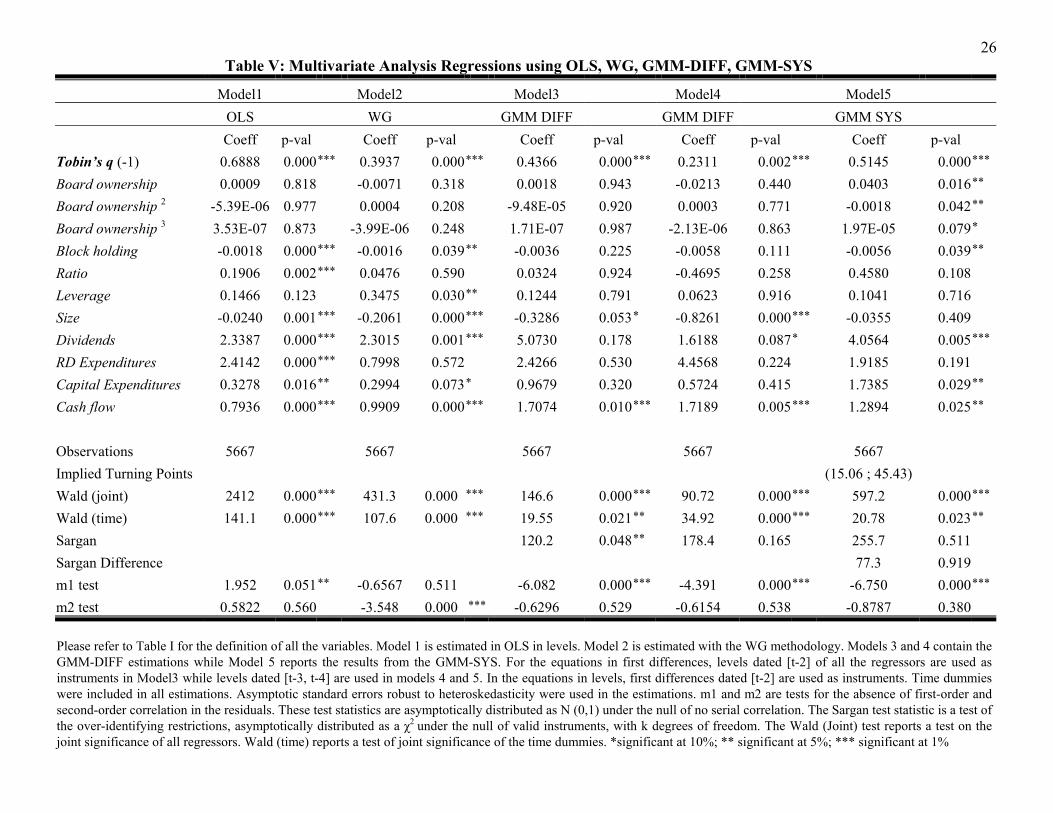
26 Table V: Multivariate Analysis Regressions using OLS, WG, GMM-DIFF, GMM-SYS
Model1 Model2 Model3 Model4 Model5
OLS WG GMM DIFF GMM DIFF GMM SYS
Coeff p-val Coeff p-val Coeff p-val Coeff p-val Coeff p-val
Tobin’s q (-1) 0.6888 0.000*** 0.3937 0.000*** 0.4366 0.000*** 0.2311 0.002*** 0.5145 0.000***
Board ownership 0.0009 0.818 -0.0071 0.318 0.0018 0.943 -0.0213 0.440 0.0403 0.016**
Board ownership 2 -5.39E-06 0.977 0.0004 0.208 -9.48E-05 0.920 0.0003 0.771 -0.0018 0.042**
Board ownership 3 3.53E-07 0.873 -3.99E-06 0.248 1.71E-07 0.987 -2.13E-06 0.863 1.97E-05 0.079*
Block holding -0.0018 0.000*** -0.0016 0.039** -0.0036 0.225 -0.0058 0.111 -0.0056 0.039**
Ratio 0.1906 0.002*** 0.0476 0.590 0.0324 0.924 -0.4695 0.258 0.4580 0.108
Leverage 0.1466 0.123 0.3475 0.030** 0.1244 0.791 0.0623 0.916 0.1041 0.716
Size -0.0240 0.001*** -0.2061 0.000*** -0.3286 0.053* -0.8261 0.000*** -0.0355 0.409
Dividends 2.3387 0.000*** 2.3015 0.001*** 5.0730 0.178 1.6188 0.087* 4.0564 0.005***
RD Expenditures 2.4142 0.000*** 0.7998 0.572 2.4266 0.530 4.4568 0.224 1.9185 0.191
Capital Expenditures 0.3278 0.016** 0.2994 0.073* 0.9679 0.320 0.5724 0.415 1.7385 0.029**
Cash flow 0.7936 0.000*** 0.9909 0.000*** 1.7074 0.010*** 1.7189 0.005*** 1.2894 0.025**
Observations 5667 5667 5667 5667 5667
Implied Turning Points (15.06 ; 45.43)
Wald (joint) 2412 0.000*** 431.3 0.000 *** 146.6 0.000*** 90.72 0.000*** 597.2 0.000***
Wald (time) 141.1 0.000*** 107.6 0.000 *** 19.55 0.021** 34.92 0.000*** 20.78 0.023**
Sargan 120.2 0.048** 178.4 0.165 255.7 0.511
Sargan Difference 77.3 0.919
m1 test 1.952 0.051** -0.6567 0.511 -6.082 0.000*** -4.391 0.000*** -6.750 0.000***
m2 test 0.5822 0.560 -3.548 0.000 *** -0.6296 0.529 -0.6154 0.538 -0.8787 0.380
Please refer to Table I for the definition of all the variables. Model 1 is estimated in OLS in levels. Model 2 is estimated with the WG methodology. Models 3 and 4 contain the GMM-DIFF estimations while Model 5 reports the results from the GMM-SYS. For the equations in first differences, levels dated [t-2] of all the regressors are used as instruments in Model3 while levels dated [t-3, t-4] are used in models 4 and 5. In the equations in levels, first differences dated [t-2] are used as instruments. Time dummies were included in all estimations. Asymptotic standard errors robust to heteroskedasticity were used in the estimations. m1 and m2 are tests for the absence of first-order and second-order correlation in the residuals. These test statistics are asymptotically distributed as N (0,1) under the null of no serial correlation. The Sargan test statistic is a test of the over-identifying restrictions, asymptotically distributed as a χ2 under the null of valid instruments, with k degrees of freedom. The Wald (Joint) test reports a test on the joint significance of all regressors. Wald (time) reports a test of joint significance of the time dummies. *significant at 10%; ** significant at 5%; *** significant at 1%
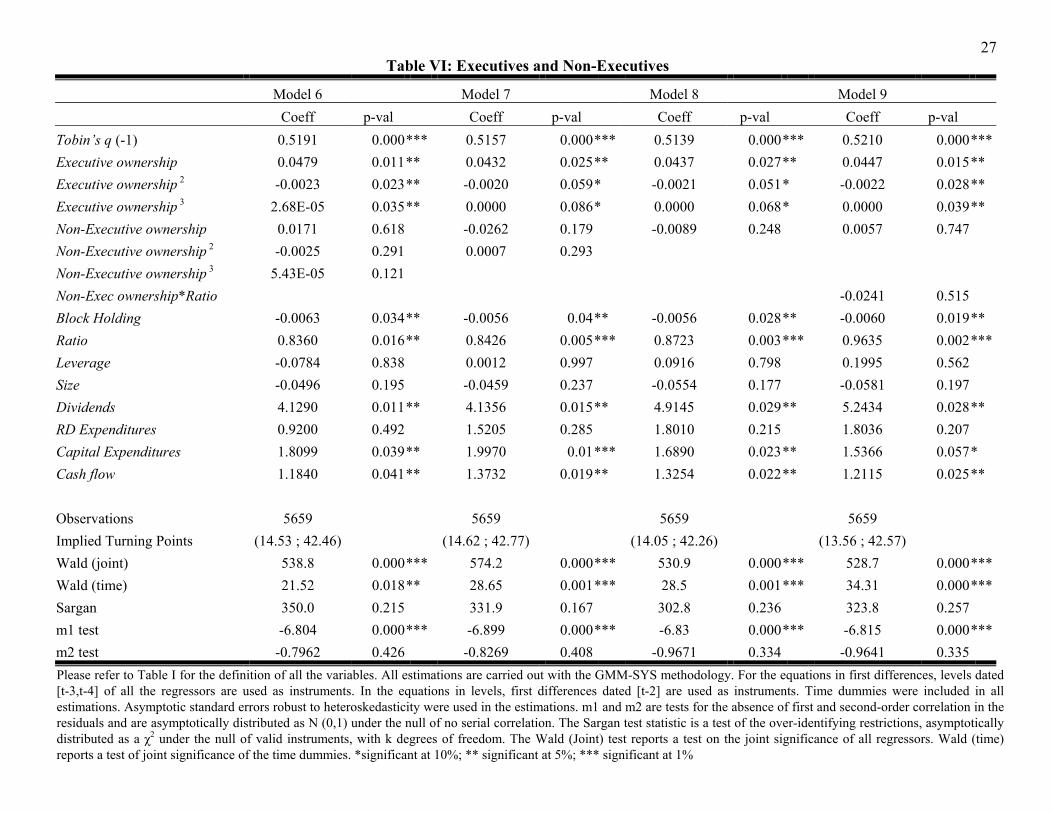
27 Table VI: Executives and Non-Executives
Model 6 Model 7 Model 8 Model 9 Coeff p-val Coeff p-val Coeff p-val Coeff p-val Tobin’s q (-1) 0.5191 0.000*** 0.5157 0.000*** 0.5139 0.000*** 0.5210 0.000*** Executive ownership 0.0479 0.011** 0.0432 0.025** 0.0437 0.027** 0.0447 0.015** Executive ownership 2 -0.0023 0.023** -0.0020 0.059* -0.0021 0.051* -0.0022 0.028** Executive ownership 3 2.68E-05 0.035** 0.0000 0.086* 0.0000 0.068* 0.0000 0.039** Non-Executive ownership 0.0171 0.618 -0.0262 0.179 -0.0089 0.248 0.0057 0.747 Non-Executive ownership 2 -0.0025 0.291 0.0007 0.293 Non-Executive ownership 3 5.43E-05 0.121 Non-Exec ownership*Ratio -0.0241 0.515 Block Holding -0.0063 0.034** -0.0056 0.04** -0.0056 0.028** -0.0060 0.019** Ratio 0.8360 0.016** 0.8426 0.005*** 0.8723 0.003*** 0.9635 0.002*** Leverage -0.0784 0.838 0.0012 0.997 0.0916 0.798 0.1995 0.562 Size -0.0496 0.195 -0.0459 0.237 -0.0554 0.177 -0.0581 0.197 Dividends 4.1290 0.011** 4.1356 0.015** 4.9145 0.029** 5.2434 0.028** RD Expenditures 0.9200 0.492 1.5205 0.285 1.8010 0.215 1.8036 0.207 Capital Expenditures 1.8099 0.039** 1.9970 0.01*** 1.6890 0.023** 1.5366 0.057* Cash flow 1.1840 0.041** 1.3732 0.019** 1.3254 0.022** 1.2115 0.025** Observations 5659 5659 5659 5659 Implied Turning Points (14.53 ; 42.46) (14.62 ; 42.77) (14.05 ; 42.26) (13.56 ; 42.57) Wald (joint) 538.8 0.000*** 574.2 0.000*** 530.9 0.000*** 528.7 0.000*** Wald (time) 21.52 0.018** 28.65 0.001*** 28.5 0.001*** 34.31 0.000*** Sargan 350.0 0.215 331.9 0.167 302.8 0.236 323.8 0.257 m1 test -6.804 0.000*** -6.899 0.000*** -6.83 0.000*** -6.815 0.000*** m2 test -0.7962 0.426 -0.8269 0.408 -0.9671 0.334 -0.9641 0.335 Please refer to Table I for the definition of all the variables. All estimations are carried out with the GMM-SYS methodology. For the equations in first differences, levels dated [t-3,t-4] of all the regressors are used as instruments. In the equations in levels, first differences dated [t-2] are used as instruments. Time dummies were included in all estimations. Asymptotic standard errors robust to heteroskedasticity were used in the estimations. m1 and m2 are tests for the absence of first and second-order correlation in the residuals and are asymptotically distributed as N (0,1) under the null of no serial correlation. The Sargan test statistic is a test of the over-identifying restrictions, asymptotically distributed as a χ2 under the null of valid instruments, with k degrees of freedom. The Wald (Joint) test reports a test on the joint significance of all regressors. Wald (time) reports a test of joint significance of the time dummies. *significant at 10%; ** significant at 5%; *** significant at 1%
28
Table VII: Identities of the External Shareholders Model 10 Model 11 Model 12 Coeff p-val Coeff p-val Coeff p-val Tobin’s q (-1) 0.5249 0.000*** 0.5424 0.000*** 0.5469 0.000***Executive ownership 0.0414 0.017** 0.0402 0.045** 0.0439 0.044** Executive ownership 2 -0.0020 0.032** -0.0020 0.059* -0.0021 0.055* Executive ownership 3 0.0000 0.044** 0.0000 0.064* 0.0000 0.059* Non-Executive ownership 0.0034 0.847 0.0055 0.759 0.0043 0.801 Non-Exec ownership*Ratio -0.0167 0.644 -0.0185 0.642 -0.0180 0.623 Institutional Ownership -0.0061 0.023** Non-Institutional Ownership -0.0077 0.025** Largest non-managerial Ownership -0.0054 0.081* Largest Institutional Ownership -0.0057 0.133 Largest Non- Institutional Ownership -0.0058 0.045** Ratio 0.9668 0.002*** 0.9059 0.001*** 0.8998 0.002***Leverage 0.0549 0.854 0.2138 0.526 0.1092 0.732 Size -0.0597 0.168 -0.0207 0.639 -0.0159 0.695 Dividends 4.8318 0.012** 5.0954 0.016** 4.5649 0.011** RD Expenditures 1.7565 0.217 1.9908 0.175 1.6356 0.26 Capital Expenditures 1.3644 0.082* 1.6528 0.031** 1.4339 0.072* Cash flow 1.2114 0.017** 1.2154 0.025** 1.1758 0.021** Observations 5659 5659 5659 Implied Turning Points (13.39 ; 42.01) (13.50 ; 40.60) (13.96; 40.63) Wald (joint) 558 0.000*** 556.5 0.000*** 579.3 0.000***Wald (time) 42.56 0.000*** 34.97 0.000*** 36.12 0.000***Sargan 329.4 0.499 326.6 0.343 363.3 0.205 m1 test -6.773 0.000*** -6.889 0.000*** -6.84 0.000***m2 test -0.9529 0.341 -0.8495 0.396 -0.8759 0.381
Please refer to Table I for variable definitions. All estimations are carried out with the GMM-SYS methodology. For the equations in first differences, levels dated [t-3,t-4] of all the regressors are used as instruments. In the equations in levels, first differences dated [t-2] are used as instruments. Time dummies were included in all estimations. Asymptotic standard errors robust to heteroskedasticity were used in the estimations. m1 and m2 are tests for the absence of first and second-order correlation in the residuals and are asymptotically distributed as N (0,1) under the null of no serial correlation. The Sargan test statistic is a test of the over-identifying restrictions, asymptotically distributed as a χ2 under the null of valid instruments, with k degrees of freedom. The Wald (Joint) test reports a test on the joint significance of all regressors. Wald (time) reports a test of joint significance of the time dummies. *significant at 10%; ** significant at 5%; *** significant at 1%
29
REFERENCES Agrawal, A. and C.R. Knoeber, 1996, “Firms Performance and Mechanisms to Control
Agency Problems between Managers and Shareholders,” Journal of Financial and
Quantitative Analysis, 31, 377-397.
Arellano, M. and S. Bond, 1991, “Some tests of specification for panel data: Monte Carlo evidence and
an application to employment equations,” Review of Economic Studies, 58, 277-297.
Arellano, M. and O. Bover, 1995, “Another look at the instrumental variable estimation of error
component models,” Journal of Econometrics, 68, 29-51.
Bearle A., G. Means, 1932, The Modern Corporation and Private Property, London
MacMillan.
Bhagat, S. and B.S. Black, 1998, “The uncertain relationship between board composition and
firm performance,” in: K.Hopt, M.Roe and E.Wymeersch eds, Corporate Governance:
The State of the Art and Emerging research ,Oxford, Oxford University Press.
Black, B. and J. Coffee, 1994, “Hail Britannia?: Institutional Investor Behaviour under
Limited Regulation,” Michigan Law Review, 92, 1997-2087.
Blundell, R. and S. Bond, 1998, “Initial conditions and moment restrictions in dynamic panel
data models,” Journal of Econometrics, 87, 115-143.
Blundell, R. and S. Bond and F. Windmeijer, 2000, “Estimation in dynamic panel data
models: improving on the performance of the standard GMM estimators,” IFS working
paper, WP 00/12.
Bond, S., 2002, “Dynamic panel data models: a guide to micro data methods and practice,”
IFS working paper, WP 09/02.
Bowsher, C., 2002, “On testing overidentifying restrictions in dynamic panel data models,”
Economic Letters, 77, 211-220.
Brickley, J.A., R.C. Lease, C.W. Smith JR, 1988, “Ownership structure and voting on anti-
takeover amendments,” Journal of Financial Economics, vol.20, 267-291.
Burkart, M. and D. Gromb and F. Panunzi, 1997, “Large Shareholders, Monitoring and the
Value of the Firm,” The Quarterly Journal of Economics, vol. 112,3, 693-728.
Cadbury Report, 1992, “Report of the Committee on the Financial Aspects of Corporate
Governance,” Chairman: Sir Adrian Cadbury, London, London GEE.
Chan, S.H. and J.D. Martin and J.W. Kesinger, 1990, “Corporate Research and Development
expenditures and share value”, Journal of Financial Economics, 26, 255-276.
30
Cho, Myeong-Hyeon ,1998, “Ownership Structure, Investment, and the Corporate Value: An
Empirical Analysis,” Journal of Financial Economics, 47, 103-121.
Chung, K.H. and S.W. Pruitt, 1994, “A Simple Approximation of Tobin’s q,” Financial
Management, Autumn, 70-74.
Claessens, S. and S. Djankov and J.P.H. Fan and H.P. Lang, 2002, “Disentangling the
incentive and entrenchment effects of large shareholdings,” Journal of Finance, 2741-2771.
Conyon, M.J. and S.I. Peck, 1997, “Recent Developments in UK Corporate Governance,” in
Buxton, A., Chapman, P. and P. Temple, Ed., Britain’s Economic Performance. London,
Routledge, 253-277
Cosh, A., A. Hughes, 1997, “Executive remuneration, executive dismissal and institutional
shareholdings,” International Journal of Industrial Organization 15, 469–492.
Crespi-Cladera, R. and L. Renneboog, 2003, “United we stand: Coalition formation and
shareholder monitoring in the UK,” Discussion paper CentER, Tilburg University.
Dahya,J., J.J. McConnell, 2002, “The Cadbury committee, corporate performance and top
management turnover,” Journal of Finance, vol.67, n.1, 461-483.
Dahya, J., J.J. McConnell, 2003, “Board Composition, Corporate Performance and the
Cadbury Committee Recommendation,” Working Paper.
Davies, J.R. and D. Hillier and P. McColgan, “Ownership Structure, Managerial Behavior and
Corporate Value,” Forthcoming Journal of Corporate Finance.
Dedman, E., 2003, Executive Turnover in UK Firms: the Impact of Cadbury, Accounting
and Business Research, 33, 33-50.
Demsetz, H., 1983, “The structure of ownership and the theory of the firm” Journal of Law
and Economics 26, 375–390.
Demsetz, H., K. Lehn, 1985, “The structure of corporate ownership: causes and
consequences” Journal of Political Economy 93, 1155–1177.
Demsetz, H. and B. Villalonga, 2001, "Ownership structure and corporate performance,”
Journal of Corporate Finance 7, 209–233,2.
Easterbrook, F.H., 1984, “Two Agency Costs Explanations of Dividends,” American
Economic Review, 650-59.
Faccio, M. and A.M. Lasfer, 1999, Board Structure and Agency Costs, SSRN WP179008.
Fama, E. and M.C. Jensen, 1983, “Separation of Ownership and Control,” Journal of Law and
Economics, 26, 301-325.
31
Farinha, J., 2003, “Dividend Policy, Corporate Governance and the Managerial Entrenchment
Hypothesis: an Empirical Analysis,” Journal of Business Finance and Accounting, 9-
10,1173-1209.
Fazzari, S.M., G.R. Hubbard, B. Petersen, 1996, “Financing constraints and corporate
investment” NBER Working Paper, No. 5462,
Franks, J., C. Mayer and L. Renneboog, 2001, “Who disciplines management in Poorly
performing countries?,” Journal of Financial Intermediation, 209-248
Franks, J., C. Mayer and S. Rossi, 2003, “The Origination and Evolution of Ownership and
Control,” 9, working paper ECGI.
Gadhoum, Y. and L.H.P. Lang and L. Young, 2004, “Who controls US?,” European
Financial Management, forthcoming.
Goergen, M. and L. Renneboog, 2001, “Investment policy, internal financing and ownership
concentration in the UK,” Journal of Corporate Finance, 257-284
Greenbury Report ,1995, Directors’ Remuneration: Report of a Study Group, Chairman, Sir
Richard Greenbury, London: GEE.
Hampel Report ,1998, Committee on Corporate Governance: Final Report ,Chairman, Sir
Ronald Hampel, London GEE.
Hart, O.,1995, “Corporate Governance: Some Theory and Implications,” The Economic
Journal, 105, 678-689.
Hermalin, B. and M. Wiesbach, 1991, “The Effect of Board Composition and Direct
Incentives on Firm Performance,” Financial Management, 20, 101-112.
Higgs Report, 2003, Review of the Role and Effectiveness of Non-Executive Directors.
London: GEE.
Himmelberg, P. Charles, R.G. Hubbard and D. Palia, 1999, "Understanding the Determinants
of Managerial Ownership and the Link between Ownership and Performance,” Journal of
Financial Economics, 53, 353-384.
Holderness, C.G. and R.S. Kroszner and D.P. Sheehan, 1999, “Were the Good Old Days That
Good?: Changes in Managerial Stock Ownership Since the Great Depression,” Journal of
Finance, April, 54, 1.
Holderness, C.G. and D.P. Sheehan, 1988b, “The Role of Majority Shareholders in Publicly
Held Corporations: An Exploratory Analysis,” Journal of Financial Economics, 20, 317-
347.
32
Jensen, C.M., 1986, “Agency Costs of Free Cash Flow, Corporate Finance and Takeovers,”
American Economic Review, 76, May, 323-329.
Jensen, C.M., 1993, “The Modern Industrial Revolution, Exit and Failure of Internal Control
Systems,” Journal of Finance, 48, 831-880.
Jensen, C.M. and W. Meckling, 1976, “Theory of the Firm: Managerial Behavior, Agency
Cost and Capital Structure,” Journal of Financial Economics, 3, October, 305-360.
La Porta, R. and L.F.De Silanes and A. Shleifer, 1999, “Corporate Ownership around the
World,” Journal of Finance, 54, 471-517.
La Porta, R. and L.F.De Silanes and A. Shleifer and R.W. Vishny, 2002, “Investor Protection
and Corporate Valuation,” Journal of Finance, 1147-1169.
Lindenberg, E. and S. Ross, 1981, “Tobin’s q Ratio and Industrial Organization,” Journal of
Business, 54, 1-32.
Loderer, C.F. and K. Martin, 1997, “Executive Stock Ownership and Performance: Tracking
Faint Traces,” Journal of Financial Economics, 45, 2, 223-255.
Marchica, M.T. and R. Mura, 2005, “Direct and ultimate ownership structures in the UK: an
intertemporal perspective over the last decade”, Corporate Governance: An International
Review, Vol.13, 1, 26-45.
McConnell, J.J. and H. Servaes, 1990, “Additional Evidence on Equity Ownership and
Corporate Value,” Journal of Financial Economics, 27, 2, 595-612.
McConnell, J.J. and H. Servaes, 1995, “Equity Ownership and the two Faces of Debt,”
Journal of Financial Economics, 39, 1, 131-157.
McConnell, J.J. and C. J. Muscarella, 1985, “Corporate Capital Expenditures and the Market
value of the Firm,” Journal of Financial Economics, 14, 399-422.
Milgrom, P. and J. Roberts, 1992, “Economics, Organization and Management,” Prentice
Hall.
Modigliani, F. and M. Miller,1963, “Taxes and the Cost of Capital: A Correction,” American
Economic Review, June, 433-443.
Morck, R. and A. Shleifer and R.W. Vishny, 1988b, “Management Ownership and Market
Valuation: An Empirical Analysis,” Journal of Financial Economics, 20, 293-315.
Nickell, S, 1981, “Biases in Dynamic Models with Fixed Effects,” Econometrica, 49,
pp.1417-26.
Peasnell, K.V. and P.F. Pope and S. Young, 2003, “Managerial Equity Ownership and the
Demand for Outside Directors,” European Financial Management, 9, 99-118.
33
Perfect, S.B. and K.W. Wiles, 1994, “Alternative Constructions of Tobin’s q: An Empirical
Comparison,” Journal of Empirical Finance, 1, 313-341.
Pound, J., 1988, “Proxy Contests and the Efficiency of Shareholder Oversight,” Journal of
Financial Economics, 20, 237-265.
Rosenstein, S. and J.G. Wyatt, 1990, “Outside Directors, Board Independence and
Shareholder Wealth,” Journal of Financial Economics, 26, 175-191.
Ross, S.A., 1977, “The Determination of Financial Structure: The Incentive Signalling
Approach,” Bell Journal of Economics, 8, 23-40.
Shleifer, A. and R.W. Vishny, 1986b, “Large Shareholders and Corporate Control,” Journal
of Political Economy , 94, 3, 461-488.
Shleifer, A. and R.W. Vishny, 1989, “Management Entrenchment: The Case of Manager-
Specific Investments,” Journal of Financial Economics , 25, 1, 123-140.
Shleifer, A. and R. Vishny, 1997, “A Survey of Corporate Governance,” Journal of Finance,
52, 737-783.
Short, E. and K. Keasey, 1999, “Managerial Ownership and the performance of firms:
Evidence from the UK,” Journal of Corporate Finance, 5, 79-101.
Smith, C. and J. Warner, 1979, “On Financial Contracting: An Analysis of Bond Covenants,”
Journal of Financial Economics, 7, 117-161.
Stapledon, G. ,1996, “Analysis of data and share ownership and control in UK,” mimeo
Stiglitz, J.E., 1985, “Credit Markets and Control of Capital,” Journal of Money, Credit and
Banking, 17, 133-152.
Tobin J., 1969, “A General Equilibrium Approach to Monetary Theory,” Journal of Money,
Credit and Banking, 1, 15-29.
Webb, R. and M. Beck and R. McKinnon, 2003, “Problems and limitations of Institutional
Investor Participation in Corporate Governance,” Corporate Governance: An
International Review, 11, 65-73.
Weir, C. and D. Laing and P. McKnight, 2002, “Internal and External Governance
Mechanisms: their Impact on the Performance of Large UK Public Companies,” Journal
of Business Finance & Accounting, 29, 579-611.
Yermack, D., 1996, “Higher Market Valuation of Companies with Small Board of Directors,”
Journal of Financial Economics, 40, 3, 185-213.

34
Young, S., 2000, “The increasing use of Non-Executive directors: its impact on UK board
structure and governance arrangements,” Journal of Business Finance & Accounting,
vol.27, 9, 1311-13142.