Embed Size (px)
Citation preview
Copyright © 2013, 2014 by George Serafeim
Working papers are in draft form. This working paper is distributed for purposes of comment and discussion only. It may not be reproduced without permission of the copyright holder. Copies of working papers are available from the author.
Firm Competitiveness and Detection of Bribery George Serafeim
Working Paper
14-012 April 4, 2014
1
Firm Competitiveness and Detection of Bribery
George Serafeim
Harvard Business School
Abstract
Using survey data from firms around the world I analyze how detection of bribery has impacted a firm’s
competitiveness over the past year. Managers report that the most significant impact was on employee
morale, followed by business relations, and then reputation and regulatory relations. The impact on stock
price has been much less significant and this could be attributed to stock prices not reflecting the impact
on employee morale and business relations in less competitive labor and product markets. To better
understand these bribery cases I analyze detailed data on the identity of the main perpetrator, detection
method and organizational response following detection and find that both the method of detection and
how an organization responds are systematically related to the seniority or type of the perpetrator. Finally,
I examine how these factors are associated with the impact on competitiveness and find that internally
initiated bribery from senior executives is more likely to be associated with a significant impact on firm
competitiveness. Bribery detected by the control systems of the firm is less likely to be associated with a
significant impact on regulatory relations. Finally, bribery cases where the main perpetrator is dismissed
are less likely to be associated with a significant impact on firm competitiveness. These results shed light
on the costs of bribery after detection.
Keywords: competitiveness, employee engagement, reputation, bribery, corruption, regulation
George Serafeim is at Harvard Business School. I acknowledge financial support from the Division of Faculty and
Research Development at Harvard Business School. I am grateful to PwC that made the data used in this study
available and to seminar participants at ESMT for many valuable comments. I am solely responsible for any errors.
Contact email: [email protected]
2
1. Introduction
This paper seeks to provide evidence on three questions. First, what is the impact on a company’s
competitiveness, in terms of reputation, business and regulatory relations, and employee morale, after
detection of bribery and how this impact affects a firm’s stock price? Second, how does the seniority or
type (for example customer vs. supplier) of the main perpetrator relates to the method through which the
bribe was detected and how the organization responded after detection? Third, how does the seniority or
type of the main perpetrator, detection method, and organizational response as well as other firm
characteristics relate to the impact on a firm’s competitiveness?
I use throughout the paper the term competitiveness to refer to four factors that have been
associated in the literature with building a sustainable competitive advantage; corporate reputation,
employee morale, business relations, and regulatory relations. Good reputation allows a company to
attract high quality human capital, charge premium prices, create customer loyalty, and expand
geographically. High employee morale is related to high productivity, creativity and innovation, all
significantly affecting the growth of a company. Good business relations enable a company to build a
robust supply chain, lower costs, avoid operating disruptions, and establish a satisfied and loyal customer
base while good regulatory relations secure a firm’s license to operate avoiding excessive regulatory costs
and fines, and allow the firm to gain access to new markets and grow across geographies.
In this study, detected cases of bribery refer to all cases that are detected either by the firm or by
actors outside the boundaries of the firm; not just cases detected by regulators that have been frequently
used in past studies. I focus on bribery because it is widespread around the world, illegal, detrimental to
economic progress and social stability, and at the same time it can have clear economic benefits for a firm
(Healy and Serafeim 2013).1 However, while the benefits of bribery for a firm, through acquisition of
contracts or avoidance of government bureaucracy, are intuitive and well documented (Cheung, Rau, and
Stouraitis, 2012), the costs after detection are less well understood (Karpoff, Lee, and Martin, 2013).
1 The World Bank estimates that more than $1 trillion are paid in bribes every year.
3
Detection can significantly impact a firm’s competitiveness both because of regulatory and
market forces. The illegality of the action initiates a legal and regulatory battle. Consider for example, the
case of Siemens and its multi-year and jurisdictional legal battle with law enforcement and regulatory
authorities that led the firm to incur billions in costs in the form of fines or expenses from organizational
restructuring. At the same time, employees, customers, suppliers, investors, and the general public are all
likely to express their dissatisfaction. Consider for example, how the bribery scandal at Alstom, the
French maker of trains and turbines, caused the Ethics Council of the Norwegian Pension Fund, to put
Alstom under review for four years due to what the Norwegian finance ministry said was the risk of gross
corruption in the company’s operations.2 Alstom responded stating that such, unfair according to
company executives, moves by large institutional investors were affecting the reputation of the firm and
its future competitiveness. As a result, both regulatory and market forces are likely to affect the
competitiveness of the company.
Several studies attempt to draw conclusions from stock market reactions about the impact of
bribery detection on firm competitiveness with conflicting results. Smith, Stettler, and Beedles (1984)
examine share price reactions to announcements by 98 firms that voluntarily reported payments to foreign
government officials during the SEC’s pre-FCPA amnesty program that ended in 1978. The average stock
price reaction is negative leading the authors to conclude that this reflects investors’ expectations of
future government sanctions or the loss of future business. Karpoff, Lee and Martin (2013) examine the
stock market response to firms prosecuted for foreign bribery and find that their stock price declines by
3.11%, on average, on the first day that news of the bribery enforcement action is reported, and by 8.98%
over all announcements related to the enforcement action. However, they find that most bribery
enforcement actions are co-mingled with charges of financial misrepresentation and fraud, and that most
of these firms’ costs are due to the financial violations, not the bribery charges per se.
2 http://www.reuters.com/article/2011/12/06/norway-fund-idUSL5E7N62LI20111206
4
The confounding of bribery with other violations of the law is one problem for studies that
attempt to draw inferences from stock price reactions. The radically different regulatory and social
context within which bribery happens is another one. Enforcement against bribery cases was barely
existent before 2007, but it is now much more frequent in some jurisdictions (Healy and Serafeim, 2013).
Moreover, efforts in the last ten years by numerous civil society and private organizations, along with
government initiatives to promote responsible business practices under the umbrella of ‘corporate
sustainability’ are changing the business landscape. Specifically, companies that operate responsibly are
more likely to enjoy advantages in product, labor and capital markets (Cheng et al. 2014; Ioannou and
Serafeim 2014; Eccles et al. 2014). Therefore, inferences drawn from bribery cases that were detected
even ten years ago is unlikely to be applicable to the current business environment. Moreover, it is not
clear that investors are able to understand how the firm’s long-run competitiveness and specifically its
business relations, reputation, regulatory relations, and employee morale are affected by the bribery
incident. Corporate managers are much more likely to be able to understand those effects and provide an
assessment.
To overcome these challenges I use proprietary survey data, from 2009 and 2011, provided by
PwC that surveyed its clients on bribery incidences. Managers identified their companies as having
experienced a bribery incident, as well as who was the main perpetrator of the bribery incident, how it
was detected, and how the firm responded. Moreover, managers assess the significance of the impact of
the bribery incident and discovery on the firm’s competitiveness and its stock price over the last 12
months. Using data from recent years about the impact on firm competitiveness and for bribery cases that
do not involve accounting fraud or other instances of economic crime allows me to answer the three
questions I described above; which competitiveness factors are impacted the most and how the impact on
them relates to the impact on the stock price, who is the main perpetrator and how detection method and
organizational response vary with the identity of the perpetrator, and how the impact on the
competitiveness factors varies with the identity of the perpetrator, detection method and organizational
response.
5
The results suggest that the most significant impact from bribery detection is on employee
morale. The second most significant impact is on business relations. Reputation and regulatory relations
are both ranked last in terms of impact. The impact on stock price is far less significant according to
managers. I associate the impact on stock price with the impact on the competitiveness factors and find
that the lower significance for stock price impact can be explained by stock prices not reflecting the
impact on employee morale and business relations. Rather stock prices only reflect the impact on
reputation and regulatory relations; the two less significantly impacted factors. A potential explanation for
this result is that although the detection of bribery significantly impacts employee morale and business
relations, this impact does not significantly affect a firm’s future profitability and risk because of frictions
in labor and product markets. I find evidence consistent with this explanation. In countries with more
competitive labor markets there is a stronger association between employee morale impact and stock
price impact. Similarly, in countries with more competitive product markets there is a stronger association
between business relations impact and stock price impact.
Because there is significant variation in the characteristics of each bribery case I proceed to
analyze who was the main perpetrator, how the bribe was detected, and how the organization responded.
Sixty-seven percent of the cases in my sample have a main perpetrator who is an employee of the firm,
versus 33 percent that have a main perpetrator who is outside the boundaries of the firm. Middle
managers are the most frequent perpetrators among employees of the firm with junior staff being the
second most frequent and senior executives the least frequent. Government employees are the most
frequent perpetrators among outside actors, with customers, agents/intermediaries of the firm, and
suppliers following in terms of frequency. Both formal (i.e., anticorruption and security systems) and
informal (i.e., tip-offs and whistle-blowers) control systems of the firm are more likely to detect bribery
when the main perpetrator is an employee of the firm. However, in cases where middle managers are the
main perpetrators, formal internal control systems are less frequently the method of detection with
informal control systems and the media and law enforcement being more frequently the methods of
detection. Among, outside perpetrators, government employees are more likely to be detected by the
6
media or law enforcement rather than the formal control systems of the firm. These findings are
consistent with formal control systems being less effective as means of detection of bribery when the
main perpetrators are middle managers, who have deep expertise in the same control systems, and
government employees, who senior executives are probably already aware of and as a result revelation is
more likely to come from non-firm actors. In terms of organizational response, I find that internal
perpetrators are significantly more likely to be fired compared to the probability of ceasing relations with
outside perpetrators. However, the firm is less likely to initiate legal action and fire a senior executive
compared to junior staff and middle managers. These findings suggest that senior executives are treated
with more leniency. The same findings apply to government employee perpetrators compared to
customers, suppliers or agents of the firm. This might reflect the higher bargaining power that
government employees have over the firm compared to other outside stakeholders.
I find evidence that the impact of bribery detection on reputation and employee morale is more
likely to be significant when the perpetrator is internal rather than external to the firm. Moreover, the
impact is more likely to be significant if the internal perpetrator is part of the senior management. This is
the case for the impact on reputation, regulatory relations, and business relations. In addition, I find that
regulatory relations are less likely to be affected if bribery was detected by the formal or informal control
systems of the company. This result suggests that regulators are likely to take into account the quality of a
firm’s control systems when they decide on disciplinary action. A firm’s response to the discovery of
bribery is also significantly associated with the impact on competitiveness. Consistently, firms that
dismiss internal perpetrators or cease relations with external find the impact on competitiveness to have
been less significant. Specifically, when the perpetrator is internal and the person is dismissed, the impact
on reputation, regulatory relations, and employee morale is less likely to be significant. Similarly, if the
perpetrator is external and the person is dismissed, the impact on reputation and employee morale is less
likely to be significant. This provides evidence that dismissal of internal or external perpetrators could be
an effective mechanism to restrict the damage on a firm’s competitiveness. Moreover, I find that larger
firms find the impact on business relations and employee morale to be less likely to be significant. In
7
contrast, state-owned companies are less likely to find the impact on business relations to be significant.
Both results are consistent with the higher bargaining power that larger and state-owned firms have in the
product market.
Given the primitive stage of research in this area, it is hard to draw any conclusions about
causality from these relations. Thereby, I proceed with my discussion being cautious about making causal
claims. However, I include several control variables that might be operating as correlated omitted
variables otherwise and design different tests to identify plausible mechanisms. Moreover, in the
discussion section, I describe the limitations of this study associated with the use of survey data and
directions for future research.
The rest of the paper proceeds as follows. Section 2 presents the sample and the data. Section 3
presents the results on the impact of bribery detection on competitiveness and stock price. Section 4
describes findings about the relation of identity of the main perpetrator with detection method and
organizational response after detection. Section 5 analyzes how the impact on competitiveness varies with
the identity of the main perpetrator, detection method and organizational response after detection. Section
6 concludes.
2. Sample and Data
The sample comprises a set of companies around the world that are clients of the forensic services
practice of PwC. PwC got responses from approximately 3,000 and 4,000 firms in 2009 and 2011
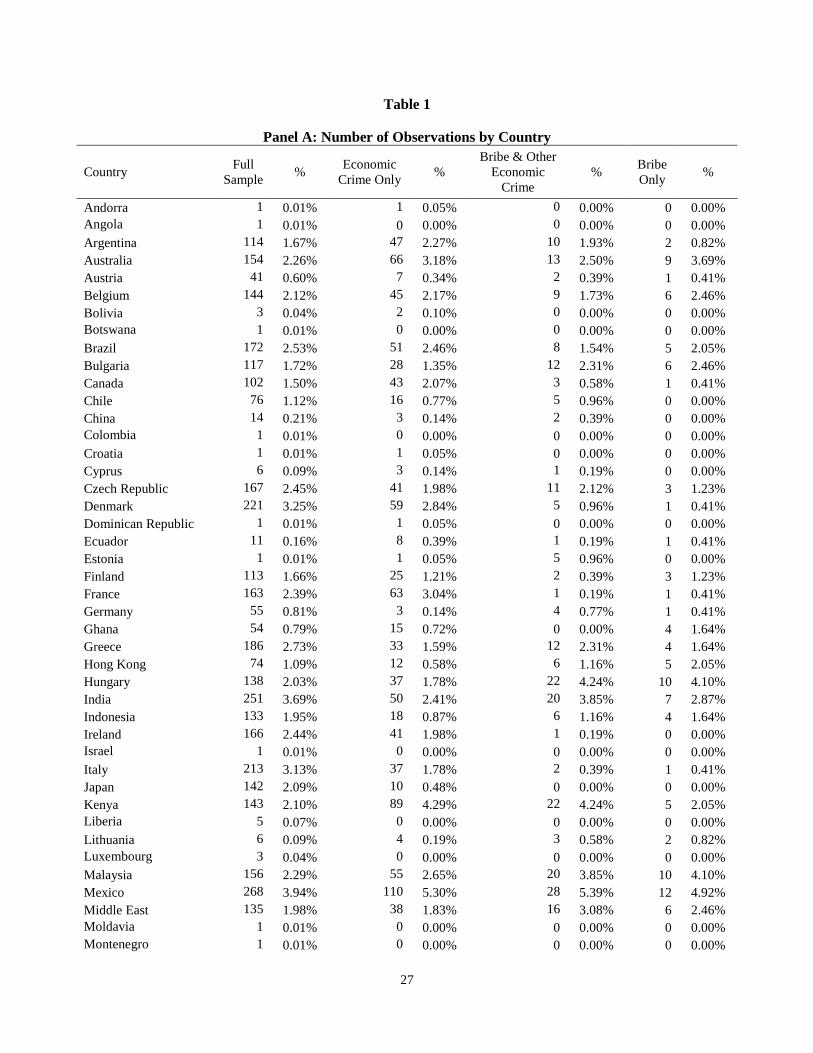
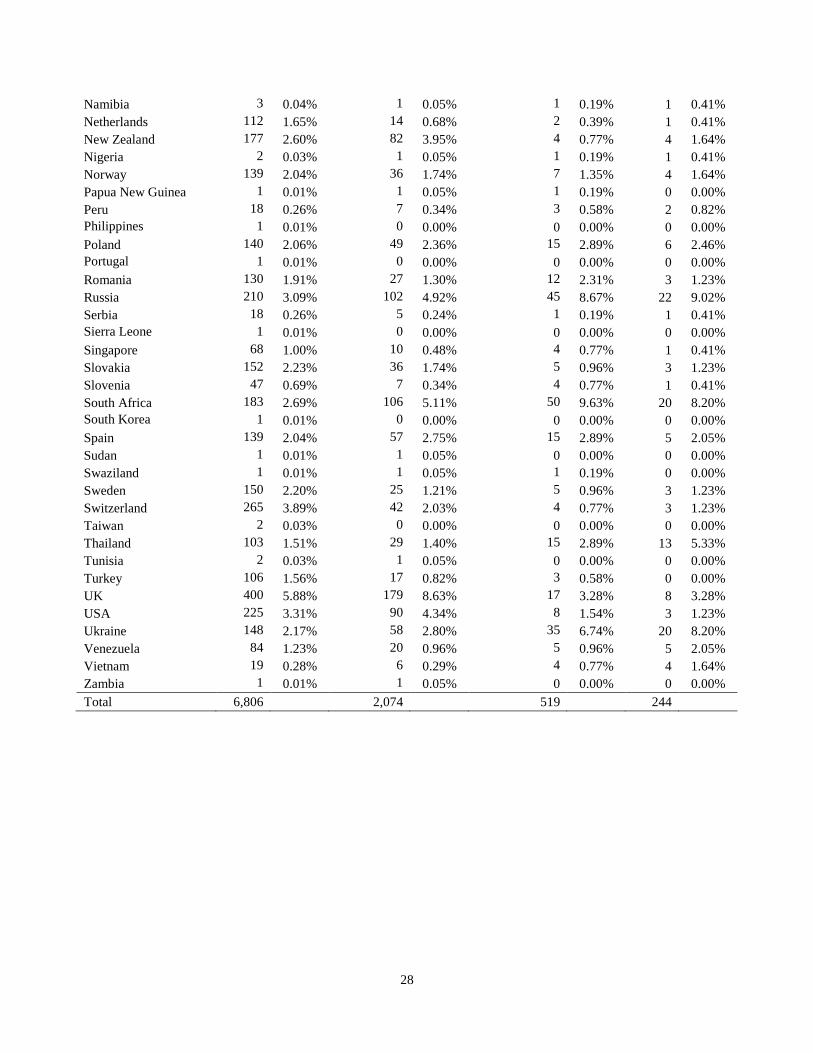
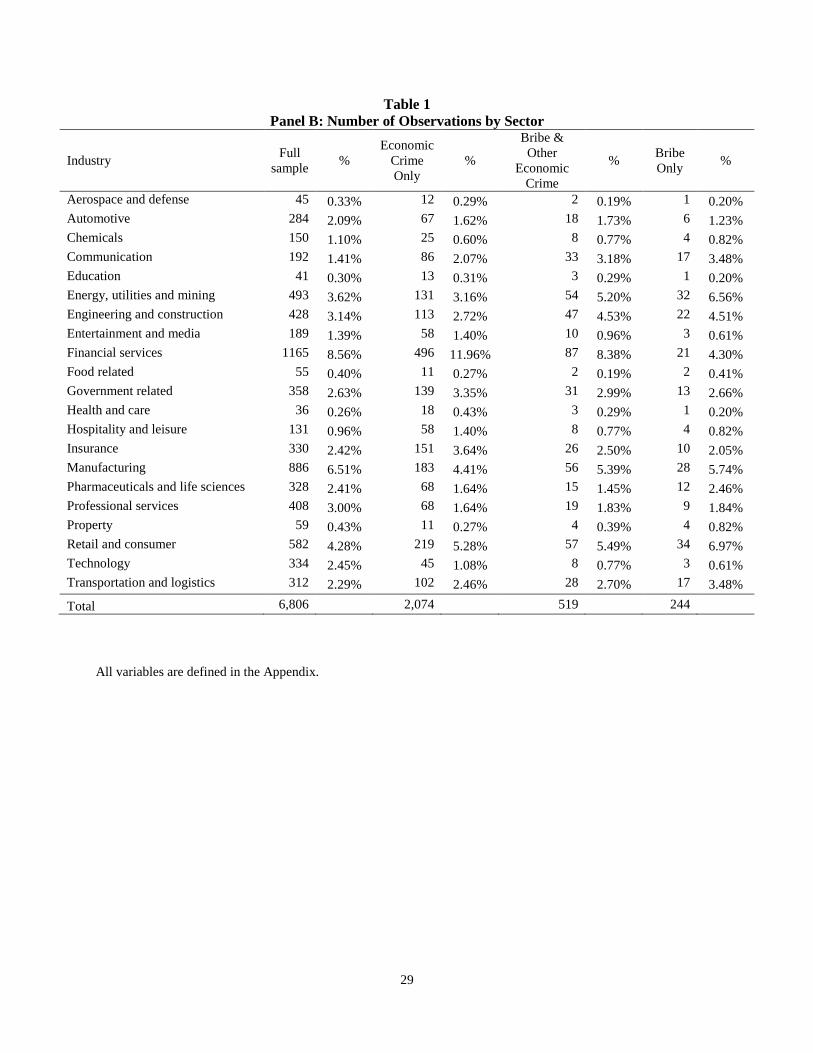
respectively. Table 1 shows the frequency of respondents across countries and Table 2 shows the
frequency of respondents across sectors. In total, there are 6,806 responses out of which 2,074 responded
that their firm had experienced an occurrence of economic crime in the past twelve months. Tables 1 and
2 also show the number of companies in each country and sector that report that their firm was involved
in a bribery incident. There are 519 responses that indicate the occurrence of a bribery incident. Because a
number of respondents identify their firms to have experienced other types of economic crime, such as
accounting fraud, insider trading, money laundering and tax fraud, I isolate responses where bribery is the

8
only occurrence of economic crime in the firm. Tables 1 and 2 show the frequency across countries of
these cases of ‘bribery-only.’ This set of 244 responses of bribery-only firms is the sample I proceed to
analyze in the next sections.
This sample includes firms that responded affirmatively only to the existence of bribery in their
organizations but no other economic crime. Investigating cases where the organization has experienced
only bribery and no other economic crime allows a cleaner identification of the costs of bribery. The
responder was able to answer anonymously and as a result responders had little incentive not to report
truthfully. Moreover, restricting the sample to respondents that admitted bribery avoids comparison of
firms that admitted to bribery versus firms that might be involved in bribery but they do not admit to it.
Making this comparison would require an econometrician to model the selection bias arising from
companies being involved in bribery but not admitting to it. That being said the sample is not random,
limiting the potential generalizability of the results. The sample comprises firms that are clients of a Big 4
audit firm, responded to the survey, and that they or outside actors detected the bribery incident. The
results might not be generalizable to companies that are not clients of Big 4 audit firms, or that are but
would not respond to the survey or would not anonymously admit to have been involved in a bribery
incident, or were not capable of detecting the bribery incident. However, the sample is broader compared
to other studies because it is not limited to firms that were caught paying bribes and firms that received
publicity or regulatory sanctions (Cheung, Rau, and Stouraitis, 2012).
Not surprisingly, a large part of the final sample of bribery-only cases comes from emerging
market countries where bribery is a relatively frequent phenomenon. The sample includes many firms
from Hungary, Malaysia, Mexico, South Africa, Russia, Ukraine, and Thailand. These countries’
representation is more frequent in my final sample compared to the initial survey sample, a finding
consistent with corruption risk rankings provided by organizations such as Transparency International and
the World Bank. However, there is a fair number of companies coming from developed markets where
corruption is much less frequent, such as Australia, the UK, and the US. The case of Australia is
particularly interesting given that the country’s representation increases in the final sample compared to
9
the survey sample. This could be attributed to a large number of Australian companies operating in
extractive industries where corruption risk is especially high.
The sample not only represents more heavily high corruption countries but also the same applies
to sectors. Companies in the communication, energy/utilities/mining, engineering/construction,
retail/consumer and transportation/logistics sectors are overrepresented in the final sample compared to
the survey sample. This is again in line with the Briber payers ranking of Transparency International that
identifies sectors with high corruption risk. In that index companies in the energy/utilities/mining and
engineering/construction sectors operate in the highest corruption risk environments.
3. Impact on Competitiveness and Stock Price
Detection of bribery has often been suggested to impact a corporation’s competitiveness. Apart from legal
costs and fines, a negative impact on corporate reputation is one of the most frequently claimed effects
from detection of bribery. In addition to corporate reputation, commentators have claimed that a company
can suffer from a severe disruption in its business relations as customers and partners distance themselves
from a troubled company (PwC 2008). Moreover, loss of talent is another potential cost. Ralph Peterson,
the Chairman and CEO of CH2M Mill, a global engineering and construction firm with 23,000 employees
and operations in 31 countries, claims that the high corruption risk of the engineering and construction
industry makes the profession unattractive to young people limiting the pool of talent (PwC 2008). In
addition, both management and staff could become distracted and demoralized as they investigate what
went wrong and respond to legal actions. Schwepker (1999) finds that salespeople’s perception of a
positive ethical climate in their organization is positively associated with job satisfaction and
organizational commitment.
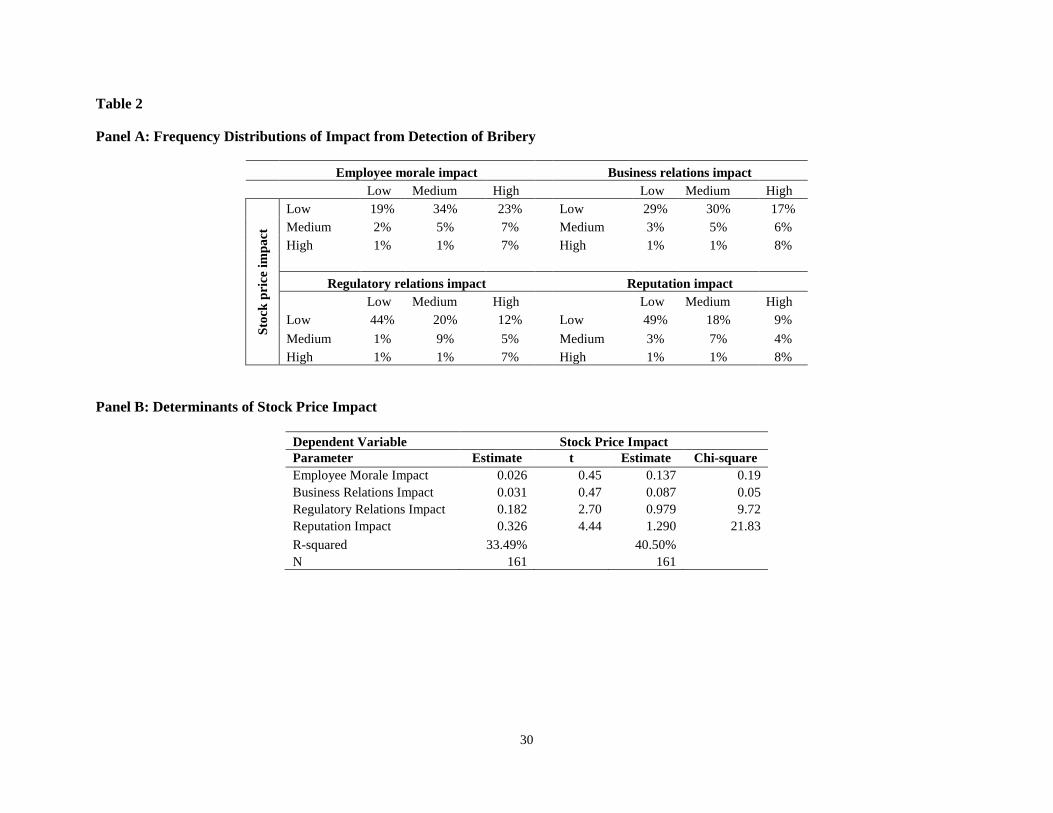
Table 2 Panel A shows frequency statistics. Managers could state whether the detection of bribery
had a “Significant,” “Not Significant or Insignificant,” or “Not Significant” effect on firm
competitiveness in the last twelve months. 23 and 52 percent reports that the bribery incident had a
significant and not significant effect on firm reputation. In contrast, 39 and 27 percent reports that it had a
10
significant and not significant impact on employee morale. More managers report that bribery had an
effect on business (32 percent significant and 34 percent not significant) rather than regulatory relations
(23 percent significant and 48 percent insignificant). These results suggest that there is a fair amount of
variation in whether bribery has affected significantly a firm’s competitiveness. Moreover, according to
managers, the most significant impact has been on employee morale, followed by business relations and
then on regulatory relations and reputation.
The high significance from bribery detection on employee morale is very interesting and stands in
contrast to surveys of managers of firms that have not experienced a bribery incident. Among these
executives only eight percent suggested that the impact on employees would be more or as severe
compared to reputation or regulatory relations (PwC 2008). Although one could argue that this difference
could be driven by other factors, such as differences in companies included in the sample, one explanation
is that managers realize only after the detection of bribery how significant the impact on employee morale
has been.
The percentage of managers who respond that the detection of bribery had a significant impact on
the firm’s stock price is much lower. Only nine percent respond that the impact has being significant with
77 percent responding that it has been not significant.3 These results are consistent with Karpoff et al.
(2013), who find that for bribery-only cases the stock price reaction is insignificant. To better understand
the discrepancy between the impact on stock price and competitiveness I present three-by-three tables of
frequencies. This analysis sheds light on which competitiveness factors are more likely to be significantly
impacted while the impact on stock price is not significant. Table 2 shows that the highest frequency of
Low impact on stock price, High impact on Competitiveness is for employee morale (23 percent),
followed by business relations (17 percent) and then regulatory relations and reputation (7 and 8 percent).
These results suggest that stock prices after the detection of bribery do not incorporate the impact on
employee morale and business relations.
3 I only have 161 responses for stock price impact because the rest of the companies in the sample are not publically
listed firms.
11
To provide further evidence on this statement I estimate multivariate regressions where the
dependent variable is impact on stock price and the regressors include the impact on the four
competitiveness factors. Each variable takes values from one to three where one is ‘Not Significant’ and
three is ‘Significant.’ Standard errors are robust to heteroscedasticity and clustered at the country level to
mitigate serial correlation within countries. Table 2 Panel B presents estimated coefficients and statistical
significance both for linear and ordered logistic models. The results are similar across both specifications.
There is a statistically significant relation between impact on stock price and impact on regulatory
relations and reputation. The largest coefficient is on reputation (0.326) and then regulatory relations
(0.182) in the linear specification. In contrast, the relation with the impact on business relations and
employee morale is insignificant in both specifications.
A potential explanation for the lack of relation between business relations and employee morale
and stock price is that institutional frictions limit the competition in labor and product markets thereby
insulating future company performance from changes in employee morale and business relations. One
would expect that in less competitive labor markets characterized by more stringent labor regulations the
effect of decreased employee morale is less likely to affect future profitability. In such labor markets,
unemployment, especially among youth, is higher (Botero et al. 2004) limiting outside opportunities and
as a result decreasing the extent to which morale can impact employee productivity. Moreover, in
competitive labor markets, new firms that seek to challenge successful incumbents are able to attract labor
at a competitive price. In contrast, if the labor market is not competitive, it will be difficult for new firms
to attract talent, enabling profitable incumbents to sustain their performance. Consistent with this, in more
competitive labor markets, profitability ratios mean revert more rapidly (Healy et al. 2014). I use a
measure of labor market competition from Botero et al. (2004) that captures the rigidity of the labor
market in each country through employment laws.
Similarly, one would expect that deteriorated business relations are less likely to affect a firm’s
future profitability and thereby its stock price in less competitive product markets. Limits to competition
in product markets are likely to limit the propensity of customers and suppliers to switch business
12
partners when a firm is found to be involved in a bribery case. I use of measure of product market
competition from Djankov et al. (2002) which is the natural logarithm of the number of steps needed to
start a business. Both the labor and product market variables have been extensively used in the literature
and have been validated as measures of labor and product market competition.
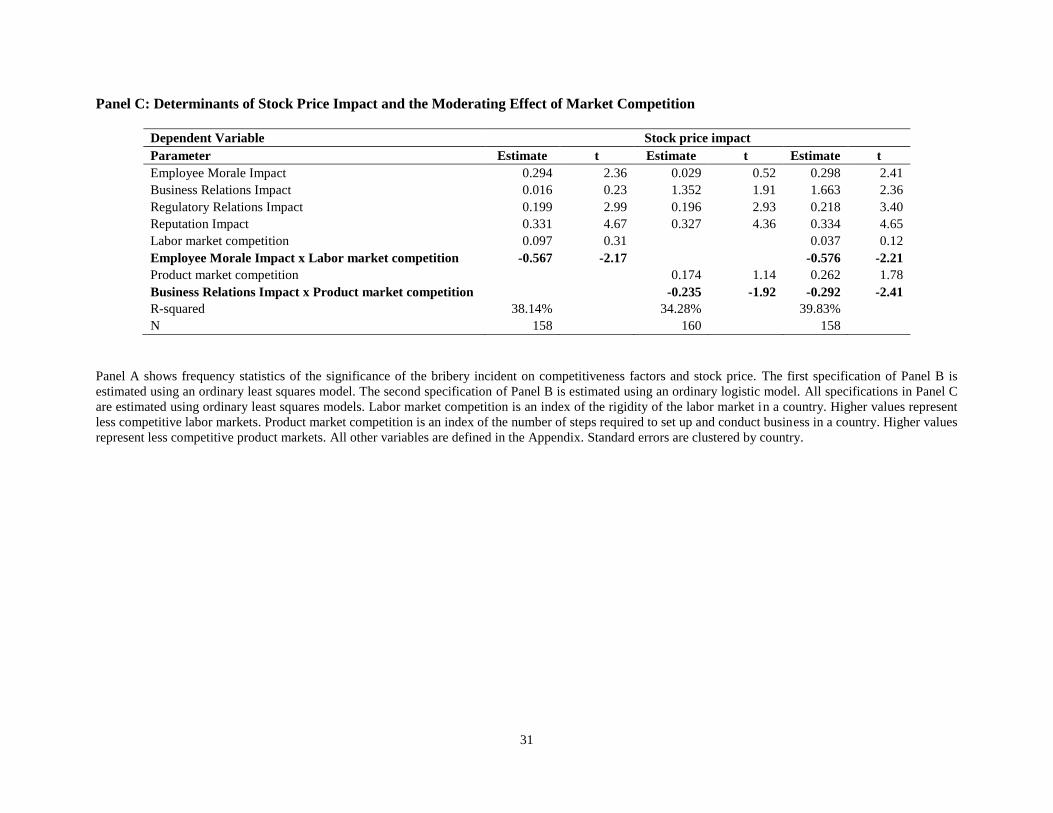
Table 2 Panel C presents the results of models that include these moderating variables. I present
specifications where I only moderate the effect of employee morale or business relations and a
specification modelling both moderating effects simultaneously. The effect of employee morale is
moderated by the rigidity of the labor market. The interaction term is negative and significant since higher
values of the labor market competition variable represent more rigid labor markets. Similarly, the effect
of business relations on stock price is moderated by product market competition. The interaction term is
negative and significant since higher values of the product market competition variable represent less
competitive product markets. Now the main effects both for employee morale and business relations are
positive and significant. Moreover, the explanatory power of the model jumps from 33 to 40 percent when
I include the moderating variables. These results suggest that after detection of bribery stock prices might
not react even though both business relations and employee morale have been significantly affected. The
reason for that are, at least partly, impediments to competition in labor and product markets.
4. Main Perpetrator, Detection Method, and Organizational Response
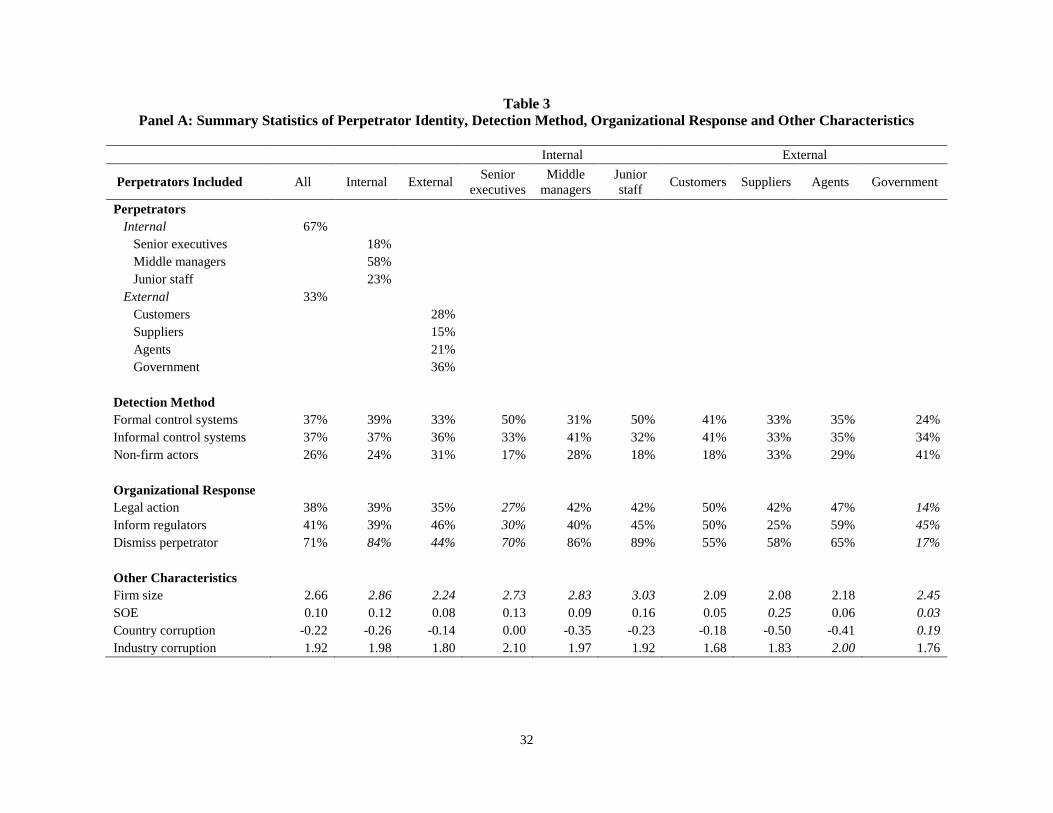
Table 3 Panel A presents summary statistics about who was the main perpetrator, how bribing was
detected, and how the organization responded after detection. In 67 percent (33 percent) of the bribery
cases the main perpetrator was internal (external). Among internal perpetrators, in 18 percent of the cases
the main perpetrator was a senior executive of the company while in 59 percent of the cases the main
perpetrator was a middle manager and in 23 percent a junior staff member. Among external perpetrators,
22 percent were agents/intermediaries of the company. Twenty-eight percent of the external perpetrators
were customers, 15 percent were suppliers, and 36 percent were government employees.
13
There are three broad categories under which methods to detect bribery can be classified. The
first is formal control systems employed by the firm. These include anticorruption systems, internal and
external auditing procedures, and risk management systems. The second is informal control systems that
are descriptive of a firm’s culture. These include tips provided by people internal or external to the
organization and information coming from whistle-blowing systems. The third is methods outside
management’s control. These include investigations by regulatory and law enforcement authorities,
reports by competitors, and media investigations. Thirty-seven percent of the cases are detected by the
formal internal control systems of the firm. Another 37 percent of the cases are discovered by the
informal control systems of the firm. The rest 26 percent of the cases are discovered by actors outside the
boundaries of the firm, such as the media, regulators, and law enforcement agencies.
In terms of organizational response, there are at least three actions that a firm can adopt after the
discovery of a bribery act. These actions are not mutually exclusive. One is to pursue legal action, in
particular civil action, against the perpetrator. Second, it can proactively inform regulatory authorities
about the incident. Third, it can proceed to dismiss the employee or cease relations with the business
partner who initiated the bribery act. Of course a company can choose to do nothing. In 38 percent of the
cases the firm takes legal action against the perpetrator. In 41 percent of the cases regulators are informed
about the bribe and in 71 percent of the cases the perpetrator is dismissed or business relations are ceased.
The fact that not in all cases relations with the perpetrator are ceased suggests that ex post not all
organizations exhibit zero tolerance against bribery.
Both detection method and organizational response are likely to systematically vary with the
identity of the perpetrator. For example, internal control systems might be less effective in detecting
bribery when the main perpetrator is a middle manager who knows how to control information that is
coming out from the control systems of the firm. Similarly, firms might be reluctant to initiate legal action
or to cease relations with employees of government agencies.
Table 3 Panel A provides evidence around variability in detection method and organizational
response by perpetrator identity. Internal perpetrators are more likely to be detected by the formal control
14
systems and less likely by mechanisms outside the boundaries of the firm. Among internal perpetrators,
middle managers are less likely to be detected by the formal control systems and more likely to be
detected by the informal control systems of the firm or by the media or regulators. This might reflect that
middle managers are able to circumvent formal control systems more easily because they have a better
understanding of these systems. However, their actions might be more likely to be detected by other
employees who then tip-off senior management. Among external employees, customers are more likely to
be detected by the formal or informal control systems of the firm and much less likely by the media or
regulators. The opposite applies to government employees for whom formal control systems are much
less frequently the methods of detection. In contrast, media or regulators and law enforcement agencies
are more frequent methods of detection.
Companies are slightly more likely to take legal action against internal perpetrators but slightly
less likely to inform regulators. At the same time, companies are more likely to dismiss an internal
perpetrator compared to ceasing relations with an external perpetrator. Among internal perpetrators the
firm is less likely to take legal action, inform regulators or fire the perpetrator when she is a member of
senior management. Among external perpetrators, firms rather infrequently take legal actions or cease
relations with government employees. In contrast, they are as probable to inform regulators as they are
when the external perpetrator is an agent or a customer. Informing regulators is a less likely response
when the perpetrator is a supplier and as a result bribes were paid to employees of the firm.
There is a fair amount of variation in firm size in my sample. I code a variable for firm size that
ranges from one to four with four being the largest firms. Thirty percent of the sample is large firms that
have more than 5,000 employees. Twenty-five percent of the sample has between 1,000 and 5,000
employees, 25 percent between 200 and 1,000 employees and 20 percent is small firms with up to 200
employees. Therefore, average firm size in the sample is 2.66. Ten percent of the sample are state-owned
enterprises. To classify a firm’s home country, I use the World Bank corruption index as a measure of a
country’s level of corruption. Because the surveys were conducted in 2009 and 2011 and they measure
bribery incidences in the last twelve months I use the corruption index for 2008 and 2010 respectively.
15
Moreover, I designate sectors to High, Medium and Low corruption according to Transparency
International’s bribery payers index ranking. Companies in the energy, utilities and mining, engineering
and construction, property development and chemicals sectors are classified as High corruption risk. The
average country corruption rating from the World Bank is -0.22 reflecting the earlier discussion that most
of the sample is coming from corrupt countries (variables ranges from -2.5 to 2.5). Average industry
corruption is 1.92 with High corruption sectors taking the value of three and Low corruption sectors the
value of one.
The main perpetrator of bribery is much more likely to be internal in larger firms. Among internal
perpetrators, senior executives are more likely to be the main perpetrators in smaller firms. This likely
reflects the fact that as an organization grows, senior executives delegate authority and decision rights as
a result increasing the probability that a more junior employee is able to give or receive a bribe. Among
external perpetrators, government employees are more likely to be the main perpetrators for larger firms.
Presumably the bribes that they can receive from such firms are larger thereby making them more
lucrative targets for corrupt government officials. In the case of SOEs the most frequent perpetrators are
suppliers suggesting that SOEs are more likely to receive rather than pay bribes. There are some
differences in country and industry corruption across the different samples but none is statistically
significant.
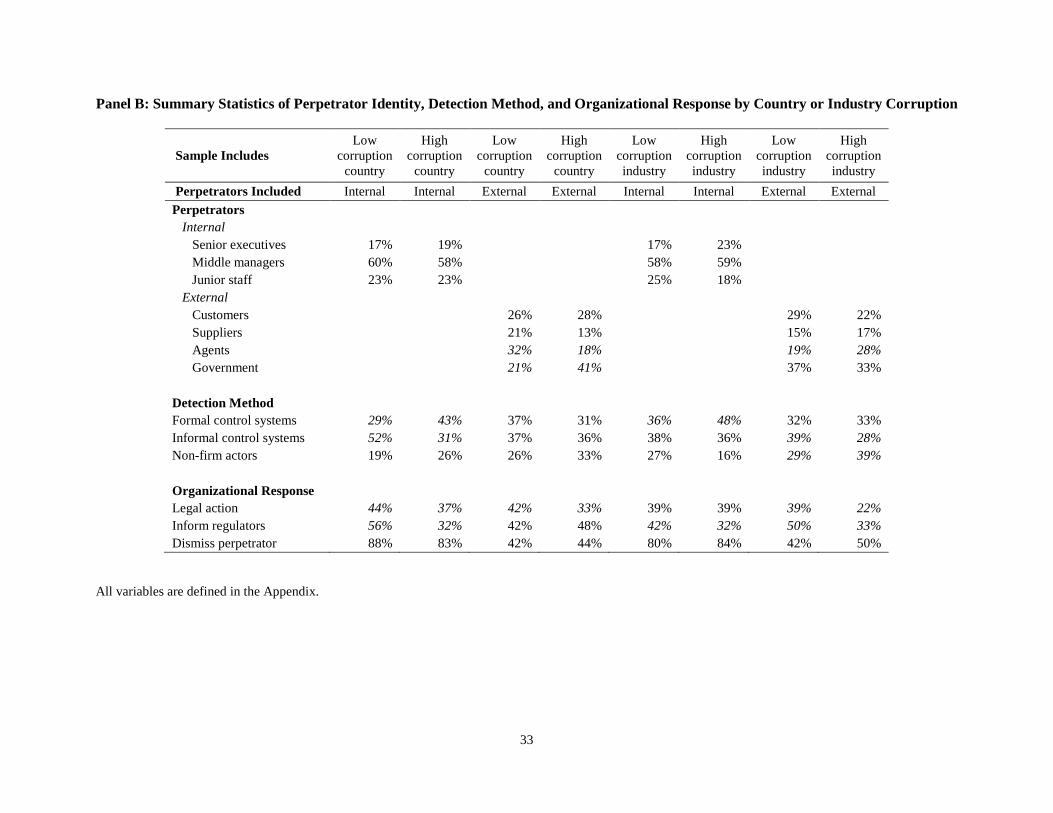
Varying Country or Industry Corruption Risk
Panel B presents summary statistics for subsamples of varying levels of country or sector corruption. I use
the home country of each organization to classify them as high or low country corruption risk. I first
discuss the results varying the level of corruption at the country level. There are no differences in internal
perpetrator seniority across High and Low corruption countries. In contrast, in High corruption countries
the external perpetrator is much more likely to be a government employee compared to a supplier or an
agent. This makes sense given that in high corruption countries government officials frequently demand
bribes. The relatively high frequency of agents being the perpetrators in low corruption countries is
16
consistent with companies from developed countries using agents when they operate in highly corrupt
countries.
In terms of detection method, when the perpetrator is internal in High corruption countries
bribery is much more likely to be detected by formal control systems while in Low corruption countries
by informal control systems. This finding suggests that the relative effectiveness of formal and informal
control systems varies systematically with the level of corruption of a country. In High corruption
countries employees are much less likely to feel comfortable blowing the whistle on corrupt activities
since both incentives for doing so are lower and their ability to protect themselves is lower.
Firms are more likely to take legal action against perpetrators in Low corruption countries since
in those countries the legal system is more effective and less likely to be corrupt itself. Not surprising is
also the fact that among cases where the perpetrator is internal, it is more likely that the company informs
regulators in Low corruption countries. Regulators are more likely in such regions to be well organized
and discover the bribery incident by themselves and as a result more likely to punish the firm afterwards.
Varying the level of corruption at the sector level also reveals some interesting differences. In
High corruption sectors it is more likely that the perpetrator was a senior executive compared to a junior
staff member. Because in these sectors bribing is more likely to be part of the ‘way of doing business’ it is
also more likely that it is handled by more senior people inside the firm. Among external perpetrators,
agents are more likely to be the perpetrators in High corruption sectors. Because corruption is more
endemic in these sectors firms are more likely to use agents for bribery.
Formal control systems are more likely to detect internal perpetrators in High corruption sectors
while actors outside the firm, such as regulators and the media are more likely to detect internal
perpetrators in Low corruption sectors. Non-firm actors are more likely to detect external perpetrators in
High corruption countries where informal control systems are less likely to be effective. Firms are more
likely to take legal action against external perpetrators and inform regulators in Low corruption sectors.
5. Variation in Competitiveness Impact
17
While section 3 provided evidence on how detection of bribery impacts firm competitiveness, this section
describes how the impact varies with the characteristics of the bribery incident. I examine several
characteristics that might be related to the impact on company competitiveness from detection of bribery.
Specifically, I consider who the perpetrator of bribery was, how the bribe was detected, how the firm
responded after the detection of bribery, firm size, state ownership, and country and industry corruption
risk.
One would expect that in cases where larger bribes were involved the impact on competitiveness
might be more significant. Larger bribes could attract more media attention and invite larger fines from
regulators. At the same time, the size of the bribe could be correlated with variables such as the identity of
the main perpetrator. One would expect that more senior employees would pay or receive larger bribes for
example. Unfortunately, in the survey there are no data about the actual size of the bribe. However, I use
a survey question that measures “In financial terms, approximately, how much do you think your
organisation may have lost through incidences of all such economic crimes over the last 12 months?” as a
proxy for the size of the bribe. Since for the sample companies in this study bribery is the only economic
crime it refers to lost money from the bribery incident. However, this variable does not only include
bribes that were paid but also legal costs and fines that the organization paid. It might also include lost
revenues from customers that ceased relations with the firm. Therefore, by including this variable I am
potentially biasing downwards the coefficients on the rests of the variables of interest because I could be
partly controlling for deteriorated regulatory and business relations.
I estimate ordered logistic regressions to examine the factors that are associated with the impact
on competitiveness. This functional form is appropriate given the discrete ordinal nature of the dependent
variable. For each dependent variable of interest, I estimate a pooled regression with bribery cases that
have been initiated either internally or externally, and separate regressions for internal or external
perpetrator cases. The separate models allows for identification of the relation between the impact on firm
competitiveness and the seniority or type of main perpetrator.
18
Main Perpetrator. Internally initiated bribery might have a larger impact on the competitiveness of the
company for multiple reasons. First, it signals that the culture and control systems inside the organization,
which are there to prevent bribery, have failed. Therefore, detection of internally initiated bribery is more
likely to impact the reputation of the organization by exposing the ineffectiveness of internal control
systems and signaling that the culture of a firm is tolerant of such behavior. Similarly, it is more likely to
impact business relations with customers and suppliers, which could avoid doing business with
organizations that do not show a commitment and adequate control systems to avoid corruption.
Moreover, internally initiated bribery is more likely to impact employee morale since a fellow employee,
rather than an outside party, was involved in illegal activity.
Within the group of internally initiated bribery, I expect a larger impact when the initiator was
part of the senior management. In those cases, the signal that there might be something wrong with the
culture of the company is even stronger since the activity was initiated by a person that is a leader of the
organization. This is especially true for employee morale. Employees are more likely to look to senior
leadership to set the standards for individual conduct. When their expectations are not met, employees are
likely to feel disappointed, confused, and ultimately demotivated. Moreover, the fact that they worked for
a firm that has experienced corruption might taint their resume limiting their outside opportunities leading
to further decrease in morale (Zahra, Priem and Rasheed 2005).
Within the group of externally initiated bribery, I expect a larger impact when the initiator was an
agent of the firm rather than a government employee, customer, or supplier. In cases where the initiator
was an agent, one could argue that the agent was acting on behalf of the firm thereby resembling more of
an internally initiated bribery act. In a survey of business development directors of 50 US and 50
European companies, an overwhelming majority of those surveyed stated that companies used middlemen
such as agents, joint venture partners or foreign subsidiaries to avoid direct involvement with corruption
either ‘regularly’ or ‘occasionally’ (Control Risks Group, 1998). There is also plenty of anecdotal
evidence which blames intermediary agents, hired by corporations, for increasing corruption in the
developing world (Wiehen 1999).
19
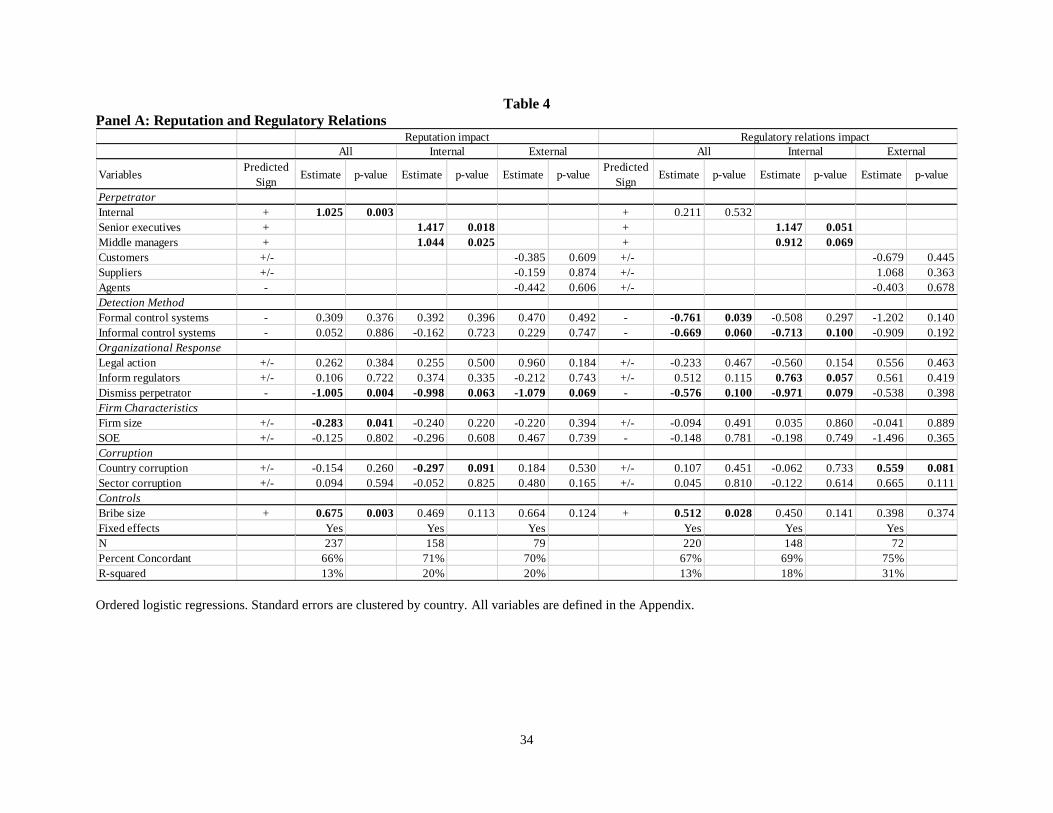
Table 4 Panels A and B show the results of the estimation. The first few columns have models
with reputation impact as the dependent variable. The table shows that detection of bribery is 2.8 times
more likely to have a significant impact on a firm’s reputation if the perpetrator was internal. Moreover,
the more senior the employee the more likely the impact will be significant. The likelihood of significant
impact increases by 4.1 times if the perpetrator is part of senior management and by 2.8 times if the
perpetrator is a middle manager relative to a junior staff member. Seniority is also related to the impact on
regulatory relations. Senior executives and middle managers have a higher impact on regulatory relations
increasing the probability of a significant impact by 3.1 and 1.5 times respectively. The same is the case
for impact on business relations where the estimates are 2.1 and 2.6 times. In contrast, I find directionally
consistent but not significant results for senior executives for the impact on employee morale. However,
cases of internal perpetrators are more likely to have a significant impact on employee morale.
I do not find consistent evidence that the type of external perpetrator is systematically associated
with the impact on competitiveness. However, cases where the perpetrator is a government employee are
less likely to have a significant impact on business relations. In these cases other firms might consider the
focal firm as the victim of government expropriation and as a result they might be less likely to cease
relations with the focal firm. Paying bribes to government officials that ask for them is an action that
might be seen as involuntary by other firms relative to receiving bribes from suppliers, paying bribes to
customers or using agents to pay bribes.
Detection Method. I expect that the impact on firm competitiveness will be smaller when bribery is
detected by a firm’s control systems. In these cases, the firm shows that it is capable of controlling illegal
behavior from the part of its employees or business partners (PwC 2008). This can send a strong signal
both to business partners and regulators that the firm is committed to fighting corruption and that it has
the proper systems to do so, thereby mitigating any effect on business and regulatory relations. A stream
of literature documents the importance that regulators and investors are placing on internal control
systems (Hammersley, Myers and Shakespeare 2008). Detection method is less likely to impact employee
morale, since employees are unlikely to pay attention to how bribery was detected.
20
The method of detection is generally not significantly associated with impact on competitiveness.
The one exception is when the dependent variable is impact on regulatory relations where estimated
coefficients both on formal and informal control systems are negative and in some cases significant.
Bribery cases that were detected by the formal and informal control systems are 0.47 and 0.51 times less
likely to be associated with a significant impact on regulatory relations. These results suggest that
regulators could take into account the quality of the internal control systems of a firm when they decide
on disciplinary actions.
Organizational Response. The relation between choosing to pursue legal action and firm competitiveness
is unclear. On the one hand, pursuing legal action might be a signal that the bribery act is likely to have
serious consequences on a firm. Similarly, a legal battle can generate negative publicity damaging a
firm’s reputation and serving as a deterrent for customers and suppliers from doing business with the
company. On the other hand, it can serve as a signal that the company is the victim, mitigating any
negative effect on business relations and reputation. Similarly, ambiguous is the relation between
informing regulatory authorities and impact on firm competitiveness. Cases where regulators are
informed are more likely to be very serious cases of bribery and as a result they are more likely to have a
significant effect on firm competiveness. On the other hand, especially with respect to regulatory
relations, it could be perceived as an act of good faith where the company is willing to cooperate with the
regulators. The relation between dismissal and cease of relation with the initiator and firm
competitiveness is more straightforward. Dismissing the initiator is a strong signal that the firm has zero
tolerance against corruption. This could mitigate any negative effects on firm competitiveness.
Both taking legal action and informing regulators are not significantly associated with
competitiveness impact. This might be because the two opposite effects cancel each other out thereby
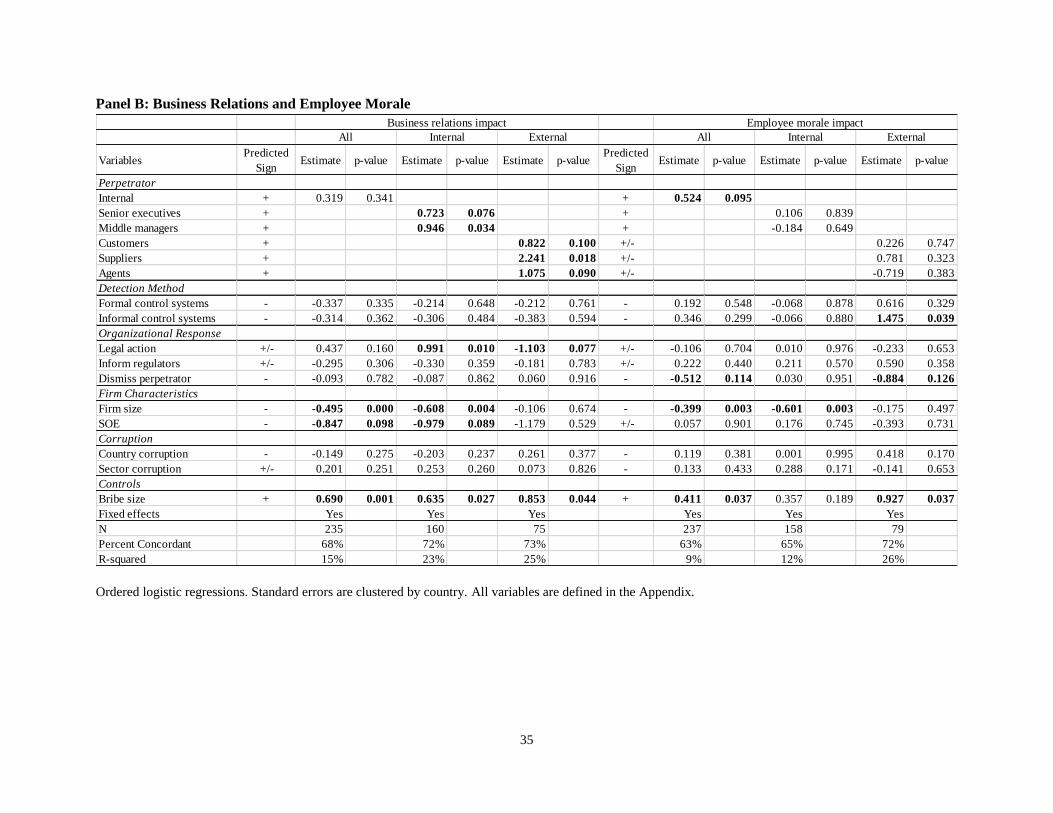
Dismissal of the perpetrator is significantly associated with a lower likelihood of significant impact on a
firm’s reputation, regulatory relations, and employee morale. Dismissing an employee reduces the
probability of significant impact on reputation, regulatory relations, and employee morale by 0.37, 0.56,
and 0.60 times. Exhibiting zero tolerance against bribery and as a result firing an employee or ceasing
21
relations with outside parties that were the main perpetrators are likely to reduce the damage on
reputation, regulatory relations, and employee morale.
Firm size. I find that firm size is significantly associated with competitiveness impact. For smaller firms
the impact particularly on business relations and employee morale is more likely to be significant. This
might reflect the lower bargaining power that small firms have and the associated lower dependence of
both customers and suppliers on them. Moreover, in smaller organizations where all employees know
each other and are likely to interact with each other at the workplace or even socially, the effect from the
discovery of bribery is more likely to demotivate employees.
SOE. I find that detection of bribery is less likely to impact business relations for SOEs. This could reflect
the significant power that SOEs have both because of their size and political power due to significant
government ownership. As a result, customers and suppliers might be more dependent on them and as a
result less likely to limit business dealing with SOEs following a bribery incident.
Country and Sector Corruption. I fail to find evidence of differential impact on competitiveness or stock
price based on the level of country or sector corruption after estimating the effect of all other factors.
While one might expect firms in low corruption countries to be more significantly influenced in a number
of ways the results are not consistent with this hypothesis.
Overall, the evidence supports the hypothesis that the identity of the main perpetrator is
significantly associated with the impact on firm competitiveness. Internally initiated bribery from senior
executives is correlated with higher likelihood of significant impact. Bribery cases detected by the
internal control systems of the firm seem to be associated with a lower likelihood of significant impact on
regulatory relations. Finally, firms that responded by firing or ceasing business relations with the main
perpetrator have lower likelihood of significant impact.
6. Conclusion
While the benefits to a corporation from bribing are intuitive, the costs are less well understood. In this
paper I analyze survey data collected from corporate managers around the world to provide evidence on
22
how an organization is impacted from the discovery of bribery. I show that discovery of bribery in many
cases significantly impacts both employee morale and business relations and less frequently reputation
and regulatory relations. Moreover, I find, consistent with other studies, that the impact on stock price is
most frequently insignificant, largely reflecting the fact that stock prices do not incorporate the adverse
effect on employee morale and business relations. Although the detection of bribery significantly impacts
employee morale and business relations, this impact does not significantly affect a firm’s future
profitability and risk because of frictions in labor and product markets.
Analyzing granular data on the identity of the main perpetrator, the method of detection and how
an organization responds to the bribery incident uncovers interesting patterns. In general, organizations
are less likely to take legal action and cease business relations with senior executives and government
employees who were the main perpetrators of the bribery. Moreover, different detection methods appear
to be more effective in uncovering perpetrators of differential seniority or type.
Furthermore, I find that the identity of the main perpetrator is significantly associated with the
impact on firm competitiveness. Internally initiated bribery from senior executives is correlated with
higher likelihood of significant impact. Bribery cases detected by the internal control systems of the firm
seem to be associated with a lower likelihood of significant impact on regulatory relations. Finally, firms
that responded by firing or ceasing business relations with the main perpetrator have lower likelihood of
significant impact.
While the analyses reveal interesting patterns in the data one potential caveat is that the
dependent variable comprises corporate managers’ perceptions of the impact on firm competitiveness
rather than the actual impact on competitiveness. To the extent that the two constructs are significantly
different and perceptions are different from reality in this setting, the results should be interpreted with
caution. If perceptions are not an accurate indication of reality then future research is needed to examine
whether the relations documented here hold when one uses actual data on firm competitiveness. However,
in this paper, I am interested in understanding how perceptions of impact vary with these characteristics.
Perceptions are important because they affect managerial behavior. Managers make investment, financing
23
and operating decisions based on how they perceive the environment around them. Therefore,
understanding how their perceptions of impact on firm competitiveness vary with characteristics of the
bribery case is likely to provide with useful evidence on how managers think of the costs of bribery.
Moreover, an advantage of the perceptual data is that the dependent variable captures the impact on firm
competitiveness from the detection of bribery. Research that will use actual data will need to isolate the
effect of bribery detection and control for any other confounding factors that might affect a firm’s
competitiveness.
There are numerous avenues for future research that explores the costs of bribery after detection.
First, it would be useful to better understand which business relations are more likely to be affected by
bribery cases. The effect could vary between customers and suppliers, and between large multinational
corporations and local companies. Second, if executives believe that dismissing the initiator of the bribery
is likely to mitigate any impact on firm competitiveness then why in some cases the initiator is not
dismissed? Third, how does the impact on firm competitiveness evolve as social, technological and
political institutions change? Citizens are becoming less tolerant of corruption and the rise of the internet
and social media allow for corruption cases to become more broadly known. Moreover, enforcement
against bribery from regulatory authorities has been increasing from non-existent to considerable.
Understanding how those larger trends will influence the effect of bribery detection on firm
competitiveness is likely to increase our understanding of the phenomenon.
24
References
Agrawal, A., Jaffe, J. and Karpoff, J. (1999). Management Turnover and Governance Changes Following
the Revelation of Fraud. Journal of Law and Economics 42: 309-342.
Botero, J., Djankov, S., La Porta, R., Lopez-de-Silanes, F. and Shleifer, A. (2004). The Regulation of
Labor. Quarterly Journal of Economics 119 (4): 1339-1382.
Cheng, B., Ioannou, I. and Serafeim, G. (2014). Corporate Social Responsibility and Access to Finance.
Strategic Management Journal, 35 (1): 1-23.
Cheung Y., Rau R., and Stouraitis A. (2012). How much do firms pay as bribes and what benefits do they
get? Evidence from corruption cases worldwide. Working Paper.
Control Risks Group, Information Services Team. (1998). Corruption and Integrity: Best Business
Practice in an Imperfect World. London, Washington, D.C.: Control Risks Group Limited.
Djankov, S., La Porta, R., Lopez-de-Silanes, F. and Shleifer, A. (2002). The Regulation of Entry.
Quarterly Journal of Economics 117 (1): 1-37.
Hammersley, J. S., Myers, L. A., Shakespeare, C. (2008). Market Reactions to the Disclosure of Internal
Control Weaknesses and to the Characteristics of those Weaknesses under Section 302 of the Sarbanes
Oxley Act of 2002. Review of Accounting Studies, 13 (1): 141-165.
Harter J., Hayes T., and Schmidt F. (2002). Business-Unit-Level Relationship between Employee
Satisfaction, Employee Engagement, and Business Outcomes: A Meta-Analysis. Journal of Applied
Psychology 87 (2): 268-279.
Healy, Paul M., and George Serafeim. (2013). "An Analysis of Firms' Self-Reported Anticorruption
Efforts." Harvard Business School Working Paper, No. 12-077.
Healy, Paul M., George Serafeim, Suraj Srinivasan, and Gwen Yu. "Market Competition, Earnings
Management, and Persistence in Accounting Profitability Around the World." Review of Accounting
Studies (forthcoming).
Ioannou, Ioannis, and George Serafeim. "The Impact of Corporate Social Responsibility on Investment
Recommendations: Analysts’ Perceptions and Shifting Institutional Logics." Strategic Management
Journal (forthcoming).
Karpoff J., Lee S., and Martin G. (2013). The Economics of Foreign Bribery: Evidence from FCPA
Enforcement Actions. Available at SSRN: http://ssrn.com/abstract=1573222
PwC. (2008). Confronting Corruption: The Business Case for an Effective Anticorruption Program.
Roberts, P., and Dowling G. (2002). Corporate Reputation and Sustained Financial Performance.
Strategic Management Journal 23: 1077-1093.
Schwepker, C. (1999). Ethical Climate’s Relationship to Job Satisfaction, Organizational Commitment
and Turnover Intention in the Salesforce. Journal of Business Research 54: 39-52.
Smith, D. B., Stettler H., and Beedles W. (1984). An Investigation of the Information Content of Foreign
25
Sensitive Payment Disclosures. Journal of Accounting and Economics 6: 153-162.
Wiehen M. (1999). The Integrity Pact: The Concept, the Model and the present Applications. A Status
Report as of November 1, 1999. Transparency International, Berlin.
Zahra, S., Priem R., and Rasheed A. (2005). The Antecedents and Consequences of Top Management
Fraud. Journal of Management 31: 803-828.
26
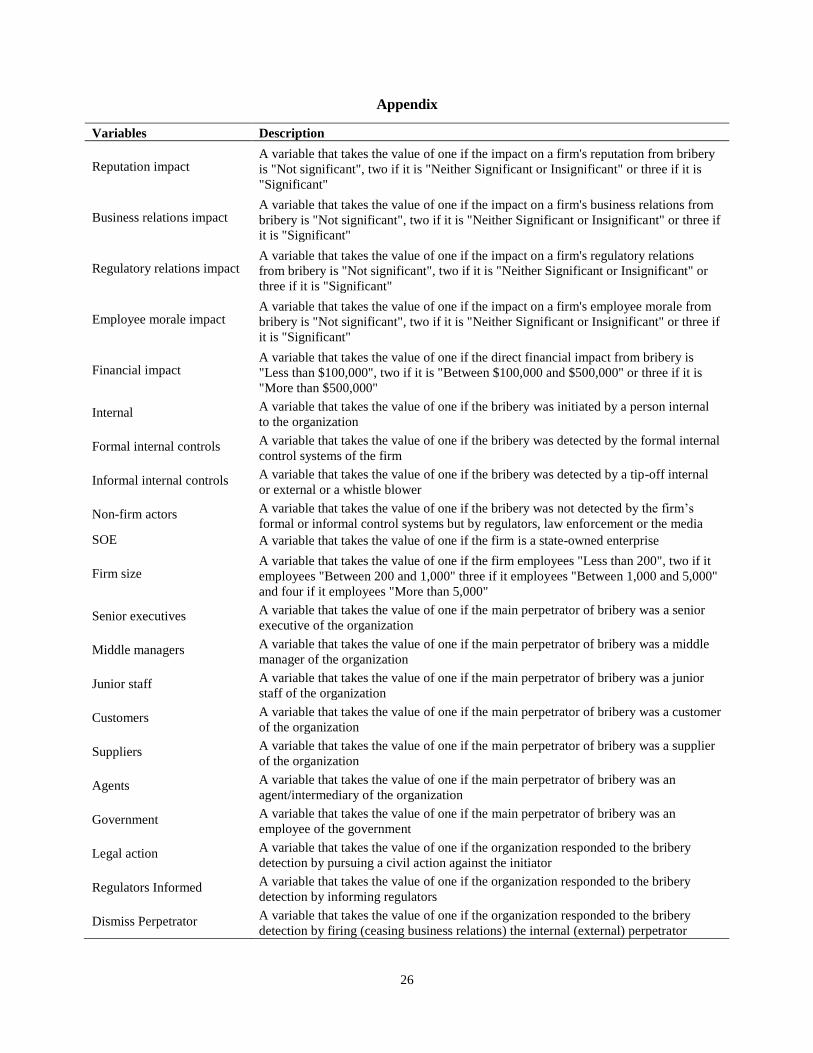
Appendix
Variables Description
Reputation impact A variable that takes the value of one if the impact on a firm's reputation from bribery
is "Not significant", two if it is "Neither Significant or Insignificant" or three if it is
"Significant"
Business relations impact A variable that takes the value of one if the impact on a firm's business relations from
bribery is "Not significant", two if it is "Neither Significant or Insignificant" or three if
it is "Significant"
Regulatory relations impact A variable that takes the value of one if the impact on a firm's regulatory relations
from bribery is "Not significant", two if it is "Neither Significant or Insignificant" or
three if it is "Significant"
Employee morale impact A variable that takes the value of one if the impact on a firm's employee morale from
bribery is "Not significant", two if it is "Neither Significant or Insignificant" or three if
it is "Significant"
Financial impact A variable that takes the value of one if the direct financial impact from bribery is
"Less than $100,000", two if it is "Between $100,000 and $500,000" or three if it is
"More than $500,000"
Internal A variable that takes the value of one if the bribery was initiated by a person internal
to the organization
Formal internal controls A variable that takes the value of one if the bribery was detected by the formal internal
control systems of the firm
Informal internal controls A variable that takes the value of one if the bribery was detected by a tip-off internal
or external or a whistle blower
Non-firm actors A variable that takes the value of one if the bribery was not detected by the firm’s
formal or informal control systems but by regulators, law enforcement or the media
SOE A variable that takes the value of one if the firm is a state-owned enterprise
Firm size A variable that takes the value of one if the firm employees "Less than 200", two if it
employees "Between 200 and 1,000" three if it employees "Between 1,000 and 5,000"
and four if it employees "More than 5,000"
Senior executives A variable that takes the value of one if the main perpetrator of bribery was a senior
executive of the organization
Middle managers A variable that takes the value of one if the main perpetrator of bribery was a middle
manager of the organization
Junior staff A variable that takes the value of one if the main perpetrator of bribery was a junior
staff of the organization
Customers A variable that takes the value of one if the main perpetrator of bribery was a customer
of the organization
Suppliers A variable that takes the value of one if the main perpetrator of bribery was a supplier
of the organization
Agents A variable that takes the value of one if the main perpetrator of bribery was an
agent/intermediary of the organization
Government A variable that takes the value of one if the main perpetrator of bribery was an
employee of the government
Legal action A variable that takes the value of one if the organization responded to the bribery
detection by pursuing a civil action against the initiator
Regulators Informed A variable that takes the value of one if the organization responded to the bribery
detection by informing regulators
Dismiss Perpetrator A variable that takes the value of one if the organization responded to the bribery
detection by firing (ceasing business relations) the internal (external) perpetrator
27
Table 1
Panel A: Number of Observations by Country
Country Full
Sample %
Economic
Crime Only %
Bribe & Other
Economic
Crime
% Bribe
Only %
Andorra 1 0.01% 1 0.05% 0 0.00% 0 0.00%
Angola 1 0.01% 0 0.00% 0 0.00% 0 0.00%
Argentina 114 1.67% 47 2.27% 10 1.93% 2 0.82%
Australia 154 2.26% 66 3.18% 13 2.50% 9 3.69%
Austria 41 0.60% 7 0.34% 2 0.39% 1 0.41%
Belgium 144 2.12% 45 2.17% 9 1.73% 6 2.46%
Bolivia 3 0.04% 2 0.10% 0 0.00% 0 0.00%
Botswana 1 0.01% 0 0.00% 0 0.00% 0 0.00%
Brazil 172 2.53% 51 2.46% 8 1.54% 5 2.05%
Bulgaria 117 1.72% 28 1.35% 12 2.31% 6 2.46%
Canada 102 1.50% 43 2.07% 3 0.58% 1 0.41%
Chile 76 1.12% 16 0.77% 5 0.96% 0 0.00%
China 14 0.21% 3 0.14% 2 0.39% 0 0.00%
Colombia 1 0.01% 0 0.00% 0 0.00% 0 0.00%
Croatia 1 0.01% 1 0.05% 0 0.00% 0 0.00%
Cyprus 6 0.09% 3 0.14% 1 0.19% 0 0.00%
Czech Republic 167 2.45% 41 1.98% 11 2.12% 3 1.23%
Denmark 221 3.25% 59 2.84% 5 0.96% 1 0.41%
Dominican Republic 1 0.01% 1 0.05% 0 0.00% 0 0.00%
Ecuador 11 0.16% 8 0.39% 1 0.19% 1 0.41%
Estonia 1 0.01% 1 0.05% 5 0.96% 0 0.00%
Finland 113 1.66% 25 1.21% 2 0.39% 3 1.23%
France 163 2.39% 63 3.04% 1 0.19% 1 0.41%
Germany 55 0.81% 3 0.14% 4 0.77% 1 0.41%
Ghana 54 0.79% 15 0.72% 0 0.00% 4 1.64%
Greece 186 2.73% 33 1.59% 12 2.31% 4 1.64%
Hong Kong 74 1.09% 12 0.58% 6 1.16% 5 2.05%
Hungary 138 2.03% 37 1.78% 22 4.24% 10 4.10%
India 251 3.69% 50 2.41% 20 3.85% 7 2.87%
Indonesia 133 1.95% 18 0.87% 6 1.16% 4 1.64%
Ireland 166 2.44% 41 1.98% 1 0.19% 0 0.00%
Israel 1 0.01% 0 0.00% 0 0.00% 0 0.00%
Italy 213 3.13% 37 1.78% 2 0.39% 1 0.41%
Japan 142 2.09% 10 0.48% 0 0.00% 0 0.00%
Kenya 143 2.10% 89 4.29% 22 4.24% 5 2.05%
Liberia 5 0.07% 0 0.00% 0 0.00% 0 0.00%
Lithuania 6 0.09% 4 0.19% 3 0.58% 2 0.82%
Luxembourg 3 0.04% 0 0.00% 0 0.00% 0 0.00%
Malaysia 156 2.29% 55 2.65% 20 3.85% 10 4.10%
Mexico 268 3.94% 110 5.30% 28 5.39% 12 4.92%
Middle East 135 1.98% 38 1.83% 16 3.08% 6 2.46%
Moldavia 1 0.01% 0 0.00% 0 0.00% 0 0.00%
Montenegro 1 0.01% 0 0.00% 0 0.00% 0 0.00%
28
Namibia 3 0.04% 1 0.05% 1 0.19% 1 0.41%
Netherlands 112 1.65% 14 0.68% 2 0.39% 1 0.41%
New Zealand 177 2.60% 82 3.95% 4 0.77% 4 1.64%
Nigeria 2 0.03% 1 0.05% 1 0.19% 1 0.41%
Norway 139 2.04% 36 1.74% 7 1.35% 4 1.64%
Papua New Guinea 1 0.01% 1 0.05% 1 0.19% 0 0.00%
Peru 18 0.26% 7 0.34% 3 0.58% 2 0.82%
Philippines 1 0.01% 0 0.00% 0 0.00% 0 0.00%
Poland 140 2.06% 49 2.36% 15 2.89% 6 2.46%
Portugal 1 0.01% 0 0.00% 0 0.00% 0 0.00%
Romania 130 1.91% 27 1.30% 12 2.31% 3 1.23%
Russia 210 3.09% 102 4.92% 45 8.67% 22 9.02%
Serbia 18 0.26% 5 0.24% 1 0.19% 1 0.41%
Sierra Leone 1 0.01% 0 0.00% 0 0.00% 0 0.00%
Singapore 68 1.00% 10 0.48% 4 0.77% 1 0.41%
Slovakia 152 2.23% 36 1.74% 5 0.96% 3 1.23%
Slovenia 47 0.69% 7 0.34% 4 0.77% 1 0.41%
South Africa 183 2.69% 106 5.11% 50 9.63% 20 8.20%
South Korea 1 0.01% 0 0.00% 0 0.00% 0 0.00%
Spain 139 2.04% 57 2.75% 15 2.89% 5 2.05%
Sudan 1 0.01% 1 0.05% 0 0.00% 0 0.00%
Swaziland 1 0.01% 1 0.05% 1 0.19% 0 0.00%
Sweden 150 2.20% 25 1.21% 5 0.96% 3 1.23%
Switzerland 265 3.89% 42 2.03% 4 0.77% 3 1.23%
Taiwan 2 0.03% 0 0.00% 0 0.00% 0 0.00%
Thailand 103 1.51% 29 1.40% 15 2.89% 13 5.33%
Tunisia 2 0.03% 1 0.05% 0 0.00% 0 0.00%
Turkey 106 1.56% 17 0.82% 3 0.58% 0 0.00%
UK 400 5.88% 179 8.63% 17 3.28% 8 3.28%
USA 225 3.31% 90 4.34% 8 1.54% 3 1.23%
Ukraine 148 2.17% 58 2.80% 35 6.74% 20 8.20%
Venezuela 84 1.23% 20 0.96% 5 0.96% 5 2.05%
Vietnam 19 0.28% 6 0.29% 4 0.77% 4 1.64%
Zambia 1 0.01% 1 0.05% 0 0.00% 0 0.00%
Total 6,806 2,074 519 244
29
Table 1
Panel B: Number of Observations by Sector
Industry Full
sample %
Economic
Crime
Only
%
Bribe &
Other
Economic
Crime
% Bribe
Only %
Aerospace and defense 45 0.33% 12 0.29% 2 0.19% 1 0.20%
Automotive 284 2.09% 67 1.62% 18 1.73% 6 1.23%
Chemicals 150 1.10% 25 0.60% 8 0.77% 4 0.82%
Communication 192 1.41% 86 2.07% 33 3.18% 17 3.48%
Education 41 0.30% 13 0.31% 3 0.29% 1 0.20%
Energy, utilities and mining 493 3.62% 131 3.16% 54 5.20% 32 6.56%
Engineering and construction 428 3.14% 113 2.72% 47 4.53% 22 4.51%
Entertainment and media 189 1.39% 58 1.40% 10 0.96% 3 0.61%
Financial services 1165 8.56% 496 11.96% 87 8.38% 21 4.30%
Food related 55 0.40% 11 0.27% 2 0.19% 2 0.41%
Government related 358 2.63% 139 3.35% 31 2.99% 13 2.66%
Health and care 36 0.26% 18 0.43% 3 0.29% 1 0.20%
Hospitality and leisure 131 0.96% 58 1.40% 8 0.77% 4 0.82%
Insurance 330 2.42% 151 3.64% 26 2.50% 10 2.05%
Manufacturing 886 6.51% 183 4.41% 56 5.39% 28 5.74%
Pharmaceuticals and life sciences 328 2.41% 68 1.64% 15 1.45% 12 2.46%
Professional services 408 3.00% 68 1.64% 19 1.83% 9 1.84%
Property 59 0.43% 11 0.27% 4 0.39% 4 0.82%
Retail and consumer 582 4.28% 219 5.28% 57 5.49% 34 6.97%
Technology 334 2.45% 45 1.08% 8 0.77% 3 0.61%
Transportation and logistics 312 2.29% 102 2.46% 28 2.70% 17 3.48%
Total 6,806 2,074 519 244
All variables are defined in the Appendix.
30
Table 2
Panel A: Frequency Distributions of Impact from Detection of Bribery
Employee morale impact Business relations impact
Low Medium High Low Medium High
Sto
ck p
rice
im
pa
ct
Low 19% 34% 23%
Low 29% 30% 17%
Medium 2% 5% 7%
Medium 3% 5% 6%
High 1% 1% 7%
High 1% 1% 8%
Regulatory relations impact Reputation impact
Low Medium High
Low Medium High
Low 44% 20% 12%
Low 49% 18% 9%
Medium 1% 9% 5%
Medium 3% 7% 4%
High 1% 1% 7% High 1% 1% 8%
Panel B: Determinants of Stock Price Impact
Dependent Variable Stock Price Impact
Parameter Estimate t Estimate Chi-square
Employee Morale Impact 0.026 0.45 0.137 0.19
Business Relations Impact 0.031 0.47 0.087 0.05
Regulatory Relations Impact 0.182 2.70 0.979 9.72
Reputation Impact 0.326 4.44 1.290 21.83
R-squared 33.49%
40.50%
N 161 161
31
Panel C: Determinants of Stock Price Impact and the Moderating Effect of Market Competition
Dependent Variable Stock price impact
Parameter Estimate t Estimate t Estimate t
Employee Morale Impact 0.294 2.36 0.029 0.52 0.298 2.41
Business Relations Impact 0.016 0.23 1.352 1.91 1.663 2.36
Regulatory Relations Impact 0.199 2.99 0.196 2.93 0.218 3.40
Reputation Impact 0.331 4.67 0.327 4.36 0.334 4.65
Labor market competition 0.097 0.31
0.037 0.12
Employee Morale Impact x Labor market competition -0.567 -2.17
-0.576 -2.21
Product market competition
0.174 1.14 0.262 1.78
Business Relations Impact x Product market competition
-0.235 -1.92 -0.292 -2.41
R-squared 38.14%
34.28%
39.83%
N 158 160 158
Panel A shows frequency statistics of the significance of the bribery incident on competitiveness factors and stock price. The first specification of Panel B is
estimated using an ordinary least squares model. The second specification of Panel B is estimated using an ordinary logistic model. All specifications in Panel C
are estimated using ordinary least squares models. Labor market competition is an index of the rigidity of the labor market in a country. Higher values represent
less competitive labor markets. Product market competition is an index of the number of steps required to set up and conduct business in a country. Higher values
represent less competitive product markets. All other variables are defined in the Appendix. Standard errors are clustered by country.
32
Table 3
Panel A: Summary Statistics of Perpetrator Identity, Detection Method, Organizational Response and Other Characteristics
Internal External
Perpetrators Included All Internal External Senior
executives
Middle
managers
Junior
staff Customers Suppliers Agents Government
Perpetrators
Internal 67%
Senior executives
18%
Middle managers
58%
Junior staff
23%
External 33%
Customers
28%
Suppliers
15%
Agents
21%
Government
36%
Detection Method
Formal control systems 37% 39% 33% 50% 31% 50% 41% 33% 35% 24%
Informal control systems 37% 37% 36% 33% 41% 32% 41% 33% 35% 34%
Non-firm actors 26% 24% 31% 17% 28% 18% 18% 33% 29% 41%
Organizational Response
Legal action 38% 39% 35% 27% 42% 42% 50% 42% 47% 14%
Inform regulators 41% 39% 46% 30% 40% 45% 50% 25% 59% 45%
Dismiss perpetrator 71% 84% 44% 70% 86% 89% 55% 58% 65% 17%
Other Characteristics
Firm size 2.66 2.86 2.24 2.73 2.83 3.03 2.09 2.08 2.18 2.45
SOE 0.10 0.12 0.08 0.13 0.09 0.16 0.05 0.25 0.06 0.03
Country corruption -0.22 -0.26 -0.14 0.00 -0.35 -0.23 -0.18 -0.50 -0.41 0.19
Industry corruption 1.92 1.98 1.80 2.10 1.97 1.92 1.68 1.83 2.00 1.76
33
Panel B: Summary Statistics of Perpetrator Identity, Detection Method, and Organizational Response by Country or Industry Corruption
Sample Includes
Low
corruption
country
High
corruption
country
Low
corruption
country
High
corruption
country
Low
corruption
industry
High
corruption
industry
Low
corruption
industry
High
corruption
industry
Perpetrators Included Internal Internal External External Internal Internal External External
Perpetrators
Internal
Senior executives 17% 19%
17% 23%
Middle managers 60% 58%
58% 59%
Junior staff 23% 23%
25% 18%
External
Customers
26% 28%
29% 22%
Suppliers
21% 13%
15% 17%
Agents
32% 18%
19% 28%
Government
21% 41%
37% 33%
Detection Method
Formal control systems 29% 43% 37% 31% 36% 48% 32% 33%
Informal control systems 52% 31% 37% 36% 38% 36% 39% 28%
Non-firm actors 19% 26% 26% 33% 27% 16% 29% 39%
Organizational Response
Legal action 44% 37% 42% 33% 39% 39% 39% 22%
Inform regulators 56% 32% 42% 48% 42% 32% 50% 33%
Dismiss perpetrator 88% 83% 42% 44% 80% 84% 42% 50%
All variables are defined in the Appendix.
34
Table 4
Panel A: Reputation and Regulatory Relations
Ordered logistic regressions. Standard errors are clustered by country. All variables are defined in the Appendix.
VariablesPredicted
SignEstimate p-value Estimate p-value Estimate p-value
Predicted
SignEstimate p-value Estimate p-value Estimate p-value
Perpetrator
Internal + 1.025 0.003 + 0.211 0.532
Senior executives + 1.417 0.018 + 1.147 0.051
Middle managers + 1.044 0.025 + 0.912 0.069
Customers +/- -0.385 0.609 +/- -0.679 0.445
Suppliers +/- -0.159 0.874 +/- 1.068 0.363
Agents - -0.442 0.606 +/- -0.403 0.678
Detection Method
Formal control systems - 0.309 0.376 0.392 0.396 0.470 0.492 - -0.761 0.039 -0.508 0.297 -1.202 0.140
Informal control systems - 0.052 0.886 -0.162 0.723 0.229 0.747 - -0.669 0.060 -0.713 0.100 -0.909 0.192
Organizational Response
Legal action +/- 0.262 0.384 0.255 0.500 0.960 0.184 +/- -0.233 0.467 -0.560 0.154 0.556 0.463
Inform regulators +/- 0.106 0.722 0.374 0.335 -0.212 0.743 +/- 0.512 0.115 0.763 0.057 0.561 0.419
Dismiss perpetrator - -1.005 0.004 -0.998 0.063 -1.079 0.069 - -0.576 0.100 -0.971 0.079 -0.538 0.398
Firm Characteristics
Firm size +/- -0.283 0.041 -0.240 0.220 -0.220 0.394 +/- -0.094 0.491 0.035 0.860 -0.041 0.889
SOE +/- -0.125 0.802 -0.296 0.608 0.467 0.739 - -0.148 0.781 -0.198 0.749 -1.496 0.365
Corruption
Country corruption +/- -0.154 0.260 -0.297 0.091 0.184 0.530 +/- 0.107 0.451 -0.062 0.733 0.559 0.081
Sector corruption +/- 0.094 0.594 -0.052 0.825 0.480 0.165 +/- 0.045 0.810 -0.122 0.614 0.665 0.111
Controls
Bribe size + 0.675 0.003 0.469 0.113 0.664 0.124 + 0.512 0.028 0.450 0.141 0.398 0.374
Fixed effects Yes Yes Yes Yes Yes Yes
N 237 158 79 220 148 72
Percent Concordant 66% 71% 70% 67% 69% 75%
R-squared 13% 20% 20% 13% 18% 31%
All Internal External
Reputation impact Regulatory relations impact
All Internal External
35
Panel B: Business Relations and Employee Morale
Ordered logistic regressions. Standard errors are clustered by country. All variables are defined in the Appendix.
VariablesPredicted
SignEstimate p-value Estimate p-value Estimate p-value
Predicted
SignEstimate p-value Estimate p-value Estimate p-value
Perpetrator
Internal + 0.319 0.341 + 0.524 0.095
Senior executives + 0.723 0.076 + 0.106 0.839
Middle managers + 0.946 0.034 + -0.184 0.649
Customers + 0.822 0.100 +/- 0.226 0.747
Suppliers + 2.241 0.018 +/- 0.781 0.323
Agents + 1.075 0.090 +/- -0.719 0.383
Detection Method
Formal control systems - -0.337 0.335 -0.214 0.648 -0.212 0.761 - 0.192 0.548 -0.068 0.878 0.616 0.329
Informal control systems - -0.314 0.362 -0.306 0.484 -0.383 0.594 - 0.346 0.299 -0.066 0.880 1.475 0.039
Organizational Response
Legal action +/- 0.437 0.160 0.991 0.010 -1.103 0.077 +/- -0.106 0.704 0.010 0.976 -0.233 0.653
Inform regulators +/- -0.295 0.306 -0.330 0.359 -0.181 0.783 +/- 0.222 0.440 0.211 0.570 0.590 0.358
Dismiss perpetrator - -0.093 0.782 -0.087 0.862 0.060 0.916 - -0.512 0.114 0.030 0.951 -0.884 0.126
Firm Characteristics
Firm size - -0.495 0.000 -0.608 0.004 -0.106 0.674 - -0.399 0.003 -0.601 0.003 -0.175 0.497
SOE - -0.847 0.098 -0.979 0.089 -1.179 0.529 +/- 0.057 0.901 0.176 0.745 -0.393 0.731
Corruption
Country corruption - -0.149 0.275 -0.203 0.237 0.261 0.377 - 0.119 0.381 0.001 0.995 0.418 0.170
Sector corruption +/- 0.201 0.251 0.253 0.260 0.073 0.826 - 0.133 0.433 0.288 0.171 -0.141 0.653
Controls
Bribe size + 0.690 0.001 0.635 0.027 0.853 0.044 + 0.411 0.037 0.357 0.189 0.927 0.037
Fixed effects Yes Yes Yes Yes Yes Yes
N 235 160 75 237 158 79
Percent Concordant 68% 72% 73% 63% 65% 72%
R-squared 15% 23% 25% 9% 12% 26%
Business relations impact Employee morale impact
All Internal External All Internal External