Embed Size (px)
Citation preview
1
Fire WeatherFire Weather Hayman 2002. Kenneth Wyatt
Rodeo-Chediski 2002. www.floa.org/rodeo_chediski/fire_photos1.htm
Biscuit 2002 www.biscuitfire.com
BitterrrotBitterrrot NF photographNF photograph
© John McColgan6 August 2000, Bitterroot NF, MT6 August 2000, Bitterroot NF, MT
Societal Needs for Weather & Climate InformationSocietal Needs for Weather & Climate Information
2
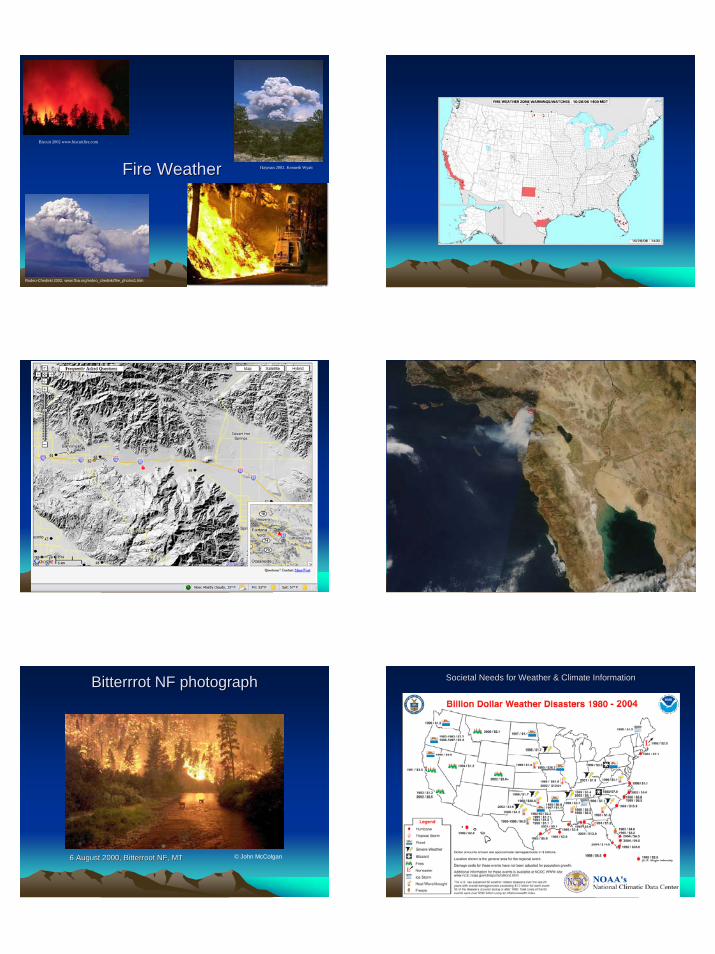
Drought in the West Drought in the West Fire Weather Internet ResourcesFire Weather Internet Resources
• National Fire plan: www.fireplan.gov• National Interagency Fire Center (NIFC):
www.nifc.gov• GACCs: www.nifc.gov/fireinfo/geomap.html• Fire Danger PocketCards:
famweb.nwcg.gov/pocketcards• GeoMAC: geomac.usgs.gov• DRI: www.wrcc.dri.edu/fire/FW2.html• Wildland Fire Assessment System:
www.fs.fed.us/land/wfas/• ROMAN: raws.wrh.noaa.gov/roman
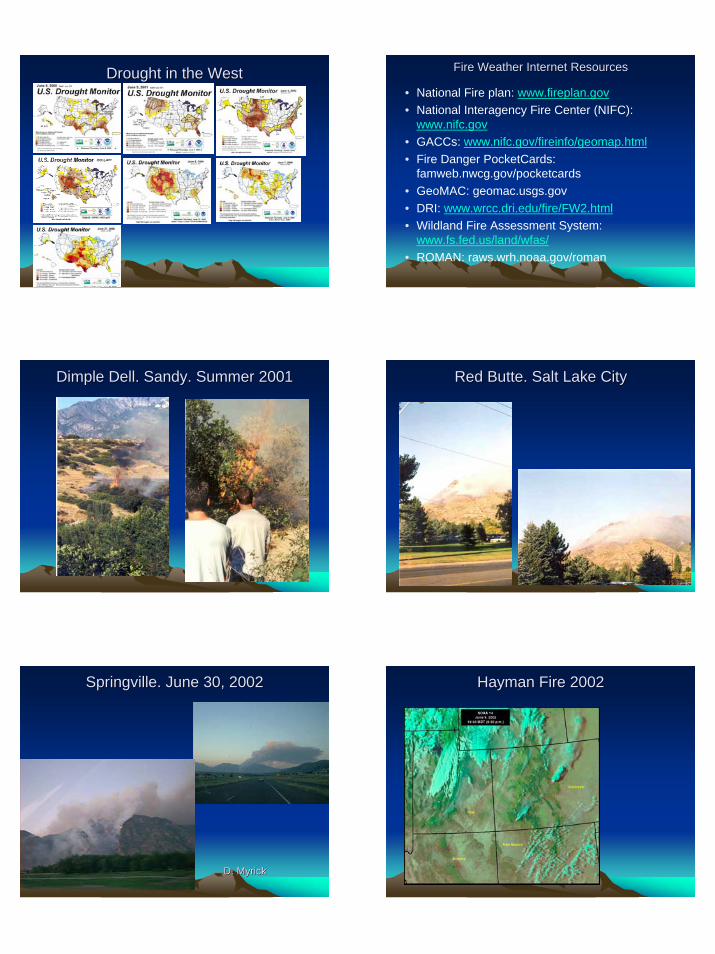
Dimple Dell. Sandy. Summer 2001Dimple Dell. Sandy. Summer 2001 Red Butte. Salt Lake CityRed Butte. Salt Lake City
Springville. June 30, 2002Springville. June 30, 2002
D. MyrickD. Myrick
HaymanHayman Fire 2002Fire 2002
3
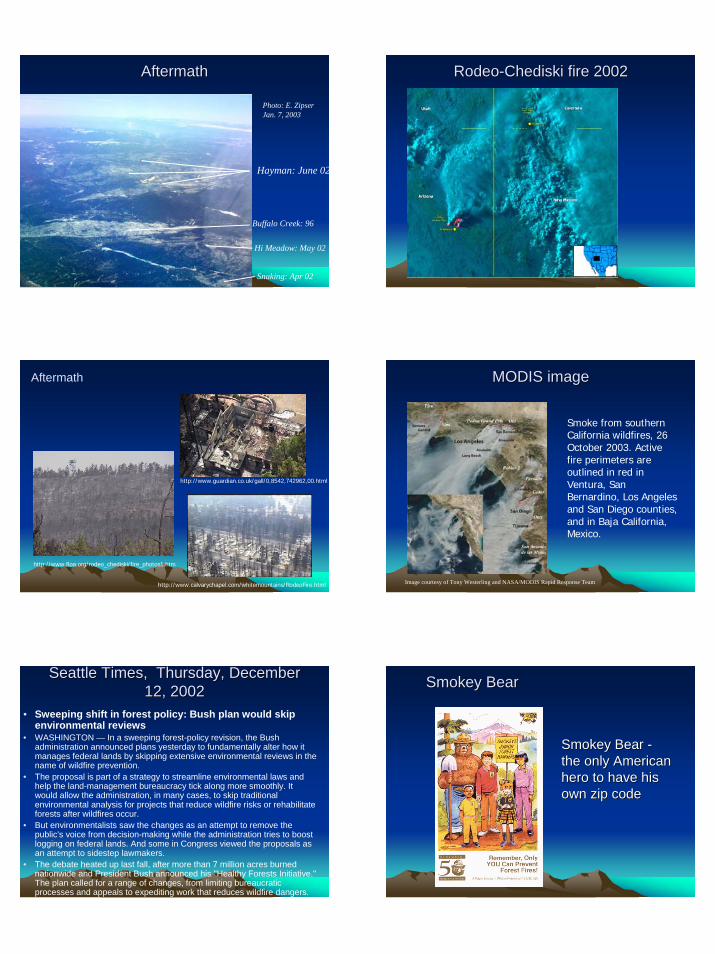
AftermathAftermath
Buffalo Creek: 96
Snaking: Apr 02
Hi Meadow: May 02
Hayman: June 02
Photo: E. ZipserJan. 7, 2003
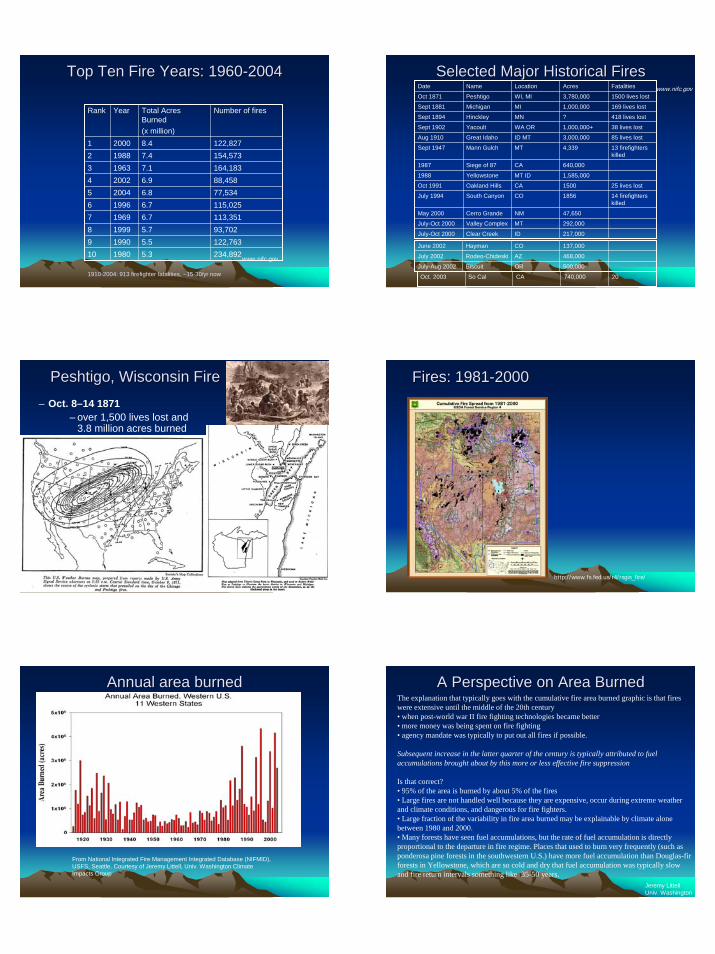
RodeoRodeo--ChediskiChediski fire 2002fire 2002
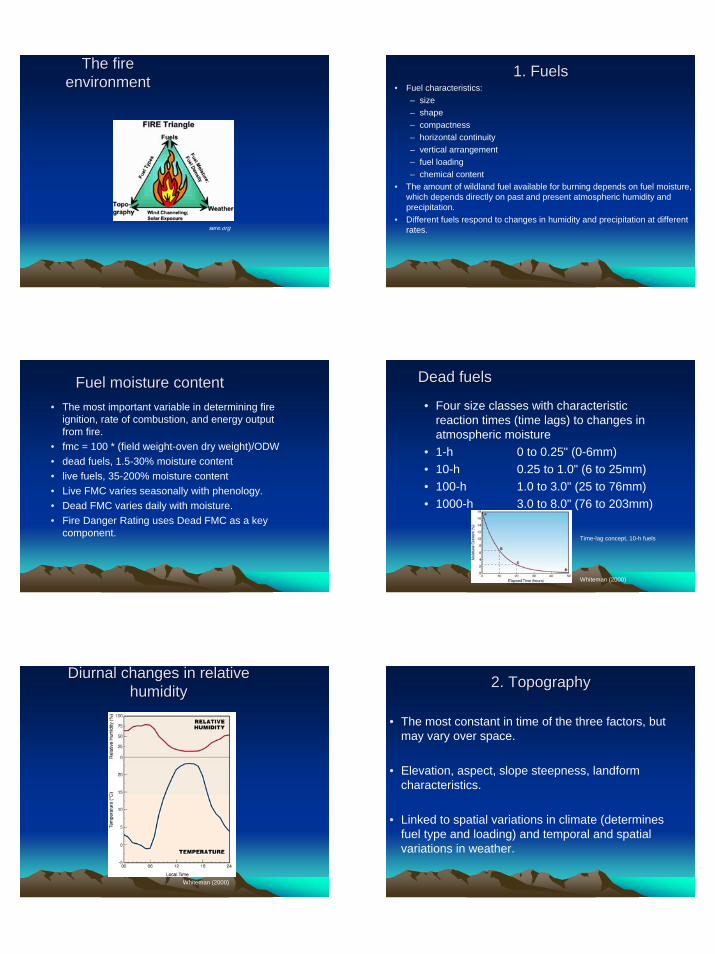
Aftermath
http://www.calvarychapel.com/whitemountains/RodeoFire.html
http://www.guardian.co.uk/gall/0,8542,742962,00.html
http://www.floa.org/rodeo_chediski/fire_photos1.htm
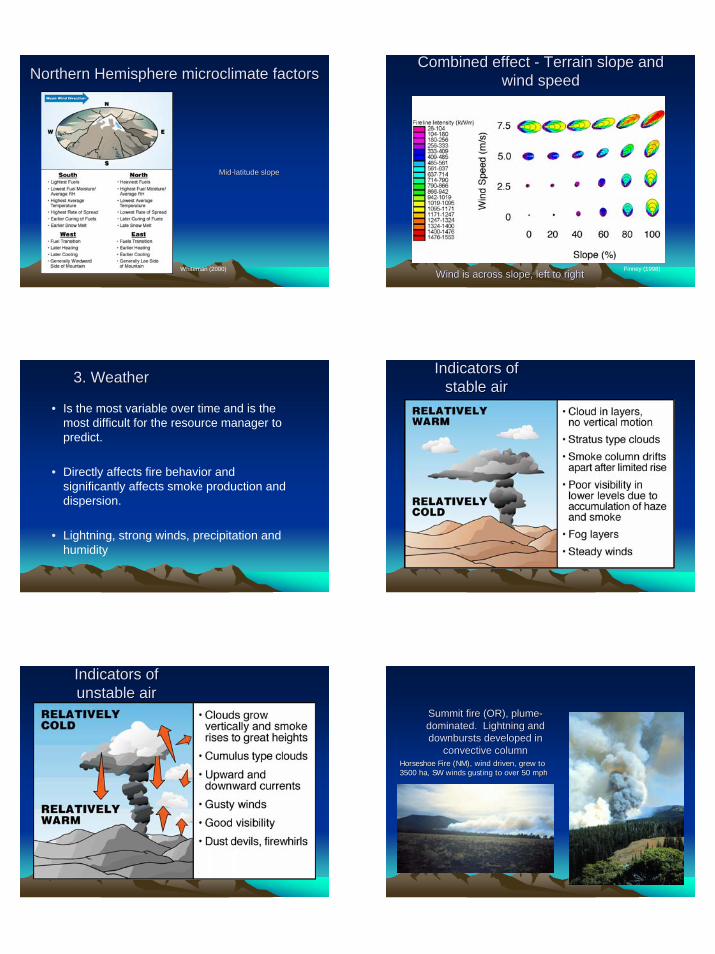
MODIS imageMODIS image
Smoke from southern California wildfires, 26 October 2003. Active fire perimeters are outlined in red in Ventura, San Bernardino, Los Angeles and San Diego counties, and in Baja California, Mexico.
Image courtesy of Tony Westerling and NASA/MODIS Rapid Response Team
Seattle Times, Seattle Times, Thursday, December Thursday, December 12, 200212, 2002
• Sweeping shift in forest policy: Bush plan would skip environmental reviews
• WASHINGTON — In a sweeping forest-policy revision, the Bush administration announced plans yesterday to fundamentally alter how it manages federal lands by skipping extensive environmental reviews in the name of wildfire prevention.
• The proposal is part of a strategy to streamline environmental laws and help the land-management bureaucracy tick along more smoothly. It would allow the administration, in many cases, to skip traditional environmental analysis for projects that reduce wildfire risks or rehabilitate forests after wildfires occur.
• But environmentalists saw the changes as an attempt to remove the public's voice from decision-making while the administration tries to boost logging on federal lands. And some in Congress viewed the proposals as an attempt to sidestep lawmakers.
• The debate heated up last fall, after more than 7 million acres burned nationwide and President Bush announced his "Healthy Forests Initiative." The plan called for a range of changes, from limiting bureaucratic processes and appeals to expediting work that reduces wildfire dangers.
Smokey BearSmokey Bear
Smokey Bear Smokey Bear --the only Americanthe only Americanhero to have his hero to have his own zip codeown zip code
4
Top Ten Fire Years: 1960Top Ten Fire Years: 1960--20042004
Rank Year Total Acres Burned (x million)
Number of fires
1 2000 8.4 122,827154,573164,18388,45877,534115,025113,35193,702122,763234,892
2 1988 7.43 1963 7.14 2002 6.95 2004 6.86 1996 6.77 1969 6.78 1999 5.79 1990 5.510 1980 5.3
www.nifc.gov
1910-2004: 913 firefighter fatalities, ~15-30/yr now
Selected Major Historical FiresSelected Major Historical FiresDate Name Location Acres Fatalities
Oct 1871 Peshtigo WI, MI 3,780,000 1500 lives lost
Sept 1881 Michigan MI 1,000,000 169 lives lost
Sept 1894 Hinckley MN ? 418 lives lost
Sept 1902 Yacoult WA OR 1,000,000+ 38 lives lost
Aug 1910 Great Idaho ID MT 3,000,000 85 lives lost
Sept 1947 Mann Gulch MT 4,339 13 firefighters killed
1987 Siege of 87 CA 640,000
1988 Yellowstone MT ID 1,585,000
Oct 1991 Oakland Hills CA 1500 25 lives lost
July 1994 South Canyon CO 1856 14 firefighters killed
May 2000 Cerro Grande NM 47,650
July-Oct 2000 Valley Complex MT 292,000
July-Oct 2000 Clear Creek ID 217,000
June 2002 Hayman CO 137,000
July 2002 Rodeo-Chideski AZ 468,000
July-Aug 2002 Biscuit OR 500,000
www.nifc.gov
Oct. 2003 So Cal CA 740,000 20
Peshtigo, Wisconsin FirePeshtigo, Wisconsin Fire– Oct. 8–14 1871
– over 1,500 lives lost and 3.8 million acres burned in nation's worst forest fire
– Weather: prolonged and widespread drought and high temperatures, capped off by a cyclonic storm in early October
– Started same day as Chicago fire (cow/lantern)
– http://www.peshtigofire.info/
Fires: 1981Fires: 1981--2000 2000
http://www.fs.fed.us/r4/rsgis_fire/
Annual area burnedAnnual area burned
From National Integrated Fire Management Integrated Database (NIFMID), USFS, Seattle. Courtesy of Jeremy Littell, Univ. Washington Climate Impacts Group
A Perspective on Area BurnedA Perspective on Area Burned
Jeremy LittellUniv. Washington
The explanation that typically goes with the cumulative fire area burned graphic is that fires were extensive until the middle of the 20th century• when post-world war II fire fighting technologies became better• more money was being spent on fire fighting• agency mandate was typically to put out all fires if possible.
Subsequent increase in the latter quarter of the century is typically attributed to fuel accumulations brought about by this more or less effective fire suppression
Is that correct?• 95% of the area is burned by about 5% of the fires• Large fires are not handled well because they are expensive, occur during extreme weather and climate conditions, and dangerous for fire fighters.• Large fraction of the variability in fire area burned may be explainable by climate alone between 1980 and 2000. • Many forests have seen fuel accumulations, but the rate of fuel accumulation is directly proportional to the departure in fire regime. Places that used to burn very frequently (such as ponderosa pine forests in the southwestern U.S.) have more fuel accumulation than Douglas-fir forests in Yellowstone, which are so cold and dry that fuel accumulation was typically slow and fire return intervals something like 35-50 years.
5
The fire The fire environmentenvironment
sere.org
1. Fuels1. Fuels• Fuel characteristics:
– size– shape– compactness– horizontal continuity– vertical arrangement– fuel loading– chemical content
• The amount of wildland fuel available for burning depends on fuel moisture, which depends directly on past and present atmospheric humidity and precipitation.
• Different fuels respond to changes in humidity and precipitation at different rates.
Fuel moisture contentFuel moisture content• The most important variable in determining fire
ignition, rate of combustion, and energy output from fire.
• fmc = 100 * (field weight-oven dry weight)/ODW• dead fuels, 1.5-30% moisture content• live fuels, 35-200% moisture content• Live FMC varies seasonally with phenology.• Dead FMC varies daily with moisture.• Fire Danger Rating uses Dead FMC as a key
component.
Dead fuelsDead fuels
• Four size classes with characteristic reaction times (time lags) to changes in atmospheric moisture
• 1-h 0 to 0.25" (0-6mm)• 10-h 0.25 to 1.0" (6 to 25mm)• 100-h 1.0 to 3.0" (25 to 76mm)• 1000-h 3.0 to 8.0" (76 to 203mm)
Whiteman (2000)
Time-lag concept, 10-h fuels
Diurnal changes in relative Diurnal changes in relative humidityhumidity
Whiteman (2000)
2. Topography2. Topography
• The most constant in time of the three factors, but may vary over space.
• Elevation, aspect, slope steepness, landform characteristics.
• Linked to spatial variations in climate (determines fuel type and loading) and temporal and spatial variations in weather.
6
Northern Hemisphere microclimate factorsNorthern Hemisphere microclimate factors
MidMid--latitude slopelatitude slope
Whiteman (2000)
Combined effect Combined effect -- Terrain slope and Terrain slope and wind speedwind speed
Finney (1998)Wind is across slope, left to rightWind is across slope, left to right
3. Weather3. Weather
• Is the most variable over time and is the most difficult for the resource manager to predict.
• Directly affects fire behavior and significantly affects smoke production and dispersion.
• Lightning, strong winds, precipitation and humidity
Indicators of Indicators of stable airstable air
Indicators of Indicators of unstable airunstable air
Summit fire (OR), plumeSummit fire (OR), plume--dominated. Lightning and dominated. Lightning and downbursts developed in downbursts developed in
convective columnconvective columnHorseshoe Fire (NM), wind driven, grew to Horseshoe Fire (NM), wind driven, grew to 3500 ha, SW winds gusting to over 50 mph3500 ha, SW winds gusting to over 50 mph
7
Fire terminologyFire terminology• Crown fire - a severe fire where flames travel from tree to tree at the
level of the tree’s crowns or tops.• Fire line - a zone along a fire’s edge where there is little or no fuel
available to the fire• Backfire - a fire started to stop an advancing fire by creating a burned
area in its pattern• Firebrand - flaming or glowing fuel particles that can be carried naturally
by wind, convection currents or gravity into unburned fuels• Spotting - outbreak of secondary fires as firebrands or other burning
materials are carried ahead of the main fire by winds• wildfire - an unwanted fire that requires measures of control.• firing pattern - the specific pattern and timing of ignition of a prescribed
fire to affect the direction or rate of fire spread and fire intensity.
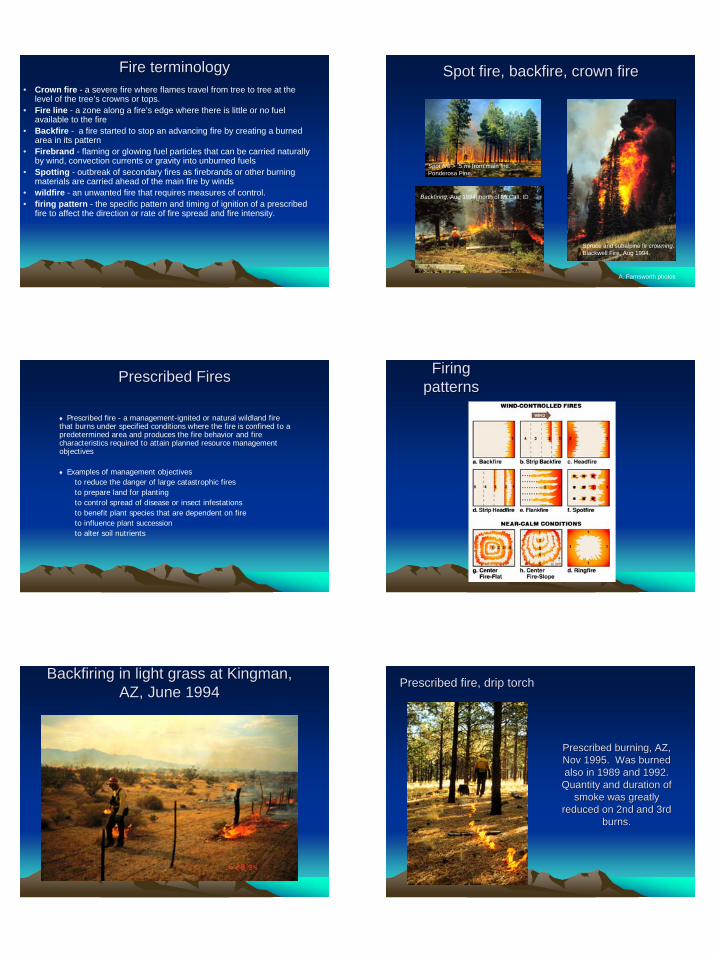
Spot fire, backfire, crown fireSpot fire, backfire, crown fire
A. Farnsworth photos
Spruce and subalpine fir crowning.Blackwell Fire, Aug 1994.
Backfiring, Aug 1994, north of McCall, ID
Spot fire > .5 mi from main fire. Ponderosa Pine.
Prescribed FiresPrescribed Fires
♦ Prescribed fire - a management-ignited or natural wildland fire that burns under specified conditions where the fire is confined to a predetermined area and produces the fire behavior and fire characteristics required to attain planned resource management objectives
♦ Examples of management objectivesto reduce the danger of large catastrophic firesto prepare land for plantingto control spread of disease or insect infestationsto benefit plant species that are dependent on fireto influence plant successionto alter soil nutrients
Firing Firing patternspatterns
Backfiring in light grass at Kingman, Backfiring in light grass at Kingman, AZ, June 1994AZ, June 1994
Prescribed burning, AZ, Prescribed burning, AZ, Nov 1995. Was burned Nov 1995. Was burned also in 1989 and 1992. also in 1989 and 1992. Quantity and duration of Quantity and duration of
smoke was greatly smoke was greatly reduced on 2nd and 3rd reduced on 2nd and 3rd
burns.burns.
Prescribed fire, drip torchPrescribed fire, drip torch
8
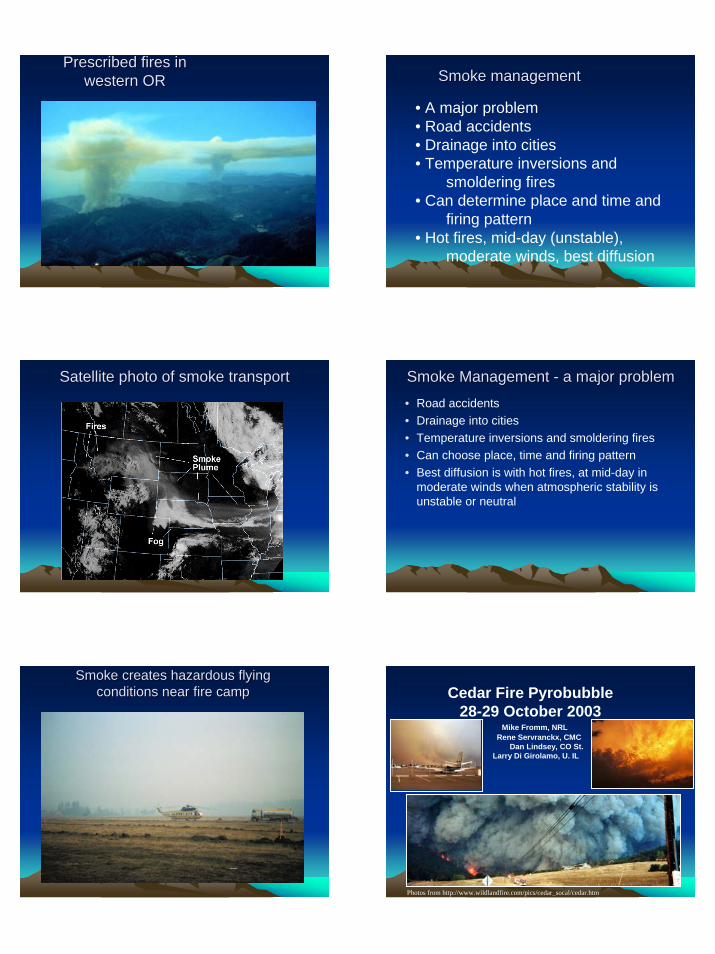
Prescribed fires in Prescribed fires in western ORwestern OR Smoke managementSmoke management
• A major problem• Road accidents• Drainage into cities• Temperature inversions and
smoldering fires• Can determine place and time and
firing pattern• Hot fires, mid-day (unstable),
moderate winds, best diffusion
Satellite photo of smoke transportSatellite photo of smoke transport Smoke Management Smoke Management -- a major problema major problem• Road accidents• Drainage into cities• Temperature inversions and smoldering fires• Can choose place, time and firing pattern• Best diffusion is with hot fires, at mid-day in
moderate winds when atmospheric stability is unstable or neutral
Smoke creates hazardous flying Smoke creates hazardous flying conditions near fire campconditions near fire camp Cedar Fire Pyrobubble
28-29 October 2003Mike Fromm, NRL
Rene Servranckx, CMCDan Lindsey, CO St.
Larry Di Girolamo, U. IL
Photos from http://www.wildlandfire.com/pics/cedar_socal/cedar.htm
9
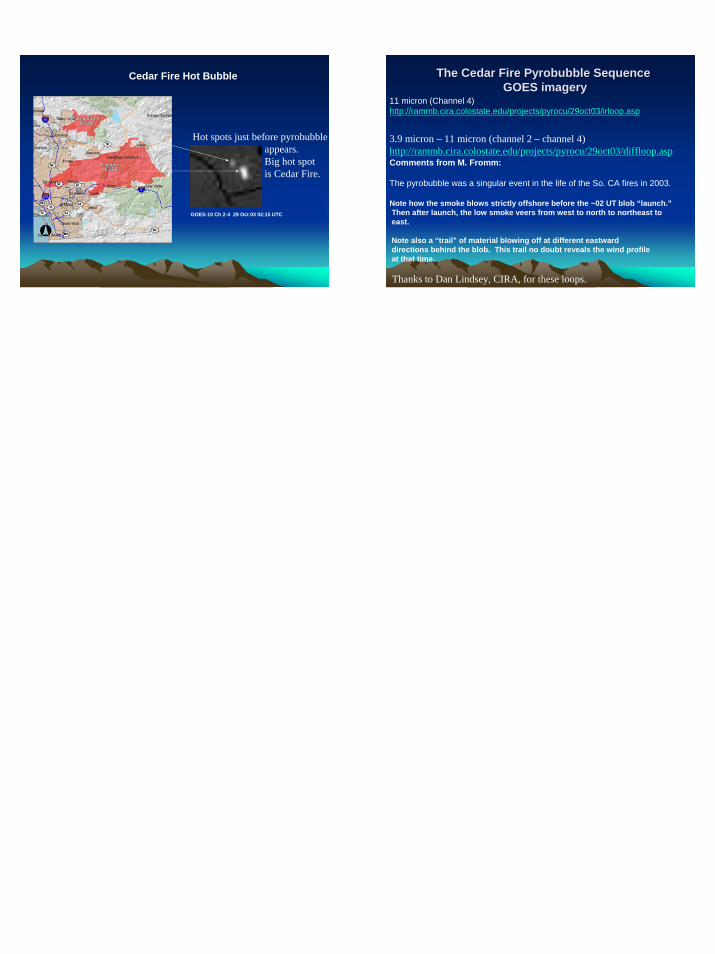
Cedar Fire Hot Bubble
Hot spots just before pyrobubbleappears.Big hot spotis Cedar Fire.
GOES-10 Ch 2-4 29 Oct 03 02:15 UTC
The Cedar Fire The Cedar Fire PyrobubblePyrobubble SequenceSequenceGOES imageryGOES imagery
11 micron (Channel 4)http://rammb.cira.colostate.edu/projects/pyrocu/29oct03/irloop.asp
3.9 micron – 11 micron (channel 2 – channel 4)http://rammb.cira.colostate.edu/projects/pyrocu/29oct03/diffloop.aspComments from M. Fromm:
The pyrobubble was a singular event in the life of the So. CA fires in 2003.
Note how the smoke blows strictly offshore before the ~02 UT blob “launch.”Then after launch, the low smoke veers from west to north to northeast toeast.
Note also a “trail” of material blowing off at different eastward directions behind the blob. This trail no doubt reveals the wind profileat that time.
Thanks to Dan Lindsey, CIRA, for these loops.