Embed Size (px)
Citation preview
FIRE SERVICE COMPREHENSIVE GROWTH PLAN
Minnesota
2018
25030 SW Parkway Avenue, Suite 330 Wilsonville, OR 97070
E-Mail: [email protected] • Corporate Office: 503.570.7778
City of Corcoran, MN Fire Service Comprehensive Growth Plan
i
TABLE OF CONTENTS
Acknowledgments ........................................................................................................................ iii
Evaluation of Current Conditions ................................................................................................... 1
Organizational Overview ................................................................................................................................. 1
Governance ................................................................................................................................................. 2
Organizational Design ................................................................................................................................. 5
Service Area and Infrastructure .................................................................................................................. 7
Budgets and Finance ................................................................................................................................... 9
Finance and Budget .................................................................................................................................. 11
Emergency Response Type and Frequency............................................................................................... 13
Management Components ........................................................................................................................... 14
Foundational Management Elements ...................................................................................................... 14
Management Documents and Processes.................................................................................................. 15
Record Keeping and Documentation ........................................................................................................ 17
Capital Assets and Capital Improvement Programs ...................................................................................... 20
Facilities .................................................................................................................................................... 21
Apparatus .................................................................................................................................................. 25
Staffing .......................................................................................................................................................... 27
Administrative and Support Staffing ......................................................................................................... 27
Emergency Response Staffing ................................................................................................................... 28
Fire and EMS Training Delivery ..................................................................................................................... 33
General Training Competencies ................................................................................................................ 33
Training Program Management and Administration ................................................................................ 35
Service Delivery and Performance ................................................................................................................ 38
Service Demand ........................................................................................................................................ 38
Future System Demand Projections ............................................................................................. 52
Population Growth and Community Risk ...................................................................................................... 52
Service Demand Projections ......................................................................................................................... 55

City of Corcoran, MN Fire Service Comprehensive Growth Plan
ii
Future Delivery System Models ................................................................................................... 57
Short and Mid-Term Strategies ..................................................................................................................... 57
Establishment of Response Standards and Targets .................................................................................. 57
Short Term Functional Improvements ...................................................................................................... 62
Potential Mid Term Improvements .......................................................................................................... 64
Future Fire Station Strategies and Alternatives ............................................................................................ 66
Potential Long-Term Strategies .................................................................................................................... 68
Potential Addition of a Third Fire Station in Rogers ................................................................................. 68
Potential Addition of a Fire Station in Corcoran ....................................................................................... 70
Hamel Fire Department ............................................................................................................................ 72
Maple Grove Fire Department .................................................................................................................. 73
Plymouth Fire Department ....................................................................................................................... 74
Analysis of Available Options ........................................................................................................................ 74
Option 1: Continue the Current Model ..................................................................................................... 75
Option 2: Construct an Additional Station and Continue to Contract with Surrounding Agencies .......... 75
Option 3: Construct a New Fire Station and Implement a City Fire Department ..................................... 79
Future Staffing .......................................................................................................................................... 80
Exploration of Regional Cooperation Opportunities ................................................................................ 81
Thresholds and Triggers—Determining When a New Station is Needed ..................................................... 82
Cost Projections ............................................................................................................................................ 84
Continuation of the Current Model—Cost Projections ............................................................................ 84
Multiple-Variable Allocation ..................................................................................................................... 90
Construct an Additional Station and Continue to Contract with Surrounding Agencies— Cost Projections
.................................................................................................................................................................. 91
Fire Station Costing Examples ....................................................................................................................... 92
Construct an Additional Station and Implement a City Fire Department—Cost Projections ................... 94
Summary of Cost Projections .................................................................................................................... 95
Moving Forward .......................................................................................................................... 96
Findings and Recommendations ................................................................................................................... 96
Implementation Planning .............................................................................................................................. 97
Conclusion ................................................................................................................................. 100
Appendices ................................................................................................................................ 101
Appendix A: Table of Figures ...................................................................................................................... 101

City of Corcoran, MN Fire Service Comprehensive Growth Plan
iii
ACKNOWLEDGMENTS
Emergency Services Consulting International (ESCI) would like to acknowledge and thank the assistance and
support of the City of Corcoran administrative staff and personnel of the participating fire departments,
without which this project could not have been successfully completed.
CITY COUNCIL
Ron Thomas, Mayor
Jonathan Bottema, Councilor
Brian Dejewski, Councilor
Mike Keefe, Councilor
Tonya LaFave, Councilor
AGENCY STAFF
Brad Martens, City Administrator
Matt Gottschalk, Director of Public Safety
Dave Malewicki, Fire Chief, City of Hanover
Jeff Leuer, Fire Chief, Loretto Fire Department
Brad Feist, Fire Chief, City of Rogers

City of Corcoran, MN Fire Service Comprehensive Growth Plan
1
EVALUATION OF CURRENT CONDITIONS
Emergency Services Consulting International (ESCI) was engaged by the City of Corcoran to provide a Fire
Service Comprehensive Growth Plan regarding the delivery of fire and emergency services within the city that
will assist the agency in future efforts and long-range planning. This report serves as the culmination of the
project and is configured in a matter that evaluates current conditions; projects future growth, development,
and service demands; and provides recommendations to maintain or enhance current service delivery in the
future.
Using organizational, operational, staffing, and geographic information system (GIS) models; this phase of the
study provides an evaluation of the current services delivered to the city. The evaluation and analysis of data
and other information is based on state laws and regulations, National Fire Protection Association (NFPA)
standards, Commission on Fire Accreditation International (CFAI)1 self-assessment criteria, health and safety
requirements, federal and state mandates relative to emergency services, and generally accepted best
practices within the emergency services community.
Each section in the following report provides the reader with general information about that element, as well
as observations and analyses of any significant issues or conditions that are pertinent. Observations are
supported by data provided by the fire departments providing services to the City of Corcoran and collected
as part of the data review and interview process.
The purpose of this section is two-fold. First, it verifies the accuracy of baseline information along with ESCI’s
understanding of the agency’s composition. This provides the foundation from which the Fire Service
Comprehensive Growth Plan is developed. Secondly, the overview serves as a reference for the reader who
may not be fully familiar with the details of the city or the contracted fire department’s operations. Where
appropriate, ESCI includes recommended modifications to current observations based on industry standards
and best practices.
Organizational Overview The Organizational Overview component provides a summary of the agency’s composition, discussing its
configuration and the services that it provides. Data provided by the City of Corcoran and the fire departments
providing contracted services, as well as both internal and external stakeholders, was combined with
information collected during ESCI’s fieldwork to develop the following overview.
Fire, emergency medical, and other emergency services in the City of Corcoran are provided via contract with
three area fire departments, rather than by the city itself. The City is served by the Rogers Fire Department,
the Hanover Fire Department, and the Loretto Fire Department. The following figure displays the study area
and the portions of the City of Corcoran that are served by the three fire departments.
1 The CFAI organization is now a subsection of the Center for Public Safety Excellence (CPSE) but maintains its prime function of accrediting fire agencies.

City of Corcoran, MN Fire Service Comprehensive Growth Plan
2
Figure 1: Corcoran Service Area Map
The service area consists of 36 square miles that constitute the city limits of Corcoran. The population served
consists of an estimated 5,500 in the city.
Governance
The very basis of any service provided by governmental or quasi-governmental agencies lies within the policies
that give that agency the responsibility and authority upon which to act. In most governmental agencies,
including the fire departments serving Corcoran, those policies lie within the charters, ordinances, and other
governing documents adopted by the agency. The following figure provides an overview of the fire
departments, and City of Corcoran’s governance and lines of authority elements.
City of Corcoran, MN Fire Service Comprehensive Growth Plan
3
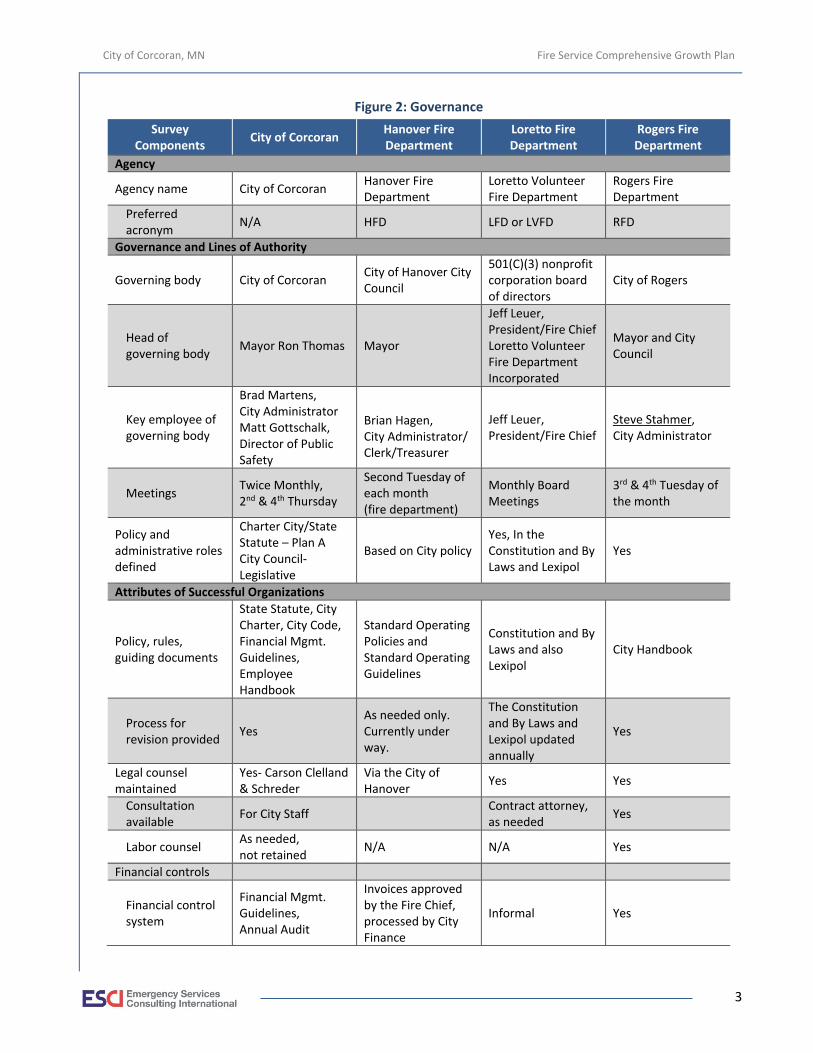
Figure 2: Governance
Survey Components
City of Corcoran Hanover Fire Department
Loretto Fire Department
Rogers Fire Department
Agency
Agency name City of Corcoran Hanover Fire Department
Loretto Volunteer Fire Department
Rogers Fire Department
Preferred acronym
N/A HFD LFD or LVFD RFD
Governance and Lines of Authority
Governing body City of Corcoran City of Hanover City Council
501(C)(3) nonprofit corporation board of directors
City of Rogers
Head of governing body
Mayor Ron Thomas Mayor
Jeff Leuer, President/Fire Chief Loretto Volunteer Fire Department Incorporated
Mayor and City Council
Key employee of governing body
Brad Martens, City Administrator Matt Gottschalk, Director of Public Safety
Brian Hagen, City Administrator/ Clerk/Treasurer
Jeff Leuer, President/Fire Chief
Steve Stahmer, City Administrator
Meetings Twice Monthly, 2nd & 4th Thursday
Second Tuesday of each month (fire department)
Monthly Board Meetings
3rd & 4th Tuesday of the month
Policy and administrative roles defined
Charter City/State Statute – Plan A City Council-Legislative
Based on City policy Yes, In the Constitution and By Laws and Lexipol
Yes
Attributes of Successful Organizations
Policy, rules, guiding documents
State Statute, City Charter, City Code, Financial Mgmt. Guidelines, Employee Handbook
Standard Operating Policies and Standard Operating Guidelines
Constitution and By Laws and also Lexipol
City Handbook
Process for revision provided
Yes As needed only. Currently under way.
The Constitution and By Laws and Lexipol updated annually
Yes
Legal counsel maintained
Yes- Carson Clelland & Schreder
Via the City of Hanover
Yes Yes
Consultation available
For City Staff Contract attorney, as needed
Yes
Labor counsel As needed, not retained
N/A N/A Yes
Financial controls
Financial control system
Financial Mgmt. Guidelines, Annual Audit
Invoices approved by the Fire Chief, processed by City Finance
Informal Yes
City of Corcoran, MN Fire Service Comprehensive Growth Plan
4
Survey Components
City of Corcoran Hanover Fire Department
Loretto Fire Department
Rogers Fire Department
Financial review
Annual Audit, Quarterly Performance Reports
Annual audit is performed by the city
Monthly Report to full department
Yes
Auditor Abdo, Eick & Meyers
Annual
Yes, Audit report completed each time the treasurer or Fire Chief changes
Yes
Frequency of review
Annual Audit, Quarterly by staff
Upon change of Chief or Treasurer
Annual
Governing body minutes maintained
Yes Yes Yes Yes
Availability of minutes
Last 2 yrs. Online, others by request
Available on line
Emailed to all members plus kept in a book in the fire station
City webpage
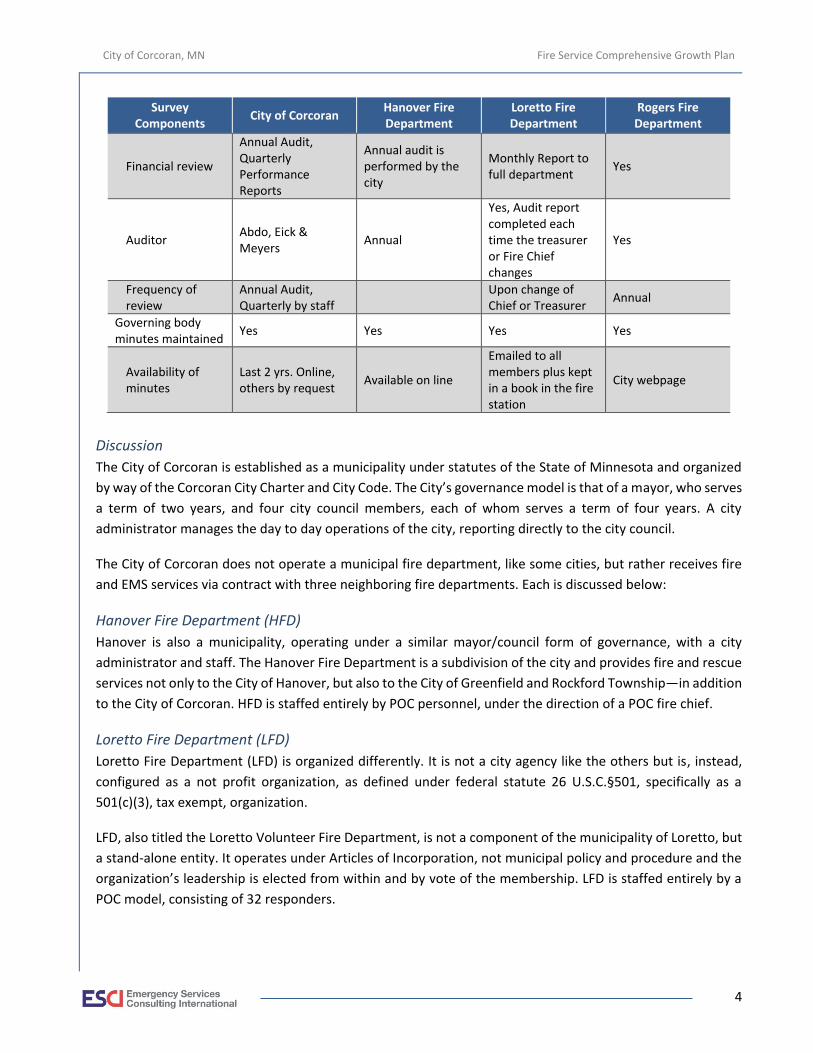
Discussion
The City of Corcoran is established as a municipality under statutes of the State of Minnesota and organized
by way of the Corcoran City Charter and City Code. The City’s governance model is that of a mayor, who serves
a term of two years, and four city council members, each of whom serves a term of four years. A city
administrator manages the day to day operations of the city, reporting directly to the city council.
The City of Corcoran does not operate a municipal fire department, like some cities, but rather receives fire
and EMS services via contract with three neighboring fire departments. Each is discussed below:
Hanover Fire Department (HFD)
Hanover is also a municipality, operating under a similar mayor/council form of governance, with a city
administrator and staff. The Hanover Fire Department is a subdivision of the city and provides fire and rescue
services not only to the City of Hanover, but also to the City of Greenfield and Rockford Township—in addition
to the City of Corcoran. HFD is staffed entirely by POC personnel, under the direction of a POC fire chief.
Loretto Fire Department (LFD)
Loretto Fire Department (LFD) is organized differently. It is not a city agency like the others but is, instead,
configured as a not profit organization, as defined under federal statute 26 U.S.C.§501, specifically as a
501(c)(3), tax exempt, organization.
LFD, also titled the Loretto Volunteer Fire Department, is not a component of the municipality of Loretto, but
a stand-alone entity. It operates under Articles of Incorporation, not municipal policy and procedure and the
organization’s leadership is elected from within and by vote of the membership. LFD is staffed entirely by a
POC model, consisting of 32 responders.
City of Corcoran, MN Fire Service Comprehensive Growth Plan
5
Rogers Fire Department (RFD)
RFD is a municipal subdivision of the City of Rogers. Rogers governance is configured in the same manner as
the City of Corcoran, with a mayor/council form of government. However, unlike Corcoran, Rogers operates
an all hazards fire and EMS department. A full-time fire chief manages the department, along with a full-time
fire inspector. Emergency response is provided by a combination of the two full-time personnel and 41 “Paid
On Call” (POC) first responders, staffing response vehicles from two fire stations.
Organizational Design
The structural design of an emergency services agency is vitally important to its ability to deliver service in an
efficient and timely manner while providing the necessary level of safety and security to the members of the
organization, whether career, paid-on-call, or volunteer. During an emergency, an individual’s ability to
supervise multiple personnel is diminished thus industry standards recommend a span of control of four to
six personnel under stressed situations. This is a recommendation carried forward from military history and
has shown to be effective in emergency service situations.
In addition, employees tend to be more efficient when they know to whom they report and have a single point
of contact for supervision and direction. A recent research project conducted by the Columbia University,
Northwestern University, and University of Queensland, Australia, found that,
…when there are tasks that require teamwork, people get more done when there are leaders and followers. Without a clear chain of command, members often become sidetracked with grabbing
power and lose track of the task at hand.2
The following figure summarizes the organizational design components of each of the study agencies:
2 “Why Hierarchies are Good for Productivity,” Inc. September 2012, p 26.

City of Corcoran, MN Fire Service Comprehensive Growth Plan
6
Figure 3: Organizational Design
Survey Components
City of Corcoran Hanover Fire Department
Loretto Fire Department
Rogers Fire Department
Organizational Structure
Structure type Mayor/Council- Administrator
Traditional top down hierarchy
Traditional top down hierarchy
Traditional top down hierarchy
Descriptions of all jobs maintained
Yes Yes Yes, for all positions Yes
Job descriptions updated
Yes In June, 2017 As needed; all are current
Yes
Employment agreements
Yes N/A N/A Yes
Chain of Command
Defined Chain of command
Council-City Administrator-Director of Public Safety
Yes, via organizational chart
Yes, via organizational chart
Yes, via organizational chart
Span of control
Public Safety Director oversees fire service contracts
The fire chief oversees all operational personnel
3:1 for administration and operations. Appropriate given existing staffing levels
Chief oversees one inspector and all 41 POC personnel
Hiring/Firing authority
Council Fire Chief
Final authority is with the board; Chief is a board member
Fire Chief
Formation and History
Organization formed
City, 1973 1931 1947 Incorporated in 1949
History maintained Yes Yes Yes No
Individual or group responsible
City Clerk Fire Chief Fire Chief N/A
Discussion
The City of Corcoran is configured as a municipality, operating under the direction of a city council and mayor.
A city administrator manages daily operations of the city government, assisted by a public safety director that
is responsible for law enforcement services as well as managing the contractual services provided by the fire
departments serving the city.
The fire departments in Rogers and Hanover are organized in a similar manner. A top-down hierarchical
organization is in place, as is typical of most fire departments. A fire chief is appointed by the city to manage
the fire department. The fire chief subsequently appoints subordinate positions, as needed, to accomplish the
mission of the agency.

City of Corcoran, MN Fire Service Comprehensive Growth Plan
7
Loretto Fire Department differs from the others as a 501(c)3 nonprofit corporation. Still, a top down
organizational chart is in place and causes the organization to operate essentially the same as the other two
fire departments. However, in this instance the fire chief does not report to a city administrator or city council,
but rather to the nonprofit corporation board of directors, of which the fire chief is also a member.
Service Area and Infrastructure
The size and composition of a fire department’s service area affects the type and number of personnel, fire
stations and vehicles that are needed to provide services efficiently. Sometimes complex decision need to be
made regarding the deployment strategies employed to properly position resources based on land area,
geography, risk and similar factors. Following is a summary of the agency service areas and service delivery
infrastructure resources.
Figure 4: Service Area and Infrastructure
Survey Components
City of Corcoran Hanover Fire Department
Loretto Fire Department
Rogers Fire Department
General Description of Agency
Agency type Municipal Municipal fire
department. Paid on call staffed.
501c3 Nonprofit Corporation
Loretto Volunteer Fire Department
Incorporated
Full time Chief, Fire Inspector, & 41 POC
Firefighters
Area, square miles +/- 36 36 33 44
Headquarters 8200 County Rd 116
Corcoran, MN 55340
1 – 369 Labeauxe Ave.
259 Medina Street PO Box 22
Loretto, MN 55357 Station 1
Fire stations None 1 1 2 (1 temporary)
Other facilities City Hall Campus, Public Works, Old
Public Works None 1 off-site office None
Population served 5,500 4,500 5,000 16,500
Service Delivery Infrastructure
Emergency vehicles N/A
Engines 2 3 3
Engine, reserve 0 0 0
Ladder truck 0 0 1
Ambulance 0 0 0
Ambulance, reserve
0 0 1
Quick response unit
0 2
Water tender 2 1 1
Brush 3 1 2
Rescue 1 1 1

City of Corcoran, MN Fire Service Comprehensive Growth Plan
8
Survey Components
City of Corcoran Hanover Fire Department
Loretto Fire Department
Rogers Fire Department
ISO rating
Current Classification
Tied to responding fire department
ratings 4/4X
4 in the City of Loretto, 4Y outside
the city 3/3Y
Date of last rating N/A October, 2016 2017 May of 2017
Staffing
Total fire department personnel
N/A 25 Paid On Call plus
POC Chief 32 Paid On Call
42 Paid On Call (POC) responders
1 chief, 1 fire inspector
Administrative and support personnel, full-time
N/A 0 0 2
Administrative and support personnel, part-time
N/A 0
1 fire chief @ 20% FTE,
4 POC assistant chief,
2 Admin. Asst. @ 30 hours/week
0
Operational personnel, full-time
N/A 0 0 0
Operational personnel, volunteer/POC
N/A 0 31 42
Operational personnel, POC
N/A 26 30 Paid On Call
members plus fire chief
42
Discussion
The boundaries of the City of Corcoran consist of a 36-square mile township, six miles by six miles. The city’s
current population is estimated to be 5,500, however the number is growing steadily. The areas served by the
contract fire departments extend beyond their respective cities, with Roger’s service area the largest at 44
square miles consisting of 16,500 population served. Hanover’s population of 4,500 is included in a service
area of 36 square miles, and Loretto Fire Department serves approximately 33 square miles that is home to
5,000 residents.
The following figure compares the three fire department’s numbers of fire stations, pumpers (fire engines),
and aerial ladder trucks.

City of Corcoran, MN Fire Service Comprehensive Growth Plan
9
Figure 5: Capital Asset Comparison
Discussion
The Rogers Fire Department operates out of a main fire station, but has also established a second, temporary
station that is planned to be replaced with a permanent facility. Plans for a third station, which would be in
proximity to the City of Corcoran’s northeastern border, are also in place, however a specific location and
anticipated date of construction have not been identified. The Hanover Fire Department operates from a
single facility, as does the Loretto Fire Department.
Rogers has three structural fire engines in service, as does Loretto Fire Department, while Hanover has two.
The only aerial ladder truck in the study area is operated by Rogers Fire Department.
It is important to note that each of the study fire agencies provides services to areas that extend beyond their
respective boundaries. Each department contracts for services to other cities, in the same manner that they
do with Corcoran. These additional service areas may have an impact on the availability of response units to
incidents in Corcoran, if they are otherwise committed to an emergency in another area. The matter will be
considered in the Service Delivery section of this report.
Budgets and Finance
No emergency services agency, whether municipal or non-profit corporation can survive without adequate
funding. This funding, which may come from a variety of sources such as ad valorem taxes, fundraisers,
donations, etc., forms the basis from which the agency is able to purchase the necessary equipment to fulfill
its mission. Without adequate funding that is also sustainable, an organization is destined for failure. In the
current economy, most communities are searching for ways in which to reduce expenditures while
maintaining levels of service. Simultaneously, emergency services organization are finding it increasingly
difficult to deliver the services that the community desires and are often asking for more funding to
adequately supply the expected levels of services.
2
3
11
2
0
1
3
00
1
1
2
2
3
3
4
Stations Pumpers Aerials
Rogers FD Hanover FD Loretto FD

City of Corcoran, MN Fire Service Comprehensive Growth Plan
10
The following is a summary of the three fire department’s revenues, operating budget, and debt. The
representations presented here illustrate total departmental budget including personnel, supplies/materials,
and capital expenditures, information that will be used in future analyses in this report.
Figure 6: Operating Budget and Financial Resources
Survey Components
City of Corcoran Hanover Fire Department
Loretto Fire Department
Rogers Fire Department
Designated fiscal year
Calendar year, January 1 to
December 31
Calendar year, January 1 to
December 31
Calendar year, January 1 to
December 31
Calendar year, January 1 to
December 31
Revised current year general operating fund budget, fire department
$298,700 $208,829
Operational Budget $327,400
Capital Outlay $100,000
Pension $55,000 Total Budget
$482,400
$601,839
General fund property tax, city levy
$3,716,165 (Levy w/ Debt)
$1,410,972 N/A 5,357,938
Levy rate (current year)
45.994% 49.50% N/A 38.308%
Bonds, fire department
None None None
$69,783 2011 Equipment
$71,400 Station (final year)
$58,000 2014 Equipment
Other tax levy, public safety
None None None None

City of Corcoran, MN Fire Service Comprehensive Growth Plan
11
Finance and Budget
Without adequate funding, no emergency services organization can fulfill its mission. The personnel, whether
career or volunteer, are compensated either through salary and benefits, or through per-call compensation
and volunteer pension programs. Apparatus are expensive pieces of specialized equipment that can cost as
much as $1.5 million and must be replaced periodically—as will be discussed in the next section of this report.
Facilities, which can cost upwards of several million dollars to construct, are necessary to house the apparatus
and provide housing and training for personnel. Although not replaced as often as apparatus, emergency
services facilities cannot be expected to last forever. This report section reviews the current funding provided
to the departments providing services to the City of Corcoran.
As already mentioned, the City of Corcoran is served by three predominantly volunteer fire departments:
Hanover VFD, Loretto VFD, and Rogers VFD. Based on information received from the City of Corcoran, funding
for fire protection and medical first response for fiscal year 2017 totaled $298,700 and $328,113 for fiscal year
2018; with $64,119 allocated to Hanover VFD, $110,000 allocated to Loretto VFD, and $153,994 allocated to
Rogers VFD. The following figure illustrates the Corcoran allocation to each of the department providing
services to the city as well as their estimated funding from all other sources.
Figure 7: Estimated Total Fire Department Funding (FY2018)
Based on a cost per household comparison, the City of Corcoran is significantly below state and national rates
as illustrated in the following figure.

City of Corcoran, MN Fire Service Comprehensive Growth Plan
12
Figure 8: Comparison of Cost of Fire Protection per Household
The preceding figure does not simply state that Corcoran is underpaying for fire protection. It must be
understood that the comparison, produced by the Minnesota Center for Fiscal Excellence, includes all forms
of fire departments such as full-time career, combination, and predominantly volunteer.3
A greater indicator of adequate funding is the level of service provided to the community and the community’s
satisfaction with that level of service. In short, if a community is willing to accept longer response times in
exchange for lower tax rates, then the burden has been shifted to the taxpayers. However, if the level of
service is not meeting the needs or desires of the community, it should be clearly communicated to them that
improving the level of service will, in turn, create additional funding needs that will most likely translate into
higher tax rates to support the system.
In most rural fire protection systems, longer response times have been acceptable but, as communities grow
and develop, and as populations move from more urban areas, their expectations may be drastically different
than what the community has typically accepted.
3 “How Does Minnesota Compare? State Rankings of State and Local Government Revenues and Spending.” For Fiscal Year 2015. September 2017. P. 22.

City of Corcoran, MN Fire Service Comprehensive Growth Plan
13
Emergency Response Type and Frequency
Rogers, Hanover, and Loretto Fire Departments respond to multiple requests for assistance from their
residents each year. As typically found, most incidents are emergency medical in nature. The department’s
emergency calls for 2016 are listed in the following figure.
Figure 9: Emergency Response Type and Frequency
Survey Components Hanover Fire Department Loretto Fire Department Rogers Fire Department
Fire 18 21 Incidents
Value of property exposed to fire, 2014
Data not provided $230,000 51
Value of property lost to fire, 2014
Data not recorded $126,000 $3.5 million
Rupture or explosion 1 0 $760,000
EMS/rescue 106 119 1
Number of EMS transports
0 0 163
Hazardous condition 10 8
Service call 3 19 37
Good intent call 29 23 23
False call 22 10 102
Severe weather 11 0 105
Other 0 0
Total 200 200 482
Discussion
Of the three, the Rogers Fire Department responds to the most incidents annually, totaling 482 in 2016, the
most recent period for which a complete year of data is available. Hanover and Loretto each recorded 200
responses during the year.

City of Corcoran, MN Fire Service Comprehensive Growth Plan
14
Management Components Effective fire department management is a common challenge for fire service leaders. Today’s fire department
must address management complexities that include an effective organizational structure, adequacy of
response, maintenance of competencies, a qualified work force, and financial sustainability for the future.
To be effective, the management of a fire department needs to be based on a number of components. The
initial elements have been accomplished by the agency, completing a Strategic Plan that has institutionalized
the organization’s mission, vision, and values. This process needs to be continually built upon to ensure that
essential foundational elements such as policy and operational documents, development of internal and
external communication practices, recordkeeping, and sustainable financial practices are implemented and
maintained.
In the following report section, ESCI examines the city’s and the three fire departments’ current efforts to
manage the organization and identifies measures and best practices ESCI is recommending for the future.
Foundational Management Elements
The development of baseline management components in an organization enables it to move forward in an
organized and effective manner. In the absence of foundational management elements, the organization will
tend to operate in a random and generally ineffective manner. The following figure reviews the departments’
baseline management components.
Figure 10: Foundational Elements
Survey Components
City of Corcoran Hanover Fire Department
Loretto Fire Department
Rogers Fire Department
Mission, Vision, Strategic Planning, Goals, and Objectives
Mission statement adopted
Yes Yes Yes Yes
Displayed Yes Yes In bylaws only –
every member has a copy
Yes
Periodic review Yes No Annual, as a part of
annual bylaws Review
Annually
Vision established and communicated
Yes No No Yes
Values of staff established
Yes No No Yes
Strategic or master plan
Yes None No No formal
Strategic Plan
Adopted by elected officials
Yes N/A N/A Yes
Published and available
Yes N/A N/A Yes
Periodic review Yes N/A N/A Annually

City of Corcoran, MN Fire Service Comprehensive Growth Plan
15
Survey Components
City of Corcoran Hanover Fire Department
Loretto Fire Department
Rogers Fire Department
Agency goals and objectives established
Yes Informally only Yes Yes
Date developed Annually N/A
Annually by the board and as a part
of budget development
process, but no published document
Annually
Periodic review Yes N/A Annual Yes
Tied to division/personnel performance statements/plans
Yes N/A No No
Objectives linked to programs
In Progress No N/A
Performance objectives established
Yes
Individual performance
evaluations are being implemented
No N/A
Code of ethics established
City Handbook Yes, included in policy manual
Yes Yes
Discussion
All the agencies involved in this report have developed a Mission Statement, commendably, and Rogers Fire
Department has developed statements of Vision and Core Values. However, of the three fire departments,
none have undertaken a process of fully developing a Strategic Plan.
A Strategic Plan sets a course of direction for an organization, stating its reason for existence and declaring
priorities, goals, and plans for moving ahead. Doing so requires a facilitated process of guiding a working group
though the process, resulting in a three-to-five-year road map for the organization. It is recommended that
each of the fire departments undertake a Strategic Planning process and, further, that consideration be given
to doing so collaboratively to establish a plan specifically for the delivery of services in Corcoran.
Management Documents and Processes
Similarly, an organization should establish appropriate documentation, policies, procedures, and
identification of internal and external issues that affect the agency. Processes must also be established to
address the flow of information and communication within the fire department as well as with its constituents.

City of Corcoran, MN Fire Service Comprehensive Growth Plan
16
Figure 11: Foundational Documents and Processes
Survey Components Hanover Fire Department
Loretto Fire Department
Rogers Fire Department
Availability of SOPs, Rules and Regulations, Policies
Copies of rules provided Standard Operating
Policies and Standard Operating Guidelines
Yes Yes
Last date reviewed Currently under review 2016 January 2015
Copies of SOGs or guidelines available
Yes Yes Yes
Regular update Currently under review Annually Yes
Process for development of new SOGs
Not defined Yes, chiefs do as time
allows Not defined
SOGs used in training evolutions
Yes Yes Yes
Policy manual available Yes, in the form of a Standard Operating
Policy manual Yes Yes
Reviewed for consistency
Currently under review Yes Yes
Reviewed for legal mandates
Currently under review Yes Yes
Training on policies provided
Yes Yes Yes
Critical Issues
Has the agency identified critical issues?
Informally only Informally only Yes
First critical issue Budgeting and financing
equipment needs Funding Daytime response
Second critical issue Keeping an adequate
number of responders POC numbers Retention
Third critical issue
Inability to plan due to not knowing if the
contract with Corcoran will continue. Uncertainty.
Not provided Response Time
Internal Communications
Regularly scheduled staff meetings (fire department)
Yes
501c3 Board Meetings Monthly
Quarterly Officers Meeting.
Yes
Written staff meeting minutes
Yes Yes No
Memos Yes Yes Yes
Member newsletter No No No
Member forums No No Yes
Open door policy Yes Yes Yes

City of Corcoran, MN Fire Service Comprehensive Growth Plan
17
Discussion
The departments, as Paid On Call staffed organizations, by necessity and mission, function in a paramilitary
manner. Consistent service delivery is dependent on standardized rules, regulations, and policies that guide
appropriate behavior and accountability. These guiding documents are vital for success in training at all levels
and meeting the expectations of the citizens served by the City of Corcoran and the citizens outside of the city
served by the study fire departments.
All three fire departments have developed operating procedures to varying degrees. Loretto updated their
manual in 2016; and Rogers in 2015. Hanover indicated that theirs were currently under review and those
that were observed were found to be dated. Further, well developed practices for the review and update of
operating guidelines was not articulated by the agencies.
ESCI advises that all three agencies prioritize the development, annual review, and updating of operating
guidelines within their organizations. Further, ESCI finds that one of the most valuable undertakings that could
be pursued in the interest of enhanced service delivery in Corcoran, as well as the entire area served by the
three fire departments would be to jointly develop shared, consistent Standard Operating Guidelines to be
used by all three agencies. Doing so would standardize the ways in which emergencies are managed, avoid
conflicts resulting from differing practices, increase firefighter safety, and substantially enhance the delivery
and consistence of fire and EMS services.
Critical Issues
Each agency was asked to identify critical issues facing their organization. The responses were similar between
all three, generally consisting of concerns with financial stability, uncertainty regarding service contracts and,
consistently, the need to recruit and retain qualified responders. Each agency identified shared concerns and
needs that are common to all.
Commonly shared critical issues not only impact the participating fire agencies, but resultantly affect the City
of Corcoran, as well. The common challenges suggest opportunities for the fire departments to share
resources and work more closely together to improve the efficiency of service delivery regionally. The subject
is beyond the scope of this study, but will be re-visited later in the report in future strategy discussions.
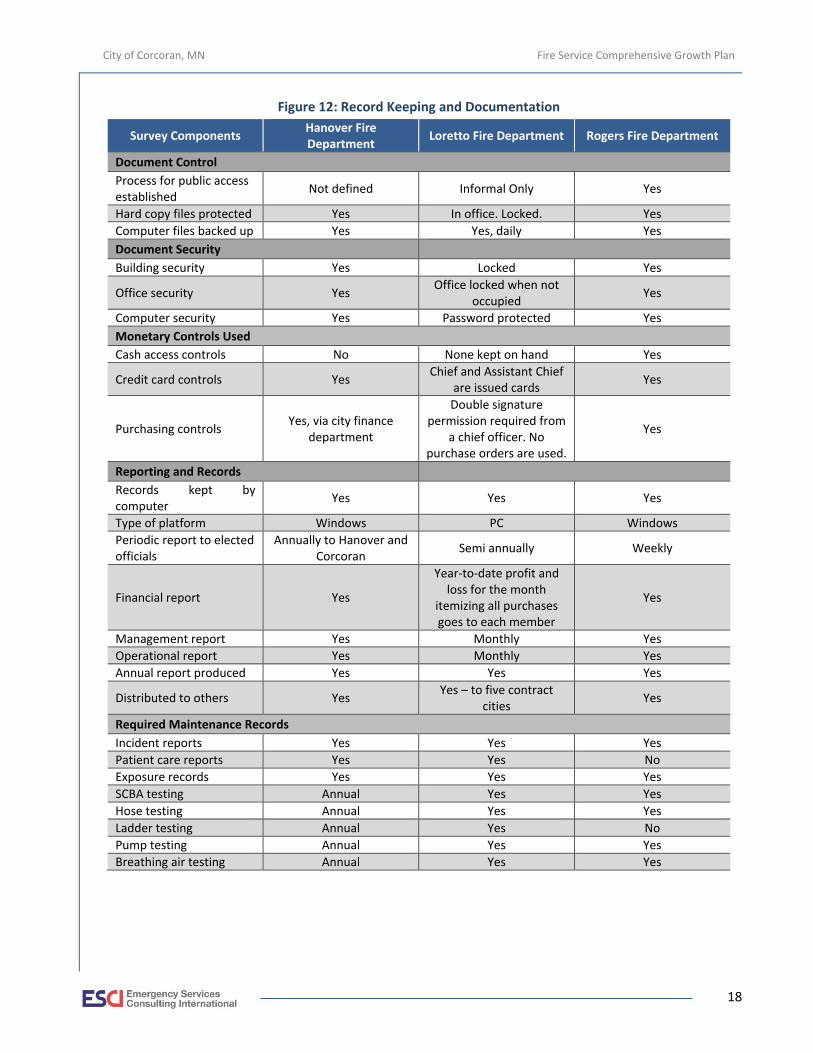
Record Keeping and Documentation
In any organization, documentation of activities is of paramount concern. The following figure reviews the
practices that are in place in the study agencies.
City of Corcoran, MN Fire Service Comprehensive Growth Plan
18
Figure 12: Record Keeping and Documentation
Survey Components Hanover Fire Department
Loretto Fire Department Rogers Fire Department
Document Control
Process for public access established
Not defined Informal Only Yes
Hard copy files protected Yes In office. Locked. Yes
Computer files backed up Yes Yes, daily Yes
Document Security
Building security Yes Locked Yes
Office security Yes Office locked when not
occupied Yes
Computer security Yes Password protected Yes
Monetary Controls Used
Cash access controls No None kept on hand Yes
Credit card controls Yes Chief and Assistant Chief
are issued cards Yes
Purchasing controls Yes, via city finance
department
Double signature permission required from
a chief officer. No purchase orders are used.
Yes
Reporting and Records
Records kept by computer
Yes Yes Yes
Type of platform Windows PC Windows
Periodic report to elected officials
Annually to Hanover and Corcoran
Semi annually Weekly
Financial report Yes
Year-to-date profit and loss for the month
itemizing all purchases goes to each member
Yes
Management report Yes Monthly Yes
Operational report Yes Monthly Yes
Annual report produced Yes Yes Yes
Distributed to others Yes Yes – to five contract
cities Yes
Required Maintenance Records
Incident reports Yes Yes Yes
Patient care reports Yes Yes No
Exposure records Yes Yes Yes
SCBA testing Annual Yes Yes
Hose testing Annual Yes Yes
Ladder testing Annual Yes No
Pump testing Annual Yes Yes
Breathing air testing Annual Yes Yes

City of Corcoran, MN Fire Service Comprehensive Growth Plan
19
Discussion
Practices for securing and controlling documentation are in place in all three organizations and, generally, are
consistent with best practices. HFD indicated that they do not have procedures in place for cash access and,
if the agency handles petty cash, tracking should be established. Other appropriate controls are in place in the
two city fire departments via their respective city protocols. As a non-profit corporation, LFD has set its own
document and financial procedures.
Record keeping and reporting of agency activities is appropriately undertaken by all three agencies. Each
report activities to the communities that they serve on a routine basis and reporting is provided in a
transparent manner. Reporting of testing practices that are generally accepted as industry standards is
completed by all three agencies. It is noted that HFD conducts appropriate annual testing of equipment, with
the exception of ground ladder testing, which is recommended.

City of Corcoran, MN Fire Service Comprehensive Growth Plan
20
Capital Assets and Capital Improvement Programs Regardless of an emergency service agency’s financing, if appropriate capital equipment is not available for
the use by responders, it is impossible for a fire department to deliver services effectively. Two primary capital
assets that are essential to the provision of emergency response are facilities and apparatus (response
vehicles).
The study agencies maintain a balance of three basic resources that are needed to carry out its emergency
mission: People, equipment, and facilities. Because firefighting is an extremely physical pursuit, the adequacy
of personnel resources is a primary concern; but no matter how competent or numerous the firefighters are,
the department will fail to execute its mission if it lacks sufficient fire apparatus distributed in an efficient
manner.
Of the three study area fire departments, four fire stations are incorporated into the service delivery model.
Rogers Fire Department operating two, and Hanover and Loretto each responding from one facility.
The agencies’ capital assets are again summarized in the following figure:
Figure 13: Capital Asset Comparison
2
3
11
2
0
1
3
00
1
1
2
2
3
3
4
Stations Pumpers Aerials
Rogers FD Hanover FD Loretto FD

City of Corcoran, MN Fire Service Comprehensive Growth Plan
21
Facilities
Appropriately designed and maintained facilities are critical to a fire department’s ability to provide services
in a timely manner and with appropriate deployment of assets. ESCI observed and reviewed the fire stations
operated by three fire agencies. The findings are summarized in the following pages and any areas of concern
observed are identified.
Figure 14: Hanover Fire Station
Hanover’s station is the departments only fire station, and also houses its administrative offices. The station was constructed in 2015 and is in excellent condition. The facility includes four, back in, double-depth apparatus bays along with offices and a large training room. There are no 24-hour crew quarters in this station.
SURVEY COMPONENT OBSERVATIONS
STRUCTURE
Physical address 369 Labeauxe Avenue. Hanover, MN
Construction type Masonry and steel frame, steel clad walls and roof
Date of construction 1994
Seismic protection/energy audits When originally designed
Auxiliary power None
Condition Excellent
Special considerations (ADA, mixed gender appropriate, storage, etc.)
Adequate storage, ADA accessible, dual gender appropriate. Apparatus bay space is maximized.
Square footage Approximately 6,400
FACILITIES AVAILABLE
Exercise/workout Some fitness equipment is in the apparatus bay mezzanine
Kitchen/dormitory A small kitchen is adjacent to the training room
Lockers/showers Yes
Training/meetings A large training/meeting room seats approximately 50
Washer/dryer Yes
SAFETY AND SECURITY
Sprinkler system None
Smoke detection Present
Security Doors have combination locks
Apparatus exhaust system None
Units/staffing levels assigned Apparatus list follows. All units are staffed via Paid On Call responders.

City of Corcoran, MN Fire Service Comprehensive Growth Plan
22
Figure 15: Loretto Fire Station
Loretto operates out of one station, which also includes some of the administrative offices. Additional office space is located in an off-site space. The station was constructed in 1980 and, while in fair condition, the space is fully maximized. The facility includes five, back-in apparatus bays, which are barely adequate in depth. There are no 24-hour crew quarters in this station.
SURVEY COMPONENT OBSERVATIONS
STRUCTURE
Physical address 259 Medina Street North
Construction type Masonry
Date of construction 1980
Seismic protection/energy audits None
Auxiliary power None
Condition Fair
Special considerations (ADA, mixed gender appropriate, storage, etc.)
Not ADA compliant. Apparatus bays are crowded, and storage is limited. There is no room for future expansion.
Square footage 5,000
FACILITIES AVAILABLE
Exercise/workout None
Kitchen/dormitory None
Lockers/showers None
Training/meetings A good-sized training and meeting area is located on the second floor, but in a space shared with the city of Loretto.
Washer/dryer Turnout gear extraction machine is present. There is no dryer.
SAFETY AND SECURITY
Sprinkler system None
Smoke detection Yes
Security Doors have combination locks
Apparatus exhaust system Yes
Units/staffing levels assigned Apparatus list follows. All units are staffed via Paid On Call responders.

City of Corcoran, MN Fire Service Comprehensive Growth Plan
23
Figure 16: Rogers Station 1
Rogers Station 1 is the department’s main station, as well as home to the administrative offices. It is a modern facility consisting of six apparatus bays, offices, and a large training room. Built in 1997, the station is in excellent condition and will continue to serve the department well for many years.
SURVEY COMPONENT OBSERVATIONS
STRUCTURE
Physical address 21201 Memorial Drive
Construction type Concrete block & brick
Date of construction 1997
Seismic protection/energy audits When originally designed
Auxiliary power Yes
Condition Excellent
Special considerations (ADA, mixed gender appropriate, storage, etc.)
Yes
Square footage 12,850 Sq. Ft.
FACILITIES AVAILABLE
Exercise/workout Yes
Kitchen/dormitory Yes
Lockers/showers Yes
Training/meetings Yes
Washer/dryer Yes
SAFETY AND SECURITY
Sprinkler system Yes
Smoke detection Heat detection
Security Yes
Apparatus exhaust system No
Units/staffing levels assigned Apparatus list follows. Staffing is via two 40 hour/week personnel, all other units are staffed via Paid On Call members.

City of Corcoran, MN Fire Service Comprehensive Growth Plan
24
Figure 17: Rogers Station 2
Rogers Station 2 is a temporary facility for housing fire units in anticipation of construction of a new fire station. It is located in a bay that is a portion of the city’s public works facility and consists of a single, double-width bay that houses an engine and a small rescue vehicle. There are no quarters, kitchen, or other staff facilities and there is no storage space provided.
SURVEY COMPONENT OBSERVATIONS
STRUCTURE
Physical address 22350 South Diamond Lake Road (Temporary Location)
Construction type Concrete Panels (Public Works building)
Date of construction 2005
Seismic protection/energy audits Yes
Auxiliary power Yes
Condition Excellent
Special considerations (ADA, mixed gender appropriate, storage, etc.)
No storage area – No space for additional apparatus
Square footage 1,530 Sq. Ft.
FACILITIES AVAILABLE
Exercise/workout No
Kitchen/dormitory No
Lockers/showers No
Training/meetings No
Washer/dryer No
SAFETY AND SECURITY
Sprinkler system Yes
Smoke detection Smoke & heat detection
Security Yes
Apparatus exhaust system No
Units/staffing levels assigned Apparatus list follows; N/A
City of Corcoran, MN Fire Service Comprehensive Growth Plan
25
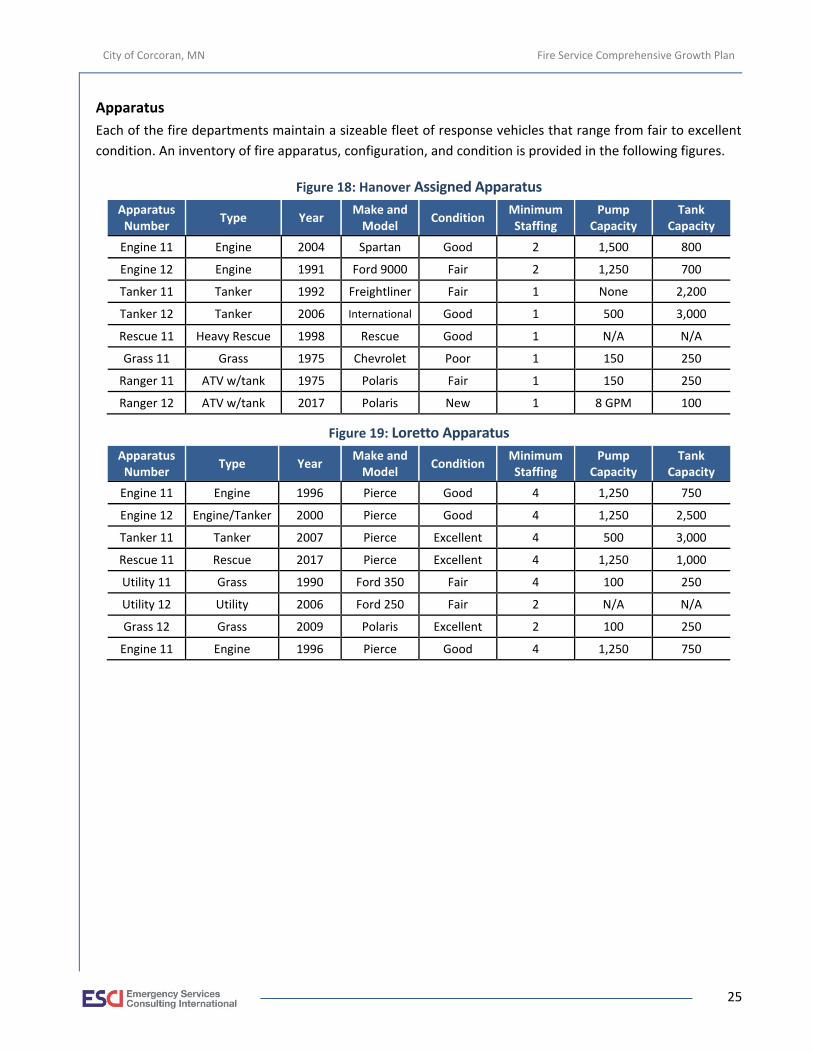
Apparatus
Each of the fire departments maintain a sizeable fleet of response vehicles that range from fair to excellent
condition. An inventory of fire apparatus, configuration, and condition is provided in the following figures.
Figure 18: Hanover Assigned Apparatus
Apparatus Number
Type Year Make and
Model Condition
Minimum Staffing
Pump Capacity
Tank Capacity
Engine 11 Engine 2004 Spartan Good 2 1,500 800
Engine 12 Engine 1991 Ford 9000 Fair 2 1,250 700
Tanker 11 Tanker 1992 Freightliner Fair 1 None 2,200
Tanker 12 Tanker 2006 International Good 1 500 3,000
Rescue 11 Heavy Rescue 1998 Rescue Good 1 N/A N/A
Grass 11 Grass 1975 Chevrolet Poor 1 150 250
Ranger 11 ATV w/tank 1975 Polaris Fair 1 150 250
Ranger 12 ATV w/tank 2017 Polaris New 1 8 GPM 100
Figure 19: Loretto Apparatus
Apparatus Number
Type Year Make and
Model Condition
Minimum Staffing
Pump Capacity
Tank Capacity
Engine 11 Engine 1996 Pierce Good 4 1,250 750
Engine 12 Engine/Tanker 2000 Pierce Good 4 1,250 2,500
Tanker 11 Tanker 2007 Pierce Excellent 4 500 3,000
Rescue 11 Rescue 2017 Pierce Excellent 4 1,250 1,000
Utility 11 Grass 1990 Ford 350 Fair 4 100 250
Utility 12 Utility 2006 Ford 250 Fair 2 N/A N/A
Grass 12 Grass 2009 Polaris Excellent 2 100 250
Engine 11 Engine 1996 Pierce Good 4 1,250 750

City of Corcoran, MN Fire Service Comprehensive Growth Plan
26
Figure 20: Rogers Station 1 Apparatus
Apparatus Number
Type Year Make and
Model Condition
Minimum Staffing
Pump Capacity
Tank Capacity
E11 Engine 2006 Pierce Excellent 5 2,000 750
E12 Engine 1996 Custom
Fire Fair 5 1,250 1,000
A11 Aerial
(Platform) 2001 Pierce Excellent 5 2,000 300
R11 Rescue 2011 GMC 2500 Excellent 4 N/A N/A
R12 Heavy
Rescue/IC 2014 Pierce Excellent 5 N/A N/A
G11 Grass Rig 2000 Ford F350 Good 2 18 HP 300
G12 (ATV) ATV 2016 John Deere Excellent 2 5.5 HP 70
LSU Rehab Trailer
2004 Pace Good N/A N/A N/A
T11 Tanker 1990 Ford L9000 Fair 2 N/A 3,500
Figure 21: Rogers Station 2 Apparatus
Apparatus Number
Type Year Make and
Model Condition
Minimum Staffing
Pump Capacity
Tank Capacity
Engine 21 Engine 2011 Pierce Excellent 5 2,000 1000
Rescue 21 Rescue 2005 GMC Yukon Good 5 N/A N/A
Discussion
ESCI observed the three departments’ vehicles to be well maintained and in good to excellent condition
generally. The apparatus operated by the agencies is similar in terms of design, water tank capacity, and fire
pumping capability. The departments are able to operate on an emergency scene without issues of
incompatible fire hose fittings or inadequate apparatus capabilities between one agency and another.
Long range capital replacement planning is always a challenge, and one that the fire departments appear to
have addressed adequately. Of note is the Hanover Fire Department which ESCI observed to have a fleet of
good quality apparatus and for which the department reports that they have no debt, having fully paid for all
apparatus when it was purchased.
The City of Rogers reports that a comprehensive Capital Improvement Plan (CIP) is in place. The CIP
accommodates the purchase of high cost equipment including fire apparatus, as well as equipment and future
facility construction. Major capital expenses are financed via bonded debt under the plan and may be
supplemented with pull tab or other revenue.
Loretto Fire Department has been able to maintain a high-quality fleet of apparatus, as well. When on-site for
field work, LFD had just taken delivery of a new fire engine and the balance of their equipment was all found
to be in good and excellent condition.

City of Corcoran, MN Fire Service Comprehensive Growth Plan
27
Staffing Personnel resources serve as the backbone of any emergency service provider and the study departments are
no exception. Regardless of the deployment of stations or the availability of vehicles and apparatus, people
are the resource that place these other items into action, fulfilling the mission of the organization.
Typically, today’s emergency service agencies are configured as a combination of career (paid full-time), part-
time, paid-on-call, and volunteer personnel. Decisions regarding which staffing methodologies an agency
utilizes are dependent upon several factors, including availability of paid-on-call or volunteer personnel,
service demand, population density, socioeconomics and demographics of the community, and financial
resources. This section of the report evaluates the study agencies’ personnel resources including
administrative staffing, and operational staffing and performance.
Administrative and Support Staffing
One of the primary responsibilities of a fire department’s administration is to ensure that the operational
segment of the organization has the ability and means to respond to and mitigate emergencies in a safe and
efficient manner. An effective administration and support services system is critical to the success of a fire
agency.
Figure 22: Administrative and Support Staffing
Survey Components Hanover Fire Department Loretto Fire Department Rogers Fire Department
Administration and Other Support Staff
Fire Chief 1 1 1, full-time (Fire Marshal & Emergency Manager)
Assistant Chief 1 4
Training 1 Training Officer 1
EMS Coordinator Captain 4 1
Fire Prevention Captain 1 0 1 Fire Inspector, full-time
Administrative Assistant None 2 None
Total administrative & support staff
1 Chief, others are primarily responders with additional assigned duties
1 Chief, others are primarily responders with additional assigned duties
2
Percent administrative & support to total department personnel
4% 4% 4%
Discussion
In career organizations, administrative personnel often are not included in operations totals as they serve
functions other than scene response. In combination departments, however, these staff are commonly both
administrative and operational; serving many times as the primary responders during daytime hours. For the
purposes of illustration, administrative personnel are separated here in an effort to display how the
departments operate similarly.

City of Corcoran, MN Fire Service Comprehensive Growth Plan
28
Figure 23: Administrative and Support Staff
Hanover Loretto Rogers
Chief 1 1 1
Assistant Chief 0 4 0
Inspector 0 0 1
Administrative Assistant 0 2 0
Total 1 7 2
As mentioned previously, the personnel identified in the preceding figure as administrative and support staff
also serve operational roles. The next figure identifies those within each organization that do not have
administrative and support roles.
Figure 24: Operational Staff
Hanover Loretto Rogers
Paid-on-Call Responder 26 30 40
Emergency Response Staffing
It takes an adequate and properly trained staff of emergency responders to put the appropriate emergency
apparatus and equipment to its best use in mitigating incidents. Insufficient staffing at an operational scene
decreases the effectiveness of the response and increases the risk of injury to all individuals involved.
Tasks that must be performed at a fire can be broken down into two key components—life safety and fire
flow. Life safety tasks are based on the number of building occupants, and their location, status, and ability to
take self-preservation action. Life safety related tasks involve search, rescue, and evacuation of victims. The
fire flow component involves delivering sufficient water to extinguish the fire and create an environment
within the building that allows entry by firefighters.
The number and types of tasks needing simultaneous action will dictate the minimum number of firefighters
required to combat different types of fires. In the absence of adequate personnel to perform concurrent
action, the command officer must prioritize the tasks and complete some in chronological order, rather than
concurrently. These tasks include:
• Command
• Scene safety
• Search and rescue
• Fire attack
• Water supply
• Pump operation
• Ventilation
• Back-up/rapid intervention

City of Corcoran, MN Fire Service Comprehensive Growth Plan
29
The first 15 minutes is the most crucial period in the suppression of a fire. How effectively and efficiently
firefighters perform during this period has a significant impact on the overall outcome of the event. This
general concept is applicable to fire, rescue, and medical situations. Critical tasks must be conducted in a
timely manner in order to control a fire or treat a patient. The fire chiefs are responsible for assuring that
responding companies are capable of performing all of the described tasks in a prompt, efficient, and safe
manner. The following figure lists the department’s emergency response staffing configuration.
Figure 25: Emergency Response Staffing
Survey Components Hanover Fire Department Loretto Fire Department Rogers Fire Department
Emergency Service Staff
Station or Assistant Chief 1 4 2, Paid On Call
Captain 4 7 4 positions (POC)
Lieutenant 2 1 4 positions (POC)
Firefighter/EMT – career 0 0 0
Firefighter/EMT – volunteer/POC
18 17 41
Use of Career and Volunteer Personnel
Career scheduling methodology
N/A N/A 40-hour work week
for full-time
Length of normal duty period
N/A N/A 8-hour day
FLSA period, if applicable
N/A N/A N/A
Residency requirements
N/A N/A Yes
Wage for hours worked
N/A N/A Yes
Operational Services Provided
Fire suppression Yes Yes Yes
EMS/rescue, first response
Yes Yes Yes
EMS, advanced life support
No No No
Specialized rescue Trench, silo rescue, swift water rescue
No Yes
Fire prevention inspections
Yes, accompanies contract inspector
No Yes
Emergency management Yes No Yes
Public education Yes No Yes
Hazardous materials response (level)
Operations level Operations level Operations level

City of Corcoran, MN Fire Service Comprehensive Growth Plan
30
Discussion
Although the preceding figure illustrates total numbers of operational personnel and, when combined with
the administrative and support staff, provides a number of total staff for each department, it does little in the
way of evaluating how the departments are staffed in comparison to others throughout the nation and region
or how many personnel they are each able to generate for sufficient incident response. The following three
figures illustrate how each department compares to others serving similar population sizes in regard to total
personnel per 1,000 population.
Figure 26: Comparison of Hanover VFD Personnel per 1,000 Population
Based on this comparison, Hanover VFD is trending slightly behind other departments throughout the
Midwest and the nation serving similar populations.
Figure 27: Comparison of Loretto VFD Personnel per 1,000 Population

City of Corcoran, MN Fire Service Comprehensive Growth Plan
31
In contrast to Hanover, Loretto VFD is doing very well in the number of total personnel when compared to
departments serving similar populations across the Midwest and the nation.
Figure 28: Comparison of Rogers VFD Personnel per 1,000 Population
Although not as high as Loretto, Rogers VFD is also doing well regarding the comparison of personnel to other
departments.
These comparisons, however, do not necessarily translate into the ability to generate sufficient personnel for
incident response. It is common for volunteer organizations to have a roughly 10 to 20 percent active
participation rate. The following figure illustrates each department’s ability to generate its own personnel for
structure fire response—incidents that require the most personnel—and does not include personnel from
mutual and automatic aid departments.

City of Corcoran, MN Fire Service Comprehensive Growth Plan
32
Figure 29: Average Structure Fire Staffing
Based on this analysis of 2015 and 2016 national fire incident reporting system (NFIRS) structure fire data
obtained from the Federal Emergency Management Agency (FEMA) for the individual study departments,
Loretto and Rogers Fire Departments are able to generate sufficient personnel independently while Hanover
is more reliant on mutual and automatic aid. This is not necessarily a negative point as long as the department
can rely on mutual and automatic aid departments to supplement their internal staff for fire incidents.

City of Corcoran, MN Fire Service Comprehensive Growth Plan
33
Fire and EMS Training Delivery Providing safe and effective fire and emergency services requires a well-trained workforce. Training and
education of personnel are critical functions for each study agency. Without quality, comprehensive training
programs, emergency outcomes are compromised, and emergency personnel are at risk.
One of the most important jobs in any department is the thorough training of personnel. The personnel
have the right to demand good training and the department has the obligation to provide it.4
Initial training of newly hired firefighters is essential, requiring a structured recruit training and testing
process. Beyond introductory training, personnel need to be actively engaged on a regular basis and tested
regularly to ensure skills and knowledge are maintained. To accomplish this task, agencies must either have a
sufficient number of instructors within their own organization or be able to tap those resources elsewhere.
Training sessions should be formal and follow a prescribed lesson plan that meets specific objectives. In
addition, a safety officer should be dedicated to all training sessions that involve manipulative exercises.
In the following pages, ESCI reviews the training practices in the three study agencies, compares them to
national standards and best practices, and recommends modifications, where deemed appropriate.
General Training Competencies
For training to be fully effective, it should be based on established standards. There are a variety of sources
for training standards. All three departments use the National Fire Protection Association (NFPA) and
International Fire Service Training Association (IFSTA) and Minnesota State established training standards as
the basis for their fire suppression training practices, and national Emergency Medical Services standards are
used as the baseline for medical training coursework.
4 Robert Klinoff, Introduction to Fire Protection, Delmar Publishers: New York, NY, 1997.

City of Corcoran, MN Fire Service Comprehensive Growth Plan
34
Figure 30: General Training Competencies
Survey Components Hanover Fire Department Loretto Fire Department Rogers Fire Department
General Training Competency
Incident command system Yes Yes Yes
Accountability procedures Yes, via par tags Yes Yes – fireground
operations
Policy and procedures Yes Yes Yes
Safety procedures Yes Yes Yes – City Safety
Committee
Recruit training Yes Mentor program Yes
Special rescue (high angle, confined space, etc.)
Limited Confined Space, Awareness level
Yes
Hazardous materials Operations Level Operations Level Operations Level
Wildland firefighting Yes Yes, Basic only Yes
Vehicle extrication Yes Yes Yes
Defensive driving Yes
In-house and outside instructors based on Emergency Vehicle Operations Course
(EVOC)
Yes
Use and care of small tools Yes Yes Yes
Radio communications & dispatch protocol?
Yes Yes Yes
EMS skills and protocol Yes EMT Basic and EMR
continuing education Yes
Discussion
A review of the general training competencies that are included in the fire departments’ fire-related training
program reveals that the necessary baseline subject areas are addressed by the training officers. Following is
additional discussion related to the training program’s foundational configuration.

City of Corcoran, MN Fire Service Comprehensive Growth Plan
35
Training Program Management and Administration
To function effectively, a training program needs to be managed. Administrative program support is
important, though often weakly addressed. An additional element of effective administration is the
development of program guidance in the form of training planning, goals, and defined objectives.
The next figure reviews the department’s training program administration and management practices.
Figure 31: Training Program Administration and Management
Survey Components Rogers Fire Department Hanover Fire Department Loretto Fire Department
Training Administration
Director of training program
Chief – contracts to Customized Fire/Rescue
Training Inc.
One captain and one lieutenant assigned to fire training, another captain and lieutenant assigned
to EMS training
Rick Altendorf, Assistant Chief and Training Officer
Program goals and objectives identified
Yes Not formally
Generally, to meet continuing education
requirements of Firefighter I and II based
on state standards
Recordkeeping
Individual training files maintained
Yes Yes Yes
Records and files computerized
Yes Limited Yes
Daily training records Yes Monthly N/A
Company training records N/A Yes N/A
Administrative Priority
Budget allocated to training
Not provided $12,000 $16,000
Using certified instructors Yes Some Yes
Annual training report produced
No No
Each person gets their own quarterly training summary, no annual
report
Adequate training space/facilities and equipment
Yes Yes Yes
Training Program Record Keeping and Clerical Support
Administrative secretary support
Fire inspector & fire chief None Part-Time Administrative
Assistant
Records computerized software used
Firehouse Software Yes Excel, Image trend &
Target Solutions
Training Facilities and Resources
Training facilities (tower, props, pits)
Yes None. Area streets and
parking lots only No

City of Corcoran, MN Fire Service Comprehensive Growth Plan
36
Survey Components Rogers Fire Department Hanover Fire Department Loretto Fire Department
Live fire props Yes None. Use State Fire
Marshal’s Office props as available
Access to mobile burn props and used. Live fire
training on donated structures.
Fire and driving grounds Yes None None, parking lots and
roads used
Classroom facilities Yes Yes Classroom in Fire Station
VCR, projectors, computer simulations
Adequate Yes Adequate
Books, magazines, instructional materials
Adequate Yes Adequate
Training Procedures Manual
Manual developed and used
Yes No agency training
manual
Orientation manual. Training handbook
references State mandated annual training
requirements
IFSTA manuals used Yes Yes Jones & Bartlett
Training Scheduling
Career training schedule N/A N/A N/A
Volunteer training schedule
Yes Monthly drill only Monthly drill
Minimum training hours, competencies
Yes
Fire training: Must attend 8 of 12 training sessions. 1 fire training per month
and EMS: 6 training sessions,
must meet minimum continuing education
requirement.
Members must attend all mandatory training and 30% of non-mandatory
training. Mandatory is 24 hours as required by the
state. Additional department-specific training required as mandatory by the
department of approximately 50 hours
annually, plus attendance to 30% of non-mandatory
training.
Methodology Used for Training
Manipulative Yes Yes Yes
Task performances Yes Yes Yes
Minimum annual training hours
Yes
Fire training: Must attend 8 of 12 training sessions. 1 fire training per month
and EMS: 6 training sessions,
must meet minimum continuing education
requirement.
Approximately 50 hours/Year plus First
Responder Recertification.
Use of lesson plans Yes No Yes
Night drills Yes Yes Yes
Multi-agency drills Yes Yes Yes

City of Corcoran, MN Fire Service Comprehensive Growth Plan
37
Survey Components Rogers Fire Department Hanover Fire Department Loretto Fire Department
Inter-station drills Yes Yes N/A
Physical standards or requirements
Yes
Physical ability test required upon hire.
Medical physical examination every 2
years.
Physical ability test upon initial hire and medical evaluation bi-annually.
NFPA compliant.
Annual performance evaluation conducted
Yes/No – Full time staff only
No Ongoing as part of regular
training. No annual testing.
Employee Development program
Yes – Performance reviews
No
Mentor program for new hires. Basic requirements to progress through the ranks identified in the
By Laws.
Discussion
The City of Corcoran has an interest in assuring that the agencies contracted for services train and operate in
a similar manner. The training programs operate under the oversight of a chief officer or designee in all three
agencies. Program goals and objectives are loosely defined and generally focused on meeting identified
continuing education requirements. Administrative practices and record keeping is appropriate, although it is
noted that there are efforts that are duplicated by all three agencies, which could be consolidated for greater
efficiency.
City of Corcoran, MN Fire Service Comprehensive Growth Plan
38
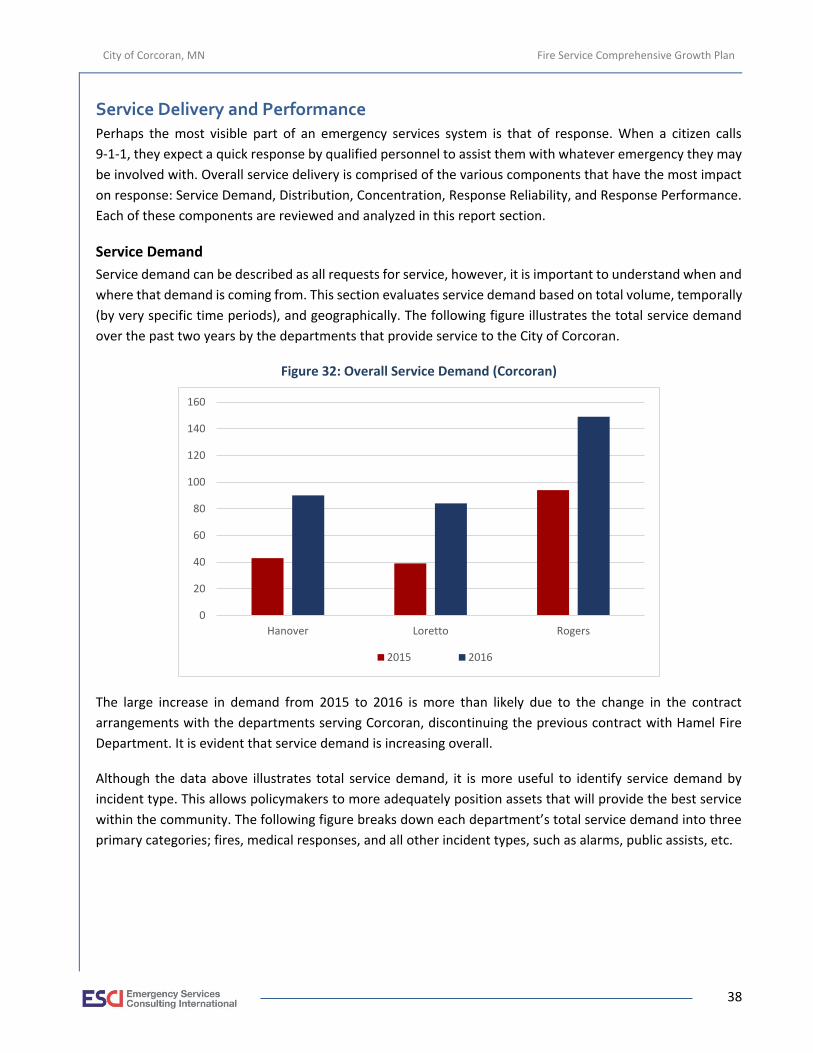
Service Delivery and Performance Perhaps the most visible part of an emergency services system is that of response. When a citizen calls
9-1-1, they expect a quick response by qualified personnel to assist them with whatever emergency they may
be involved with. Overall service delivery is comprised of the various components that have the most impact
on response: Service Demand, Distribution, Concentration, Response Reliability, and Response Performance.
Each of these components are reviewed and analyzed in this report section.
Service Demand
Service demand can be described as all requests for service, however, it is important to understand when and
where that demand is coming from. This section evaluates service demand based on total volume, temporally
(by very specific time periods), and geographically. The following figure illustrates the total service demand
over the past two years by the departments that provide service to the City of Corcoran.
Figure 32: Overall Service Demand (Corcoran)
The large increase in demand from 2015 to 2016 is more than likely due to the change in the contract
arrangements with the departments serving Corcoran, discontinuing the previous contract with Hamel Fire
Department. It is evident that service demand is increasing overall.
Although the data above illustrates total service demand, it is more useful to identify service demand by
incident type. This allows policymakers to more adequately position assets that will provide the best service
within the community. The following figure breaks down each department’s total service demand into three
primary categories; fires, medical responses, and all other incident types, such as alarms, public assists, etc.
0
20
40
60
80
100
120
140
160
Hanover Loretto Rogers
2015 2016

City of Corcoran, MN Fire Service Comprehensive Growth Plan
39
Figure 33: Service Demand by Type
Based on this illustration, a majority of incidents occurring within Corcoran are medical and non-fire in nature,
such as alarms (without fire) and public assists. Actual fires are relatively low, and each department has a
significant number of other incident types throughout the city. It is also beneficial to evaluate service demand
temporally. The following paragraphs review the last two years’ service demand by month, day of week, and
hour of day.
Figure 34: Service Demand by Month
This analysis indicates that service demand is typically higher during the warmer months as would be expected
based on levels of human activity. The following figure evaluates services by day of week.
0
20
40
60
80
100
120
140
160
180
2015 2016
Fires Medical Other
0
10
20
30
40
50
60
70
Jan Feb Mar Apr May Jun Jul Aug Sep Oct Nov Dec
2015 2016

City of Corcoran, MN Fire Service Comprehensive Growth Plan
40
Figure 35: Service Demand by Day of Week
Based on this analysis, service demand is generally higher during the regular workweek and on Saturdays as
the general public travels to and from work and recreational activities. The final temporal analysis evaluations
demand by hour of day.
Figure 36: Service Demand by Hour of Day
As expected from departments that provide emergency medical first responder services, demand begins to
rise between 6:00 and 7:00 a.m.; peaking during the mid-afternoon hours; and then declines into the evening.
This trend closely mirrors general human activity.
0
10
20
30
40
50
60
Sun Mon Tue Wed Thu Fri Sat
2015 2016
0
5
10
15
20
25
30
35
Mid
nig
ht 1 2 3 4 5 6 7 8 9
10
11
12
13
14
15
16
17
18
19
20
21
22
23
2015 2016

City of Corcoran, MN Fire Service Comprehensive Growth Plan
41
This type of analysis allows policymakers to visualize when resources are needed the most. However, where
these incidents occur is equally important so that decisions can be made regarding resource deployment. The
following analysis plots the incident demand within Corcoran geographically and by incident type.
Figure 37: Geographical Service Demand Distribution
As illustrated in this figure, service demand is extremely low throughout the city with the exception of the
east central section, which is much more densely populated than points further west. Unfortunately, this is
the area that is furthest away from response resources as will be discussed next.

City of Corcoran, MN Fire Service Comprehensive Growth Plan
42
Resource Distribution
Now that it has been determined when and where incidents occur, existing deployment of resources can be
evaluated and matched against historical demand. The following figure illustrates each department’s ability
to respond from their respective stations within an assumed four, six, eight, and 10-minute travel time.
Figure 38: Four, Six, Eight and 10-Minute Travel Capability
As can be seen in this figure, even within 10 minutes of travel, a significant portion of Corcoran is uncovered.
This analysis, however, assumes that resources are at the station and ready for response when dispatched.
Understanding that stations are not always staffed, as is common with volunteer systems, this analysis does
not represent actual response time.

City of Corcoran, MN Fire Service Comprehensive Growth Plan
43
When evaluating distribution of resources, requirements from the Insurance Services Office (ISO) must also
be considered. Those requirements indicate that, in order to receive the highest amount of credit, properties
should be within 1.5 miles of a fire engine, 2.5 miles of an aerial apparatus (ladder) for properties over three
stories in height or greater than 25,000 square feet, and within five total miles from a fire station. The
following figure illustrates those travel distances based on current deployment of resources. The 2.5-mile
range is included to represent the area covered by the Rogers Fire Department, the only Corcoran-contracted
department that operates an aerial apparatus.
Figure 39: 1.5, 2.5 and 5-Mile Travel Capability

City of Corcoran, MN Fire Service Comprehensive Growth Plan
44
The map demonstrates 1.5, 2.5, and 5-mile travel from the fire departments directly involved in this analysis.
Although the 1.5 and 2.5-mile distances have less of an impact on properties, those that lie greater than five
miles from a fire station are at risk of being classified as ‘unprotected,’ which can lead to higher property
insurance premiums. It is noted that large portions of Corcoran fall beyond 5 miles travel from the three study
agencies. If the ISO and insurance provider considers stations in Maple Grove, Plymouth and Hamel in their
travel distances, rates will improve. Further, automatic aid agreements with Maple Grove have reduced this
risk since Stations 4 and 5 can reach much of the area currently outside five road miles from the departments
currently serving Corcoran. The same can be said, to varying degrees, for the stations in Plymouth and Hamel.
ESCI met with representatives of Maple Grove Fire Department and found that they are willing to respond on
a mutual aid basis but are not inclined to do so on a fully automatic mutual aid basis, meaning the ISO may or
may not count those stations toward ratings. Looking at the response area map and specifically the City of
Corcoran, it is visually apparent that a gap exists. The placement of an additional station in the eastern portion
of the city will address these gaps and is discussed in greater detail later in this report.
Response Reliability
The workload on emergency response units can also be a factor in response time performance. The busier a
given unit or department, the less available it is for the next emergency. If a response unit is unavailable, then
a unit from a more distant station must respond, increasing overall response time. A cushion of surplus
response capacity above average values must be maintained due to less frequent, but very critical times, when
atypical demand patterns appear in the system. Multiple medical calls, simultaneous fires, multi-casualty
events, or multiple alarm fires are all examples.
One way to look at resource workload is to examine the amount of time multiple calls occur within the same
time frame on the same day. ESCI examined the calls during 2015 and 2016 to find the frequency that the
departments are handling multiple calls within any given time frame. This is important because the more calls
occurring at one time; the more stretched available resources become leading to extended response times
from distant responding available apparatus.
Figure 40: Call Concurrency Rates (2016)
Single 2 3 4 5
Incidents 264 25 3 1 3
Concurrency % 89.2% 8.4% 1.0% 0.3% 1.0%
For most departments, the majority of calls occur singularly, as is the case within Corcoran. However, as
communities grow the propensity for concurrent calls increases. When the concurrency reaches a level to
which it stretches resources to near capacity, response times begin to extend. Although multiple medical calls
will cause drawdown, especially as concurrency increases, they usually occupy only one unit at a time.
Concurrent fire calls, however, are of more concern as they may require multiple unit responses for each call
depending upon the dispatch criteria. Typically, “other” calls that are not actual fires or medical calls have
higher rates of concurrency than fires and depending on the dispatch criteria, may create periods of extensive
resource drawdown.
City of Corcoran, MN Fire Service Comprehensive Growth Plan
45
It is important to note that an area with the highest workload will typically have the highest rate of concurrent
calls and resource drawdown. This requires response units from other stations, to respond into this area. The
impact on station area reliability can be affected by several factors such as:
• Out of service for mechanical reasons
• Out of service for training exercises
• Out of area on move-up deployment
• Lack of staffing
• Concurrent calls
When these factors impact the reliability of a station to respond within its prescribed territory, response time
performance measures for the back-up station/apparatus can be negatively affected.
Response Performance
When discussing emergency services organizations, the primary issue of question is response performance.
Response performance analysis evaluates how quickly an organization responds to an incident and is more
commonly known as response time. The response time continuum, the time between when the caller dials 9-
1-1 and when assistance arrives, is comprised of several different components:
• Processing Time—The amount of time between when a dispatcher answers the 9-1-1 call and
resources are dispatched.
• Turnout Time—The amount of time between when units are notified of the incident and when they
are en route.
• Travel Time—The amount of time the responding unit actually spends on the road to the incident.
• Response Time—A combination of turnout time and travel time and generally accepted as the most
measurable element.
Other performance measurements are also valuable but not utilized in this analysis of staffing and
deployment, such as:
• Patient Contact Time—The actual time personnel arrived at the patient and began treatment.
• Scene Time—The total amount of time resources have spent on the emergency scene prior to
transport or clearing the incident.
• Transport Time—The total amount of travel time spent transporting the patient to a definitive care
facility.
• Hospital Time—The total amount of time the transporting unit spent at the receiving facility before
returning to service.
• Total Commit Time—The total amount of time between dispatch and clearing the incident.
Since none of the agencies involved in this project provide transport EMS, the components evaluated in this
section will be limited to those found in the first list: processing, turnout, and total response. Before entering
this discussion, however, the project team felt it necessary to provide a brief discussion about how the
statistical information is presented, particularly regarding average versus percentile measures.
City of Corcoran, MN Fire Service Comprehensive Growth Plan
46
The average measure is a commonly used descriptive statistic, also called the mean of a data set. It is a
measure which is a way to describe the central tendency, or the center of a data set. The average is the sum
of all the points of data in a set divided by the total number of data points. In this measurement, each data
point is counted, and the value of each data point has an impact on the overall performance. Averages should
be viewed with a certain amount of caution because the average measure can be skewed if an unusual data
point, known as an outlier, is present within the data set. Depending on the sample size of the data set, this
skewing can be either very large or very small.
As an example, assume that a particular station with a response time objective of six minutes or less had five
calls on a particular day. If four of the calls had a response time of eight minutes while the other call was
across the street and only a few seconds away, the average would indicate the station was achieving its
performance goal. However, four of the five calls, or 80 percent, were beyond the stated response time
performance objective.
The reason for computing the average is because of its common use and ease of understanding. The most
important reason for not using averages for performance standards is that it does not accurately reflect the
performance for the entire data set.
With the average measure, it is recognized that some data points are below the average and some are above
the average. The same is true for a median measure which simply arranges the data set in order and finds the
value in which 50 percent of the data points are below the median and the other half are above the median
value. This is also called the 50th percentile.
When dealing with percentiles, the actual value of the individual data does not have the same impact as it did
in the average. The reason for this is that the percentile is nothing more than the ranking of the data set. The
90th percentile means that 10 percent of the data is greater than the value stated, and all other data is at or
below this level.
Higher percentile measurements are normally used for performance objectives and performance
measurement because they show that the large majority of the data set has achieved a particular level of
performance. This can then be compared to the desired performance objective to determine the degree of
success in achieving the goal.
For this analysis, ESCI was most interested in the ability to respond the appropriate resources to the highest
percentage of incidents. For this reason, ESCI analyzed NFIRS data from each department for 2015 and 2016
and generated average, 80th percentile, and 90th percentile response performance for emergency incidents
only.
The first component of the response time continuum to be evaluated is call processing time in the
communications/dispatch center. Hennepin County Communication provided ESCI with computer aided
dispatch (CAD) data for 2015 and 2016 for this analysis. The following figure captures the organization’s
average and 90th percentile call processing performance.

City of Corcoran, MN Fire Service Comprehensive Growth Plan
47
Figure 41: Call Processing Performance
Year Average 90th
Percentile
2015 0:01:21 0:02:07
2016 0:01:17 0:02:00
NFPA 1221 recommends that communications centers process and dispatch emergency incidents within 60
seconds when measured at the 90th percentile. The data provided by the dispatch center indicates the 90th
percentile performance to be twice the national standard. The discrepancy may be due to procedural matters
in the center, or may be a result of flawed data collection, but it should be addressed. The fire departments
and municipalities should work with the dispatch center to identify areas of improvement in an attempt to
achieve a better call processing time.
The second component of the response time continuum is turnout time, or the time between when resources
are dispatched and when response units are en route to the incident. Turnout times can vary based on staffing
patterns and will typically be longer for volunteer or paid-on-call departments. NFPA 1710, the standard that
applies to career organizations, recommends a turnout time performance of 60 seconds for medical incidents
and 1:20 (1 minute, 20 seconds) for fire incidents, when measured at the 90th percentile. NFPA 1720, the
standard that applies to volunteer and combination departments, does not outline a specific turnout time
performance recommendation. However, in order to determine if there is an identifiable deficiency in the
overall response continuum, it is necessary to evaluate each department’s ability to get apparatus or units en
route to an incident. The following figure summarizes each department’s historical average and 90th percentile
turnout time performance.
Figure 42: 90th Percentile Turnout Time Performance Hanover Loretto Rogers
Average 90th
Percentile Average
90th Percentile
Average 90th
Percentile
2015 0:03:51 0:07:45 0:01:23 0:02:40 0:02:50 0:07:39
2016 0:03:09 0:07:28 0:01:00 0:01:45 0:03:08 0:07:49
Regardless of what the call processing or turnout times are for a particular organization or a region, the most
important aspect of response is actually getting the appropriate resources on the scene of the emergency.
NFPA 1710 recommends a first unit arrival response performance of five minutes when measured at the 90th
percentile regardless of population density and is applied to career fire departments. NFPA 1720 allows a
tiered response performance objective based on varying levels of population density as illustrated in the
following figure.

City of Corcoran, MN Fire Service Comprehensive Growth Plan
48
Figure 43: NFPA 1720 Response Performance Recommendations5
Classification Population Density per
Square Mile Response Performance
Target Percentile
Urban >1000 9:00 90th
Suburban 500 to 999 10:00 80th
Rural <500 14:00 80th
Wilderness/Remote Undeveloped Undetermined 90th
The following figure illustrates the total response performance for the study agencies from time of dispatch
to arrival at the incident for 2015 and 2016.
Figure 44: Response Time Performance, 2015 and 2016
Hanover Loretto Rogers
Average 80th % 90th % Average 80th % 90th % Average 80th % 90th %
2015 00:10:02 00:14:00 00:15:36 00:06:33 00:09:51 00:10:29 00:07:34 00:11:00 00:14:00
2016 00:07:02 00:10:00 00:11:48 00:04:26 00:06:41 00:07:48 00:07:03 00:11:00 00:13:00
The summary in this figure includes emergency responses (without mutual aid) within the City of Corcoran
ONLY and provides—in addition to the average and 90th percentile measures—the 80th percentile total
response performance. This performance is illustrated based on the entirety of the City of Corcoran falling
into the ‘rural’ population density zone based on NFPA 1720 recommendations. As can be seen in the figure,
the 80th percentile response performance for each department serving Corcoran is at or better than the
recommended measure of 14 minutes.
However, it is noted that the city staff desires to apply the ‘suburban’ density standard to the properties that
fall within the Metropolitan Utilities Service Area (MUSA). That category calls for a response time of ten
minutes at the 80th percentile. As seen in the 2016 response performance in the table, Hanover falls at the 10
minute threshold, Loretto is 4 minutes below and Rogers is slightly above the level.
Mutual and Automatic Aid Systems
Communities have traditionally forged limited agreements to share resources under circumstances of extreme
emergencies or disasters. These agreements, known as mutual aid agreements, allow one community to
request the resources of another in order to mitigate an emergency situation or disaster that threatens lives
or property. There are numerous mutual aid agreements, both formal and informal, in place between fire,
police, and emergency medical agencies within the study area, both with the departments participating in this
project and those surrounding the study area.
However, it is important to define the level of mutual aid systems in place in this region. Mutual aid can take
several forms, and this analysis of mutual aid programs will begin with a brief explanation of the various types
of mutual aid systems used by the fire service in various parts of North America.
5 NFPA 1720 Volunteer Department Staffing and Response Target Table from Section 4.3.2.

City of Corcoran, MN Fire Service Comprehensive Growth Plan
49
BASIC MUTUAL AID UPON REQUEST
This form of mutual aid is the most basic and is typically permitted under broad public laws that allow
communities to share resources upon request during times of disaster or during local and regional
emergencies. Often, these broad laws permit communities to make decisions quickly regarding mutual aid
under specified limitations of liability. These broad laws can allow a community to tap into resources from
their immediate neighbors, as well as very distant resources in communities with which they have very little
day to day contact otherwise. Under this level of mutual aid, specific resources are typically requested by the
fire department, through the appropriate chain of command, and sometimes coordinated by local or regional
emergency management personnel. Depending on the level of the request, the response can sometimes be
slow and the authorization process may be cumbersome due to the exchange of official information or even
elected official’s approval that may be required.
WRITTEN MUTUAL AID AGREEMENTS
This form of mutual aid takes the previous form one step further by formalizing written agreements between
communities—typically immediate neighbors in a region—in an effort to simplify the procedures and, thus,
cut response time. Usually, these written agreements include a process that takes the request and response
authorization down to a lower level in the organization, such as the fire chief or other incident commander.
By signing such agreements, communities are “pre-authorizing” the deployment of their resources under
specified circumstances as spelled out in the agreement. Most often, these agreements are generally
reciprocal in nature and rarely involve an exchange of money for service, though they may include methods
for reimbursement of unusual expenses for long deployments.
AUTOMATIC AID AGREEMENTS
This form of mutual aid takes the process an additional step further by spelling out certain circumstances
under which one or more community’s specific resources will respond automatically upon notification of a
reported incident in the neighboring community. In essence, automatic aid agreements expand a community’s
initial first alarm response to certain types of incidents by adding resources from a nearby neighbor to that
response protocol. Typically, such agreements are for specific geographic areas where the neighbor’s resource
can be expected to have a reasonable response time and are for only specific types of incidents. An example
of such an agreement would be having a neighboring community’s engine respond to all reported structure
fires in an area where it would be closer than the second or third-due engine from the home community. In
other cases, the agreement might cover a type of resource, such as a water tender or aerial ladder, that the
home community does not possess. An example of this would be having a neighboring community’s water
tender respond to all reported structure fires in the areas of the home community that do not have
pressurized hydrants.

City of Corcoran, MN Fire Service Comprehensive Growth Plan
50
Automatic aid agreements may be purely reciprocal, or they may involve the exchange of money for the
services provided. Purely reciprocal agreements are common, but typically are used where each community
has some resource or service it can provide to the benefit of the other. These services or resources need not
be identical. For instance, one community may send an engine to the other community on automatic response
to structure fires, while the second community agrees to send a water tender to the first community’s
structure fire calls in exchange. These reciprocal agreements are sometimes made without detailed concern
over quantification of the equality of the services exchanged, since they promote the effectiveness of overall
services in both communities. In other cases, the written agreements spell out costs that one community can
charge the other for services, typically where no reasonable reciprocation can be anticipated.
One primary purpose of automatic aid agreements is to improve the regional application of resources and
staffing. Since fire protection resources are most frequently established because of the occupancy risks in a
community and not necessarily a heavy workload, these resources may be idle during frequent periods of
time. While fire departments make productive use of this time through training, drills, pre-incident planning,
and other functions, the fact is that these expensive resources of apparatus and staff are not heavily tied up
on emergency incidents.
Communities that share certain resources back and forth are, in essence, expanding the emergency response
workload of those units across a larger geographic area that generally ignores jurisdictional lines. This
expanded use of resources can strongly benefit both communities that might otherwise have significantly
increased costs if they had to procure and establish all the same resources alone. Automatic aid can be used
effectively to bolster a community’s fire protection resources, or to reduce unnecessary redundancy and
overlap between communities.
For the departments serving the City of Corcoran, they each rely on a mix of automatic and mutual aid in order
to get the closest unit to the scene in the fastest manner as well as to ensure sufficient personnel are on scene
to effectively mitigate the incident. The following figure summarizes each departments’ use of mutual and
automatic aid during 2015 and 2016.

City of Corcoran, MN Fire Service Comprehensive Growth Plan
51
Figure 45: Mutual/Automatic Aid Given and Received
As illustrated in this figure, Hanover VFD has decreased the amount of aid that it has provided to other
departments over the past two years while increasing the amount of aid that it has received. Loretto VFD’s
aid given has remained relatively stable and the amount of aid received from other departments has
decreased. Rogers VFD has seen in increase in both aid given and aid received. It should be noted that the aid
given by, and received from, is not limited to the study departments and would include other surrounding
departments such as Hamel, Maple Grove, and Plymouth.
0
5
10
15
20
25
30
35
40
Aid Given Aid Received Aid Given Aid Received
2015 2016
Hanover Loretto Rogers

City of Corcoran, MN Fire Service Comprehensive Growth Plan
52
FUTURE SYSTEM DEMAND PROJECTIONS
In order to project potential future service demand, it is first necessary to evaluate historical population
growth and current community risk. These elements, combined with historical per capita incident rates, allow
for a more accurate projection of future demand.
Population Growth and Community Risk
Population History and Growth
Emergency services demand is typically driven by population and human activity. This holds true for Corcoran
as well. As the population of the area has risen, so has the overall service demand. The overall population of
the response area has fluctuated over the past sixteen years based on historical census data, as illustrated in
the following figure.
Figure 46: Population Growth History
Over this same period, the average growth rate calculates to 0.07 percent with a low of -1.03 percent in 2002
and a high of 2.05 percent in 2016. With additional development, particularly on the eastern side of the city,
the population will likely continue to increase. This will be discussed in later sections of this report.
Community Risk Analysis
The fire service assesses the relative risk of properties based on a number of factors. Properties with high fire
and life risk often require greater numbers of personnel and apparatus to effectively mitigate a fire
emergency. Staffing and deployment decisions should be made with consideration of the level of risk within
geographic sub-areas of a community. Unlike medical responses that focus on human life, fire incidents are
intended to protect property in addition to life. Property values translate into tax revenue for municipalities
and the protection of that valuation is often imperative to the success of a fire department.
0
1,000
2,000
3,000
4,000
5,000
6,000
2000 2001 2002 2003 3004 2005 2006 2007 2008 2009 2010 2011 2012 2013 2014 2015 2016

City of Corcoran, MN Fire Service Comprehensive Growth Plan
53
The following translates land use (potential scale and type of development within geographic sub-areas) to
categories of relative fire and life risk.
• Low risk—Areas zoned and used for agricultural purposes, open space, low-density residential, and
other low intensity uses.
• Moderate risk—Areas zoned for medium-density single family properties, small commercial and office
uses, low-intensity retail sales, and equivalently sized business activities.
• High risk—Higher-intensity business districts, mixed use areas, high-density residential, industrial,
warehousing, and large mercantile centers.
Corcoran has a diverse mix of risk across the jurisdiction including some high risk industrial occupancies but is
predominantly rural residential and agricultural. Proper code enforcement and fire prevention efforts will
assist the city in ensuring that these properties are operating safely.
In addition to occupancy risk, the relative age of a population can impact service demand and service delivery.
Studies have shown that departments that participate in emergency medical services generally see utilization
rates higher in certain age groups; typically, those under the age of five and those over the age of 65. The
following figure illustrates how the population in the city is distributed across the various age groups.
Figure 47: Population by Age Group
The relative distribution of the population indicates lower than expected population age 65 and over. Many
communities across the nation see a correlation between housing occupancy type and service demand. In
some cases, high rental property and vacancy rates lead to increased service demand. This is commonly tied
to socioeconomic issues but is highly variable. The City of Corcoran, however, currently enjoys a relatively low
renter and vacancy rate, which should remain steady into the future.
0
200
400
600
800
1000
1200
1400
Under 5 5-14 15-24 25-34 35-44 45-54 55-64 65 andOver

City of Corcoran, MN Fire Service Comprehensive Growth Plan
54
Figure 48: Housing Occupancy Type
There are different methods of calculating potential future population growth, and the mathematical and
growth rate data indicate that the population of the response area will continue to remain stable for the
foreseeable future, totaling an estimated 5,620 by 2040, as illustrated in the following figure. However,
additional information will be presented following this chart that changes the projections considerably.
Figure 49: Population Growth Projections
The forecast of population growth is based on several models that include:
• Mathematical forecast based on historical growth
• Growth Rate using an average of historical growth rates
90.7%
6.6%2.7%
0%
10%
20%
30%
40%
50%
60%
70%
80%
90%
100%
Owner-Occupied Renter Occupied Vacant
0
1,000
2,000
3,000
4,000
5,000
6,000
Mathematical Growth Rate Based

City of Corcoran, MN Fire Service Comprehensive Growth Plan
55
However, the data above does not present the complete picture. The Metropolitan Council adopted Thrive
2040 in May 2014. That document, based on development driven population projections, places the overall
population of Corcoran at 8,900 in 2030 and 11,300 in 2040, nearly double what historical growth indicates
as shown in the following figure.
Figure 50: Consolidated Population Growth Projections
The City should continue to regularly monitor population growth and development and continually update
their plans to serve that growing population. This information will be used in the following section to project
future service demand.
Service Demand Projections Using the information from the previous sections of this report, ESCI evaluated historical service demand,
historical incident rates, and potential changes to the population in the future, to develop a number of models
of future service demand. Historical incident rates were multiplied against future populations based on the
average growth rate model (annual historical growth rate). This method indicates slow but steady growth over
the planning period as illustrated in the following figure, with a majority of service demand coming from
medical incidents.

City of Corcoran, MN Fire Service Comprehensive Growth Plan
56
Figure 51: Service Demand Projections – Historically Based
Additionally, ESCI evaluated the projected populations based on the THRIVE 2040 report. These projected
populations, as expected, create significantly more projected service demand as illustrated below.
Figure 52: Service Demand Projections – Thrive Based
Although it is nearly impossible to precisely predict population and service demand changes, it is evident that
Corcoran will be faced with an increased service demand as time progresses and the overall population
continues to grow due to development, particularly in the eastern portions of the City. Local officials should
work closely with fire department representatives to monitor population changes annually and adjust future
predictive models as necessary, relative to resource deployment.
0
20
40
60
80
100
120
140
160
180
200
Fire Medical Other

City of Corcoran, MN Fire Service Comprehensive Growth Plan
57
FUTURE DELIVERY SYSTEM MODELS
Although the foregoing sections of this report focused primarily on the conditions that currently exist within
the City of Corcoran, the intent of this study is to combine that evaluation with a look into the future and
provide policy makers with information necessary to carry the system forward over the next 10 to 20 years,
with a defined focus on the question of future fire station placement and personnel deployment. This portion
of the report provides discussion related to the deployment of facilities, apparatus and personnel with a focus
on future service delivery and an improvement in overall efficiency within the system.
Short and Mid-Term Strategies
Establishment of Response Standards and Targets
ESCI observes that the city, and the contracting fire departments involved in this study, have not established
formalized response performance standards and targets. It is difficult to adequately identify if, when, or where
a fire station should be added, or how personnel resources should be deployed, if the city does not know what
it is seeking to achieve in terms of response performance.
However, city staff have indicated that they would consider applying the response standard of the National
Fire Protection Association (NFPA) using the category of “rural”, which sets a response standard of 14 minutes
at the 80th percentile, to areas outside the Metropolitan Utilities Service Area (MUSA). In addition, staff would
like to apply the “suburban” response category of a 10 minute response, 80 percent of the time, to areas
within the MUSA. Additional detail on these standards is provided in the following pages.
To determine future service delivery models for the study area, it is first necessary to establish response
standards and targets that will be used to identify the appropriate deployment of physical and personnel
resources. While there are nationally published standards for the deployment of fire stations and apparatus,
often these standards are simply too restrictive, or too expensive, for many organizations. In this report
section, ESCI will provide an overview of the published standards and then work to establish an appropriate
set of response standards and targets for the study area that deliver an expected level of service within the
fiscal constraints of the region.
However, before doing so, ESCI provides the following important consideration, one that does not apply
in most circumstances, and with most fire departments. In Corcoran, an unique situation is found, that
being that fire and EMS services are provided via contracted services, rather than by a city fire
department or separate fire district, as is more commonly found.
The Evaluation of Current Conditions section of this report finds that the contracted service approach
works well for Corcoran’s citizens and provides an acceptable level of service, without the need for the
City of Corcoran to establish and maintain its own fire department. The model works and works well.
Receiving fire and EMS response by way of contracted service presents the importance of defining the
level of service for which the city is paying and taking steps to measure how well the provided services
meet the city’s and citizens’ needs, expectations, and ability to pay. To measure service effectively, the
city needs to do two things: First, establish defined response standards and targets, and secondly, track
and measure the contract agency’s response performance, relative to the identified standards.

City of Corcoran, MN Fire Service Comprehensive Growth Plan
58
Response standards are based not only on response time, which is sometimes viewed as the only
important measure, but also by the ability of the contract agency to assemble and adequate number of
responders at an incident to address the emergency. Further, response time may be measured
differently—for example, in some instances, response time may be calculated based on how soon a chief
officer arrives on scene. However, that measure is invalid, because a chief does not bring with him/her
the personnel and equipment with which to extinguish a fire or mitigate a medical emergency. Instead,
a more appropriate measure is that of when an engine, rescue, or other resource has arrived that is
equipped to manage the incident.
In review of the service contracts that are in place in Corcoran, ESCI finds that they call for fire
departments to provide service to various portions of the city, but they do not specify how quickly or
how effectively they are expected to do so. In the absence of defined response standards and targets,
the city is left in a position of “you get what you get” from their contractors.
ESCI hastens to point out that we do not imply that the services provided by Rogers, Loretto, and
Hanover Fire Departments is flawed. It is not. We simply underscore the importance of establishing a
process by which to quantify and measure response performance and translate it into contract language
that allows the city to hold the contract responders to an identified standard.
Identifying that standard and stating it in a measurable manner is not an easy process. The balance of
this discussion will help to provide information with which to do so.
It must first be made clear that response standards have to be developed by the individual community, based
on the expectations of elected officials and citizens balanced against the financial aspect of what a community
is able and willing to afford. For this reason, ESCI cannot establish these standards for Corcoran, but rather
will provide guidance and examples of what we consider to be acceptable metrics.
NFPA 1710 recommends that career fire departments adopt response performance objectives that deliver an
equal level of service across the entirety of the response area irrespective of population density, geography,
or response area size. For an area the size of the study region, it is improbable that a single response
performance objective can be accomplished. The standard recommends the following for career fire
departments:
• Call Processing 0:60 at the 90th Percentile
• Turnout 1:00 at the 90th Percentile6
• Total Response 5:00 at the 90th Percentile7
6 1:20 for fire incidents. 7 5:20 for fire incidents.

City of Corcoran, MN Fire Service Comprehensive Growth Plan
59
A note about standards: The standards promulgated by the National Fire Protection Association (NFPA)
are not requirements. In fact, there are no model requirements by which a fire department is bound
regarding service delivery, but rather, standards that are developed by consensus process, setting a
baseline. Few, if any fire departments comply with all the established standards and, in fact, response
agencies are expected to develop their own standards, considering the nationally established standards,
based on their circumstances and their community’s ability to fund services.
For volunteer and combination fire departments NFPA 1720 provides a separate set of response performance
objectives based on various levels of population density. NFPA 1720 does not provide for a turnout time
performance objective since many personnel may be responding from home, work, or elsewhere throughout
the community. The standard recommends the following for volunteer and combination fire departments:
• Call Processing: 0:60 at the 90th Percentile
• Turnout: None
• Total Response Time: Urban: 9:00 at the 90th Percentile
Suburban: 10:00 at the 80th Percentile Rural: 14:00 at the 80th Percentile
The standard also defines the various population densities as follows:
• Urban: Greater than 1,000 population per square mile
• Suburban: 500 to 1,000 population per square mile
• Rural: Less than 500 population per square mile
The following figure illustrates how these population densities are distributed throughout the study area.

City of Corcoran, MN Fire Service Comprehensive Growth Plan
60
Figure 53: Population Density
Note: Maple Hill Estates is a mobile home park which is why it is covered by 2 census blocks in the mapping
data, likely because it is a more densely populated area due to mobile homes in a small space.
Also, the census block data did not contain information on Jackie Lane, which is why it does not appear
properly. It consists of about 5 streets with a normal array of homes.

City of Corcoran, MN Fire Service Comprehensive Growth Plan
61
As illustrated in the preceding figure, the entirety of the City of Corcoran is under 500 population per square
mile (based on census block data) making the entire response area rural based on the NFPA standards.
The historical response performance for the study departments was provided previously in this document.
Based on this information, ESCI recommends that the departments continue to attempt to achieve compliance
with NFPA 1720 as their adopted response performance objectives as listed in the following figure:
Figure 54: Recommended Response Performance Objectives
Population Density Performance Objective Percentile
Urban >1,000 9:00 90th
Suburban 500–999 10:00 80th
Rural <500 14:00 80th
Since the entire response area is considered rural (at present), only the yellow shaded performance objective
would apply to the study departments. However, future development of lower density areas will call for other
criteria to be adopted. In addition, the city has indicated to ESCI that they wish to consider applying the
“Suburban” standard to properties that are within the MUSA. Application of either standard will require
modification to the existing service contracts.
However, having provided the above explanation, ESCI hastens to point out that things are changing in
Corcoran as this report is being composed. Based on consideration of the growth that is being experienced
today, and more importantly projected by community comprehensive planning efforts, the rural population
density should not be expected to remain at that level moving into the future.
The City of Corcoran 2030 Future Land Use Plan predicts that a substantial increase in use, primarily
residential, is expected to occur along the eastern and southern borders of the city, as shown in the following
figure.
Key Recommendation:
• The City is advised to work with the contract fire departments to determine whether the above standard is achievable and, if not, what standard can be met. Once that determination has been made, the result should be refined to parallel language in the service contracts, establishing the response standards and targets that they agree to provide.

City of Corcoran, MN Fire Service Comprehensive Growth Plan
62
Figure 55: City of Corcoran 2030 Land Use Plan Map
The map demonstrates that the city can anticipate increased population density in the areas shaded in yellow,
orange, and brown. Those areas represent Low, Medium, and High Density residential areas, respectively, and
include the entirety of the eastern and southern parts of the city.
It is advised that, when the city establishes response performance objectives, it should do so in consideration
of at least two, and potentially three population density categories as detailed in Figure 54, previously.
Short Term Functional Improvements
The development of response standards discussed above will help Corcoran and the response agencies to
quantify its goals and targets with respect to service delivery. In addition to the above, ESCI has identified a
number of short term initiatives that can be applied to the City of Corcoran, and surrounding service area,
that can provide enhancements to current practices that are relatively easy and inexpensive to put into
practice.
Many of the concepts listed are ones typically applied to a cooperative effort or merger/consolidation study
which is beyond the scope of work of this project. While this project is not a consolidation study, the following
is a summary of potential functional initiatives that ESCI believes can be implemented to increase
effectiveness within the study region with little to no fiscal impact and each department retaining their
individual identity and independence.
City of Corcoran, MN Fire Service Comprehensive Growth Plan
63
Enhanced Automatic Aid System
The Corcoran contracting fire department, and Hennepin and Wright County fire departments generally, have
a well-developed Mutual Aid system in place that provides needed resource support to the participating
agencies. The system could be more fully automated, avoiding the need for command officers to call for
specific resources when needed. Establishment of a fully automate Mutual Aid, (Automatic Aid) system with
a dropped boundary approach that sends the closest resource regardless of jurisdiction, can enhance service
delivery.
Unification of Standard Operating Guidelines
Each of the agencies has developed Standard Operating Guidelines that are well established. While the SOGs
are generally acceptable as they stand, each contract agency has developed their own. Since the departments
work together often and operate in a similar manner, the current procedures do not differ a great deal,
however, it is essential that during mutual aid operations all personnel are working from the same “play
book.” Efforts to standardize the procedures regionally will improve operating efficiency and, most
importantly, firefighter safety.
Regionalized Incident Command
Incident Command practices, while similar, vary between the subject agencies. Standardization of a regional
approach is important to both safety of responders and the effectiveness of the response. Like Standard
Operating Guidelines, a regional or county-wide adopted system can and should be in place.
Joint Apparatus and Equipment Purchasing
Purchasing of small equipment, turnout gear and ever fire apparatus can be undertaken as a shared initiative.
Often significant cost savings may be realized as a result of economies of scale that can be gained by joint/bulk
purchasing.
Capital Replacement Planning
Planning for long term replacement of capital assets is a shared need between all of the agencies. None
currently have replacement schedules in place for fire apparatus. Approaching apparatus replacement
planning from a regional perspective may offer opportunities for cost savings and operational efficiencies.
Shared Recruitment and Retention Efforts
All of the contract agencies depend heavily on the use of Paid on Call responders and, as a result, share a
common need for recruitment and retention of capable personnel. Shared recruitment and retention
activities offer the opportunity to pool personnel resources and offer additional gains, as noted below.
Collaborative Training Practices
Training of emergency responders is a need that is common to all three organizations. Currently, training is
generally conducted independently, with some, but limited joint drill sessions. Because the three departments
often respond to the same emergencies, and assuming that the above effort to combine operating
procedures, opportunities are present to address shared training needs based on a regionalized perspective.

City of Corcoran, MN Fire Service Comprehensive Growth Plan
64
Further, training facilities are limited in the study area. Often, responders need to train on community
buildings, using parking lots or other resources. Consideration should be given to the future development of
a shared training ground. One consideration could be the inclusion of some training props and facilities in the
construction of a new station in Corcoran, if doing so is pursued.
A key element to joint training efforts will be consistency of standards. First, a minimum standard for training
would need to be agreed to by all participants. Secondly, minimum requirements for attendance and make-
up of missed trainings would need to be agreed to, established, and equally applied in all of the agencies.
Shared/Cross Trained Response Personnel
In viewing the service delivery practices by the fire departments in the study area it is readily apparent that
all three service providers function in a very similar manner in terms or response procedures, personnel
training and levels of service provided. Should the fire departments pursue some of the initiatives listed above,
including joint training and shared recruitment and retention efforts, all personnel involved will be qualified
to work as Paid On Call responders within any of the three fire departments.
POC personnel, generally, are members of the department that is closest to their home. However, they may
work during the day in one of the other communities, closer to another fire department’s station. While rarely
done, personnel that are trained and qualified could respond from work or anyplace else that they are at the
time of an emergency call, to the closest fire station and respond with that agency, effectively sharing
responders and increasing the personnel available to each fire department.
Potential Mid Term Improvements
The items listed above are ones that can be readily achieved, at little or no cost and that offer opportunities
for improved efficiency as well as an enhance capacity to address the community growth and future service
demand that is presented in this report. All can be achieved quickly, as there are no contractual or legal
requirements involved, only the agreement by the agencies to do so.
Other opportunities also exist, but are more involved and, as a result, time consuming. The following initiatives
take the fire departments and the City of Corcoran to a higher degree of collaboration and, in fact, forms of
consolidation. They offer opportunities for increased effectiveness and keep the governance of all four
agencies intact as it is today, while enabling operations go be undertaken collaboratively.
Administrative Consolidation
An administrative consolidation occurs when two or more agencies maintain their separate legal status and
separate operational elements but combine some or all of their administrative functions. Examples include
combining clerical, HR, IT, and/or financial functions while maintaining separate operational activities, or even
combining agency administration and management under one fire chief. An administrative consolidation is
accomplished legally through an Interlocal Cooperation Agreement or the formation of a Joint Powers
Authority (JPA) between the agencies. The three study fire departments have very small administrative staffs,
so there are not a large number of functions that could be combined, but efficiency could certainly be gained
from things like shared administration of training programs, fire prevention efforts and routine clerical and
administrative tasks.

City of Corcoran, MN Fire Service Comprehensive Growth Plan
65
Operational Consolidation
Under an operational consolidation, all operations are consolidated under a single organization that serves all
participating agencies. The agencies remain independent organizations from a legal/political/taxing
standpoint; but from a service level standpoint, the organization operates as one agency. Like other strategies
listed, an operational consolidation is accomplished legally through an Interlocal Cooperation Agreement or
formation of a Joint Powers Authority.
Under an operational consolidation, governance of the three fire departments and city of Corcoran would
remain as it is at the city council and board level. However, this strategy largely joins the three entities,
operationally, through the execution of a more comprehensive operational agreement. The resulting
organization features a single organizational structure and chain of command.
Regionalization considerations
The above initiatives are often undertaken as the early steps toward a more comprehensive consolidation of
efforts and, in many cases, the legal unification of the participating agencies in the form of a legal merger.
That concept falls beyond the scope of work of this study, but nonetheless warrants future consideration, and
is discussed further later in this report.
Key Recommendations:
• As stated the short-term initiatives listed above are easily accomplished and ESCI recommends that each of them be evaluated internally and implemented if found to be feasible.
• The mid-term concepts will require more assessment and analysis of their feasibility, but ESCI also recommends that, at a minimum, the three fire departments and City of Corcoran have a conversation about how the concepts may be applied. ESCI can provide additional detail and guidance, if needed.
•

City of Corcoran, MN Fire Service Comprehensive Growth Plan
66
Future Fire Station Strategies and Alternatives In June 2011, the City of Corcoran produced an updated Comprehensive Plan that identified areas of future
growth within the community. Part of the process of developing this plan was to reclassify certain property
types into more narrow categories, i.e. Single Family Residential into Low, Medium, and High Density
Residential. The current (2008) and 2030 forecast for land use within the city is summarized in the following
figure.
Figure 56: Comparison of 2008 and 2030 Land Use8
2008 2030 Change
Ag Preserve 1,796.23 1,821.13 +24.90
Ag Rural 16,264.09 12,222.17 -4,041.92
Single Family Res. 2,948.28 1,568.15 -1,380.13
Manufactured Home 28.56 0.00 -28.56
Commercial 59.32 299.60 +240.28
Business Park 0.00 80.40 +80.40
Industrial 205.34 506.08 +300.74
Public/Semi-Public 141.87 115.10 -26.77
Parks and Open 111.28 79.24 -32.04
Golf Course 417.87 92.32 -325.55
Right-of-Way 871.13 871.13 0.00
Open Water 236.94 236.94 0.00
Wetland 0.00 0.00 0.00
High Density Res. 0.00 341.87 +341.87
Low Density Res. 0.00 3,388.14 +3,388.14
Medium Density Res. 0.00 153.74 +153.74
Mixed Res. 0.00 640.05 +640.05
Mixed Use 0.00 475.05 +475.05
Rural Service/Commercial 0.00 189.82 +189.82
25,088.91 25,110.93 +0.03
What this information alludes to is an overall decrease in agricultural properties (including golf courses) and
a significant increase in housing, particularly Low Density Residential. Although the figure indicates a decrease
in “Single Family Residential” properties, there is an increase in Medium Density Residential, High Density
Residential, and Mixed-Use Residential that largely offsets that decrease. This is the result of the
reclassification mentioned previously.
As illustrated in the following figure, most of the change in land use is expected to occur along the eastern
and southern borders of the city.
8 City of Corcoran, 2030 Comprehensive Plan: Future Land Use Plan, Tables 4 and 5.

City of Corcoran, MN Fire Service Comprehensive Growth Plan
67
Figure 57: Comparison of Current (2008) to 2030 Comprehensive Plan9
9 City of Corcoran, 2030 Comprehensive Plan; Future Land Use Plan, Figures 7 and 8.

City of Corcoran, MN Fire Service Comprehensive Growth Plan
68
When the reader observes the 2008 Land Use Map, Figure 57, in comparative reference to the 2030 Future
Land Use Plan, the difference is clear, and significant. As the Comprehensive Plan moves forward, the
character of Corcoran will change dramatically. From a long-range planning perspective regarding fire and
EMS services, the growth is sure to translate into significantly increasing service demand.
Large tracts of, what is now, agricultural or rural properties are expected to develop into Low Density
Residential and Mixed-Use properties and other portions are planned in the Medium and High Density
Residential categories. This type of change in land use will, without question, lead to additional service
demand on the public safety and emergency services providers in the affected areas. In addition, there is
currently a very high density of service demand in the southeastern portion of the city that is currently outside
recommended travel distances from existing stations.
The following discussions address a variety of approaches that have been identified regarding fire and EMS
resource deployment, viewed in the light of the projected community growth.
Potential Long-Term Strategies A long-term, high-level, view of future needs is important to provide a “big picture” perspective of how the
organization needs to continue with future initiatives. Primarily, long-term strategies are centered around
community growth and related workload and how both impact the future deployment of fire stations and
personnel.
Before proceeding with the identified options that are available to the city, ESCI determined that one
identified variable needed to be assessed. The City of Rogers is considering the addition of a third fire station
sometime in the future. To determine how the initiative may impact services in the City of Corcoran, the
following discussion is provided.
Potential Addition of a Third Fire Station in Rogers
To prepare for the expected increase in service demand, and to potentially address lack of sufficient coverage
of the current high service demand in the southeastern quadrant of their city, the City of Rogers has explored
the potential of placing an additional station just north of the Corcoran border in the general proximity of
County Road 116 and Valley Drive. The concept is intended to address anticipated growth I Rogers, but, if
constructed, may affect Corcoran, as well. Although this potential station would lie outside of Corcoran, it
could provide a quicker response to the northeastern portions of the city should they continue to provide
service, as illustrated in the next figure.

City of Corcoran, MN Fire Service Comprehensive Growth Plan
69
Figure 58: Potential Rogers Station Travel Model
This figure depicts travel times from the existing fire stations, with the addition of the proposed third station
in Rogers, using four, six, eight, and 10-minute travel times. It is important to remind the reader that these
are travel times only, and they are not total response times.
The maps demonstrate that the addition of a third station in Rogers will improve response times to the
northeast corner of the City of Corcoran. However, the more significant area of concern to Corcoran officials
is focused more to the south of the portion of the city, where current service demand is the greatest and
where the highest future service demand can be anticipated based on the Comprehensive Plan. With the
added Rogers station, coverage to the current and future high service demand area would still be outside
recommended travel distance models.

City of Corcoran, MN Fire Service Comprehensive Growth Plan
70
Potential Addition of a Fire Station in Corcoran
Another concept that warrants consideration is that of building a fire station within the City of Corcoran. ESCI
reviewed mapping data and related information to select a potential location in the vicinity of the existing City
Hall campus, at or near the intersection of County Road 10 and County Road 116.
ESCI mapped the station location that has been discussed. The following map depicts that location, as well as
the proposed third Rogers station:
Figure 59: Potential Added Corcoran and Rogers Station Travel Model
City of Corcoran, MN Fire Service Comprehensive Growth Plan
71
Although placing a station in the location identified by Rogers would produce a response overlap if the City of
Corcoran was to construct a new station within the city, to the southeast; unless the Rogers station is staffed
with full time personnel, or significant numbers of Paid On Call personnel currently live in close proximity to
the potential station location, the response performance from the north would not be significantly improved.
It is also unknown if, or when Rogers will build a third station. The fire chief indicates that the timing of doing
so is unknown, and that the initiative is also dependent on the extension of County Road 117, as well as the
development of a 500-unit subdivision in the area. The subdivision work has started. Further, it is unknown
whether Corcoran will decide to construct a station in the city and how it will be staffed. Comparatively, if the
addition of a station at the proposed Corcoran location is not implemented and Rogers moves forward with
their third station, coverage to the current high service demand area would still be outside recommended
travel distance models.
The fire departments in Hamel, Maple Grove and Plymouth were not directly included in this study because
they do not currently contact services to Corcoran. However, due to their proximity to the city, it is appropriate
to include some analysis or response coverage from those departments, found below.

City of Corcoran, MN Fire Service Comprehensive Growth Plan
72
Hamel Fire Department
The city received response from the Hamel Fire Department in the past and does not contract with Hamel at
this time. ESCI decided to look at how the Hamel station compares in regard to response coverage, resulting
in the following finding.
Figure 60: Hamel Station Location Coverage
This map includes travel times from the existing fire stations, with the addition of the Hamel station, using
four, six, eight, and 10-minute travel times. It is important to remind the reader that these are travel times
only, and they are not total response times.
The preceding map demonstrates that the travel times from the Hamel station reach the 8 and 10-minute
thresholds only a very small portion of the southern and eastern of the areas of the city, where current service
demand is the greatest and where the highest future service demand can be anticipated based on the
Comprehensive Plan. With the inclusion of the Hamel station, coverage to the current and future high service
demand area would still be outside recommended travel distance models and of limited advantage in the
context of travel time.

City of Corcoran, MN Fire Service Comprehensive Growth Plan
73
Maple Grove Fire Department
Similarly, the two closest Maple Grove stations were mapped using four, six, eight, and 10-minute travel times.
Figure 61: Maple Grove Station Location Coverage
As demonstrated, coverage is improved with the inclusion of the Maple Grove stations. Considerable portions
of the city still fall in the 8, 10 and longer travel time categories. When ESCI spoke with Maple Grove
representatives they indicated that, while they are comfortable and willing in regard to the provision of mutual
aid response, they are not inclined to enter into a contract for service with Corcoran.

City of Corcoran, MN Fire Service Comprehensive Growth Plan
74
Plymouth Fire Department
Travel times from Plymouth Fire Department’s Station 3 is reflected in the next map.
Figure 62: Plymouth Station Location Coverage
From an initial response standpoint, little is gained in coverage from this station.
Analysis of Available Options Based on the preceding analysis of current conditions and the review of current risk and development trends
within Corcoran, ESCI has evaluated the need for additional resources to enable the city to provide services
to both current and future populations. In essence, the city has three options to provide future fire protection
and medical first response to its residents:
1. Continue the Current Model 2. Construct an Additional Station and Continue to Contract with Surrounding Agencies 3. Construct an Additional Station and Implement a City Fire Department

City of Corcoran, MN Fire Service Comprehensive Growth Plan
75
Option 1: Continue the Current Model
Based on current levels of expectation within the community, the existing model is viable for the near future.
However, as development continues, particularly on the east side of the city, service demand is likely to
increase, which could lead to extended response times.
Pros: ▪ Costs will remain low for the provision of fire protection and medical first response.
▪ No additional capital investment would be required.
▪ Existing community satisfaction should not be impacted.
Cons:
▪ As development continues, response times could increase with increased service demand.
▪ Surrounding departments could require additional funding to accommodate increased service
demand within Corcoran.
▪ Changing demographics may desire a higher level of service.
Continuation of the current service approach does not address future needs or address current shortcomings
in the service delivery approach. It has been demonstrated in this report that the existing response system is
maximized, and, in some respects, the current model is stretched.
A status quo continuation of the current service delivery approach will not meet the response needs of the
city if community growth develops as projected and resultant service demand increases. Continuing with the
current model in the long term, is not advised.
Option 2: Construct an Additional Station and Continue to Contract with Surrounding Agencies
This scenario provides the city with an opportunity to invest in the community with a new station but allows
the current program of contracting with surrounding departments to provide staffing and apparatus; although
additional apparatus could be needed in the new station. Historical service demand indicates that an
additional station would provide a significant improvement in travel time if placed in the area of highest
service demand as previously discussed.
As already presented, the current stations leave a significant portion of the city outside acceptable travel time
models. Current and future development, particularly to the east, is currently outside the four-minute travel
model and placing a new station to service that area will create significant improvement in coverage as shown
in the following figure.

City of Corcoran, MN Fire Service Comprehensive Growth Plan
76
Figure 63: Potential Corcoran Station Location Travel Times

City of Corcoran, MN Fire Service Comprehensive Growth Plan
77
Figure 63 models a potential station in the vicinity of County Road 116 and County Road 10, just to the south
of the Corcoran City Hall and Police Department. Adjusting the location within a half mile in either direction
will not negatively impact the modeled performance.
An additional analysis is offered, comparing 1.5 and 5-mile travel distances (ISO criteria) to further visualize
the adequacy of coverage from this location.
Figure 64: 1.5 and 5 Mile Travel Distances – Proposed Corcoran Station

City of Corcoran, MN Fire Service Comprehensive Growth Plan
78
As demonstrated graphically in Figure 64, the location significantly improves 1.5 and 5-mile coverage,
compared to the existing station configuration. ISO is likely to view the change favorably which will affect
insurance rates positively.
The question then becomes, who will staff the station? Multiple considerations come in to play to answer the
question, including administrative and operational capacity of the potential contractors, along with their
willingness and financial ability to do so. A key factor is, of course, the availability of responders. Based on
the proposed location, ESCI asked that each department submit a roster of member address to be mapped.
The result is illustrated in the following figure.
Figure 65: Current Volunteer Residences

City of Corcoran, MN Fire Service Comprehensive Growth Plan
79
Although only one current volunteer lives within the vicinity of the proposed station location, several other
members, all of the Loretto Fire Department, live within the city limits of Corcoran and could provide a quicker
response from the proposed location than from the current VFD station. However, whether Loretto, or
another contract agency is used is a decision that will be dependent on factors not limited to responder
locations, including the contract cost, capacity of an agency to take on the additional responsibility and their
ability to do so from an administrative standpoint.
Pros:
▪ Improves response capability to the highest area of service demand.
▪ Reduces response times to a growing area of service demand.
▪ May result in lower property insurance rates for homeowners within five miles of the new station.
▪ Continues the relationship with the volunteer fire departments and enhances the partnership by
providing a station from which the volunteers can respond.
Cons:
▪ Will require a capital investment in a fire station.
▪ May require the re-negotiation of contracts with other departments currently serving Corcoran.
▪ Not all calls for service will be answered from volunteers’ homes; response potential could be
negatively projected.
Of the three options identified and evaluated here, ESCI considers the above to be the preferred option for
the City of Corcoran.
Option 3: Construct a New Fire Station and Implement a City Fire Department
This report would be incomplete if the notion of starting an entirely new fire department, operated by the
City of Corcoran, was not identified as an option.
The only difference between this scenario and the previous is that the city would implement its own fire
department, which would require significant input from the community due to questions regarding staffing
and response capability. The following questions would need to be considered:
1. Would existing departments continue to work with the city to cover the outlying areas? If not, would additional stations be necessary?
2. Would sufficient personnel be available to provide services without jeopardizing the surrounding departments’ response capabilities?
3. Would the city be willing to invest in a station PLUS sufficient apparatus to adequately operate the station?
4. Does the city want to get into the business of providing fire protection and medical first response?

City of Corcoran, MN Fire Service Comprehensive Growth Plan
80
These questions are all valid and should be carefully considered prior to making any decision on moving
forward. Although listed last, question four is perhaps the most important since it involves the creation of an
entirely new entity within the current City governmental structure and, with it, additional duties,
responsibilities, and liabilities for the city. City leaders should continue to work with fire departments to
ensure that service is provided throughout the jurisdiction in a way that is satisfactory to the residents and
should consider a series of public meetings to gather public input as to future expectations, ability to fund the
various options, and most importantly, their willingness to fund the option chosen.
Two primary concerns come into play when considering the alternative. First is cost, which is considerable.
The second is the challenge of staffing a new fire department. Doing so with career personnel would likely be
viewed as cost prohibitive in this instance, and a Paid On Call model would likely be preferred. The problem
with a Paid On Call approach is simply that the new Corcoran Fire Department would be competing for
members from the same pool of personnel resources as that of the other fire departments. What was
identified consistently as a critical issue by the departments in the Evaluation of Current Conditions section of
this report—that of recruitment and retention of responders—would simply be exacerbated under this
option.
The implementation of this strategy is not advised.
Future Staffing
All of the fire departments serving the City of Corcoran are dependent on a Paid On Call method of staffing
response. The methodology has worked well and continues to do so today. However, the city and the fire
departments are urged to view their staffing practices with an eye to the future.
ESCI’s recent experience in Minnesota has found that, while many, if not the majority, of fire departments in
the state employ a POC staffing model, all are finding it more and more difficult to recruit and maintain
responders. And the problem if further challenging in communities that are growing. In this instance, the city
is not able to tell the fire department’s how to staff its responses, but nonetheless needs to know what the
long-range staffing picture looks like.
Determining what adequate staffing levels are for a fire department is more elusive that it would seem.
Agencies typically staff according to the normally expected service demands and, if possible, include some
reserve capacity for multiple or larger incidents. However, agencies typically depend on outside assistance for
major, manpower-intensive incidents that occur on an infrequent basis. It is simply impractical to fully staff
for every contingency.
Staffing decisions are best made in consideration of what the organization seeks to accomplish in terms of
response performance. Community expectations and an agency’s financial capacity must be balanced to
achieve an acceptable level of service delivery. Staffing allocation is then based on meeting targeted needs
and expectations, within the organization’s ability to afford new hires. The development of response time
standards and performance targets as discussed within this report will assist the city and its contract fire
departments with future staffing decisions.

City of Corcoran, MN Fire Service Comprehensive Growth Plan
81
In some agencies, an option to full dependence on career staffing sometimes includes working with other area
fire agencies and community college fire science programs to place qualified intern or student personnel as
first responders. An additional or alternative approach is the establishment of resident firefighter, volunteer,
or apprentice programs, any of which conceivably improve on the existing situation.
Fire departments in the study area and surrounding communities are feeling the pressure of maintaining the
current Paid On Call approach. Many are considering, or have implemented the addition of career personnel,
but doing so comes at a substantial cost which, potentially, will result in increasing costs to the city at some
point in time.
Although the analysis of alternative staffing methodologies falls outside of the scope of work of this report
and is an issue that needs to be addressed by the fire departments as contract service providers, the city is
encouraged to meet with the fire agencies and discuss long range plans for meeting future staffing needs.
Finally, should the city decide to move forward with building a new fire station, it is urged to consider future
staffing needs in the design. The construction plans should either include residential accommodations for
paid, part-time, resident or other staffing approaches or, at a minimum, incorporate space considerations for
the addition of crew quarters in the future.
Exploration of Regional Cooperation Opportunities
It is broadly recognized that jurisdictional boundaries seldom make efficient and effective service delivery
parameters. Citizens often recognize and appreciate regional approaches to service delivery as an all-too-rare
example of governmental cooperation and efficiency. While completing this analysis of current and future
station locations, it became apparent that service delivery may be improved, and costs may be contained, if a
regional approach is considered.
While the City of Corcoran does not have a fire department of its own to engage in a shared service delivery
approach, there are multiple collaborative opportunities available to the fire departments serving the city,
which may, and should be, considered as future initiatives. A few examples include:
• Jointly staffed fire station(s)
• Joint purchasing agreement between area fire agencies
• Functional consolidation with allied fire agencies in areas such as:
▪ Shared training program
▪ Shared prevention and public education programs
▪ Special Operations/Technical Rescue services
• Operational consolidation with neighboring agencies which could include:
▪ Shared incident command staffing
▪ Fully dropped boundary incident response
▪ Collaborative station staffing with personnel from differing agencies

City of Corcoran, MN Fire Service Comprehensive Growth Plan
82
As providers of services in the study area, the three fire departments could set the stage for greater levels of
cooperation and collaboration between additional area agencies. In addition, when ESCI met with
representatives of Maple Grove and Plymouth as a part of information gathering, both indicated a willingness
to consider exploration of future cooperative efforts. Often, the effort may lead to some form of more formal
and legal integration of two or more area agencies. That integration may be in the form of various types of
consolidation or may be one of legal merger or fire district formation.
A study of the feasibility of formalized or more structured cooperative service delivery opportunities falls
outside of the scope of work for this study and would constitute another project in itself. However, ESCI finds
that exploration of how the area agencies may work more closely together to increase efficiencies, contain
costs, and achieve long-range future cost avoidance, is warranted and highly recommended. It is further noted
that grant funding is currently available to study the feasibility of shared service delivery options via the
Minnesota State Fire Marshal’s Office.
Thresholds and Triggers—Determining When a New Station is Needed In many communities, the question that must be addressed is when is a new fire station, additional response
resource, or alternative response program required to meet response goals. In many cases the overall answer
is part financial and part professional judgement of policy makers and fire department leaders. The problem
comes in identifying a quantifiable trigger point for adding resources; since it can vary from community to
community or even within a specific jurisdiction. While there is an abundance of opinion, there is very little
definitive guidance in fire service literature on how this should be accomplished.
First and foremost, the decisions about not only where, but when, to build a new fire station should not be
made without first determining and documenting what the city is trying to achieve as far as response time,
reliability, and performance from the contracting fire departments. The discussion earlier in this report
explains in detail the importance of establishing these standards, and does not need to be repeated here. The
City is advised to base this kind of decision on the following questions:
1. What are our response time standards and targets?
2. Are the identified targets being achieved by the responding agencies today?
3. Will the addition of new fire station(s) result in achieving the response standards that are not being
met today?
If the answer to question 3 is yes, a new station is advised. However, two additional considerations must come
into play:
1. Can we afford to add a station at this time; and,
2. Are we able to assure that, once constructed, we will be able to staff and equip the station
adequately?
Another way to identify variables and determining factors as to whether an additional station area is needed
would be to place them into a matrix. The following figure is only an example and is not meant to recommend
response time parameters or given decision points.
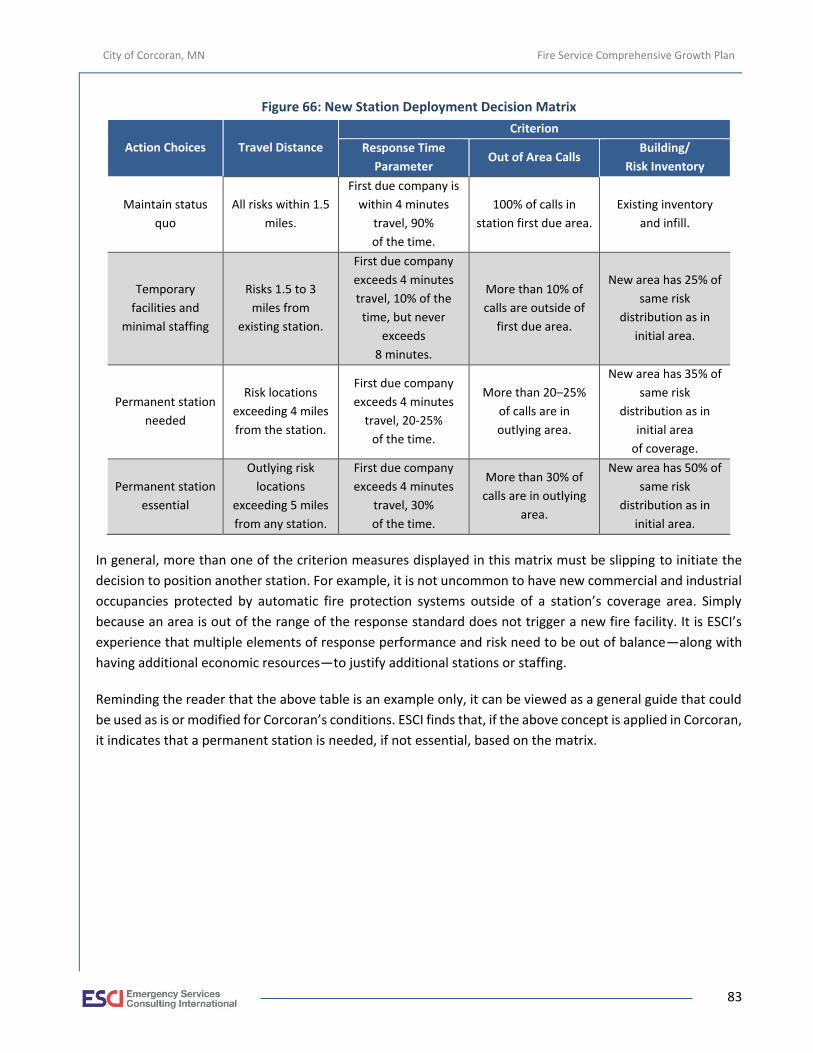
City of Corcoran, MN Fire Service Comprehensive Growth Plan
83
Figure 66: New Station Deployment Decision Matrix
Action Choices Travel Distance
Criterion
Response Time
Parameter Out of Area Calls
Building/
Risk Inventory
Maintain status
quo
All risks within 1.5
miles.
First due company is
within 4 minutes
travel, 90%
of the time.
100% of calls in
station first due area.
Existing inventory
and infill.
Temporary
facilities and
minimal staffing
Risks 1.5 to 3
miles from
existing station.
First due company
exceeds 4 minutes
travel, 10% of the
time, but never
exceeds
8 minutes.
More than 10% of
calls are outside of
first due area.
New area has 25% of
same risk
distribution as in
initial area.
Permanent station
needed
Risk locations
exceeding 4 miles
from the station.
First due company
exceeds 4 minutes
travel, 20-25%
of the time.
More than 20–25%
of calls are in
outlying area.
New area has 35% of
same risk
distribution as in
initial area
of coverage.
Permanent station
essential
Outlying risk
locations
exceeding 5 miles
from any station.
First due company
exceeds 4 minutes
travel, 30%
of the time.
More than 30% of
calls are in outlying
area.
New area has 50% of
same risk
distribution as in
initial area.
In general, more than one of the criterion measures displayed in this matrix must be slipping to initiate the
decision to position another station. For example, it is not uncommon to have new commercial and industrial
occupancies protected by automatic fire protection systems outside of a station’s coverage area. Simply
because an area is out of the range of the response standard does not trigger a new fire facility. It is ESCI’s
experience that multiple elements of response performance and risk need to be out of balance—along with
having additional economic resources—to justify additional stations or staffing.
Reminding the reader that the above table is an example only, it can be viewed as a general guide that could
be used as is or modified for Corcoran’s conditions. ESCI finds that, if the above concept is applied in Corcoran,
it indicates that a permanent station is needed, if not essential, based on the matrix.
City of Corcoran, MN Fire Service Comprehensive Growth Plan
84
Cost Projections Regardless of the chosen option for future fire protection and medical first response, there is the potential for
additional cost. This report section attempts to identify potential future costs associated with each option
listed previously.
Continuation of the Current Model—Cost Projections
As mentioned previously, continuing the current model of contracting with adjacent departments to provide
services within the city is still a viable option; at least for the near-term. However, as development continues,
and populations grow, service demand is likely to overextend the current model’s ability to provide adequate
service.
If this option is chosen, it is foreseeable that the current contract providers will need additional funding as
service demand increases. This will likely be due to their need to justify responses outside of their primary
response area to a contracted area. As presented in earlier portions of this report, the cost per household for
fire protection in Corcoran is well below the state and national averages, so an increase in the cost of these
services should not come as a surprise to most.
The question remains as to how much of an increase to expect. Currently, all three fire departments contract
values are based on blended formulas of property values and calls for service. The formulas are similar but
vary slightly and each is negotiated with the agencies providing service in a manner that is deemed to be fair,
considering variances in the different cities in the different coverage areas.
The approach has been in place for some time and is working in a manner that is acceptable to all involved
and does not need to be changed. However, should the city find a need to modify the formula in the future,
and alternative approach is offered below.
ESCI generally advises clients to keep cost apportionment formulas fair, simple, and intuitively logical to assure
that the public accepts and supports the endeavor. The typical factors included in cost allocation formulas
include:
• Area
• Valuation
• Heated Square Footage
• Service Demand
• Fixed Rate
• Population
• Parcels
• Averaged Composite
What follows is a non-prioritized listing of system variables that can be used (singly or in combination) to
allocate cost between allied entities. Each option is summarized by the concept, its advantages and
disadvantages, and other factors that should be considered.

City of Corcoran, MN Fire Service Comprehensive Growth Plan
85
Area
Concept: The cost of emergency service can be apportioned based on the geographic area served relative to the
whole. Apportionment founded on service area alone may work best in areas that are geographically and
developmentally homogeneous.
Pro: Service area is easily calculable from a variety of sources.
Con: Service area does not necessarily equate to greater risk or to greater workload.
Consider: Service area may be combined with other variables (such as assessed value and number of emergencies)
to express a compound variable (such as assessed value per square mile and emergencies per square
mile).
Valuation
Concept: The valuation of properties is established by the local tax assessor under laws of the state. Usually, higher-
valued structures and complexes carry a greater risk to the community from loss by fire. Consequently,
assessed value also tends to approximate the property at risk within a community. Emergency services
agencies are charged with being sufficiently prepared to prevent loss of life and property. Therefore, the
cost of contracted service may be apportioned relative to the assessed value of the jurisdictions. Typically,
valuation is used to apportion cost of shared service by applying the percentage of each partner’s
valuation to the whole.
Pro: Valuation is updated regularly helping to assure that adjustments for changes relative to new
construction, annexation, and inflation are included. Because a third party (the assessor) establishes
valuation in accordance with state law, it is generally viewed as an impartial and fair measurement for
cost apportionment. Although the provision of emergency medical services is not typically considered a
property-related service, apportionment tied directly to property value has merit.
Con: Valuation may not reflect the property risk associated with certain exempt property, such as schools,
universities, government facilities, churches, and institutions. Valuation may not always represent the life
risk of certain properties, such as nursing homes or places of assembly, which might dictate more
significant use of resources. In addition, some large facilities may seek economic development incentives
through valuation exemptions or reductions. Adjustments may need to be made to valuation if such large
tracts of exempt property in one jurisdiction cause an imbalance in the calculation.

City of Corcoran, MN Fire Service Comprehensive Growth Plan
86
Consider: Some states discount valuation depending on the class of property (commercial, residential, or
agricultural), which may skew the overall proportion of those properties compared to risk. As an additional
consideration, assessors usually establish the valuation in accord with the property tax cycle, which can
lag somewhat behind the budget cycle of local agencies and the time when service contracts are reviewed
or negotiated. Also, commercial facilities contain greater fire containment systems based on building code
requirements such as sprinkler systems.
Heated Square Footage
Concept: Much like the use of valuation, heated square footage is a method that allows agencies to view the
property risk within their community through a process that evaluates each and every property they
protect. Larger structures typically carry a higher risk due to occupancy or overall size of the space. Unlike
valuation, however, exempt properties and those properties that may have received discounts on their
valuation are rated equally based on size.
Pro: Local building, zoning and assessor’s offices keep routine records on existing and new construction and
these records are regularly updated to accurately reflect the community’s value and appeal. Like
valuation, these reviews are typically viewed as impartial and fair because they are completed by a third-
party evaluator.
Con: Some properties that may contain high risks to life and property may not actually contain much in the way
of heated square footage. Commercial and industrial areas that contain hazardous materials, such as
petroleum pipeline facilities, storage tanks and fill stations, would not be included in this calculation.
Communities with higher concentrations of these non-heated facilities would see this type of measure as
an imbalance in the apportionment system.
Consider: While this concept may work well in communities that are largely residential, it would be difficult to apply
in industrial and chemical settings. When using this concept, a weighting or offset system would need to
be implemented to account for those non-heated facilities.
Service Demand
Concept: Service demand may be used as an expression of the workload of an emergency service provider or
geographical area. Cost allocation based on emergencies would consider the total emergency response
of the service area; and apportion system cost relative to the percentage of emergencies occurring in the
jurisdictions.

City of Corcoran, MN Fire Service Comprehensive Growth Plan
87
Pro: Easily expressed and understood. Changes in the workload over the long term tend to mirror the amount
of human activity (such as commerce, transportation, and recreation) in the corresponding area.
Con: Emergency response fluctuates from year-to-year depending on environmental and other factors not
directly related to risk, which can cause dependent allocation to fluctuate as well. Further, the number of
incidents may not be representative of actual workload; for example, one large emergency event requiring
many emergency workers and lasting many hours or days versus another response lasting only minutes
and resulting in no actual work. Last, emergency response is open to (intentional and/or unintentional)
manipulation by selectively downgrading minor responses, by responding off the air, or by the use of
mutual aid. Unintentional skewing of response is most often found in volunteer fire systems, where
dispatch and radio procedures may be imprecisely followed. Further, service demand does not follow a
predetermined ratio to land area. As such, the service demand per square mile ratios may produce large
variations. This should be taken into consideration if this methodology is used.
Consider: Using a rolling average of incidents over several years can help to suppress the normal tendency for the
year-to-year fluctuation of emergencies. Combining the number of emergencies with the number of
emergency units and/or personnel required may help to align incidents with actual workload more closely;
however, doing so adds to the complexity of documentation. In a similar manner (and if accurate
documentation is maintained), the communities could consider using the total time required on
emergencies as an aid to establish the comparative workload represented by each jurisdictional area.
Fixed Rate
Concept: The use of fixed fees or rates (such as a percentage) to calculate allocation of shared cost is more common
between municipalities and independent districts. Occasionally, fixed-rate contracts involve the exchange
of in-kind services.
Pro: The concept is simple and straightforward. A menu of service options and the fees corresponding to those
alternatives can be developed by the contractor agency. The contracting agencies can tailor a desired level
of service based on risk and community expectation by choosing from the various menu items.
Con: Partnering communities may change (i.e., population, jobs, commerce, structures, and risk) at divergent
rates causing disconnection between the rationales used to establish the fee and the benefit received. A
fixed-rate contract may be difficult to coherently link to the services provided and/or received, which can
lead to a lack of support by officials and the community.
City of Corcoran, MN Fire Service Comprehensive Growth Plan
88
Consider: Partnering agencies need to assure that provision for rate adjustment is included in the agreement,
including inflation. The agreement should address the issue of full cost versus marginal cost. The inclusion
or non-inclusion of administrative and/or overhead cost also requires statement, as does the
reconciliation of in-kind service exchange. The ownership and/or depreciation of capital assets should be
addressed, as should rent, utilities, and liability insurance. In the case of a fixed fee, the agreement should
establish how the participation of other public agencies in the partnership would affect cost.
Population
Concept: Payment for service can be based on the proportion of residential population to a given service area. This
variable is easily determined and can be adjusted annually based on U.S. Census population estimates. It
is a known fact that human activity generates service demand for emergency services providers. Areas of
higher population (urban and suburban) will see higher service demand rates than areas of lower
population (rural). Basing cost allocation on population places more of the cost on the areas where
incidents are more likely to occur.
Pro: Residential population is frequently used by governmental agencies to measure and evaluate programs.
The U.S. Bureau of Census maintains an easily accessible database of the population and demographics
of cities, counties, and states. Estimates of population are updated regularly. Laypersons intuitively equate
residential population to the workload of fire departments.10
Con: Residential population does not include the daily and seasonal movement of a transient population
caused by commerce, industry, transport, and recreation. Depending on the local situation, the transients
coming in (or going out) of an area can be very significant, which can tend to skew community risk.
Residential population does not statistically link with emergency workload; rather, human activities tend
to be the linchpin that connects people to requests for emergency assistance.
For example, if residential population actually determined emergency workload, emergencies would peak
when population was highest within a geographic area. However, in many communities where the
residential population is highest from about midnight to about 6:00 a.m. (bedroom communities), that
time is exactly when the demand for emergency response is lowest. It turns out that emergency demand
is highest when people are involved in the activities of daily life—traveling, working, shopping, and
recreating. Often, the persons involved in such activities do not reside in the same area.
10 The average citizen may easily associate population to emergency workload, but no statistical link can be made between the two.

City of Corcoran, MN Fire Service Comprehensive Growth Plan
89
Consider: Some areas experience a daily or seasonal influx of people who are not counted as residential population.
This transient population can be estimated by referring to traffic counts, jobs data, and hotel/motel
occupancy rates. Residential population plus transient population is referred to as functional population.
Where functional population is significantly different from residential population, service agreements
based on population should be adjusted to account for it.
Parcels
Concept: The number of parcels within a given community can be used to determine proportional cost shares due
to the variable density of those parcels. Communities with smaller parcels tend to have higher population
densities while those more rural areas can have very large parcels with much lower population density.
Much like population, areas of higher parcel population will likely see higher service demand rates than
areas of low parcel density.
Pro: Although infrequently used, the employment of parcels into a cost-share calculation allows organizations
to evaluate the need for service to areas that may not be developed but still contain a certain level of risk.
Even undeveloped properties contain a fire risk, albeit low. Medical risk is extremely low unless
recreational facilities are included in the count. This type of calculation also ignores those properties that
may not be taxable such as government buildings, non-profit organizations and churches.
Con: Parcel counts ignore the types of properties being included in the count. Certain parcels may contain high
risk properties while others have an extremely low risk. This type of calculation also ignores the population
of any given parcel, which as previously discussed, typically drives emergency services demand.
Consider: Determining cost share based on parcel count should only be used solely if the various departments have
a relatively equal distribution of non-taxable properties or if one or more departments have an extremely
high concentration of non-taxable properties.
As mentioned previously, each of the funding options discussed can be used singularly or in combination with
one or more other variables. The following paragraphs evaluate the multiple-variable allocation method and
provide some examples of how this methodology can be implemented.
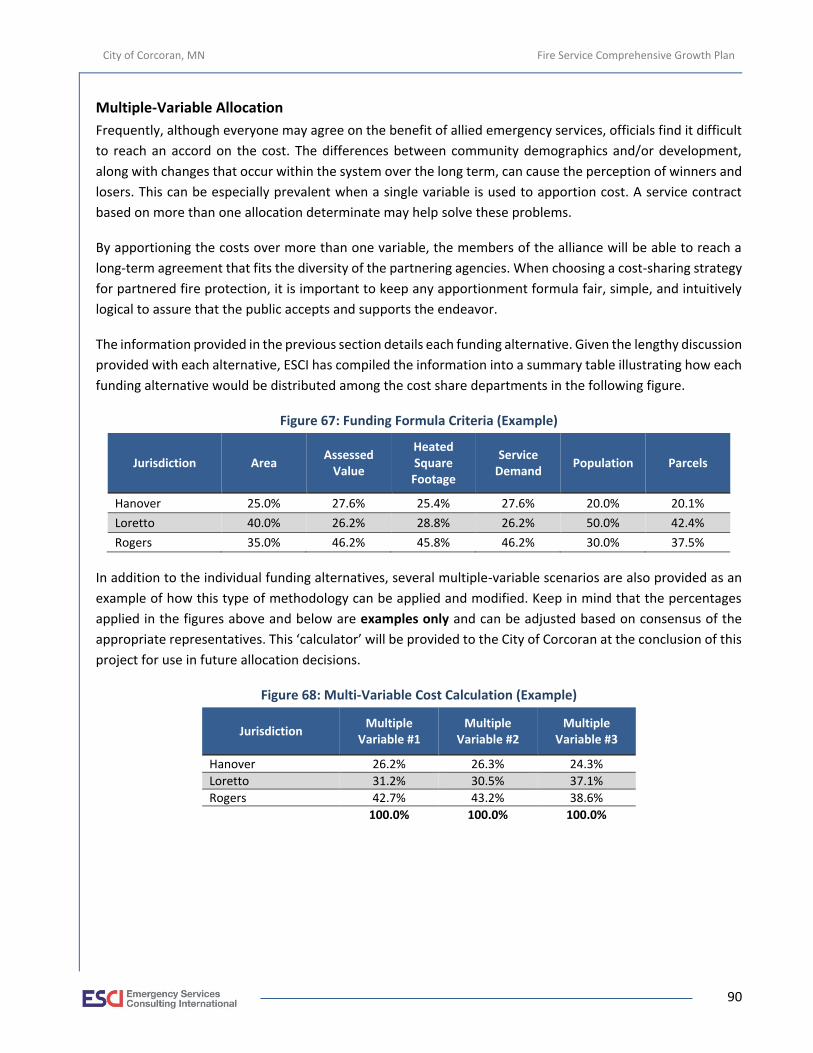
City of Corcoran, MN Fire Service Comprehensive Growth Plan
90
Multiple-Variable Allocation
Frequently, although everyone may agree on the benefit of allied emergency services, officials find it difficult
to reach an accord on the cost. The differences between community demographics and/or development,
along with changes that occur within the system over the long term, can cause the perception of winners and
losers. This can be especially prevalent when a single variable is used to apportion cost. A service contract
based on more than one allocation determinate may help solve these problems.
By apportioning the costs over more than one variable, the members of the alliance will be able to reach a
long-term agreement that fits the diversity of the partnering agencies. When choosing a cost-sharing strategy
for partnered fire protection, it is important to keep any apportionment formula fair, simple, and intuitively
logical to assure that the public accepts and supports the endeavor.
The information provided in the previous section details each funding alternative. Given the lengthy discussion
provided with each alternative, ESCI has compiled the information into a summary table illustrating how each
funding alternative would be distributed among the cost share departments in the following figure.
Figure 67: Funding Formula Criteria (Example)
Jurisdiction Area Assessed
Value
Heated Square Footage
Service Demand
Population Parcels
Hanover 25.0% 27.6% 25.4% 27.6% 20.0% 20.1%
Loretto 40.0% 26.2% 28.8% 26.2% 50.0% 42.4%
Rogers 35.0% 46.2% 45.8% 46.2% 30.0% 37.5%
In addition to the individual funding alternatives, several multiple-variable scenarios are also provided as an
example of how this type of methodology can be applied and modified. Keep in mind that the percentages
applied in the figures above and below are examples only and can be adjusted based on consensus of the
appropriate representatives. This ‘calculator’ will be provided to the City of Corcoran at the conclusion of this
project for use in future allocation decisions.
Figure 68: Multi-Variable Cost Calculation (Example)
Jurisdiction Multiple
Variable #1 Multiple
Variable #2 Multiple
Variable #3
Hanover 26.2% 26.3% 24.3%
Loretto 31.2% 30.5% 37.1%
Rogers 42.7% 43.2% 38.6%
100.0% 100.0% 100.0%

City of Corcoran, MN Fire Service Comprehensive Growth Plan
91
Figure 69: Multi-Variable Distribution (Example)
Multiple Variable #1
Area 10%
Assessed Value 50%
Service Demand 25%
Population 15%
100%
Multiple Variable #2
Area 5%
Assessed Value 40%
Service Demand 40%
Population 15%
100%
Multiple Variable #3
Area 10%
Assessed Value 5%
Service Demand 45%
Population 40%
100%
Based on the current cost per household, compared to what that cost might be if Corcoran was at the same
level as the Minnesota state average, the city could see an increase of approximately $90,883 (1,922
household x $218 per household – state average) to a total of $418,996 annually for fire services funding.
Construct an Additional Station and Continue to Contract with Surrounding Agencies— Cost Projections
This option could have two components: capital investment in a new fire station, and a potential modified
cost allocation formula. As already discussed in the Resource Distribution discussion, an additional station in
eastern Corcoran will address gaps in travel time, which become more important as development continues
and population and service demand increases. The costs of a new station will depend heavily on what type of
building is constructed including size, function, land cost, material costs, etc. However, there are a number of
newly constructed stations across the region that can provide some guidance in this regard.
What follows is a short list of recently completed facilities with an approximate cost of construction.
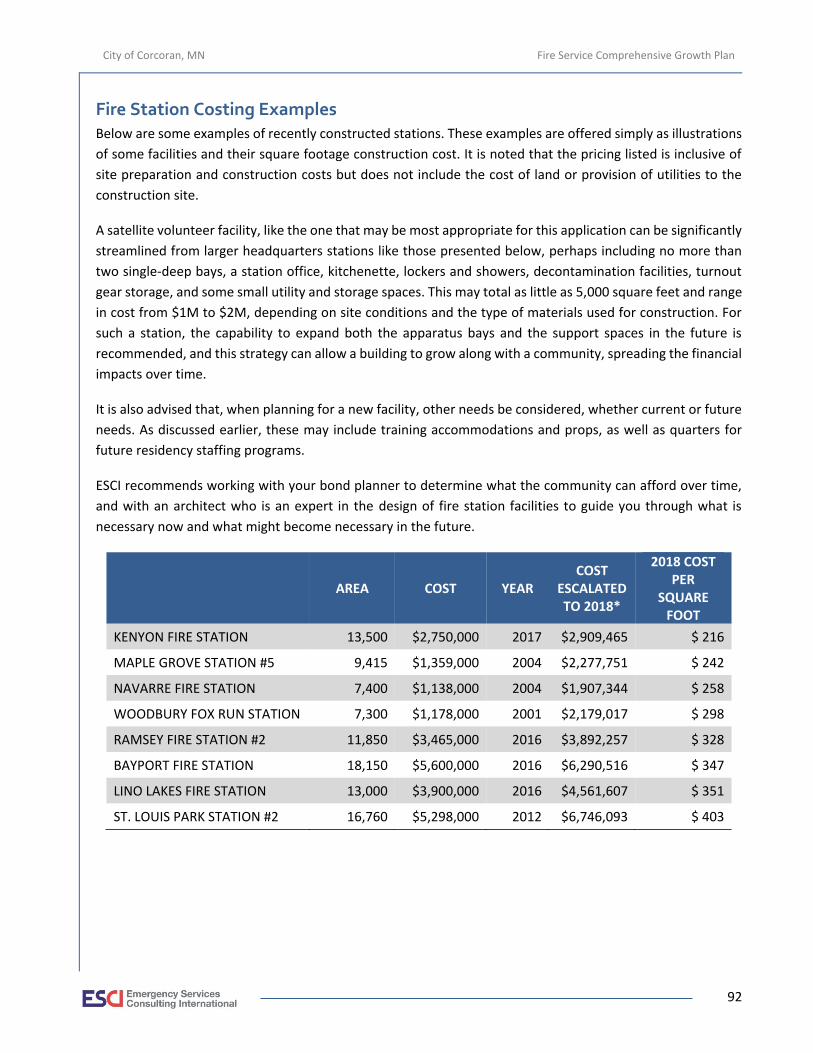
City of Corcoran, MN Fire Service Comprehensive Growth Plan
92
Fire Station Costing Examples Below are some examples of recently constructed stations. These examples are offered simply as illustrations
of some facilities and their square footage construction cost. It is noted that the pricing listed is inclusive of
site preparation and construction costs but does not include the cost of land or provision of utilities to the
construction site.
A satellite volunteer facility, like the one that may be most appropriate for this application can be significantly
streamlined from larger headquarters stations like those presented below, perhaps including no more than
two single-deep bays, a station office, kitchenette, lockers and showers, decontamination facilities, turnout
gear storage, and some small utility and storage spaces. This may total as little as 5,000 square feet and range
in cost from $1M to $2M, depending on site conditions and the type of materials used for construction. For
such a station, the capability to expand both the apparatus bays and the support spaces in the future is
recommended, and this strategy can allow a building to grow along with a community, spreading the financial
impacts over time.
It is also advised that, when planning for a new facility, other needs be considered, whether current or future
needs. As discussed earlier, these may include training accommodations and props, as well as quarters for
future residency staffing programs.
ESCI recommends working with your bond planner to determine what the community can afford over time,
and with an architect who is an expert in the design of fire station facilities to guide you through what is
necessary now and what might become necessary in the future.
AREA COST YEAR COST
ESCALATED TO 2018*
2018 COST PER
SQUARE FOOT
KENYON FIRE STATION 13,500 $2,750,000 2017 $2,909,465 $ 216
MAPLE GROVE STATION #5 9,415 $1,359,000 2004 $2,277,751 $ 242
NAVARRE FIRE STATION 7,400 $1,138,000 2004 $1,907,344 $ 258
WOODBURY FOX RUN STATION 7,300 $1,178,000 2001 $2,179,017 $ 298
RAMSEY FIRE STATION #2 11,850 $3,465,000 2016 $3,892,257 $ 328
BAYPORT FIRE STATION 18,150 $5,600,000 2016 $6,290,516 $ 347
LINO LAKES FIRE STATION 13,000 $3,900,000 2016 $4,561,607 $ 351
ST. LOUIS PARK STATION #2 16,760 $5,298,000 2012 $6,746,093 $ 403

City of Corcoran, MN Fire Service Comprehensive Growth Plan
93
Kenyon Volunteer Fire Dept.– Cost 2,750,000
Maple Grove Station 5 – Cost $1,359,000
Navarre Fire Department – Cost $1,138,000
Woodbury Fox Run Station – Cost $1,178,000
Ramsey Fire Station – Cost $3,465,000
Bayport MN – Cost $5,600,000
Lino Lakes Fire Station – Cost - $3,900,000
St Louis Park Station – Cost $5,298,000

City of Corcoran, MN Fire Service Comprehensive Growth Plan
94
As can be seen from the examples presented, costs for a facility can vary greatly depending on the building,
its location, and functionality. The City should consider the total use of the facility before making a final
decision on size and scope. Many fire stations of this type also include a community room or other area so
that the community can have a place to hold special events rather than a single use fire station.
In addition to the capital investment, the servicing departments may still want to re-negotiate the funding of
their departments. The allocation method presented previously would still apply in this case.
Construct an Additional Station and Implement a City Fire Department—Cost Projections
This final option will contain the capital investment cost of a new station and could potentially bring new costs
to the city depending on what staffing model is chosen to operate the facility. As already presented, there are
only a few current volunteers that live within the city limits of Corcoran and recruitment of new personnel
would be a daunting task, as volunteerism nationwide has been on the decline for a number of years.
Even if they City was able to adequately recruit personnel to staff a City owned and operated fire department,
a facility and personnel alone cannot adequately provide protection to the community. Additional capital
purchases would include apparatus, personal protective equipment (PPE) such as turnout gear, self-contained
breathing apparatus (SCBA), tools, equipment, etc. The table below estimates the costs to completely outfit
a department of 20 members.
Figure 70: Estimated Cost of Apparatus and Equipment
Equipment Count Price Extended
Price Engine/Pumper 2 $350,000 $700,000
Tanker 1 $250,000 $250,000
Brush Unit 1 $200,000 $200,000
Turnout Gear 30* $2,500 $75,000
SCBA 20* $6,000 $120,000
Rescue Tools 1 Set $60,000 $60,000
Small Tools Various $10,000 $10,000
Hose and Appliances Various $50,000 $50,000 *Includes spares. $928,500.00 $1,465,000.00
The estimate costs in this figure are not intended to be all-inclusive, but they do highlight the cost of the
additional equipment and supplies that would be necessary to start a fire department from the ground up.

City of Corcoran, MN Fire Service Comprehensive Growth Plan
95
Summary of Cost Projections
Although the costs associated with the various options are estimates, suffice it to say that continuing the
current model is, by far, the least expensive. However, if the city wishes to adequately prepare for the future
of fire protection and medical first response within the corporate limits, as well as help to improve the overall
level of service and reduce property insurance premiums, some expense will be necessary. The following
figure summarizes the cost projections presented in this section.
Figure 71: Summary of Cost Projections
Option Elements Estimated Total Increase
Continue Current Model Funding Formula Adjustment $90,883
New Station with Continued Contracts New Station $300,000–$2,000,000
New Station with New Fire Department New Station $300,000–$2,000,000 New Apparatus and Equipment $1,465,000 Recruitment of Personnel $10,000–$25,000

City of Corcoran, MN Fire Service Comprehensive Growth Plan
96
MOVING FORWARD
The content of this report provides insight into the City of Corcoran’s current fire and EMS delivery system,
and to the future challenges that will face the city in the coming years. Upon completion of the preceding
analysis, it becomes clear that the city will need to adjust its plans for the future to keep pace with growing
demands.
Findings and Recommendations It is ESCI’s conclusion that the approach identified above, “Construct an Additional Station and Continue to
Contract with Surrounding Agencies” is the preferred long term approach. As stated, this scenario provides
the city with an opportunity to invest in the community with a new station but allows the current program of
contracting with surrounding departments to provide staffing and apparatus; although additional apparatus
could be needed in the new station. Historical service demand indicates that an additional station would
provide a significant improvement in travel time if placed in the area of highest service demand as previously
discussed.
As presented in the travel time models, the current stations leave a significant portion of the city outside
acceptable travel time models. Current and future development is currently outside the four-minute travel
model and placing a new station to service that area will create significant improvement in coverage as shown
in the travel time maps.
Two key considerations will come into play:
1. The timing of construction of a new station will need to be based on identification of response targets
and analysis of current response performance and/or response shortcomings
2. Staffing of the new station will need to be analyzed carefully to assure that acceptable levels can be
achieved. In the near term, doing so will likely be accomplished via the existing Paid On Call
methodology, however long time consideration to other staffing strategies should be considered in
future planning as well.
Timing of the addition of the station is fairly clear, based on the analysis provided herein. Although we repeat
that the identification of response time targets is ESCI’s preferred approach, the city has also indicated the
desire to apply the NFPA 1720 response performance criteria, and ESCI agrees with the methodology. As
explained previously, the staff chooses to apply the ‘suburban’ density standard to the properties that fall
within the Metropolitan Utilities Service Area (MUSA). That category calls for a response time of ten minutes
at the 80th percentile. As seen in the 2016 response performance in the table below, Hanover falls at the 10
minute threshold, Loretto is 4 minutes below and Rogers is slightly above the level.
Hanover Loretto Rogers
Average 80th % 90th % Average 80th % 90th % Average 80th % 90th %
2015 00:10:02 00:14:00 00:15:36 00:06:33 00:09:51 00:10:29 00:07:34 00:11:00 00:14:00
2016 00:07:02 00:10:00 00:11:48 00:04:26 00:06:41 00:07:48 00:07:03 00:11:00 00:13:00

City of Corcoran, MN Fire Service Comprehensive Growth Plan
97
ESCI advises that the approach of using the NFPA standards be considered concurrently with discussion of
desired response targets, however, in regard to the standards quoted, and ESCI’s understanding of the city’s
response performance desires, we draw the following conclusions:
Implementation Planning Many studies and reports have been published and presented to clients over the years by ESCI. Often, clients
are overwhelmed with information and options. It takes time to digest the report and then figure out what to
do next. ESCI finds it helpful to offer a process whereby the clients can break the process down into smaller
segments. Those smaller pieces allow policy-makers, fire chiefs, and communities to examine details and have
discussions about what is possible. The following is offered as a framework to consider in the initial stages of
evaluation. It is a strategic planning approach to partnerships.
The first decision is whether the three organizations are to do anything at all, or continue on a status quo
basis. Once a decision is made, the following steps are offered as a means by which to implement the chosen
approach.
Conduct Vision Session(s) with Policymakers
The initial stage of implementation begins with the most elementary decision: “Do we want to move forward
or not?” It is extremely important that, at this stage of the process, it is clearly recognized that this is a public
policy decision on the part of the governing entities involved. A decision to consider altering the way in which
a critical public safety service is provided, in some cases even permanently altering the governance of those
services, is clearly in the purview of the elected bodies. While senior management input should be considered,
the final decision should not rest at any level lower in the organization than those who are elected to represent
the customers.
Key Recommendations:
• Understanding that portions of the City of Corcoran fall outside of desired travel time models and appreciating that future development will increase service demand considerably, and,
• Finding that current response performance at the 80th percentile in the context of the NFPA Standards is marginal in some areas at this time, it is recommended that the city seek the construction of a fire station in Corcoran within a time frame of two years.
• Critical to the addition of a fire station will be the determination of how it will be staffed. It is recommended that the city meet jointly with the contract fire agencies to determine the most effective approach and associated cost, considering the options of 1. Contracting with a single service provider, or 2. Staffing with a combination of qualified responders under some of the approaches listed in this report including resident firefighters, use of an integrated strategy discussed in the short-term strategies in which responders from all three contract fire departments can respond to the new station depending on their location, and 3. Future consideration of, career or part time career personnel.

City of Corcoran, MN Fire Service Comprehensive Growth Plan
98
For this reason, it is recommended that the elected representatives of the City of Corcoran first meet together
for the initial discussion of the findings of this study and its projected operational and fiscal outcomes. During
this policy stage, involvement by additional staff should be somewhat limited, perhaps at the senior
management level, and then for the sole purpose of providing technical support. It is important to limit the
discussion at this point to a very high level, conceptual, conversation only. Avoid “getting into the weeds”.
At this stage, the city council should address only the following questions:
1. Do we concur with the findings of the ESCI report in regard to future needs?
2. If so, are we willing to consider building a fire station at all, understanding that we will need
a great deal more information?
3. Should we provide direction to staff to continue to seek more information?
Establish a Joint Planning Committee
The next step in the process is to establish a Joint Planning Committee that will be given the overall
responsibility with leadership and management of the evaluation, planning and implementation process. This
will be the “nuts and bolts” group that works through the details, overcomes the challenges, reacts to new
information, and makes many of the actual decisions on the implementation plan. This group should have
much wider representation from stakeholders both inside and outside of the individual organizations
involved. Membership in the Joint Planning Committee may include senior management personnel and,
where appropriate, labor/Paid On Call representatives. The following is an example of a Joint Planning
Committee:
• City Manager or Board Chair (or equivalent) from each organization
• Corcoran Director of Public Safety
• Fire Chiefs
• Finance person from each organization
• Paid On Call representatives from each agency, if appropriate
The Joint Planning Committee should select a chair for the committee meetings and set goals regarding how
often the group will meet, how information will be communicated, and how will the group pursue consensus.
The group should start by addressing the first, high level questions, for example:
In addition, their first order of business should be to determine the rules and procedures of this committee.
This should include such items as:
• What is the direction to us at this point from the elected officials?
• Do we adequately understand the findings in the report are there questions that we need to ask?

City of Corcoran, MN Fire Service Comprehensive Growth Plan
99
Develop an Implementation Strategic Plan
Once ground rules have been set, and the committee understands its direction, the next step is the
development of a draft strategic implementation plan to be returned to the elected officials.
The purpose of the initial strategic planning session should be as follows:
• To further articulate and refine the joint vision set by the elected officials.
• To identify critical issues that will be met as the implementation process unfolds
• To identify potential impediments to implementation such as:
▪ Cost and funding
▪ Conflicts present between agencies
▪ Availability of needed data and information
▪ Lack of sufficient staff to carry through implementation processes
▪ Outside influences and time demands
• To set the specific goals and objectives of the implementation process and the timelines for
accomplishment
• To establish any workgroups necessary for implementation
This process should result in the preparation of an implementation planning document that can be shared
with the policy body, stakeholders, and others who will be involved in or affected by the implementation
process. The document should provide the joint vision and the goals of the project, describe the strategy or
strategies being pursued, the desired outcome, and the individual objectives, tasks and timelines for
accomplishment. When fully and adequately prepared, this document will serve as the master “road map” for
the process and will help guide the next steps of developing working groups and assigning responsibilities.
Meet, Identify, Challenge, Refine, and Overcome
When new challenges, issues, impediments, or opportunities are identified by the members or workgroups,
they need to be communicated to the full committee so that the information can be coordinated with findings
and processes of the other members. Where necessary, the Joint Planning Committee or the chair can meet
with the elected officials to discuss significant issues that may precipitate a refinement of the original joint
vision.
The process is continual as the objectives of the strategic plan are accomplished one by one. When sufficient
objectives have been met, the Joint Planning Committee can declare various goals as having been fully met
until the point comes when the actual implementation approval needs to be sought from the policy bodies.
This formal “flipping of the switch” will mark the point at which implementation ends and integration of the
agencies begins.

City of Corcoran, MN Fire Service Comprehensive Growth Plan
100
CONCLUSION
The ESCI project team began collecting information concerning the City of Corcoran fire and EMS services in
August of 2017. The team members recognize this report contains a large amount of information and ESCI
would like to thank the City of Corcoran and its contract fire departments and many council members, Paid
on Call responders and employees for their efforts in bringing this project to fruition. ESCI would also like to
thank the various individuals and external organizations for their input, opinions, and candid conversations
throughout this process. It is ESCI’s sincere hope the information contained in this report is used to its fullest
extent and the emergency services provided to the citizens of Corcoran and the surrounding area will be
improved by its implementation.

City of Corcoran, MN Fire Service Comprehensive Growth Plan
101
APPENDICES
Appendix A: Table of Figures Figure 1: Corcoran Service Area Map ................................................................................................................. 2
Figure 2: Governance .......................................................................................................................................... 3
Figure 3: Organizational Design .......................................................................................................................... 6
Figure 4: Service Area and Infrastructure ........................................................................................................... 7
Figure 5: Capital Asset Comparison .................................................................................................................... 9
Figure 6: Operating Budget and Financial Resources ....................................................................................... 10
Figure 7: Estimated Total Fire Department Funding (FY2018) ......................................................................... 11
Figure 8: Comparison of Cost of Fire Protection per Household ...................................................................... 12
Figure 9: Emergency Response Type and Frequency........................................................................................ 13
Figure 10: Foundational Elements .................................................................................................................... 14
Figure 11: Foundational Documents and Processes ......................................................................................... 16
Figure 12: Record Keeping and Documentation ............................................................................................... 18
Figure 13: Capital Asset Comparison ................................................................................................................ 20
Figure 14: Hanover Fire Station ........................................................................................................................ 21
Figure 15: Loretto Fire Station .......................................................................................................................... 22
Figure 16: Rogers Station 1 ............................................................................................................................... 23
Figure 17: Rogers Station 2 ............................................................................................................................... 24
Figure 18: Hanover Assigned Apparatus ............................................................................................................ 25
Figure 19: Loretto Apparatus ............................................................................................................................. 25
Figure 20: Rogers Station 1 Apparatus ............................................................................................................... 26
Figure 21: Rogers Station 2 Apparatus ............................................................................................................... 26
Figure 22: Administrative and Support Staffing ................................................................................................ 27
Figure 23: Administrative and Support Staff .................................................................................................... 28
Figure 24: Operational Staff .............................................................................................................................. 28
Figure 25: Emergency Response Staffing .......................................................................................................... 29
Figure 26: Comparison of Hanover VFD Personnel per 1,000 Population ........................................................ 30
Figure 27: Comparison of Loretto VFD Personnel per 1,000 Population .......................................................... 30
Figure 28: Comparison of Rogers VFD Personnel per 1,000 Population .......................................................... 31
Figure 29: Average Structure Fire Staffing ........................................................................................................ 32
Figure 30: General Training Competencies ....................................................................................................... 34
Figure 31: Training Program Administration and Management ....................................................................... 35
Figure 32: Overall Service Demand (Corcoran) ................................................................................................. 38
Figure 33: Service Demand by Type .................................................................................................................. 39
Figure 34: Service Demand by Month............................................................................................................... 39
Figure 35: Service Demand by Day of Week ..................................................................................................... 40
Figure 36: Service Demand by Hour of Day ...................................................................................................... 40
Figure 37: Geographical Service Demand Distribution ..................................................................................... 41
Figure 38: Four, Six, Eight and 10-Minute Travel Capability ............................................................................. 42
Figure 39: 1.5, 2.5 and 5-Mile Travel Capability ............................................................................................... 43

City of Corcoran, MN Fire Service Comprehensive Growth Plan
102
Figure 40: Call Concurrency Rates (2016) ......................................................................................................... 44
Figure 41: Call Processing Performance ............................................................................................................ 47
Figure 42: 90th Percentile Turnout Time Performance ..................................................................................... 47
Figure 43: NFPA 1720 Response Performance Recommendations .................................................................. 48
Figure 44: Response Time Performance, 2015 and 2016 ................................................................................. 48
Figure 45: Mutual/Automatic Aid Given and Received .................................................................................... 51
Figure 46: Population Growth History .............................................................................................................. 52
Figure 47: Population by Age Group ................................................................................................................. 53
Figure 48: Housing Occupancy Type ................................................................................................................. 54
Figure 49: Population Growth Projections ........................................................................................................ 54
Figure 50: Consolidated Population Growth Projections ................................................................................. 55
Figure 51: Service Demand Projections – Historically Based ............................................................................ 56
Figure 52: Service Demand Projections – Thrive Based .................................................................................... 56
Figure 53: Population Density ........................................................................................................................... 60
Figure 54: Recommended Response Performance Objectives ......................................................................... 61
Figure 55: City of Corcoran 2030 Land Use Plan Map ...................................................................................... 62
Figure 56: Comparison of 2008 and 2030 Land Use ......................................................................................... 66
Figure 57: Comparison of Current (2008) to 2030 Comprehensive Plan .......................................................... 67
Figure 58: Potential Rogers Station Travel Model ............................................................................................ 69
Figure 59: Potential Added Corcoran and Rogers Station Travel Model .......................................................... 70
Figure 60: Hamel Station Location Coverage .................................................................................................... 72
Figure 61: Maple Grove Station Location Coverage ......................................................................................... 73
Figure 62: Plymouth Station Location Coverage ............................................................................................... 74
Figure 63: Potential Corcoran Station Location Travel Times ........................................................................... 76
Figure 64: 1.5 and 5 Mile Travel Distances – Proposed Corcoran Station ........................................................ 77
Figure 65: Current Volunteer Residences ......................................................................................................... 78
Figure 66: New Station Deployment Decision Matrix ....................................................................................... 83
Figure 67: Funding Formula Criteria (Example) ................................................................................................ 90
Figure 68: Multi-Variable Cost Calculation (Example) ...................................................................................... 90
Figure 69: Multi-Variable Distribution (Example) ............................................................................................. 91
Figure 70: Estimated Cost of Apparatus and Equipment .................................................................................. 94
Figure 71: Summary of Cost Projections ........................................................................................................... 95