Embed Size (px)
Citation preview

FinScope Consumer Survey India
Under the Poorest States Inclusive Growth Programme
2015

FinScope Survey Team
FinMark Trust, South Africa
Dr Prega Ramasamy, CEO
Dr Kingstone Mutsonziwa, Head: Information and Research
Bobby Berkowitz, Information and Research
Obert Maposa
Abel Motsomi
Jabulani Khumalo
DFID, India
David Elliott, Senior Private Sector Advisor
Ragini Chaudhary, Private Sector Advisor
PSIG, SIDBI, New Delhi, India
Umesh Chandra Gaur, General Manager
Surendra Srivastava, Dy. General Manager
Pravanjan Mohapatra, Theme Leader – M&E
Jagan Mohan Pattnaik, PAO
EDA Rural Systems Pvt. Ltd., Gurgaon, NCR, India
Frances Sinha, Managing Director
Gaurav Prateek, Vice President
Krishna Raj Pandey, Consultant
AFC India Ltd., New Delhi, India
GS Yadav, Asst. General Manager
Ashok Kalia, Manager
Santosh Kumar, Senior Consultant

This material has been funded by UK aid from the UK Government’s Department for International Development; however the viewsexpressed do not necessarily reflect the UK Government’s official policies.
This document is an output from a project implemented by the Small Industries Development Bank of India (SIDBI). The viewsexpressed are not necessarily those of SIDBI.

This page has been left blank intentionally.
Table of contents
Acknowledgements 1
Acronyms and abbreviations 2
Forward 3
Executive Summary 4
1. Introduction 6
1.1. Background of the FinScope Study in the 4 PSIG States of India 6
1.2. About SIDBI 7
1.3. About FinMark Trust 7
1.4 About DFID 8
1.5. Partnering for a Common Purpose 8
2. The Financial Sector in India and the PSIG States 9
2.1. Financial Architecture of the Indian Financial Sector 9
2.2. The Financial Inclusion Landscape 11
2.2.1. Prime Ministers Jan Dhan Yojana (PMJDY) 13
2.2.2. Financial Inclusion in the PSIG States lags behind the average for the country 14
2.3. The supply of inclusive financial services – India and the PSIG States 14
2.3.1. Shifts in the economy that affect financial inclusion 16
2.4. Related studies on financial inclusion in the PSIG 19
2.4.1. All-India Debt and Investment Survey 19
2.4.2. CRISIL Inclusix – financial inclusion index 19
3. Methodological Approach 20
3.1. Survey implementation 20
3.1.1. Focus group discussions 20
3.1.2. Questionnaire design 21
3.1.3. Piloting the FinScope questionnaire 21
3.1.4. Generic FinScope sampling methodology 21
3.1.5. Enumerator training 23
3.1.6. Data collection and processing 23
3.1.7. Computation of weights at various levels 24
3.1.8. Analysis and reporting 24
4. Socio-Economic Profile 25
4.1. Demographic characteristics of the PSIG States 25
4.1.1. Area type and gender 25
4.1.2. Age 26
4.1.3. Religion and community category 27
4.1.4. Marital status 27
4.1.5. Education 28
4.2. Agricultural involvement, income and poverty 28
4.2.1. Farming 28
4.2.2. Income 29
4.2.3. Poverty 30
4.3. Asset ownership and energy usage 32
4.4. Documentation 33
4.5. Access to infrastructure and connectivity 34

5. Financial behaviour, risk and coping mechanisms 36
5.1. Financial behaviour 36
5.2. Risk and coping mechanisms 39
5.3. Planning for old age 40
6. Defining financial access and inclusion 41
6.1. The dimension of financial inclusion 42
6.2. The determinants of financial inclusion 42
6.2.1. Gender 43
6.2.2. Age 43
6.2.3. Level of education 43
6.2.4. Income source 43
6.2.5. Area type 43
7. Financial Inclusion in the 4 PSIG States 45
7.1. Financial inclusion and exclusion at household level 45
7.1.1. Overlaps of financial product usage by households 45
7.1.2. Household financial access by area type 47
7.1.3. Household financial access by household economic status 47
7.1.4. Household financial access by income source 48
7.1.5 Household formal account distribution 48
7.1.6. Household credit 49
7.1.7. Household insurance 50
7.1.8. Household remittances 52
7.2. Individual financial access and exclusion 51
7.2.1 Individual levels of financial inclusion 53
7.2.2 Overlaps of financial product usage by adult individuals 55
7.3. Determinants of financial inclusion 55
7.3.1. Financial inclusion and access by area type 55
7.3.2. Financial inclusion and access by gender, age and education 56
7.4. Landscape of Access 57
8. Commercial bank product uptake and usage 58
9. Other formal (non-bank) uptake and usage 63
9.1. Insurance sector product uptake and usage 62
10. Savings 67
11. Borrowing and credit 71
12. Remittances 75
13. Conclusions and recommendations/opportunities 78
13.1. Conclusion 78
13.1.1. Financial inclusion 78
13.1.2. Financial product usage 78
13.2. Opportunities 79
14. Annexures 81
14.1 Weighting procedures 81
14.2 Comparison of key financial inclusion indicators 82

List of TablesTable 1: India's financial system 9
Table 2: Inclusive finance products 12
Table 3: PMJDY account access 13
Table 4: Key statistics on the PSIG states 14
Table 5: Credit and deposit ratios in PSIG states, 2012-13 16
Table 6: Sectoral characteristics of PSIG economies 18
Table 7: Distribution of the AIDIS survey 19
Table 8: CRISIL Inclusix score 19
Table 9: Location of focus group discussions 20
Table 10: Survey sample and Fieldwork results 23
Table 11: Age distribution per state 27
Table 12: Religion and community category 27
Table 13: Marital status 27
Table 14: Highest level of education 28
Table 15: Type of farming (of those involved in farming) 28
Table 16: Main source of income at household level 29
Table 17: Sources of income at individual level 30
Table 18: Household asset ownership ranked at PSIG level 32
Table 19: Household ownership of assets by area type 33
Table 20: Possession of land and ownership 33
Table 21: Possession of documents 34
Table 22: Usage of communication channel/device 34
Table 23: Mean time taken to destination (in minutes) 35
Table 24: Involvement of adults in financial decisions 36
Table 25: Factors used for choosing financial institutions 37
Table 26: Perceived meaning of savings 37
Table 27: Shortest time for money to be kept to count as savings 38
Table 28: Statements concerning financial livelihood 38
Table 29: Plans for spending in old age 39
Table 30: Risk or hardship experienced in the past 12 months 39
Table 31: Coping with risk and hardship for PSIG 40
Table 32: Households claiming to receive money in the past 12 months 51
Table 33: Drivers for banking 60
Table 34: Drivers for PMJDY 60
Table 35: Distribution of the banked population 61
Table 36: Distribution of the unbanked population 62
Table 37: Drivers of insurance uptake 65
Table 38: Distribution of the insured population 66
Table 39: Distribution of the formal savings account holders 69
Table 40: Drivers for formal savings account by states 70
Table 41: Distribution of the borrowing/credit account holder 73
Table 42: Drivers for those with formal savings account by states 74
Table 43: Channels of sending money 76
Table 44: Recipient of money 77

List of FiguresFigure 1: FinScope Consumer Survey India (PSIG) 2015 8
Figure 2: Structure of India credit system 10
Figure 3: Distribution of population, PSIG 2011 15
Figure 4: Distribution of GDP, PSIG FY 2012-13 15
Figure 5: GDP per capita growth (2012-13) 15
Figure 6: Sectoral distribution of GDP, 2002-03 17
Figure 7: Sectoral distribution of GDP, 2012-13 17
Figure 8: Sectoral distribution of PSIG economies 17
Figure 9: Survey implementation stages 20
Figure 10: Diagram of generic FinScope sampling design 22
Figure 11: Adult population breakdown by state 25
Figure 12: Household population breakdown by state 25
Figure 13: Urban/Rural distribution 25
Figure 14: Gender 26
Figure 15: Age distribution of the PSIG states 26
Figure 16: Household involvement in farming 29
Figure 17: Household economic status 31
Figure 18: Poverty indicator bands 31
Figure 19: Main energy/fuel used for cooking 31
Figure 20: Adults needing more information about managing money 36
Figure 21: The Financial Access Strand 41
Figure 22: Overlaps in uptake of financial products/services 42
Figure 23: Livelihoods framework 44
Figure 24: Household overall uptake of financial products/services 45
Figure 25: Household overlaps in uptake of financial products/services 46
Figure 26: Household Financial Access Strand 46
Figure 27: Household Financial Access Strand by Area 47
Figure 28: Household Financial Access Strand by Poverty Indicator Bands and Economic Status (%) 47
Figure 29: Household Financial Access Strand by income source 48
Figure 30 Household usage of financial services 49
Figure 31: Household credit overalls 49
Figure 32: Household Credit Strand 50
Figure 33: Household Insurance Strand 50
Figure 34: Drivers for household Insurance 50
Figure 35: Household remittances overalls 51
Figure 36: Household Remittances Strand 51
Figure 37: Financial Access overalls 53
Figure 38: Individual overlaps in uptake of financial products/services 54
Figure 39: Consumer Financial Access Strand 54
Figure 40: Financial Access Strand by area 55
Figure 41: Financial Access Strand by gender 56
Figure 42: Financial Access Strand by age 56
Figure 43: Financial Access Strand by education 56
Figure 44: PSIG Landscape of Access 57
Figure 45: PSIG level of trust with banks 58
Figure 46: Ease of dealing with financial institutions 58
Figure 47: Banking products uptake 58
Figure 48: Banking usage status in the PSIG states (of the banked population) 59
Figure 49: Landscape of bank product access in the PSIG states 59
Figure 50: Products/services used by adults served by non-bank formal financial institutions 63
Figure 51: Landscape of non-bank formal product access 63

Figure 52: Proportion of adults who are insured 64
Figure 53: Insurance distribution by gender 64
Figure 54: Insurance distribution by area 64
Figure 55: Main reasons for not having insurance 65
Figure 56: Savings overall 67
Figure 57: Savings Strand by state 68
Figure 58: Savings Strand by area type 68
Figure 59: Savings Strand by gender 68
Figure 60: Drivers for formal savings account for PSIG states 70
Figure 61: Credit overalls 71
Figure 62: Credit Strand 71
Figure 63: Credit Strand by gender 72
Figure 64: Credit Strand by area type 72
Figure 65: Drivers for those with formal credit account 74
Figure 66: Proportion of adult people remitting 75
Figure 67: Remittances Strand 75
Figure 68: Remittances Strand by area type 76

1
AcknowledgementsFinMark Trust prepared this report from findings of the FinScope Consumer Survey conducted in the Poorest States Inclusive GrowthIndia 2015. FinMark Trust is grateful for the assistance received from our Local Project Coordinator, EDA Rural Systems, the LocalResearch House, AFC India Ltd, and their enumerators who ensured that the different in-country activities and milestones wereproperly coordinated.
Many thank to the team of PSIG, SIDBI; in particular Mr. Umesh Ch. Gaur, General Manager and Mr. Surendra Srivastava, Dy. GeneralManager for their continuous support and feedback during the implementation of the survey. Sincere thanks to Ms. Ragini Chaudhary,Private Sector Adviser, DFID India for hand its staff including DFID India for her guidance and support in connecting various institutionsinto the survey. The FinScope study also benefited from the expertise of the Project Steering Committee (PSC) members. Thanks toMr. Brij Mohan, Dr. Prabhala, Mr. Vijay Mahajan, Mr. N. Srinivasan, Dr. Kannan and Dr. Susan Thomas, members of the steering committeefor their feedback, challenges and guiding the survey to give it local context. On behalf of the FinScope team, gratitude is also extendedto the CEO of FinMark Trust, Dr Prega Ramsamy, for the support and guidance received during the course of the study.
The FinScope study would not have been possible without the collaboration and commitment from various individuals - thank you foryour efforts in enriching the FinScope PSIG India 2015 study.
FinScope Survey TeamFinMark Trust, South Africa

2
Acronyms and abbreviationsAP Andhra Pradesh (state)
AIDIS All India Debt and Investment Survey (NSS 70th round, 2013)
BC Business Correspondent (of commercial banks)
BSBDA Basic Savings Bank Deposit Account
CBs Cooperative Banks
CPIAL Consumer Price Index for Agricultural Labour
DCCB District Central Cooperative Bank
EDA EDA Rural Systems Private Limited
FGD Focus Group Discussions
FMT FinMark Trust
GCC General Credit Card (line of credit for artisans)
GDP Gross Domestic Product
GNI Gross National Income
GOI Government of India
ICT Information & Communications Technology (read mobile banking through BCs)
IRDA Insurance Regulation & Development Authority
KCC Kisan Credit Card (line of credit for farmers)
M-CRIL Micro-Credit Ratings International Limited (associate company of EDA)
MFI Microfinance Institution
MP Madhya Pradesh (state)
NABARD National Bank for Agriculture and Rural Development
NAFSCOB National Federation of Cooperative Banks
NAFSCUB National Federation of Cooperative Urban Banks
NAIS National Agricultural Insurance Scheme
NBFC Non-Bank Finance Company
NDPS National Disability Pension Scheme
NGO Non-Government Organisation
NOAPS National Old Age Pension Scheme
NWPS National Widow Pension Scheme
OEROperating Expense Ratio(operating expenses during a period divided by the average loan portfolio for that period)
PACS Primary Agricultural Credit Society
PMJDY Prime Minister’s Jana Dhan Yojana (people’s wealth programme)
PPI Progress out of Poverty Index
PPP Purchasing Power Parity
PSIG Poorest States Inclusive Growth programme
RBI Reserve Bank of India
RRB Regional Rural Bank
RSBY Rastriya Swasthya Bima Yojana (National Health Insurance Scheme)
SCB State Cooperative Bank
SHG Self Help Group
SIDBI Small Industries Development Bank of India
PSC Project Steering Committee
UCB Urban Cooperative Bank
UP Uttar Pradesh (state)

3
ForewordI am happy to know that the Poorest States Inclusive Growth (PSIG) Programme, beingimplemented by Small Industries Development Bank of India (SIDBI), with the support ofUKaid, is publishing the report of the FinScope Survey conducted in the four PSIG states ofBihar, Madhya Pradesh, Odisha and Uttar Pradesh in India.
The FinScope Survey, developed by FinMark Trust based in South Africa, and is a scientificallydesigned survey methodology. In the present survey, it has weighted data of 16 000representative households in the four PSIG states of India. The report highlights the financialbehaviour of the households across the demography along with the different kind of risksperceived and ways of coping with them. It attempts to define financial inclusion with respectto gender, geography, age, income level and social groups. In addition to the household level,the report has also drilled down to whether an individual within a household is financiallyincluded or excluded. This makes the report usable in India to design appropriate financialservices for different categories of consumers.
The report has benchmarked the key riders of the financial inclusion and I am sanguine thatit would provide an impetus to the policy- makers for incorporating different options forinclusive finance.
My congratulations to the PSIG Team for their efforts.
Dr. Kshatrapati Shivaji CMD, SIDBI
Dr. Kshatrapati Shivaji
It is my extreme pleasure to know the report of the FinScope Survey is being published andI hope this brings up the financial inclusion status of the PSIG states and also flag issues ofconcern and opportunities to move further.
It is a happiest moment that the Poorest State Inclusive Growth (PSIG) Programme hasestablished a way forward in the inclusive finance sector in India particularly in the fourimplementing states viz. Odisha, Bihar, Madhya Pradesh and Uttar Pradesh in conducting theFinScope Survey in these states. The survey, taking little a longer than a year, has come outnicely in the form of a full-fledged report and brochure as ready reference. The compilationand analysis of both supply and demand side data on the financial services being accessedby the consumers has reflected the key successes as well challenges in front of the policymakers, regulators, bankers, financial intermediaries and implementers.
I appreciate the efforts of Dr. Prega Ramsamy, CEO, FinMark Trust, South Africa and hisresearch team in conceptualizing and implementing the FinScope Survey in four PSIG statesin India. My sincere thanks to the survey team of AFC India Ltd. New Delhi, India for theirtireless effort in collecting quality data from the field and EDA Rural Systems Pvt. Ltd. for theircoordination, facilitation and support for the implementation of the survey. Congratulationsto the PSIG team, both at DFID and SIDBI, for publishing the FinScope Survey report. I willwait for the repeat survey to see the potential changes that will have resulted in the post-PSIG implementation period.
David Elliott DFID, India
David Elliott
4
Executive SummaryFinScope Consumer India (PSIG) 2015 is the first financial inclusion survey of the Poorest States Inclusive Growth (PSIG) in which arepresentational cross-section of adult Indians were interviewed comprehensively about their financial behaviour, familiarity with financialterminology and their use of financial services. A total of 16,000 households were covered by the survey from which one person fromeach household aged 18 years or over was selected (with equal opportunity for interviewing in the second half of 2015).
The introductory Chapter (one) presents the background and the setting for the analysis. Some of the important issues relevant tothe use of the study are reviewed together with the interpretation of the data. The objectives of the FinScope Surveys developed byFinMark Trust (FMT) are also presented here. Differences between the FinScope findings discussed in this report and other surveyssuch as the AIDIS are in part due to differences in definition and scope of the surveys being compared, the computation of the variables,differences in terminology and focal areas (adult versus household) and the period the surveys were implemented. Hence, cautionshould be exercised when comparing variables in this report against other survey documents. Chapter two presents the literaturereview of the Indian financial sector, particularly relevant to the PSIG states. The chapter explores the financial products that areavailable to the public emphasizing the initiatives in the financial sector that have driven the agenda of financial inclusion. Further, thechapter looks at the economic variables such as sectorial production and gross domestic products of the PSIG states in relation to therest of India to give a background of the PSIG economic status. It shows that India (and the PSIG) has an extensive, diverse andapparently inclusive financial architecture. Despite significant growth in private sector banks in recent years, the public sector continuesto predominate; with 70% of total bank credit being accounted for by the government-owned banks.
Chapter three discusses the methodology used in the FinScope sampling and weighting methodology. It also specifies the data collectionand quality control measures put in place to ensure that high quality data was obtained and captured accurately. Training of enumeratorscommenced on 1st of July 2015 in Madhya Pradesh, 8th of July 2015 in Bihar, 15th of July 2015 in Odisha and 20th of July 2015 in UttarPradesh. Data collection started within a week from the first day of training in each state. The processes that were involved from thedesign phase of the study (sampling, questionnaire design, etc.) to the completion of the field survey were overseen and approved bythe Project Steering Committee.
Chapter four provides a socio-economic profile of the adult population of the PSIG states (sometimes households), which is criticalfor contextualising financial access, and the usage patterns of financial services. The variables analysed in the study are importantindicators of people’s livelihoods, their quality of life and means of survival. It shows that over half of the PSIG households live belowthe poverty line with 80% of the adult population residing in rural areas. About three out of ten adults have no formal education withfemales having about double the proportion of uneducated adults compared to males. The study also reveals that PSIG adults sourcetheir income from various places with salary or wages being the most popular source of income closely followed by farming oragriculture. Household remittances form an essential part in contributing to household income. The study also shows thatdocumentation and infrastructure are not real barriers to financial inclusion as nine out of ten adults have some form of documentation.Also, the average time taken to reach a financial service point is 30 minutes in both urban and rural areas.
Chapter five briefly discusses the financial behaviour of adults and explores their coping mechanisms for risk or hardships that they facedin the past year. Findings from this chapter are related to those of Chapter four that show many of the challenges are inter-twinnedwith education, income and gender. Many adults choose to reduce expenditure or use savings to cope largely with inflationary costsor illness within the household. Surprisingly, death-related risk was not mentioned although life insurance is a huge driver of insuranceuptake explored in chapter nine. To better understand the lives of adults in the PSIG states, statements concerning their financial liveswere asked. The study shows that about nine out of ten adults agreed to spend more money than they had available and seven outof ten adults found dealing with finances stressful.
Chapter six explains the Financial Access Strand based on the FinScope methodology and determinants of financial inclusion. TheFinScope methodology details the analytical framework through which the categorising of financial products is discussed. The chapterexplains how the banked population is further segmented into three sub-segments as well as the other categories of the FinScopeclassifications. FinScope estimates a total of at least 267 million adults in the PSIG states. These were put under investigation tounderstand their demographic landscape which is likely to affect how people interact with financial services.
Chapter seven presents the analysis of the levels of financial inclusion and exclusion using a livelihoods framework approach andFinScope indicators (overall uptake, overlaps, access strands and landscape of access), which give a holistic view of financial inclusionand livelihoods. Showing the results of financial inclusion across different demographics, a prominent finding is found in this chapter.Many of the households, even the poorest, living in rural areas or having informal income sources – have some form of financial accessto products and services. This gives context to the analysis of financial access and exclusion at individual level within the chapter. Thelink between financial access and households and individuals skews towards households – showing higher inclusion rates amongsthouseholds than among individuals.

5
Findings in this chapter indicate that the levels of financial inclusion in the PSIG states are high – 94% of households in the PSIG statesare financially included (either included formally or informally). Financial inclusion is driven by the uptake of the banking products andservices. When deducing levels of financial inclusion among adult individuals, one notes that 75% of adults have some type of financialaccount with formal providers. At household level, the most important finding showed that 92% of households in the PSIG state havebank accounts. This high penetration of banking products at household level allowed 241 million adult individuals in the PGIS state tohave bank accounts.
Bank product uptake is reviewed in Chapter eight. About 45 million adults are banked through PMJDY banking accounts (Jan Dhanbank accounts). Although the financial inclusion campaign has seen good progress, there is a significant amount of adults with bankaccounts that are inactive at 14% (25.5 million).
The usage of electronic payments in the PSIG states is relatively low, providing an opportunity for disrupting cash through acceleratingelectronic payments in the PSIG states. There is also still a number of unbanked adults (74 million), with the chapter exploring segmentsthat can be reached mainly rural areas, adults without formal education, Bihar state and women.
Chapter nine examines insurance, which is the main driver for other formal (non-bank) institutions. About 28% of all households areinsured and the percentage of adults insured is 20% largely being driven by life and medical insurance. Although adults face risks asdetailed in Chapter 5, the use of savings to cope with illness-related risk as well as inflationary costs is high. The main reason why adultsin the PSIG states do not have an insurance penetration in PSIG relates to affordability and a financial literacy deficit.
Savings patterns are explored in Chapter 10. Savings are the leading product type for the entire PSIG states and this is encouragingas savings are the key to enabling adults to create wealth, pay for household furniture and equipment and most importantly, enablesadults to use it as collateral for accessing credit. The chapter finds that people save mainly for medical emergencies (59%), whichexplains why the medical insurance is low. This low uptake of insurance may be attributed to the cost of medical insurance but linkedto this relatively small number is that about 5% of adults source their income from salary or wages from government or privatecompanies. This leaves the rest of the adults who may not have a steady income source to afford medical/health insurance to save forsuch expenses. Adults also save for developmental purposes such as education, buying livestock or farming equipment and business.
The credit uptake and behaviour is discussed in Chapter 11 and attempts to analyse the use of credit. The overall incidence of formalborrowing in the PSIG states is lower compared to formal savings. Only 9% (around 24.1 million) of the adults in the PSIG states borrowmoney from the formal institutions as compared to 73% that are saving. The proportion of adults who are borrowing from the formalsector varies significantly within the PSIG states with Bihar showing higher population from the informal sector mainly being pawnshops.Odisha’s population proportion of those borrowing is largely from the formal sector (22%), which is double that of Bihar’s borrowingpopulation proportion (10%). The main drivers for credit are similar to those of savings with buying livestock or farming equipmentbeing first and medical emergencies being second among others.
Remittances are discussed in Chapter 12. About one in twelve households (5.9 million) in the PSIG states remit (mainly receive)money from someone living in a different place at least monthly or few times in a year. The main channel used by households andindividual adults to remit is through the bank with mainly adults from Uttar Pradesh largely remitting from both urban and rural areas.Surprisingly, besides the use of banks for remitting money adults send or receive their money in cash (directly).
Chapter 13 presents the conclusions, recommendations and opportunities based on the results of the study. Conclusions areconsolidated under the issues of disparities (urban and rural) access issues; access and costs; product use; technology and innovation;and gender issues. Financial inclusion in the PSIG states is clearly driven by banking products. However, the landscape of bankingproducts indicates that banking clients are mainly served in terms of their savings needs (99% of banked population use it for savingcompared to 44% who reported transactional products). A significant number of the bank accounts are dormant (14%). The seconddriver of formal financial accounts is insurance penetration, at 21% of the PSIG adult population. Areas of concern are discussed in thischapter in particular the low health insurance uptake of adults, financial literacy and high dormancy rates for the banking accounts.Recommendations/opportunities focus on targeting the segments as identified in the study addressing segments that need attentionto achieve a fully banked society as envisaged by government of India and other development partners. These include innovative andaffordable financial products, financial education programs and further investigation of savings products and usage.

6
1. Introduction1.1. Background of the FinScope study in the 4 PSIG states of IndiaPoorest States Inclusive Growth Project (PSIG) programme, supported by UK’s Government Department for InternationalDevelopment (DFID) and implemented by SIDBI aims to enhance income and employment opportunities of poor women and menby enabling them to participate and benefit from wider economic growth in India. The programme expects to improve access for poormen and women to a variety of financial services in four low income states namely Bihar, Odisha, Madhya Pradesh and Uttar Pradesh.It is working to contribute to an appropriate policy environment, including a range of studies of different aspects of financial inclusionin the four states. The FinScope study has been commissioned to provide robust data on access and the barriers to access, as a basisfor more informed policy making and strategy.
The four states, Bihar, Madhya Pradesh, Odisha and Uttar Pradesh, are all located in the east-central region of the country and areamongst the most populous states of India, accounting between them for 34.6% of the population but only 16.3% of the GDP infinancial year 2012 – 13. In recent years all of these states have reported higher growth rates of per capita income than the countryas a whole though it is combined with lower credit to GDP and credit-deposit ratios than the national average. This suggests thesimultaneous effect of a high level of public sector investment which means a lower level of formal sector debt financing as a factor ineconomic growth. It further indicates a high degree of informal financing of economic activity in these states on account of a higherlevel of informal enterprise resulting in a significant proportion of debt in the economy going unrecorded. The lower C-D ratio meanslocal savings are largely being deployed productively in other parts of the country.
An important development in the Indian economy over the past couple of decades has been the shift in share of production from theprimary (agriculture and mining) sector to the tertiary/services sector which now accounts for over 59% of GDP. The relatively loweducational attainments and health indicators in the PSIG states have inhibitated the modernisation of these states relative to much ofthe rest of the country. Thus, the shift of the national economy towards relatively modern service activities like Information andTechnology (IT), communications and biotechnology have not brought much cheer to the PSIG states.
As a result of the efforts being made to promote financial inclusion in the country as a whole, the PSIG states are amongst those thathave received more attention in recent years resulting in a high proportion of rural/semi-urban branches. However, the populationper bank branch is still higher in the PSIG states than the average for the country as a whole – with Bihar performing particularlypoorly.
The FinScope survey is a research tool, which was developed by FinMark Trust. It is a nationally representative survey of how adultindividuals source their incomes, and how they manage their financial lives. It also provides insight into attitudes and perceptionsregarding financial products and services. The survey, by design, is intended to involve a range of stakeholders, thereby enriching thedata through a process of cross-cutting learning and sharing of information.
The information provided by this survey will help extend the reach of financial services in four states in India (Odisha, Uttar Pradesh,Madhya Pradesh and Bihar) as it will provide an understanding of the 4 PSIG states’ adult population in terms of:
n Their livelihoods and how they generate their income; n Their financial needs and/or demands; n The levels of financial inclusion (formal and informal) and the types of financial products (formal and informal, credit, savings,
etc.); n Their financial perceptions, attitudes and behaviour; n Their demographic and geographical distribution; n The obstacles they face and the factors that would have an influence on their financial situations; n Current levels of access to, and utilisation of, financial services and products (formal and/or informal); n The landscape of access (i.e. types of products used in terms of transactions, savings, credit, insurance and remittances); n Drivers of financial products and service utilisation; andn Barriers to, utilisation of, and access to, financial products and services.
This report documents the principal findings of the survey and presents recommendations for stakeholders of India’s 4 PSIG states andother interested stakeholders.The breadth of information collected in the survey allows analysis of the population across a multitude of different variables such as
7
specific state, rural/urban, income level, household size, age group, gender among other demographic variables. This report capturesthe main findings in a manner comparable to FinScope reports in other countries. However, further in-depth analysis could beperformed on the data that has not been covered in this report. Stakeholders are recommended to review the data available in orderto help them to address financial and development questions that are of importance and significant to them.
FinScope India PSIG 2015 is a state level representative survey, with reporting domains ranging from urban and rural levels. With asample of 16,000 adult individuals, it provides estimates for the aforementioned domains state, urban and rural levels.
The FinScope India PSIG 2015 survey is designed to involve a range of stakeholders engaging in a comprehensive consultation process.FinScope surveys provide an in-depth analysis that, serve the informational needs of policy makers, financial services providers, donorsand researchers. This process has enriched the survey and the shared results have contributed meaningfully to members who have acommon interest in financial inclusion.
The FinScope Consumer Surveys have been conducted and completed in 17 African and 6 Asian countries including India’s PSIG states.Because the FinScope methodology includes savings mechanisms or investments as financial services, each country’s inclusion of whatconstitutes the main forms of savings or investment are different and prone to the local context. Of importance in the long term,however, is the manner in which the methodology is robust and consistent with other studies and data sources.
As a guide to the reader, caution must be exercised when comparing FinScope survey findings for the PSIG states against other surveysconducted covering similar financial access variables. These differences can be explained by:
n Definition and scope: FinScope uses its methodology from the design of the survey to the analysis and reporting of thevariables which may be similar to those used in other surveys but may likely be constructed differently. Further, FinScope isboth an adult and household survey that allows for comparison with other surveys but taking into account the differences asstated earlier. The terminology may also be different such as ‘currently borrowing’ used in FinScope and ‘incidence ofindebtedness’ used in the AIDIS;
n Different focal area: With the FinScope survey focusing only on the PSIG states, comparison against other Indian wide surveymay differ in comprehensiveness and representativeness; and
n Time of survey: Financial landscapes change rapidly over time and differences in data points between FinScope and othersurveys should be explored and explained by other data points.
1.2. About SIDBISmall Industries Development Bank of India (SIDBI), set up on April 2, 1990 under an Act of Indian Parliament, acts as the PrincipalFinancial Institution for the Promotion, Financing and Development of the Micro, Small and Medium Enterprise (MSME) sector and forCo-ordination of the functions of the institutions engaged in similar activities.
The business domain of SIDBI consists of Micro, Small and Medium Enterprises (MSMEs), which contribute significantly to the nationaleconomy in terms of production, employment and exports. MSME sector is an important pillar of Indian economy as it contributesgreatly to the growth of Indian economy with a vast network of around 4.6 crore units, creating employment of about 11 crore,manufacturing more than 6,000 products, contributing about 45% to manufacturing output and about 40% of exports in terms ofvalue, about 37% of GDP, directly and indirectly.
1.3. About FinMark TrustFinMark Trust, an independent trust based in Johannesburg, South Africa, was established in March 2002 and is funded primarily by UKaidfrom the Department for International Development (DFID) through its Southern Africa office. More recently some other funders(UNCDF, Bill & Melinda Gates Foundation and MasterCard Foundation) have come on board to support the work of FinMark Trust.FinMark Trust is a not-for-profit independent trust whose purpose is ‘Making financial markets work for the poor by promoting financialinclusion and regional financial integration’. In pursuit of its purpose, FinMark Trust supports institutional and organisational developmentwhich increases access to financial services in Africa, by conducting research to identify the systemic constraints that prevent financialmarkets from reaching out to poor consumers and by advocating for change on the basis of research findings.

8
Figure 1: FinScope Consumer Survey India (PSIG) 2015
Project SteeringCommittee
DFIDProject funding
FinMark TrustTechnical Support
SIDBIPSIG Implementation
EDALocal Project Co-ordinator
AFCLocal Research House
The structure and organisation of the FinScope Consumer Survey India (PSIG) 2015 is displayed in Figure 1 above.
1.4 About DFIDThe Department for International Development (DFID) leads the UK’s work to end extreme poverty, building a safer, healthier, moreprosperous world for all of us which is firmly in the UK’s national interest. We are ending the need for aid by creating jobs, unlockingthe potential of girls and women and helping to save lives when humanitarian emergencies hit.
UK’s Department for International Development (DFID) partnered with Small Industries Development Bank of India (SIDBI) to deliveran ambitious Poorest State Inclusive Growth (PSIG) Programme in 2012. This seven-year £30m technical assistance programme aimsto increase responsible access to financial services for 12 million low income households in four poorest states of India – Uttar Pradesh,Madhya Pradesh, Bihar and Odisha. This programme is currently in its fourth year of operations has three distinct but interrelated outputsof working at policy, institutional and client level.
1.5. Partnering for a common purposeThe FinScope Consumer survey was conducted under the supervision of the Project Steering Committee and was customised to takeinto account the Reserve Bank of India (RBI) definitions and socio- economic survey norms in India. The process was overseen andapproved by various members of the Project Steering Committee. During the course of the survey, guidance was taken from the ProjectSteering Committee, FinMark Trust, DFID, EDA Rural Systems as Local Project Coordinator and AFC as the research house.
DFID is a ministerial department, supported by 2 agencies and public bodies. For more information, please visit:https://www.gov.uk/government/organisations/department-for-international-development

9
2. The Financial Sector in India and the PSIG States2.1. Financial architecture of the Indian financial sectorThis sections looks at the existing literature and supply-side information which will provide background and context to the results ofthe survey.
India has an extensive, diverse and apparently inclusive financial architecture. Table 1 and Figure 2 summarise the various levels of theIndian financial system – numbers of institutions/groups, fund flows and regulatory relationships. At each level the financial inclusionagenda plays an important part in the geographical spread of institutions and the product mix offered by them. Despite significantgrowth of the private sector banks in recent years, the public sector continues to dominate; the 26 government-owned banks accountedfor over 70% of total bank credit outstanding at the end of March 20131.
1 Much of the discussion of the financial sector in this report is based on data for end-March 2013 or earlier. It is taken largely from RBI annual publications,Trend and Progress of Banking in India and Statistical Tables on Banks in India. During 2014, the former was not published and the latest edition of thelatter (containing March 2014 data) has not been published yet.
Type of financial institution Institutional ownership Regulator Number of institutions
Commercial Banks
Government of India
RBI
26
Private – Indian 20
Foreign 41
Regional Rural Banks (RRB) Government RBI 56
Local Area Banks Private – Indian RBI 4
State Cooperative Banks DCCBs/State government State government 31
District Cooperative Banks PACS/individuals RBI 371
Primary AgriculturalCooperative Societies (PACS)
Individuals State government ~92 000
Urban Cooperative Banks(UCBs)
Individuals as members RBI 1 589
India Post Government of India Self 1
Non-Bank Finance Companies(NBFC)
Private – Indian, some partlyor wholly foreign
RBI12 375 of which approx. 90 are micro-finance NBFCs
NGOs: Societies/trusts No ownership structure Central/state government Approx. 180 in microfinance*
Self help groupsUnregistered – memberequity
Self, some supported/guidedby NGOs
1. With outstanding bankloans – 4.20 million
2. With bank savings accounts– 7.43 million
Table 1: India's financial system
The inclusive finance architecture of India is, thus, predominantly composed of public sector commercial banks that have large numbersof rural and semi-urban branches, government-owned Regional Rural Banks (RRBs) and heavily state-supported cooperative banks (CBs)along with their linked cooperative credit societies (PACS). Self-help groups (SHG) have the largest outreach in terms of membership(100 million members) and are serviced largely by the public sector banking system (including RRBs and CBs). Member-owned UrbanCooperative Banks (UCBs) play a relatively small role in servicing the poor though their outreach to urban low-income families issignificant in some states. For deposits there is also India Post with many offices in villages. In the context of financial inclusion, it is mainlynon-bank finance companies engaged in microfinance (MF NBFCs) that are (largely) owned by private investors that provide small loansto vulnerable sections of people. Until now, these institutions have not been permitted to provide deposit services; as a result, theyhave provided mainly micro-credit to low-income families with (80%) debt funding from commercial banks (both government ownedand private banks) and investor funds (20%).
Sources: RBI reports, NAFSCOB Annual Report 2013-14, NABARD: Status of Microfinance in India, 2013-14 (for SHGs) and M-CRIL estimates for Indian MFIs. * According to the Sa-Dhan Directory of MFIs, 2014.

10
Microinsurance is mostly offered directly by insurance companies – both government owned and private. There is one governmentowned life insurance company – Life Insurance Corporation of India (LIC) and 4 government owned general insurance companies. Inaddition there are 23 private life insurance companies and 22 general insurance companies (five of which specialise in health insurance,although all offer health insurance products)2. The LIC (by far the largest of the life insurers) has over 75% of the market in terms ofpremium collected, although India Post has a large number of active life insurance policies3. The government-owned insurance companieshave 55% of the non-life insurance market (in terms of premium collected).
2 www.irda.gov.in – the website of the insurance regulator.3 IRDA Annual Report 2013-14. Due to the likelihood of multiple counting there is no information on the number of lives insured
Source: EDA Rural Systems Private Ltd (2015) literature review
Regulator
Reserve Bank of India
Commercial banks
Government owned: 26 Private Indian: 20
Foreign: 41
Development banks
National Bank for Agriculture & Rural Development (NABARD)
Small Industries Development Bank of India(SIDBI)
Regional Rural Banks: 56Local Area Banks: 4
State Cooperative Banks:31
District Central Cooperative Banks:
371
Urban
Cooperative
Banks: 1,589
Non@bank Finance
Companies (NBFCs):
Total: 12,375 of which, deposit taking, 336; engaged in microfinance:~55
Non@government
organisations as MFIs
(NGO MFIs)
Total:~500
Joint Liability Groups/
Grameen Groups'
25 million members
Self Help Groups
4.2 million credit-linked'7.4 million savings linked'
100 million members
Primary Agricultural Cooperatives (PACS):
~92,000
Key
Regulatory relationshipFlow of funds
*all numbers in the figure are for numbers of institutions except where otherwise stated
Figure 2: Structure of India credit system

11
2.2. The financial inclusion landscapeThe inclusive finance architecture of India is predominantly composed of public sector commercial banks (which account for 70% oftotal bank credit) with large numbers of rural and semi-urban branches, government-owned Regional Rural Banks (RRBs) along withheavily state-supported cooperative banks (CBs) and their linked cooperative credit societies (PACS). Deposit and remittance servicesare also available through the 150,000 outlets of India Post. Self-help groups (SHG), which have the largest outreach in terms ofnumbers, are also serviced largely by the public sector banking system. It is mainly non-bank finance companies engaged in microfinance(MF NBFCs) that are owned by private investors. Until now, these institutions have not been permitted to provide deposit services;as a result, they are focused on micro-credit to low-income families. Both public sector and private companies provide insuranceservices while health microinsurance and micro-pensions are managed mainly by government agencies.
There is a range of apparently inclusive financial products – lines of credit for farmers and artisans (KCC and GCC from banks) andloans from cooperatives, SHGs and MFIs. MFIs are not allowed to offer deposits, SHG deposits are quasi-compulsory and small in sizeand cooperatives have poor governance, hence, a bad reputation, limiting public interest in their offering. The new, low balance, bankdeposit accounts (BSBDAs) are yet to become widely used. These have been greatly expanded over the past year through the PrimeMinister’s Jan Dhan Yojana (PMJDY) which now has over 217 million accounts*.
Microinsurance regulation in India has led to services becoming widely available, though mainly through linkage with the loans providedby MFIs, RRBs and cooperative banks. Over the past few years government implemented microinsurance for hospitalisation and micro-pensions have also become available and coverage of low income populations is being rolled out more widely than before. The statesponsored insurance schemes have a dominant welfare character and may not be commercially viable.
In theory, there is a substantial network of financial service contact points including bank branches and large numbers of businesscorrespondents, SHGs, cooperatives and MFI branches spread over the country and India Post offices for deposit and remittanceservices. In practice, many of these contact points overlap on account of the limited service offering from each one and, as a result,there remain large gaps in the system – in terms of geography or services available – that result in incomplete outreach.
However, the extent of financial inclusion is still low despite the efforts of the government and RBI to promote the opening of depositaccounts with the banking system. Just 6.8% of all deposits are in inclusive accounts and the latest Financial Inclusion Tracker Surveyby Intermedia in late 2013 showed that only 47% of adults had registered bank accounts and half of these, mostly basic accountsopened for subsidy transfers, were inactive. The Findex Survey for 2014 reports 53% of the population (but only 43% of women, 63%men) with bank accounts.
Credit outstanding has been stagnant in real terms except in loans for agriculture. Under pressure from the government, the bankingsystem has expanded its lending to farmers quite significantly in recent years while GCCs have expanded even faster. There has beena substantial thrust on lending through various poverty reduction schemes. However, overdraft facilities in the more inclusive BSBDAsare still small so as to be almost negligible and the real value of loans from SHGs and MFIs have been stagnant over many years resultingin a natural incentive for multiple borrowing as the real GDP per capita rises. While 11.4% of all credit has been provided throughinclusive accounts, much of this is to relatively large farmers (with more than 2 hectares landholding) who are unlikely to be financiallyexcluded.
There is insufficient information on insurance to make an assessment of the growth of microinsurance but the overall growth ofpremiums collected by the insurance sector, 9.4% for life insurance and 12% for non-life insurance points to reasonable growth. Thenumber of insurance agents is significant though the sale of microinsurance is mainly through aggregators like cooperatives, RRBs andMFIs. Rural Postal Life Insurance, which has been available for a number of years and now has 15 million active policies still covers asmall proportion of the population and is growing relatively slowly at 5% per annum. However, life insurance cover of ₹30,000 to 188million account holders through the PMJDY has the potential to provide some relief to low-income families. Similarly, hospitalisationcover of ₹30,000 per annum to 36 million of 247 million families (26% of them in PSIG states) also provides some relief in states likeOdisha where coverage is relatively high (66%) but less so in Bihar where it is low (12%). Limited information on crop insurancesuggests a coverage of 15-25% of cultivated area nationwide but around 40% in MP.
Inclusive finance products available in India are summarised in Table 2. Deposits cannot be offered by non-bank finance companies whichrules out MFIs (with more than 25 million client accounts) from providing deposit services.
* As of 5 May 2016. Source: PMJDY webpage, DFS, MOF, GOI

12
Product Institutions Purpose Term/collateral Interest rate
Deposits
Passbooksavings
All types of banks,PACS, India Post
Intermittent savings,individual fund management
Indefinite 4%
Termdeposits
All types of banks,India Post
Long term savings 6 months to 5 years 4.5% - 8.5%
Recurringdeposits
Regular savings 12 - 120 months Same as term deposits
Credit
Loans toSHGs
Commercial banks,RRBs
On-lending to members 3 years, no collateral 11.5-12.5%
Kisan CreditCards (KCC) Commercial banks,
RRBs, CooperativeBanks
Farmers’ agriculturaloperations Line of credit – reviewed
annually, proof of crop landownership/no collateral upto ₹100,000
7% (additional 4% subsidyfor on-time payment insome states11.5-12.5%
GeneralCredit Cards
Entrepreneurial finance fornon-farm productionactivities up to ₹50,000
Cooperatives PACS Agricultural operations6-12 months, collateral asabove
As for KCC
Microfinanceloans by MFIs
Microfinanceinstitutions
Productive investmentsMainly 12 months, ₹15,000,up to 24 months, nocollateral
24-30%
Microinsurance
Name Offered by Insurance type Cover up to Sold via
JeevanMadhur
Life Insurance Corp &similar productsoffered by others
Life, premium paid weekly,monthly, quarterly, bi-annually
₹30,000Individually or to groups viafinancial institutions includingcooperatives and MFIs
Health andpropertyinsuranceproducts
Most of over twodozen generalinsurance companies
Health, accident, fire,property
₹50,000
Family healthinsurance
RSBY – NationalHealth Insurance
Hospitalisation₹30,000 per annum (5 familymembers)
Ministry of Health
Rural PostalLife Insurance
India Post Life ₹500,000 Individually
Cropinsurance
Agricultural InsuranceCorporation of India
For food-grain and a fewother notified crops
Average yield of previous 7years or bank loan amount
Individually or compulsorilyvia bank (KCC)
Remittances
Name Offered by Type Cost
Moneyorders India Post Person-to-person ~5% of money order value
Banktransfers Banks G2P and P2P Variable ~0.005%
Table 2: Inclusive finance products
Source: EDA Rural Systems Private Ltd (2015) literature review

13
The savings linkage of over 100 million members of SHGs is limited to relatively small quasi-compulsory savings made by members asa means of accessing bank credit (often around 25% of the bank credit applied for). It is termed as thrift rather than savings, sincewithdrawals are limited (and sometimes practically impossible). Although PACS have considerable outreach, they have suspect viabilityand serious governance issues. They are, therefore, not preferred as deposit-taking institutions. The limited avenues available for smalldepositors are to have either savings accounts at banks or post offices. The postal deposit system has been in decline for many yearsdue to low information technology adoption, slow response to competition, low service quality and the reduction of interest rates ondiferent small savings products of the government offered through the post offices. The network has not expanded in recent years.Nevertheless, post offices are located predominantly in rural areas and the postman continues to be a familiar figure in villages facilitatingoutreach to large numbers of otherwise under-served rural families. The products offered to individual depositors in banks are similaracross the financial system as is interest paid (except in the case of one private bank which pays a somewhat higher rate on passbooksavings accounts).
All the institutions shown in Figure 2 offer credit products. The main lenders to large numbers of low income (financially excluded)persons are SHGs, PACS and MFIs. However, the quantum of loans from SHGs and MFIs is small and the credit offering of MFIs is rigid;it is based on a number of cycles of borrowing (each usually 12 months) from the MFI rather than on the needs of the borrower. SHGloans (average outstanding ₹7,306, $120) are even smaller than MFI loans (average ₹9,920, $165). These translate to loan disbursementsof the order of ₹10,000 and ₹15,000 respectively and do not provide reasonable funding for any entrepreneurial activity likely to yielda worthwhile income. As a result, borrowers are often compelled to seek additional loans for investment leading to borrowing frommultiple sources and sometimes, consequently, to over-indebtedness4. PACS lend mainly for agricultural operations and are, therefore,limited to those owning agricultural land5. Similarly, the commercial banks have Kisan Credit Cards (for farmers) and General CreditCards (for artisans) while Regional Rural Banks provide small loans to dispersed borrowers in rural and semi-urban areas.
Microinsurance has been promoted by the insurance regulator (Insurance Regulatory and Development Authority, IRDA) over the pastten years; India was one of the first countries to introduce microinsurance regulation, in 2005. As a result microinsurance products havebecome widely available mainly through linkage with loans provided by MFIs, RRBs and cooperative banks. Credit-Life insurance is anattractive proposition for lending institutions to promote since it provides assurance of loan repayment in case of a borrower’s death.Most microinsurance policies, whether for life or assets, are provided as group insurance mediated through lending institutions, aproposition that is advantageous to both the lender and insurer. There are 21 life microinsurance products registered with the IRDA6.Other microinsurance products are also promoted in the same way but do not yet have extensive outreach. The older postal lifeinsurance service has significant outreach but its cumbersome procedures limit its utility.
4 This is discussed further in Section 3 of the M-CRIL Microfinance Review 2014.5 Also available, in theory, to leasehold farmers but since the practice of registering leases is not common it is difficult for leaseholders to get loans either
from cooperatives or KCCs from the banks.6 IRDA Annual Report, 2013-14, page 153.
2.2.1. Prime Ministers Jan Dhan Yojana (PMJDY)A national programme to accelerate financial inclusion through opening of at least one bank account per household in the country wasunveiled in August 2014. The opening of bank accounts has been at a brisk pace and most states have reported complete coverage ofall households in the state. The data on number of accounts opened in the PSIG states is found in Table 3. The access to savingsaccounts data indicated from the results of the FinScope survey would have undergone a significant change and should be read in thecontext of the subsequent development of opening of PMJDY accounts.
State No. of PMJDY Accounts (million)
Rural Urban Total
Bihar 13.83 6.19 20.02
Madhya Pradesh 9.43 9.37 18.80
Odisha 6.26 2.11 8.37
Uttar Pradesh 19.70 12.84 32.54
India 133.45 83.95 217.40
Table 3: PMJDY account access

14
2.2.2. Financial inclusion in the PSIG states lags behind the average for the countryThe coverage of low-income families by inclusive deposit accounts (even without taking low value commercial bank deposit accounts)exceeds 100% for 3 of the PSIG states indicating significant multiple holding of such accounts. In UP, however, this coverage is just 44%and the difference in coverage with the other states is so large that the reporting of numbers of cooperative members appears to befaulty. The result of this low number of accounts is that the average deposit balance in such accounts in UP is nearly ₹12,000, comparedto significantly lower levels in the other states and a national average of ₹7,400. Odisha performs reasonably but both Bihar and MPhave low coverage relative to the national average.
Bank credit in all the states is growing at a reasonable rate but not substantially higher than the 10 – 12% inflation over the past fewyears and not much higher than the national average credit growth of 18.1%. Bank credit in Odisha in particular has grown at muchless than the national average. Deposits per capita are 3% in Bihar and 7% of the average per capita income in Odisha while MP hasa more reasonable 16%. Information from the All India Debt and Investment Survey (AIDIS) shows that 314 of every 1,000 householdsare indebted in rural areas and 224 of 1,000 in urban areas. In rural areas, 34% of debt still comes from moneylenders thoughinstitutional sources now account for 53%. State-wise information shows the low quantum of debt in Bihar and in rural Odisha thoughthe low asset holdings in these areas result in high debt-asset ratios in rural as well as urban Odisha.
In this light the findings of the FinScope Survey will be invaluable for designing more appropriate financial products to meet the needsof all citizens.
Despite opening over 370 million basic deposit accounts (by October 2015) at banks and directly through business correspondents,effective financial inclusion is quite limited from a medium term perspective. Despite an increase in subsidies (DBTs) being disbursedthrough such accounts, the average number of transaction is still below 3 (though the absolute amount has increased to ₹4,500 ($75)over the past few years. Even active bank accounts are not used significantly for anything other than making deposits and withdrawals;just 6% of the population is even aware of mobile money while only 0.3% have actually used such services.
In this context, it is important to understand the extent to which these accounts and other mechanisms of financial inclusion discussedin this report are meeting the needs of the low-income population and other financially excluded bankable adults. The results of theFinScope Survey are therefore expected to provide feedback to key stakeholders such as policymakers, regulators, and financial serviceproviders in order to enable the design and provision of increasingly appropriate financial services for the needs of all citizens.
Indicators (31 March 2013) Bihar MP Odisha UP Rest of India
Population, million (March 2011) 104 73 42 200 1,210
Population, million (March 2011)% Urban 11.3 27.6 16.7 22.3 31.2
Population, million (March 2011) % Literacy 63.8 70.6 73.4 69.7 74.0
GDP 2012-13 (₹ billion) 2 871 3 330 2 107 6 837 77 576
GDP per capita ₹ 28 774 44 989 49 241 33 137 67 839
Poverty ratio, % 53.5 36.7 37.0 37.7 29.8
Unemployment rate (%), rural 20 7 30 10 16
Urban 73 29 42 29 34
Life expectancy at birth, years (female) 66.2 63.8 63.9 63.7 67.7
Life expectancy at birth, years (male) 65.5 61.1 62.2 61.8 64.6
Infant mortality rate, per 1000 live births 44 59 57 57 44
Table 4: Key statistics on the PSIG states
Source: Compiled by EDA Rural Systems Private Ltd (2015) from different sources

15
7 The GDP of $1,130 in 2012-13 is distinct from India’s GNI of $1,570 in 2013 as calculated by the World Bank using the Atlas method. GNI (GrossNational Income) is different from GDP (Gross Domestic Product) as it includes income earned by a country from abroad. Naturally, GNI figures arenot calculated for states within a country so GDP is the only basis for comparing intra-country regional economies
This situation is explained by the comparative GDP per capita information in Figure 5. The GDP per capita of UP and Bihar was lessthan half of the country as a whole in 2012-13 (₹68,000, $1,130)7. In terms of per capita income the two states are ranked 28 and 29respectively amongst the 29 states while MP is ranked 24 and Odisha, 23. Both the latter states have better per capita incomes onaccount of significant returns from the primary sector: forestry and mining that do not always benefit the poorest families.
In recent years, however, all of these states have reported higher growth rates of per capita income than the country as a whole, withBihar (25.6%), MP (18.5%) and Odisha (17.6%) being the three fastest growing states while UP (11.2%) is just ahead of the nationalaverage growth rate of per capita income of 9.7% for 2012-13.
Figure 5: GDP per capita growth (2012-13)
Source: Economic Survey, 2013-14.
80 000
70 000
60 000
50 000
40 000
30 000
20 000
10 000
0
80%
70%
60%
50%
40%
30%
20%
10%
0%
28 774
44 98949 241
33 137
67 839
Bihar MP Odisha UP India
GDP per capita, ₹Growth % previous yearCredit/GDP ratio
2.3. The supply of inclusive financial services – India and the PSIG statesThe Poorest States Inclusive Growth Project (PSIG) focuses on promoting inclusive financial services in four of the poorest of the 29states (and 7 Union Territories) of India. The four states of Bihar, Madhya Pradesh, Odisha and Uttar Pradesh are all located in the east-central region of the country and are amongst the most populous states of India, accounting between them for 34.6% of the populationbut only 16.3% of the GDP in financial year 2012-13 as illustrated in Figures 3 & 4. Of particular note are UP and Bihar that togetheraccounted for over 25% of the 1,210 million population in March 2011 but only 10.5% of the GDP of ₹77,576 billion (~$1.3 trillion)during 2012-13.
Figure 3: Distribution of population, PSIG 2011
8.6
65.4 n 8.6% Biharn 6.0% MPn 3.5% Odishan 16.5% UPn 65.4% Rest of India
6.0
16.5
3.5
Figure 4: Distribution of GDP, PSIG FY 2012-13
3.1
83.7 n 3.1% Biharn 3.6% MPn 2.3% Odishan 7.4% UPn 83.7% Rest of India
3.6
7.4
2.3
Source: Census of India, 2011 Source: Economic Survey, 2013-14

16
The indicators of economic vibrancy for India as a whole are good. The savings rate of 30.1% in 2012-13 is ranked a highly respectable27 out of 134 countries for which data is available (in the World Bank’s database) and in excess of most developed countries (thoughstill significantly behind China’s 50%). Like GNI though, savings rates for states are not available. However, the deposit and credit toGDP/SDP ratios for the banking sector are available and these are less encouraging than the growth rates of GDP per capita. The creditto GDP ratios of 17% for Bihar and 30-35% for MP, Odisha and UP are well below the national average of 71% (see blue line in Figure5 and Table 5) as are the ratio of deposits in the banking sector to SDP. Bihar, in particular, lags substantially behind the national averages.All the PSIG states have received much less credit than the banking sector provides in other states with the C-D ratio at just 30-57%compared to the national average of 78%.
State SDP/NDP₹ in billion Deposits Credit C-D ratio
%Deposits/SDP
%Credit/SDP
%
Bihar 2 871 1 652 497 30.1 57.5 17.3
Madhya Pradesh 3 330 2 008 1 158 57.7 60.3 34.8
Odisha 2 107 1 440 663 46.0 68.3 31.5
Uttar Pradesh 6 836 5 150 2 247 43.6 75.3 32.9
India 82 560 70 513 55 065 78.1 85.4 66.7
Table 5: Credit and deposit ratios in PSIG states, 2012-13
Source: EDA Rural Systems Private Ltd (2015) literature review
As pointed out in the paper on the need for an inclusive banking structure, commissioned by the PSIG programme, the credit-depositratios for the PSIG states are lower than the 60% C-D ratio than the public sector banks were asked to achieve in 1980 for the ruraland semi-urban areas of the country8.
The combination of high growth rate and low credit to GDP and C-D ratios suggest the simultaneous effect of two phenomena in theeconomies of these states
1 A high level of public sector investment which means a lower level of debt financing as a factor in economic growth, 2 A high level of informal financing of economic activity in these states on account of a higher degree of informal enterprise there
than in the rest of the country resulting in a significant proportion of debt in the economy going unrecorded.
If the recent high growth rates of these states are to be sustained the financial inclusion effort will need to be reinforced and a concertedpush will be required to improve the flow of credit to enterprises there.
8 Mahajan, Vijay, 2014. Call for an Inclusive Banking Structure by 2019, Fifty Years after Bank Nationalisation. SIDBI/PSIG, DFID and ACCESS Assist.

17
Figure 8: Sectoral distribution of PSIG economies (%)
5
22
73
25
28
47
25
16
59
11
44
45
25
16
59
n Primaryn Secondaryn Tertiary
Bihar MP Odisha UP India
Sources: Economic Surveys of the respective states
2.3.1. Shifts in the economy that affect financial inclusionAnother important development in the Indian economy over the past couple of decades has been the shift in share of production fromthe primary (agriculture and mining) sector to the tertiary (services – trade, tourism/hotels, transport, communication, finance &personal services) sector. Figures 6 & 7 show the sectoral shift in India’s GDP from 23% in the primary sector in 2002-03 to just 16%in 2012-13 while the tertiary sector expanded its share from 52% to 59% of the economy.
Figure 7: Sectoral distribution of GDP, 2012-13
15.9
58.8 n 15.9% Primaryn 25.3% Secondaryn 58.8% Tertiary
25.3
Figure 6: Sectoral distribution of GDP, 2002-03
23.1
52.5 n 23.1% Primaryn 24.4% Secondaryn 52.5% Tertiary
24.4
Source: Economic Survey, 2013-14 Source: EDA Rural Systems Private Ltd (2015) literature review
While the PSIG states show significant similarities in terms of economic growth, there are substantial differences in economic structure.This is presented in Figure 8. While the sectoral distribution of Odisha’s State Domestic Product (SDP) in 2012-13 closely matchedthat of India as a whole, those of Bihar and MP were significantly more agriculture oriented (at 22% and 28%) respectively whileagriculture in UP still contributed a substantial 44% to SDP. Like Odisha, the secondary sector of MP matched that of the country(~25%) while UP and Bihar had smaller manufacturing sectors (11% and 5% respectively). MP and UP have 47% and 45% servicessector income while Bihar has a substantial 73%.

18
The sectoral characteristics of the economies of these states are summarised in Table 6. Essentially, Bihar’s poverty is intrinsically relatedto its low agriculture productivity and lack of mineral resources. Conversely, Odisha also has low agriculture productivity but issignificantly better off due to its natural resources leading to large mineral-based production units and power generation capacity. MPhas a vibrant commercial crop economy in the western part of the state and western UP has irrigated commercial agriculture. UP’seconomic indicators are dragged down by the lower productivity of the eastern and southern parts of the state though sugarcane isa major cash crop in the east as well. All the states have major tourist sites. UP is the best endowed with the Mughal architecture ofAgra and Fatehpur-Sikri and the Hindu holy city of Varanasi. MP has the ancient temples of Khajuraho as well as animal sanctuary inthe forests of central India while Odisha has the ancient Konark temple and the holy city of Puri. Bihar is a major destination forBuddhist pilgrims from all over Asia visiting Bodh Gaya (site of Buddha’s enlightenment) and the site of the ancient university at Nalanda.
The drawback of all the PSIG states is that the high share of services there reflects low earning traditional services and transport whilemost of the modern software/IT and financial services are located in other states. Automobile production, power resources and themajor pharmaceutical production centres are also outside these states. The modernisation of these states is limited by relatively loweducational attainments and health indicators relative to the rest of the country. The national economy has significantly shifted towardsrelatively modern service activities like IT, communications and biotechnology , but the PSIG states have not been able to achieve theshifts at the pace of other states.
State Primary Secondary Tertiary
BiharFruit – mango, litchi, honeyLow productivity food-grainagriculture, fish
Handloom and art basedproducts
Traditional personal services,transport, communications,Buddhist tourism
Madhya PradeshMajor producer of soya bean,pulses, gram, oilseeds, minorforest produce
Cement, soya products,ayurvedic medicines, powergeneration
Traditional personal services,communications, tourism
OdishaLow food-grain production,minor forest produce, mining
Mineral based industries – steel,aluminium, power
Traditional personal services,communications, tourism
Uttar PradeshFood-grain production,sugarcane, livestock/milkproduction, fish
Handloom, handicrafts, leatherproducts, sugar, electricalappliances and electronics,cement
Traditional personal services,communications, tourism, IT &software (near Delhi)
Table 6: Sectoral characteristics of PSIG economies
Source: EDA Rural Systems Private Ltd (2015) literature review

19
2.4. Related studies on financial inclusion in the PSIGThere have been other surveys and studies relating to financial inclusion that covered the PSIG states.
2.4.1. All-India Debt and Investment SurveyThe All-India Debt and Investment Survey (AIDIS) is an important study that is carried out in intervals of about 10 years. The last surveywas carried out in 2013A with the reference date of 30 June 2012. The survey provides information relating to household assets,household debt to formal and informal sector institutions, debt to asset ratio, disaggregated data on debts, holding of deposit accountswith banks and post offices and remittances received. The survey is a large format one, covering 8,000 villages/blocks and 110,000households in all states in India. In the PSIG, the coverage is found in the Table 7.
State No. of villages/blocks No. of households
Bihar 354 4 898
Madhya Pradesh 442 6 093
Odisha 298 4 127
Uttar Pradesh 974 13 543
Table 7: Distribution of the AIDIS survey
The National Sample Survey Organisation (NSSO) – Government of India, also carried out a survey of agricultural households acrossthe country to bring out a report on Key indicators of Situation of Agricultural Households in India 2013B. The survey report providesinformation on income and expenditure of agricultural households, sources of incomes, debt levels by source, access to and use of cropinsurance.
While to a large extent the findings of FinScope survey are aligned to the findings of surveys carried out by NSSO in 2013 there aresome aspects in which there are differences. In MP, access to credit and remittances as found in the FinScope surveys is considerablyless than the levels reported in the AIDIS 2013 survey. The reasons for the difference could be the questionnaire design, underlyingsample characteristics and the product level awareness of the respondents as explained in chapter one.
2.4.2. CRISIL Inclusix – financial inclusion indexCRISIL, a credit rating entity has been publishing an index of financial inclusion called CRISIL Inclusix in the country providing comparativedata for the different states. The index seeks to measure penetration of financial services in terms of bank presence, credit and depositpenetration. The inclusion scores for the PSIG states for the year 2013 is found in Table 8.
Source: A Key Indicators of Debt and Investment in India 2013– National Sample Survey Organisation (GOI) 70th Round – December 2014.B Key indicators of Situation of Agricultural Households in India 2013 - National Sample Survey Organisation (GOI) 70th Round – December 2014.
State CRISIL Inclusix score
2013 2010
Bihar 30.2 21.4
Madhya Pradesh 40.5 29.1
Odisha 55.2 36.7
Uttar Pradesh 40.1 31.5
India 50.1 37.6
Table 8: CRISIL Inclusix score
The progress in inclusion, as reported in Inclusix score, in Odisha, MP and Bihar has been better than the national growth rate, whilegrowth in UP has been stagnant.

20
Figure 9: Survey implementation stages
DesignFieldwork &
Data processingAnalysis & reporting
Dissemination
Literature review
Sample design
Focus GroupDiscussions (FGDs)
Questionnaire update
Piloting & finalisation
Training of field teams
Data collection
Supervision and qualitycontrol
Data entry
Data cleaning
Data weighting
Tabulations and cross-tabulation
Presentation ofpreliminary results tothe Project SteeringCommittee
Input from the ProjectSteering Committee
Report finalisation
Public launches in the 4states and 1 in Delhi
3. Methodological approachThe FinScope Consumer Survey PSIG India 2015 (also referred to as ‘the study’) was carried out with a representative sample of 16,000households over 4 PSIG states, 530 villages and 270 wards and each village/ward having 20 households being covered with systematicrandom sampling.
3.1. Survey implementationThe study was implemented in four stages shown in Figure 9 below.
3.1.1. Focus group discussionsBefore commencing work on the study, FMT customised the survey tool to fit the context of the Indian background. Focus groupdiscussions (FGD) were held before finalising the questionnaire in order to obtain advice and input from the field for the design of thequestionnaire for the survey.
In this context of financial inclusion/exclusion, FGDs under FinScope survey were planned and prepared and conducted in the followingdistricts, area, gender and age-groups.
Table 9: Location of focus group discussions
Sl. No. FGD No. State District Area Financial Status Gender Age-group
1 FGD1 Madhya Pradesh Gwalior Urban Included Male 36 – 50
2 FGD2 (SC) Madhya Pradesh Ratlam Rural Included Female 36 – 50
3 FGD3 Madhya Pradesh Dhar Urban Excluded Male 18 – 35
4A FGD4A Madhya Pradesh Betul Rural Included Male 51 – 65
4B FGD4B Madhya Pradesh Betul Rural Included Male 51 – 65
5 FGD5 Madhya Pradesh Satna Urban Excluded Female 36 – 50
6 FGD6 Odisha Bhubaneshwar Urban Included Male 51 – 65
7 FGD7 (ST) Odisha Kendujhar Rural Included Female 18 – 35
8 FGD8 Odisha Koraput Urban Excluded Female 18 – 35
9 FGD9 Odisha Bolangir Rural Excluded Female 51 – 65
10 FGD10 Bihar Saharsa Rural Included Male 18 – 35
11 FGD11 Bihar Buxar Urban Included Female 18 – 35
12 FGD12 Bihar Sheohar Rural Included Female 51 – 65
13 FGD13 (Muslim) Bihar Patna Urban Excluded Male 36 – 50
14 FGD14 Bihar Gaya Rural Excluded Female 36 – 50

21
For the purpose of the FinScope FGD, the Reserve Bank of India (RBI), definition of financial inclusion is considered as those financiallyincluded people who had transactions of, at least, one of the products/services of the banking, insurance, established MFIs/SHGs.Members of Primary Agricultural Co-operative Societies (PACS) were considered as included. Adults that obtained services frominformal financial service providers like moneylenders, chit fund, etc., were considered as excluded.
Some key findings drawn from the FGDs are summarised below:
n Farming/Agriculture – FGD participants were encouraged to articulate their responses with respect to problems infarming/agriculture activities. They expressed their concerns related to some activities already mentioned in the draftquestionnaire. Generally, participants could express two to three common problems; but when they were prompted throughshowcard, they could express their concerns. Some new problems not mentioned in the draft questionnaire were expressedby the participants, which were incorporated in the questionnaire.
n Mobile money – During FGDs, it was disappointedly found that overall 96% participants never heard about mobile moneywhereas a minuscule 4% heard about mobile money through TV advertisements. None of the participants in Odisha knewabout mobile money.
n Non-farming businesses – Participants who carried non-farming businesses also emphatically acknowledged problemsmentioned in the options of the particular question of the draft questionnaire. Therefore, all options of the question had tobe kept intact in the final questionnaire for detailed FinScope survey. However, participants provided new problems worthincorporating into the questionnaire like ‘low wages’, ‘lack of capital’, ‘high competition’, ‘lack of business information’ and ‘lack ofskill’.
The findings of the FGDs contributed to the questionnaire design allowing FinMark Trust to customise the questionnaire to the relevantaspects.
3.1.2. Questionnaire designAfter identifying data elements to be collected, the questionnaire was designed, developed and finalised (to suit the evolving contextin India) in consultation with the FMT, EDA, SIDBI, including workshops to obtain stakeholders’ input) under the supervision of PSCmembers. The draft questionnaire was translated into Hindi (for Bihar, UP and MP) and Odiya for Odisha.
The survey questionnaire has the following structure: socio-economic information, household socioeconomic situation, perceived risksand coping mechanisms, financial literacy, experience with formal financial institutions providing account related services, remittances,savings and investment, credit and loans, insurance, informal mechanisms, physical access to institutions, overall perception of selectedfinancial service providers, communications and use of technology, access and use of mobile money and everyday quality of life.
3.1.3. Piloting the FinScope questionnaireBefore commencement of the FinScope Survey, a pilot study was necessary for pre-testing and debugging of the draft questionnairewith respect to translation of questionnaire, introduction to respondents, interview flow, interview duration, respondent selectioncriteria, understanding of questions, instructions and routing, terminology, orientation training of supervisors and to test the effectivenessof training and field manuals.
In each state under coverage of FinScope Study, a sample of size 10 (5 in rural area and 5 in urban area) was covered between 28thMarch – 2nd April 2015. Households and respondents were covered following systematic random sampling and Kish Grid as per theFinScope methodology. Piloting of questionnaire took place under the supervision of FinMark Trust. The representatives of EDA RuralSystems Private Ltd. were personally present during the piloting in Uttar Pradesh and Bihar. The representative of SIDBI also monitoredthe piloting in the state of Odisha. All the observations of the pilot study led to further refinement of the questionnaire.
3.1.4. Generic FinScope sampling methodologyThe FinScope methodology requires representative probability sample drawn systematically using probability proportional to sizesampling (PPS) method. A multi-stage sampling methodology is applied which entails selection of enumeration areas (EAs) /villagesusing recent census or population estimates using PPS followed by the selection of households as well as the selection of one adult inthe selected household using a Kish Grid. Using the Kish Grid ensures that respondents are randomly selected and therefore avoidingbias selection.

22
Figure 10: Diagram of generic FinScope sampling design
The survey population refers to the adult population in the PSIG states of India including both rich and poor, individuals residing in urbanand rural areas, women and men. An adult in this case refers to an individual who can open a bank account, which – in most countries– is 18 years or older. Anyone who is younger than 18 years of age at the time of the survey is excluded from the sample universe.Also excluded are those individuals who reside in national parks, institutionalised settings, such as students in dormitories and personsin prisons or nursing homes.
The FinScope sampling design is typically a three stage sampling with enumeration areas (EAs) – villages or wards in the four states –as primary sampling units (PSU), households as secondary sampling units (SSU), and individuals selected by Kish Grid from a list of eligiblerespondents at every selected household as tertiary sampling units (TSU).
1. Target population: Adult population of ages 18 years or older in the four states2. Sample representation levels:
a. Stateb. Urban/rural
3. Total recommended number of minimum households to be interviewed is 16,0004. Sample was allocated disproportionally to all states5. Population sampling frame: Recent census Enumeration Areas /villages6. Stratification: States and urban and rural levels7. EAs were grouped in clusters 8. Selection method: EAs/villages selected using Probability Proportional to Size (PPS) systematic sampling procedure. In the case
of PSIG, the clusters were the primary sampling units9. Household sample size per each EA/village in terms
a. Urbanb. Rural
10. Household selection using systematic random sample11. Selection of an individual adult within the selected household respondent using a Kish Grid
The generic sampling approach used in FinScope is presented in Figure 10.
Urban wards/villages
Rural wards /villages
Household Household Household Household
Householdmember
Householdmember
Householdmember
Householdmember
Selectedindividual
WARD1
WARD2
WARD3
Village1
Village2
Village3
All EAs will be stratified according tostate and urban/rural
Selected on probabilityproportional size (PPS)
Random selection of 20households per Ward/village
Listing of all household members(aged 18 years or older)
Selection of one individual per selectedhousehold using the Kish Grid
All Clusters perState

23
3.1.5. Enumerator trainingEnumerator training was done over a period of 3 days (two days class-room training in 8 sessions, each session of two hours duration,and one day mock field training). Orientation training was organised and conducted in each state of coverage under the FinScope Survey.The enumerator training aimed at achieving success of the entire survey project at all stages, to be implemented partly by theinterviewers and supervisors, who played an essential role in collecting data and information, as accurate as possible, and in goingthrough the field process without any problems. The training of enumerators was done in each state sequentially by AFC in July 2015,followed by fieldwork. EDA and SIDBI participated in some of the training sessions and observed the process and also gave somefeedback where necessary.
*Please refer to separate technical reports for the actual training sessions in each of the four states.
3.1.6. Data collection and processingFieldwork commenced on the 3rd of July 2015 in Madhya Pradesh, 11th of July 2015 in Bihar, 20th of July 2015 in Odisha and the 22ndof July 2015 in UP. Data entry was done in MS Excel and the resulting database was converted into SPSS (Statistical Package for theSocial Sciences) format.
n Within each selected village/ward (refer to technical reports) 20 households were randomly selected in a systematic manner,i.e., 4 households (each at regular intervals) in each of 5 directions (North, East, Centre, South and West) of village or wardhad human settlement in oval, circular, rectangular or square shape. Similarly, if village or ward was located along a road or river,then 6-7 households (each at regular interval) had been selected in each of 3 directions (North, Centre & South or East,Centre & West)
n Supervisors, Enumerators and Auditors were provided Google location maps to have an idea of alignment of human settlementin a particular village or ward. On this basis enumerators could choose the direction and ascertain the number of householdsto be covered and in which direction. These directions were mentioned in the questionnaire also so that Auditors of both AFCand EDA Rural Systems could check whether the households had properly been covered or not
n Enumerators sort assistance from the village headman/ward councilor/resident welfare association, Anganwadi worker,prominent person, etc. to get an idea of socio-economic distribution of the population in that village or ward
Further to the technical aspects of data collection were quality control measures which were internal AFC quality control mechanismssummarised below:
1. At a minimum, quality control measures included verification of the following:
n fact that the interview took placen proper application of the sampling plan in selecting the householdsn approximate duration of the interviewn proper administration of the various sections of the questionnairen enumerator’s general adherence to professional standards
2. AFC has standard procedures that require its field supervisors to make a daily report on the progress of work unless they arelocated in villages where there is no means of communication to do that. This is to ensure that AFC can provide administrativeand logistics support to the supervisors and interviewers for data collection and supervision.
3. The Audit team undertook in-house auditing of the process of the field survey and back-check respondents through field visitsand telephonically as per the audit sample plan and reported to the State Team Leader for immediate corrective measure forquality survey.
Table 10: Survey sample and fieldwork results
StateNo. of
VillagesNo. of Ward
Total No. ofVillages &
Wards
No. of Ruralrespondents
No. of Urbanrespondents
Total No. ofrespondents
AchievedSample
%
Bihar 148 55 203 2 960 1 100 4 060 100
MP 111 71 182 2 220 1 420 3 640 100
Odisha 100 45 145 2 000 900 2 900 100
UP 171 99 270 3 420 1 980 5 400 100
Total 530 270 800 10 600 5 400 16 000 100

24
4. Each completed questionnaire was checked twice. First, the field supervisor checked the questionnaires collected by theinterviewers before they left the village/ward where the interviews were conducted so that they could reconfirm answers givenby the respondents, if necessary. Secondly, the editing team at the AFC office checked the questionnaires to ensure that theywere properly completed.
3.1.7. Weighting of the dataIn order for the sample estimates from the survey to be representative of the adult population, it is necessary to multiply the data bya sampling weight, or expansion factor. The basic weight for each sample household or individual would be equal to the inverse of itsprobability of selection (calculated by multiplying the probabilities at each sampling stage). The weighting was based on the Census 2011estimates. The weighting procedures are available in the annexures.
3.1.8. Analysis and reportingAnalysis and reporting of the data was done by FMT after the weighting of the data. The report was written from mid December 2015to end of January 2016 and benefited from inputs from the technical and steering committee in February. The next chapters presentthe results of the FinScope survey. The results are based on weighted data- mainly individual weights and in some cases householdweighting was used where the questions were household related. Please note that figures in this report have been rounded as sometables or graphs may not add up to 100%.

25
4. Socio-economic profileThis section presents the FinScope results on the socio-economic status of the 4 PSIG states with the objective to showing a clear profileof the PSIG adults. The estimated adult population of the 4 PSIG states were 266 655 543 with the biggest population of adults beingin Uttar Pradesh (46%) which is almost double the adults than the second largest state – Bihar (24%). Odisha has the smallest adultpopulation of the four states (12% as illustrated in Figure 11). On average the PSIG states have more males (52%) than females (48%)with the largest population of males in proportion to females being in the state of Bihar (54% being male). Together, the four stateshave about 77 million households with about 43%of them (33,4 million) being in UP; 18,8 million in Bihar ; 15 million in MP; and 9,6million being in Odisha.
Figure 11: Adult population breakdownby state (%)
24
46 n 24% Biharn 18% MPn 12% Odishan 46% UP
18
12
Figure 12: Household population breakdownby state (%)
12
43
n 25% Biharn 20% MPn 12% Odishan 43% UP
25
20
Uttar Pradesh – has a total adult population of 123 million having the biggest adult population amongst the PSIG states. UP has 77%(95 million) of its adults residing in rural areas. The state is a home to about 33,4 million households.
Bihar – has a total adult population of 62,9 million. Bihar has 88% (55,4 million) of its adults residing in rural areas. Bihar has about18,8 million households.
Madhya Pradesh – has a total adult population of 48,7 million. MP has 73% (35,3 million) of its adults residing in rural areas. The statehouses about 15 million households.
Odisha – has a total adult population of 31,9 million. Odisha has 84% (26,9 million) of its adults residing in rural areas. Odisha alsohas the fewest number of households at under ten million (9,6 million) at the time of the study.
4.1. Demographic characteristics of the PSIG states4.1.1. Area type and Gender
n Urbann Rural
Figure 13: Urban/Rural distribution
PSIG
Uttar Pradesh
Odisha
Madhya Pradesh
Bihar
20
23
16
27
12
80
77
84
73
88
%

Figure 14: Gender
PSIG
Uttar Pradesh
Odisha
Madhya Pradesh
Bihar
48
48
49
48
46
52
52
51
52
54
26
The bulk of the population reside in rural areas. The study further reveals that in the rural areas there are more males than femalesin all four states with almost an identical distribution of male to female of 53% to 47% respectively in all three states besides Odishawith 51% males to 49% females in the rural areas. Noteworthy, is the distribution of males and females in the urban areas of the PSIGstates. Both Odisha and UP have an equal distribution of males to females with Bihar having more males in its urban areas than femalesat 54% to 46% respectively. MP has fewer males at 48% of its urban population.
The PSIG states generally have more males than females shown in each of the four states in Figure 14. The PSIG states show that thereare more males (52%) than females (48%). The state of Bihar has more males (54%) in comparison to the other PSIG states. The overallIndia sex ratio for the India Population Census of 2011 revealed 940 females per 1000 of males, which was an upward trend from 2001.The main cause of the declining female birth rates in India is suggested to be the unfavorable treatments of the girl child at the timeof birth. As will be explained later in the education sub-section, a contributing factor to gender bias might be inadequate education.
4.1.2. AgeThe age distribution of the PSIG populace can be described as fairly young with most of the population (62%) being under the age of40 years. According to the BBC report of 20119, India is set to be the largest population by 2030 and the youngest population by 2020with an estimated adult average age of 29 years. The average age of the PSIG adult population is just under 39 years with a medianof 36 years.
The state of Bihar has a relatively higher senior population at 25% (those aged 51 years and above) while the state of MP has a largeryouth population (40% aged between 18 and 30 years).
Figure 15: Age distribution of the PSIG states
25
12n 18 – 25 yearsn 26 – 30 yearsn 31 – 40 yearsn 41 – 50 yearsn 51 – 60 yearsn 61 years and above
23
15
9
17
n Malen Female
%
9 Basu, Kaushik (25 July 2007). "India's demographic dividend". BBC News.

27
4.1.3. Religion and community categoryMost of the Asian religions were birthed in India namely Hinduism, Buddhism, Jainism and Sikhism. India is one of the most religiouslydiverse nations of the world, which plays a definitive role in the livelihoods of many of its people. As with many religions globally, thereligious affiliations of a household or an adult have an impact on the financial choices and products that they can interact with. Table12 below presents the religious affiliations of the adults in the four PSIG states.
The study explored adults belonging to certain community categories. The four main categories are General, Other Backward Class(OBC), Scheduled Castes (SC) and Scheduled Tribes (ST). These are also referred to as ‘caste category’ and are also shown in Table 12.The table shows the state of Odisha has the highest proportion of adults in the General category (31%) and lowest proportion in theOBC category (32%). SC categories are more popular in UP with almost a third of the community belonging to this category. BothMP and Odisha have similar proportions of adults in the ST category at 18% and 19% respectively while the lowest is UP with only1%.
4.1.4. Marital statusMany of the adults in the PSIG states are married (79%) with the highest proportions being in Bihar (85%), MP and Odisha both at(81%). These figures show that marriage is still an important institution in the Indian community with no percentage of adults reportedto be divorced. Only 1 in 20 of the adults reported to be widowed.
Age category Bihar Madhya Pradesh Odisha Uttar Pradesh PSIG
18 – 25 years 18 24 19 25 23
26 – 30 years 16 16 14 13 15
31 – 40 years 26 27 25 24 25
41 – 50 years 16 15 19 17 17
51 – 60 years 14 12 12 11 12
61 years and above 11 7 11 9 9
Table 11: Age distribution per state (%)
Marital status Bihar Madhya Pradesh Odisha Uttar Pradesh PSIG
Un-married 9 14 15 18 15
Married 85 81 81 75 79
Separated 0 0 0 0 0
Divorced 0 0 0 0 0
Widow/widower 5 5 4 6 5
Table 13: Marital status (%)
Religion Bihar Madhya Pradesh Odisha Uttar Pradesh PSIG
Hindu 86 92 96 88 89
Muslim 14 8 1 12 11
Sikh 0 0 0 0 0
Christian 0 0 3 0 0
Others 0 0 0 0 0
Community category Bihar Madhya Pradesh Odisha Uttar Pradesh PSIG
General 20 10 31 22 21
Other backward class 51 50 32 47 47
Scheduled Castes 22 20 18 29 24
Scheduled Tribes 7 18 19 1 8
None of these 0 1 0 0 0
Table 12: Religion and community category (%)
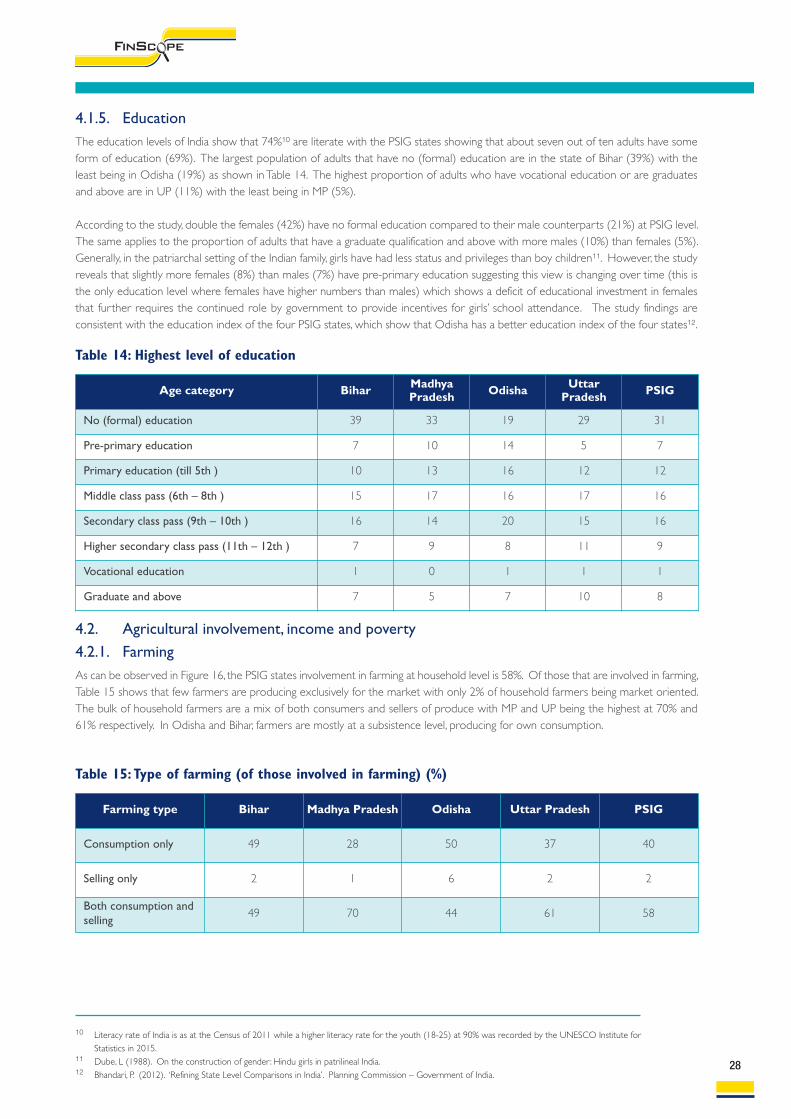
28
4.1.5. Education The education levels of India show that 74%10 are literate with the PSIG states showing that about seven out of ten adults have someform of education (69%). The largest population of adults that have no (formal) education are in the state of Bihar (39%) with theleast being in Odisha (19%) as shown in Table 14. The highest proportion of adults who have vocational education or are graduatesand above are in UP (11%) with the least being in MP (5%).
According to the study, double the females (42%) have no formal education compared to their male counterparts (21%) at PSIG level.The same applies to the proportion of adults that have a graduate qualification and above with more males (10%) than females (5%).Generally, in the patriarchal setting of the Indian family, girls have had less status and privileges than boy children11. However, the studyreveals that slightly more females (8%) than males (7%) have pre-primary education suggesting this view is changing over time (this isthe only education level where females have higher numbers than males) which shows a deficit of educational investment in femalesthat further requires the continued role by government to provide incentives for girls’ school attendance. The study findings areconsistent with the education index of the four PSIG states, which show that Odisha has a better education index of the four states12.
10 Literacy rate of India is as at the Census of 2011 while a higher literacy rate for the youth (18-25) at 90% was recorded by the UNESCO Institute forStatistics in 2015.
11 Dube, L (1988). On the construction of gender: Hindu girls in patrilineal India.12 Bhandari, P. (2012). ‘Refining State Level Comparisons in India’. Planning Commission – Government of India.
Age category Bihar MadhyaPradesh Odisha Uttar
Pradesh PSIG
No (formal) education 39 33 19 29 31
Pre-primary education 7 10 14 5 7
Primary education (till 5th ) 10 13 16 12 12
Middle class pass (6th – 8th ) 15 17 16 17 16
Secondary class pass (9th – 10th ) 16 14 20 15 16
Higher secondary class pass (11th – 12th ) 7 9 8 11 9
Vocational education 1 0 1 1 1
Graduate and above 7 5 7 10 8
Table 14: Highest level of education
4.2. Agricultural involvement, income and poverty4.2.1. FarmingAs can be observed in Figure 16, the PSIG states involvement in farming at household level is 58%. Of those that are involved in farming,Table 15 shows that few farmers are producing exclusively for the market with only 2% of household farmers being market oriented.The bulk of household farmers are a mix of both consumers and sellers of produce with MP and UP being the highest at 70% and61% respectively. In Odisha and Bihar, farmers are mostly at a subsistence level, producing for own consumption.
Farming type Bihar Madhya Pradesh Odisha Uttar Pradesh PSIG
Consumption only 49 28 50 37 40
Selling only 2 1 6 2 2
Both consumption andselling
49 70 44 61 58
Table 15: Type of farming (of those involved in farming) (%)

Figure 16: Household involvement in farming
n Household is not involved in farming at alln Household is involved in farming and other workn Household is only involved in farming
29
Of the adults involved in farming - using source of income related to farming and not household involvement – males earning incomefrom farming is much higher (70%) than females (30%). According to the study, male adults in the PSIG earning an income fromfarming/farming activities constitute 36% of the male population showing a significant population earning a living from farming. Only16% of the female population earn an income from farming. Many households, although involved in farming do not necessarily earnan income from their produce indicating a large number of smallholder subsistence farmers.
4.2.2. IncomeTables 16 and 17 summarises the results of the main source of income at individual and household levels respectively. The biggestproportion of household main income source is largely salary or wages from public enterprises (excluding wages from agriculturework) with 47% of households at the PSIG level. The state of Odisha shows that the main source of income for 65% of householdsis farming or farming activities and only 14% salary or wages. The state of Bihar shows the opposite, while only 25% of household dependmainly on farming/agriculture 54% of households depend on salary or wages as the main household source of income. In addition Biharshows the highest proportion of adults that depend on remittances from outside the household (8%).
%
Income source Bihar MadhyaPradesh Odisha Uttar
Pradesh PSIG
Salary/wages from government/state ownedenterprise (e.g. teacher, anganwadi worker)
3 4 3 3 3
Salary/wages from private company 6 4 4 10 7
Salary/wages from non-farm work (i.e. domesticworker, etc.)
46 42 3 39 36
Wage from agri-labour work 1 4 29 3 6
Wages from MGNREGA work 0 0 3 0 1
Self-employed (own non-farm business) 12 12 18 8 11
Self-employed – farming, cultivation 22 33 35 32 30
Self-employed – livestock 1 0 1 1 1
Pension or annuities 1 1 1 1 1
Elderly/disability assistance from government 0 0 1 0 0
Remittances (money sent by someone living outside) 8 0 0 2 3
Table 16: Main source of income at household level (%)
PSIG
Urban
Rural
Utta
r Pra
desh Urban
Rural
Odis
ha
Urban
Rural
Mad
hya
Prad
esh Urban
Rural
Biha
r Urban
Rural
8114
633
23
165
24
2551
197
27
1955
45
41
45
79
74
91
70
4344
13
2534
1910

30
When one looks closer at the household main source of income in Table 16 one observes that there is a considerable amount of adultsat household level that have their own businesses (including farming) as the main income source; coming in second with 42% after salaryor wages for the PSIG states combined. This is highly linked to household involvement in farming activities displayed in Figure 16.Overall, one observes that 42% of households in the PSIG states are not involved in farming activities at all. At state level, MadhyaPradesh has the highest proportion of households not involved in farming (54%) but has the most adults having farming as an incomesource as shown in Table 17. As shown in Table 6 other states are not productive in agriculture, which may lead one to conclude, thatmost of the farming involvement is largely subsistence. 35% of adults source their income from wages from informal sector with 30%from self employment in farming. The study also revealed that a higher proportion of those in the age category of 41 to 60 years tendedto get income from farming than in other age brackets.
Income source Bihar MadhyaPradesh Odisha Uttar
Pradesh PSIG
Salary/wages from government/state ownedenterprise (e.g. teacher, anganwadi worker)
2 3 2 2 2
Salary/wages from private company 4 3 3 6 5
Salary/wages from non-farm work (i.e. domestic worker, etc.)
33 38 2 22 25
Wage from agri-labour work 1 4 25 2 5
Wages from MGNREGA work 0 1 5 1 1
Self-employed (own non-farm business) 9 11 13 6 8
Self-employed – farming, cultivation 17 31 25 18 21
Self-employed – livestock 3 0 1 2 2
Pension or annuities 1 2 2 2 1
Elderly/disability assistance from government 1 2 3 2 2
Remittances (money sent by someone living outside)
6 0 0 1 2
Received money from household members 30 20 38 36 32
Do not receive money 0 0 0 5 2
Table 17: Sources of income at individual level (%)
4.2.3. PovertyIndia’s Department of Food, Civil Supplies & Consumer Affairs is entrusted with ensuring that essential commodities are under the PublicDistribution System to reach all citizens to ensure food security regardless of an individual’s position economically or otherwise.FinScope PSIG 2015 explored the household economic status and the results are displayed in Figure 17. Household economic statushas three main classifications of households namely, beginning with the poorest, Antyodaya Anna Yojana (AAY), Below Poverty Line (BPL),and Above Poverty Line (APL). Under the AAY scheme (being the poorest of the BPL families) the families are given the mostaffordable price of rice at ₹3 per kg (compared to ₹9.50 for the APL families) which initially targeted 5% of the population who couldnot afford two meals a day.
The study also looked at some of the poverty indicators based on some of the household questions asked in the FinScope survey andlinked the results to the benchmarked norms. This analysis helps to understand the poverty rate in a given population for differentpoverty lines using 10 indicators that are linked to household per capita expenditure. As part of the FinScope India survey, data wascollected for 16,000 respondent households and analysed to understand the poverty rate within the sampled population. This analysiswas done by urban and rural population as poverty benchmarks are available for rural and urban populations of each state. In thepoverty outreach analysis, consideration was given to the bottom two quintiles of the population and this is largely captured by$1.25/day for rural areas and $1.88/day for urban areas.
In rural Bihar, 45% of respondent households fall below $1.25/day while the state benchmark is 56%. In urban Bihar, 72% of respondenthouseholds fall below $1.88/day while the state benchmark is 64%. In rural Madhya Pradesh, 34% of respondent households fall below$1.25/day while the state benchmark is 45%. In urban Madhya Pradesh, 59% of respondent households fall below $1.88/day while thestate benchmark is 49%. In rural Odisha, 40% of respondent households fall below $1.25/day while the state benchmark is 51%. Inurban Odisha, 64% of respondent households fall below $1.88/day while the state benchmark is 48%. In rural Uttar Pradesh, 35% ofrespondent households fall below $1.25/day while the state benchmark is 46%. In urban Uttar Pradesh, 63% of respondent households

31
Figure 17: Household economic status
PSIG
Uttar Pradesh
Odisha
Madhya Pradesh
Bihar
8
3310
4111
46
49
1236
8
2918
366
264
4
279
60n Antyodayan Below poverty linen Above poverty linen Do not know
%
fall below $1.88/day while the state benchmark is 53%. These figures show that there were some differences between the FinScopebased figures and the benchmarked figures.
As shown in Figure 17, those living below the poverty line amount to 57% (AAY plus BPL) of the PSIG states. When looking at thestates, MP has the highest percentage of adults living below the poverty line at 69% closely followed by Bihar at 64%. In the states ofMP and Bihar high poverty levels are accompanied by the high proportion of adults without formal education among the four statesat 33% and 39% respectively. Further, both states also show the highest number of households not involved in agriculture which maycontribute to more households failing to provide food from farming for their consumption (see Table 15).
The poverty indicator bands were created using FinScope data for each state. Looking at the overall state levels of poverty in Figure18, it shows that Bihar has the highest proportion of households living on under $1.25/day both at urban and rural levels while thestate of MP has the highest proportion of households living on $2.50/day and above. This is also confirmed when looking at thehousehold economic status, MP has the least proportion of households living below the poverty line as observed in Figure 17. Generally,across the different states, households living in the $1.25/day to $1.88/day band show no significant differences in proportion amongstrural and urban households yet significant variances are noticed in the much higher and lowest bands.
Figure 18: Poverty indicator bands
27 36 18 19
35 37 16 12
30 34 17 19
40 36 14 10
24 35 20 21
34 36 16 14
37 35 15 13
45 35 13 7
n Under $1.25/dayn $1.25/day to under $1.88/day
n $1.88/day to under $2.50/dayn $2.50/day and above
%
Utta
rPr
ades
h Urban
Rural
Odis
ha
Urban
Rural
Mad
hya
Prad
esh Urban
Rural
Biha
r Urban
Rural

32
4.3. Asset ownership and energy usageThe source of energy available in largely rural communities in the PSIG would be those that are easy to access at low cost to thehousehold. FinScope PSIG 2015 collected information (at household level) on the main energy used for cooking. Overall, the PSIGhouseholds mainly use wood, coal or dung as the main energy/fuel for cooking (79%) followed by LPG/PNG (20%). The use ofelectricity is minimal for cooking (if at all in some states) with a total of just under 35,000 households using it for cooking purposes inthe PSIG. This is related to the low ownership of electrical appliances such as television sets or sewing machines indicating low accessto electricity as displayed in Table 18.
n Wood, coal/charcoal, dung caken Kerosene
n LPG/PNG
PSIG
Uttar Pradesh
Odisha
Madhya Pradesh
Bihar
Figure 19: Main energy/fuel used for cooking
20179
27172
9289
20179
12187
Assets Bihar MadhyaPradesh Odisha Uttar
Pradesh PSIG
Mobile handset 73 88 89 82 82
Television 32 29 54 51 43
Almirah/wardrobe/dressing table 10 14 34 34 24
Motorcycle/scooter/moped 11 11 27 18 16
Sewing machine 6 12 28 18 15
Casserole, thermos, thermoware 1 2 8 7 5
DVD player 1 4 6 5 4
Car/Jeep 1 1 3 1 1
Landline telephone 0 0 1 1 1
None of these 21 9 6 11 12
Table 18: Household asset ownership ranked at PSIG level (%)
Table 18 below summarises the results of household ownership of different assets.

Interestingly, there is relatively high household ownership of mobile handset in the PSIG states with a total of 82% of householdsowning a mobile phone. Even higher are the states of MP and Odisha with Odisha also having the largest number of mobile-owningadults living in the rural areas. Household ownership of assets attempts to display the living standards of adults indicating a qualitymeasurement of their livelihoods. It would show from Table 18 that most households owning relatively more expensive assets such ascars or motorcycles reside in Odisha (3% owning a car or Jeep and 27% owning a motorcycle or moped).
Table 19 presents the percentage of household asset ownership by states and by area location (i.e. urban/rural).
AssetsBihar Madhya
Pradesh Odisha Uttar Pradesh PSIG
Rural Urban Rural Urban Rural Urban Rural Urban Rural Urban
Mobile handset 73 73 88 87 89 87 81 82 81 82
Television 33 29 28 32 55 52 51 52 42 44
Almirah/wardrobe/dressing table 10 10 14 16 35 33 34 33 24 25
Motorcycle/scooter/moped 11 11 10 12 27 25 18 20 16 17
Sewing machine 6 5 12 13 28 28 18 17 15 16
Casserole, thermos, thermoware 1 0 2 3 8 8 7 7 4 5
DVD player 1 2 3 4 6 6 5 5 4 4
Car/Jeep 0 1 0 1 3 2 1 1 1 1
Landline telephone 0 0 0 0 1 1 1 1 1 1
None of these 21 20 9 8 6 7 11 12 12 11
Table 19: Household ownership of assets by area type (%)
33
4.4. Documentation
Documentation forms a critical component in adults having access to formal financial services. The study shows in Table 20 that mosthouseholds have land ownership documents namely in the states of Bihar and MP being 98% and 96% respectively. This opens upoptions for households to obtain loans to finance their agricultural activities and commercialise these leading to improved productivityrates. Most financial institutions require Know-Your-Consumer popularly known as KYC, which refer to documents provided by theclient to the financial service providers to identify their client and prevent fraud and money laundering. Such documentation involvesidentification documents such as an ID book or card or passport and proof of residence. Overall, the most popular document possessedin the PSIG states is the voter ID at 92% possession followed by the Aadhar card at 86% and both driver’s licence and utility bill at 6%as shown in Table 21.
Land ownershipdocument
Bihar Madhya Pradesh Odisha Uttar Pradesh PSIG
Yes 98 96 84 79 88
No 2 3 16 11 8
Do not know 0 1 0 10 4
Table 20: Possession of land and ownership (%)

34
The possession of documents is naturally skewed to rural areas having the largest population of adults in the PSIG states. Looking atthe result displayed in Table 21, one does not see a lack of documentation encumbering the access or usage of financial services.Although the possession of proof of residence documents such as utility bills is low at state level being below 7%, the possession ofland ownership documents shown in Table 20 shows a moderate to high ownership at state level. Hence, given the importance ofconventional banks or financial institutions on personal documentation and collateral, the study reveals an adult population that hassufficient documentation to have access to formal financial services.
Document possessedBihar Madhya
Pradesh Odisha Uttar Pradesh PSIG
Rural Urban Rural Urban Rural Urban Rural Urban Rural Urban
Voter ID 90 91 90 92 90 91 96 94 95 93
Aadhar card 79 83 79 87 89 87 80 85 81 89
Drivers licence 3 11 4 3 8 4 2 10 3 9
Utility bill 4 18 6 6 8 7 2 2 2 4
Passport 0 0 0 0 0 0 0 0 0 0
None of these 4 2 4 2 3 2 2 3 2 2
Table 21: Possession of documents (%)
4.5. Access to infrastructure and connectivityOne of the limitations to financial services access in many areas is limited telephonic or cellphone usage or access. Table 22 presentsusage of communication technologies amongst the PSIG states.
The states of UP and Bihar have the highest usage of cellphones, 93% and 92% respectively, while usage is low in Odisha (47%). Thismay be surprising since Odisha and MP have the highest ownership of mobile phones as shown in Table 19. All other technologiesusable for communicating are low with less usage of computers/laptops in all states. The higher usage of phones and relatively higherusage of the computer or laptops in Uttar Pradesh can be attributed to better infrastructural development in the state13. This issupported also by the relatively higher number of households that are using LPG/PNG for cooking in UP suggesting better infrastructurein the state.
Communication channel/device Bihar MadhyaPradesh Odisha Uttar
Pradesh PSIG
Cellphone usage 92% 65% 47% 93% 82%
PCO/STD booth 0% 0% 0% 1% 1%
Computer/laptop 1% 1% 1% 4% 2%
Internet/Cyber café 1% 2% 1% 4% 3%
Email 1% 2% 1% 3% 2%
Table 22: Usage of communication channel/device
13 Bhandari, P. (2012). ‘Refining State Level Comparisons in India’. Planning Commission – Government of India.

35
Table 23 illustrates the mean time taken (in minutes) to reach common destinations regardless of the mode of transportation used.On average, the PSIG states’ access to common destinations ranges between 10 and 30 minutes. In all states, adults generally have accessto banking infrastructure such as bank branch and ATMs but differ significantly when looking at their location. The time taken to accessthe bank branch or ATM in rural areas seems more of a challenge in all states when compared to urban adults.Table 23 also showsthat ATMs are further away for rural Bihar adult while banking correspondent outlets are further for rural MP adults. While the meantime taken to reach most of financial service points across the states does not show distance as a main barrier to financial access,improvements can be made to reduce the time taken to reach financial access points such as ATMs/BCs to simulate ease of access toareas such as grocery stores especially in rural areas.
DestinationBihar Madhya Pradesh Odisha Uttar Pradesh PSIG
Rural Urban Rural Urban Rural Urban Rural Urban Rural Urban
Grocery store 15 9 13 8 19 14 14 9 15 9
Market 30 18 32 19 29 16 32 16 31 17
Post office 26 19 28 22 26 17 28 18 27 19
Bank branch 34 20 34 23 33 18 34 18 34 20
ATM 41 19 33 19 35 18 35 17 36 18
Bankingcorrespondent outlet
24 19 44 25 39 19 31 20 32 20
Money lender/pawn shop
19 15 38 25 32 17 29 17 29 17
Table 23: Mean time taken to destination (in minutes)
It is with the above socio-economic profile of the PSIG that policymakers have been focusing on financial inclusion of Indian rural andsemi-rural areas, primarily for the two most important pressing needs:
1. Creating a platform for habitual savings culture – the lower income category has been living under the constant shadow offinancial duress mainly due to the absence of savings. This report will explore the services accessible to the rural populationin the savings chapter. Noteworthy, FinScope findings in other markets have shown that the poor often rely on informalmechanisms such as savings groups to cope with large payments or risk which usually are prone to risk of embezzlement orfraud within themselves but may offer ease of access and high efficiency.
2. Creating formal credit avenues – to date the unbanked has largely been dependent on informal credit channels making themvulnerable. Availability of adequate and transparent credit from formal banking channels will allow the entrepreneurial spirit ofthe masses to increase agricultural outputs. Initiatives to this end have been the ease and continuity of credit to the poor bythe micro-finance sector.

5. Financial behaviour, risk and coping mechanisms5.1. Financial behaviourThe study revealed that a number of adults realised that they required more information on aspects of managing money. This informationis useful to tailor information needs for adults living in different areas. Figure 20 shows that MP has the highest number of adultsneeding more information about managing money. This may be related to the higher proportion of adults living below the povertyline of the four states in the backdrop of a higher number of adults with no formal education.
36
Overall, looking at the gender split at the PSIG level more males (42% of all PSIG males) agreed to need more information than females(40% of all PSIG females), while at state level MP had higher proportion of males (74% of all MP males) with lesser females (67% ofall MP females). At PSIG level, the age category agreeing to need more information about managing money was the 31-40 yearcategory closely followed by the younger 18-25 year category.
Pertaining to decision-making on financial issues, households generally have one or more people involved in the process. The studyrevealed that many of the adults (70%) in the PSIG states are involved in the decision-making on financial issues either alone or jointlywith a partner or other household member(s) with the remaining 30% not being involved in the process (see Table 24). Perhaps themost notable involvement of adults in decision-making at state level is that of Odisha with 87% of adults involved in financial decision-making as opposed to UP with only 63%. Involvement in decision-making concerning finances can help to indicate that adults are ableto access financial services freely in their individual capacity or collectively. Looking at urban/rural areas no major differences are notedwith individuals making decisions alone, but notable for those making decisions jointly.
Figure 20: Adults needing more information about managing money
PSIG
Uttar Pradesh
Odisha
Madhya Pradesh
Bihar
41
34
34
71
36
%
People involved indecision-making
Bihar Madhya Pradesh Odisha Uttar Pradesh PSIG
Rural Urban Total Rural Urban Total Rural Urban Total Rural Urban Total Rural Urban Total
Adult makesdecision alone 32 30 31 34 32 34 32 33 32 31 30 31 32 31 32
Adult with theirspouse/partner 23 19 23 24 21 23 43 39 42 20 12 19 24 20 24
Adult and otherhousehold/familymembers
17 20 17 14 12 14 13 14 13 12 17 13 14 16 14
The householdhead – managesthe money foreveryone alone
26 29 26 28 35 30 13 14 13 36 35 36 29 32 30
Someone else inthe household –not thehousehold head
3 3 3 0 0 0 0 0 0 2 2 2 2 1 2
Table 24: Involvement of adults in financial decisions (%)

37
When adults were asked about the factors they would consider when opening an account or to use the services of a financial institution,not surprisingly, the most popular response was that of convenience at 51%. Other factors such as image or brand and ease of accesswere mentioned by 2 in every 5 adults indicating the triggers that appeal to adults when considering using a financial service provider(see Table 25). When analysing image or brand amongst the age groups, image and brand are more important for those of youngerage (between 18 and 30 years). These factors may differ amongst gender groups. Notable differences in convenience and cost for adultsin MP and Bihar, image or brand for UP adults and ease of access to funds and interest earning attribute for PSIG adults overall.
Adults were also asked what it means to save by choosing the statement that closest described the meaning of saving. Table 26 showsthat most adults defined savings as keeping money safe (43%). This, in part, explains the use of banks as a way of keeping money safe(being the biggest driver for the banked). The idea that savings are kept so that they earn interest over time was only mentioned byone out of five adults. Looking at Table 27, about 54% of adults mentioned that money needs to be kept for at least a year to countas savings with 24% choosing a period of six months or less. When looking at gender, notable differences were captured for adults inMP defining savings as money to be safe and adults in Bihar defining savings as putting money away to increase its value.
Factors considered whenopening
an account
Bihar MadhyaPradesh Odisha Uttar Pradesh PSIG
Male Female Male Female Male Female Male Female Male Female
Convenience (e.g. nearby,convenient timings, doorstepservice)
53 51 46 41 43 45 56 56 52 51
Image or brand 31 29 34 30 34 34 25 21 29 26
Easy to access money whenneeded
27 28 47 41 40 37 47 40 41 37
Reasonable costs 27 20 33 27 29 27 50 49 39 36
Simpleprocesses/documentation
26 23 20 19 36 35 22 21 24 23
Attitude of staff/helpfulness 20 20 15 12 16 15 27 26 22 21
Right product 18 18 23 24 19 18 14 12 17 16
Earns interest 8 12 3 10 1 1 2 4 4 7
Recommendation by others 3 3 2 2 16 14 2 2 4 4
Do not know 2 1 3 2 0 1 3 4 3 3
Table 25: Factors used for choosing financial institutions (%)
StatementBihar Madhya
Pradesh Odisha Uttar Pradesh PSIG
Male Female Male Female Male Female Male Female Male Female
Money to be safe 20 21 59 53 55 57 47 46 43 43
Money to use later whenneeded
27 29 28 26 29 26 31 29 29 28
Putting money away so thatthe total amount increasesover time
43 37 9 7 15 16 18 19 22 21
Do not know 11 13 4 14 1 1 4 6 6 8
Table 26: Perceived meaning of savings (%)

38
To better understand the lives of the adults in the PSIG states, certain statements concerning their financial lives were asked as presentedin Table 28. It shows in the first two statements that adults were facing financial constraints with 71% agreeing that dealing with financesis stressful and 88% sometimes having to spend more money that they had available. About half of the adults agreed that budgets helpto keep record of how much money they could spend and 28% keeping track of their income and expenditure on a monthly basis.
Time period Bihar MadhyaPradesh Odisha Uttar
Pradesh PSIG
One day 4 1 4 1 2
One week 4 1 3 1 2
At least one month 14 4 12 6 8
Six months 14 9 3 15 12
One year 14 14 26 30 23
More than a year 18 32 46 33 31
Do not know 33 39 6 13 22
Table 27: Shortest time for money to be kept to count as savings (%)
Statement Bihar MadhyaPradesh Odisha Uttar
Pradesh PSIG
You sometimes have to spend more moneythan you have available
91 88 94 86 88
Dealing with finances is stressful 83 77 59 66 71
A budget/record helps to keep track of howmuch money you can spend
68 47 42 47 51
You keep track of your income andexpenditure on a monthly basis
47 22 27 20 28
You want to enjoy your money now ratherthan worry about the future
39 12 33 36 32
You understand the terms and conditions ofdifferent financial services that you have
44 17 46 42 38
You want to use technology to manage yourmoney
7 11 18 10 11
Table 28 Statements concerning financial livelihood (%)

5.2. Risk and coping mechanismsRisk poses a significant amount of strain on a household especially if it is not covered. This has direct implications on the quality of one’slife. The study explored the risks and hardships that people experienced in the past 12 months and the results are displayed in Table29. Most adults faced a rise in the price of goods and services at 84% for the PSIG states with Odisha and MP at 98% and 93% ofadults respectively. Further, adults in Odisha also experienced more hardship with family illness (80%) more than twice that of MP (35%).Few households experienced the loss of a family member or main income earner in the past year in all four states.
39
As most households may face an increase in commodity prices due to inflation or illness in their households, it was important for thestudy to explore what mechanisms they used to alleviate these risks or hardships. The main mechanisms used to cope with suchevents for all PSIG states were to cut down expenses (73%), use savings (9%) and rely on family and friends (6%). When it came toillnesses within the household, savings came into play one out of five times. Although few adults reported to have experienced a lossof crop or livestock, the study reveals that an insignificant proportion of the PSIG states claimed from insurance, if at all. Due to thesmall base figures, analysis at state level could be misleading if computed due to smaller numbers of adults who answered.
Event-coping mechanisms
Cut
dow
n ex
pens
es
Use
d sa
ving
s
Rel
ied
on
mo
ney
fro
m fa
mily
Cla
imed
insu
ranc
e
Mis
sed
paym
ent
on
alo
an
Bo
rrow
ed m
one
yfr
om
ban
k
Bo
rrow
ed m
one
yfr
om
MF
Is
Bo
rrow
ed m
one
yfr
om
SH
Gs
Bo
rrow
ed m
one
yfr
om
mo
neyl
ende
r
So
ld s
om
ethi
ng t
oge
t m
one
y
Did
no
thin
g
Oth
er
Rise in prices of goods andservices (including transport,electricity, groceries, interestrates)
73 9 6 0 0 1 1 1 1 0 2 0
Illness within your householdor family that requiresmedical expenses
28 20 7 0 0 1 1 0 4 0 0 0
Loss to agriculture, livestockor own business
8 6 3 0 1 1 0 0 1 0 1 0
Loss/destruction of yourhome
1 1 1 0 0 0 0 0 0 0 0 0
Loss of savings 2 1 0 0 0 0 0 0 0 0 0 0
Table 30: Coping with risk and hardship for PSIG (%)
Experienced risk or hardship Bihar MadhyaPradesh Odisha Uttar
Pradesh PSIG
Rise in prices of goods and services (includingtransport, electricity, groceries, interest rates)
86 93 98 76 84
Illness within your household or family thatrequires medical expenses
44 35 80 60 54
Loss to agriculture, livestock or own business 12 17 26 18 18
Loss of job – self or household member 1 0 1 1 1
Loss/destruction of your home 4 1 2 4 3
Separation or divorce 1 0 0 0 0
Loss of savings 4 1 5 4 3
Death or disability of main income earner 0 0 1 1 1
Death of other family member not mainincome earner
0 0 1 1 1
Table 29: Risk or hardship experienced in the past 12 months (%)

40
5.3. Planning for old ageSavings also forms a large part of a safety net for retirement. When adults were asked what plans they had in place for their spendingneeds in the old age, 44% mentioned savings and 16% relying on money from family. 40% of adults did not know what they would dofor their spending needs in old age.
Statement Bihar MadhyaPradesh Odisha Uttar
Pradesh PSIG
Savings 40 36 58 46 44
Pension – National Pension Scheme (NPS) 3 3 7 5 4
Government grant/pension 1 5 3 7 5
Rely on money from family 2 12 11 27 16
Table 31: Plans for spending in old age
When looking at the planning for spending by age, no major distinctions were found based on the proportions of their categories.Looking at it from a different lens (based on the group that plans to use a particular mechanism for old age expenses) the age group31-40 years had more adults (26%) claiming that they would rely on savings with the 18-25 year category having 21% and 16% for the26-30 years category. For the more senior adults aged 41 years and older 37% claimed saving to be the plan for the old age expenditure.Similarly, for pensions the under 40 year categories planned their old age expenditure on the National Pension Scheme with 67% whilethe categories aged 41 years and older having 33%. Only 1.1% of those above 60 years age had pensions, while 0.2% of those in theAntyodaya category had access to pensions.

6. Defining financial access and inclusion The financial access strand (explained schematically in Figure 21) is one of the key measures of FinScope surveys. It illustrates the useof financial products and services available within the market. Those who do not access these products and services are consideredto be “financially excluded” due to the fact that they are physically, psychologically or circumstantially impeded from accessing suchproducts and services or who have voluntarily opted to stop using financial services. The access strand ranges from formal bankingservices provided by commercial banks at the one extreme, shifting to other formal financial services provided by a large variety ofother formal FSPs (not regulated by the reserve bank, RBI in this case). At the other end of the access strand one finds a range ofinformal services and products. This study focuses on four types of financial services: i) transactions such as deposits, withdrawals andmoney transfers (remittances); ii) savings/investment; iii) credit; and iv) insurance. Each of these services are provided in varyingdegrees by the banks or informal service providers, whereas formal financial service providers tend to offer specialised services, forexample credit, insurance and pension schemes.
The standard FinScope methodology has four categories but for the PSIG a request was made to separate the banking segment intothree sub-segments.
41
Figure 21: The Financial Access Strand
Banked= have/use financial
products/services provided by a bank,
regulated by RBI
Served by other formal financial institutions = have/use financial products/services provided by other regulated
(non-bank) financial institutions, e.g. remittances servicesor insurance products
Financially excluded = do not have/use anyfinancial products and/or services – if
borrowing, they rely only on friend/family;and if saving, they save at home
Formally served = have/use financial products and/or
services provided by a formal financialinstitution (bank and/or non-bank). A
formal financial institution is governed bya legal precedent of any kind and bound
by legally recognised rules
Informally served = have/use financial products and/or services which are not regulated and
operate without legal governance that would berecognised, e.g. pawn shops
Total adult population = Minimum age defined by the age at which individuals can enter into a legal financial transaction in their own capacity – 18 years and older
Financially included = adults who have/use financial products and/or
services – formal and/or informal

42
Consumers generally use a combination of financial products and services to meet their financial needs. It is empirical to understandthe product combinations or overlaps as this will show the extent of financial needs not met by the formal sector thus signalling therole of the informal sector within the financial inclusion context. FinScope findings are presented to show these product combinationsas illustrated in Figure 22 below:
Other formal(non-bank)
Informalmechanisms
Excluded
Figure 22: Overlaps in uptake of financial products/services
Bank products
In order to calculate the Financial Access Strands, these overlaps are eliminated.
6.1. The dimension of financial inclusionFinancial inclusion is only effective or functional if consumers have physical access to financial institutions, are eligible to open an accountor use a product or service, and actually open an account or take up a product or service and then use it. In measuring financialinclusion, FinScope therefore enables the determination of:
n The proportion of the adult population that has physical access to formal financial institutions (i.e. financial institutions regulatedby the Reserve Bank of India). Distance from the institution (measured by time taken to get to the institution) are used forthis purpose
n The proportion of the adult population that is eligible to open an account or use a product or service with a formal financialinstitution – in this regard minimum KYC (“know-your-customer”) requirements for product/service uptake enforced by theReserve Bank are considered
n The proportion of the adult population that is financially included. Both formal and informal inclusion is measuredn The proportion of the adult population that is financially served and uses financial products/services
6.2. The determinants of financial inclusionAlthough physical access to a financial institution and eligibility to open an account or use a product/service are prerequisites for theuptake of financial services, the actual uptake and usage of a financial service or product depends on the individual’s willingness to useany financial service. A range of factors could influence this. FinScope attempts to highlight which factors influence uptake and usageby considering:
n Characteristics of the individual such as:o Demographics – age, gender, level of educationo Income generating activities, levels of income and consistency/regularity of incomeo Attitudes and perceptions about money, financial services and institutionso Financial literacy, knowledge about financial products and services and an understanding by individuals of how financial
products and services can help them improve their lives
n Characteristics of the household such as the structure of the household, role and status of the individual in the household n The attributes of the community the individual lives in such as the level of access it provides to infrastructure as well as culture,
tradition and religion

43
6.2.1. GenderThere is no doubt that gender plays a pivotal element in the household dynamics and the influence on choice of financial products thatthe household member has. How these dynamics play out in PSIG states will be explored through the gender lenses. The two sub-segments for gender are male and female with 52% and 48% representation respectively.
6.2.2. AgeLikewise, age is a variable that helps explains the levels of financial inclusion based on both the economic and intellectual maturity ofan individual. As in most markets, the levels of unemployment mostly affect the youth. For the purposes of analysing financial access,the study uses two age categories for the PSIG adults i.e. ‘under 30 years’ and ‘30 years and older’ as our experience has revealed thatmost youth under the age of 30 years are not economically settled. The split for the two age categories is 30% for under 30 years and70% for 30 years and older. About 9% of adults were aged 61 years ad older as detailed in Table 11.
6.2.3. Level of education In general, levels of financial inclusion, especially formal inclusion, are higher among adults with higher levels of education, that is, adultswith higher than primary education. Given the correlation between education and income and possibly to some extent the relationshipbetween education and financial knowledge, the study uses education as a determinant of financial access. The two categories are‘primary and less’, and ‘higher than primary’ education. The primary and less category has 67% of the PSIG adults with the remaining33% belonging to the higher than primary education.
6.2.4. Income sourceIncome is probably one of the strongest determinants of (formal) financial inclusion, referring to income levels as well assource/regularities of income i.e. proportion of the adult population that receive salaries/wages. Therefore, FinScope surveys takeincome sources and regularity into consideration when analysing financial inclusion. Our experience in implementing FinScope surveysshow that those with more regular sources are more likely to be formally included than those with irregular (and often low) or noincome (e.g. from farming activities and part-time jobs).
Adults source their incomes from multiple sources at a given time especially at the base of pyramid as they try to make ends meet.Through following the source of income, one can see how similar income groups have similar adult profiles (demographics) and hencesimilar financial perceptions and attitudes. Income sources, in most instances, predict the type and level of inclusion in a community.Generally, as income sources become more formal the financial products usually become more diversified compared to less formalincome sources. The sub-categories for sources of income for adults are salaried, part-time employees, self-employed (non-agricultural),those receiving government grants or assistance, those receiving remittances and those involved in agriculture.
6.2.5. Area typeThis refers to the geographical location characterised by population density, an array of human-built features, infrastructure and otherphysical features distinguishing between urban and rural areas as explained in Chapter four. For financial inclusion purposes, this is asignificant determinant as the ‘differences between rural and urban’ characterise the proximity to financial services (supply-side),infrastructural development of area, which gives context to financial inclusion. The two sub-segments are rural (80%) and urban (20%)as discussed earlier.
The above-mentioned determinants will be analysed at PSIG level and at state-level.

44
7. Financial inclusion in the 4 PSIG StatesThe goal of financial sector development and increased financial inclusion is to improve the lives of all 4 PSIG states adult population,and more especially to enable the poor to build financial security, manage financial shocks and to invest in opportunities to generateincome through access to secure savings facilities and other financial services. In line with this goal, it would also be any Government’sobjective to channel as much of the money in a country through the formal financial system in order to enhance the liquidity of financialinstitutions and ultimately increase their ability to provide credit and better interest on savings.
Broadly viewed, the overall objective of financial sector development would therefore be to decrease the proportion of the populationwho are financially excluded and to specifically drive formal inclusion.
The study approaches financial inclusion using a livelihoods framework model. The approach used follows the understanding thatadults are affected and influenced by the household, which in turn is influenced by the community at large. The livelihoods frameworkis illustrated in Figure 23. It shows that at the core of the framework, the adult is influenced by numerous factors starting from withinthe household such as household structure and infrastructure or household income sources. These influence the adult in the way theyconduct their financial matters, lifestyle, etc. Impacting the household are community factors such as social groups, communityinfrastructure such as electricity and water or societal norms and practices.
1 Communityn Facilities and infrastructure
n Social connectivity
2 Householdn Structure
n Decision-making & behaviour
n Sources of money
n Infrastructure
n Assets
n Vulnerability and response
3 Individualn Lifestyle
n Life-stage and product needs
n Financial attitudes and behaviour
n Financial engagement
n Drivers and barriers
n Demographic characteristics
Figure 23: Livelihoods framework
The following section looks at household level financial access and exclusion and then looks at adult (individuals) level access in thesection to follow.

7.1. Financial inclusion and exclusion at household levelThe social and economic setting of a community sets the tone and directly influences the propensities of whether households arefinancially served or not. As the livelihoods framework suggests, the availability (or lack thereof) of facilities and infrastructure createsan enabling environment for financial service providers to service that area – in turn enabling communities to have a greater access tofinancial services. The FinScope experience has noted the strong correlation between access to financial services and higher incidenceof financial inclusion.
From the FinScope PSIG 2015, a proxy of how well-developed the community is, was derived on the accessibility to infrastructure andfacilities. From section 4.5, the summary was that the PSIG states have good connectivity as 82% of adults use cellphones signaling thatmobile connectivity is good. Furthermore, physical access to facilities shows that on average it takes an adult within PSIG states to reacha Post Office, bank branch and an ATM in 25 minutes, 31 minutes and 32 minutes respectively.
Bearing in mind that these are the poorest states of India, this shows that PSIG states are conducive to roll-out any targeted interventionsas infrastructure and facilities are available.
Overall, the majority of the households (93%) in the PSIG are formally served as shown by Figure 24 below. The percentage ofhouseholds that are banked directly is 86% while those that are banked through BC is 13% and 26% through PMJDY accounts. In general,35% of households have other formal (non-bank) accounts for example saving with NBFC or MFIs and 15% are only served by theinformal sector. This means that 6% (4 650 461 households) are financially excluded.
45
Figure 24: Household overall uptake of financial products/services (%)
Formally served
Banked
Other formal (non-bank)
Informal
Excluded
%
93
92
13
26
35
15
6
7.1.1. Overlaps of financial product usage by householdsHouseholds generally use a combination of financial products and services to meet their financial needs – a household could have abank account and also belong to an informal grouping. A few groups are seen in Figure 25:
n Only 49% of households rely exclusively on banking servicesn 13.2% use a combination of formal and informal mechanisms to manage their financial needs, thus indicating that their needs
may not be fully met by the formal sector alonen 2% of the household ONLY rely on informal mechanisms such as to save or borrow money
To get a clearer picture of how households utilise a combination of financial products, the product overlaps are shown below in Figure25. This depicts that households that only have banked products is 49% while some households supplement the bank products withother products – that is 29% hold both bank and other formal (non-bank) products and 8% have bank and informal products. Overall,Figure 25 illustrates the extent of needs that drives households to have multiple products. This Venn diagram provides insights tofinancial service providers that there is a gap that is not fully met by product suites offered by them – thus requiring an innovativeapproach from them to design more appropriate offerings.
Banked PMJDY
Banked BC
Banked directly 86

46
BankedOther formal(non-bank)
Informal
Excluded
49.3% 29.7% 1.1%
0.2%
4.5%
7.9%
1.4%
5.8%
Figure 25: Household overlaps in uptake of financial products/services
In constructing this strand, the overlaps in financial product/services usage are removed, resulting in the following segments:
n Financially excluded households, i.e. they do not use any financial products/services – neither formal nor informal – to managetheir financial lives (6%)
n Households who have/use informal mechanisms only but NO formal products/services (2%)n Households who have/use formal non-bank products/services but NO commercial bank products (1%) – they might also
have/use informal mechanismsn Households who have/use bank products/services (93%) – they might also have/use other formal and/or informal mechanisms.
n Banked directlyn Banked BCn Banked PMJDY
n Other formal (non-bank) n Informal onlyn Excluded
HH_PSIG
Uttar Pradesh
Odisha
Madhya Pradesh
Bihar
62186
Figure 26: Household Financial Access Strand (%)
92%
42
391 41
102 573 62
7187 22
6587 11
The banked household population represents 92% of the PSIG states indicating that most adults in the PSIG belong to a householdwhere one or more members of the household are banked. In the section to follow we see how this how this influences the totaladult population usage of bank accounts (i.e. household vs. individual adult). Few households are dependent on informal mechanismsonly at 2% indicating a low dependency on informal services alone to deal with financial matters.
Households are formally included across states with Odisha leading, having 94% of households being served by formal financialinstitutions. The initiative by the Prime Minister to get households to have at least a financial account is gaining traction for extendingfinancial inclusion as evidenced by the contribution of PMJDY accounts over and above the contemporary bank accounts that householdmembers had. This is also evident in Figure 25 above illustrating the access strand for each state.

7.1.3. Household financial access by household economic statusFigure 28 shows the level of financial access by household economic status. The BPL households slightly lag behind those that are abovethe poverty line. It is surprising that there are no major differences in the total levels of financial access by the two groups. For thosehouseholds that are above the poverty line, 90% of them are banked directly with 7 percentage points higher than the BPL households.It would also appear for “other formal (non-banked)” products to “informal only” that those households in BPL have slightly higherownership of these products but with also a higher number of excluded households (7%). Generally, access to both BPL and APLhouseholds is high. Using the poverty indicator bands for household stratification in Figure 28, those living on under $2.50/day are wellincluded (mostly banked) while those living on under $1.88/day and $1.25/day show lower banked households respectively. This alsoshows that as households get poorer, they tend to have higher dependency on informal mechanisms.
n Banked directlyn Banked BCn Banked PMJDY
n Other formal (non-bank) n Informal onlyn Excluded
Urban
Rural 86 2 3 621
85 661 1
Figure 27: Household Financial Access Strand by area (%)
7.1.2. Household financial access by area typeWhen one looks at area type and household financial access in Figure 27, there is not much difference between area types and thelevels of financial inclusion with urban at 94% of the households formally included while rural lags behind at 92%. One can also see asmall number of rural households that are dependent on informal services only. However, there are minor differences in productuptake between the urban and rural area households.
Above poverty line
Belowpoverty line 83 2 4 722
90 531 11
Figure 28: Household Financial Access Strand by Poverty Indicator Bands and Economic Status (%)
47
n Banked directlyn Banked BCn Banked PMJDY
n Other formal (non-bank) n Informal onlyn Excluded
99 1
87 641 11
77 863 33
Householdsliving on under
$2.50/day
Householdsliving on under
$1.88/day
Householdsliving on under
$1.25/day

48
Household results show that financial inclusion rates at household level are high with 93% of households formally served. The PMJDYis a scheme launched in August 2014 by the Prime Minister, where every Indian family will be enrolled in a bank for opening a zerobalance account14.
The scheme not only provides for the families of India to have an account but it also offers various benefits for the poor families. Someof these benefits are that every person:
n Will have a zero balance accountn Gain life cover insurance worth ₹30 000n Will be given a new RuPay debit card – this card comes with accidental cover of 1 lakh rupeesn Will be eligible for taking an overdraft of ₹5 000 after 6 monthsn Will qualify for pension grant at old age
These benefits cover almost all the product ranges for financial inclusion. As such, the relationship between households and individualsis close as families influence the choice of financial products that individuals take.
Having discussed the interaction between households and their financial livelihoods we now go a step further to try and understandhow the household links to the individuals that it composes of. Household analysis helps give context to the environment in whichadults live and work from – hence forming an integral part of understanding the financial lives of individuals. The next section andsubsequent chapters explore the levels of financial inclusion from the individuals’ (adult) perspective.
7.1.5. Household formal account distributionFigure 30 presents the use of financial products by the households. It shows that bank products and services are the most popularlyused in the PSIG states. This helps explain the household financial access strand showing a high percentage of household that arebanked. 82% of households claimed to have a regular bank account while 24% claimed to have life insurance.
There were a total of about 76 985 464 households in the PSIG states. The FinScope methodology sought to find linkages betweenhousehold financial access and their demographic characteristics. As most households are classified according to their economic status,whether they are in the rural or urban areas, these are the same variables that were used to classify if they are financially included ornot.
n Banked directlyn Banked BCn Banked PMJDY
n Other formal (non-bank) n Informal onlyn Excluded
Government grants
Receiving remittances
Salaried
Self employed(non-agricultural)
Part time
Involved in agriculture
51189
Figure 29: Household Financial Access Strand by income source (%)
13
53 288 2
491 3 111
52 190 21
91 379 72
51287 41
7.1.4. Household financial access by income sourceAs explained in Chapter 6, the study analyses the households by categorising them into common income groups. Looking at Figure29, it shows that households receiving remittances are formally served, that it is, they use formal channels to receive remittances andbanking channels being used more (88%). As expected, where at least one member of the family receives a salary, 95% of the familiesare formally served. Noteworthy in this analysis is that even for the households that have part-time sources of income, 89% of themare formally served showing a drive for household inclusion that is wholly inclusive in design..
14 http://jandhanyojana.net/

7.1.6. Household creditHouseholds use credit to manage their financial wellbeing and finance their operations. Figure 31 shows the percentage of householdsthat used borrowed funds to finance their operations where a total of 23% use credit. Only 7% access credit through the banks and3% through other formal (non-bank) sources. Though the emphasis is on formal channels, one notes that 13% are actively seeking creditfrom informal sources. The emphasis on informal is to highlight that households do use credit and the formal sector seems not to bethe preferred source for those households.
49
Figure 31: Household credit overalls
Formally served
Bank
Other formal (non-bank)
Informal
Not borrowing
%
105
10
734
32
6
157
12
77
8374
n Totaln Urbann Rural
Figure 30: Household usage of financial services
Bank – regular account (directly opened in bank branch)
Bank – Jan Dhan account – (directly opened in bank branch)
Life Insurance
Bank – credit/debit card
Loan from moneylender or pawn shop
Bank – kisan credit card
Bank – required account for Govt direct benefit transfers
Bank – loan
Post Office – savings account
Savings through SHG
Health insurance
Bank Jan Dhan account through BC
SHG loan
General Insurance
PACS – credit
Bank regular account through BC
Savings with NBFC/company
MFI – loan
%
82
26
24
19
15
10
7
7
7
7
7
6
6
4
2
1
1
1

50
7.1.7. Household insuranceInsurance is also used to cope with sudden shocks and events that may disturb the financial well-being of households. FinScope soughtto assess the uptake of insurance products applicable at household level such as property and medical insurance. Figure 33 shows that28% of all households are insured using formal products and 72% are not insured. The drivers for insurance identified in Figure 34 showthat life insurance (85%), health insurance (24%) and general insurance (15%) are the top drivers for insurance product uptake.
Figure 32 showing the credit strand indicates that:
n 7% claim to borrow from banksn 3% have formal credit facilities from non-bank financial institutionsn 13% have informal creditn 77% do not borrow
n Bankedn Other formal (non-bank) n Informal
n Family and friends onlyn Not borrowing
7 773 13
2 833 6 6
6 744 11 5
Figure 32: Household Credit Strand
n Have insurance n Not insured
7228
6733
7327
8020
7525
5248
7228
Figure 33: Household Insurance Strand
Figure 34: Drivers for household insurance
Life insurance
Health insurance
General insurance
Agriculture insurance
85
24
15
2
%
Total
Urban
Rural
Bihar
Madhya Pradesh
Odisha
Uttar Pradesh
Total
Urban
Rural

51
7.1.8. Household remittancesThe flows of funds are an important element in sustaining households financially – especially those flowing inbound. Householdmembers may be scattered across India but remit funds to other household members left behind as a means of supporting them.Remittances are another product that is taken into account when assessing inclusion. Figure 35 shows that 7% of households areremitting through banking channels to receive money. However, caution must be exercised, as the questions were directed only at therespondents on whether they or the household received money.
Figure 35: Household remittances overalls
Formally served
Bank
Other formal (non-bank)
Cash in hand
Not remitting
%
7
7
0.4
2
92
Figure 36 summarises the levels of remittances as:
n 7% of the households remit through banksn 0.4% of households use formal remittances facilities from non-bank financial institutionsn 2% use informal channelsn 92% do not remit
n Bankedn Other formal (non-bank) n Informal
n Cash in hand onlyn Not borrowing
7 922
0.4
Figure 36: Household Remittances Strand
15 The claimed remittances results do not simulate the product-based remittances found in the remittances strand. The claimed figure is often exaggerated16 Although comparability between surveys needs identical or similar methodologies, AIDIS 2014 reported that Odhisha and MP household remittances
were much higher.
Household remittances form an important livelihood component of income source. The study found that 10%15 of households in thePSIG states receive their money from within India and only 1% from outside the country. Bihar state shows the highest proportion ofhouseholds receiving money in the past 12 months with 21% shown in Table 32 below.
Bihar MadhyaPradesh Odisha Uttar
Pradesh PSIG
Received money within India 21 1 4 10 10
Received money outside India 1 0 0 1 1
Table 32: Households claiming to receive money in the past 12 months (%)16

52
7.2. Individual financial access and exclusionThe previous section gave context to how households access and use financial products in different areas and economic situations. Thissection now looks closer at the adult individual as most financial products are tailored to be used by individuals. More so, althoughfinancial products can benefit members of a household, individuals who in their personal capacity own most products and services, facedifferent choices and have different needs. Financial products are also designed mainly from individual based traits rather than communaltraits that may not speak to individuals.
In order to assess the extent to which adults within the PSIG states have access to formal financial institutions, the study looks at thegeographical distribution of PSIG adults in relation to the geographical distribution of formal financial institutions.
Data collected through FinScope 2015 survey in PSIG regarding the physical locations of access points of formal financial institutions,enabled the estimation of time taken to get to geographical mapping of the location of access points in relation to the geographicaldistribution of adults (See Chapter 4). This led to the conclusion that physical access or proximity to financial institutions did not serveas a major obstacle to formal financial inclusion in the PSIG states.
Product information collected from financial institutions suggested that the main requirement for opening a basic entry-level type ofaccount included proof of identity and the provision of two passport photographs. For most financial institutions strict deposit andminimum balance requirements do not apply for these types of products.
As carrying of a national identity card is obligatory for every resident in PSIG aged 18 years or older, eligibility, like physical access, didnot seem to serve as a major obstacle to formal financial inclusion. On average only 8% adults in the PSIG states claimed to have noVoters ID.

5317 These accounts may be serviced by bank branches directly or through business correspondents.18 http://www.cgap.org/blog/can-india-achieve-financial-inclusion-within-next-few-years
7.2.1. Individual levels of financial inclusion The term formally served refers to the percentage of adults that have financial products at formal financial institutions across all productcategories. When interpreting Figure 37 one notes that 75% of the adults have some type of financial account with formal providers– and obviously this interaction is evident with commercial banks as they account for 72%. Further, this means that 17% are bankedthrough PMJDY accounts17 while only 6% are banked through banking correspondents (BC). Similarly, 25% transact with other formal(non-bank) institutions.
The Indian Finance Minister had aspirations that each individual in every Indian household should have a financial account by August201518. Noting the 75% of the adult population in the PSIG states who are formally served, this is quite an achievement. If one includesthe informal sector in the equation, this figure would significantly be higher as some adults still transact in the informal space. Possibly,those who transact in the informal space (18%) can be incentivised to participate in the mainstream formal economy though financialeducation initiatives that motivates for the use of formal products.
When analysing further, the individual overlaps in Figure 38 highlights the product combinations that adults use in meeting their financialneeds. Those that have banked or formal products only (42% and 3% respectively) are content being served by those productsexclusively, while 32% need a supplement from other products. Other formal (non-bank) is driven by insurance products and is skewedtowards adults living in Odisha. Informal products are being driven by savings in Odisha and credit in Bihar.
Figure 37: Financial Access overalls (%)
Formally served
Banked
Other formal (non-bank)
Informal
Excluded
%
75
72
6
17
25
18
21
Banked PMJDY
Banked BC
Banked directly 64

54
7.2.2. Overlaps of financial product usage by adult individualsIndividuals generally use a combination of financial products and services to meet their financial needs – an individual could have a bankaccount and also belong to an informal grouping.
n Only 42% of adults rely exclusively on banking servicesn 15% use a combination of formal and informal mechanisms to manage their financial needs, thus indicating that their needs may
not be fully met by the formal sector alonen 4% of the adult population ONLY rely on informal mechanisms such as Self Help Groups to save or borrow money
BankedOther formal(non-bank)
Informal
Excluded
41.6%16.6%
2.6%
0.6%
5%
9.1%
3.5%
21.1%
Figure 38: Individual overlaps in uptake of financial products/services
In constructing this strand, the overlaps in financial product/services usage are removed, resulting in the following segments:
n Financially excluded individuals, i.e. they do not use any financial products/services – neither formal nor informal – to managetheir financial lives (21%)
n Individuals who have/use informal mechanisms only but NO formal products/services (4%)n Individuals who have/use formal non-bank products/services but NO commercial bank products (3%) – they might also have/use
informal mechanismsn Individuals who have/use bank products/services (72%) – they might also have/use other formal and/or informal mechanisms.
Below is a summary of the Consumer Financial Access Strand of the four PSIG states in Figure 39 which shows that 79% (210.4 million)of the adult population was financially included (75% formally served, leaving 21% (56.2 million) financially excluded at the PSIG level).The financial access strand is an amalgamation of all the landscape product such as credit or savings which will later be looked atindividually e.g. Savings strand.
n Banked directlyn Banked BCn Banked PMJDY
n Other formal (non-bank) n Informal onlyn Excluded
PSIG
Odisha
Uttar Pradesh
Madhya Pradesh
Bihar
214364
Figure 39: Consumer Financial Access Strand (%)
72%
62
1969 7 1 22
274 852 81
273 260 62
129 175 12
When comparing the Financial Access Strands for the four states, Odisha is leading because it has the highest banked population at78% and also has the least number of the excluded population (12%). This means that majority of the adults are financially includedat 88% for Odisha when summing up all forms of product categories held. Bihar lags behind with the highest proportion of thefinancially excluded with 27%. UP’s banked population is similar to Odhisha (78%) but it has a higher excluded proportion of 19%.
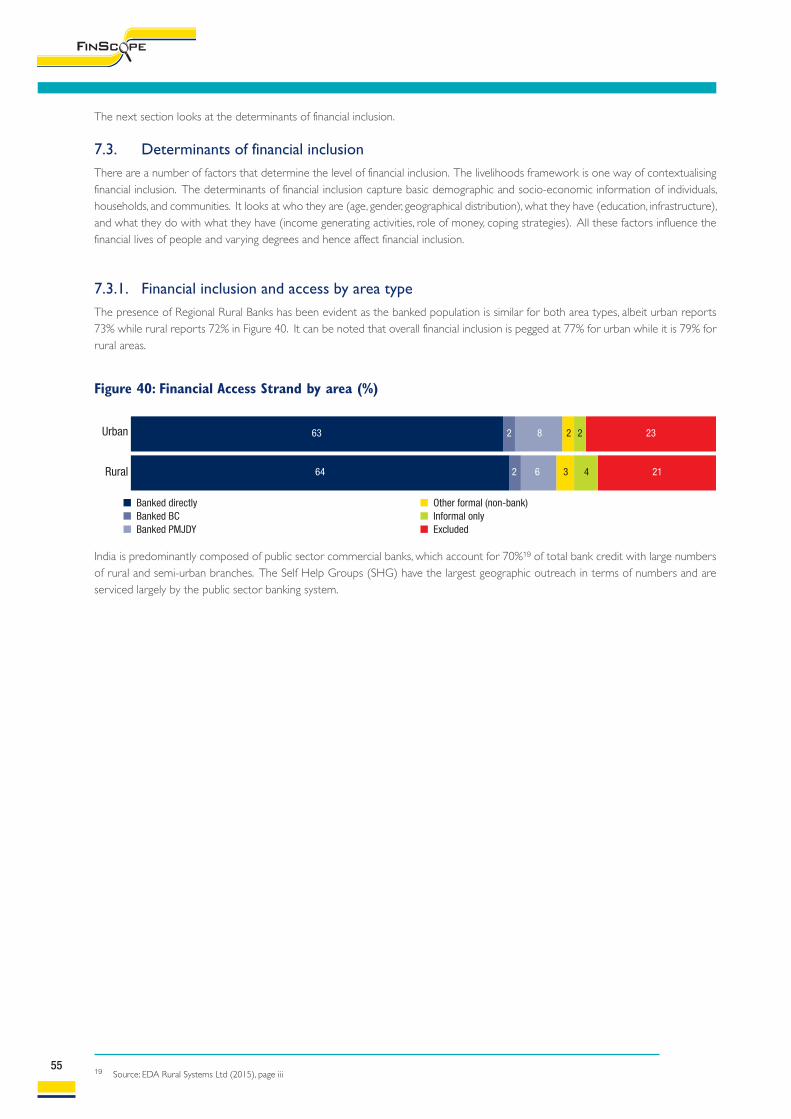
55
The next section looks at the determinants of financial inclusion.
7.3. Determinants of financial inclusionThere are a number of factors that determine the level of financial inclusion. The livelihoods framework is one way of contextualisingfinancial inclusion. The determinants of financial inclusion capture basic demographic and socio-economic information of individuals,households, and communities. It looks at who they are (age, gender, geographical distribution), what they have (education, infrastructure),and what they do with what they have (income generating activities, role of money, coping strategies). All these factors influence thefinancial lives of people and varying degrees and hence affect financial inclusion.
7.3.1. Financial inclusion and access by area typeThe presence of Regional Rural Banks has been evident as the banked population is similar for both area types, albeit urban reports73% while rural reports 72% in Figure 40. It can be noted that overall financial inclusion is pegged at 77% for urban while it is 79% forrural areas.
n Banked directlyn Banked BCn Banked PMJDY
n Other formal (non-bank) n Informal onlyn Excluded
Urban
Rural 64 2 6 2143
63 2382 2 2
Figure 40: Financial Access Strand by area (%)
India is predominantly composed of public sector commercial banks, which account for 70%19 of total bank credit with large numbersof rural and semi-urban branches. The Self Help Groups (SHG) have the largest geographic outreach in terms of numbers and areserviced largely by the public sector banking system.
19 Source: EDA Rural Systems Ltd (2015), page iii

56
7.3.2. Financial inclusion and access by gender, age and educationThere is no clear evidence to say that age or level of education influences the choice of financial products, but gender does. Figure 41and 42 show no significant differences for age or level of education as the profile of the users have similar types of products. On theother hand, males have a higher percentage of those that have contemporary bank accounts (banked directly) with 70% while for femalesits 58%. Overall, the picture does not produce conflicting results across the determinants of financial inclusion with the exception ofgender.
The PSIG states have an interesting twist to the FinScope norms. As mentioned in section 6.3, the determinants of financial inclusionare used to create a practical way of understanding the realities of the people and their surrounding areas- using demographic variablessuch as age, gender, level of education, source of income and type of area they live in. In most countries, the FinScope experience hasshown the following norms:
n those with higher than primary level of education are more likely to be formally includedn males are likely to be formally includedn those with regular sources of income are more likely to be formally includedn those living in urbanised [physical accessibility to formal financial institutions, sanitation, electricity, etc.] are more likely to be
formally included
In the PSIG states, there are real reasons and justification for why these norms do not apply. Firstly, the Indian Finance Ministry has aninitiative to ensure that every individual has a formal financial account in order to advance financial inclusion. Secondly, the presenceof financial institutions in rural areas is a clear indication of progressive states as regional rural banks have good geographic coverage.Moreover, the summary below encapsulates why the PSIG states fare well with respect to financial inclusion.
n Physical access to financial institutions – the average time taken to a formal financial access point is 30 minutes, which is relativelygood considering that these are the poorest states.
n Banked directlyn Banked BCn Banked PMJDY
n Other formal (non-bank) n Informal onlyn Excluded
Female
Male 70 2 5 1743
58 2582 4 4
Figure 41: Financial Access Strand by gender (%)
n Banked directlyn Banked BCn Banked PMJDY
n Other formal (non-bank) n Informal onlyn Excluded
Under 30years
30 yearsand older 64 2 7 2043
64 2172 3 3
Figure 42: Financial Access Strand by age (%)
n Banked directlyn Banked BCn Banked PMJDY
n Other formal (non-bank) n Informal onlyn Excluded
Primary andless
Higher thanprimary 65 2 7 2133
65 2172 3 4
Figure 43: Financial Access Strand by education (%)

n Eligibility to open an account – FinScope results shows that 98% of adults have identity documentation in their names tofacilitate the opening of financial accounts. This also suggests that documentation is not a barrier to financial inclusion – itfurther means the minimum “Know Your Customer (KYC)” requirements are easily met.
n Product take-up – formal product take-up of 75% is a great result considering the poor rank of the PSIG states. Whencomparing this inclusion rate to other South East Asian countries, these poor states have better financial inclusion rates.
n Usage – Banking account usage is dealt with in section 8.
7.4. Landscape of AccessThe FinScope Landscape of Access is used to gain more insight into the type of financial products held or used. Landscape of Accesslooks at the types of products taken up by consumers who are financially included (210.5 million) and describes the percentage of adultsthat have/use formal and informal products/mechanisms, including the following:
n Transactional products/services - current accounts, debit cards, credit cards or basic savings accounts, which could be used fortransactional purposes, etc.
n Savings products/services - Long and short-term products are included – i.e. basic savings accounts, fixed deposit accounts, shares,government and/or utility bonds, savings with savings groups, etc.
n Credit products/services - Loans from formal financial institutions and informal credit such as shop credit and credit frommoneylenders; shops or savings groups, etc. are included.
n Insurance products/services - Risk management products from formal institutionsn Remittance services/mechanisms - remittance services provided by formal institutions such as Western Union or informal
mechanisms such as paying taxi or bus drivers a fee to transport remittances, etc. are included.
The study findings summarised by Figure 44 revealed that:
n PSIG adults were most likely to have savings (93%) n Transactional products/services have been reported by 39% n Remittances (26%)n Credit product (23%)
57
Figure 44: PSIG Landscape of Access
39
Transactional
8
Remittances
93
Savings
26
Insurance
23
Credit

58
8. Commercial bank product uptake and usageThis chapter looks at the issues around banking. Before we assess the financial inclusion levels with regards to banks, it is important tounderstand the psychology of the consumers when dealing with financial institutions. With regards to levels of trust, there is a cleardisparity between public banks and private banks where there was total trust on government banks versus private banks, (see Figures45 and 46). Similarly, this trend continues on the perceived ease of dealing with private banks (31%) and business correspondents ofbanks/BC kiosks (21%). Further understanding of this trend is needed as financial inclusion is pegged on finding ways for the public todeal with financial institutions generally.
Figure 45: PSIG level of trust with banks
Banks (public)
Banks (private)
Business correspondentsof banks/BC kiosks
99
27
18
%
Figure 46: Ease of dealing with financial institutions
Banks (public)
Banks (private)
Business correspondentsof banks/BC kiosks
87
31
21
%
As already shown in the previous analysis in the Financial Access Strand, banking status is composed of the three sub-segments. Firstly,contemporary bank accounts as those individuals who have bank accounts organically – termed directly banked. The second sub-segment consists of the individuals who opened bank accounts through the banking correspondents (BC) – i.e. the use of other bankrepresentative channels as means of reaching the consumers. Lastly, the third sub-segment consists of the groups that have activelytaken up the PMJDY accounts where the initiative is to get the adults to have banking accounts. Figure 47 shows that 64% of the adultpopulation have the contemporary basic account while 6% have banking correspondent accounts. Further, those who have taken upthe PMJDY accounts are at 17%. It should be noted that there are still some individuals who have a combination of these accounts.Using a different age category to check the level of access amongst different age groups as used in Chapter 4, the proportion of thosein age group 26 to 40 years with bank accounts is significantly less than other age groups. Ownership of credit/debit cards is lessprevalent in age group 51 years and above compared to those below 50 years showing that ownership of bankcards among adultstended to increase with their level of education.
Figure 47: Banking products uptake
Banked directly
Banked BC
Banked PMJDY
Unbanked
%
64
17
6
28
The survey shows that the India PSIG states’ bank account penetration might be higher than expected; however these states suffer fromnotable inactive accounts. About one in ten (25.5 million) adults in the PSIG states have inactive bank accounts (Figure 48). A bankaccount is classified as ‘active or inactive’. If one has a current or a savings bank account which has not been used for any transactionsfor more than 12 months it is classified as inactive. If one does not do any transactions from a bank account for 24 months, then it willbe classified as dormant.
Only 66% (129 million) adults actively use their bank accounts on a monthly basis to either initiate transactions such as withdrawal ofcash at a branch or automated teller machine (ATM), payment by cheque, transfer of funds through Internet banking, phone bankingor ATMs. The use of accounts for payments or receiving payments/income is relatively low – 27% (54.7 million) adults reported usingaccounts to make or receive payments in the past 12 months. Only 11% (20.6 million) adults receive their income through a bankaccount.
Put differently active accounts are those that have been used for at least one transaction in the past three months and at least ten timesduring the past year.
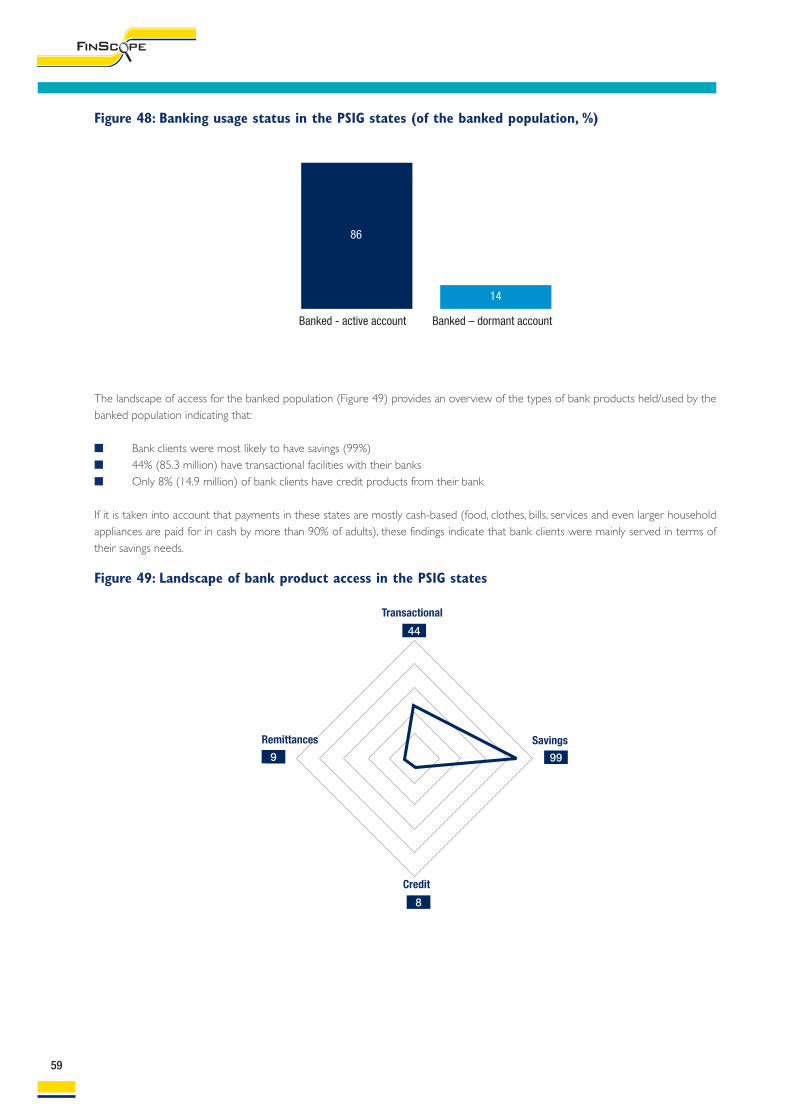
The landscape of access for the banked population (Figure 49) provides an overview of the types of bank products held/used by thebanked population indicating that:
n Bank clients were most likely to have savings (99%)n 44% (85.3 million) have transactional facilities with their banksn Only 8% (14.9 million) of bank clients have credit products from their bank
If it is taken into account that payments in these states are mostly cash-based (food, clothes, bills, services and even larger householdappliances are paid for in cash by more than 90% of adults), these findings indicate that bank clients were mainly served in terms oftheir savings needs.
59
Figure 48: Banking usage status in the PSIG states (of the banked population, %)
Banked - active account Banked – dormant account
86
14
Figure 49: Landscape of bank product access in the PSIG states
44
Transactional
9
Remittances
99
Savings
8
Credit

60
There are a number of reasons why people use banks. Table 33 below summaries the drivers for the use of bank accounts. The maindriver is that people use bank accounts to keep their money safe from theft at least nine out of ten times for each of the states.Additionally, the banked is also driven by those that use their accounts to remit money with 90% of the banked adults in Bihar statingthis as an advantage.
All adults were asked about the advantages of the PMJDY which are presented in Table 34. The PMJDY account has advantages overthe traditional bank accounts such as relaxed and simple KYC. 72% of adults in the PSIG states claim it to be the main advantage ofthe PMJDY.
Few adults claimed to use someone else’s account with only a proportion of 0.5% at the PSIG state level. Of these adults, 95% claimedto use a ‘bank direct account’. When asked whose account they were using, 45% claimed the account to belong to a neighbour orfriend, 25% claiming it belonged to their spouse or partner and 7% claiming to belong to their parents. The main reasons for the adultsusing someone else’s account were that they were illiterate (20%); distance to a bank too far (15%) or they did not have anydocumentation (13%).
Advantages of using PMJDY Bihar MadhyaPradesh Odisha Uttar
Pradesh PSIG
Regular Bank accounts require a lot ofdocumentation to open account 61 72 54 83 72
Regular Bank accounts require a deposit/minimum balance to open the account 49 64 35 49 50
Information about the details of the accounts(requirement, benefits, etc.) are clearly spelt outfor PMJDY accounts.
43 21 45 44 40
PMJDY accounts could also be opened through aBanking Correspondent (not necessarily only atthe Bank Branch)
32 38 39 26 31
When receiving a payment from government orsalary or wage into a bank account, it is better totake all the money out at once rather than take itout as you need it
20 14 28 7 14
Table 34: Drivers for PMJDY (%)
Advantages of using a bank or Post office Bihar MadhyaPradesh Odisha Uttar
Pradesh PSIG
Money is safe from theft 99 98 91 97 97
Easy way of receiving/sending money from others 90 70 66 76 77
You get interest on savings 86 60 71 74 73
Safe way of receiving/sending money from others 82 61 59 69 70
Helps you to get access to loans 61 44 64 49 53
Compulsory for receiving governmentpayments/benefits 56 44 42 53 51
Salaries/wages can be deposited by employers 61 28 43 29 37
Other 1 1 6 3 3
Table 33: Drivers for banking (%)

The survey indicated that 72% (192.2 million) of the adult population is banked (i.e. had/used commercial bank products/services). Table35 gives an overview of the characteristics of the banked population and that the profile of the banked was significantly skewed towards:
n Adults from Uttar Pradeshn Malen Post-secondary
Merely having a bank account is not enough for effective financial inclusion. What is of paramount importance is the usage of that bankaccount. Characteristics of the banked population with “active” bank accounts were significantly skewed towards:
n Urbann Odisha staten Malesn Secondary and Post-secondary
Rural adults, females and Bihar state were least likely to have active banking accounts.
61
Table 35: Distribution of the banked population
Geographic distribution Total population%
Banked population%
Active bankaccounts at
monthly basis %
Rural 80 80 77
Urban 20 20 23
States
Bihar 24 20 21
Madhya Pradesh 18 17 17
Odisha 12 13 16
Uttar Pradesh 46 50 46
Gender
Male 52 55 57
Female 48 45 43
Age distribution
18 to 29 years 30 30 29
30 to 39 years 26 26 26
40 to 49 years 19 19 19
50 to 59 years 12 12 12
Older than 60 years 13 13 13
Income generating activities
Money from agriculture 55 56 56
Part time job 46 45 44
Own business (not agriculture related) 18 19 20
Salary 15 15 15
Remittances 10 10 9
Government grants 9 9 9
Levels of education
No formal school 31 28 23
Primary school 36 36 36
Secondary school 25 26 29
Post-secondary 8 10 12

62
There are about 73.9 million unbanked adults in the PSIG states. Bihar state is more likely to have a higher proportion of the unbankedpopulation compared to other states. The unbanked population skewed towards adults without formal education, and females.
Table 36: Distribution of the unbanked population
Geographic distribution Total population%
Unbankedpopulation
%
Rural 80 80
Urban 20 20
States
Bihar 24 33
Madhya Pradesh 18 21
Odisha 12 9
Uttar Pradesh 46 37
Gender
Male 52 44
Female 48 56
Age distribution
18 to 29 years 30 30
30 to 39 years 26 27
40 to 49 years 19 18
50 to 59 years 12 12
Older than 60 years 13 13
Income generating activities
Money from agriculture 55 54
Part time job 46 48
Own business (not agriculture related) 18 17
Salary 15 14
Remittances 10 10
Government grants 9 8
Levels of education
No formal school 31 39
Primary school 36 35
Secondary school 25 22
Post-secondary 8 4

63
9. Other formal (non-bank) uptake and usageAs was indicated earlier (see Figure 37), 25% of the adult population had or used products provided by non-bank formal institutions.Figure 50 indicates that most (82%) adults using non-bank formal financial products or services had or used products/services fromthe insurance sector.
The results summarised in the landscape of access for adults served by non-bank formal institutions (Figure 51) give an overview ofthe types of products held/used by these adults:
n 82% had/used insurance productsn 14% of adults that had/used non-bank formal products had/used savings products; 15% borrowed money from institutions such
as MFIs and SHG
Insurance 54,1 million
SHG 13,8 million
MFI 1,3 million
Cooperation 1,1 million
Figure 50: Products/services used by adults served by non-bank formal financial institutions
Insurance
SHG
MFI
Cooperation
82
21
2
2
%
Figure 51: Landscape of non-bank formal product access
82
Insurance
0.2
Remittances
14
Savings
15
Credit

64
9.1. Insurance sector product uptake and usage As mentioned in section 5.2, risk poses a significant amount of strain on individuals and households alike especially if it is not covered.This has direct implications on the quality of one’s life. The study explored the risks and hardships that people may experience andwhich products they would use in covering such risks. In total, 20% (54.1 million) adults in the PSIG states have/use insurance products.The proportion of adults who are insured varies significantly from 43% in Odisha state to only 13% in Bihar.
The following Figures (53 and 54) show the results by gender and area type. When exploring the results using gender, males (24%)are more insured than females (16%). As most males are typically heads of households they may tend to have insurance products intheir names. On the other hand, adults in urban (24%) areas are more insured than those in rural (19%) areas. This is possibly due togenerally higher salaries in urban areas. The age variable was also used but no notable differences were found amongst age categories.
Insurance in the PSIG states is mainly driven by the uptake of life insurance. The reported main barrier to insurance penetration (Figure55) in PSIG relates to affordability (nearly two in three adults reported that they cannot afford insurance).
n Insured individually n Not insured
Less than 30 years
30 years and above
PSIG
Uttar Pradesh
Odisha
Madhya Pradesh
Bihar
8020
8119
5743
8218
8713
Figure 52: Proportion of adults who are insured (%)
n Insured individually n Not insured
Female
Male 24 76
16 84
Figure 53: Insurance distribution by gender
n Insured individually n Not insured
Rural
Urban 24 76
19 81
Figure 54: Insurance distribution by area
8020
7921
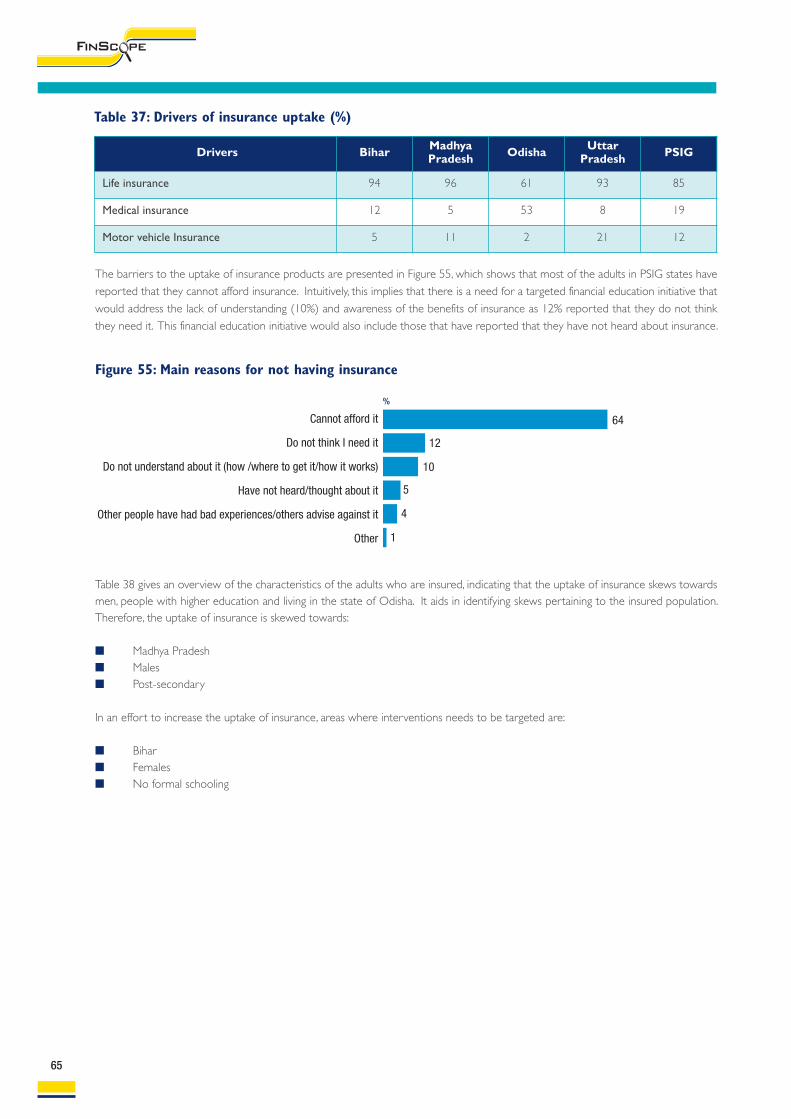
65
The barriers to the uptake of insurance products are presented in Figure 55, which shows that most of the adults in PSIG states have
reported that they cannot afford insurance. Intuitively, this implies that there is a need for a targeted financial education initiative that
would address the lack of understanding (10%) and awareness of the benefits of insurance as 12% reported that they do not think
they need it. This financial education initiative would also include those that have reported that they have not heard about insurance.
Figure 55: Main reasons for not having insurance
Cannot afford it
Do not think I need it
Do not understand about it (how /where to get it/how it works)
Have not heard/thought about it
Other people have had bad experiences/others advise against it
Other
64
12
10
4
%
Table 38 gives an overview of the characteristics of the adults who are insured, indicating that the uptake of insurance skews towardsmen, people with higher education and living in the state of Odisha. It aids in identifying skews pertaining to the insured population.Therefore, the uptake of insurance is skewed towards:
n Madhya Pradeshn Malesn Post-secondary
In an effort to increase the uptake of insurance, areas where interventions needs to be targeted are:
n Biharn Femalesn No formal schooling
5
1
Drivers Bihar MadhyaPradesh Odisha Uttar
Pradesh PSIG
Life insurance 94 96 61 93 85
Medical insurance 12 5 53 8 19
Motor vehicle Insurance 5 11 2 21 12
Table 37: Drivers of insurance uptake (%)

66
Table 38: Distribution of the insured population
Geographic distribution Total population%
Insured population%
Rural 80 80
Urban 20 20
States
Bihar 24 15
Madhya Pradesh 18 17
Odisha 12 25
Uttar Pradesh 46 43
Gender
Male 52 62
Female 48 38
Age distribution
18 to 29 years 30 29
30 to 39 years 26 25
40 to 49 years 19 21
50 to 59 years 12 12
Older than 60 years 13 13
Income generating activities
Money from agriculture 55 58
Part time job 46 40
Own business (not agriculture related) 18 20
Salary 15 15
Remittances 10 9
Government grants 9 11
Levels of education
No formal school 31 16
Primary school 36 35
Secondary school 25 33
Post-secondary 8 14

67
10. SavingsWhile in Section 5.1, Table 26 illustrated that most adults defined savings as keeping money safe (43%) and Table 27 indicated that 54%of adults believed that money needs to be kept for at least a year to be defined as savings. This section looks at the type of productsused and ways that adults save.
Savings are the leading product type and one of the main drivers for financial inclusion for the entire PSIG. This is encouraging as savingsenable adults to create wealth, pay for household furniture and equipment and as can be used as collateral for accessing credit. Figure56 illustrates that 72% of adults save through banks – where Uttar Pradesh and Odisha are leading states in savings through banks.Overall, only 24% of the adults do not save.
Figure 56: Savings overall
PSIG
Uttar Pradesh
Odisha
Madhya Pradesh
Bihar
7245
824
n Bankedn Other formal (non-bank) n Informal n Family and friends n Not saving
%
781
610
18
78
68
60
1414
1118
433
29
32
635
According to Figure 57, the savings strand shows that for PSIG:
n 72% of adults save in banks;n 1% save in other formal non-bank institutions;n 1% have savings in informal facilities;n 24% do not save at all.

68
n Banked n Other formal (non-bank) n Informal
n Save at homen Not saving
PSIG
Uttar Pradesh
Odisha
Madhya Pradesh
Bihar
241172
Figure 57: Savings Strand by state
1
1878 2 2
18178 3
351 160 3
301168
Figures 58 and 59 show that there is not much variation between savings by area type and gender. This means that the adults in therural or urban areas use banking services to save money and similarly for males and females. The incidence of the adults who save inother formal non-bank financial institutions is low.
n Banked n Other formal (non-bank) n Informal
n Save at homen Not saving
Urban
Rural 72 2421
73 233
Figure 58: Savings Strand by area type
n Banked n Other formal (non-bank) n Informal
n Save at homen Not saving
Female
Male 73 2311
71 2511 2
Figure 59: Savings Strand by gender
2
Table 39 below gives an overview of the characteristics of adults using formal savings mechanisms indicating that saving activities arenot significantly differentiated as compared to insurance penetration. The proportion of those that did not save at all was higher inthe age category of 18 to 29 years.

69
Table 39: Distribution of the formal savings account holders
The main reasons for saving vary slightly across the PSIG states (see Figure 60 and Table 40): Adults mainly save for medical emergency,followed by family events such as weddings. The adult population in Odisha seem to have more savings targeted for medical emergencies(70%) and other unforeseen needs (50%). About 44% (84.5 million) adults save for developmental purposes (i.e. savings for education,farming, business, building and landed property). The savings for developmental purposes behaviour skews towards Uttar Pradeshstates, largely driven by saving for education and agriculture purposes.
Geographic distribution Total population%
Population withformal savings
account %
Rural 80 80
Urban 20 20
States
Bihar 24 19
Madhya Pradesh 18 17
Odisha 12 13
Uttar Pradesh 46 49
Gender
Male 52 55
Female 48 45
Age distribution
18 to 29 years 30 29
30 to 39 years 26 25
40 to 49 years 19 21
50 to 59 years 12 12
Older than 60 years 13 13
Income generating activities
Money from agriculture 55 56
Part time job 46 45
Own business (not agriculture related) 18 19
Salary 15 15
Remittances 10 10
Government grants 9 9
Levels of education
No formal school 31 27
Primary school 36 36
Secondary school 25 26
Post-secondary 8 10

70
Figure 60: Drivers for formal savings account for PSIG states
Medical emergency
Big family events
Other unforeseen needs
School/tuition fees
Retirement or old age
Buying livestock or farming equipment
Buy big items for household
Do not know
Buying building or landed property
College fees and expenses
Nothing specific
Business
59
41
33
21
17
14
10
8
6
6
5
4
%
Reasons for savings Bihar MadhyaPradesh Odisha Uttar
Pradesh PSIG
Medical emergency 64 40 70 60 59
Big family events 46 36 25 46 41
Other unforeseen needs 40 28 50 27 33
School/tuition fees 10 16 9 29 21
Retirement or old age 7 4 24 23 17
Buying livestock or farming equipment 4 12 6 19 14
Buy big items for household 12 12 7 8 10
College fees and expenses 2 2 3 9 6
Buying building or landed property 10 5 6 4 6
Business 3 6 2 4 4
Nothing specific 5 8 3 4 5
Do not know 1 18 - 10 8
Table 40: Drivers for formal savings account by states (%)

71
11. Borrowing and CreditIn this section the study sought to find out the proportion of adults (not households) that borrow money or use credit to finance capitalpurchases, daily consumption or other needs like agricultural inputs. In the entire PSIG, 6% of adults have credit facilities from bankinginstitution while 4% have credit from other formal non-bank financial institutions. For the state of MP, the credit uptake at householdlevel reported from the AIDIS 2013 was higher with more than 16% of households having farm loans from banks through Kisan creditcards. Surprisingly, many adults seek credit from informal sources (11%) and Bihar seems to be the state that has the highest suchincidence with 24%. This is important to flag as the requirements to access credit from informal sources are different to the requirementsneeded by formal institution.
Figure 61: Credit overalls
PSIG
Uttar Pradesh
Odisha
Madhya Pradesh
Bihar
64
117
24
n Bankedn Other formal (non-bank) n Informal n Family and friends n Not borrowing
%
76
16
10
14
76
75
89
93
1
22
54
47
245
66
n Banked n Other formal (non-bank) n Informal
n Family and friends onlyn Not borrowing
PSIG
Uttar Pradesh
Odisha
Madhya Pradesh
Bihar
76936
Figure 62: Credit Strand (%)
6
7514 8 2
7626 9
666 204 4
892 42
7
1
3

72
Comparing credit through gender, there is no difference between males and females, (see Figure 63). Intuitively, borrowing frominformal (10%) and friends and family (6%) is evident in rural areas where the presence of formal institutions is low (Figure 64). Thenumber of adults in rural areas (26%) that borrow is more than those in urban settings (16%).
n Banked n Other formal (non-bank) n Informal
n Family and friends onlyn Not borrowing
Rural
Urban 2 846 62
6 744 10 6
Figure 64: Credit Strand by area type
n Banked n Other formal (non-bank) n Informal
n Family and friends onlyn Not borrowing
Female
Male 6 7693
5 754 10 6
Figure 63: Credit Strand by gender
6
Table 41 gives an overview of the characteristics of adults using formal credit accounts illustrating that the profile of those with creditwas significantly skewed towards:
n Ruraln Odisha staten Malen Business owners (non-agriculture)n Secondary and Post-secondary

73
About 2 in 3 adults (15.4 million) who have formal credit accounts use their money for productive reasons. Developmental credit (i.e.borrowing for education, farming, business, building and landed property) is largely driven by borrowing for agriculture and starting orexpanding business (see Figure 65). Borrowing for developmental purposes behaviour skews towards Madhya Pradesh and Odishastates (Table 42). As noted earlier, Uttar Pradesh largely uses savings for productive activities.
Geographic distribution Total population%
Population withformal borrowing
accounts %
Rural 80 89
Urban 20 11
States
Bihar 24 26
Madhya Pradesh 18 8
Odisha 12 28
Uttar Pradesh 46 37
Gender
Male 52 58
Female 48 42
Age distribution
18 to 29 years 30 29
30 to 39 years 26 25
40 to 49 years 19 21
50 to 59 years 12 12
Older than 60 years 13 13
Main income generating activities
Money from agriculture 55 57
Part time job 46 39
Own business (not agriculture related) 18 24
Salary 15 13
Remittances 10 10
Government grants 9 10
Levels of education
No formal school 31 24
Primary school 36 38
Secondary school 25 30
Post-secondary 8 8
Table 41: Distribution of the borrowing/credit account holder

74
Figure 65: Drivers for those with formal credit account
Buying livestock or farming equipment
Medical emergency
Other unforeseen needs
Big family events
Business
Buying building or landed property
Buy big items for household
School/tuition fees
Pay off debts
College fees and expenses
Other
43
24
16
16
12
4
3
3
2
2
1
%
Reasons for borrowing Bihar MadhyaPradesh Odisha Uttar
Pradesh PSIG
Big family events 18 17 19 13 16
Medical emergency 32 20 12 29 24
Other unforeseen needs 15 – 19 14 16
School/tuition fees 1 – 1 7 3
College fees and expenses 2 1 1 2 2
Buy big items for household 2 3 2 6 3
Buying building or landed property 7 3 1 5 4
Pay off debts 1 – 6 1 2
Buying livestock or farming equipment 23 56 53 46 43
Business 15 14 9 11 12
Other 3 1 – – 1
Table 42: Drivers for those with formal credit account by states (%)

75
12. RemittancesAround 17.6 million (8%) of adults in the PSIG states either sent and/or received money from people living in a different place. Themost common mechanism used to transfer money is through formal channels – banking sector (65%) as shown in Figure 66.
Figure 66: Proportion of adults remitting
8%
92%n Yesn No
Figure 67 illustrates that Odisha (13%) and Uttar Pradesh (11%) have the highest numbers of adults sending or receiving remittances.Table 43 also shows that for the four states, the preferred channels of sending or receiving remittances is the bank.
n Bank n Cash in hand n Not remitting
PSIG
Uttar Pradesh
Odisha
Madhya Pradesh
Bihar
927 1
8910 1
963 1
991
927 1
Figure 67: Remittances Strand
When looking at the rural and urban remittances distribution, it is noted that rural seems to be doing better with 8% compared tourban (6%). This was expected, as the probability is that the adults in poor states and especially the rural areas are more likely to bethe recipients of remittances – i.e. the flow of money is towards rural areas. On the subject of remittances, FinScope findings weredifferent (lower in some states) as explained previously. The remittances figures reported in most FinScope surveys are of adults whosent or received money to or from another place in the past 6 or 12 months.

76
n Bank n Cash in hand n Not remitting
Rural
Urban
Rural
Urban
Rural
Urban
Rural
Urban
Rural
Urban
Figure 68: Remittances Strand by area type
Biha
rM
adhy
aPr
ades
hOd
isha
Utta
r Pr
ades
hPS
IG
927 1
945 1
8811 1
918 1
972 1
953 2
991
981 1
927 1
945 1
The main channel used by adults to send money within the PSIG states is through the bank (65%) followed by the use of friends orfamily at 29% as seen in Table 43. Bihar has the highest rate of bank usage with 78%, while Uttar Pradesh lags behind with 57%.
Channels of sending money Bihar MadhyaPradesh Odisha Uttar
Pradesh PSIG
Bank transfer 78 62 76 57 65
Friends or family 18 25 18 35 29
Post Office 1 0 6 2 2
Western Union 2 0 0 0 1
Informal agent 2 0 0 1 1
Mobile money 0 0 0 1 1
Other 0 13 0 5 5
Table 43: Channel of sending money (%)

77
Most remitters send money to family members (86%) or to friends (11%) as observed in Table 44. The use of the Post Office isminimal at 2% at the PSIG level and only 1% through mobile money.
The next section looks at the conclusions and recommendations of this study.
Recipients of money Bihar MadhyaPradesh Odisha Uttar
Pradesh PSIG
Family members 92 53 87 85 86
Friend 4 27 13 13 11
Business/supplier 2 5 0 1 2
Someone you borrowed from 2 11 0 0 1
Other 0 4 0 0 0
Table 44 : Recipient of money (%)

78
13. Conclusions and opportunities13.1. Conclusions13.1.1. Financial inclusionThe Poorest States Inclusive Growth project (PSIG) states enjoy high levels of financial inclusion. In terms of availability of financialservices infrastructure, the PSIG states seem to be well placed. The average time taken to access formal financial services such as abank, ATM and Post Office is 30 minutes. The level of connectivity is also high, reflected by high numbers of adults using mobile phones.Documentation which are critical components in adults having access to formal financial services are not an issue, given that 98% ofadults have some kind of identity document.
These enablers together with the ambitious project of the Pradhan Mantri Jan Dhan Yojana accounts, enabled 78.63 million people toopen savings accounts with banks. The PSIG states have an interesting twist to the FinScope norms, whereby the determinants of financialinclusion are used to create a practical way of understanding the realities of people and their surrounding areas- using demographicvariables such as age, gender, level of education, source of income and type of area they live in. In most cases, the FinScope experiencehas shown that those with higher levels of education, males, those with regular sources of income and the urbanised are more likelyto be included (formally included).
These findings are justified by the presence of financial institutions in rural areas and the good coverage of regional rural banks.
Financial Inclusion in these states (PSIG) is driven by banking products. However, the landscape of banking products indicates that bankingclients are mainly served in terms of their saving needs (88% of banked population use it for saving compared to 46% who reportedtransactional products).
The second driver of formal financial accounts is insurance penetration, at 20% of the adult population. However, two behavioural issuesare noted:
(i) under reporting of life insurance (only 46.2 million adults claimed to have life insurance in the PSIG states), despite the fact thatthe PMJDY scheme launched in August 2014 by the Prime Minister offers various benefits for the poor families including gainingof a life cover insurance worth ₹30 000. This could mean two things; the lack of awareness of this benefit due to its embeddednature, and the dormancy of the banking accounts.
(ii) The second area of focus would be on medical insurance, given the fact that illness within households or families requiremedical expenses. Although most households experience hardships or financial risk, few households claim to have heath/medicalinsurance. Other households used their savings for medical expenses.
Despite the Indian Finance Minister’s aspirations that each individual in every household should have a financial account and the factthat 92% of households in the PSIG states have bank accounts, there are 74 million adult individuals who are unbanked in these states.The unbanked population is typically without formal education, more likely to be female and more concentrated in the state of Bihar.
13.1.2. Financial product usageDespite its importance as an indicator for measuring financial inclusion, access and to some degree having a product is not the mostimportant aspect of financial inclusion. Although 72% (193 million) of the population is banked only 54.7 million adults reported usingaccounts to make or receive payments in the past 12 months and only 20.6 million adults receive their income through a bank account.About 25.5 million adults in the PSIG states have inactive bank account. Only 129 million (66% of the banked population) use theirbank accounts on a monthly basis to either initiate transactions such as withdrawal of cash at a branch or automated teller machine(ATM), payment by cheque, transfer of funds through Internet banking, phone banking or ATMs. The results show the use of bankingaccounts for the purposes of saving money. Payments in these states are mostly cash-based (i.e., food, clothes, bills, services and evenlarger household appliances are paid for in cash by more than 90% of adults). The preference for cash is a behaviour and literacy issuethat needs attention.

13.2. OpportunitiesBased on this report, opportunities to bring the financially excluded into the fold of financial inclusion and increase usage of financialproducts include the following:
a. Use of mobile technology for improved access of financial services: Leveraging the wide penetration of mobile handsets (82%), interventions aligning with digital finance may be designed withthe delivery of product and service information being done through mobile phone. Financial education programmes to utilizethe opportunity by broadcasting animated messages/ video in local language for larger outreach of information/ knowledgedissemination.
b. Affordable and Clean Energy:In the line of Sustainable Development Goal 7 “Affordable and Clean Energy” interventions promoting alternative/ non-conventional energy usage such as solar cooker, smoke-less stove, etc. should be promoted through various delivery models(MFI and SHPI). Innovative product design and promotion needs to be made to ensure the existing potential and providingopportunity to reduce expenses on energy and health. LPG/ PNG being the second biggest source of energy for cooking,the current usage status of LPG after the Ujjwala scheme by Government of India for providing LPG connections in ruralareas needs to be explored.
c. Access to agriculture financing:The nexus between livelihoods, financial inclusion and economic growth is of great importance to India. However, access toagriculture financing in the PSIG states as a coping mechanism is under-researched and may need further exploratory studies.The support of a bigger body of knowledge should back policymakers and Government to intervene in the agriculture sectorwith greater understanding of what areas need intervention. The KCC channel of financing to agriculture needs to berevamped with effective delivery of service to the farming community.
d. Innovative and affordable financial products and delivery channelsn Continued exploration of options that develop financial products/services that deal with the seasonality, irregularity of
income and low incomes (farming and part-time jobs). Innovative banking products/services to enable a less cash-based society. The product development needs to suit differing needs of the consumer such as ultra short-term loansto multi-stage housing loans required.
n Promoting innovative credit products suiting to the needs of the poorest households through MFIs and SHPIs.n Locally acceptable new insurance products and mass market group insurance products should be introduced. These
needs to be facilitated through local agencies for wide spread and delivery (MFI/NGO or a local bank).n Popularizing social security schemes through financial literacy programmes and also incentivizing MFIs and SHPIs to
promote Government sponsored micro insurance products including life, health and crop insurance. However,Government sponsored schemes alone will not suffice. Insurers to be persuaded to launch more products, especiallyin asset insurance. Aggressive plans to pursue (with sustained efforts) agricultural insurance is also needed.
n Banks should be sensitized to the need for launching processes for savings mobilization that mimic some of the MFIcredit processes using BC channel by mobilizing small recurring savings.
n IRDA could be associated to explore further opportunities in piloting alternative delivery channel of insurance productsin poorest states.
n Partnering with NRLM in PSIG states for promoting innovative financial products to be delivered through SHG channel.
e. Financial education programs:n Intensified financial literacy program: The objective is to encourage behavioral change that improve their livelihoodsn Financial education programmes should be targeted at the unbanked and the financially excluded since they are more
likely to be:
o Segmented to femaleso More on insurance – since 12% of the those who do not have insurance reported that they do not understand
how it works, where to get it or do not think they need ito Targeted at Bihar – Bihar lags behind on product uptake and have a higher excluded population
n Financial literacy initiatives should be continued in the PSIG with special emphasis and focus on:
o Effective uses of bank accounts for salary/ wages, remittances, insurance and pension, etc.o Change of client’s savings practice and behavior and focus on saving through formal institutions and avoiding chit
fund and other informal channels79

o Using bank or other formal sources for inward and outward remittances and avoid cash remittances. The PSIG willwork with SFBs, PBs and BCs for popularizing formal remittance channels
f. Using bank accounts to receive salary/wagesn An initiative to drive payment of salaries/income through bank accounts would simultaneously address the dormancy
rates of bank accounts and drive more adults to interact with the banking system effectively. This may also be extendedto those receiving grants/assistance from the Government, allowing them to gain more from the low cost and safetyof using formal services
n With a high penetration of bank products/ accounts, the bundling of other services such as insurance can be beneficialand ultimately reduce the cost to the consumer
n A study may be conducted to explore the BC outreach status, awareness of clients to access BC outlets for financialtransaction and the feasibility of BC model with the upcoming market situation after launch of Payments banks and SFBsto recommend the repositioning of BC model
n Promoting more use of Rupay card for transactions will reduce the cash payments. PSIG to intensify support to MFIs,RRBs, etc. for promoting usage of Rupay card and other products to their clients. The flexibility to access cash from anearby place and also at odd hours will determine the success of the move-route payments through bank accounts
n Supporting innovative and affordable channel for delivery of financial services especially credit. One of the ways is bysupporting MFIs, SFBs and PBs to pilot last mile delivery of financial services
n Focused activities for the SHG channel of lending and providing other non credit financial servicesn Through BC or SHPI channel, Government sponsored insurance products can be pilotedn Piloting BC channel of promoting delivery of financial services in remote areasn A study of how to improve efficacy of cooperatives needs to be done based on which further planning will be possible
80

81
14.1 Computation of weights at various levelsWeights are assigned to make weighted sample records represent target population as closely as possible. A weight (wi) indicatesnumber of population elements "represented" by a single sample element. Therefore, the sum of the weights, ∑wi = N should be equalto the population total of elements.
Weights are usually developed in different stages to compensate for :
n Unequal inclusion probabilitiesn Non- response (which in this study is not a factor)n Non-coverage and skewness resulting from sample design and fieldwork.
In order to obtain a representative sample of the population, a multistage stratified sample is designed with state and geographic area(Urban/Rural) as the explicit stratification variable. The sample was designed in three stages. In the first stage primary sampling units(PSU) – i.e. the Clusters – were selected with probability proportional to size (PPS) of the 2011 population number of households asa measure of size. The weight of a PSU (i.e. Cluster) is given by,
Where,
nPSU is the realised number of PSUs in the state,
PSUHH11 the 2011 Census number of households in the selected PSU, and
PopHH11 is the 2011 Census number of households in the selected state.
In the second stage households were selected in each PSU in the sample. Officially, census 2011 household counts were available perPSU. The household weight per PSU is given by,
Where,
nHH is the number of selected households per PSU and
PSUHH is the number of household in the selected PSU.
The respondent weight is given by,
Where,
n18+ is the number (or average number) of persons aged 18 years and older in the selected household.
PSUHH11
POPHH11
−1
WPSU = nEA
nHH
PSUHH
−1
WHH = WPSU
WPP = WH *n18+,
14. Annexures

82
Descriptor FinScope AIDIS FINDEX
Objective ofsurvey
Measure level of financial inclusionto formal and informal productsand services, describe thelandscape of access and driver andbarriers to usage of financialproducts and services.
Study the demand for credit fromrural families and the supply ofcredit from credit agencies bothinstitutional and non-institutional.
To fill a major gap in the financialinclusion data landscape through adatabase documenting financialusage across a myriad of variables.
Scope Adults, Households Household Adults
Geography PSIG states only All India All India
Sampling Three stage sampling Two stage sampling –
Credit variables
Currently borrowing from allsources categorized by formality,credit strand and borrowingproducts/institution
Incidence of Indebtedness (IOI)and amount of debt (AOD),variation of IOI and debt-asset ratio
Borrowed in the past year from aformal financial institution and alsoform informal sources
Householdoccupationalcategories
Using source of income –agriculture, part-time job, selfemployed, salary, remittances andgovernment grants
Cultivator, non-cultivator, self-employed, regular wage/salaryearning, casual labour and others
NA
Asset ownership
Asset ownership for household(not the value of the assets)
Average value of assets and shareof different components of assetsin the total value of assets
NA
14.2 Comparison of key financial inclusion indicators

83
Dr Kingstone [email protected]
Tel: +27 11 315 9197Fax +27 86 518 3579
www.finmark.org.zawww.finscope.co.za
ContactFor further information about FinScope PSIG India 2015, please contact:


Tel +27 11 315 9197 Fax +27 86 518 3579www.finmark.org.za | www.finscope.co.za