Embed Size (px)
Citation preview
FINLAND RESULTS AND PAN-EUROPEAN COMPARISONSAlison Fennah, VP Research and Marketing, IAB Europe
Helsinki, 20th September 2012
2
Presentation Agenda
1. Introduction→ Background→ Coverage and Methodology
2. Main Findings→ The Media Evolution→ Internet everywhere by any means→ Media multi-tasking means more active consumers→ Brand relationships grow via digital touchpoints→ The Internet is an entertainer and enabler→ Instant access to information at consumers fingertips→ Internet enriches consumer communication→ Online plays a key function in the purchase funnel
3
Background
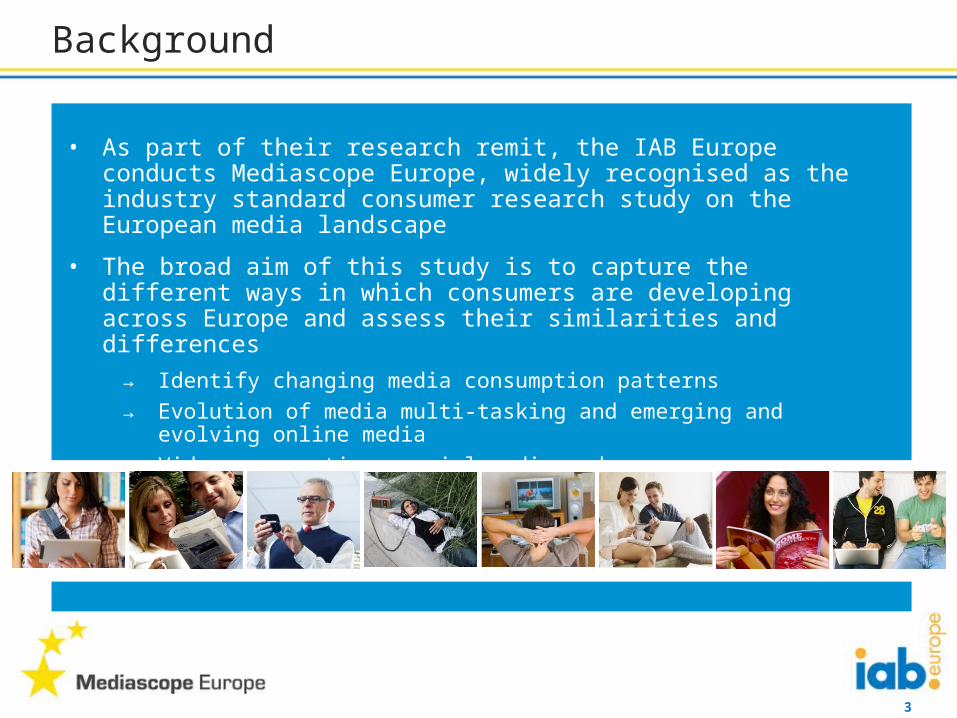
• As part of their research remit, the IAB Europe conducts Mediascope Europe, widely recognised as the industry standard consumer research study on the European media landscape
• The broad aim of this study is to capture the different ways in which consumers are developing across Europe and assess their similarities and differences
→ Identify changing media consumption patterns→ Evolution of media multi-tasking and emerging and evolving online media→ Video consumption, social media and e-commerce
4
Coverage and Methodology
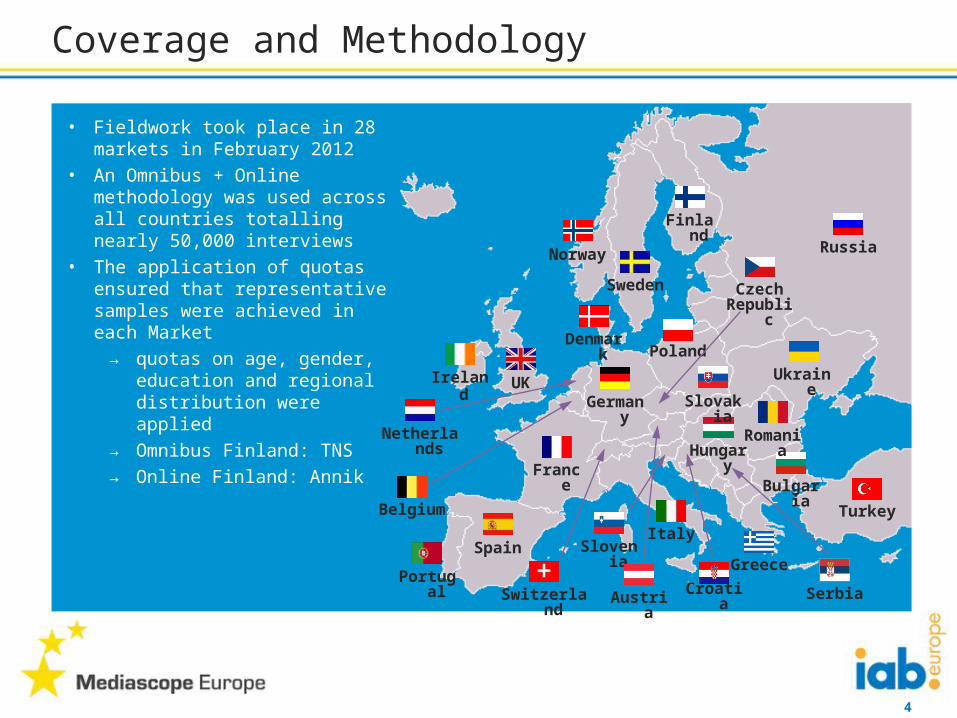
• Fieldwork took place in 28 markets in February 2012
• An Omnibus + Online methodology was used across all countries totalling nearly 50,000 interviews
• The application of quotas ensured that representative samples were achieved in each Market
→ quotas on age, gender, education and regional distribution were applied
→ Omnibus Finland: TNS→ Online Finland: Annik
Hungary
Italy
Russia
Spain
Portugal
France
Turkey
Poland
Belgium
UK
Switzerland
Denmark
Sweden
Norway
Germany
Netherlands
Finland
Ukraine
Bulgaria
Romania
Ireland
GreeceSlovenia
Croatia
Slovakia
SerbiaAustria
CzechRepublic
5
Mediascope Europe 2012 is supported by over 100 leading media companies, local IABs and
other trade associations
Mediascope Europe - Sponsors
6
Mediascope Europe – Local Sponsors – Finland
7
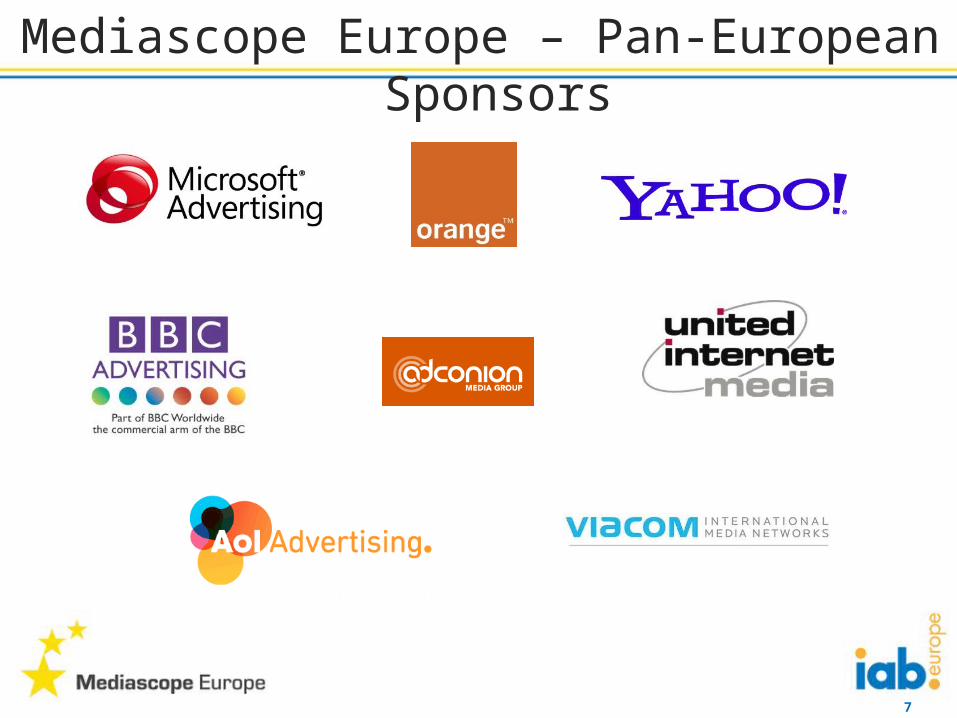
Mediascope Europe – Pan-European Sponsors
8
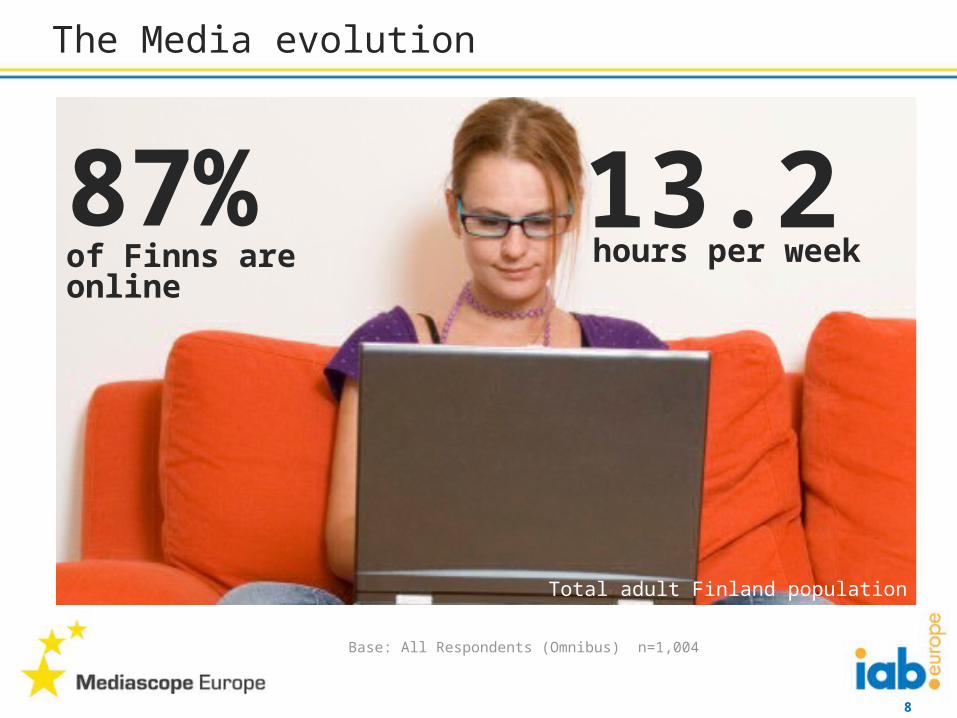
The Media evolution
87%of Finns are online
Total adult Finland population of 4.4 million
Base: All Respondents (Omnibus) n=1,004
13.2hours per week
9
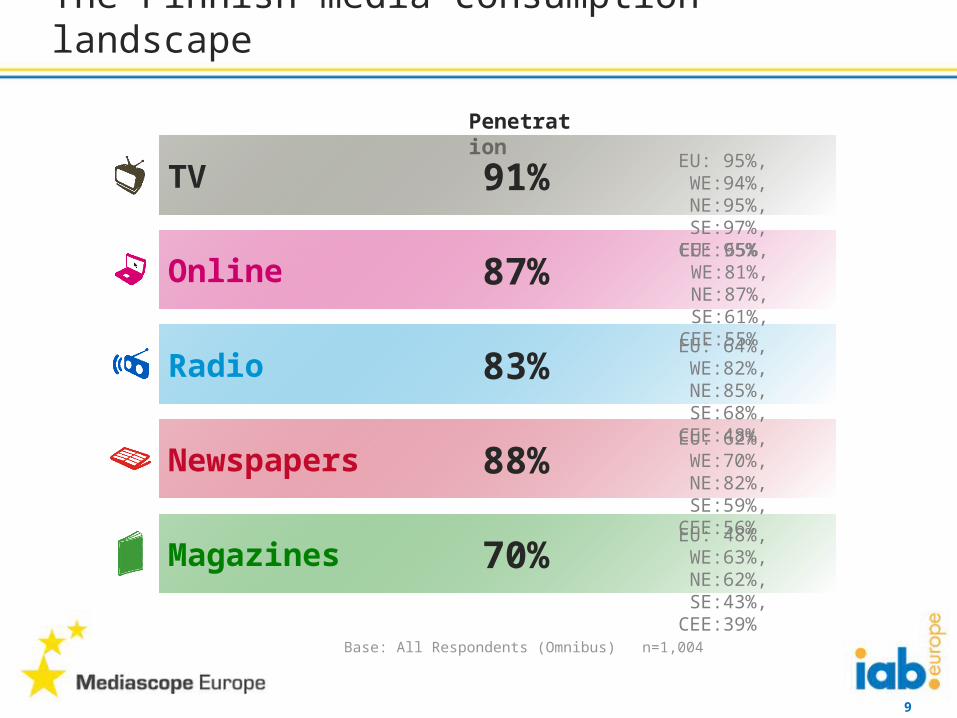
The Finnish media consumption landscape
Penetration
Online 87%
Radio 83%
Newspapers 88%
Magazines 70%
TV 91%EU: 95%,
WE:94%, NE:95%, SE:97%, CEE:95%
EU: 65%, WE:81%, NE:87%, SE:61%, CEE:55%
EU: 64%, WE:82%, NE:85%, SE:68%, CEE:48%
EU: 62%, WE:70%, NE:82%, SE:59%, CEE:56%
EU: 48%, WE:63%, NE:62%, SE:43%, CEE:39%
Base: All Respondents (Omnibus) n=1,004
10
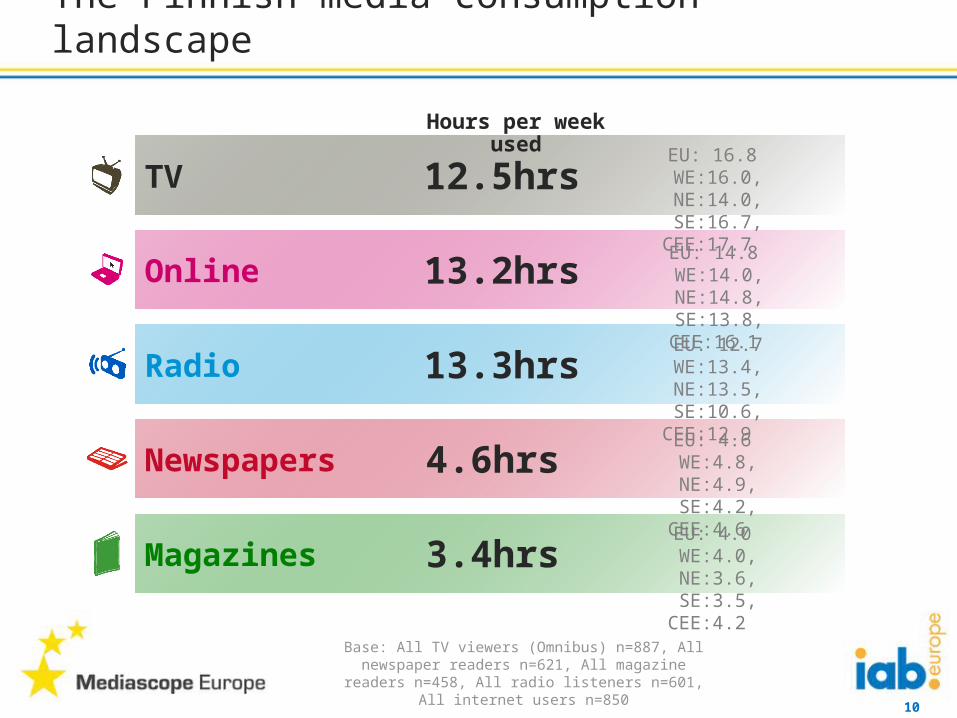
Online 13.2hrs
Radio 13.3hrs
Newspapers 4.6hrs
Magazines 3.4hrs
TV 12.5hrs
The Finnish media consumption landscape
Hours per week used
EU: 16.8 WE:16.0, NE:14.0, SE:16.7, CEE:17.7
EU: 14.8 WE:14.0, NE:14.8, SE:13.8, CEE:16.1
EU: 12.7WE:13.4, NE:13.5, SE:10.6, CEE:12.9
EU: 4.6 WE:4.8, NE:4.9, SE:4.2, CEE:4.6
EU: 4.0 WE:4.0, NE:3.6, SE:3.5, CEE:4.2
Base: All TV viewers (Omnibus) n=887, All newspaper readers n=621, All magazine readers n=458, All radio
listeners n=601, All internet users n=850
11
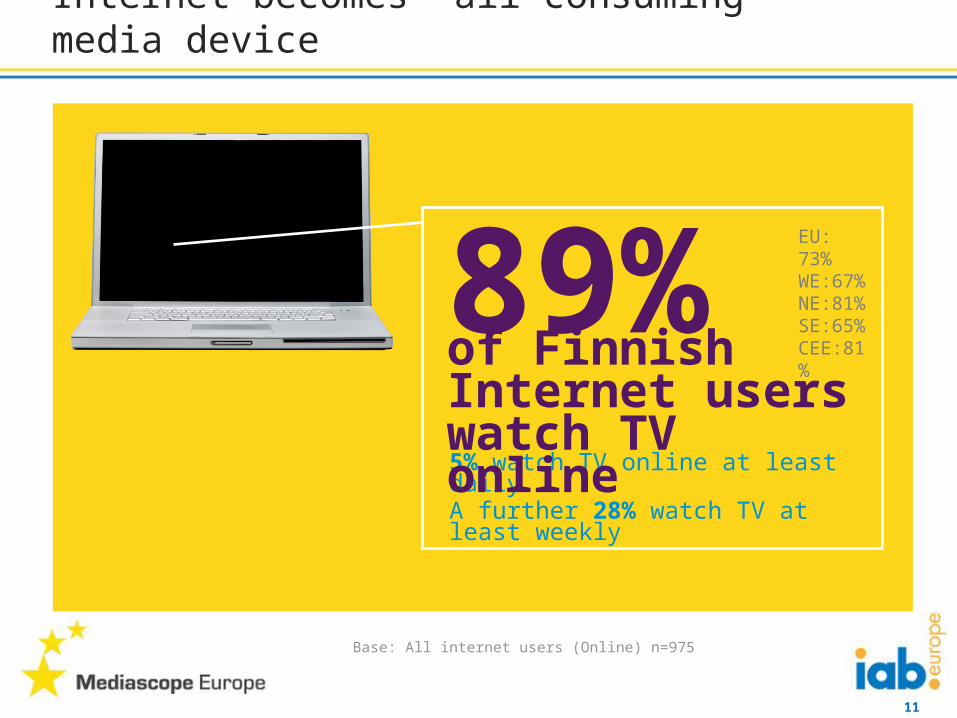
Internet becomes ‘all consuming’ media device
5% watch TV online at least dailyA further 28% watch TV at least weekly
of Finnish Internet users watch TV online
89%EU: 73% WE:67% NE:81% SE:65% CEE:81%
Base: All internet users (Online) n=975
12
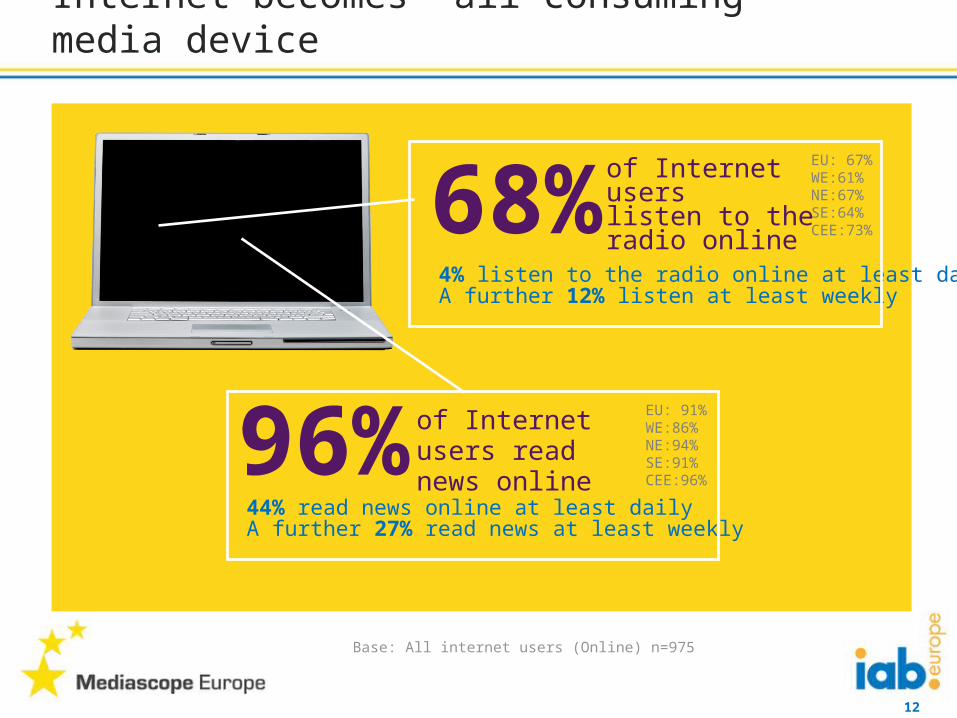
Internet becomes ‘all consuming’ media device
4% listen to the radio online at least dailyA further 12% listen at least weekly
of Internet users listen to the radio online68%
44% read news online at least dailyA further 27% read news at least weekly
of Internet users read news online96%
EU: 67% WE:61% NE:67% SE:64% CEE:73%
EU: 91% WE:86% NE:94% SE:91% CEE:96%
Base: All internet users (Online) n=975
13
Internet everywhere by any means
0.3mFinns use a Tablet to go online
Base: All respondents (Omnibus) n=1,004
14
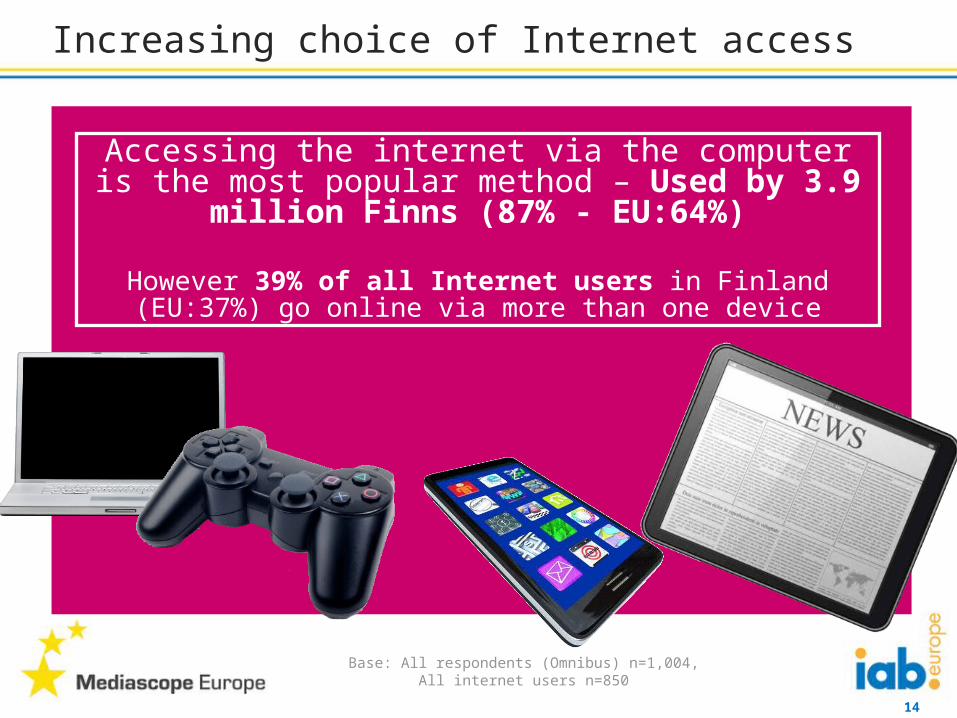
Increasing choice of Internet access
Accessing the internet via the computer is the most popular method – Used by 3.9 million Finns (87% - EU:64%)
However 39% of all Internet users in Finland (EU:37%) go online via more than one device
Base: All respondents (Omnibus) n=1,004, All internet users n=850
15
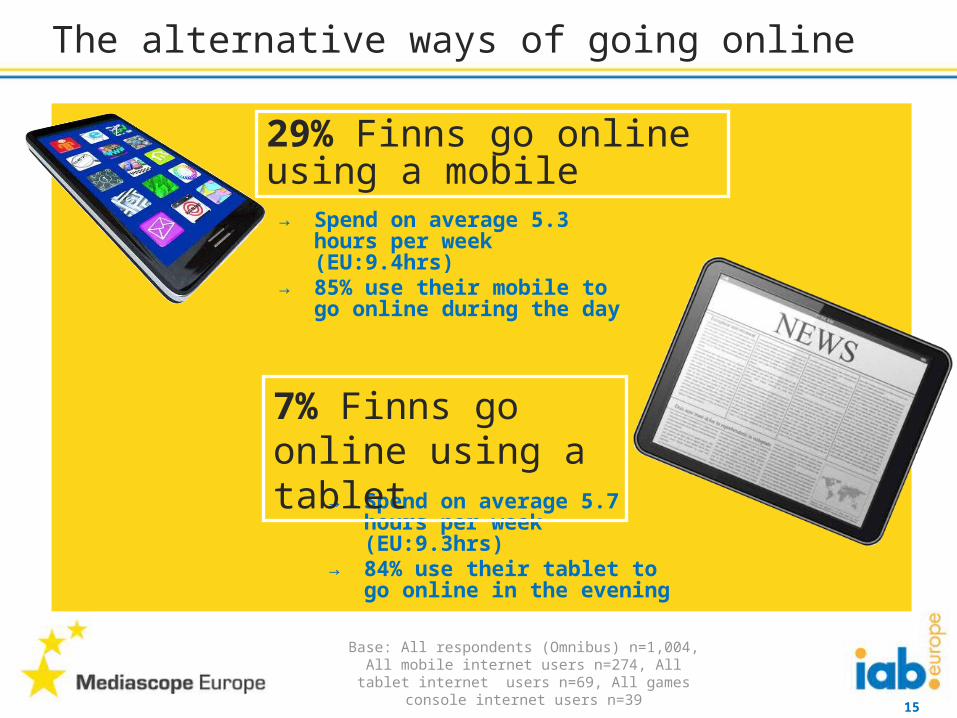
The alternative ways of going online
→ Spend on average 5.7 hours per week (EU:9.3hrs)
→ 84% use their tablet to go online in the evening
→ Spend on average 5.3 hours per week (EU:9.4hrs)
→ 85% use their mobile to go online during the day
29% Finns go online using a mobile
7% Finns go online using a tablet
Base: All respondents (Omnibus) n=1,004, All mobile internet users n=274, All tablet internet users n=69, All
games console internet users n=39
16
The alternative ways of going online
4% Finns go online using a games console
Base: All respondents (Omnibus) n=1,004, All mobile internet users n=274, All tablet internet users n=69, All
games console internet users n=39
17
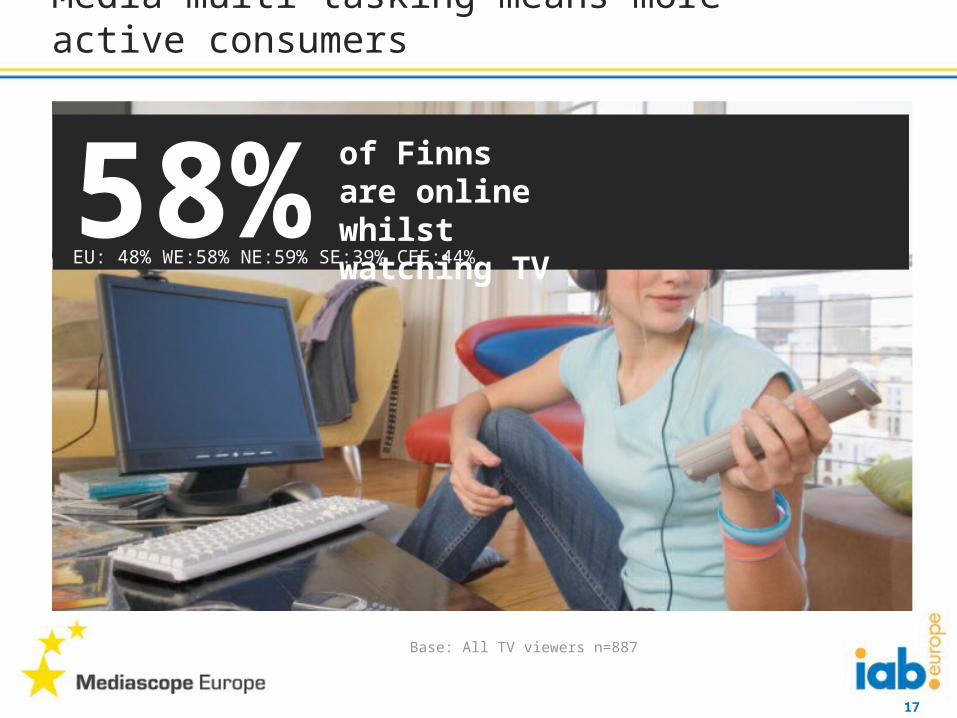
Media multi-tasking means more active consumers
58% of Finns are online whilst watching TV
EU: 48% WE:58% NE:59% SE:39% CEE:44%
Base: All TV viewers n=887

18
19
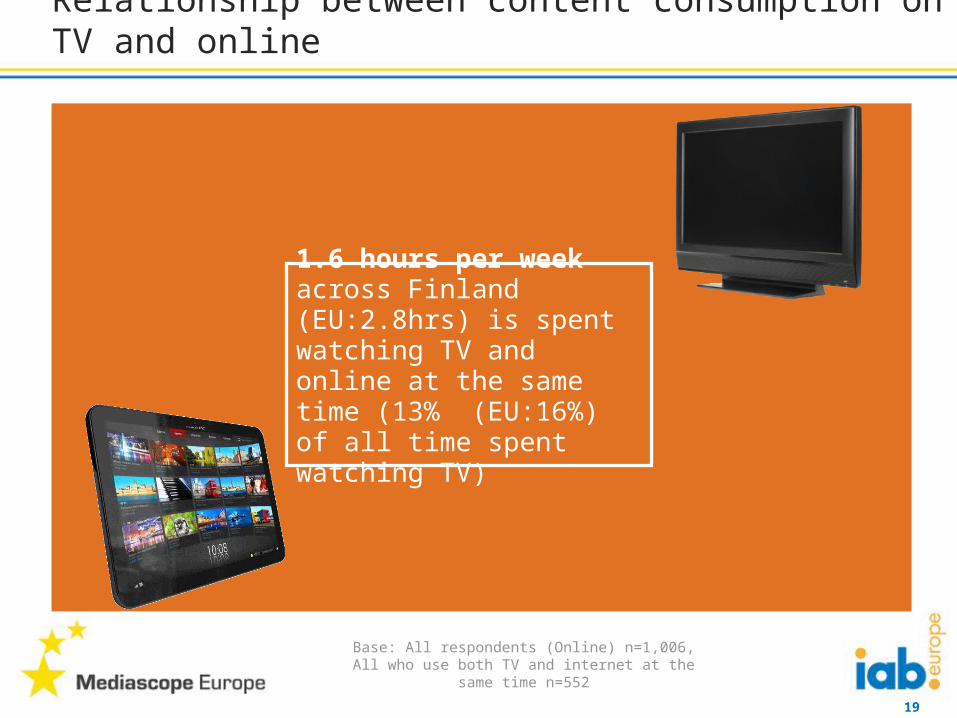
Relationship between content consumption on TV and online
1.6 hours per week across Finland (EU:2.8hrs) is spent watching TV and online at the same time (13% (EU:16%) of all time spent watching TV)
Base: All respondents (Online) n=1,006, All who use both TV and internet at the same time n=552
20
Entertainment 78%
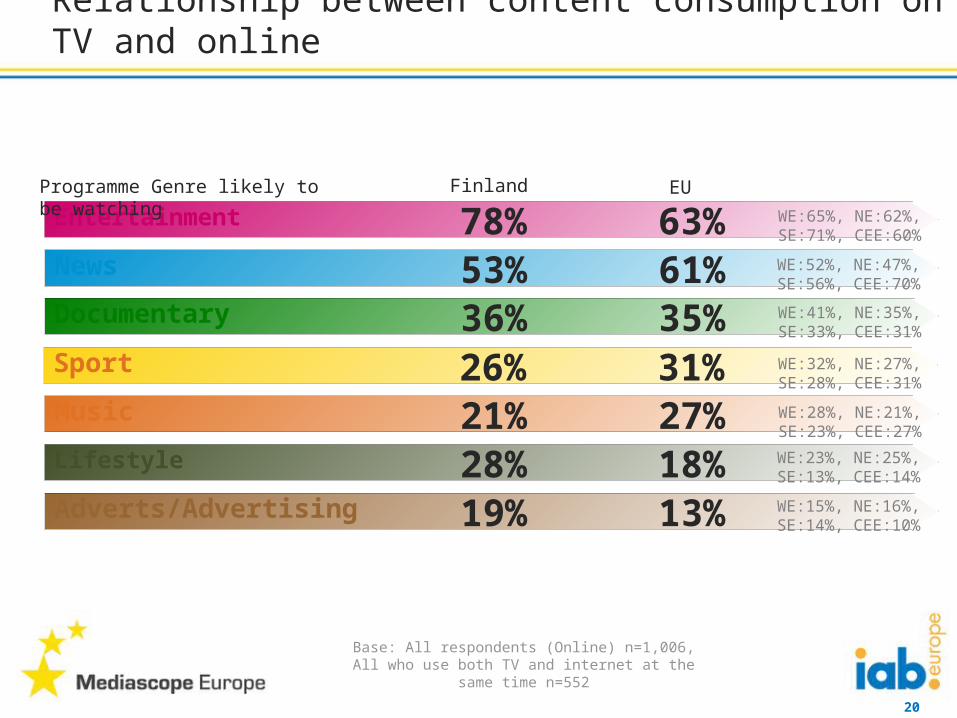
Relationship between content consumption on TV and online
Programme Genre likely to be watching
News 53%Documentary 36%Sport 26%Music 21%Lifestyle 28%Adverts/Advertising 19%
63%61%35%31%27%18%13%
Finland EUWE:65%, NE:62%, SE:71%, CEE:60%
WE:52%, NE:47%, SE:56%, CEE:70%
WE:41%, NE:35%, SE:33%, CEE:31%
WE:32%, NE:27%, SE:28%, CEE:31%
WE:28%, NE:21%, SE:23%, CEE:27%
WE:23%, NE:25%, SE:13%, CEE:14%
WE:15%, NE:16%, SE:14%, CEE:10%
Base: All respondents (Online) n=1,006, All who use both TV and internet at the same time n=552
21
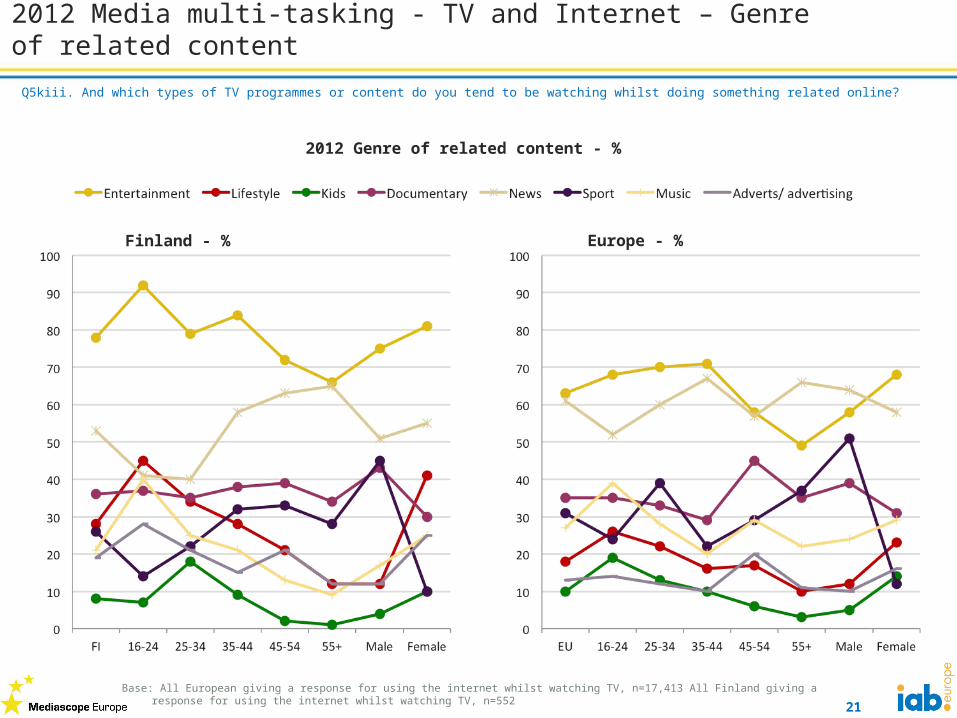
2012 Media multi-tasking - TV and Internet – Genre of related content
Q5kiii. And which types of TV programmes or content do you tend to be watching whilst doing something related online?
2012 Genre of related content - %
Finland - % Europe - %
Base: All European giving a response for using the internet whilst watching TV, n=17,413 All Finland giving a response for using the internet whilst watching TV, n=552
22
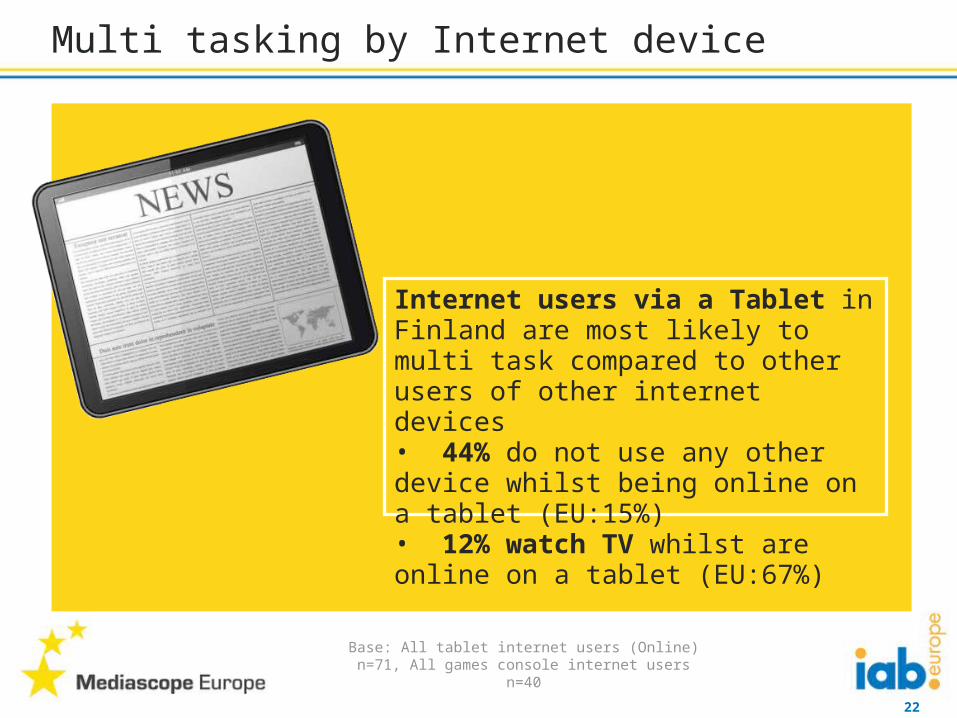
Multi tasking by Internet device
Internet users via a Tablet in Finland are most likely to multi task compared to other users of other internet devices• 44% do not use any other device whilst being online on a tablet (EU:15%)• 12% watch TV whilst are online on a tablet (EU:67%)
Base: All tablet internet users (Online) n=71, All games console internet users n=40
23
Brand relationships grow via digital touchpoints
Base: All internet users (Online) n=975
24
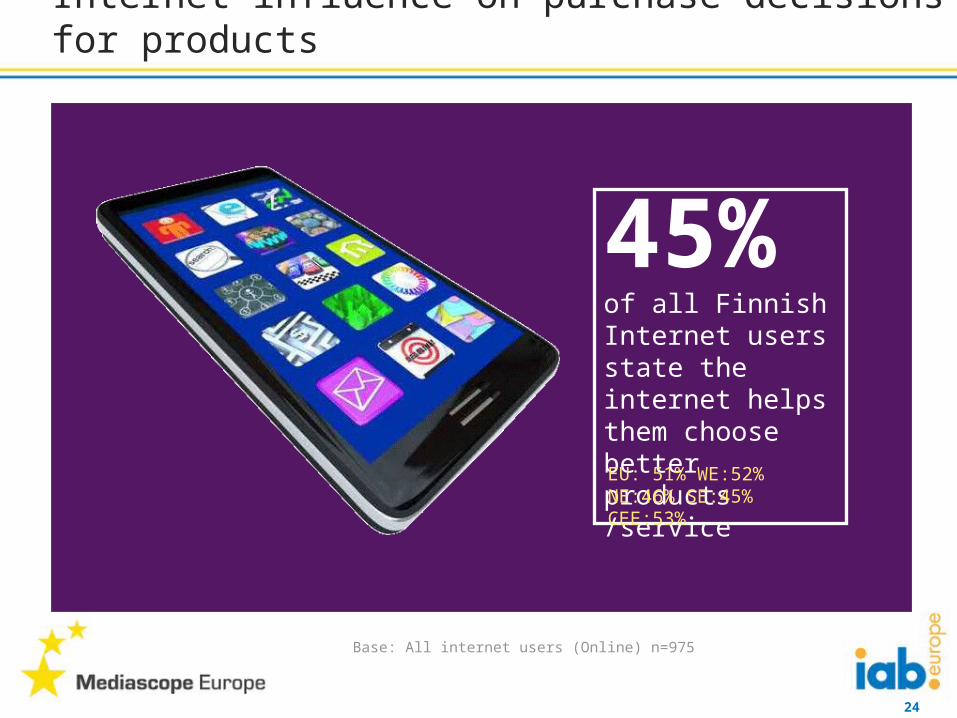
Internet influence on purchase decisions for products
45%of all Finnish Internet users state the internet helps them choose better products /serviceEU: 51% WE:52% NE:46% SE:45% CEE:53%
Base: All internet users (Online) n=975
25
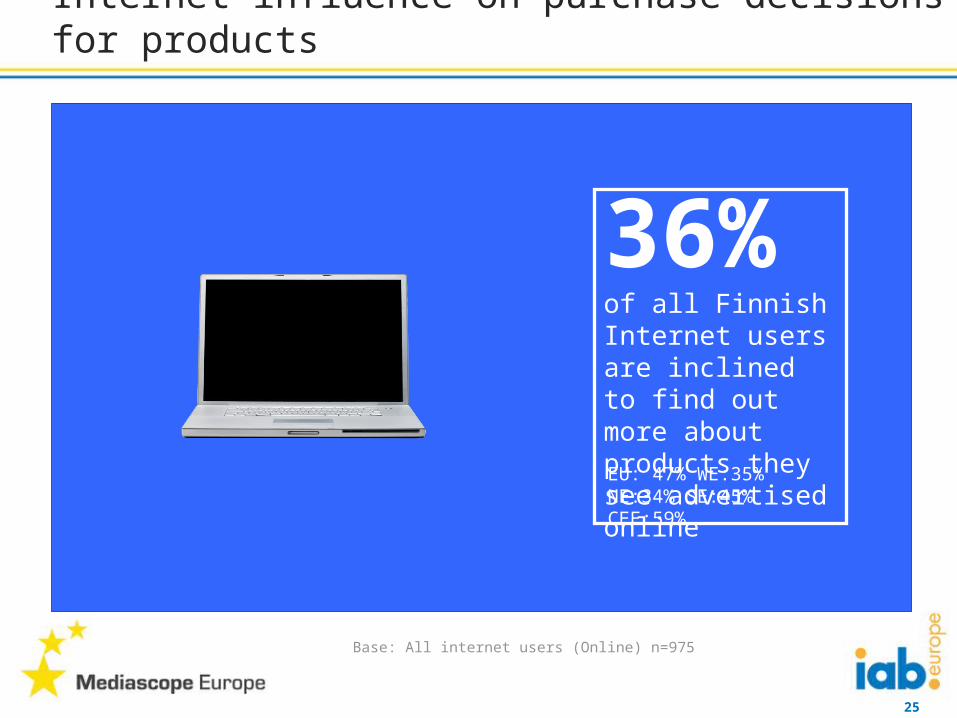
Internet influence on purchase decisions for products
36%of all Finnish Internet users are inclined to find out more about products they see advertised onlineEU: 47% WE:35% NE:34% SE:45% CEE:59%
Base: All internet users (Online) n=975
26
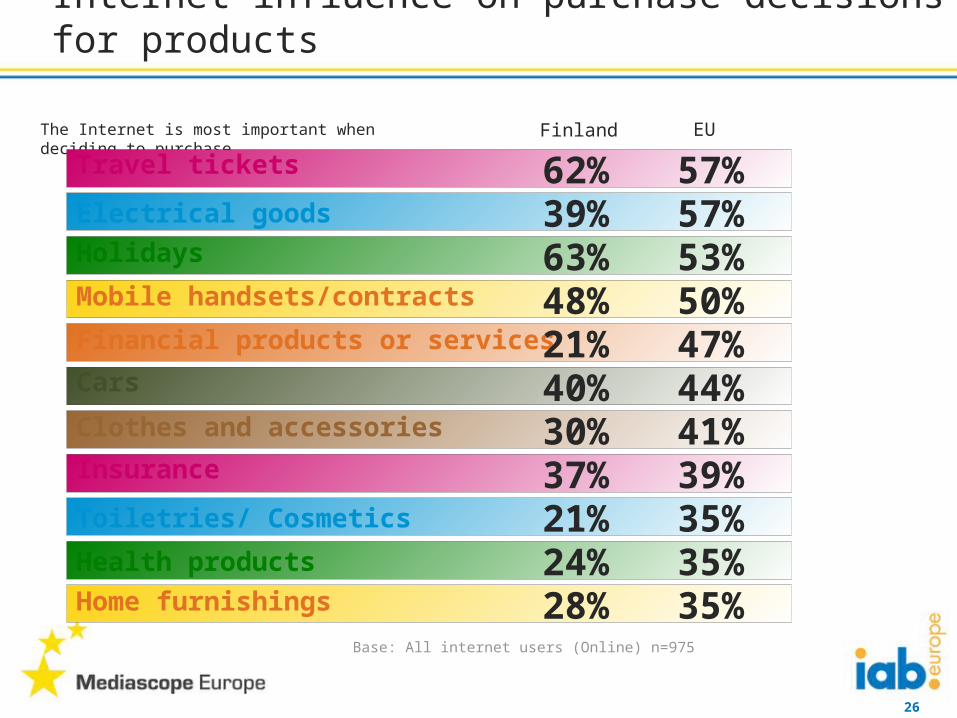
Internet influence on purchase decisions for products
The Internet is most important when deciding to purchase
Travel tickets 62%Electrical goods 39%Holidays 63%Mobile handsets/contracts 48%Financial products or services 21%Cars 40%Clothes and accessories 30%Insurance 37%Toiletries/ Cosmetics 21%Health products 24%Home furnishings 28%
57%57%53%50%47%44%41%39%35%35%35%
Finland EU
Base: All internet users (Online) n=975
27
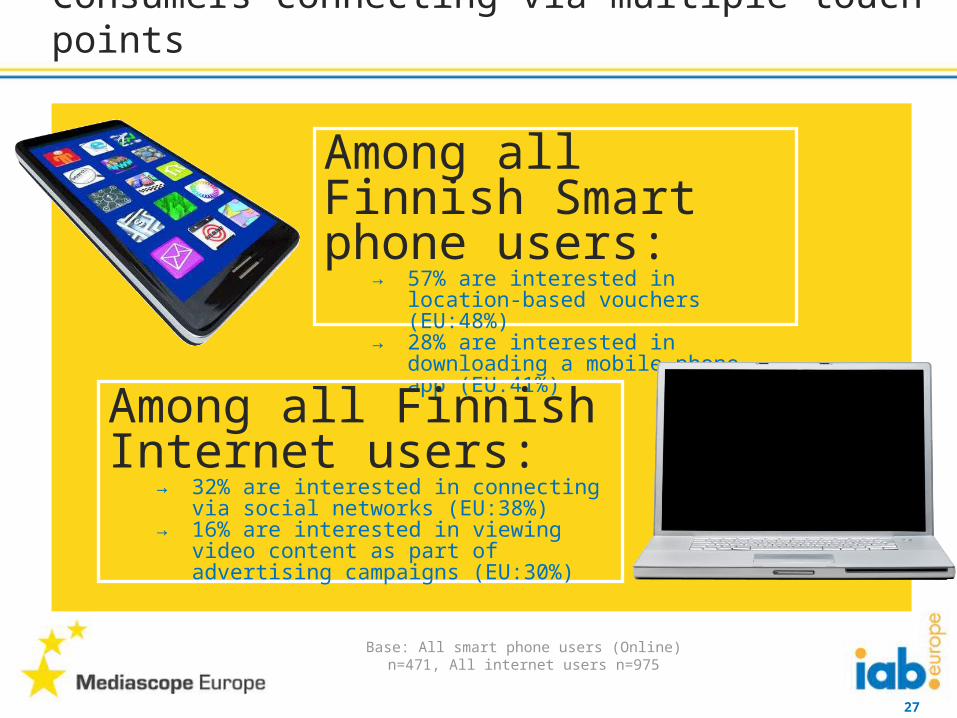
Consumers connecting via multiple touch-points
Among all Finnish Smart phone users:
→ 57% are interested in location-based vouchers (EU:48%)
→ 28% are interested in downloading a mobile phone app (EU:41%)
Among all Finnish Internet users:
→ 32% are interested in connecting via social networks (EU:38%)
→ 16% are interested in viewing video content as part of advertising campaigns (EU:30%)
Base: All smart phone users (Online) n=471, All internet users n=975
28
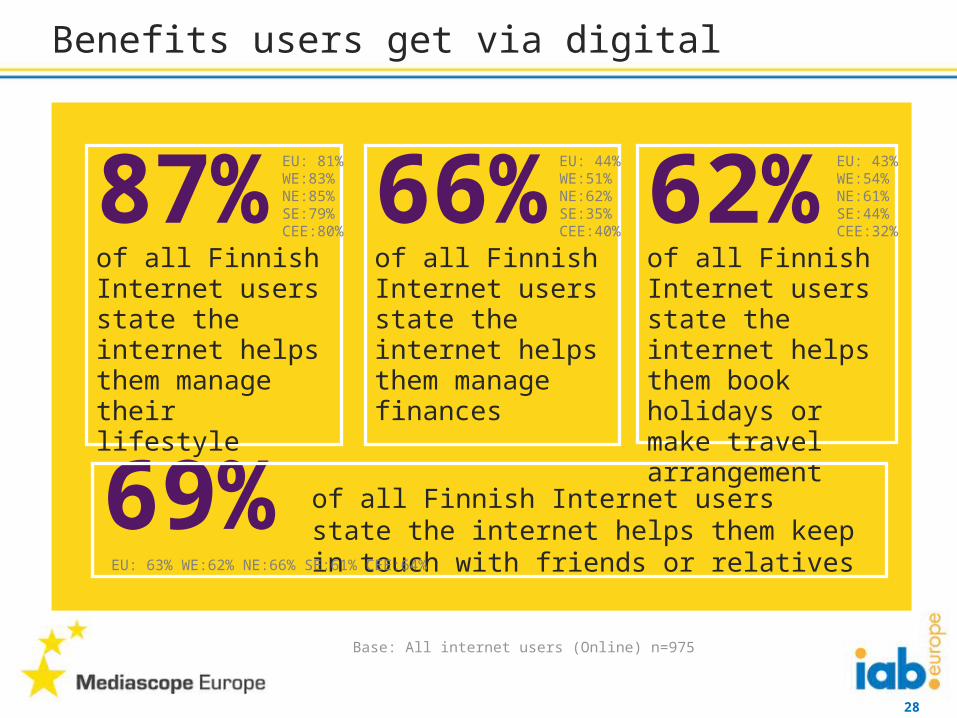
Benefits users get via digital
87%of all Finnish Internet users state the internet helps them manage their lifestyle
62%of all Finnish Internet users state the internet helps them book holidays or make travel arrangement
66%of all Finnish Internet users state the internet helps them manage finances
69% of all Finnish Internet users state the internet helps them keep in touch with friends or relatives
EU: 81% WE:83% NE:85% SE:79% CEE:80%
EU: 44% WE:51% NE:62% SE:35% CEE:40%
EU: 43% WE:54% NE:61% SE:44% CEE:32%
EU: 63% WE:62% NE:66% SE:61% CEE:64%
Base: All internet users (Online) n=975
29
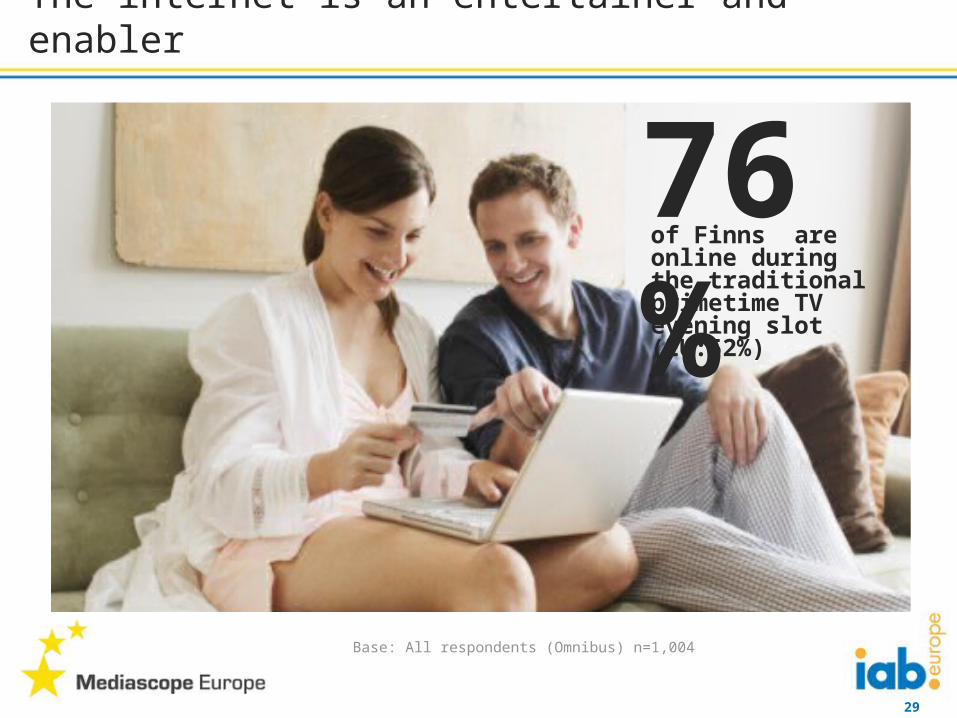
The internet is an entertainer and enabler
76%of Finns are online during the traditional primetime TV evening slot (EU:52%)
Base: All respondents (Omnibus) n=1,004
30
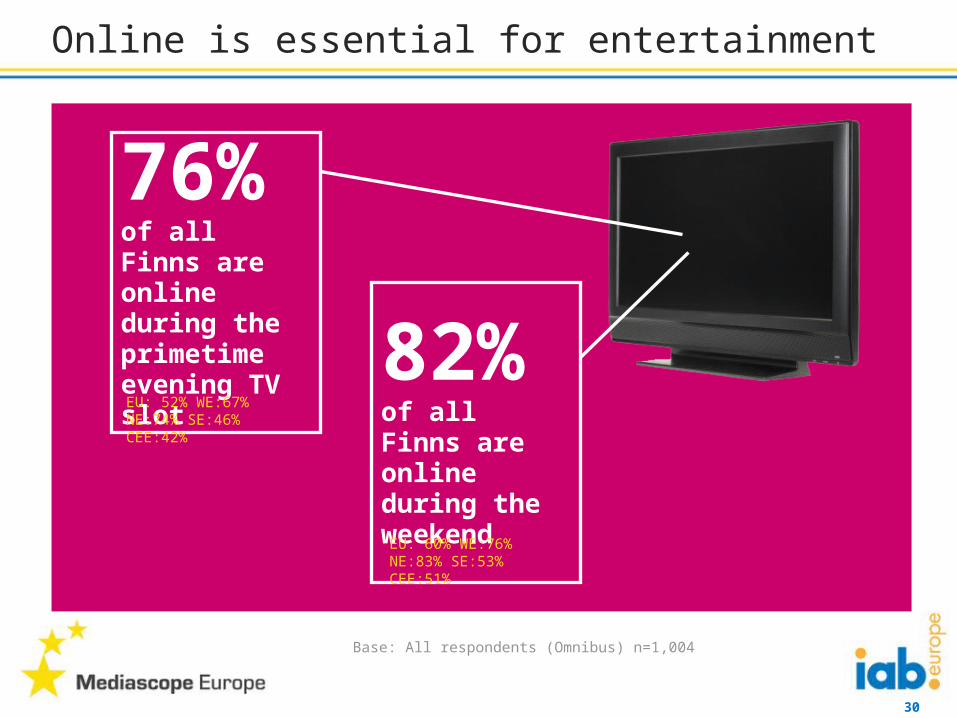
Online is essential for entertainment
82% of all Finns are online during the weekend
76% of all Finns are online during the primetime evening TV slotEU: 52% WE:67% NE:74% SE:46% CEE:42%
EU: 60% WE:76% NE:83% SE:53% CEE:51%
Base: All respondents (Omnibus) n=1,004
31
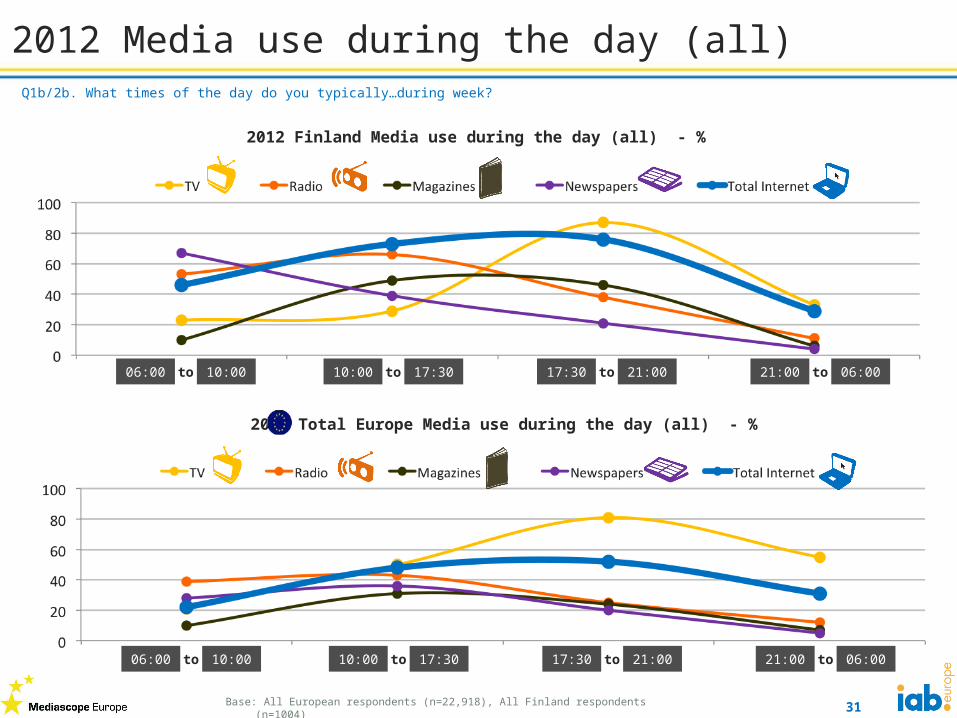
2012 Media use during the day (all)Q1b/2b. What times of the day do you typically…during week?
2012 Total Europe Media use during the day (all) - %
06:00 10:00to 10:00 17:30to 17:30 21:00to 21:00 06:00to
2012 Finland Media use during the day (all) - %
06:00 10:00to 10:00 17:30to 17:30 21:00to 21:00 06:00to
Base: All European respondents (n=22,918), All Finland respondents (n=1004)
32
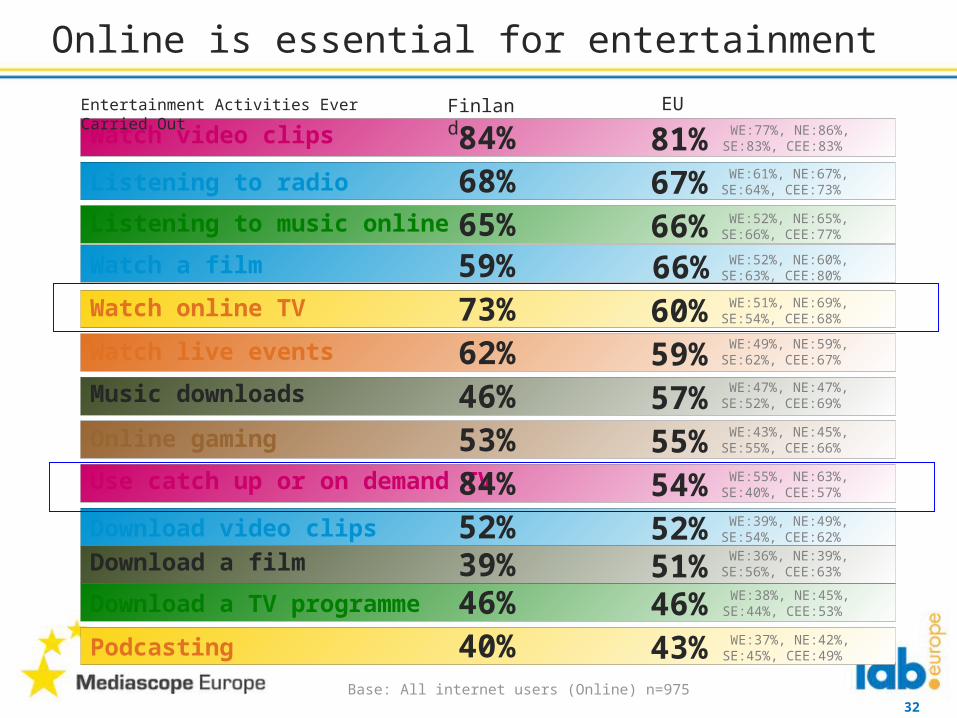
Online is essential for entertainment
Watch video clips 81%Listening to radio 67%Listening to music online 66%
Watch online TV 60%Watch live events 59%Music downloads 57%Online gaming 55%Use catch up or on demand TV 54%Download video clips 52%
Download a TV programme 46%Podcasting 43%
Entertainment Activities Ever Carried Out
84%68%65%
73%62%46%53%84%52%
46%40%
Finland EUWE:77%, NE:86%, SE:83%,
CEE:83%
WE:61%, NE:67%, SE:64%, CEE:73%
WE:52%, NE:65%, SE:66%, CEE:77%
WE:51%, NE:69%, SE:54%, CEE:68%
WE:49%, NE:59%, SE:62%, CEE:67%
WE:47%, NE:47%, SE:52%, CEE:69%
WE:43%, NE:45%, SE:55%, CEE:66%
WE:55%, NE:63%, SE:40%, CEE:57%
WE:39%, NE:49%, SE:54%, CEE:62%
WE:38%, NE:45%, SE:44%, CEE:53%
WE:37%, NE:42%, SE:45%, CEE:49%
Watch a film 59% 66% WE:52%, NE:60%, SE:63%, CEE:80%
Download a film 51%39% WE:36%, NE:39%, SE:56%, CEE:63%
Base: All internet users (Online) n=975
33
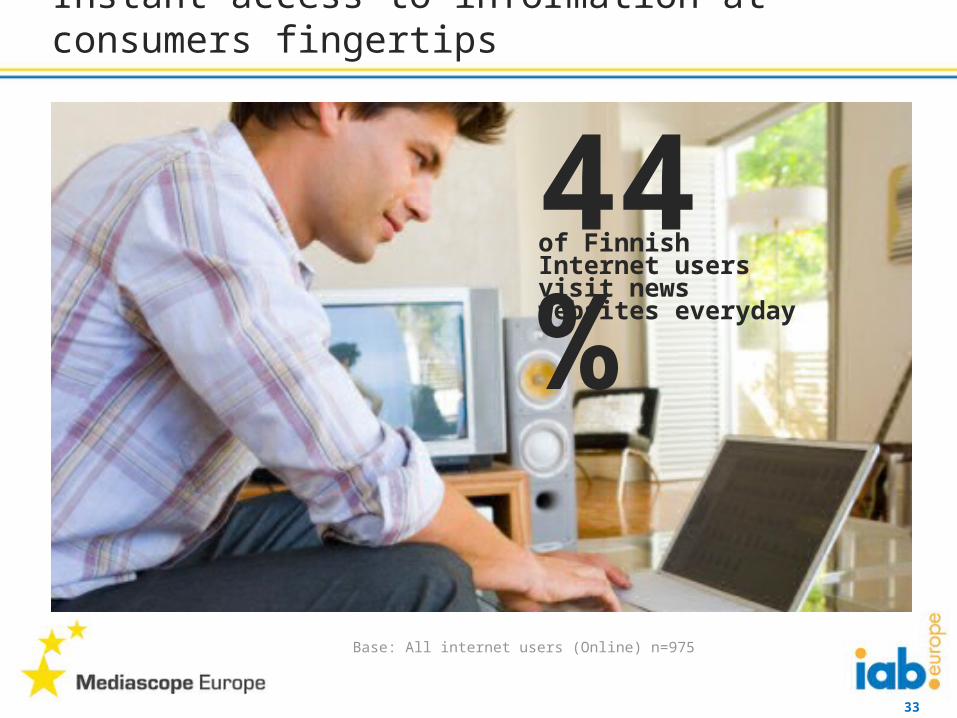
Instant access to information at consumers fingertips
44%of Finnish Internet users visit news websites everyday
Base: All internet users (Online) n=975
34
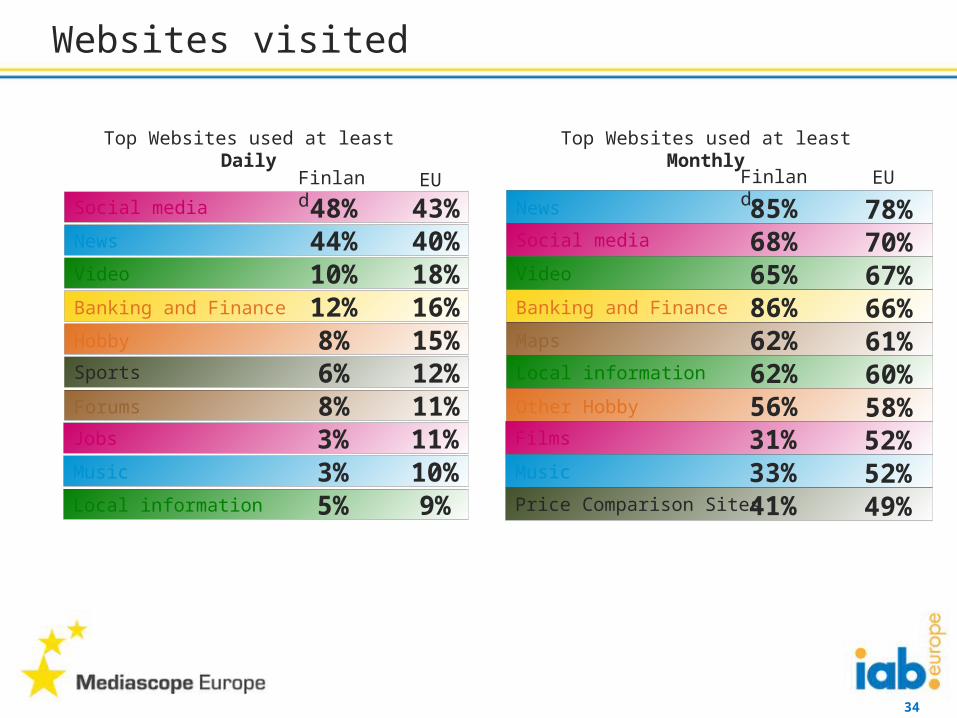
Websites visited
Top Websites used at least Daily Top Websites used at least Monthly
Maps 62%Hobby 8%Local information 62%Sports 6%
News 85%Social media 48%
Banking and Finance 12% Banking and Finance 86%
Forums 8% Other Hobby 56%
Local information 5% Price Comparison Sites 41%
News 44% Social media 68%Video 10% Video 65%
Jobs 3% Films 31%Music 3% Music 33%
15%12%
43%
16%
11%
9%
40%18%
11%10%
61%60%
78%
66%
58%
49%
70%67%
52%52%
Finland EU Finland EU
35
Internet enriches consumer communication
98%of Finnish Internet users communicate through email
Base: All internet users (Online) n=975
36
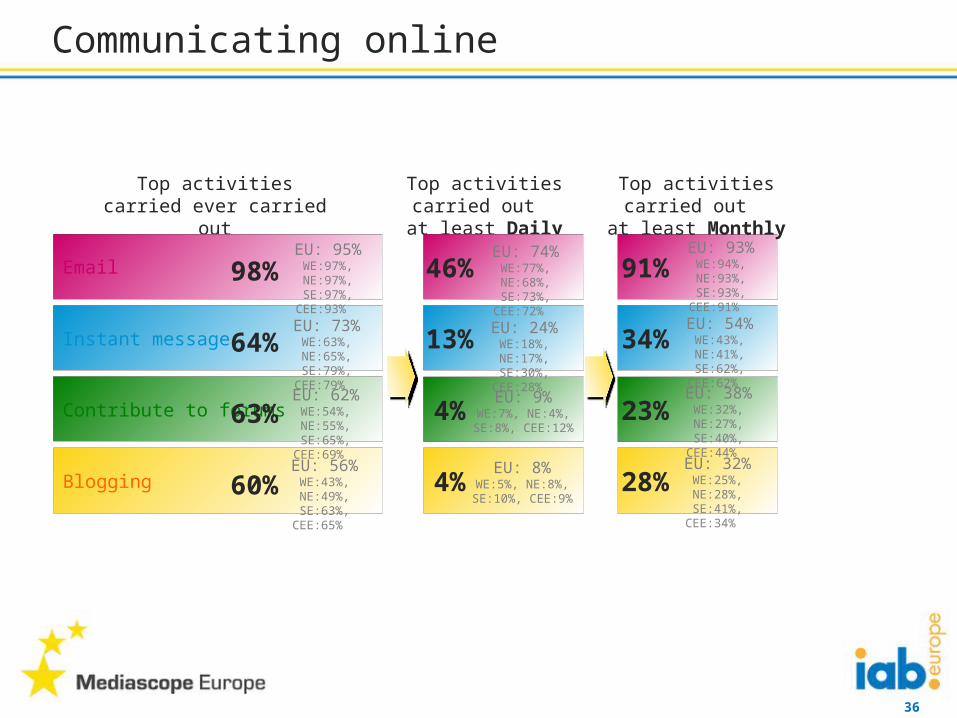
91%
28%
34%
23%
Top activities carried ever carried out
Top activities carried out at least Daily
Top activities carried out at least Monthly
Communicating online
Email 98%
Blogging 60%
Instant message 64%
Contribute to forums 63%
46%
4%
13%
4%
EU: 95%WE:97%, NE:97%, SE:97%, CEE:93%
EU: 73%WE:63%, NE:65%, SE:79%, CEE:79%
EU: 62%WE:54%, NE:55%, SE:65%, CEE:69%
EU: 56%WE:43%, NE:49%, SE:63%, CEE:65%
EU: 74%WE:77%, NE:68%, SE:73%, CEE:72%
EU: 24%WE:18%, NE:17%, SE:30%, CEE:28%
EU: 9%WE:7%, NE:4%,
SE:8%, CEE:12%
EU: 8%WE:5%, NE:8%,
SE:10%, CEE:9%
EU: 93%WE:94%, NE:93%, SE:93%, CEE:91%
EU: 54%WE:43%, NE:41%, SE:62%, CEE:62%
EU: 38%WE:32%, NE:27%, SE:40%, CEE:44%
EU: 32%WE:25%, NE:28%, SE:41%, CEE:34%
37
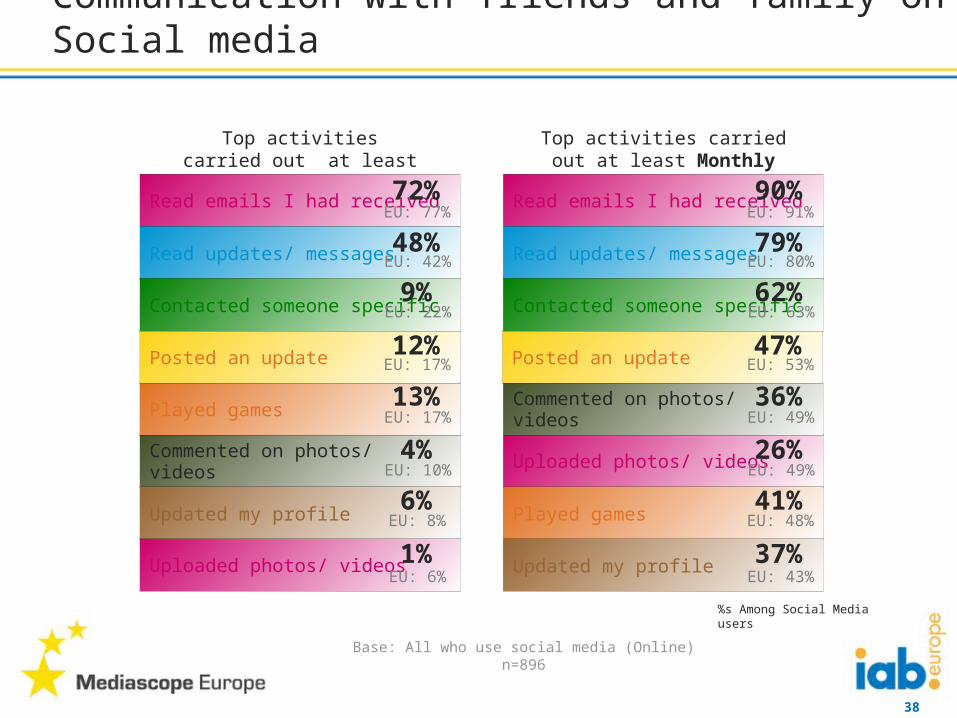
Communication with friends and family on Social media
of all Finnish Internet users have used a personal or professional Social Media websiteEU: 81%WE:73%, NE:80%, SE:84%, CEE:87%
79%
Base: All internet users (Online) n=975
38
Communication with friends and family on Social media
Top activities carried out at least Daily
Top activities carried out at least Monthly
Uploaded photos/ videos 26%Commented on photos/ videos 4%
Updated my profile 6% Played games 41%
Played games 13% Commented on photos/ videos 36%
Read emails I had received 72% Read emails I had received 90%
Posted an update 12% Posted an update 47%
Uploaded photos/ videos 1% Updated my profile 37%
Read updates/ messages 48% Read updates/ messages 79%
Contacted someone specific 9% Contacted someone specific
62%
EU: 77% EU: 91%
EU: 42% EU: 80%
EU: 22% EU: 63%
EU: 17% EU: 53%
EU: 17% EU: 49%
EU: 10% EU: 49%
EU: 8% EU: 48%
EU: 6% EU: 43%
%s Among Social Media users
Base: All who use social media (Online) n=896
39
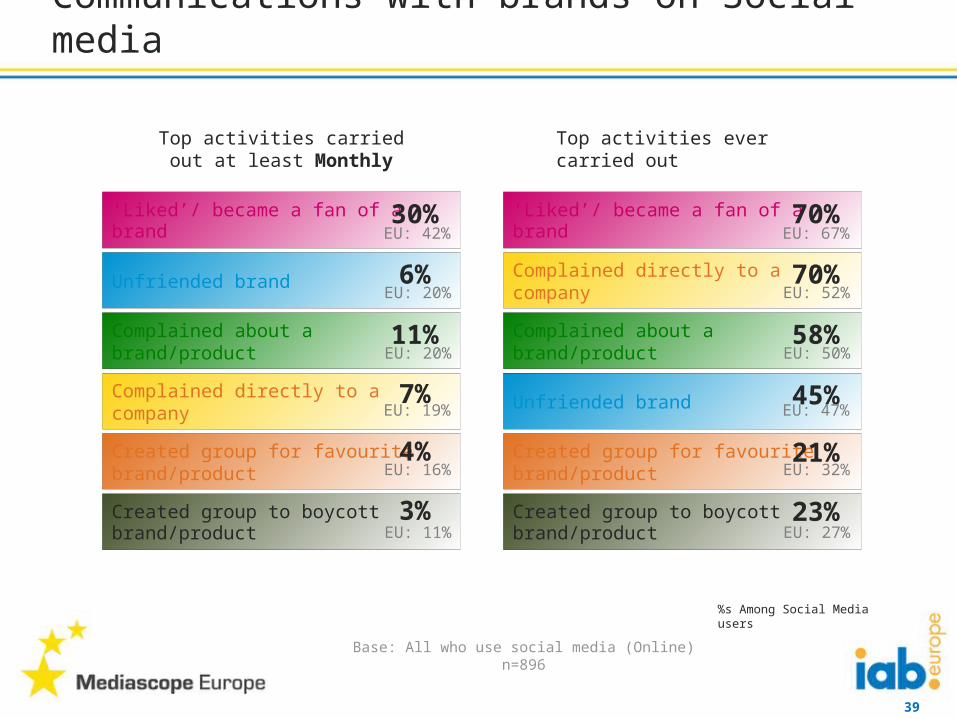
Created group to boycott brand/product
23%
Created group for favourite brand/product
21%
‘Liked’/ became a fan of a brand 70%
Unfriended brand 45%
Complained about a brand/product 58%
Complained directly to a company 70%
Created group to boycott brand/product
3%
Created group for favourite brand/product
4%
‘Liked’/ became a fan of a brand 30%
Complained directly to a company 7%
Unfriended brand 6%
Complained about a brand/product 11%
Communications with brands on Social media
Top activities carried out at least Monthly
Top activities ever carried out
EU: 42% EU: 67%
EU: 20% EU: 52%
EU: 20% EU: 50%
EU: 19% EU: 47%
EU: 16% EU: 32%
EU: 11% EU: 27%
%s Among Social Media users
Base: All who use social media (Online) n=896
40
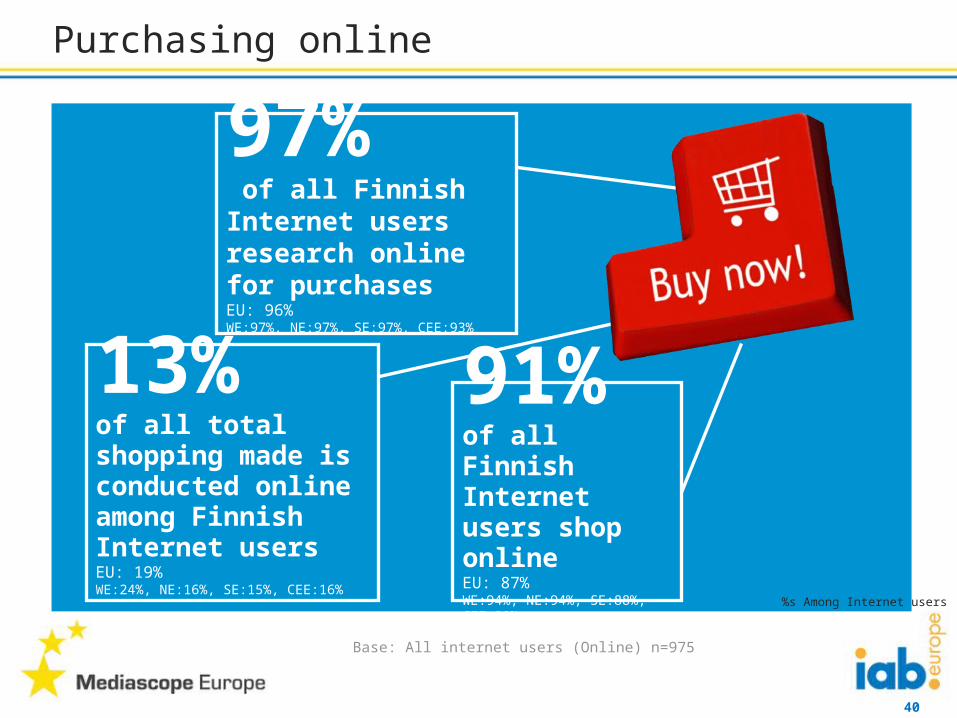
Purchasing online
91%of all Finnish Internet users shop onlineEU: 87%WE:94%, NE:94%, SE:88%, CEE:80%
97% of all Finnish Internet users research online for purchasesEU: 96%WE:97%, NE:97%, SE:97%, CEE:93%
13%of all total shopping made is conducted online among Finnish Internet usersEU: 19%WE:24%, NE:16%, SE:15%, CEE:16%
%s Among Internet users
Base: All internet users (Online) n=975
41
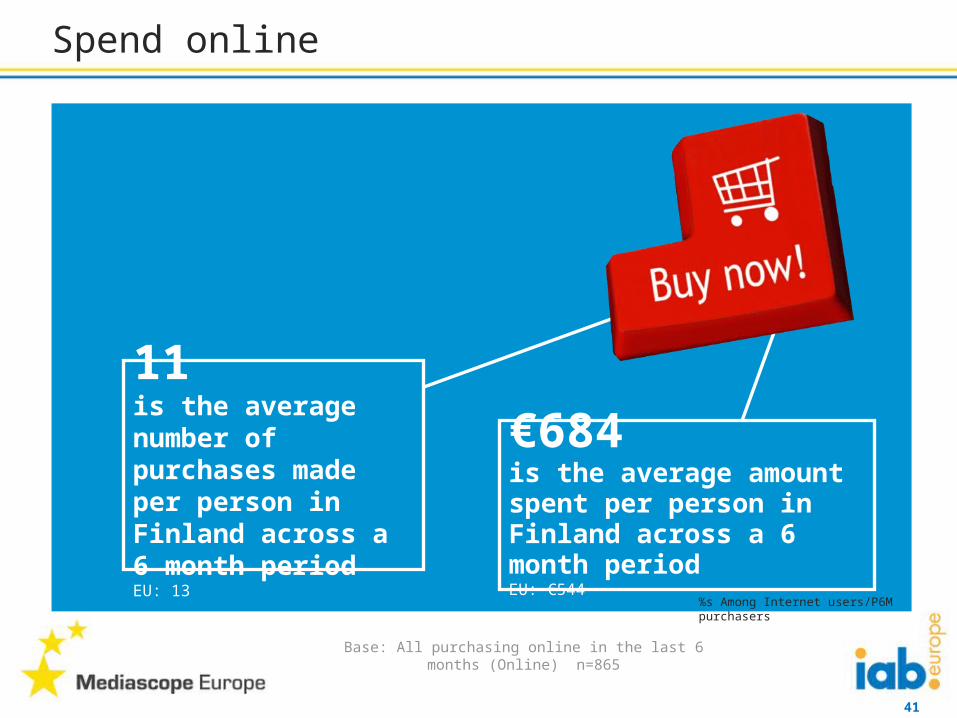
Spend online
11 is the average number of purchases made per person in Finland across a 6 month periodEU: 13
€684is the average amount spent per person in Finland across a 6 month periodEU: €544
%s Among Internet users/P6M purchasers
Base: All purchasing online in the last 6 months (Online) n=865
42
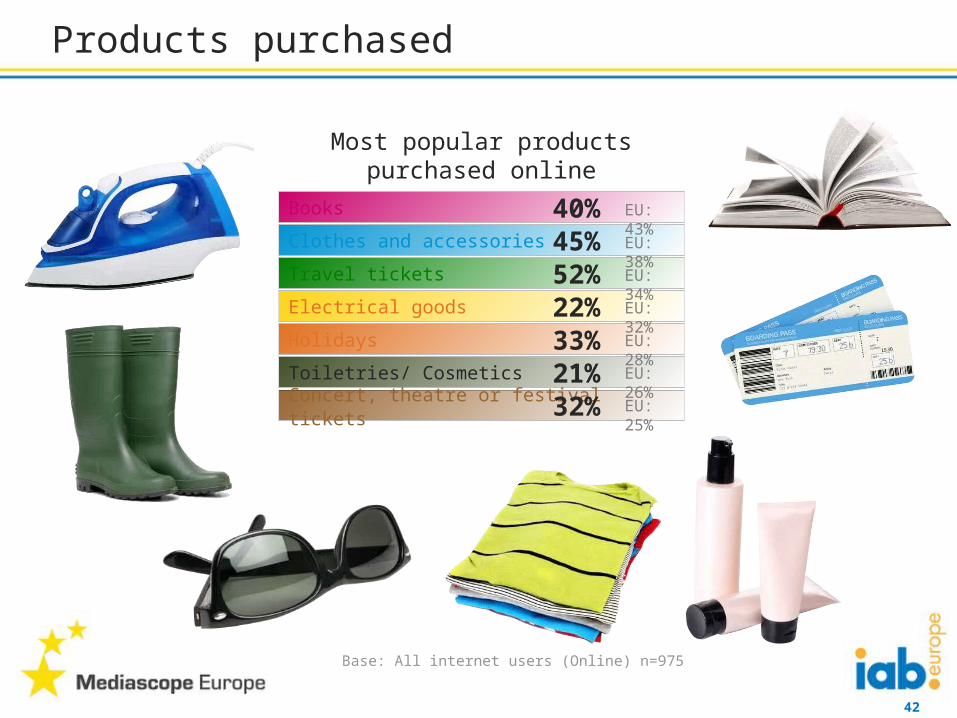
Products purchased
Most popular products purchased online
Holidays 33%Toiletries/ Cosmetics 21%
Books 40%
Electrical goods 22%
Concert, theatre or festival tickets 32%
Clothes and accessories 45%Travel tickets 52%
EU: 43%
EU: 38%
EU: 34%
EU: 28%
EU: 26%
EU: 32%
EU: 25%
Base: All internet users (Online) n=975
43
The Internet influences people’s perceptions of brands and products, especially when they are consuming across more digital devices
Other media – TV, radio, newspapers are increasingly being consumed online but Finnish pattern is different to other markets
Accessing the internet is no longer solely via traditional computer with people accessing more and more via mobiles, tablets and games consoles
Increasingly people are watching TV and using the internet at the same time but other offline media are consumed in more of a ‘solus’ mode in Finland
To summarise