Embed Size (px)
Citation preview
Finite Element Modelling of a Sustainable
Hybrid Natural Fibre Sandwich Panel Under
Bending
A dissertation submitted by
Iman Farahbakhsh
Supervised by Associate Professor Yan.Zhuge
ERP2016: Engineering Research Project 2015
For the degree:
Bachelor of Engineering (Civil)
i Finite Element Modelling of a Sustainable Hybrid Natural Fibre Sandwich Panel Under Bending
Abstract
Mass production of houses on a large scale at an affordable price,
acceptable quality and sustainable method has always been one of the
challenges for the public and private sector. Applying natural fibre
reinforced composite panels in the modular building is one of the
promising approaches to this challenge. This project modelled and
analysed jute, hemp and MDF fibre reinforced composite panels under
flexural loading using Strand7 computer software.
It was found that the introduction of the intermediate layer of jute, hemp
and MDF improved the load carrying capacity of conventional insulated
panels. However, panels with jute fibre displayed less stiffness that could
be a point of concern for practical applications. Experimental results
indicated that delamination and debonding between the core and
intermediate layers have been a major failure cause of hybrid sandwich
panels. It was understood that modelling delamination between layers was
fairly complex and required significantly more time which was out of the
scope of this project. Therefore, modelling and analysing the bonding
agent in sandwich panels is suggested for further work in the future.

ii Finite Element Modelling of a Sustainable Hybrid Natural Fibre Sandwich Panel Under Bending
University of Southern Queensland
Faculty of Health, Engineering and Sciences
ENG4111/ENG4112
Research Project
Limitations of Use
The Council of the University of Southern Queensland, its Faculty of
Health, Engineering & Sciences, and the staff of the University of Southern
Queensland, do not accept any responsibility for the truth, accuracy or
completeness of material contained within or associated with this
dissertation.
Persons using all or any part of this material do so at their own risk, and not
at the risk of the Council of the University of Southern Queensland, its
Faculty of Health, Engineering & Sciences or the staff of the University of
Southern Queensland.
This dissertation reports an educational exercise and has no purpose or
validity beyond this exercise. The sole purpose of the course pair entitled
“Research Project” is to contribute to the overall education within the
student’s chosen degree program. This document, the associated hardware,
software, drawings, and other material set out in the associated appendices
should not be used for any other purpose: if they are so used, it is entirely at
the risk of the user.

iii Finite Element Modelling of a Sustainable Hybrid Natural Fibre Sandwich Panel Under Bending
University of Southern Queensland
Faculty of Health, Engineering and Sciences
ENG4111/ENG4112 Research Project
Certification of Dissertation
I certify that the ideas, designs and experimental work, results, analyses and
conclusions set out in this dissertation are entirely my own effort, except
where otherwise indicated and acknowledged. I further certify that the work
is original and has not been previously submitted for assessment in any other
course or institution, except where specifically stated.
I. Farahbakhsh
0061075278
_______
Date: _12_/_10_/_2016_

iv Finite Element Modelling of a Sustainable Hybrid Natural Fibre Sandwich Panel Under Bending
Acknowledgement
This project was supervised by Associate Professor Yan Zhuge and I would
like to thank her for her tireless support and guidance. She has assisted me
constantly throughout the year towards the completion of the project with
sharing her invaluable knowledge and experience. I was fortunate to work
under her supervision. I would also like to thank my family and friends for
their support and patience that helped me a lot to go through the end of this
project.
Table of Contents
Abstract .................................................................................................................. i
Acknowledgement ............................................................................................... iv
1 Introduction .................................................................................................... 8
1.1. Project Background ................................................................................ 9
1.2. Project Aims ......................................................................................... 10
1.3. Constraints ........................................................................................... 10
1.4. Project objectives ................................................................................. 10
2 Background and literature review ................................................................ 12
2.1 Introduction .......................................................................................... 12
2.2 Performance of SIP .............................................................................. 12
2.2.1 Structural insulated panels ........................................................... 12
2.2.2 Performance of sandwich panels under bending load .................. 14
2.3 Numerical modelling of SIPs ............................................................... 18
2.3.1 General characteristics of Strand7 ............................................... 19
2.3.2 Finite element modelling using Strand7 ...................................... 19
2.4 Review of experimental methodology ................................................. 20
2.4.1 NFRP in construction industry ..................................................... 25
3 Methodology ................................................................................................ 27
4 Developing the 3D model ............................................................................ 28
5 Results and discussion ................................................................................. 36
5.1 Comparison of load-deflection behaviour of specimens ...................... 36
5.1.1 Medium specimens ...................................................................... 37
5.1.2 Large specimens ........................................................................... 41
5.2 Comparison of theoretical and 3D model deflections .......................... 46
5.3 Normal stress distributions of specimens ............................................. 48
6 Conclusion and recommendations ............................................................... 53
7 References .................................................................................................... 55
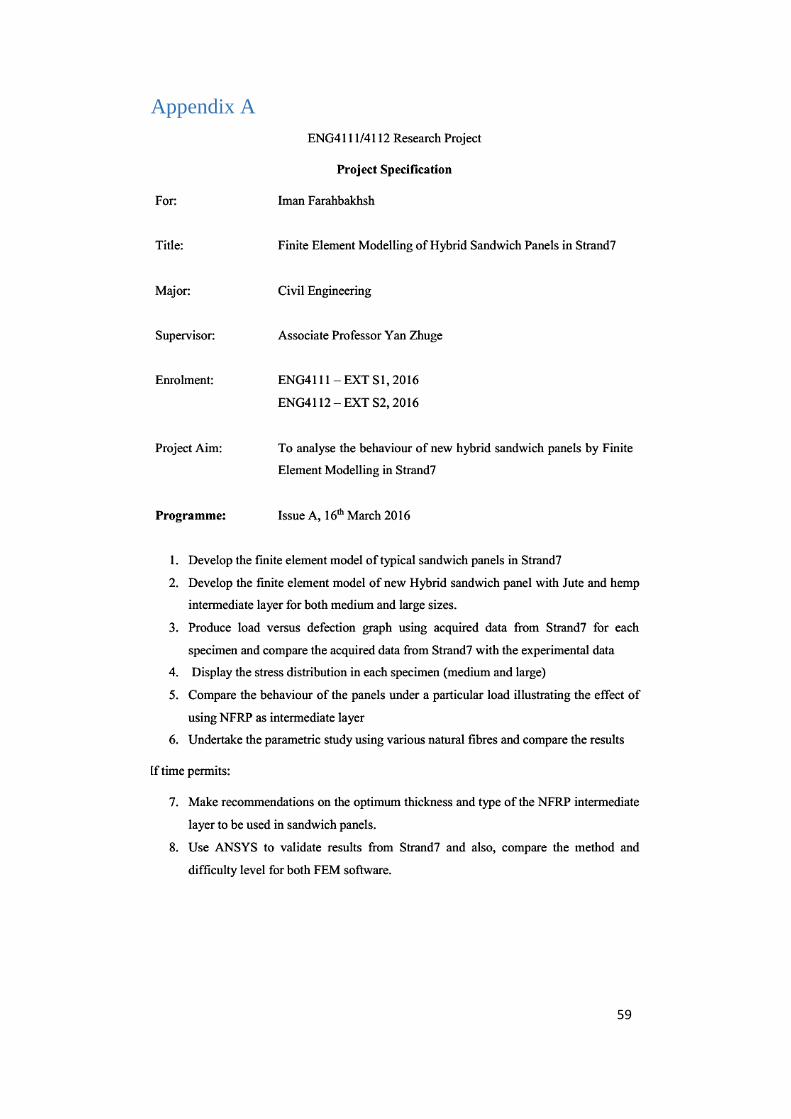
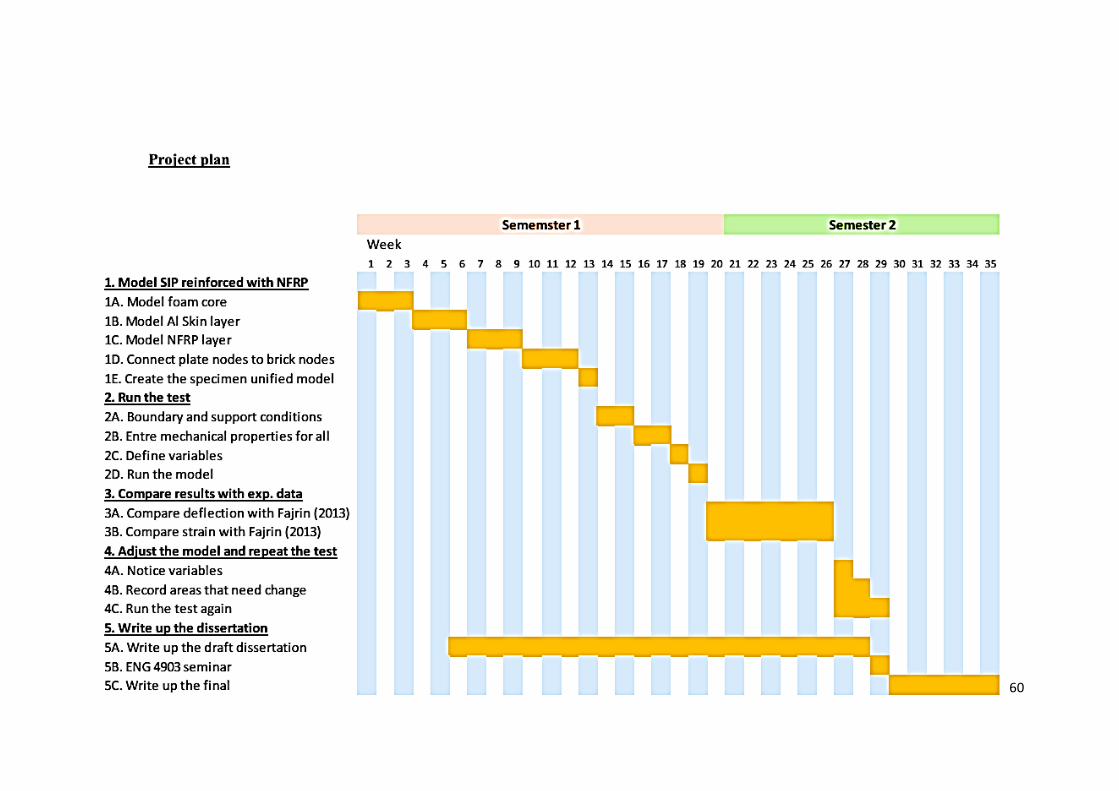
Appendix A .......................................................................................................... 59
Appendix B .......................................................................................................... 62
Appendix C .......................................................................................................... 64
Appendix D .......................................................................................................... 65
Appendix E .......................................................................................................... 67
Table of Figures
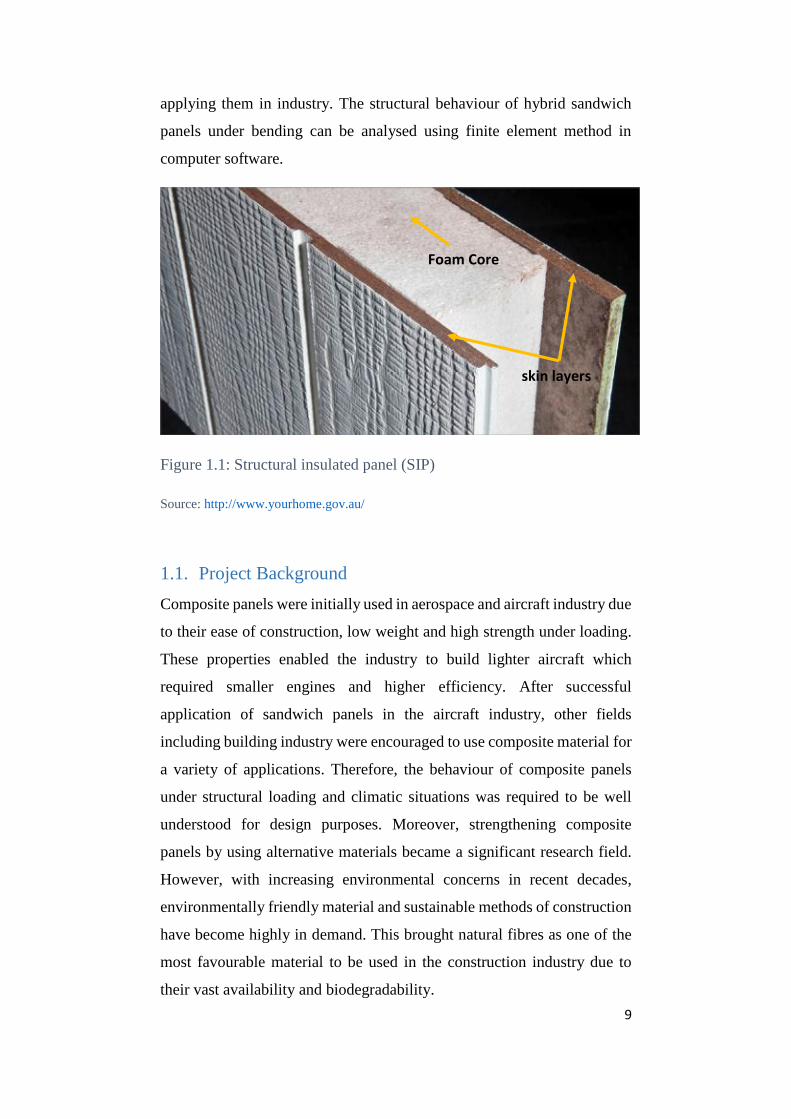
Figure 1.1: Structural insulated panel (SIP) ........................................................... 9
Figure 2.1: Stress distribution in SIP before and after application of NFRP ....... 15
Figure 2.2: Deformation under four-point loading .............................................. 17
Figure 2.3: Stress-Strain curves for materials in this project: .............................. 23
Figure 2.4: Loading conditions in the real experiment ........................................ 24
Figure 2.5: Schematic of four-point load for medium specimen ......................... 24
Figure 2.6: Schematic of four-point load for large specimen .............................. 24
Figure 2.7: Load-deflection comparison between FEM and real experiment in
previous studies .................................................................................................... 25
Figure 4.1: Properties of jute introduced to Strand7 ............................................ 29
Figure 4.2:Properties of aluminium introduced to Strand7 .................................. 29
Figure 4.3: Properties of EPS core introduced to Strand7 ................................... 30
Figure 4.4: Graph of stress vs Strain for Aluminium ........................................... 30
Figure 4.5:Graph of stress vs Strain for EPS Core............................................... 31
Figure 4.6: Graph of stress vs Strain for hemp .................................................... 31
Figure 4.7: Graph of stress vs Strain for jute ....................................................... 31
Figure 4.8: Graph of stress vs Strain for MDF .................................................... 32
Figure 4.9: Initial steps of creating jute large scale specimen ............................. 33
Figure 4.10: Subdividing jute large specimen ..................................................... 33
Figure 4.11: Load and boundary conditions applied to the specimen .................. 34
Figure 4.12: Non-linear static and load increments in Strand7 ............................ 35
Figure 5.1: Comparison of results from Strand7 (ST7) with real experiment for
medium scale control specimens.......................................................................... 38
Figure 5.2: Comparison of results from Strand7 (ST7) with real experiment for
medium-scaled specimens with jute intermediate layer....................................... 39
Figure 5.3:Comparison of results from Strand7 (ST7) with real experiment for
medium-scaled specimens with hemp intermediate layer .................................... 40
Figure 5.4: comparison of load carrying capacity among medium scale specimens
............................................................................................................................. 41
Figure 5.5:Comparison of results from Strand7 (ST7) with real experiment for
large scale control specimens ............................................................................... 42
Figure 5.6:Comparison of results from Strand7 (ST7) with real experiment for
large-scaled specimens with jute intermediate layer ............................................ 43
Figure 5.7:Comparison of results from Strand7 (ST7) with real experiment for
large scale specimens with MDF intermediate layer ........................................... 44
Figure 5.8:comparison of load carrying capacity among large scale specimens . 45
Figure 5.9: Normal stress distribution in CTR-SP ............................................... 48
Figure 5.10: Normal stress distribution in JFC-SP .............................................. 49
Figure 5.11: Normal stress distribution in HFC-SP ............................................. 50
Figure 5.12: Normal stress distribution in CTR-SIP ............................................ 51
Figure 5.13: Normal stress distribution in JFC-SIP ............................................. 52
Figure 5.14: Normal stress distribution in MDF-SIP ........................................... 52
List of Tables
Table 2.1: Mechanical properties of Aluminium and EPS .................................. 21

Table 2.2: Mechanical properties of JNC ............................................................ 22
Table 2.3: Mechanical properties of HNC ........................................................... 22
Table 2.4: specimens’ configuration for flexural test .......................................... 22
Table 5.1: Comparison of the theoretical deflections with Strand7 3D models
deflections ............................................................................................................ 46
8
1 Introduction
Providing quality affordable accommodation in a sustainable construction
method has always been of major challenges facing the housing industry.
Prefabricated or modular panelised construction is a method in which
house components or parts are pre-fabricated at factory in and transported
and erected on site. Modular panelised system is able to reduce
construction duration and labour cost. Consequently, more houses can be
built considerably faster with lower prices. Other advantages are such as
the reduction or elimination of costing delays, less weather damage to
material, utilization of precisely engineered material, less amount of
energy for cooling and heating and enhanced insulation. Modular
panelised systems conventionally use structural insulated panels (SIPs) as
favourable construction material. Composite sandwich structure with soft
rigid expanded polystyrene core has been broadly utilised in building
industry in recent decade particularly after the Modular panelised
construction gained considerable attention in the housing market.
Structural insulated panel (SIP), shown in Figure 1.1 is composed of two
skin layers of metal (Steel or aluminium) and a soft rigid polystyrene core
in the middle with a variety of thicknesses. SIPs are known as sandwich
panels due to their shape which resembles a sandwich. Metal skins are one
of the best choices for the outer layer for many reasons however the price
has always been a concern. Therefore, reducing the thickness of the outer
layers can reduce the cost of manufacturing SIPs. However, reducing the
thickness of the layer results in face wrinkling and proneness to structural
loading.
A practical and sustainable solution to this problem is adding an
intermediate layer of natural fibre reinforced plastic (NFRP) to the
conventional insulated panels to creates Hybrid Sandwich Panels. Natural
fibres are of major renewable resources in the construction industry and
have numerous advantages such as being environmentally friendly, flood
resistance and higher strength over typical SIPs. However, it is crucial to
design and analyse sandwich panels under structural loading before
9
applying them in industry. The structural behaviour of hybrid sandwich
panels under bending can be analysed using finite element method in
computer software.
Figure 1.1: Structural insulated panel (SIP)
Source: http://www.yourhome.gov.au/
1.1. Project Background
Composite panels were initially used in aerospace and aircraft industry due
to their ease of construction, low weight and high strength under loading.
These properties enabled the industry to build lighter aircraft which
required smaller engines and higher efficiency. After successful
application of sandwich panels in the aircraft industry, other fields
including building industry were encouraged to use composite material for
a variety of applications. Therefore, the behaviour of composite panels
under structural loading and climatic situations was required to be well
understood for design purposes. Moreover, strengthening composite
panels by using alternative materials became a significant research field.
However, with increasing environmental concerns in recent decades,
environmentally friendly material and sustainable methods of construction
have become highly in demand. This brought natural fibres as one of the
most favourable material to be used in the construction industry due to
their vast availability and biodegradability.
Foam Core
skin layers
10
1.2. Project Aims
A computer generated model for analysing the application of natural fibres
on insulated panels enables researchers to estimate the behaviour of
structural insulated panels reinforced with different types of natural fibres
with various thicknesses at a significantly lower cost and reduced time. On
this basis, the aim of this project is to provide a 3D model for analysing the
application of natural fibres on structural insulated panels under bending.
Requirements of this project are listed as:
Reproduce 3D models of the panels in Strand7
Test the 3D models under bending and record the data
Compare the data against experimental results from Dr. Fajrin
Analyse the results and comment on accuracy and applicability of
models for analysing other types hybrid panels
1.3. Constraints
Natural fibres are of different types and thicknesses thus, it was decided to
limit the generated model to two most used types in the construction
industry; jute and hemp fibres. This selection not only provides a better
scope of works for an undergraduate level but also represents two natural
fibres with the best performance for construction purposes among other
NFRPs. The project is also constrained to modelling and analysing the
behaviour of reinforced SIPs under bending. Therefore, the analysis of
panels under tension, compression, buckling, shear and torsion will not be
considered in this project. Furthermore, face sheet is limited to aluminium
and foam core to Expanded Polystyrene (EPS) for SIP in this project.
Despite these limitations, the process and details of creating the model can
be used by other researchers for other load types in the future.
1.4. Project objectives
The following objectives are set for this project:

11
To produce a 3D finite element model using Strand7 for analysing the
application of NFRP on SIP
To plot graphs showing load versus deflection for various types of NFRP
and thicknesses
To validate the obtained load-deflection curves by comparing them with
the graphs from the real experiment
To conduct a parametric study to evaluate the influence of parameters such
as width, thickness and type of natural fibre on SIP
12
2 Background and literature review
2.1 Introduction
Since 1935, many studies have been undertaken to analyse and learn the
behaviour of composite panels under loading and climatic conditions. Most
of these studies were done in a laboratory and by real specimens. It was only
after the development of the finite element modelling computer programs
that modelling structural insulated panels initiated.
This section reviews the information regarding sandwich panels from
previous papers and outlines the experimental conditions and methodology
from Fajrin et al. (2013a) in order to provide a scale for validating results
from the computer program.
2.2 Performance of SIP
2.2.1 Structural insulated panels
Structural insulated panel (SIP) is a structural member constructed from two
skin layers with a rigid relatively thick foam core in the middle which has
been utilised as wall, roof and floor in the prefabricated housing for years.
The core carries the shear loads and stabilises the structure against bulking
and wrinkling and face sheets carry bending stresses. It was first introduced
in 1935 in the United States as a response to high level of market demand
for faster and more economical method of construction. Due to the
significantly low amount of wastage and enabling fast-paced construction,
it has been favourable in building industry as walls, floors and slabs (Abang
Abdullah Abang, Mohammad & Yen Lei 2013). Moreover, ease of
transportation, low maintenance, good insulation, high level of strength to
weight ratio and ease of replacement for repair purposes makes structural
composite panels an ideal choice in the building industry.
The main components of structural panels are thick core, extra thin adhesive
and thin faces or skins. The adhesive or bonding agent provides connection
and transfers shear between the core and skins. The core contributes to the
high section modulus of the panel and takes care of the applied shear force
(Davies, 2001).
13
Common types of SIP face sheet include oriented strand board (OSB)
which is a wood base board, fibre reinforced polymer (FRP), aluminium
and steel, cement board and calcium silicate board (Abang Abdullah
Abang, Mohammad & Yen Lei 2013). In fact, a thin layer of almost any
material can be used as skin layers of composite panels which makes the
use of panels favourable in many situations and a variety of applications.
However, it should be taken into account that some types of cores and
bonding agents are not compatible and will result in a chemical reaction
and hence, instant failure of the panel (Zenkert, 1995).
Due to their special configuration, composite panels have their own weak
points which according to Mostafa et al. (2013), are known as face
wrinkling and failure due to shear stress. Various research has been
undertaken (Zhou & Stronge, 2005; Grenestedt & Reany, 2007) in order
to introduce and analyse different approaches to strengthening composite
panels. Some of these approaches are introducing shear keys, enhanced
skins and adhesives and direction of fibres in panels.
Furthermore, the cost of using SIP in construction has always been a
concern. The cost of using SIPs still can be reduced by decreasing the
thickness of skin layers although, thinner skin can cause wrinkling and
lessened structural stiffness of the panel. To overcome this challenge, an
intermediate layer with relatively large tensile strength such as natural
fibre reinforced polymers can be added to SIPs to increase the panel
strength under structural loading (Fajrin et al. 2013a).
Increasing environmental concerns and global consciousness toward the
natural resource preservation has attracted numerous researchers into the
application of Natural fibre reinforced polymer (NFRP) in lieu of synthetic
fibres in building industry as cost effective bio-composites. NFRP
advantages are their low cost, high strength, low density, bio-
degradability, environmentally friendly, non-corrosiveness and
renewability. Natural fibres are available as coconut fibre (coir), jute,
palm, hemp, abaca, sisal, bamboo, wood and paper in their natural
condition (Herrera-Franco & Valadez-González 2004).
14
2.2.2 Performance of sandwich panels under bending load
A study (Fajrin et al. 2013a) illustrates the flexural behaviour of a
conventional SIP, without any NFRP intermediate layer, under bending
stress. This specimen is chosen as a control specimen in order to
demonstrate the effect of applying an intermediate layer to SIP. It is
noticed that the control specimen fails under an average load of 328 N.
This is expected to be achieved in the computer generated model.
The results from previous studies (Fajrin et al. 2013a) shows that
reinforcing SIP with NFRP can increase its flexural strength up to 40% for
jute layer and 95% for hemp layer. It is realised that ultimate flexural
strength is highly dependent on the type and thickness of the NFRP applied
as an intermediate layer (Fajrin, Zhuge, Bullen &Wang 2013b). These
values of flexural strength for reinforced panel specimens are expected to
be obtained in the numerical model.
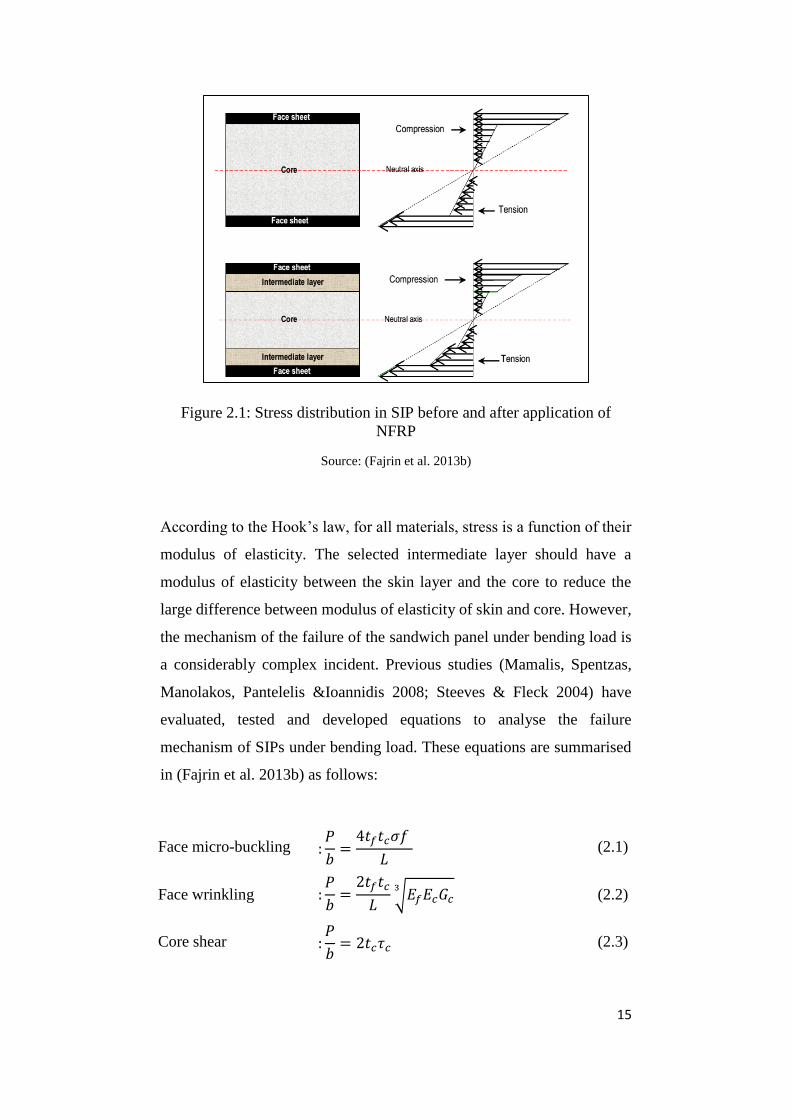
In testing SIPs, the bending load is applied to a monolithic panel attached
to a homogeny material. The resulting stress distribution is a straight
sloping plain that has a remarkable transform at the top and bottom
interface where skin layers and core meet each other. This large
inconsistency in stress distribution is the main cause of failure in an early
stage in sandwich panel structures. Introducing an intermediate layer with
median mechanical properties between the skin and core is to reduce this
gap which is illustrated in Figure 2.1.
15
Figure 2.1: Stress distribution in SIP before and after application of
NFRP
Source: (Fajrin et al. 2013b)
According to the Hook’s law, for all materials, stress is a function of their
modulus of elasticity. The selected intermediate layer should have a
modulus of elasticity between the skin layer and the core to reduce the
large difference between modulus of elasticity of skin and core. However,
the mechanism of the failure of the sandwich panel under bending load is
a considerably complex incident. Previous studies (Mamalis, Spentzas,
Manolakos, Pantelelis &Ioannidis 2008; Steeves & Fleck 2004) have
evaluated, tested and developed equations to analyse the failure
mechanism of SIPs under bending load. These equations are summarised
in (Fajrin et al. 2013b) as follows:
Face micro-buckling :𝑃
𝑏=
4𝑡𝑓𝑡𝑐𝜎𝑓
𝐿 (2.1)
Face wrinkling :𝑃
𝑏=
2𝑡𝑓𝑡𝑐
𝐿√𝐸𝑓𝐸𝑐𝐺𝑐3
(2.2)
Core shear :𝑃
𝑏= 2𝑡𝑐𝜏𝑐 (2.3)
16
Where:
𝜏𝑐 =shear strength
𝜎𝑐 = compressive strength
𝑏 =width of the sandwich panel
𝐸= elastic modulus
𝐺 =Foam core shear modulus
𝐿 =span between supports
𝑃 = load
𝑡 = thickness of the layer
f = face sheet
c =core
I=internal layer
Theoretical deflections of sandwich panels can be calculated using ASTM
C 393-00 (ASTM, 2000), the standard test method for flexural properties of
sandwich constructions. According to this standard, the total deflection of a
sandwich panel equals the sum of the deflection of all layers in bending and
shear. Total deflection under two-point load at one-quarter span can be
calculated as:
Δ =
11PL3
768D+
PL
8U
(2.5)
Where:
D = The stiffness in N. mm2
U = panel shear rigidity
P = Load (N)
L = Span length (mm)
Indentation :𝑃
𝑏= √
𝜋2𝐸𝑓𝜎𝑐2𝑡𝑓
3𝑡𝑐
𝐿
3
(2.4)
17
However, the above equation could not be used for this project as the
loading configuration was different.
Roylance (2000) suggested a general equation for calculating deflection
of sandwich panels as:
δ(x) =P(L−a)
6LEI[
L
L−a(x − a)3 − x3 + (L2 − (L − a)2x)] +
Pa
6LEI[
L
a(x − (L − a))3 − x3 + (L2 − a2)x ]
(2.6)
For this project, 𝑎 =𝐿
3 and 𝑥 =
𝐿
2 therefore,
𝛿 =
23𝑃𝐿3
1296𝐸𝐼 (2.7)
This equation can be rearranged as:
𝛿 =
23𝑃𝐿3
1296(𝐸𝐼)𝑒𝑞 (2.8)
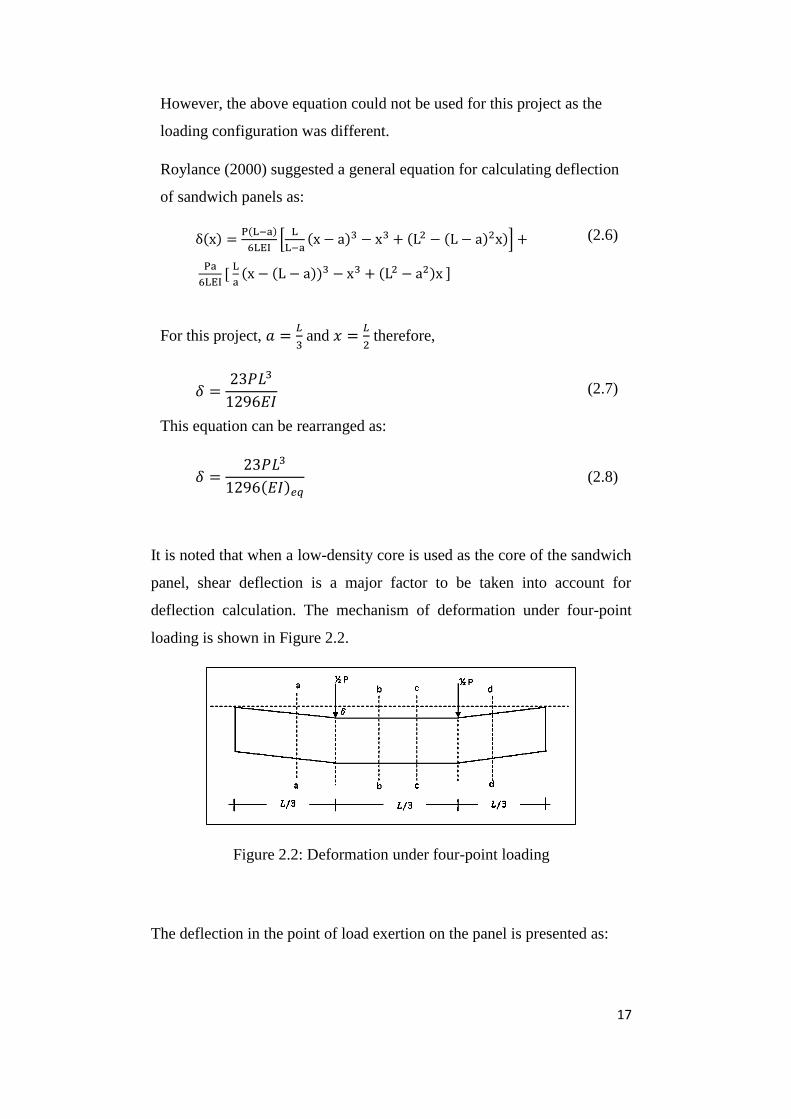
It is noted that when a low-density core is used as the core of the sandwich
panel, shear deflection is a major factor to be taken into account for
deflection calculation. The mechanism of deformation under four-point
loading is shown in Figure 2.2.
Figure 2.2: Deformation under four-point loading
The deflection in the point of load exertion on the panel is presented as:
18
𝛿
𝐿3
= 𝛾 =𝑄
𝐺𝑐𝑏𝑑 (2.9)
𝛿 =
𝑄𝐿3
𝐺𝑐𝑏𝑑 (2.10)
𝑄 =
𝑃
2 (2.11)
𝛿 =
𝑃2 .
𝐿3
𝐺𝑐𝑏𝑑 (2.12)
𝛿 =
𝑃𝐿
6(𝐺𝑐𝑏𝑑) (2.13)
𝛿 =
𝑃𝐿
6(𝐴𝐺)𝑒𝑞 (2.14)
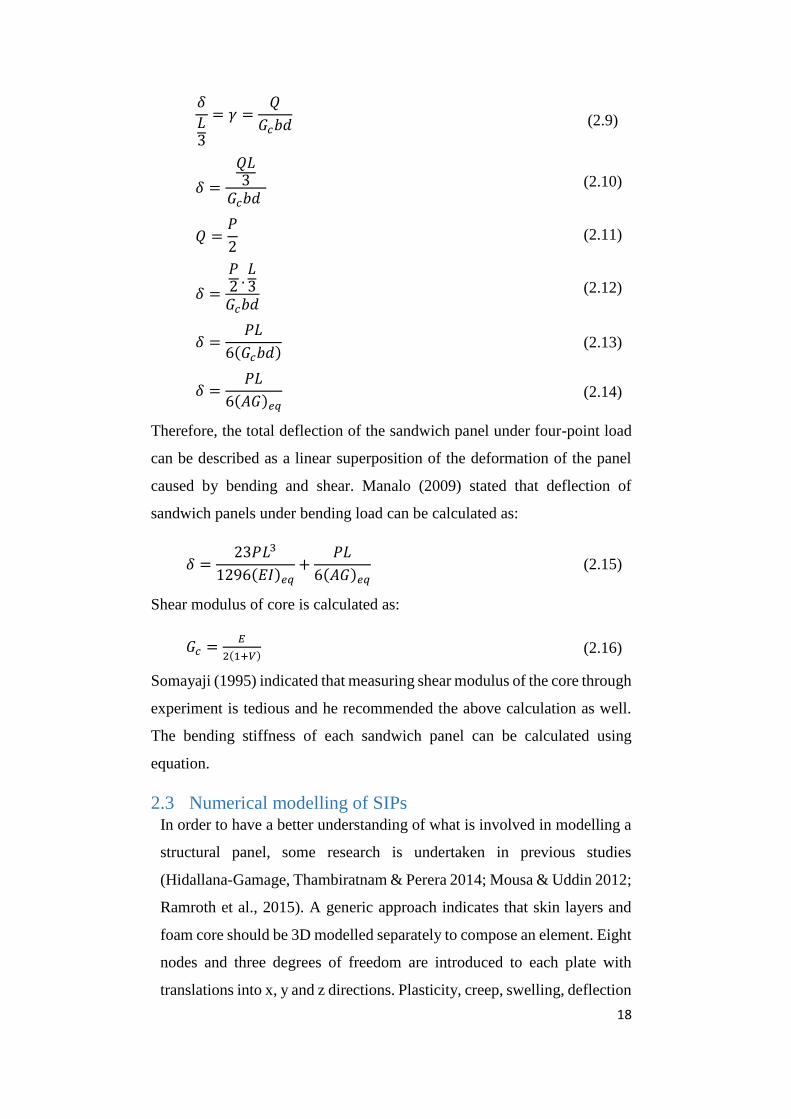
Therefore, the total deflection of the sandwich panel under four-point load
can be described as a linear superposition of the deformation of the panel
caused by bending and shear. Manalo (2009) stated that deflection of
sandwich panels under bending load can be calculated as:
𝛿 =
23𝑃𝐿3
1296(𝐸𝐼)𝑒𝑞+
𝑃𝐿
6(𝐴𝐺)𝑒𝑞 (2.15)
Shear modulus of core is calculated as:
𝐺𝑐 =𝐸
2(1+𝑉) (2.16)
Somayaji (1995) indicated that measuring shear modulus of the core through
experiment is tedious and he recommended the above calculation as well.
The bending stiffness of each sandwich panel can be calculated using
equation.
2.3 Numerical modelling of SIPs In order to have a better understanding of what is involved in modelling a
structural panel, some research is undertaken in previous studies
(Hidallana-Gamage, Thambiratnam & Perera 2014; Mousa & Uddin 2012;
Ramroth et al., 2015). A generic approach indicates that skin layers and
foam core should be 3D modelled separately to compose an element. Eight
nodes and three degrees of freedom are introduced to each plate with
translations into x, y and z directions. Plasticity, creep, swelling, deflection
19
and strain are defined for the element. It should be taken into account that
both skin layers and core in SIP act identically in all directions whereas
the NFRP layer acts in two directions (Mousa & Uddin 2012). Therefore,
face sheets and core are modelled as isotropic (same grain in each
direction) while NFRP layers are modelled as an orthotropic material.
Properties such as modulus of elasticity, tensile strength and percentage of
density and elongation for all materials in the model are required to be
defined in three planes. Loading and boundary conditions and plane
constraints for face sheets, NFRP layers and the core are defined and
applied in accordance with the real experiment. Resulting graphs of load
versus deflection is plotted by the software and compared with the real
experiment data.
2.3.1 General characteristics of Strand7
Strand7 is a finite element modelling software developed in Sydney,
Australia and is known for linear and non-linear analysis, flexural,
buckling and heat transfer modelling. It is widely used in construction and
engineering industry in modelling new materials and composite
application, the design of structures and analysis of existing infrastructure
and buildings. (Strand7 2015).
2.3.2 Finite element modelling using Strand7
What makes it attractive to work with Strand7 is access to an unlimited
number of nodes, elements and equations. This characteristic enables the
operator to create precise models with a high level of details. Dynamic
rotation of the model can be easily undertaken using Wireframe mode in
this software and using mouse directions. ‘Group’ function can be utilised
to manage large models to organise them into an intuitive model. User
defined coordinate system, plate thickness render, sub-modelling and
multiple freedom cases are just a few fascinating features of Strand7
(Strand7 2015).
20
2.4 Review of experimental methodology
Bending or flexural test generally includes bending a specimen until it
fractures. During the test, load and corresponding deflection are recorded
and compared to a control specimen. The largest load that a specimen is
able to take before the fracture is called flexural strength or modulus of
rupture. There are various methods that the flexural test can be conducted
including three point and four point methods. Fajrin et al. (2013a) found
that the best method of exerting load on sandwich panels in bending test is
the four-point bending load. This fact is also verified by former researchers
(Manalo et al. 2009).
Adding NFRP intermediate layer to structural insulated panels have been
successfully tested at the University of Southern Queensland, Australia
(Fajrin et al. 2013a). Accurate data is available and table of load versus
deflection and strain for various configurations are plotted. The specimens
for this experiment were classified as medium and large specimens.
Medium ones were cut into a span of 450 mm and the length of 550 mm,
width of 50 mm and thickness of 22 mm (550 × 50 × 22 mm). The skin
layers were aluminium 5005 H34 sheet with a thickness of 0.5 mm on both
sides of the EPS core. Jute and hemp intermediate layers were 3 mm thick
and the thickness of the expanded polystyrene core for control specimen
(without NFRP) are 15 mm and for two other specimen type (with jute and
hemp intermediate layers) is 21 mm in order to maintain an overall
thickness of 22 mm. In the real experiment, control medium specimen
were named as CTR-SP, jute medium specimens as JFC-SP and hemp
medium specimen as HFC-SP in order to make comparison purposes
easier. The same method was followed in this project.
Control specimen at large scale were prepared at dimensions of (1150×
100 × 52 mm) with the span length of 900 mm. control specimen consist
of a 50 mm EPS core with aluminium skins of 1.0 mm on both sides. Jute
and MDF specimens at large size included an EPS core of 40 mm,
intermediate natural fibre of 5 mm on both sides of the core and aluminium
skins of 1.0 mm to keep overall thickness of 52 mm. Large scale specimens
are known as CTR-SIP for control specimen, JFC-SIP for the specimen
21
with jute intermediate layer and MDF-SIP for the specimen with MDF
intermediate layer. It is noticed that the large scale specimen is actually the
smallest size of sandwich panels that are currently available in the market.
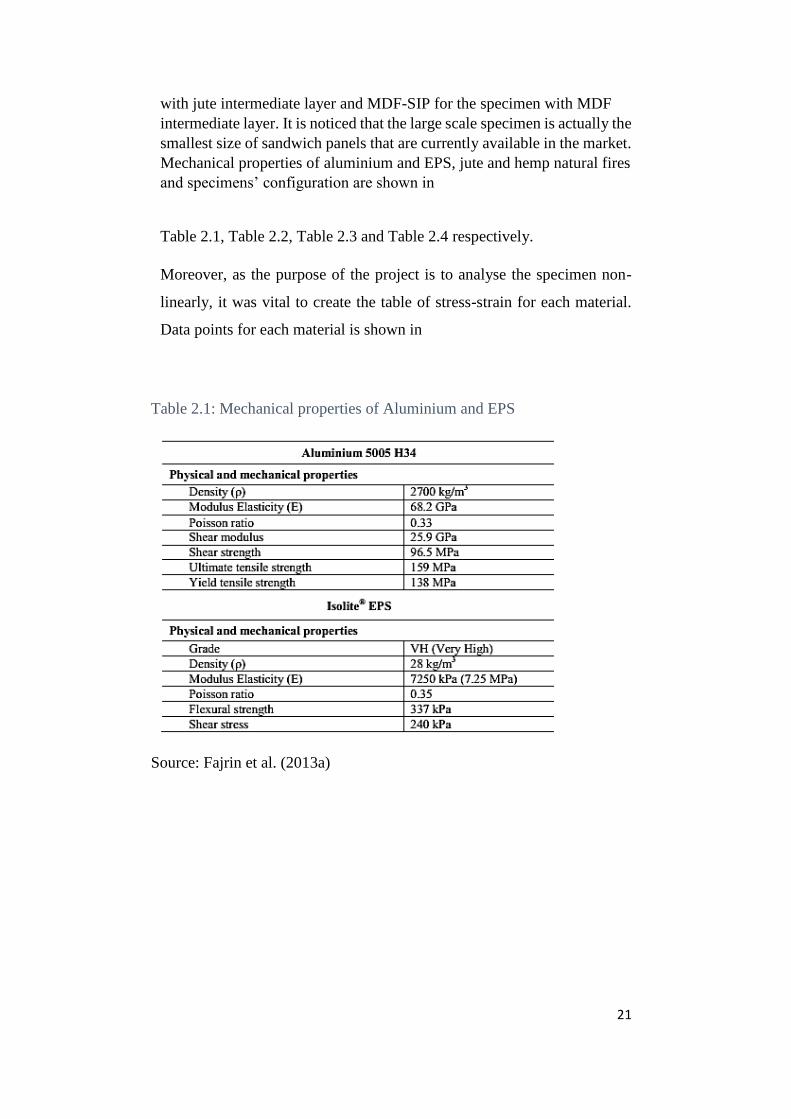
Mechanical properties of aluminium and EPS, jute and hemp natural fires
and specimens’ configuration are shown in
Table 2.1, Table 2.2, Table 2.3 and Table 2.4 respectively.
Moreover, as the purpose of the project is to analyse the specimen non-
linearly, it was vital to create the table of stress-strain for each material.
Data points for each material is shown in
Table 2.1: Mechanical properties of Aluminium and EPS
Source: Fajrin et al. (2013a)
22
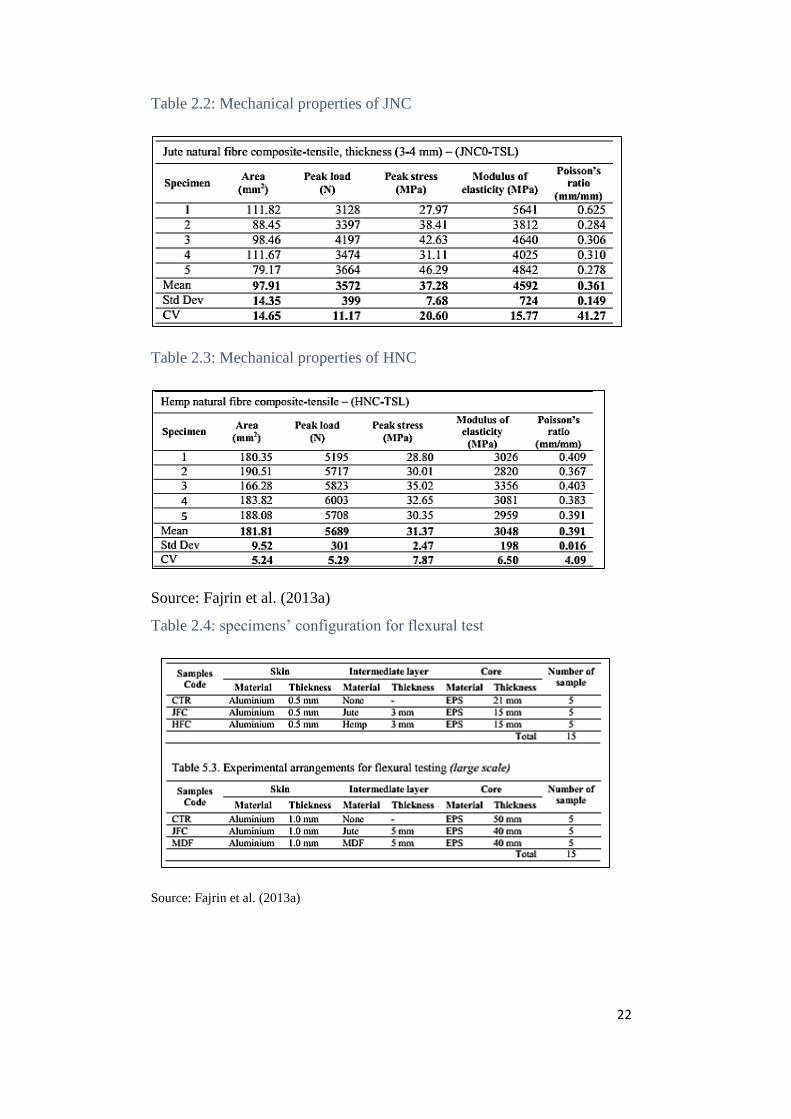
Table 2.2: Mechanical properties of JNC
Table 2.3: Mechanical properties of HNC
Source: Fajrin et al. (2013a)
Table 2.4: specimens’ configuration for flexural test
Source: Fajrin et al. (2013a)
23
(a) (b)
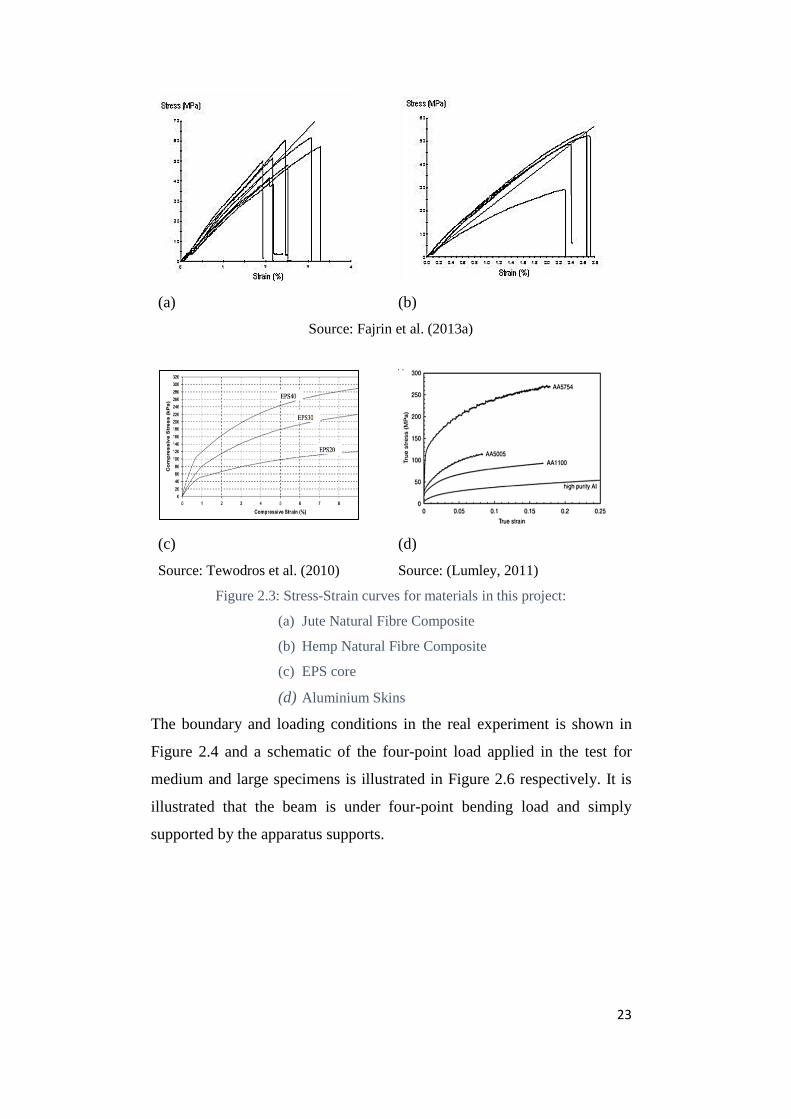
Source: Fajrin et al. (2013a)
(c) (d)
Source: Tewodros et al. (2010) Source: (Lumley, 2011)
Figure 2.3: Stress-Strain curves for materials in this project:
(a) Jute Natural Fibre Composite
(b) Hemp Natural Fibre Composite
(c) EPS core
(d) Aluminium Skins
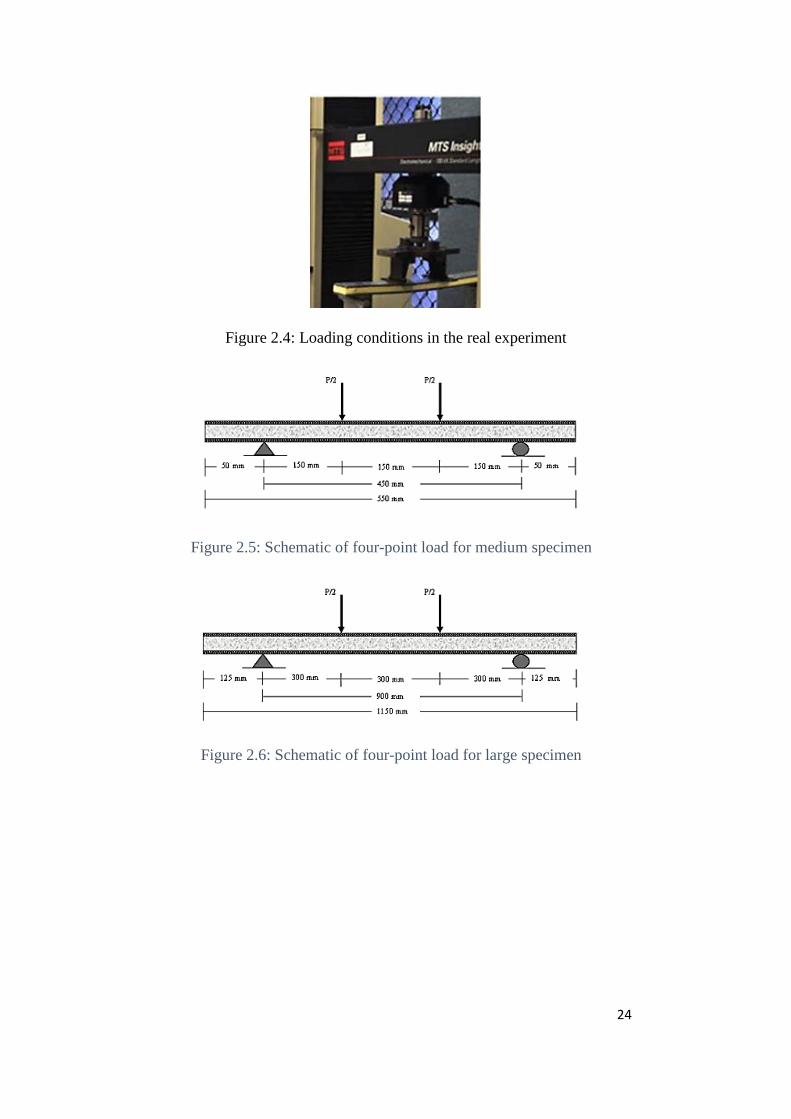
The boundary and loading conditions in the real experiment is shown in
Figure 2.4 and a schematic of the four-point load applied in the test for
medium and large specimens is illustrated in Figure 2.6 respectively. It is
illustrated that the beam is under four-point bending load and simply
supported by the apparatus supports.
24
Figure 2.4: Loading conditions in the real experiment
Figure 2.5: Schematic of four-point load for medium specimen
Figure 2.6: Schematic of four-point load for large specimen
25
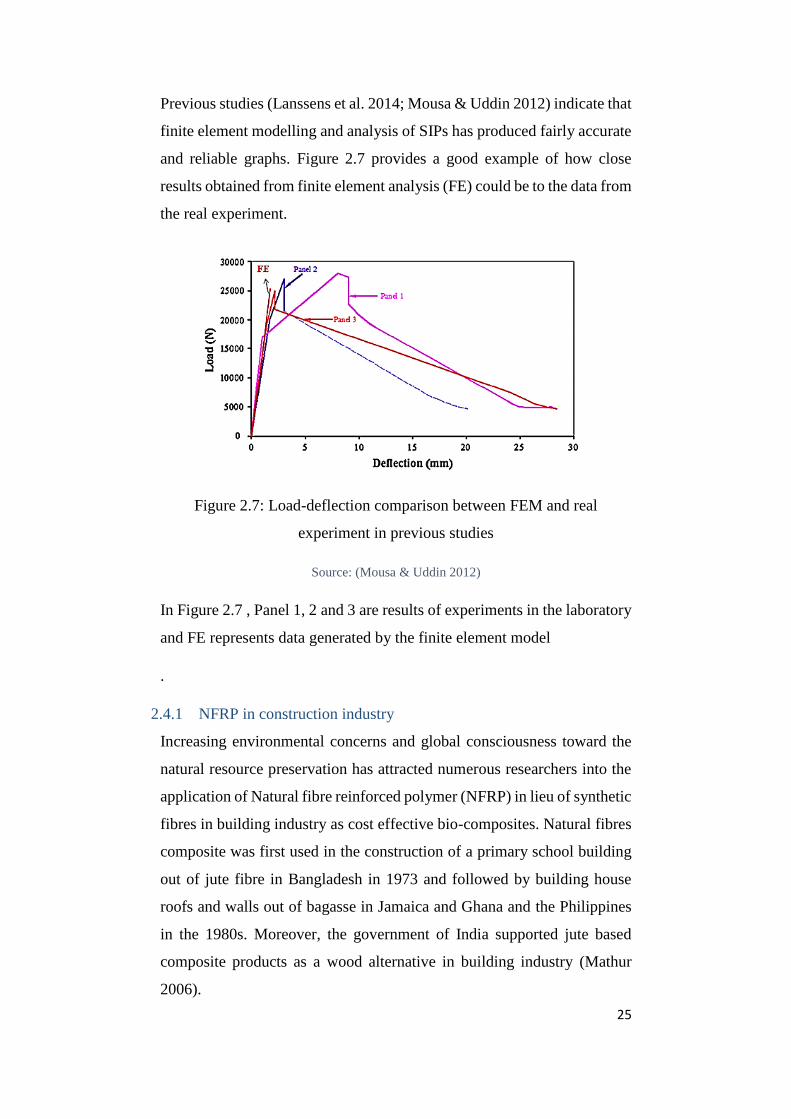
Previous studies (Lanssens et al. 2014; Mousa & Uddin 2012) indicate that
finite element modelling and analysis of SIPs has produced fairly accurate
and reliable graphs. Figure 2.7 provides a good example of how close
results obtained from finite element analysis (FE) could be to the data from
the real experiment.
Figure 2.7: Load-deflection comparison between FEM and real
experiment in previous studies
Source: (Mousa & Uddin 2012)
In Figure 2.7 , Panel 1, 2 and 3 are results of experiments in the laboratory
and FE represents data generated by the finite element model
.
2.4.1 NFRP in construction industry
Increasing environmental concerns and global consciousness toward the
natural resource preservation has attracted numerous researchers into the
application of Natural fibre reinforced polymer (NFRP) in lieu of synthetic
fibres in building industry as cost effective bio-composites. Natural fibres
composite was first used in the construction of a primary school building
out of jute fibre in Bangladesh in 1973 and followed by building house
roofs and walls out of bagasse in Jamaica and Ghana and the Philippines
in the 1980s. Moreover, the government of India supported jute based
composite products as a wood alternative in building industry (Mathur
2006).

26
NFRP advantages are their low cost, high strength, low density, bio-
degradability, environmentally friendly, non-corrosiveness and
renewability. Natural fibres are available as coconut fibre (coir), jute,
palm, hemp, abaca, sisal, bamboo, wood and paper in their natural
condition (Herrera-Franco & Valadez-González 2004). Furthermore,
(Burgueño, Quagliata, Mohanty, Mehta, Drzal &Misra 2004) stated that
natural fibre biocomposites can improve the flexural strength of load-
bearing components of a house. Moreover, (Dweib, Hu, O’Donnell,
Shenton &Wool 2004) successfully utilised natural fibres to build a bio-
based roof that meets the American standards of roof construction.
Additionally, (Nasim & Rahul 2011) used NFRP laminate as face sheet
and expanded polypropylene (EPS) as core to develop a new form of SIP
known as natural structural insulated panel (NSIP). Their study shows that
SIP conventional skin layers such as wood and glass fibre can be replaced
by NFRP laminates.
Despite many studies report the benefits of using NFRP in the construction
industry, more research needs to be done in order to reduce the cost of
NFRP and expanding knowledge towards the structural behaviour of
NFRP under loading.(Mohanty, Misra & Drzal 2005) argues that
dimensional stability, specific strength and stiffness of single layered
natural fibre based panels are far from desirable in the construction
industry. Consequently, panels should be built in multiple layers which
increase the overall cost.

27
3 Methodology
Major phases of the project from initiation towards completion are
explained in this section. After installing Strand7 on the personal
computer, it is important to have access to the manuals and tutorials that
explain how 3D models can be built in Strand7. Also, it is crucial to be
aware of how the experiment in the real world was conducted by Fajrin et
al. (2013a). Details including experiment set up, load type, specimens
dimensions, restraint conditions, material thickness and properties.
Main phases of the project are summarised as:
i) Research past papers and particularly, Fajrin et al. (2013a) in order to
acquire in-depth knowledge of the experiment and test conditions
ii) Create medium and large 3D models of SIP and NFRP in strand7
a. Model foam core using 3D brick element(Hexa8)
b. Model top and bottom skin layers in SIP by 8 node isotropic rectangular
bricks
c. Model NFRP layer by 8 nodes isotropic bricks
d. Use ‘extrude’ command to generate the foam core 3D mesh
e. Insert the data for modulus of elasticity, tensile strength, density and
elongation for aluminium, EPS and NFRP into Strand7. These values are
shown in
f. Table 2.1,Table 2.2 andTable 2.3.
g. Apply support, boundary and load conditions to each specimen
h. Run the model under various loads, NFRP layer type and thickness
iii) Record data in tables and plot the graph in Microsoft Excel
iv) Validate the results with experimental data
v) Discuss the influence of parameters in the study
28
4 Developing the 3D model
One of the major phases of this project was creating the nonlinear 3D model
of the specimen based on the real experiment conducted by Fajrin et al.
(2013a). Factors to be taken into account were global load, freedom cases,
material properties, a graph of stress versus strain for each material, load
factors and increments and checking load summation and warnings/errors at
the end of the test. The initial step was to introduce the cross section of each
specimen on XY plane and extrude the cross section in the Z axis.
The geometry of each specimen was taken from Fajrin et al (2013a) and
entered into Strand7. It is important to set up units in Strand 7 at the
beginning and stick to those units during the test. After setting up the
software units, material properties were introduced to Strand7. All
properties were taken from Fajrin et al. (2013a) as presented in section 2.4.
As the specimens were going to be analysed non-linearly, the graph of stress
versus strain for each material needed to be implemented in Strand7. Next
step was to create nodes. Nodes represent the corner of each layer with
specified thickness for that particular specimen. Then, materials were
assigned to each group of nodes, boundary conditions were introduced and
the load was applied.
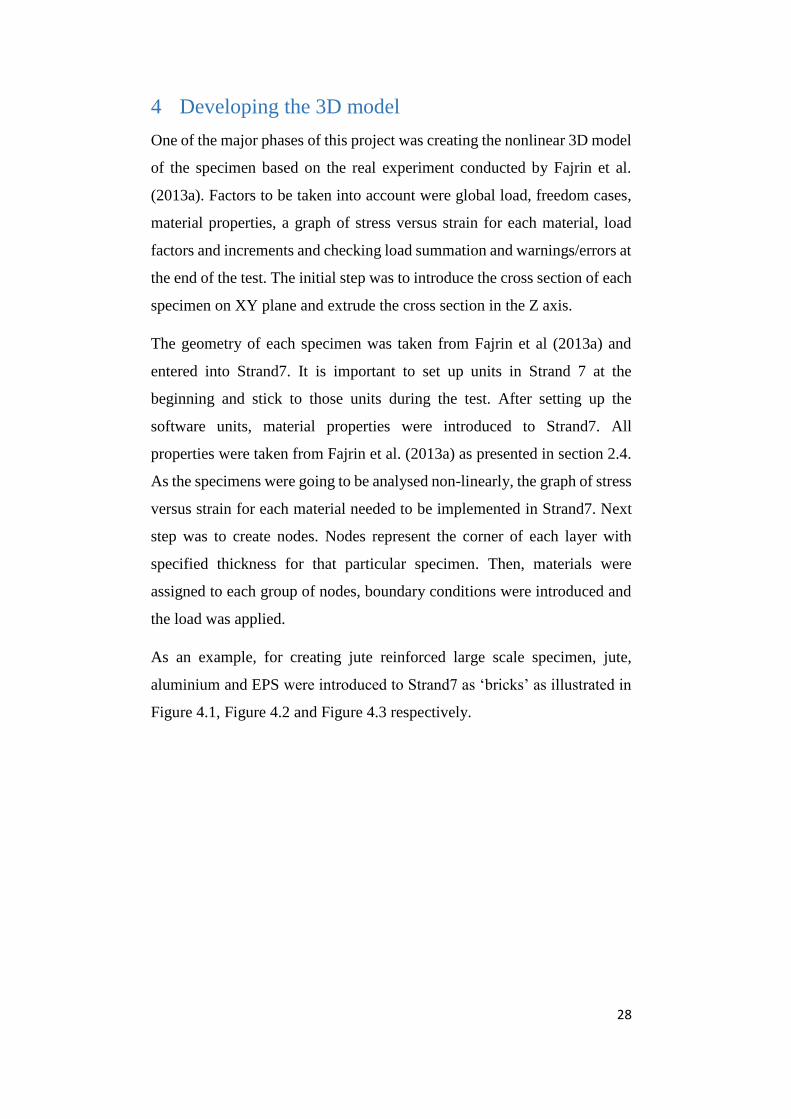
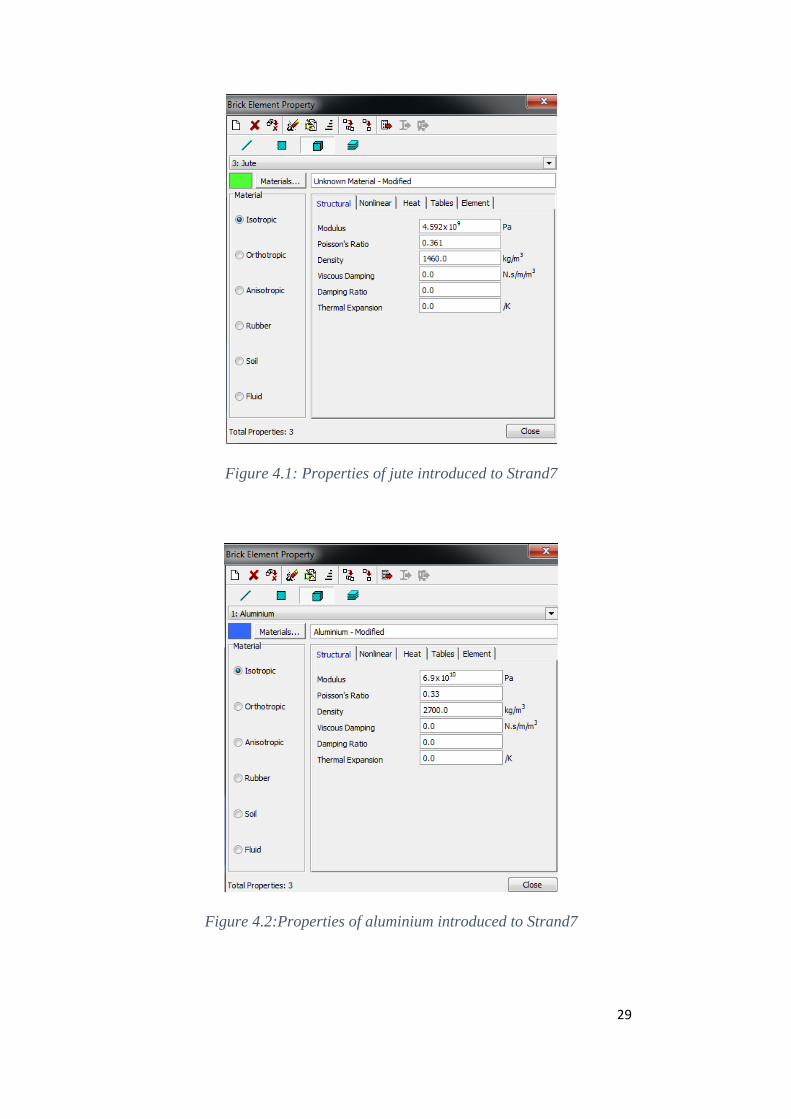
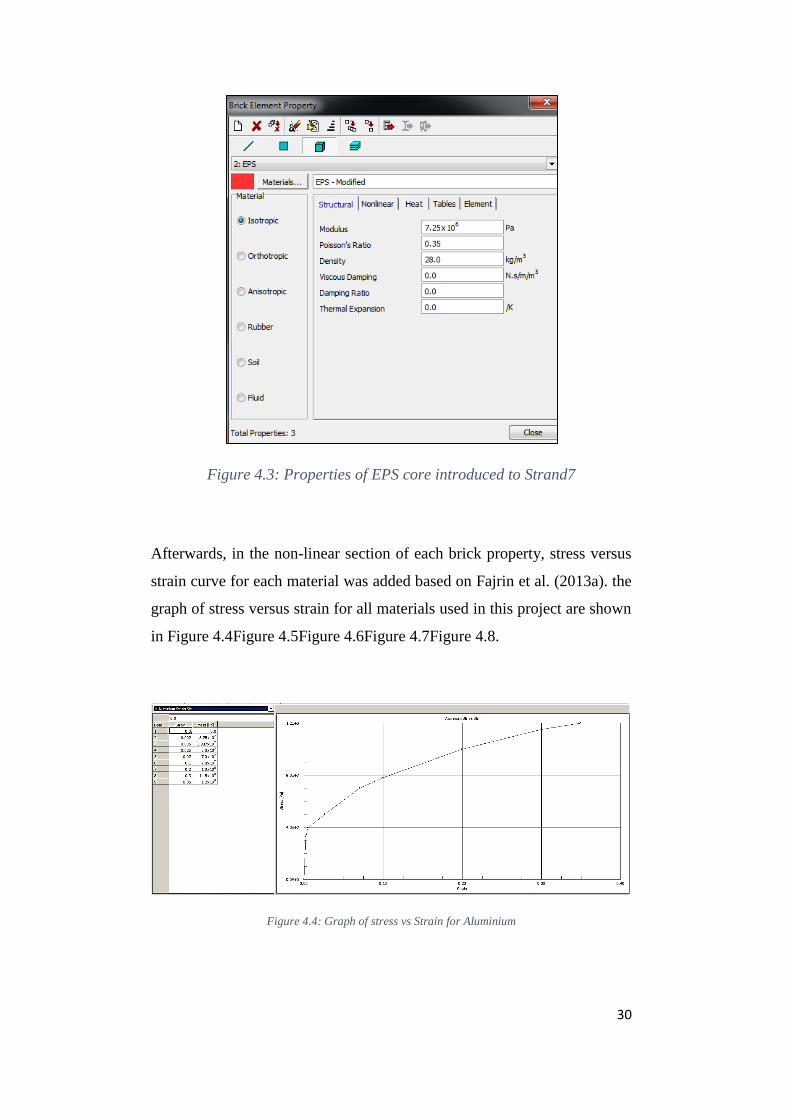
As an example, for creating jute reinforced large scale specimen, jute,
aluminium and EPS were introduced to Strand7 as ‘bricks’ as illustrated in
Figure 4.1, Figure 4.2 and Figure 4.3 respectively.
29
Figure 4.1: Properties of jute introduced to Strand7
Figure 4.2:Properties of aluminium introduced to Strand7
30
Figure 4.3: Properties of EPS core introduced to Strand7
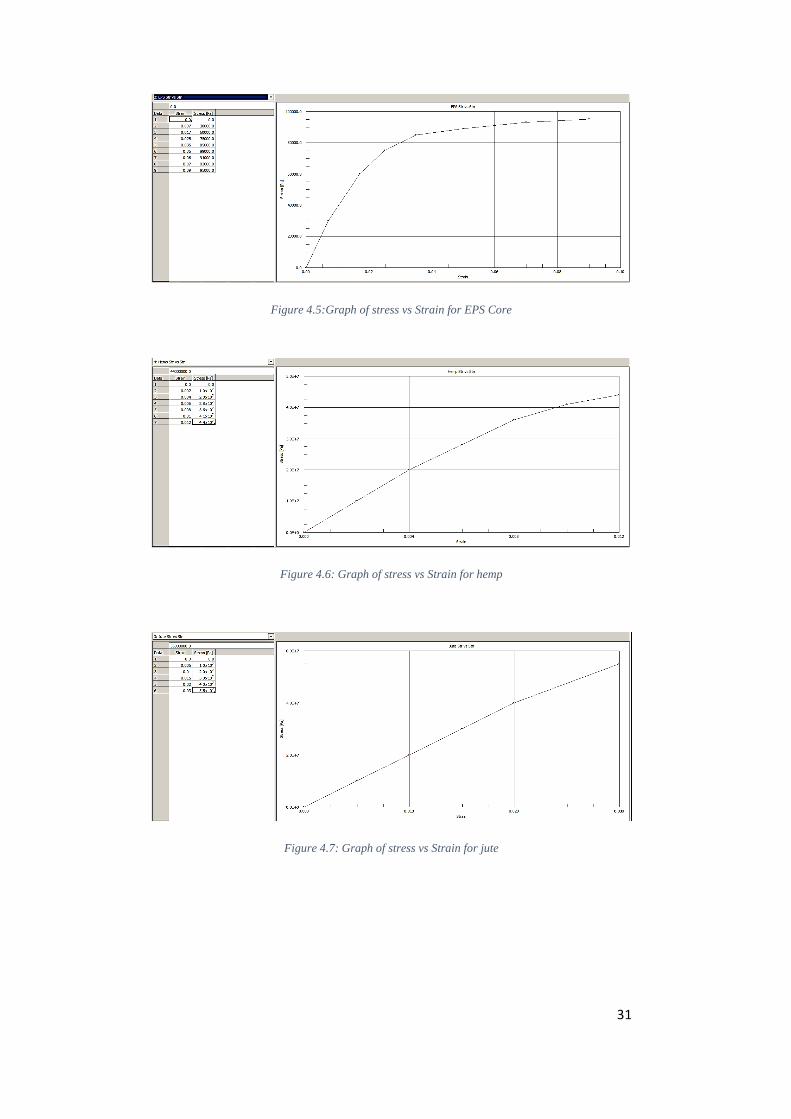
Afterwards, in the non-linear section of each brick property, stress versus
strain curve for each material was added based on Fajrin et al. (2013a). the
graph of stress versus strain for all materials used in this project are shown
in Figure 4.4Figure 4.5Figure 4.6Figure 4.7Figure 4.8.
Figure 4.4: Graph of stress vs Strain for Aluminium
31
Figure 4.5:Graph of stress vs Strain for EPS Core
Figure 4.6: Graph of stress vs Strain for hemp
Figure 4.7: Graph of stress vs Strain for jute
32
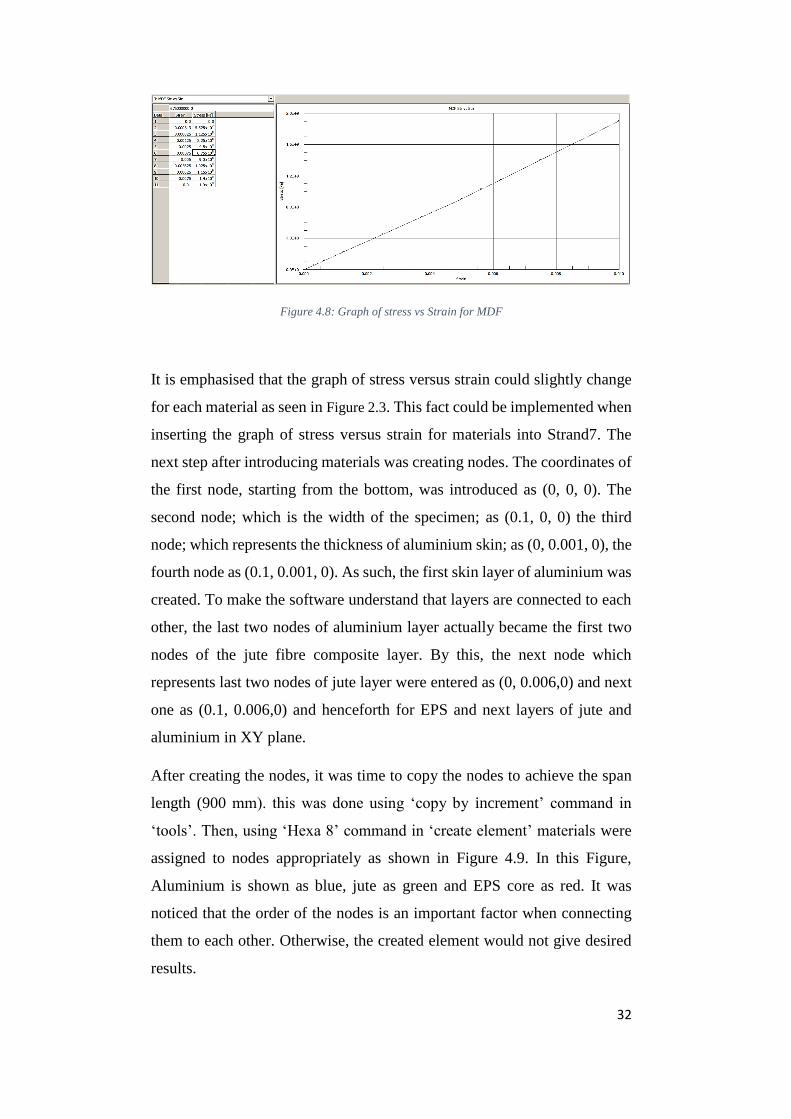
Figure 4.8: Graph of stress vs Strain for MDF
It is emphasised that the graph of stress versus strain could slightly change
for each material as seen in Figure 2.3. This fact could be implemented when
inserting the graph of stress versus strain for materials into Strand7. The
next step after introducing materials was creating nodes. The coordinates of
the first node, starting from the bottom, was introduced as (0, 0, 0). The
second node; which is the width of the specimen; as (0.1, 0, 0) the third
node; which represents the thickness of aluminium skin; as (0, 0.001, 0), the
fourth node as (0.1, 0.001, 0). As such, the first skin layer of aluminium was
created. To make the software understand that layers are connected to each
other, the last two nodes of aluminium layer actually became the first two
nodes of the jute fibre composite layer. By this, the next node which
represents last two nodes of jute layer were entered as (0, 0.006,0) and next
one as (0.1, 0.006,0) and henceforth for EPS and next layers of jute and
aluminium in XY plane.
After creating the nodes, it was time to copy the nodes to achieve the span
length (900 mm). this was done using ‘copy by increment’ command in
‘tools’. Then, using ‘Hexa 8’ command in ‘create element’ materials were
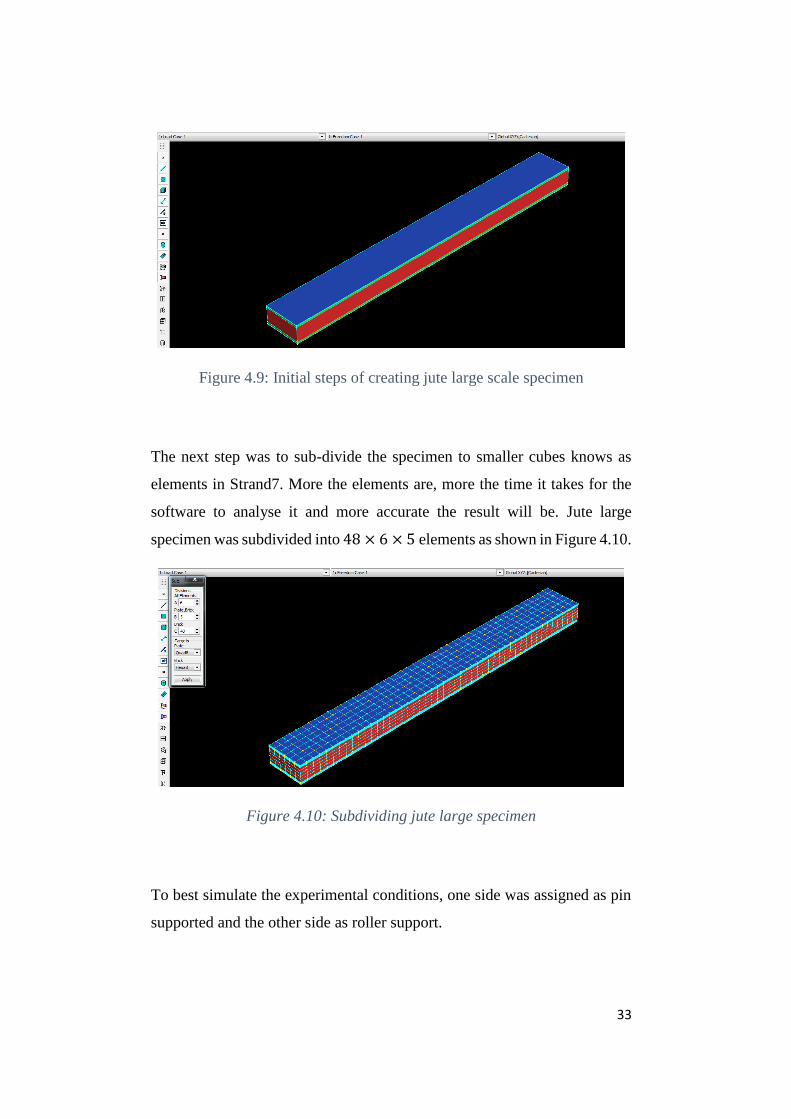
assigned to nodes appropriately as shown in Figure 4.9. In this Figure,
Aluminium is shown as blue, jute as green and EPS core as red. It was
noticed that the order of the nodes is an important factor when connecting
them to each other. Otherwise, the created element would not give desired
results.
33
Figure 4.9: Initial steps of creating jute large scale specimen
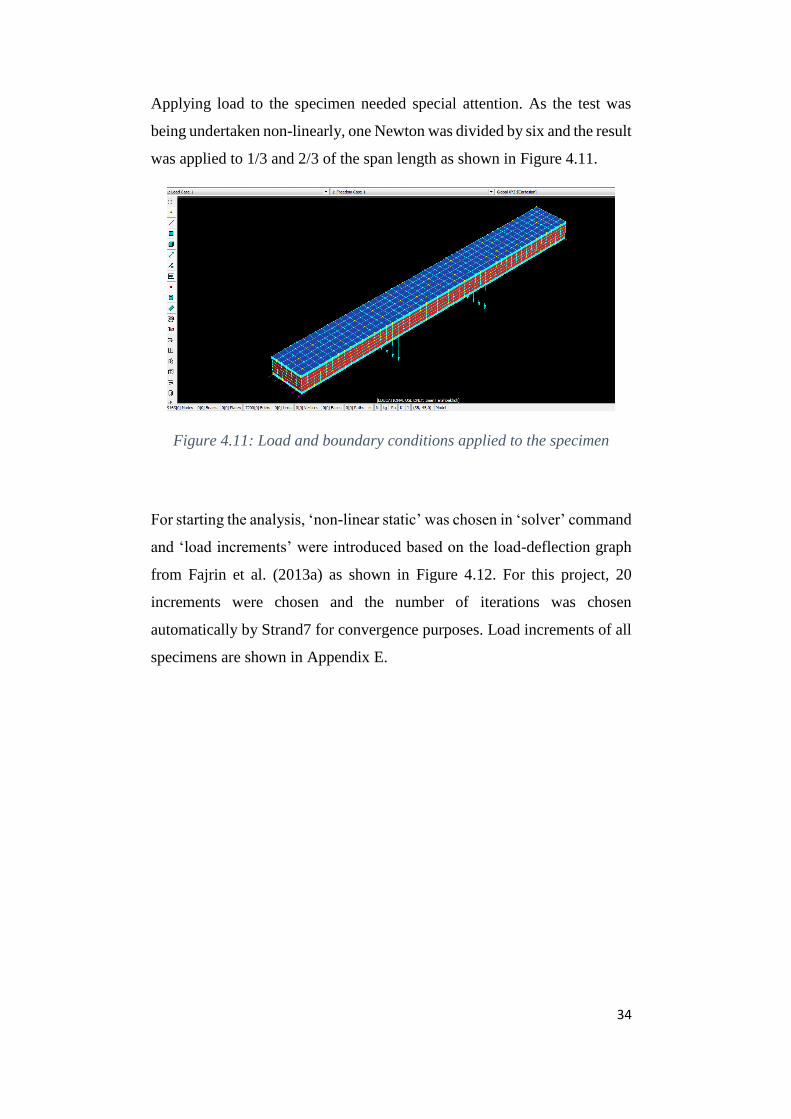
The next step was to sub-divide the specimen to smaller cubes knows as
elements in Strand7. More the elements are, more the time it takes for the
software to analyse it and more accurate the result will be. Jute large
specimen was subdivided into 48 × 6 × 5 elements as shown in Figure 4.10.
Figure 4.10: Subdividing jute large specimen
To best simulate the experimental conditions, one side was assigned as pin
supported and the other side as roller support.
34
Applying load to the specimen needed special attention. As the test was
being undertaken non-linearly, one Newton was divided by six and the result
was applied to 1/3 and 2/3 of the span length as shown in Figure 4.11.
Figure 4.11: Load and boundary conditions applied to the specimen
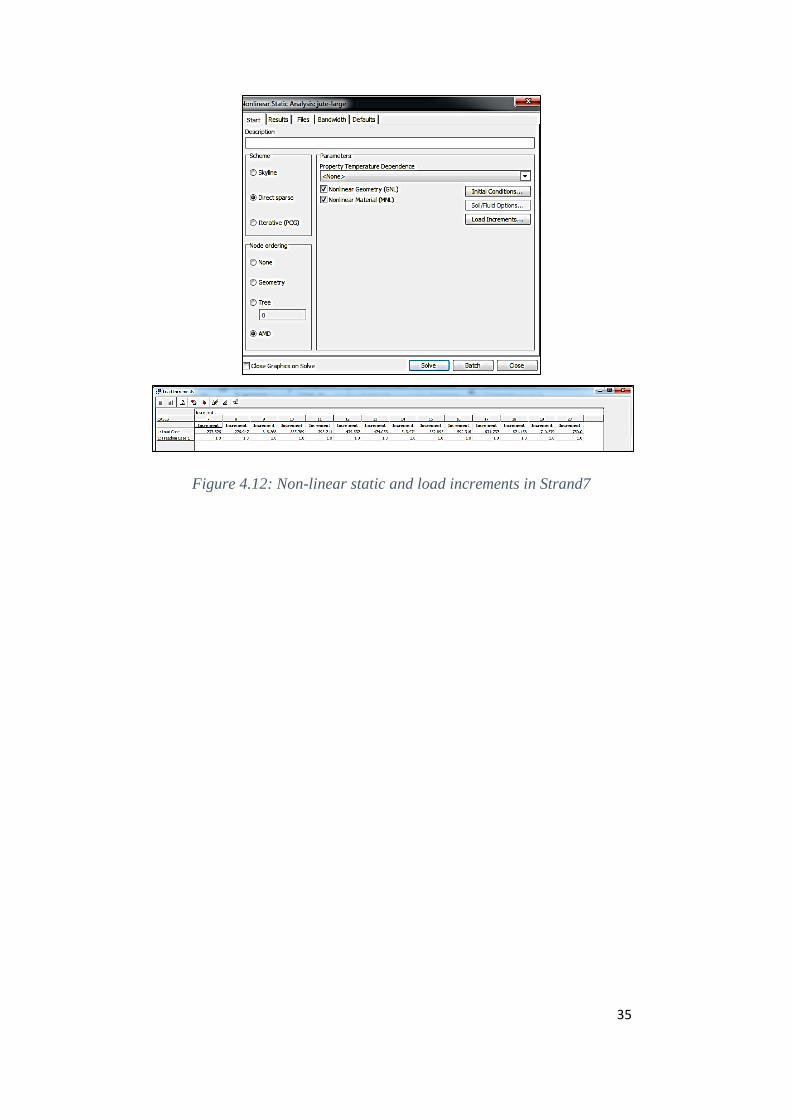
For starting the analysis, ‘non-linear static’ was chosen in ‘solver’ command
and ‘load increments’ were introduced based on the load-deflection graph
from Fajrin et al. (2013a) as shown in Figure 4.12. For this project, 20
increments were chosen and the number of iterations was chosen
automatically by Strand7 for convergence purposes. Load increments of all
specimens are shown in Appendix E.
35
Figure 4.12: Non-linear static and load increments in Strand7
36
5 Results and discussion
In this section, results from the 3D model will be discussed and analysed.
Also, these results will be compared against Fajrin et al. (2013a) for the
validation purposes. Results will indicate whether the addition of an
intermediate layer to SIPs will enhance the flexural properties of the panel
or not. The graph of load versus deflection for each specimen was drawn
and scaled into the experimental results in order to facilitate the comparison
and validation purposes. Moreover, stress distribution in each sample was
shown and discussed. It was noted that in the real experiment, the results
were based on normalisation process in which the outliner data were not
taken into account for calculation purposes.
It was found that in medium scale specimens, in average, adding an
intermediate layer of jute and hemp fibre to the conventional sandwich panel
will increase the load carrying capacity of the panel by 30% and 90%
respectively. The 60% difference in the results indicated that hemp natural
fibres have better performance under flexural loading in sandwich panels. It
was also found that control specimen (without intermediate layer) and
specimens with hemp intermediate layer had a higher level of stiffness than
those with jute intermediate layer.
Results from large specimen analysis indicated that in average, load carrying
capacity of the control specimen increased by 63% in specimens with jute
intermediate layer and 170% in the specimen with MDF intermediate layer.
It was also found that addition of a natural fibre intermediate layer to the
conventional sandwich panel decreased the maximum normal stress in the
compression and tension layers of the specimen which enabled the specimen
to carry more bending load compared to the specimen without an
intermediate layer.
5.1 Comparison of load-deflection behaviour of specimens
Results acquired from Strand7 are illustrated and compared against results
from the real experiment. It was found that in general, 3D models created
by Strand7 were able to predict the behaviour of the control and hybrid
37
specimen with an acceptable level of accuracy. However, the ultimate
failure load of the specimen was not achieved in this project due to
delamination failure of the specimen in a real experiment. It will be
discussed in more details in ‘The recommendation for further work’ chapter.
5.1.1 Medium specimens
The load-deflection graphs of medium scaled sandwich panels are shown in
this section. It was seen that the behaviour of all samples followed a similar
non-linear pattern which indicated the existence of a ductile material in the
specimens. Resultant curves did not show any yield point, however, the load
carrying capacity decreased sharply at the end of the plastic region which
was a sign of initial failure. From this behaviour, it could be anticipated that
the failure of the specimens would occur due to shear failure of the EPS
core. The graphs illustrated a linear behaviour at the beginning which
followed a non-linear pattern at the end.
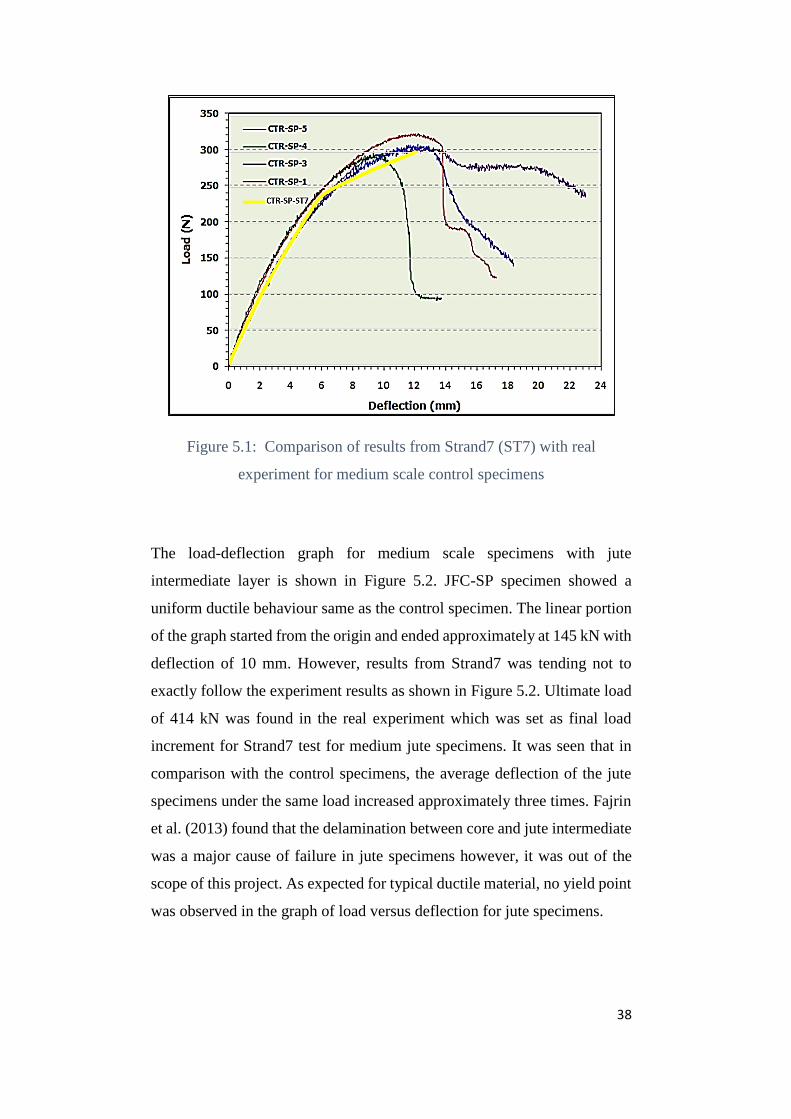
In CTR samples as illustrated in Figure 5.1, it was seen that specimens
showed a linear pattern until 105 N and 2.1 mm, then the graph initiated the
non-linear portion until its final failure. As mentioned earlier, the final
failure load was obtained from the real experiment and introduced to
Strand7 models to stop the test in that load. Result for control specimen from
Strand7 is shown as CRT-SP-ST7 and compared against results from the
real experiment. As expected, the behaviour of the panel under bending load
was dominantly controlled by the aluminium face sheets.
38
Figure 5.1: Comparison of results from Strand7 (ST7) with real
experiment for medium scale control specimens
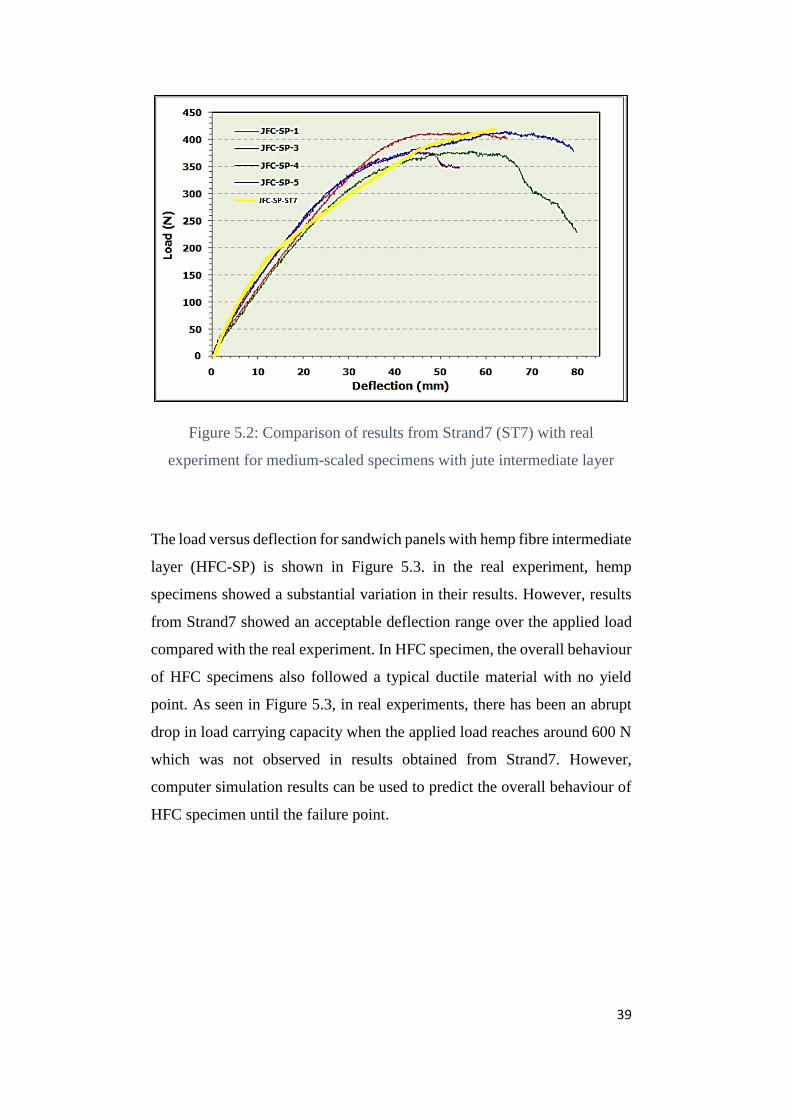
The load-deflection graph for medium scale specimens with jute
intermediate layer is shown in Figure 5.2. JFC-SP specimen showed a
uniform ductile behaviour same as the control specimen. The linear portion
of the graph started from the origin and ended approximately at 145 kN with
deflection of 10 mm. However, results from Strand7 was tending not to
exactly follow the experiment results as shown in Figure 5.2. Ultimate load
of 414 kN was found in the real experiment which was set as final load
increment for Strand7 test for medium jute specimens. It was seen that in
comparison with the control specimens, the average deflection of the jute
specimens under the same load increased approximately three times. Fajrin
et al. (2013) found that the delamination between core and jute intermediate
was a major cause of failure in jute specimens however, it was out of the
scope of this project. As expected for typical ductile material, no yield point
was observed in the graph of load versus deflection for jute specimens.
39
Figure 5.2: Comparison of results from Strand7 (ST7) with real
experiment for medium-scaled specimens with jute intermediate layer
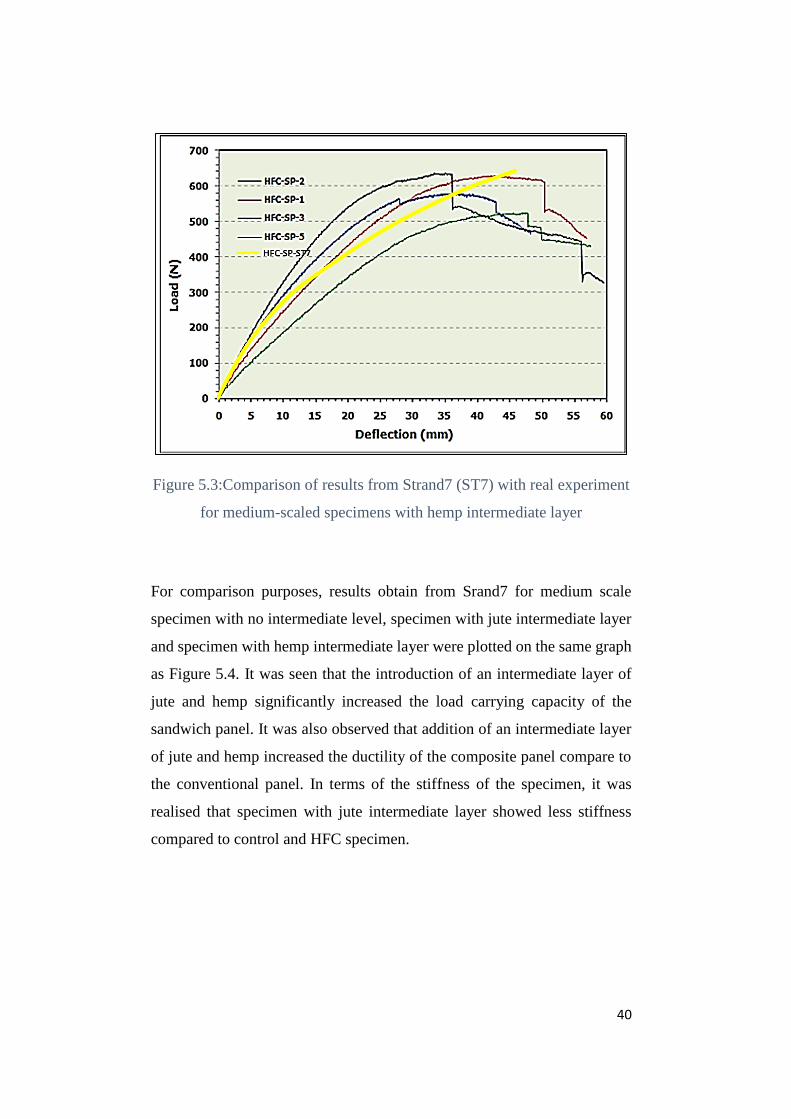
The load versus deflection for sandwich panels with hemp fibre intermediate
layer (HFC-SP) is shown in Figure 5.3. in the real experiment, hemp
specimens showed a substantial variation in their results. However, results
from Strand7 showed an acceptable deflection range over the applied load
compared with the real experiment. In HFC specimen, the overall behaviour
of HFC specimens also followed a typical ductile material with no yield
point. As seen in Figure 5.3, in real experiments, there has been an abrupt
drop in load carrying capacity when the applied load reaches around 600 N
which was not observed in results obtained from Strand7. However,
computer simulation results can be used to predict the overall behaviour of
HFC specimen until the failure point.
40
Figure 5.3:Comparison of results from Strand7 (ST7) with real experiment
for medium-scaled specimens with hemp intermediate layer
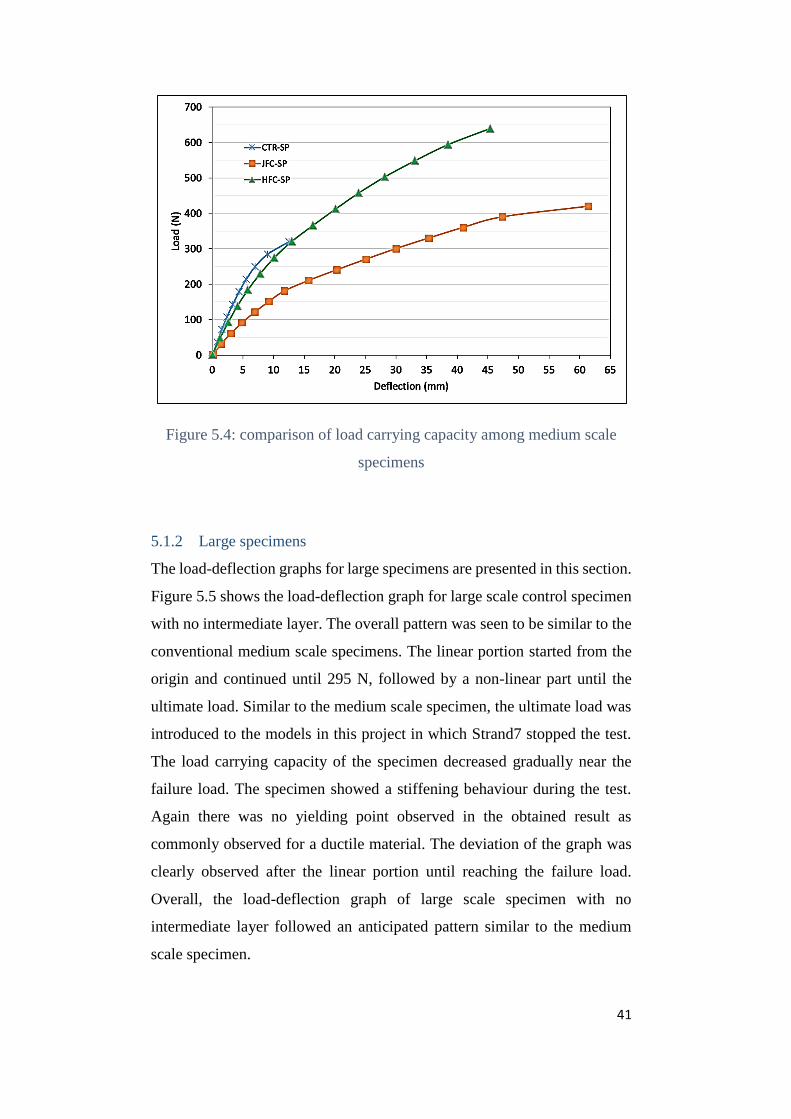
For comparison purposes, results obtain from Srand7 for medium scale
specimen with no intermediate level, specimen with jute intermediate layer
and specimen with hemp intermediate layer were plotted on the same graph
as Figure 5.4. It was seen that the introduction of an intermediate layer of
jute and hemp significantly increased the load carrying capacity of the
sandwich panel. It was also observed that addition of an intermediate layer
of jute and hemp increased the ductility of the composite panel compare to
the conventional panel. In terms of the stiffness of the specimen, it was
realised that specimen with jute intermediate layer showed less stiffness
compared to control and HFC specimen.
41
Figure 5.4: comparison of load carrying capacity among medium scale
specimens
5.1.2 Large specimens
The load-deflection graphs for large specimens are presented in this section.
Figure 5.5 shows the load-deflection graph for large scale control specimen
with no intermediate layer. The overall pattern was seen to be similar to the
conventional medium scale specimens. The linear portion started from the
origin and continued until 295 N, followed by a non-linear part until the
ultimate load. Similar to the medium scale specimen, the ultimate load was
introduced to the models in this project in which Strand7 stopped the test.
The load carrying capacity of the specimen decreased gradually near the
failure load. The specimen showed a stiffening behaviour during the test.
Again there was no yielding point observed in the obtained result as
commonly observed for a ductile material. The deviation of the graph was
clearly observed after the linear portion until reaching the failure load.
Overall, the load-deflection graph of large scale specimen with no
intermediate layer followed an anticipated pattern similar to the medium
scale specimen.
42
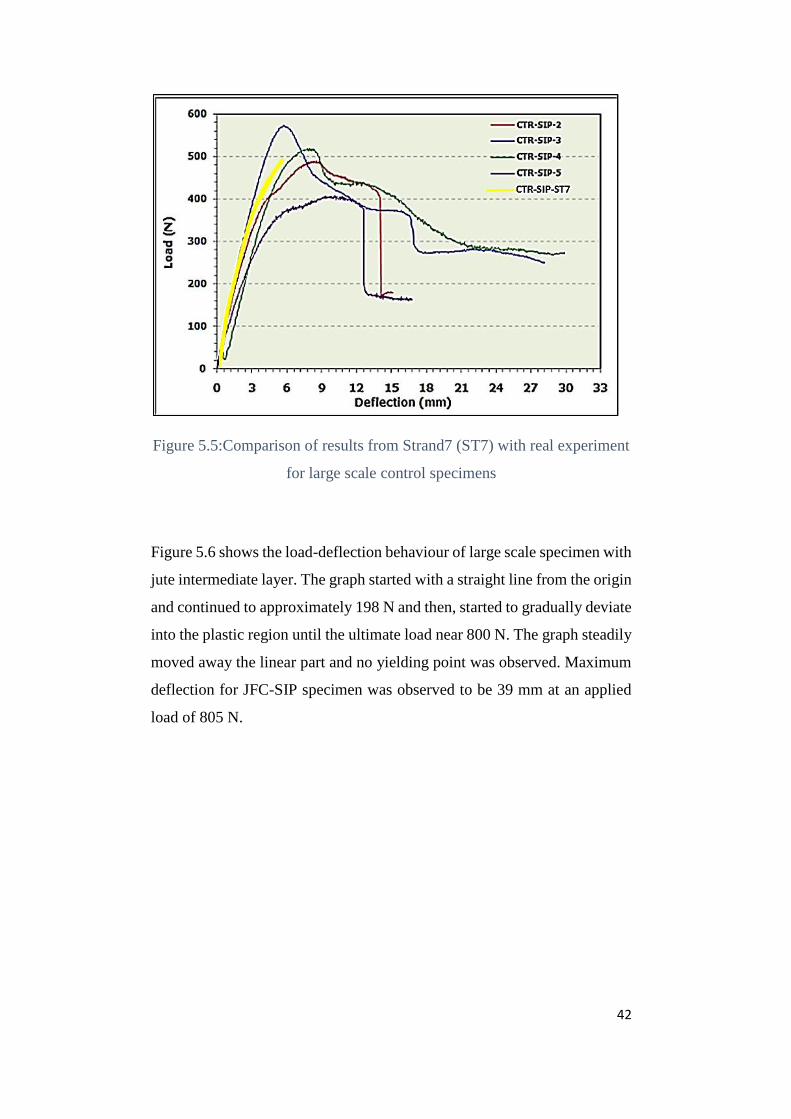
Figure 5.5:Comparison of results from Strand7 (ST7) with real experiment
for large scale control specimens
Figure 5.6 shows the load-deflection behaviour of large scale specimen with
jute intermediate layer. The graph started with a straight line from the origin
and continued to approximately 198 N and then, started to gradually deviate
into the plastic region until the ultimate load near 800 N. The graph steadily
moved away the linear part and no yielding point was observed. Maximum
deflection for JFC-SIP specimen was observed to be 39 mm at an applied
load of 805 N.
43
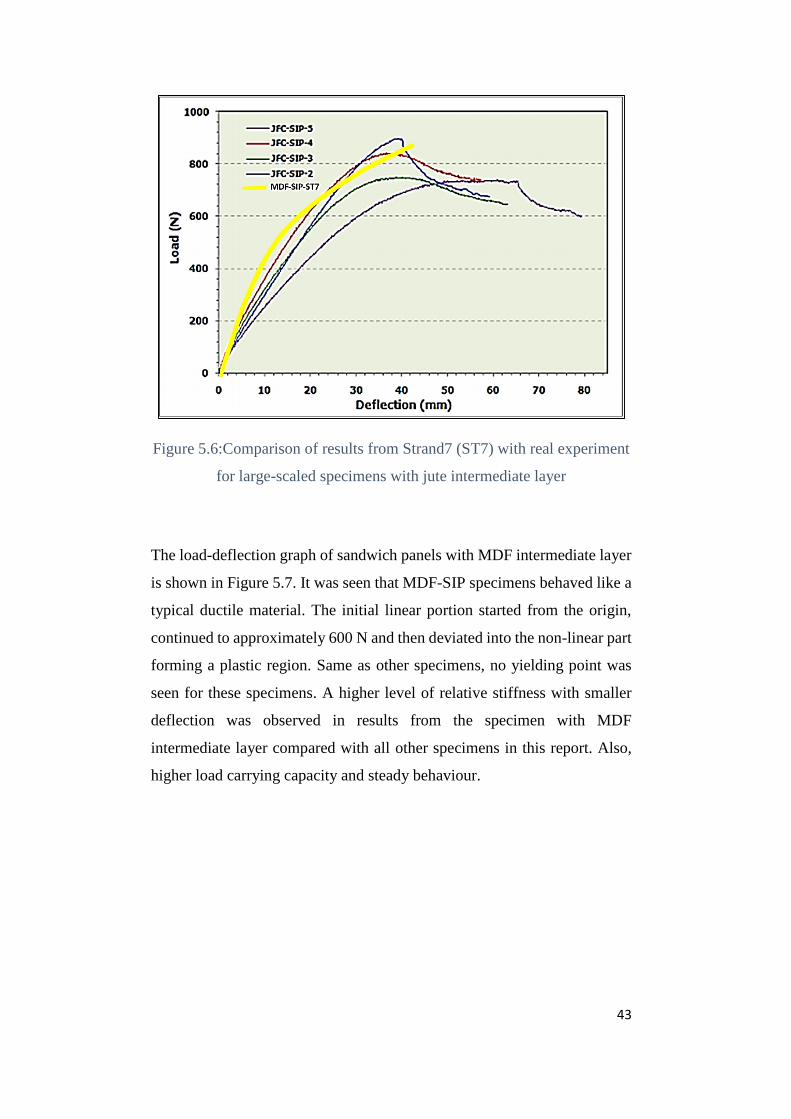
Figure 5.6:Comparison of results from Strand7 (ST7) with real experiment
for large-scaled specimens with jute intermediate layer
The load-deflection graph of sandwich panels with MDF intermediate layer
is shown in Figure 5.7. It was seen that MDF-SIP specimens behaved like a
typical ductile material. The initial linear portion started from the origin,
continued to approximately 600 N and then deviated into the non-linear part
forming a plastic region. Same as other specimens, no yielding point was
seen for these specimens. A higher level of relative stiffness with smaller
deflection was observed in results from the specimen with MDF
intermediate layer compared with all other specimens in this report. Also,
higher load carrying capacity and steady behaviour.
44
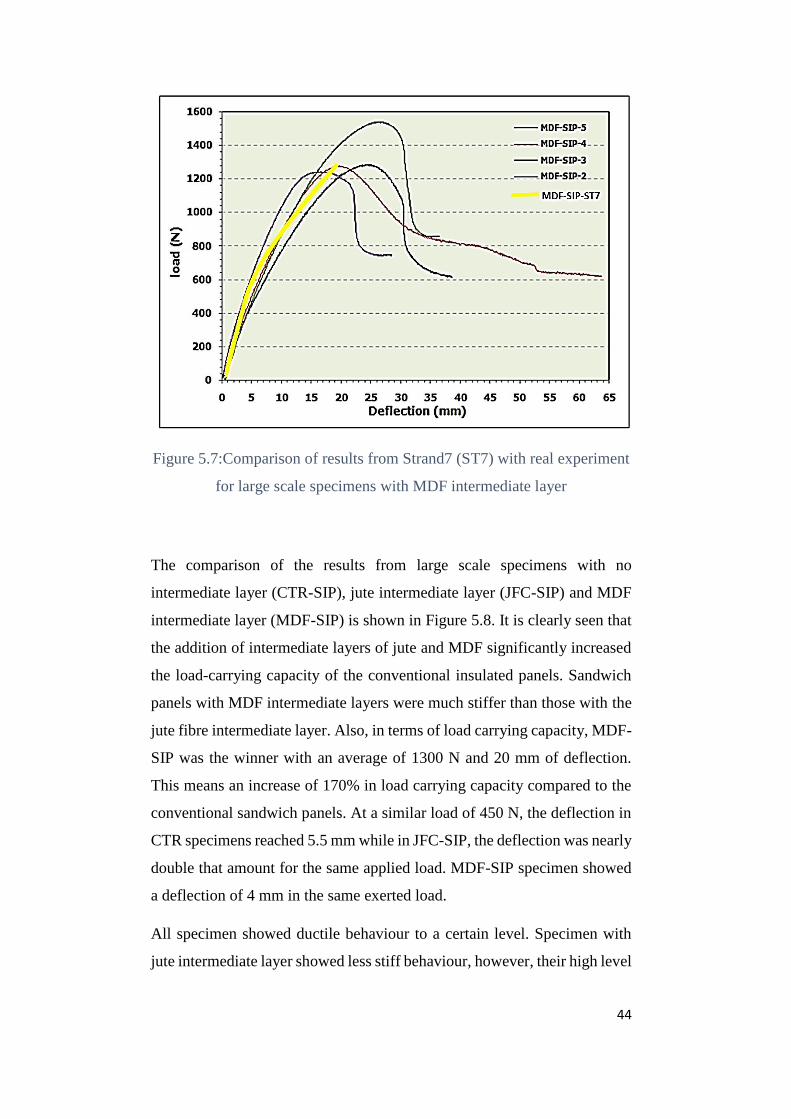
Figure 5.7:Comparison of results from Strand7 (ST7) with real experiment
for large scale specimens with MDF intermediate layer
The comparison of the results from large scale specimens with no
intermediate layer (CTR-SIP), jute intermediate layer (JFC-SIP) and MDF
intermediate layer (MDF-SIP) is shown in Figure 5.8. It is clearly seen that
the addition of intermediate layers of jute and MDF significantly increased
the load-carrying capacity of the conventional insulated panels. Sandwich
panels with MDF intermediate layers were much stiffer than those with the
jute fibre intermediate layer. Also, in terms of load carrying capacity, MDF-
SIP was the winner with an average of 1300 N and 20 mm of deflection.
This means an increase of 170% in load carrying capacity compared to the
conventional sandwich panels. At a similar load of 450 N, the deflection in
CTR specimens reached 5.5 mm while in JFC-SIP, the deflection was nearly
double that amount for the same applied load. MDF-SIP specimen showed
a deflection of 4 mm in the same exerted load.
All specimen showed ductile behaviour to a certain level. Specimen with
jute intermediate layer showed less stiff behaviour, however, their high level
45
of ductility, compared to CTR-SIP and MDF-SIP specimens, makes them
suitable to be utilised in the building industry.
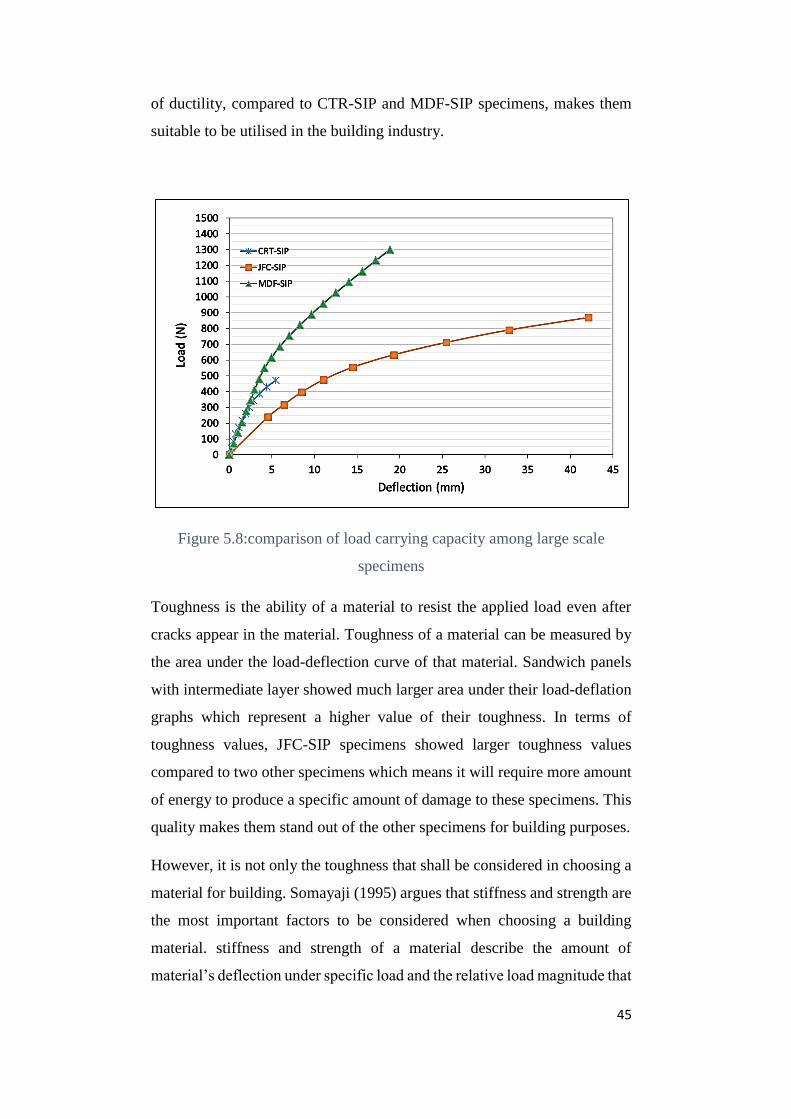
Figure 5.8:comparison of load carrying capacity among large scale
specimens
Toughness is the ability of a material to resist the applied load even after
cracks appear in the material. Toughness of a material can be measured by
the area under the load-deflection curve of that material. Sandwich panels
with intermediate layer showed much larger area under their load-deflation
graphs which represent a higher value of their toughness. In terms of
toughness values, JFC-SIP specimens showed larger toughness values
compared to two other specimens which means it will require more amount
of energy to produce a specific amount of damage to these specimens. This
quality makes them stand out of the other specimens for building purposes.
However, it is not only the toughness that shall be considered in choosing a
material for building. Somayaji (1995) argues that stiffness and strength are
the most important factors to be considered when choosing a building
material. stiffness and strength of a material describe the amount of
material’s deflection under specific load and the relative load magnitude that
46
the material is able to take before failure. These characteristics relate to the
elastic range of the load-deflection graph and stress-strain graph. Relatively
large deflection of sandwich panels is another important factor to be
considered when choosing a material for building purposes.
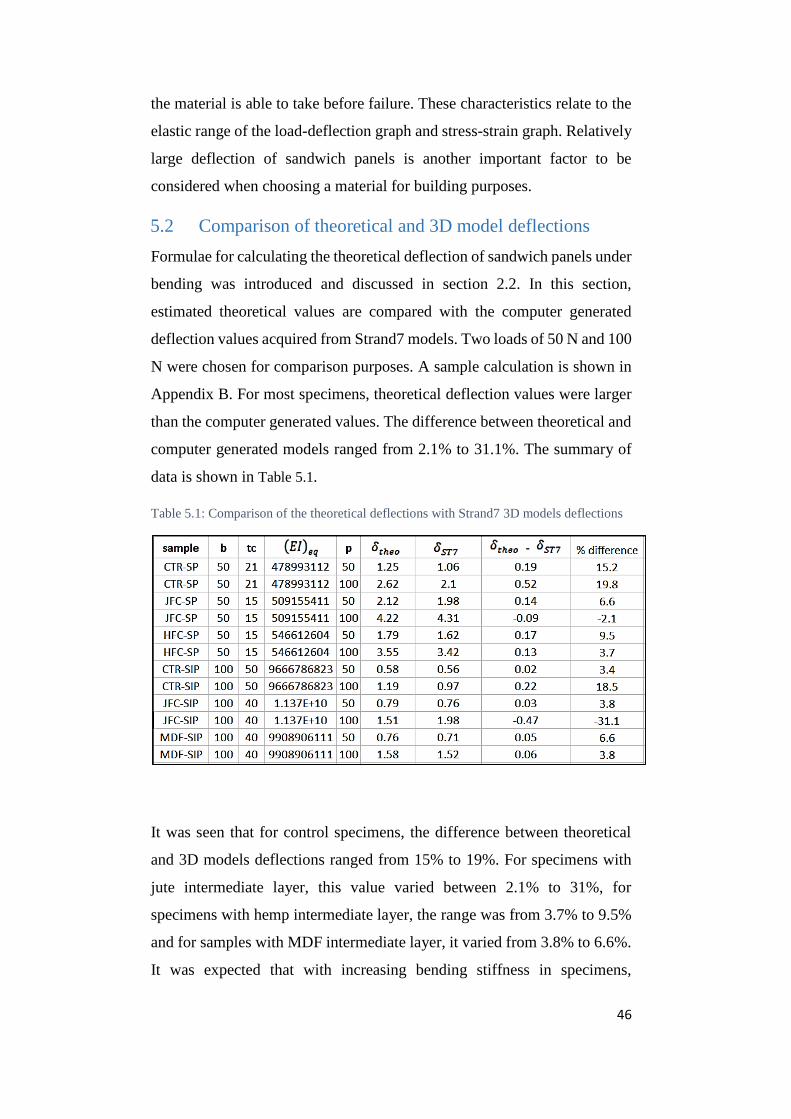
5.2 Comparison of theoretical and 3D model deflections
Formulae for calculating the theoretical deflection of sandwich panels under
bending was introduced and discussed in section 2.2. In this section,
estimated theoretical values are compared with the computer generated
deflection values acquired from Strand7 models. Two loads of 50 N and 100
N were chosen for comparison purposes. A sample calculation is shown in
Appendix B. For most specimens, theoretical deflection values were larger
than the computer generated values. The difference between theoretical and
computer generated models ranged from 2.1% to 31.1%. The summary of
data is shown in Table 5.1.
Table 5.1: Comparison of the theoretical deflections with Strand7 3D models deflections
It was seen that for control specimens, the difference between theoretical
and 3D models deflections ranged from 15% to 19%. For specimens with
jute intermediate layer, this value varied between 2.1% to 31%, for
specimens with hemp intermediate layer, the range was from 3.7% to 9.5%
and for samples with MDF intermediate layer, it varied from 3.8% to 6.6%.
It was expected that with increasing bending stiffness in specimens,
47
deflection decreases. However, it was seen that this theory could be not
always true. In JFC specimens, the deflection of the panel was much higher
than those without any intermediate layer under the same load.
Medium specimens with jute and hemp intermediate layer had the
theoretical deflection value of 2.12 and 1.79 mm under 50 N of applied load.
While, control specimen had the theoretical value of 1.25 mm. It was due to
the bending and shear deformation of the core that contributed to the overall
deflection of the panel. It was understood that the overall bending deflection
would have had smaller values without shear deflection of the core. This
finding was confirmed by Sharaf et al (2010) that stated that the shear
deformation was a major contributor to the overall deflection of sandwich
panels with low-density cores under bending. They stated that about 75% of
the overall deflection of sandwich panels was caused by shear deformation
of the soft core. However, they reported this fraction to be about 50% for
sandwich panels with a hard core.
Considering the significance of the shear deformation in sandwich panels
with a soft core, the geometric characteristics of the specimen including the
width and the core thickness, are of crucial factors in the value of the overall
deflection. Control specimen, have a larger core thickness compared to
specimens with jute and hemp intermediate layers. It can be seen that the
overall deflection of CTR panels is less than those counterparts.
In the large scale specimens, similar to medium scale ones, the theoretical
deflection of the panel was in a reasonable agreement with the deflections
obtained in 3D models. It was seen that the deflection values from the 3D
models were lower than the theoretical values. For the control specimens,
the difference between the Strand7 results and theoretical deflection values
ranged from 3.4% to 18.5%. This value was between 3.8% to 31.1% for
specimens with jute intermediate level and 3.8% to 6.6% for specimens with
MDF intermediate layer. It was noticed that the contribution of the shear
deformation in overall deflection of the specimens was remarkable having
a range between 86% to 94% of the overall deflection. This meant that the
contribution of the bending deflection was between 6% to 14%. A higher
48
value of bending stiffness was observed in the specimens with intermediate
layer however, larger deflections were seen due to thinner core. Therefore,
it can be argued that the introduction of intermediate layer did not result in
reduction in the deflection of the specimens as the main contributor to the
overall deflection of the panels was the shear deformation of the core.
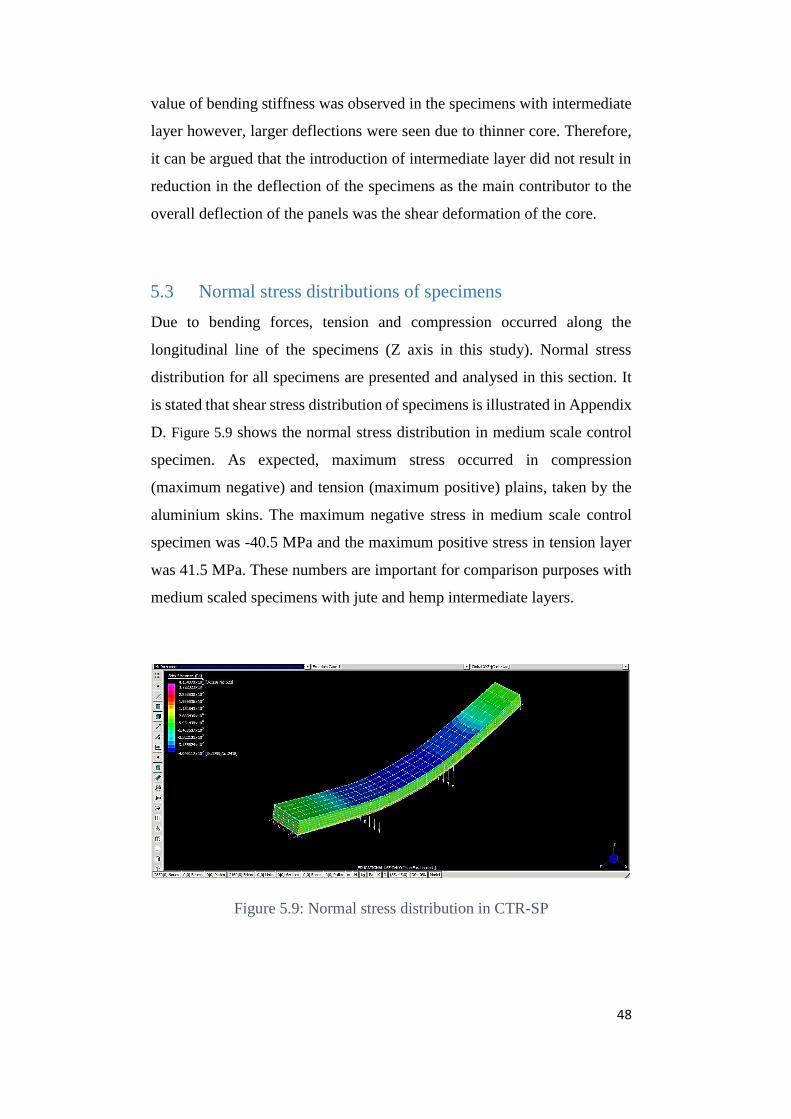
5.3 Normal stress distributions of specimens
Due to bending forces, tension and compression occurred along the
longitudinal line of the specimens (Z axis in this study). Normal stress
distribution for all specimens are presented and analysed in this section. It
is stated that shear stress distribution of specimens is illustrated in Appendix
D. Figure 5.9 shows the normal stress distribution in medium scale control
specimen. As expected, maximum stress occurred in compression
(maximum negative) and tension (maximum positive) plains, taken by the
aluminium skins. The maximum negative stress in medium scale control
specimen was -40.5 MPa and the maximum positive stress in tension layer
was 41.5 MPa. These numbers are important for comparison purposes with
medium scaled specimens with jute and hemp intermediate layers.
Figure 5.9: Normal stress distribution in CTR-SP
49
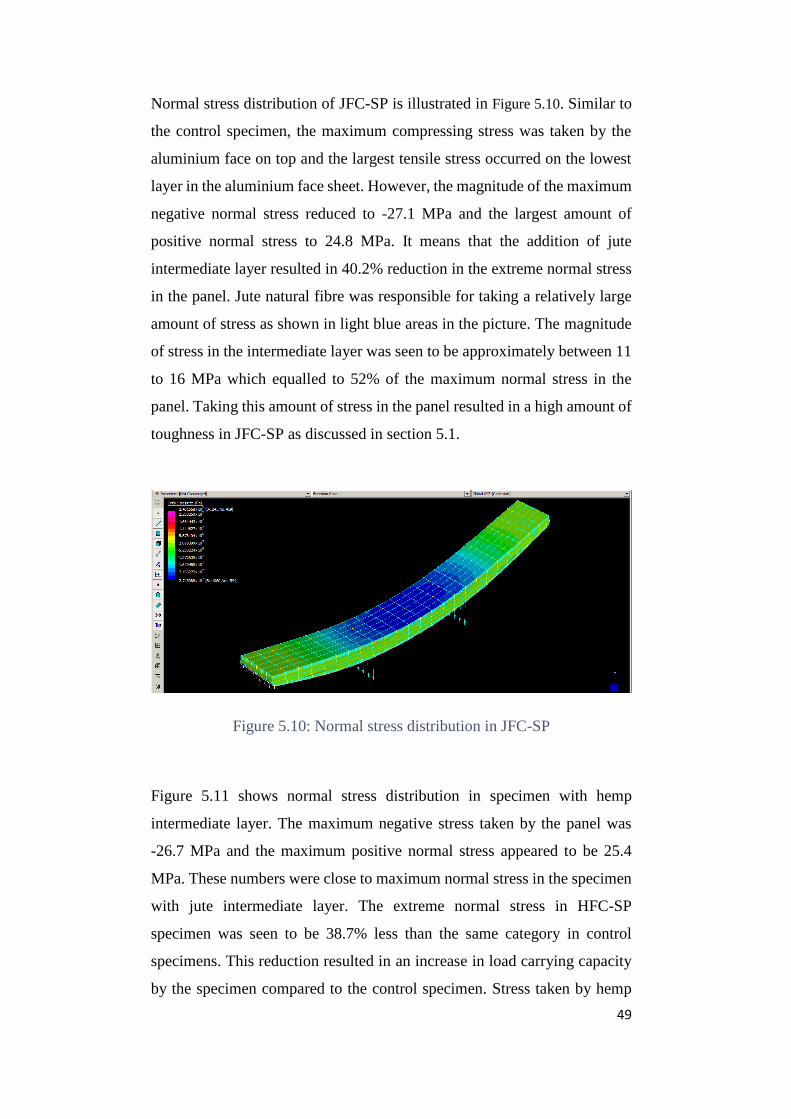
Normal stress distribution of JFC-SP is illustrated in Figure 5.10. Similar to
the control specimen, the maximum compressing stress was taken by the
aluminium face on top and the largest tensile stress occurred on the lowest
layer in the aluminium face sheet. However, the magnitude of the maximum
negative normal stress reduced to -27.1 MPa and the largest amount of
positive normal stress to 24.8 MPa. It means that the addition of jute
intermediate layer resulted in 40.2% reduction in the extreme normal stress
in the panel. Jute natural fibre was responsible for taking a relatively large
amount of stress as shown in light blue areas in the picture. The magnitude
of stress in the intermediate layer was seen to be approximately between 11
to 16 MPa which equalled to 52% of the maximum normal stress in the
panel. Taking this amount of stress in the panel resulted in a high amount of
toughness in JFC-SP as discussed in section 5.1.
Figure 5.10: Normal stress distribution in JFC-SP
Figure 5.11 shows normal stress distribution in specimen with hemp
intermediate layer. The maximum negative stress taken by the panel was
-26.7 MPa and the maximum positive normal stress appeared to be 25.4
MPa. These numbers were close to maximum normal stress in the specimen
with jute intermediate layer. The extreme normal stress in HFC-SP
specimen was seen to be 38.7% less than the same category in control
specimens. This reduction resulted in an increase in load carrying capacity
by the specimen compared to the control specimen. Stress taken by hemp
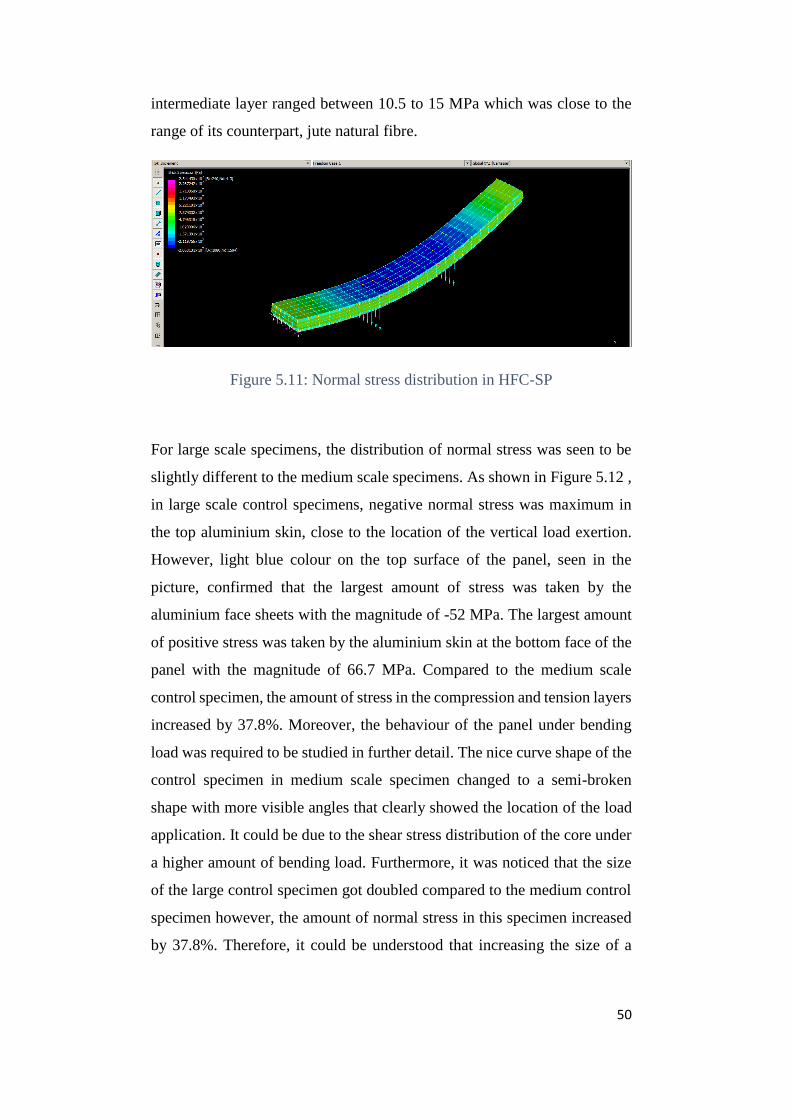
50
intermediate layer ranged between 10.5 to 15 MPa which was close to the
range of its counterpart, jute natural fibre.
Figure 5.11: Normal stress distribution in HFC-SP
For large scale specimens, the distribution of normal stress was seen to be
slightly different to the medium scale specimens. As shown in Figure 5.12 ,
in large scale control specimens, negative normal stress was maximum in
the top aluminium skin, close to the location of the vertical load exertion.
However, light blue colour on the top surface of the panel, seen in the
picture, confirmed that the largest amount of stress was taken by the
aluminium face sheets with the magnitude of -52 MPa. The largest amount
of positive stress was taken by the aluminium skin at the bottom face of the
panel with the magnitude of 66.7 MPa. Compared to the medium scale
control specimen, the amount of stress in the compression and tension layers
increased by 37.8%. Moreover, the behaviour of the panel under bending
load was required to be studied in further detail. The nice curve shape of the
control specimen in medium scale specimen changed to a semi-broken
shape with more visible angles that clearly showed the location of the load
application. It could be due to the shear stress distribution of the core under
a higher amount of bending load. Furthermore, it was noticed that the size
of the large control specimen got doubled compared to the medium control
specimen however, the amount of normal stress in this specimen increased
by 37.8%. Therefore, it could be understood that increasing the size of a
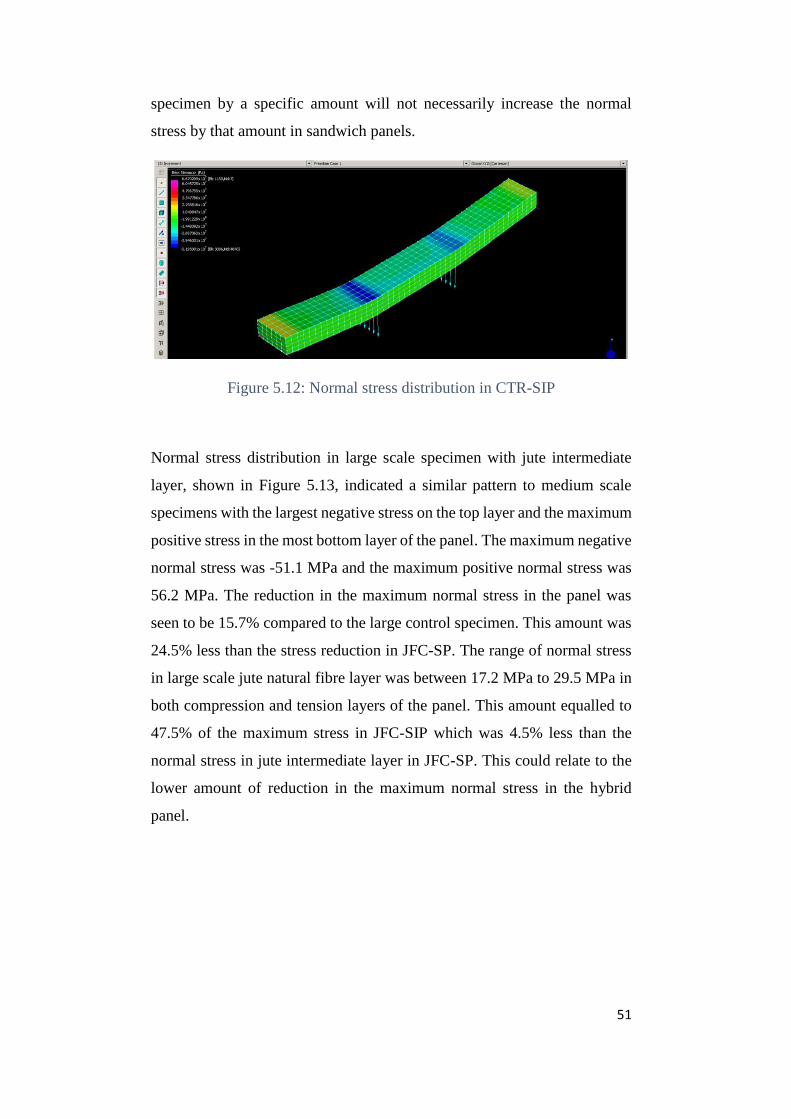
51
specimen by a specific amount will not necessarily increase the normal
stress by that amount in sandwich panels.
Figure 5.12: Normal stress distribution in CTR-SIP
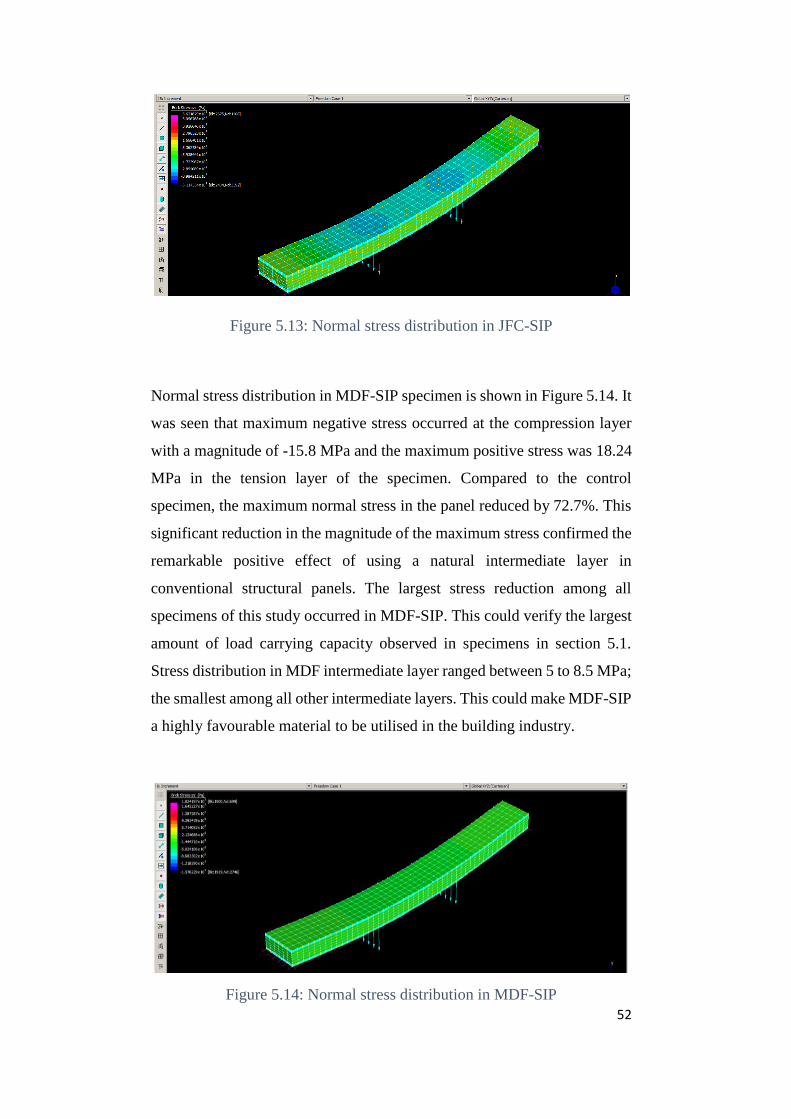
Normal stress distribution in large scale specimen with jute intermediate
layer, shown in Figure 5.13, indicated a similar pattern to medium scale
specimens with the largest negative stress on the top layer and the maximum
positive stress in the most bottom layer of the panel. The maximum negative
normal stress was -51.1 MPa and the maximum positive normal stress was
56.2 MPa. The reduction in the maximum normal stress in the panel was
seen to be 15.7% compared to the large control specimen. This amount was
24.5% less than the stress reduction in JFC-SP. The range of normal stress
in large scale jute natural fibre layer was between 17.2 MPa to 29.5 MPa in
both compression and tension layers of the panel. This amount equalled to
47.5% of the maximum stress in JFC-SIP which was 4.5% less than the
normal stress in jute intermediate layer in JFC-SP. This could relate to the
lower amount of reduction in the maximum normal stress in the hybrid
panel.
52
Figure 5.13: Normal stress distribution in JFC-SIP
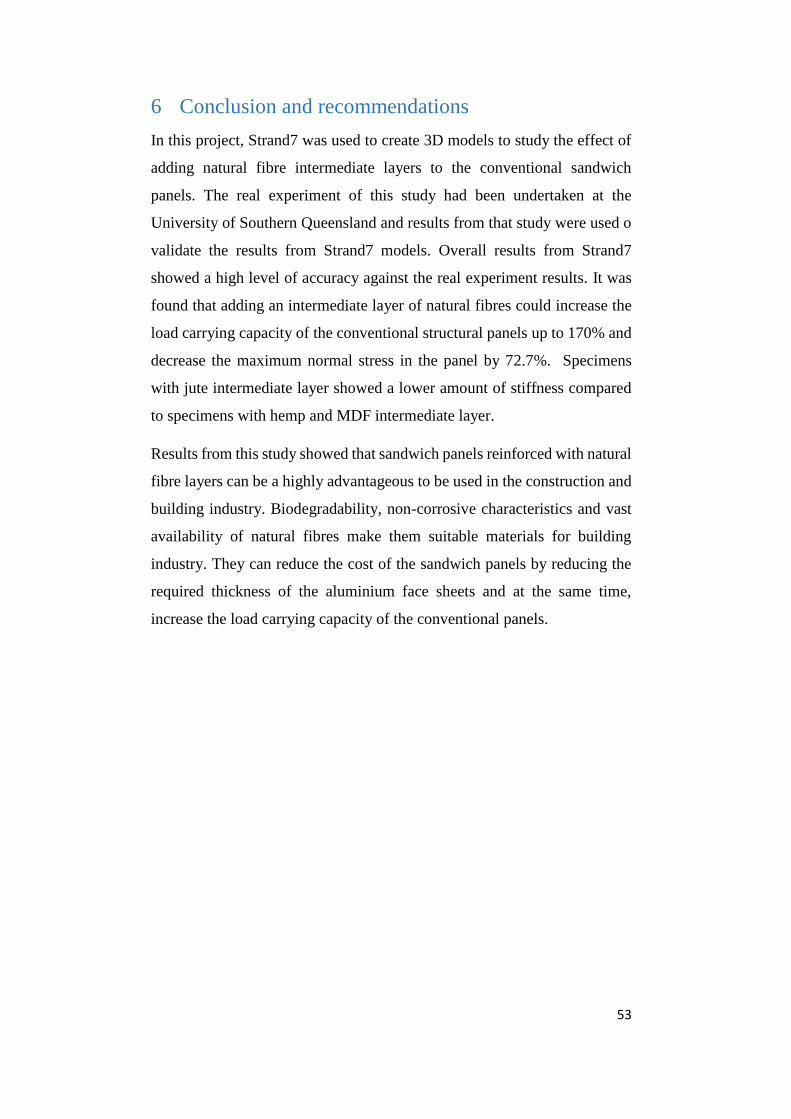
Normal stress distribution in MDF-SIP specimen is shown in Figure 5.14. It
was seen that maximum negative stress occurred at the compression layer
with a magnitude of -15.8 MPa and the maximum positive stress was 18.24
MPa in the tension layer of the specimen. Compared to the control
specimen, the maximum normal stress in the panel reduced by 72.7%. This
significant reduction in the magnitude of the maximum stress confirmed the
remarkable positive effect of using a natural intermediate layer in
conventional structural panels. The largest stress reduction among all
specimens of this study occurred in MDF-SIP. This could verify the largest
amount of load carrying capacity observed in specimens in section 5.1.
Stress distribution in MDF intermediate layer ranged between 5 to 8.5 MPa;
the smallest among all other intermediate layers. This could make MDF-SIP
a highly favourable material to be utilised in the building industry.
Figure 5.14: Normal stress distribution in MDF-SIP
53
6 Conclusion and recommendations
In this project, Strand7 was used to create 3D models to study the effect of
adding natural fibre intermediate layers to the conventional sandwich
panels. The real experiment of this study had been undertaken at the
University of Southern Queensland and results from that study were used o
validate the results from Strand7 models. Overall results from Strand7
showed a high level of accuracy against the real experiment results. It was
found that adding an intermediate layer of natural fibres could increase the
load carrying capacity of the conventional structural panels up to 170% and
decrease the maximum normal stress in the panel by 72.7%. Specimens
with jute intermediate layer showed a lower amount of stiffness compared
to specimens with hemp and MDF intermediate layer.
Results from this study showed that sandwich panels reinforced with natural
fibre layers can be a highly advantageous to be used in the construction and
building industry. Biodegradability, non-corrosive characteristics and vast
availability of natural fibres make them suitable materials for building
industry. They can reduce the cost of the sandwich panels by reducing the
required thickness of the aluminium face sheets and at the same time,
increase the load carrying capacity of the conventional panels.

54
7 Recommendations for further work
Due to time constraints and complexity of the topic, the bonding agent in
specimens were not modelled in this project. Hence, the final failure loads
of the specimens were not achieved. It is recommended for further research
to model the adhesive that bonds the layers together in order to predict the
failure point of each specimen. To do so, it is recommended to create a
uniform thin layer of the adhesive in the shape of a layer and test it to obtain
the mechanical properties as well as the graph of stress versus strain of the
adhesive. Acquired properties can be inserted into Strand7 models to predict
the failure point of the specimens.
55
8 References
Abang Abdullah Abang, A, Mohammad, P & Yen Lei, V 2013, 'Structural
Insulated Panels: Past, Present, and Future', Journal of Engineering, vol.
3, no. 1, pp. 2-8.
Anon, 2016. Stresses: Beams in Bending. 1st ed.
ASTM Standard C 393 (2000), Standard test method for flexural properties of
sandwich construction, ASTM C393-00, ASTM International, Philadelphia, Pa
19103.
Burgueño, R., Quagliata, M., Mohanty, A., Mehta, G., Drzal, L. and Misra, M.,
2004. Load-bearing natural fiber composite cellular beams and panels.
Composites Part A: Applied Science and Manufacturing, 35(6), pp.645-656.
Davies, J., 2001. Lightweight sandwich construction. Oxford: Blackwell Science.
Dweib, MA, Hu, B, O’Donnell, A, Shenton, HW & Wool, RP 2004, 'All
natural composite sandwich beams for structural applications', Composite
Structures, vol. 63, no. 2, pp. 147-157.
Fajrin, J, Zhuge, Y, Bullen, F & Wang, H 2013a, "Hybrid sandwich panel
with natural fibre composite intermediate layer: Manufacturing process
and significance analysis".
Fajrin, J, Zhuge, Y, Bullen, F & Wang, H 2013b, "Significance analysis of
flexural behaviour of hybrid sandwich panels".
Gnip, IJ, Vaitkus, SI, Kersulis, VI & Veyelis, SA 2007, 'Deformability of
expanded polystyrene under short-term compression', Mechanics of
Composite Materials, vol. 43, no. 5, pp. 433-444.
56
Herrera-Franco, PJ & Valadez-González, A 2004, 'Mechanical properties
of continuous natural fibre-reinforced polymer composites', Composites
Part A, vol. 35, no. 3, pp. 339-345.
Hibbeler, R., 1997. Mechanics of materials. Upper Saddle River, N.J.: Prentice
Hall.
Hidallana-Gamage, HD, Thambiratnam, DP & Perera, NJ 2014,
'Numerical modelling and analysis of the blast performance of laminated
glass panels and the influence of material parameters', Engineering Failure
Analysis, vol. 45, pp. 65-84.
Ku, H, Wang, H, Pattarachaiyakoop, N & Trada, M 2011, 'A review on the
tensile properties of natural fiber reinforced polymer composites',
Composites Part B, vol. 42, no. 4, pp. 856-873.
Lanssens, T, Tanghe, C, Rahbar, N, Okumus, P, Van Dessel, S & El-
Korchi, T 2014, 'Mechanical behavior of a glass fiber-reinforced polymer
sandwich panel with through-thickness fiber insertions', Construction and
Building Materials, vol. 64, pp. 473-479.
Lumley, R., 2011. Fundamentals of aluminium metallurgy. Oxford:
Woodhead Pub.
Mamalis, AG, Spentzas, KN, Manolakos, DE, Pantelelis, N & Ioannidis,
M 2008, 'Structural and impact behaviour of an innovative low-cost
sandwich panel', International Journal of Crashworthiness, vol. 13, no. 3,
pp. 231-236.
Manalo A., Aravinthan T., Karunasena W., Islam M.M., (2009), Flexural
behavior of structural fiber composite sandwich beams in flatwise and
57
edgewise positions, Composite Structures;
doi:10.1016/j.compstruct.2009.09.046.
Mathur, VK 2006, 'Composite materials from local resources',
Construction and Building Materials, vol. 20, no. 7, pp. 470-477.
Mohanty, AK, Misra, M & Drzal, LT 2005, Natural fibers, biopolymers,
and biocomposites, Taylor & Francis, Boca Raton, FL.
Mostafa, A., Shankar, K., Morozov, E.V. 2013, 'Effect of shear keys
diameter on the shear performance of composite sandwich panel with PVC
and PU foam core: FE study', Composite Structures, vol. 102, pp. 90-100.
Mousa, MA & Uddin, N 2012, 'Structural behavior and modeling of full-
scale composite structural insulated wall panels', Engineering Structures,
vol. 41, pp. 320-334.
Nasim, U & Rahul, RK 2011, 'Manufacturing and Structural Feasibility of
Natural Fiber Reinforced Polymeric Structural Insulated Panels for
Panelized Construction', International Journal of Polymer Science, vol.
2011.
Ramroth, WT, Asaro, RJ, Zhu, B & Krysl, P 2006, 'Finite element
modelling of fire degraded FRP composite panels using a rate dependent
constitutive model', Composites Part A: Applied Science and
Manufacturing, vol. 37, no. 7, pp. 1015-1023.
Roylance D., 2000, Beam Displacements, Department of Materials
Science and Engineering, Massachusetts Institute of Technology,
Cambridge, USA.

58
Sharaf T., Shawkat W., Fam A., 2010, Structural performance of sandwich
wall panels with different foam core densities in-one-way bending,
Journal of Composite Materials, Vol. 44, No 19, 2010.
Somayaji S., 1995, Civil engineering materials, Prentice Hall, Englewood,
New Jersey, USA.
Steeves, CA & Fleck, NA 2004, 'Collapse mechanisms of sandwich beams
with composite faces and a foam core, loaded in three-point bending. Part
II: experimental investigation and numerical modelling', International
Journal of Mechanical Sciences, vol. 46, no. 4, pp. 585-608.
Tewodros H. Tefera, Roald A, Hermann B, Kristian A, 2010, ' FEM
simulation of full scale and laboratory models test of EPS', The Norwegian
Public Roads Administration, Norway.
Tornabene, F, Brischetto, S, Fantuzzi, N & Viola, E 2015, 'Numerical and
exact models for free vibration analysis of cylindrical and spherical shell
panels', Composites Part B: Engineering, vol. 81, pp. 231-250.
Zenkert, D. 1995, AN introduction to sandwich construction, Solihull,
EMAS.
59
Appendix A
60
61
62
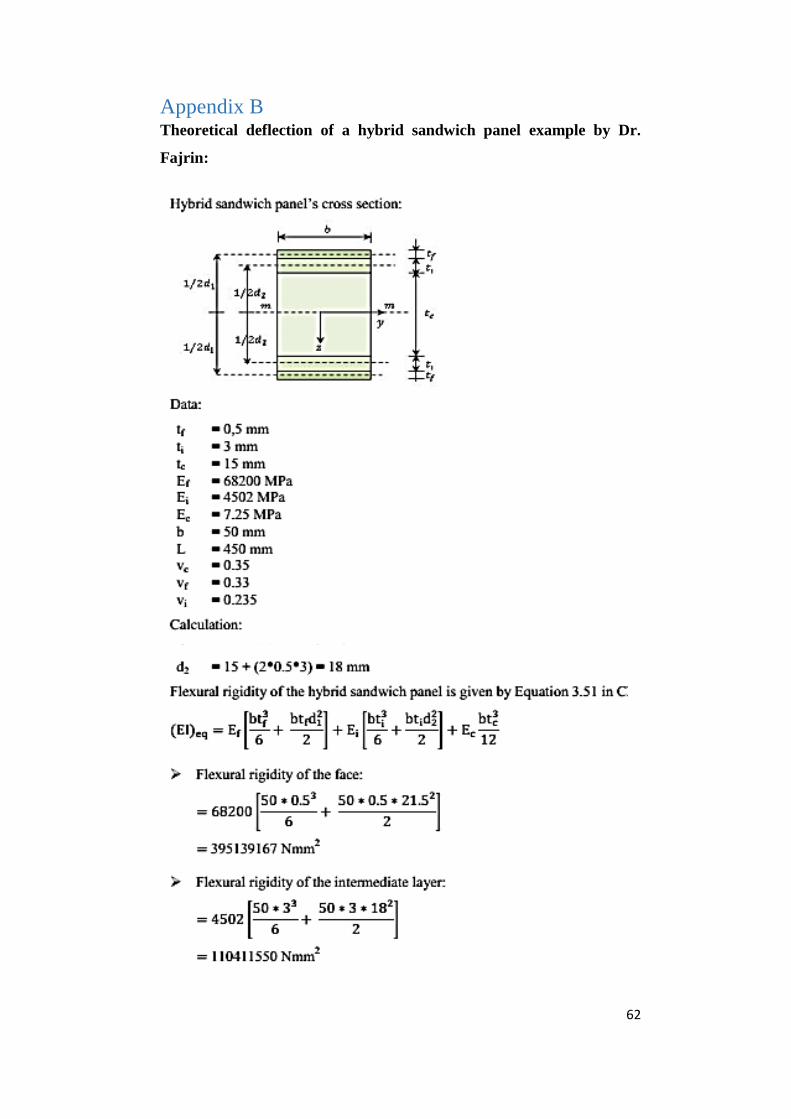
Appendix B Theoretical deflection of a hybrid sandwich panel example by Dr.
Fajrin:

63
64
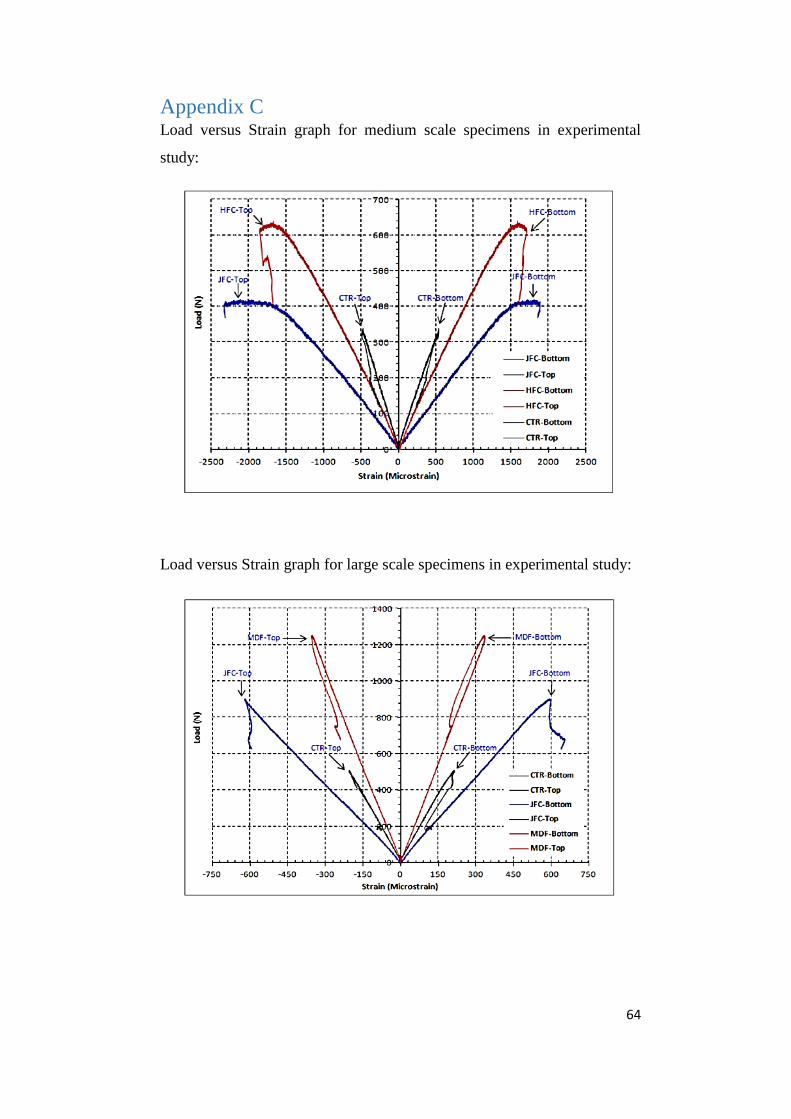
Appendix C Load versus Strain graph for medium scale specimens in experimental
study:
Load versus Strain graph for large scale specimens in experimental study:
65
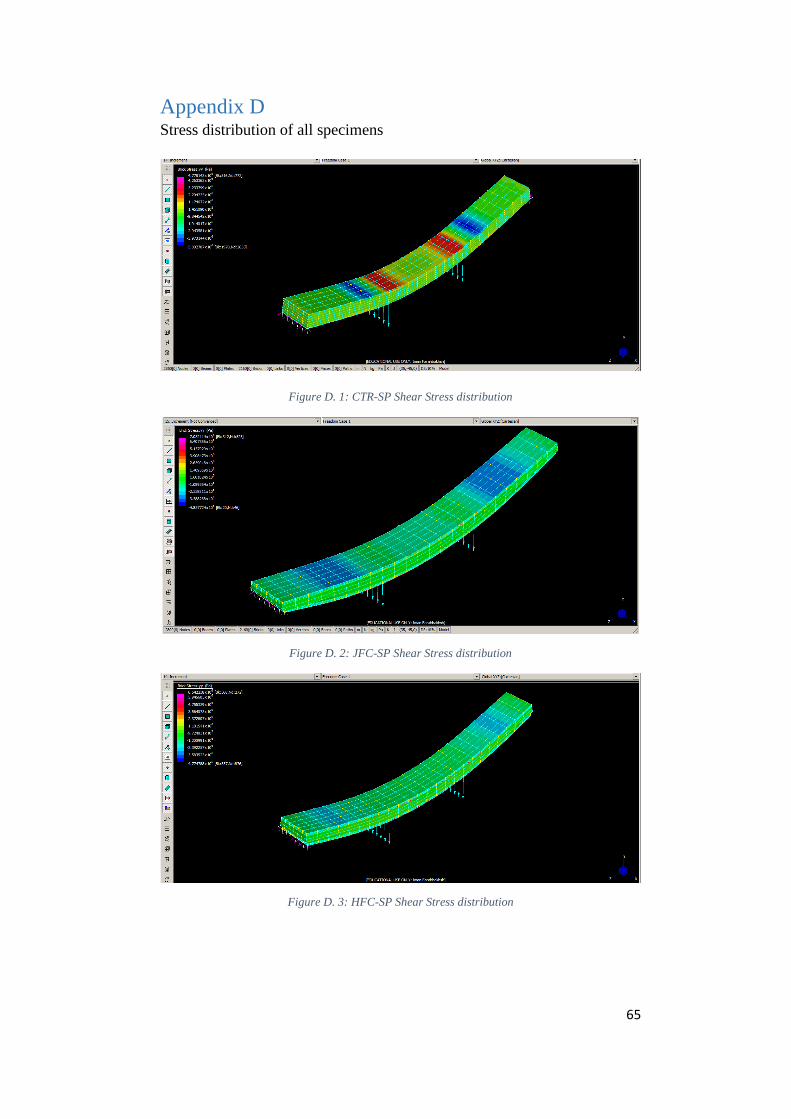
Appendix D Stress distribution of all specimens
Figure D. 1: CTR-SP Shear Stress distribution
Figure D. 2: JFC-SP Shear Stress distribution
Figure D. 3: HFC-SP Shear Stress distribution
66
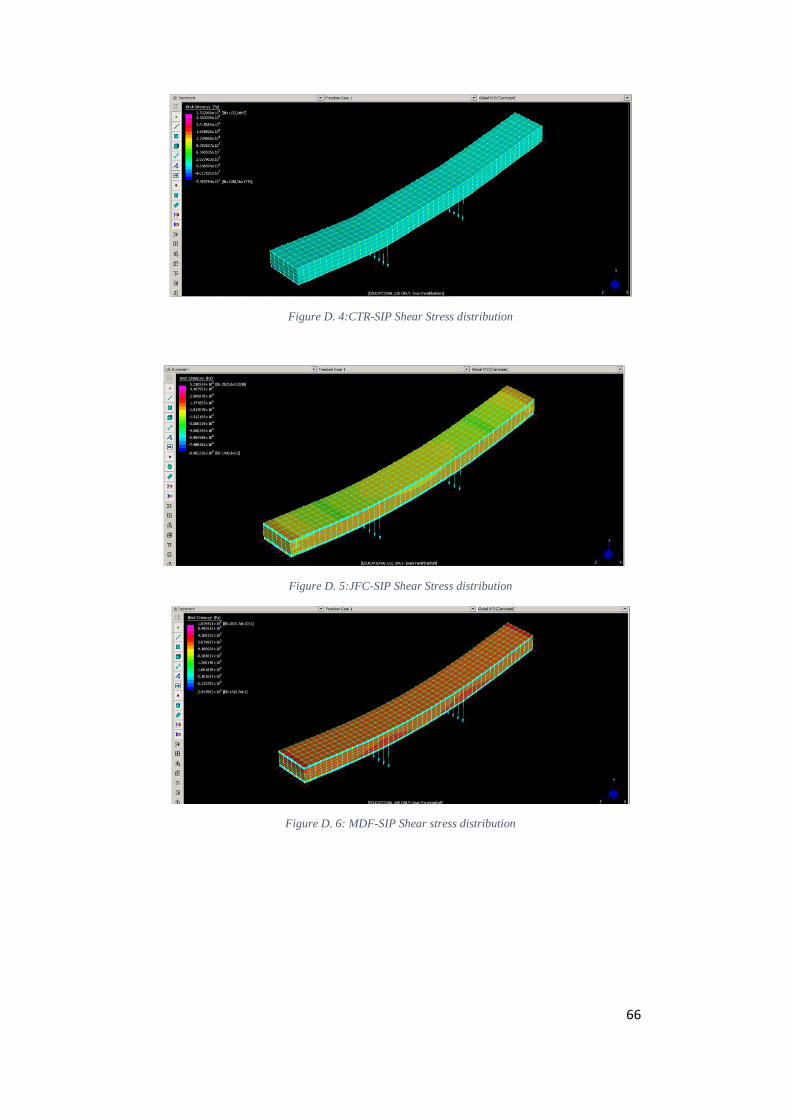
Figure D. 4:CTR-SIP Shear Stress distribution
Figure D. 5:JFC-SIP Shear Stress distribution
Figure D. 6: MDF-SIP Shear stress distribution
67
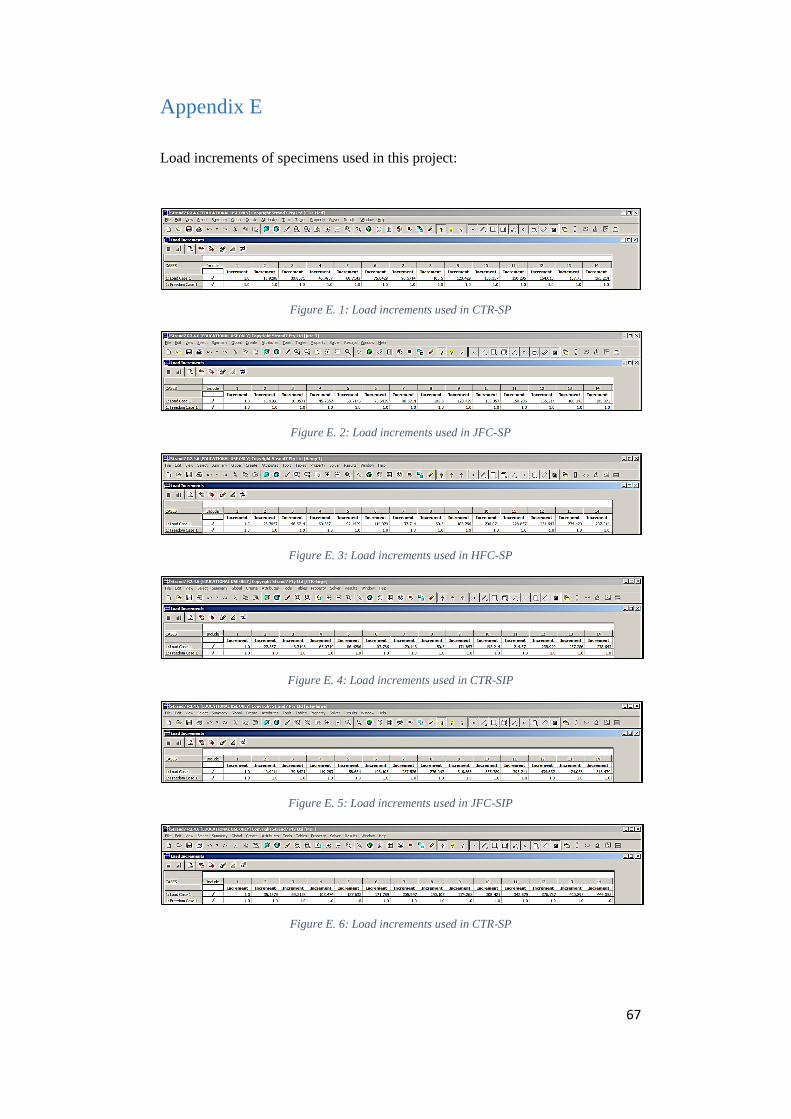
Appendix E
Load increments of specimens used in this project:
Figure E. 1: Load increments used in CTR-SP
Figure E. 2: Load increments used in JFC-SP
Figure E. 3: Load increments used in HFC-SP
Figure E. 4: Load increments used in CTR-SIP
Figure E. 5: Load increments used in JFC-SIP
Figure E. 6: Load increments used in CTR-SP