Embed Size (px)
Citation preview
________ *Corresponding author.
E-mail address: [email protected] (J.N. Reddy)
Finite Element Modeling of Viscoelastic Behavior and Interface Damage in
Adhesively Bonded Joints
Feifei Cheng, Ö. Özgü Özsoy and J.N. Reddy*
Advanced Computational Mechanics Laboratory, Department of Mechanical Engineering,
Texas A&M University, College Station, TX, 77843-3123, USA
Abstract
This paper presents a study on viscoelastic behavior of the adhesive and damage analysis of
adhesive-adherend interfaces in adhesively bonded joints. First, viscoelastic finite element
analysis of a model joint with viscoelastic adhesive has been conducted while considering
geometric nonlinearity as well as thermal expansion. Then a finite element model for bond failure
analysis at the viscoelastic adhesive-elastic adherend interface for a mixed-mode fracture problem
is proposed. In the framework of cohesive zone model, traction-separation law is used to define
the constitutive response of the cohesive elements at the interface. Quadratic nominal stress
criterion and mixed-mode energy criterion are used to determine the damage initiation and
evolution at the interface, respectively.
Keywords: adhesive joints, finite element, viscoelasticity, damage, cohesive elements
1. Introduction
Advances in polymer technologies have increased the use of the polymeric adhesives to join
dissimilar material structural components together. Adhesively bonded joints are widely used in
aerospace and automotive industries as well as in various other structural systems. They are
considered to be more efficient compared to the conventional fasteners such as bolts, rivets, and
welded joints, which cause high stress concentrations. Bonded joints are of great importance due
to the advantages in terms of their light weight compared to the mechanical fastening and
efficiency of joining, good damping and fatigue characteristics.
The lap shear test is the most widely used method for producing in-situ shear strength data on
adhesively bonded joints. Some of the characteristics of a lap joint are as follows: tensile stress is
exerted over the entire joint and away from the adhesive bond; shear stress is exerted across the
adhesive bond (i.e., the bonded materials are forced to slide over each other); cleavage stress is
concentrated at one edge and exerts a prying force on the bond; and peel stress is concentrated
along a thin line at the bond's edge. However, the stresses generated in the adhesive layer are not
uniform. The eccentricity of the axis of a lap joint gives rise to transverse or peel stresses at the
Report Documentation Page Form ApprovedOMB No. 0704-0188
Public reporting burden for the collection of information is estimated to average 1 hour per response, including the time for reviewing instructions, searching existing data sources, gathering andmaintaining the data needed, and completing and reviewing the collection of information. Send comments regarding this burden estimate or any other aspect of this collection of information,including suggestions for reducing this burden, to Washington Headquarters Services, Directorate for Information Operations and Reports, 1215 Jefferson Davis Highway, Suite 1204, ArlingtonVA 22202-4302. Respondents should be aware that notwithstanding any other provision of law, no person shall be subject to a penalty for failing to comply with a collection of information if itdoes not display a currently valid OMB control number.
1. REPORT DATE 2012 2. REPORT TYPE
3. DATES COVERED 00-00-2012 to 00-00-2012
4. TITLE AND SUBTITLE Finite Element Modeling of Viscoelastic Behavior and Interface Damagein Adhesively Bonded Joints
5a. CONTRACT NUMBER
5b. GRANT NUMBER
5c. PROGRAM ELEMENT NUMBER
6. AUTHOR(S) 5d. PROJECT NUMBER
5e. TASK NUMBER
5f. WORK UNIT NUMBER
7. PERFORMING ORGANIZATION NAME(S) AND ADDRESS(ES) Texas A&M University,Department of MechanicalEngineering,Advanced Computational Mechanics Laboratory,College Station,TX,77843
8. PERFORMING ORGANIZATIONREPORT NUMBER
9. SPONSORING/MONITORING AGENCY NAME(S) AND ADDRESS(ES) 10. SPONSOR/MONITOR’S ACRONYM(S)
11. SPONSOR/MONITOR’S REPORT NUMBER(S)
12. DISTRIBUTION/AVAILABILITY STATEMENT Approved for public release; distribution unlimited
13. SUPPLEMENTARY NOTES Special Issue of Journal of Adhesion Science and Technology, 2012 (in press)
14. ABSTRACT This paper presents a study on viscoelastic behavior of the adhesive and damage analysis ofadhesive-adherend interfaces in adhesively bonded joints. First, viscoelastic finite element analysis of amodel joint with viscoelastic adhesive has been conducted while considering geometric nonlinearity as wellas thermal expansion. Then a finite element model for bond failure analysis at the viscoelasticadhesive-elastic adherend interface for a mixed-mode fracture problem is proposed. In the framework ofcohesive zone model, traction-separation law is used to define the constitutive response of the cohesiveelements at the interface. Quadratic nominal stress criterion and mixed-mode energy criterion are used todetermine the damage initiation and evolution at the interface, respectively.
15. SUBJECT TERMS
16. SECURITY CLASSIFICATION OF: 17. LIMITATION OF ABSTRACT Same as
Report (SAR)
18. NUMBEROF PAGES
22
19a. NAME OFRESPONSIBLE PERSON
a. REPORT unclassified
b. ABSTRACT unclassified
c. THIS PAGE unclassified
Standard Form 298 (Rev. 8-98) Prescribed by ANSI Std Z39-18
2
ends of the overlap, enabling cracks to initiate and propagate from the ends of the overlap. The
present study is concerned with stress distribution and crack propagation in elastic and
viscoelastic adhesive joints. The following literature review, by no means exhaustive or complete,
provides a background for the present study.
Adams and Peppiatt [1] focused on the stresses at the end of the adhesive layer of adhesively
bonded lap joints. They formulated a plane-strain problem, in which the shear deformations and
bending of the adherends are taken into account. They also showed the effect of the adhesive
thickness on the strength of the joint. Ojalvo and Eidinoff [2] also discussed the adhesive
thickness effects upon stresses in single lap joints (SLJs) by extending the analytical approach of
Goland and Reissner [3], through the use of a more complete shear strain-displacement equation
for the adhesive layer. Delale et al. [4] solved the SLJ as a plane strain problem in which the
adherends are considered as orthotropic plates for which a transverse shear deformation theory is
used. Their solution does not provide zero stress condition at the free ends of the adhesive layer.
Zhao et al. [5, 6] developed a model capable of providing an explicit closed-form solution for the
elastic stress analysis in SLJs. The theory can predict zero shear stress condition at the free ends
of the adhesive, as well as the variation of the normal stress through the adhesive thickness.
Reddy and Roy [7] used the updated Lagrangian formulation for elastic solids to develop a two-
dimensional finite element analysis with geometric nonlinearity. They brought attention to the
effect of boundary conditions applied at the ends of the adherends and mesh on the stress
distributions in lap joints. Carpenter [8] formulated a finite element analysis approach in which
finite thickness of adhesive is accounted for. It is based on the assumptions common to the
theories of Goland and Reissner [3], and Ojalvo and Eidinoff [2]. He developed two different
elements based on the formulation of aforementioned theories. Cooper and Sawyer [9] derived
the Goland and Reissner equations for adhesive shear and peel stresses. The development of the
equations is similar to the original with some slight modifications to improve the consistency of
the analysis. Li et al. [10] used nonlinear finite element analysis to investigate the stress and strain
distributions across the adhesive thickness in SLJs where the adherends consist of composite
material. They also proposed a methodology to treat the cohesive failure in the adhesive layer and
possible failure mechanisms. Magalhães et al. [11] investigated the stress distributions along the
overlap at various cross sections of the SLJs and concluded that the highest stresses are found at
the top and bottom interfaces, at the end of the overlap region. This indicates that damage can
initiate at these interfaces. Yang et al. [12] developed an elastoplastic analytical model for SLJs.
They assumed that the adherends are linear elastic, whereas the adhesives are elastic-perfectly
3
plastic following the von Mises yield criterion. It is claimed that the model developed in this
study is a good tool to evaluate the joint strength under the cohesive failure model once a suitable
joint failure criterion is established.
The finite element method has also been used by several researchers to model viscoelastic
behavior of adhesively bonded joints: Yadagiri et al. [13] employed usual and modified plane
strain systems in formulating the adhesive layer element. Carpenter [14] used direct integration
process to advance the solution with time. Henriksen [15] used nonlinear viscoelastic model
proposed by Schapery [16] and compared the numerical results with the experimental results of
Peretz and Weitsman [17]. Knauss and Emri’s nonlinear viscoelastic model [18] has been
employed by Becker et al. [19] in developing a finite element program named VISTA for stress
analysis of adhesively bonded joints. In Roy and Reddy’s work [20-22], an updated Lagrangian
formulation and the associated Schapery’s nonlinear viscoelastic finite element model were
developed; the nonlinear viscoelastic behavior has been studied and compared with the results
from VISTA by Becker et al.’s work [19]; they also studied the effect of moisture on stress
distributions in adhesive joints. Schapery’s viscoelastic model combined with elastoplastic
constitutive relation was used to carry out finite element analysis of unidirectional composite
laminate by Schaffer and Adams [23].
Experimental and theoretical studies of crack propagation in a viscoelastic medium have been
carried out by a number of authors [24-29]. Finite element analysis of crack propagation in
bonded joints in which adhesives have viscoelastic properties has been conducted in [30-34]. In
Allen and Searcy’s work [30], a micromechanical model for a viscoelastic cohesive zone was
formulated while traction-displacement law has been integrated numerically in an implicit finite
element formulation to predict crack propagation in double cantilever beam (DCB) model. Chen
and Dillard [31] conducted numerical analysis of the directionally unstable crack propagation in
adhesively bonded joints by using interface mechanics and the finite element method. Dubois et
al. [32] studied the effects of viscoelastic characteristics on the creep-crack growth process, in
which fracture parameters are computed through a coupling process with an incremental
viscoelastic formulation. Rahulkumar and coworkers [33] used cohesive elements for the region
ahead of the crack tip in modeling of fracture propagation in peel test on viscoelastic material.
Their dimensional analysis showed that the macroscopic fracture energy scales with the intrinsic
fracture toughness and is a function of peel velocity, and parameters such as the thickness, bulk
properties of the polymer sheets, and other cohesive zone properties. Muliana and Khan [34]
developed a time-integration algorithm for thermo-rheological complex material (TCM), and
4
conducted finite element analysis of crack propagation in adhesively bonded joint systems with
TCM type polymer adhesives for fracture Mode I and Mode II. In their model, a crack path was
predetermined at the mid-height of the adhesive layers, where one layer of cohesive elements is
applied along.
It should be noted that most of the above studies regarding finite element analysis of crack
propagation in bonded joints with viscoelastic adhesive are developed for those cases in which
crack lies within the adhesive and mostly for peel testing (fracture Mode I). In this paper, a
cohesive-zone based finite element model has been constructed to study the bond failure behavior
at the viscoelastic adhesive-elastic adherend interface for a mixed-mode fracture problem (Mode I
and Model II).
2. Finite element analysis of viscoelastic adhesively bonded joints
2.1. Constitutive relation
In the integral form of linear viscoelasticity, the stress is expressed in terms of the strain history
as
( ) ( ) ( ) , where , ,
S S It
T Tt G t s s ds u u v v p (1)
where S is the deviatoric stress tensor, t is the current time, G is the time-dependent shear
relaxation modulus, is the engineering strain tensor, is the total stress tensor, p is the
hydrostatic pressure, and I is the unit tensor.
For linear viscoelastic model, Prony series expansion of the dimensionless relaxation modulus
( )Rg t can be expressed as follows,
/( )
1
1 1 i
Nt τ
R i
i
g t g e (2)
where , ,i iN g are material constants. For adhesive material FM-73 (Chemical type: elastomer
epoxy; Manufacture: American Cyanamid) used in this study, compliance modulus D(t) is given
in [21] as:
3 5 /0.01 4 /0.1
4 /1.0 4 /10.0
( ) 0.5988 10 1.637 10 (1 ) 0.6031 10 (1 )
0.9108 10 (1 ) 2.6177 10 (1 )
t t
t t
D t e e
e e
(3)
5
Since for viscoelastic analysis, stress formulation equation (1) is used in the present analysis, we
will have to transform creep compliance D(t) to relaxation modulus E(t) and obtain the
corresponding Prony series expression. From the linear theory of viscoelasticity, the relation
between relaxation modulus and creep compliance can be derived in the following way (see
Reddy [35], p. 312):
Given0( ) ( ) 1 ( ) t H t H t , then we have
20
( ) 11 (0) ( ) ( ) , ( ) ( )
t dD sD E t E t s ds E s D s
ds s (4)
Using inverse Laplace Transformation to calculate E(t) from D(t), we can obtain the
dimensionless relaxation modulus
/
1
- /0.009731 - /0.090992
- /0.878503 - /7.491198
( ) 1 1
1 0.02728 1 0.08933 1
0.1098 1 0.1912 1
i
Nt
R i
i
t t
t t
g t g e
e e
e e
(5)
In [36], the Prony series parametersig and i
can be defined directly from each term in equation
(5).
2.2. Numerical example
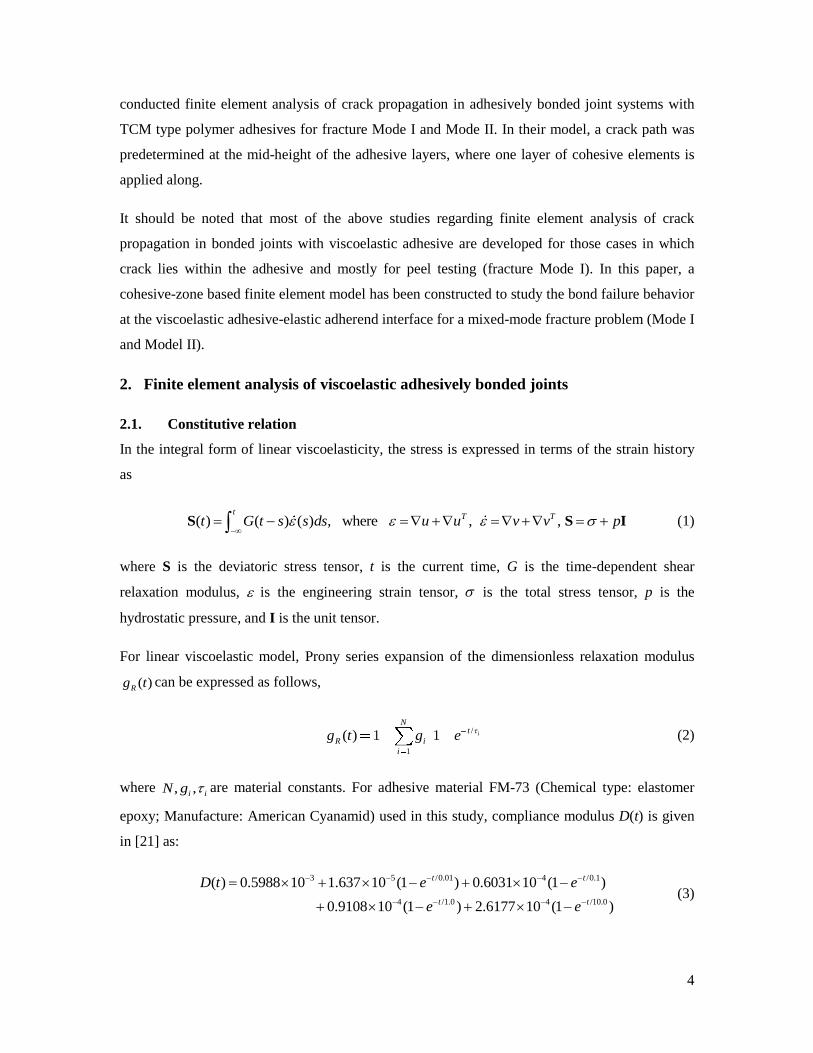
The model joint analysis problem presented in [21] is used as the validation example. The
geometry, boundary conditions and loading are shown in Figure 1. It has a total length of 132.1
mm, with thickness 12.91 mm, and overlap length 12.7 mm. The adhesive thickness is 0.254 mm.
On the left hand side of the model joint, horizontal and vertical displacements ux = uy = 0 are
applied; while on the right hand side, vertical displacement uy = 0 is applied at top and bottom
corners of adherend. Uniform stress qx = 13.6 MPa is applied at the right end. The material
properties of Al adherend, adhesive FM-73 are listed in Table 1.
6
Figure 1: Geometry, boundary conditions and loading for the model joint.
Table 1. Material properties of Al and FM-73 [21].
Material Young’s Modulus
E (GPa)
Poisson’s Ratio
v
CTE (10-6
/◦C)
Al 70 0.34 7.17
FM-73 1.67 0.38 66
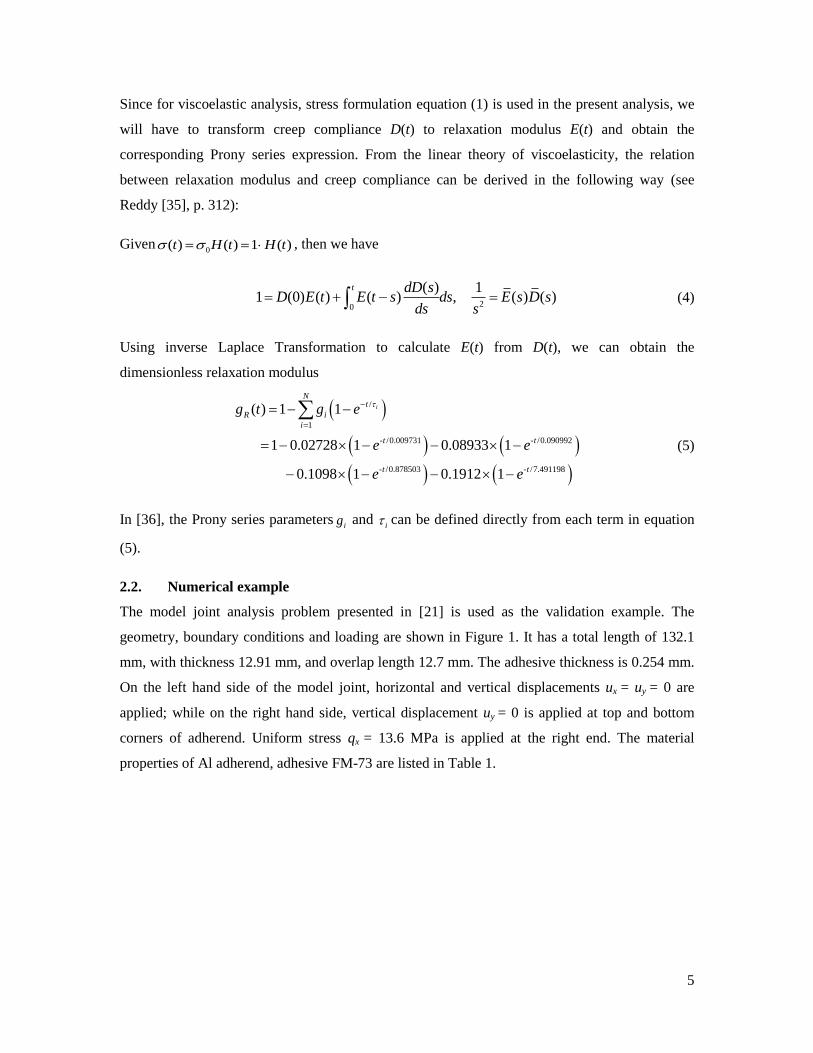
As the adhesive layer is very thin in this problem, and we are interested in stress concentration
areas in the adhesive layer close the adhesive-adherend interface, denser mesh has been assigned
to these areas, see in Figure 2. The element type selected is quadratic reduced integration plane
strain element (CPE8R).
Figure 2: An example of finite element mesh for the model joint.
132.1 mm
qx 12.91 mm
3.175 mm 12.7 mm
x
y
7
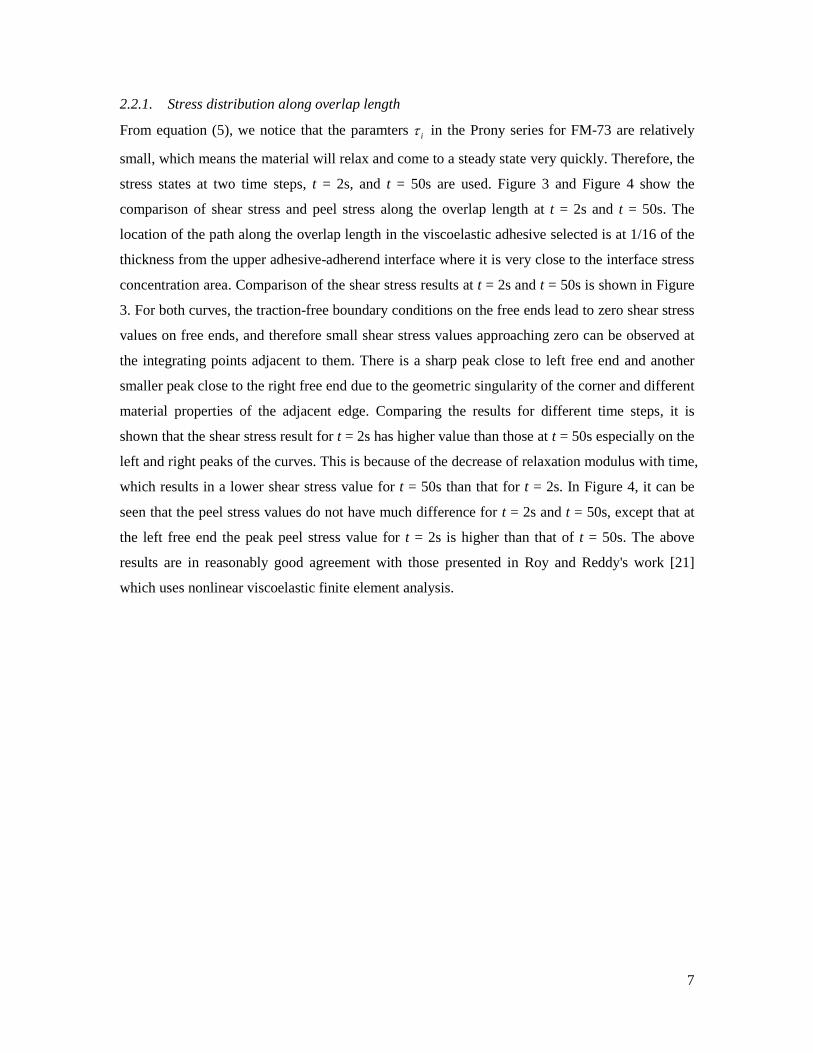
2.2.1. Stress distribution along overlap length
From equation (5), we notice that the paramters i in the Prony series for FM-73 are relatively
small, which means the material will relax and come to a steady state very quickly. Therefore, the
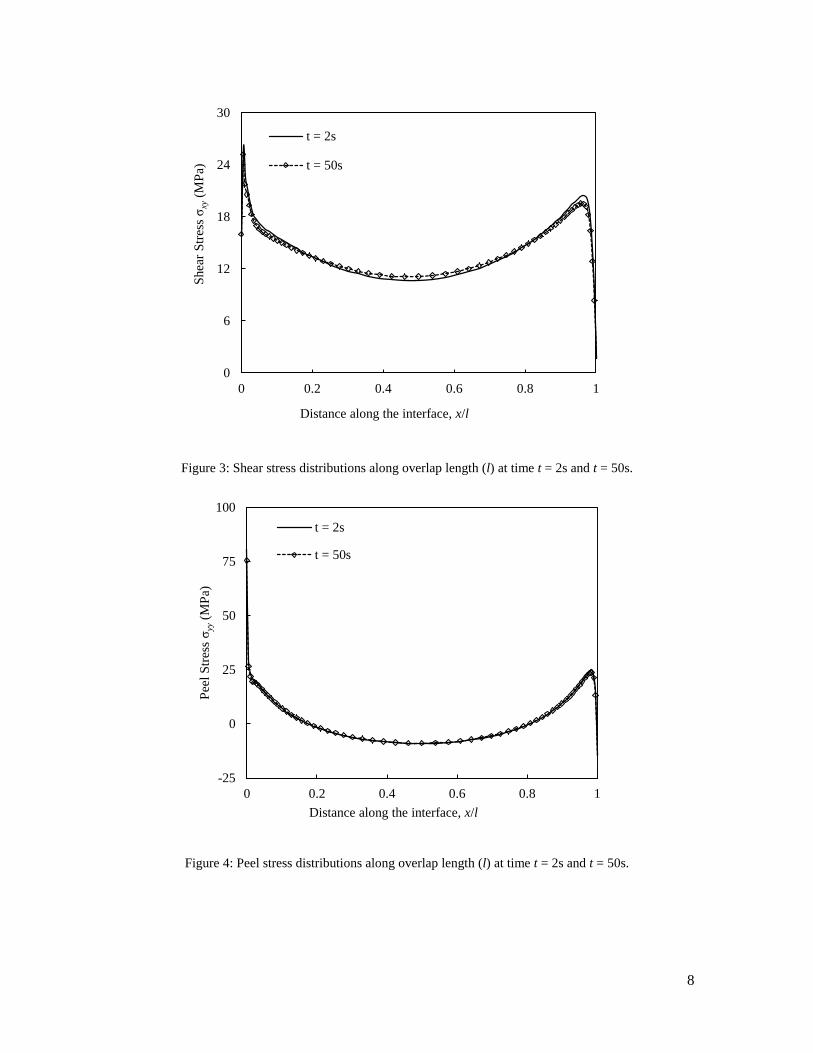
stress states at two time steps, t = 2s, and t = 50s are used. Figure 3 and Figure 4 show the
comparison of shear stress and peel stress along the overlap length at t = 2s and t = 50s. The
location of the path along the overlap length in the viscoelastic adhesive selected is at 1/16 of the
thickness from the upper adhesive-adherend interface where it is very close to the interface stress
concentration area. Comparison of the shear stress results at t = 2s and t = 50s is shown in Figure
3. For both curves, the traction-free boundary conditions on the free ends lead to zero shear stress
values on free ends, and therefore small shear stress values approaching zero can be observed at
the integrating points adjacent to them. There is a sharp peak close to left free end and another
smaller peak close to the right free end due to the geometric singularity of the corner and different
material properties of the adjacent edge. Comparing the results for different time steps, it is
shown that the shear stress result for t = 2s has higher value than those at t = 50s especially on the
left and right peaks of the curves. This is because of the decrease of relaxation modulus with time,
which results in a lower shear stress value for t = 50s than that for t = 2s. In Figure 4, it can be
seen that the peel stress values do not have much difference for t = 2s and t = 50s, except that at
the left free end the peak peel stress value for t = 2s is higher than that of t = 50s. The above
results are in reasonably good agreement with those presented in Roy and Reddy's work [21]
which uses nonlinear viscoelastic finite element analysis.
8
Figure 3: Shear stress distributions along overlap length (l) at time t = 2s and t = 50s.
Figure 4: Peel stress distributions along overlap length (l) at time t = 2s and t = 50s.
0
6
12
18
24
30
0 0.2 0.4 0.6 0.8 1
Shea
r S
tres
s σ
xy (
MP
a)
Distance along the interface, x/l
t = 2s
t = 50s
-25
0
25
50
75
100
0 0.2 0.4 0.6 0.8 1
Pee
l S
tres
s σ
yy (
MP
a)
Distance along the interface, x/l
t = 2s
t = 50s
9
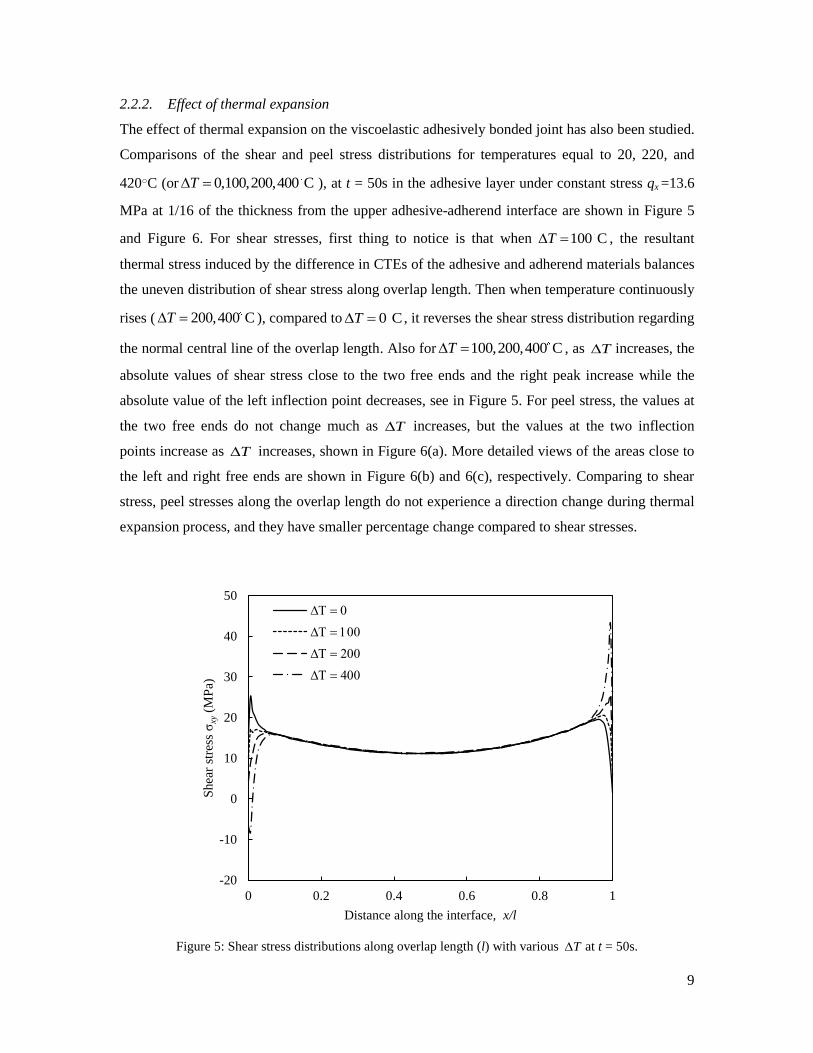
2.2.2. Effect of thermal expansion
The effect of thermal expansion on the viscoelastic adhesively bonded joint has also been studied.
Comparisons of the shear and peel stress distributions for temperatures equal to 20, 220, and
420○C (or 0,100,200,400 CT ), at t = 50s in the adhesive layer under constant stress qx =13.6
MPa at 1/16 of the thickness from the upper adhesive-adherend interface are shown in Figure 5
and Figure 6. For shear stresses, first thing to notice is that when 100 CT , the resultant
thermal stress induced by the difference in CTEs of the adhesive and adherend materials balances
the uneven distribution of shear stress along overlap length. Then when temperature continuously
rises ( 200,400 CT ), compared to 0 CT , it reverses the shear stress distribution regarding
the normal central line of the overlap length. Also for 100,200,400 CT , as T increases, the
absolute values of shear stress close to the two free ends and the right peak increase while the
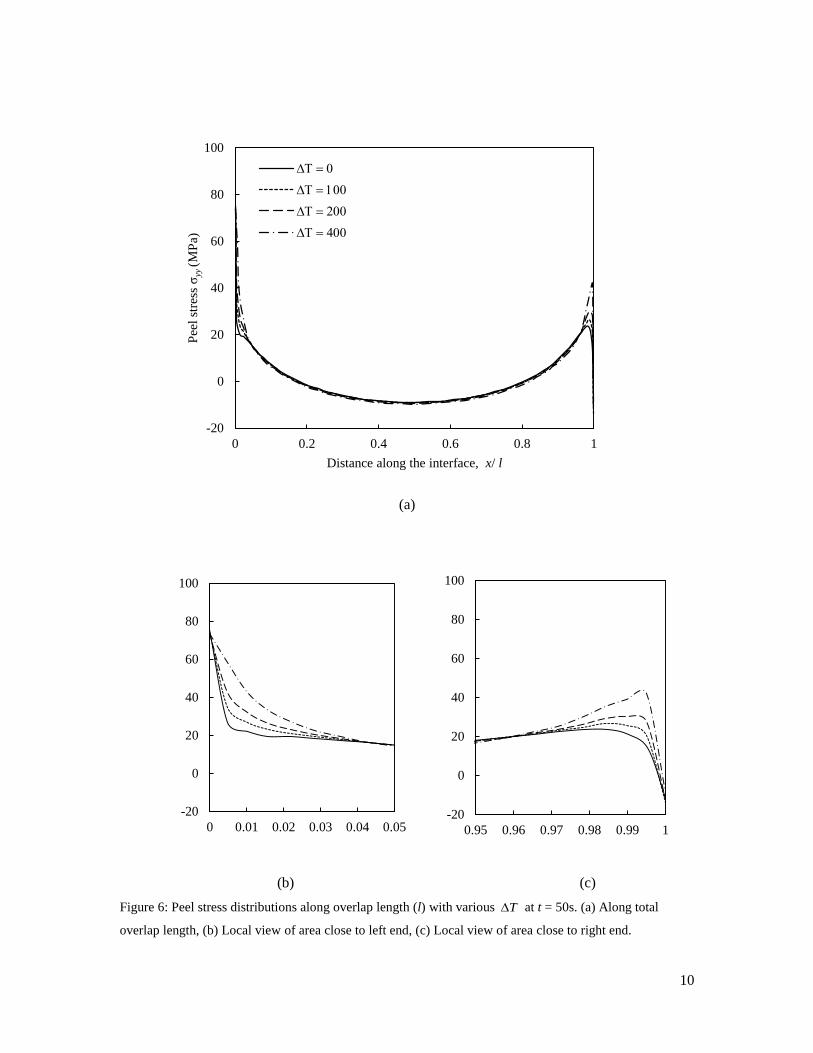
absolute value of the left inflection point decreases, see in Figure 5. For peel stress, the values at
the two free ends do not change much as T increases, but the values at the two inflection
points increase as T increases, shown in Figure 6(a). More detailed views of the areas close to
the left and right free ends are shown in Figure 6(b) and 6(c), respectively. Comparing to shear
stress, peel stresses along the overlap length do not experience a direction change during thermal
expansion process, and they have smaller percentage change compared to shear stresses.
Figure 5: Shear stress distributions along overlap length (l) with various T at t = 50s.
-20
-10
0
10
20
30
40
50
0 0.2 0.4 0.6 0.8 1
Shea
r st
ress
σxy
(M
Pa)
Distance along the interface, x/l
T 0
T 100
T 200
T 400
10
(a)
(b) (c)
Figure 6: Peel stress distributions along overlap length (l) with various T at t = 50s. (a) Along total
overlap length, (b) Local view of area close to left end, (c) Local view of area close to right end.
-20
0
20
40
60
80
100
0 0.2 0.4 0.6 0.8 1
Pee
l st
ress
σyy
(M
Pa)
Distance along the interface, x/ l
T 0
T 100
T 200
T 400
-20
0
20
40
60
80
100
0.95 0.96 0.97 0.98 0.99 1
-20
0
20
40
60
80
100
0 0.01 0.02 0.03 0.04 0.05
11
3. Damage analysis of viscoelastic adhesively bonded joints
3.1. Constitutive relation of cohesive element
3.1.1. Linear elastic traction-separation law
In cases where the critical energy release rate is the only given parameter, the cohesive zone
modeling in finite element analysis is troublesome because it depends on critical energy release
rate, maximum traction and the type of the traction-separation law. It is more straightforward to
define the constitutive response by traction-separation law and model the top and bottom
interfaces between adherends and adhesive using cohesive elements. The traction-separation law
is typically characterized by peak strength and fracture energy. In the present study, a linear
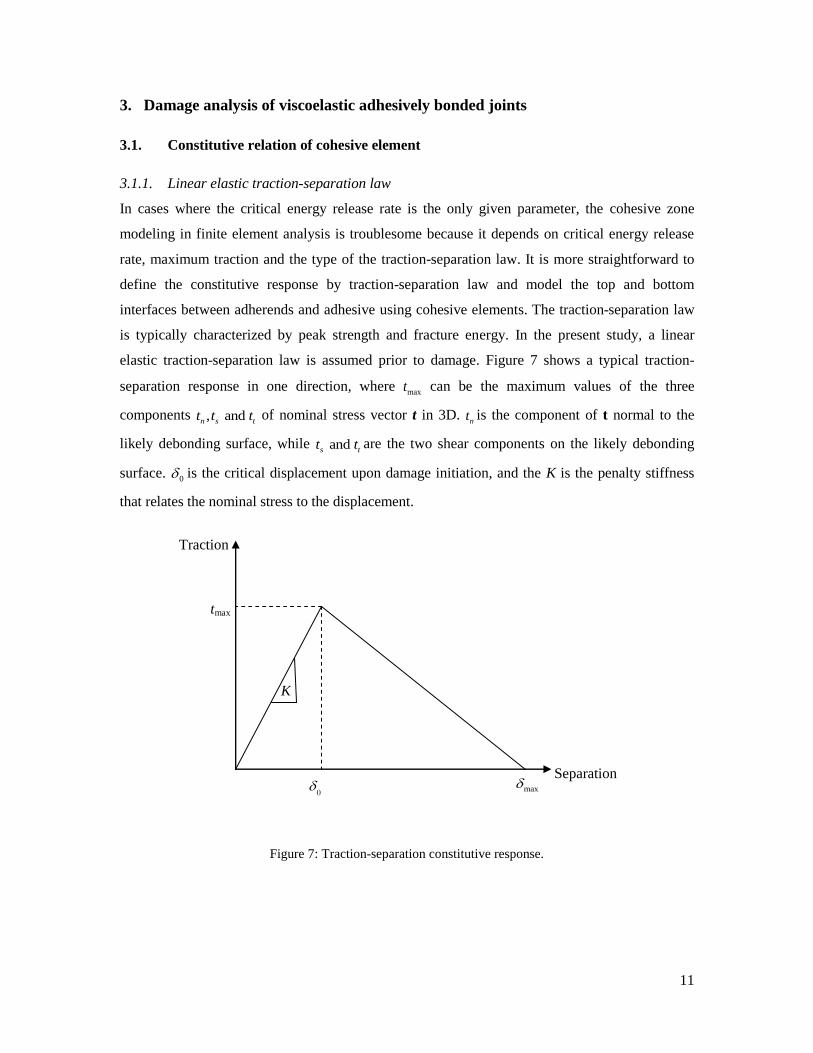
elastic traction-separation law is assumed prior to damage. Figure 7 shows a typical traction-
separation response in one direction, where maxt can be the maximum values of the three
components , and n s tt t t of nominal stress vector t in 3D.
nt is the component of t normal to the
likely debonding surface, while and s tt t are the two shear components on the likely debonding
surface. 0 is the critical displacement upon damage initiation, and the K is the penalty stiffness
that relates the nominal stress to the displacement.
Figure 7: Traction-separation constitutive response.
Traction
Separation
tmax
0
max
K
12
3.1.2. Damage initiation and evolution
Damage initiation refers to the beginning of degradation of the material stiffness. The damage
initiates when the stresses satisfy the quadratic nominal stress criterion which is given in equation
(6)
2 2 2
1
n s t
max max max
t t
T
t
N S (6)
where , ,and max max maxN S T represent the maximum values of the nominal stress components
, and, n s tt t t , respectively.
Damage evolution describes the rate of degradation of the material stiffness after the damage
initiation. It can be specified either in terms of fracture energy or in terms of the equivalent plastic
displacement. The fracture energy is defined as a function of mixed-mode which uses the power
law expression as given in equation (7). , ,IC IIC IICG G G are the critical strain energy release rates
for Mode I, II and III, respectively.
1
I II III
IC IIC IIIC
G G G
G G G (7)
The critical strain energy release rate GIC measured by the critical energy release rate in a DCB
test is the most important parameter that defines the cohesive traction-separation behavior.
Besides, the value of separation at the final failure and the shape of the softening portion of the
traction-separation curve are other parameters to be determined. In this work, once the damage is
initiated by the quadratic nominal stress criterion, the damage evolution follows according to the
given damage evolution law in equation (7). In the following numerical example, finite element
analysis of a 2D plain strain problem has been conducted. The values of GIC and GIIC are from
[37], which are measured by the critical energy release rate in DCB test and edge notch flexure
(ENF) test, respectively. Separation force and delamination length for FM-73 are also provided in
the same reference, which are used to determine the maximum normal and tangential traction
strengths of the material.
3.2. Numerical example
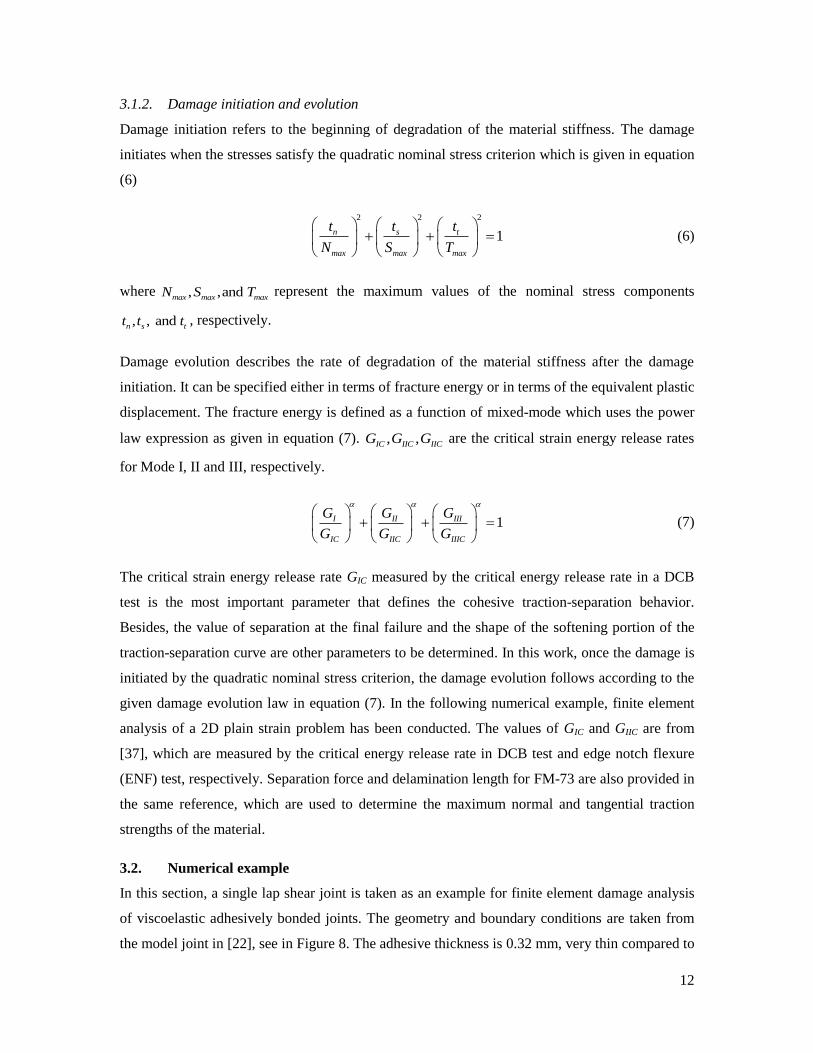
In this section, a single lap shear joint is taken as an example for finite element damage analysis
of viscoelastic adhesively bonded joints. The geometry and boundary conditions are taken from
the model joint in [22], see in Figure 8. The adhesive thickness is 0.32 mm, very thin compared to
13
the dimensions of the adherends. Fixed boundary condition is applied on the left end of the
bonded joint system. On the right end, vertical displacement uy is zero at top and bottom of the
adherend. Uniform stress is applied on the right end with the rates of 15 MPa/s and 7.5 MPa/s,
respectively. Steel is used as adherend here with E = 200 GPa and v= 0.33, while FM-73 is used
as adhesive material.
Figure 8: Geometry and boundary conditions for the model joint.
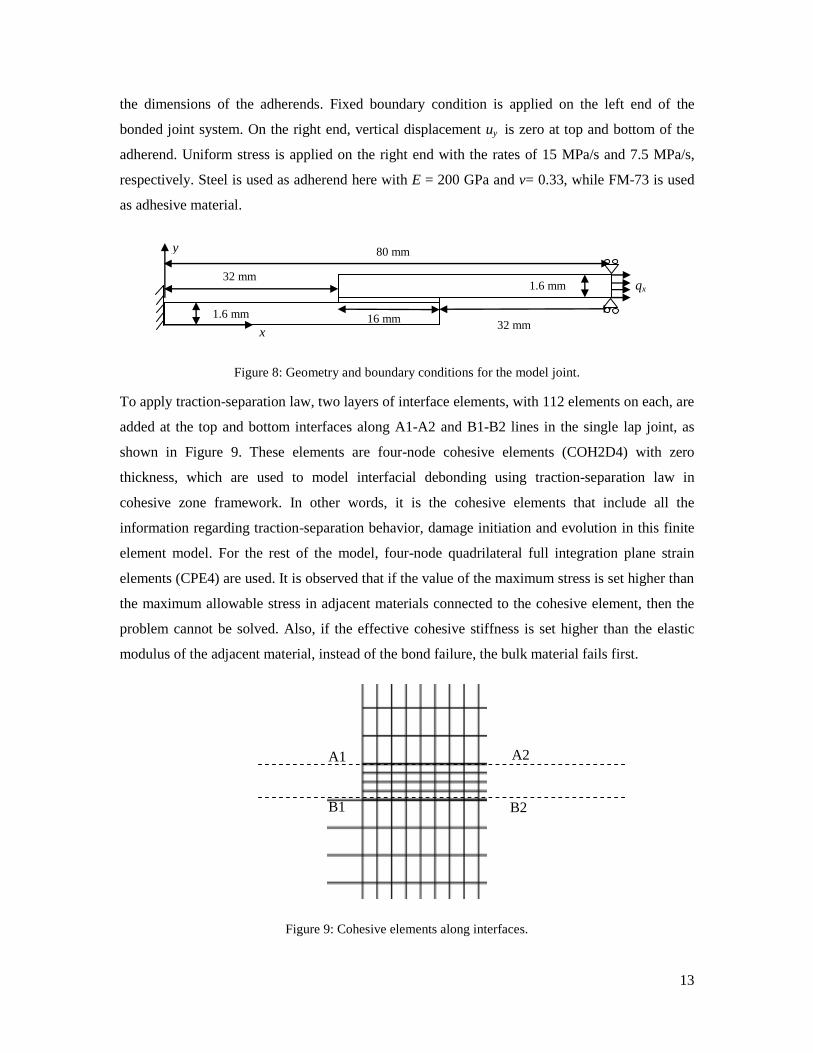
To apply traction-separation law, two layers of interface elements, with 112 elements on each, are
added at the top and bottom interfaces along A1-A2 and B1-B2 lines in the single lap joint, as
shown in Figure 9. These elements are four-node cohesive elements (COH2D4) with zero
thickness, which are used to model interfacial debonding using traction-separation law in
cohesive zone framework. In other words, it is the cohesive elements that include all the
information regarding traction-separation behavior, damage initiation and evolution in this finite
element model. For the rest of the model, four-node quadrilateral full integration plane strain
elements (CPE4) are used. It is observed that if the value of the maximum stress is set higher than
the maximum allowable stress in adjacent materials connected to the cohesive element, then the
problem cannot be solved. Also, if the effective cohesive stiffness is set higher than the elastic
modulus of the adjacent material, instead of the bond failure, the bulk material fails first.
Figure 9: Cohesive elements along interfaces.
32 mm
y
x
80 mm
16 mm 1.6 mm
1.6 mm
32 mm
qx
A1 A2
B1 B2
14
3.2.1. Joint stiffness
In the single lap shear test, the joint stiffness is represented by the relationship between applied
load at the end of the bonded joint system and corresponding displacement at the end. Joint
stiffness reflects the general load carrying ability of the bonded joint system, although it does not
give detailed information about adhesive-adherend interfaces and local stress concentration areas.
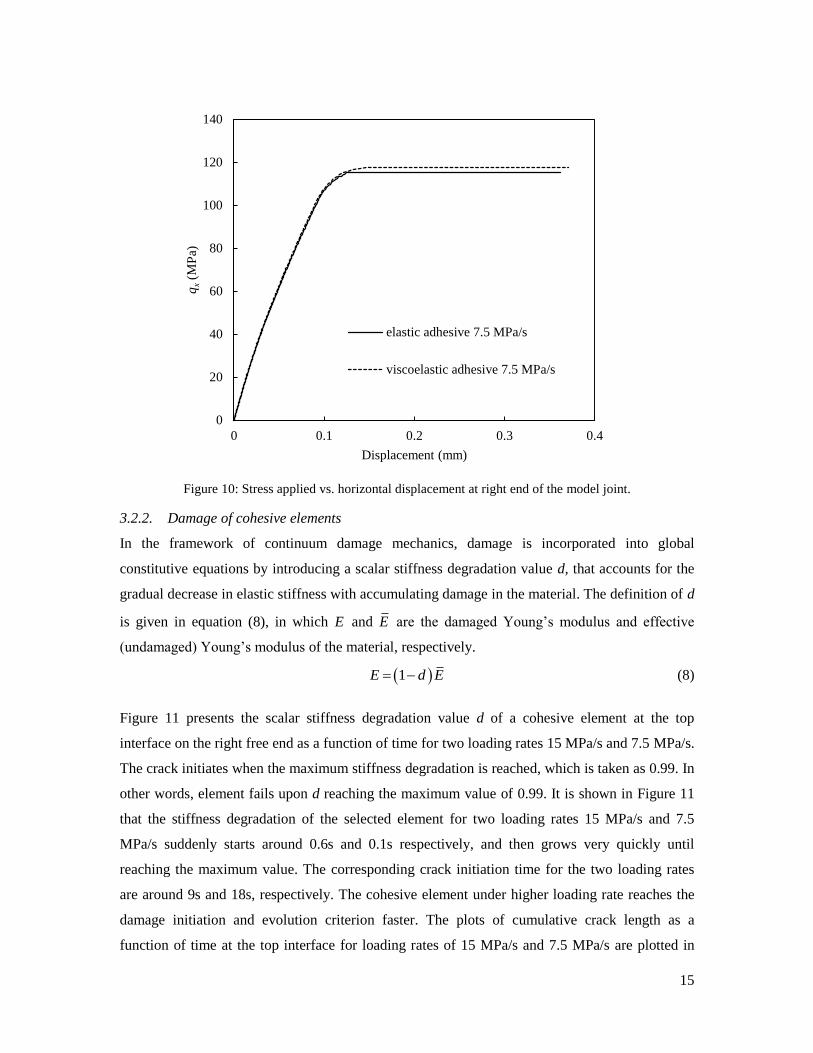
Figure 10 shows the curves of the stress applied versus horizontal displacement on the right end
of the bonded joint system when the loading rate is 7.5 MPa/s for adhesive with both elastic and
viscoelastic material properties. We can see that once the cracks at the adhesive-adherend
interfaces initiate from the ends, they start to propagate and the bonded joint system has lost the
capability to carry more loads in both cases, which shown in Figure 10 is that qx stops growing as
the horizontal displacement increases. When one of cracks propagates through the whole overlap
length, the bonded joint system will totally fail and qx will drop to zero. However in the real
experiments, the propagation of the crack usually occurs so fast that the curves obtained will not
have the plateau parts as those in Figure 10. This means the bonded joint system will suddenly
reach a complete failure and qx becomes zero. Also, it can be seen that the elastic case fails at a
lower qx than the viscoelastic case. This is because as the relaxation modulus of viscoelastic
adhesive decreases with time, elastic adhesive with Young’s modulus equals to E(0) will
experience higher stress level in local stress concentration area and fail first. Therefore, the
bonded joint system with elastic adhesive will not be able to carry more loads earlier and reach a
smaller peak value of qx than viscoelastic adhesive. Here we can conclude that when the
relaxation modulus of viscoelastic adhesive has terms with bigger values of and i ig (in other
words, E(t) will eventually have a lower value and take longer time to relax), the joint stiffness of
the system will be more enhanced.
15
Figure 10: Stress applied vs. horizontal displacement at right end of the model joint.
3.2.2. Damage of cohesive elements
In the framework of continuum damage mechanics, damage is incorporated into global
constitutive equations by introducing a scalar stiffness degradation value d, that accounts for the
gradual decrease in elastic stiffness with accumulating damage in the material. The definition of d
is given in equation (8), in which E and E are the damaged Young’s modulus and effective
(undamaged) Young’s modulus of the material, respectively.
1 E d E (8)
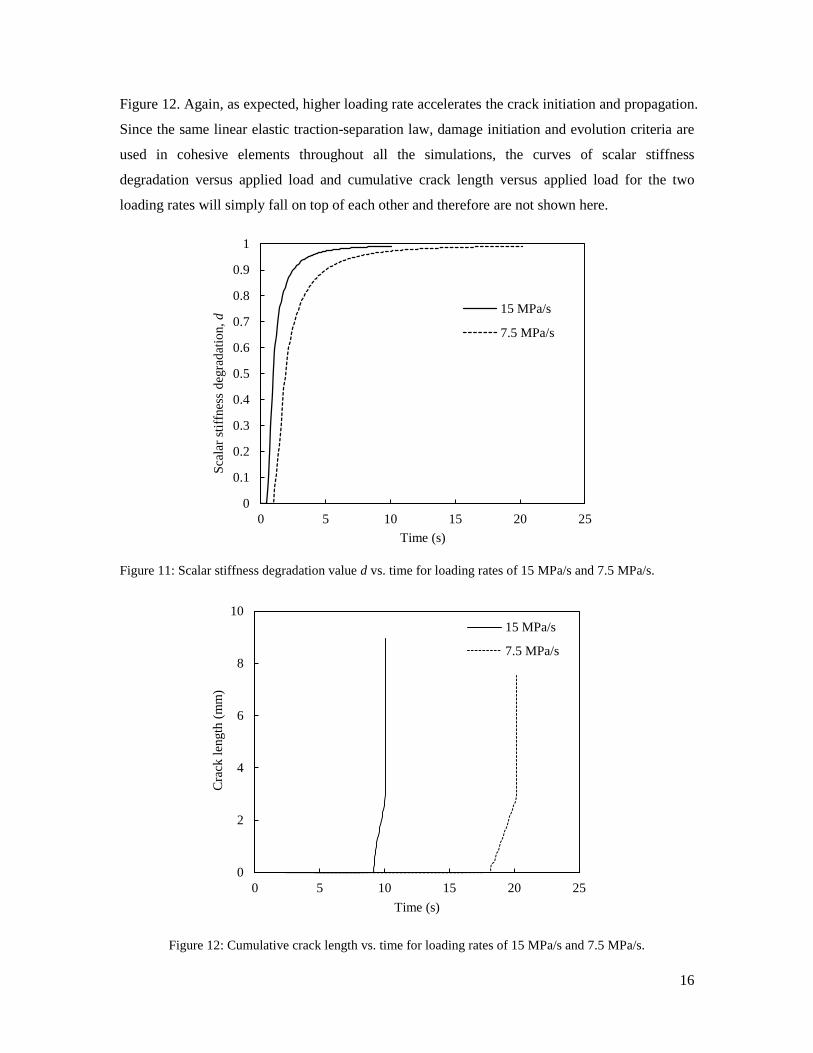
Figure 11 presents the scalar stiffness degradation value d of a cohesive element at the top
interface on the right free end as a function of time for two loading rates 15 MPa/s and 7.5 MPa/s.
The crack initiates when the maximum stiffness degradation is reached, which is taken as 0.99. In
other words, element fails upon d reaching the maximum value of 0.99. It is shown in Figure 11
that the stiffness degradation of the selected element for two loading rates 15 MPa/s and 7.5
MPa/s suddenly starts around 0.6s and 0.1s respectively, and then grows very quickly until
reaching the maximum value. The corresponding crack initiation time for the two loading rates
are around 9s and 18s, respectively. The cohesive element under higher loading rate reaches the
damage initiation and evolution criterion faster. The plots of cumulative crack length as a
function of time at the top interface for loading rates of 15 MPa/s and 7.5 MPa/s are plotted in
0
20
40
60
80
100
120
140
0 0.1 0.2 0.3 0.4
qx
(MP
a)
Displacement (mm)
elastic adhesive 7.5 MPa/s
viscoelastic adhesive 7.5 MPa/s
16
Figure 12. Again, as expected, higher loading rate accelerates the crack initiation and propagation.
Since the same linear elastic traction-separation law, damage initiation and evolution criteria are
used in cohesive elements throughout all the simulations, the curves of scalar stiffness
degradation versus applied load and cumulative crack length versus applied load for the two
loading rates will simply fall on top of each other and therefore are not shown here.
Figure 11: Scalar stiffness degradation value d vs. time for loading rates of 15 MPa/s and 7.5 MPa/s.
Figure 12: Cumulative crack length vs. time for loading rates of 15 MPa/s and 7.5 MPa/s.
0
0.1
0.2
0.3
0.4
0.5
0.6
0.7
0.8
0.9
1
0 5 10 15 20 25
Sca
lar
stif
fnes
s d
egra
dat
ion,
d
Time (s)
15 MPa/s
7.5 MPa/s
0
2
4
6
8
10
0 5 10 15 20 25
Cra
ck l
ength
(m
m)
Time (s)
15 MPa/s
7.5 MPa/s
17
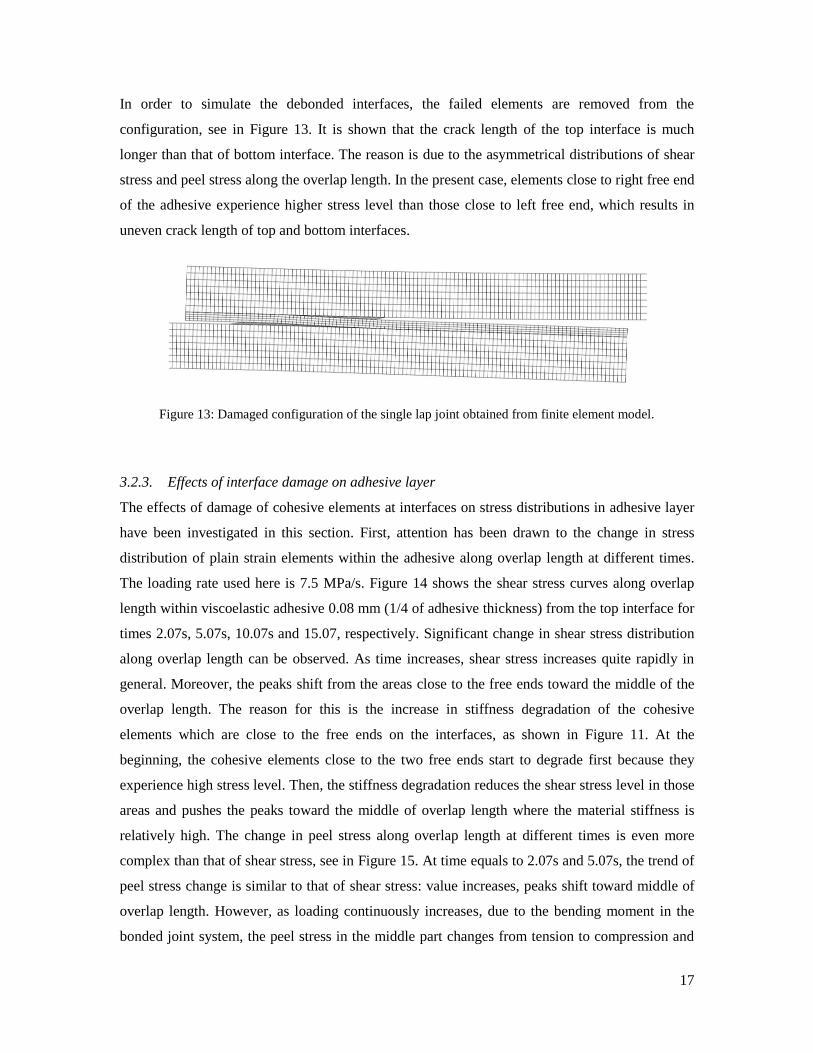
In order to simulate the debonded interfaces, the failed elements are removed from the
configuration, see in Figure 13. It is shown that the crack length of the top interface is much
longer than that of bottom interface. The reason is due to the asymmetrical distributions of shear
stress and peel stress along the overlap length. In the present case, elements close to right free end
of the adhesive experience higher stress level than those close to left free end, which results in
uneven crack length of top and bottom interfaces.
Figure 13: Damaged configuration of the single lap joint obtained from finite element model.
3.2.3. Effects of interface damage on adhesive layer
The effects of damage of cohesive elements at interfaces on stress distributions in adhesive layer
have been investigated in this section. First, attention has been drawn to the change in stress
distribution of plain strain elements within the adhesive along overlap length at different times.
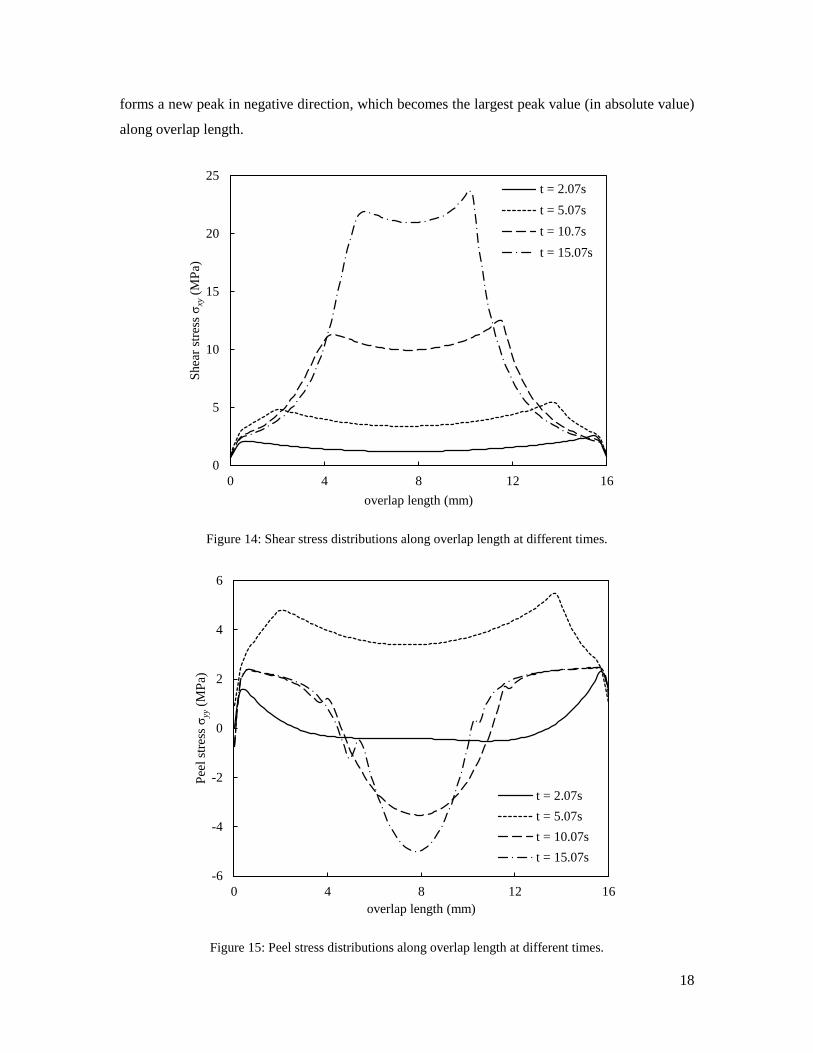
The loading rate used here is 7.5 MPa/s. Figure 14 shows the shear stress curves along overlap
length within viscoelastic adhesive 0.08 mm (1/4 of adhesive thickness) from the top interface for
times 2.07s, 5.07s, 10.07s and 15.07, respectively. Significant change in shear stress distribution
along overlap length can be observed. As time increases, shear stress increases quite rapidly in
general. Moreover, the peaks shift from the areas close to the free ends toward the middle of the
overlap length. The reason for this is the increase in stiffness degradation of the cohesive
elements which are close to the free ends on the interfaces, as shown in Figure 11. At the
beginning, the cohesive elements close to the two free ends start to degrade first because they
experience high stress level. Then, the stiffness degradation reduces the shear stress level in those
areas and pushes the peaks toward the middle of overlap length where the material stiffness is
relatively high. The change in peel stress along overlap length at different times is even more
complex than that of shear stress, see in Figure 15. At time equals to 2.07s and 5.07s, the trend of
peel stress change is similar to that of shear stress: value increases, peaks shift toward middle of
overlap length. However, as loading continuously increases, due to the bending moment in the
bonded joint system, the peel stress in the middle part changes from tension to compression and
18
forms a new peak in negative direction, which becomes the largest peak value (in absolute value)
along overlap length.
Figure 14: Shear stress distributions along overlap length at different times.
Figure 15: Peel stress distributions along overlap length at different times.
0
5
10
15
20
25
0 4 8 12 16
Shea
r st
ress
σxy
(M
Pa)
overlap length (mm)
t = 2.07s
t = 5.07s
t = 10.7s
t = 15.07s
-6
-4
-2
0
2
4
6
0 4 8 12 16
Pee
l st
ress
σyy
(M
Pa)
overlap length (mm)
t = 2.07s
t = 5.07s
t = 10.07s
t = 15.07s
19
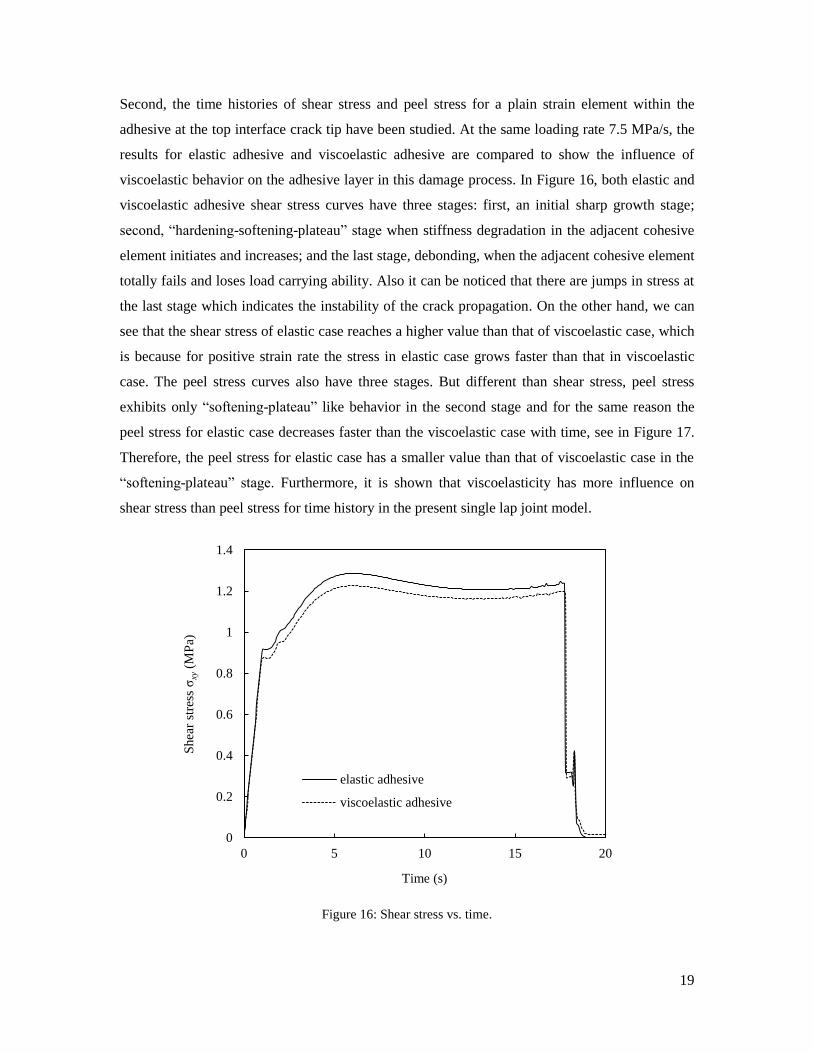
Second, the time histories of shear stress and peel stress for a plain strain element within the
adhesive at the top interface crack tip have been studied. At the same loading rate 7.5 MPa/s, the
results for elastic adhesive and viscoelastic adhesive are compared to show the influence of
viscoelastic behavior on the adhesive layer in this damage process. In Figure 16, both elastic and
viscoelastic adhesive shear stress curves have three stages: first, an initial sharp growth stage;
second, “hardening-softening-plateau” stage when stiffness degradation in the adjacent cohesive
element initiates and increases; and the last stage, debonding, when the adjacent cohesive element
totally fails and loses load carrying ability. Also it can be noticed that there are jumps in stress at
the last stage which indicates the instability of the crack propagation. On the other hand, we can
see that the shear stress of elastic case reaches a higher value than that of viscoelastic case, which
is because for positive strain rate the stress in elastic case grows faster than that in viscoelastic
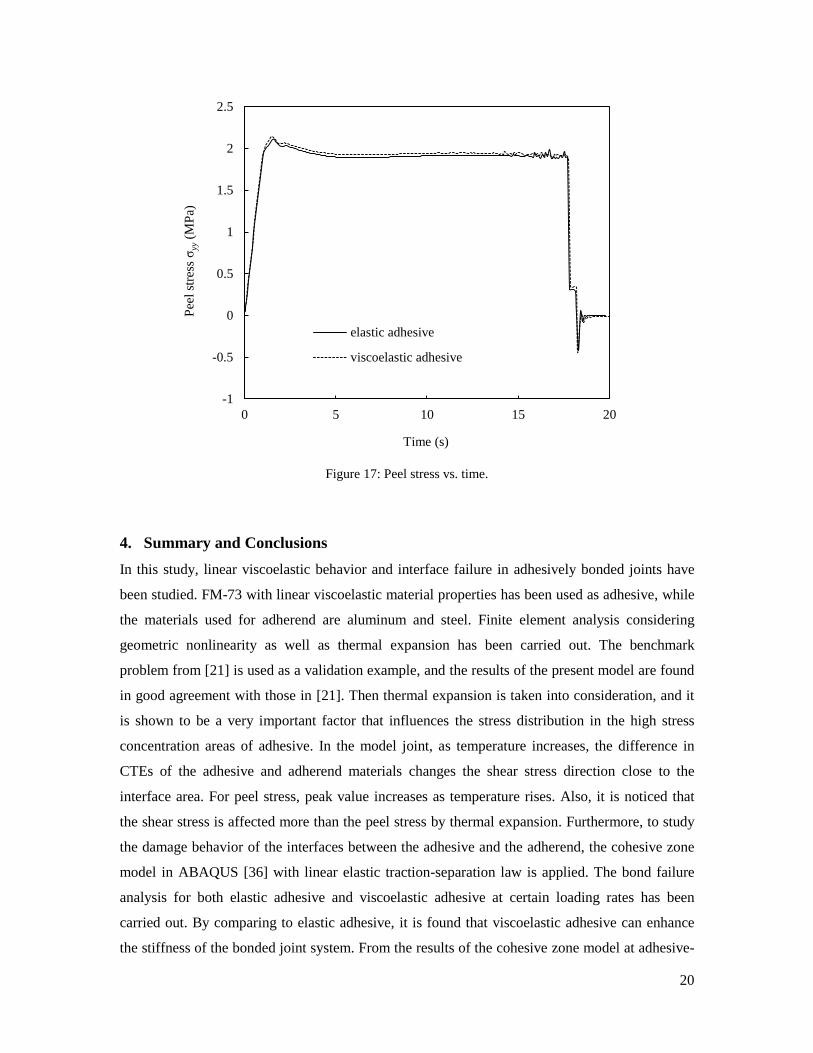
case. The peel stress curves also have three stages. But different than shear stress, peel stress
exhibits only “softening-plateau” like behavior in the second stage and for the same reason the
peel stress for elastic case decreases faster than the viscoelastic case with time, see in Figure 17.
Therefore, the peel stress for elastic case has a smaller value than that of viscoelastic case in the
“softening-plateau” stage. Furthermore, it is shown that viscoelasticity has more influence on
shear stress than peel stress for time history in the present single lap joint model.
Figure 16: Shear stress vs. time.
0
0.2
0.4
0.6
0.8
1
1.2
1.4
0 5 10 15 20
Shea
r st
ress
σxy
(M
Pa)
Time (s)
elastic adhesive
viscoelastic adhesive
20
Figure 17: Peel stress vs. time.
4. Summary and Conclusions
In this study, linear viscoelastic behavior and interface failure in adhesively bonded joints have
been studied. FM-73 with linear viscoelastic material properties has been used as adhesive, while
the materials used for adherend are aluminum and steel. Finite element analysis considering
geometric nonlinearity as well as thermal expansion has been carried out. The benchmark
problem from [21] is used as a validation example, and the results of the present model are found
in good agreement with those in [21]. Then thermal expansion is taken into consideration, and it
is shown to be a very important factor that influences the stress distribution in the high stress
concentration areas of adhesive. In the model joint, as temperature increases, the difference in
CTEs of the adhesive and adherend materials changes the shear stress direction close to the
interface area. For peel stress, peak value increases as temperature rises. Also, it is noticed that
the shear stress is affected more than the peel stress by thermal expansion. Furthermore, to study
the damage behavior of the interfaces between the adhesive and the adherend, the cohesive zone
model in ABAQUS [36] with linear elastic traction-separation law is applied. The bond failure
analysis for both elastic adhesive and viscoelastic adhesive at certain loading rates has been
carried out. By comparing to elastic adhesive, it is found that viscoelastic adhesive can enhance
the stiffness of the bonded joint system. From the results of the cohesive zone model at adhesive-
-1
-0.5
0
0.5
1
1.5
2
2.5
0 5 10 15 20
Pee
l st
ress
σyy
(M
Pa)
Time (s)
elastic adhesive
viscoelastic adhesive
21
adherend interfaces, it is observed that the higher loading rate can accelerate the crack initiation
and propagation at the adhesive-adherend interfaces. Finally, the influences of interface damage
on the stress in adhesive layer are discussed. First, shear and peel stress curves along overlap
length at different times are plotted. Due to the stiffness degradation in the cohesive elements, the
stress distribution along overlap length changed significantly over time: peaks of the stress curves
transfer from close to the free ends toward the middle of the overlap length. Second, time
histories of shear stress and peel stress of a plain strain element in adhesive at the crack tip have
been studied. Quick growth in stress value and debonding from the interface of the plain strain
element can be observed for both shear stress and peel stress at the beginning and the end of the
time history, respectively. In between, shear stress shows a “hardening-softening-plateau” like
behavior, whereas peel stress exhibits a “softening-plateau” character. Also, it is shown that the
shear stress is more affected than the peel stress by the viscoelastic material properties of the
adhesive.
Acknowledgements
The research reported here was carried out under MURI09 grant (Award No. FA-9550-09-1-0686)
from the Air Force Office of Scientific Research. The authors acknowledge many discussions
during the course of this research with Dr. Ozden Ochoa.
References
1
R. D. Adams and N. A. Peppiatt, J. Strain Analysis Eng. Design 9, 185 (1974).
2
I. U. Ojalvo and H.L. Eidinoff, AIAA J. 16, 204 (1978).
3
M. Goland and E. Reissner, J. Appl. Mech 11, A17 (1944).
4
F. Delale, F. Erdogan and M. N. Aydinoglu, J. Composite Mater. 15, 249 (1981).
5
B. Zhao and Z.-H. Lu, Mech. Adv. Mater. Struct. 16, 130 (2009).
6
B. Zhao, Z.-H. Lu and Y.-N. Lu, Intl. J. Adhesion Adhesives 31, 434 (2011).
7
J. N. Reddy and S. Roy, Intl. J. Non-Linear Mech. 23, 97 (1988).
8
W. C. Carpenter, Intl. J. Numer. Methods Eng 15, 1659 (1980).
9
P. A. Cooper and J.W.Sawyer, NASA technical paper 1507, PLASTEC, Dover, NJ
(1979).
10
G. Li, P. Lee-Sullivan and R.W. Thring, Composite Structures 46, 395 (1999).
11
A. G. Magalhães, M. F. S. F. de Moura and J. P. M. Gonçalves, Intl. J. Adhesion
Adhesives 25, 313 (2005).
12
C. Yang, H. Huang, J. S. Tomblin and W. Sun, J. Composite Mater. 38, 293 (2004).
22
13
S. Yadagiri, C. P. Reddy and T. S. Reddy, Computers and Structures 27, 445 (1987).
14
W. C. Carpenter, Computers and Structures 36, 1141 (1990).
15
M. Henriksen, Computers and Structures 18, 133 (1984).
16
R. A. Schapery, A&S Report No.69-2, Purdue University, W. Lafayette, IN (1969).
17
D. Peretz and Y. Weitsman, J. Rheology 27, 97 (1983).
18
W. G. Knauss and I. J. Emri, Computers and Structures 13, 123 (1981).
19
E. B. Becker et al., AFWAL-TR-84-4057, General Dynamics, Fort Worth Division, TX
(1984).
20
S. Roy and J. N. Reddy, Computers and Structures 29, 1011 (1988).
21
S. Roy and J. N. Reddy, Tire Sci. Technol. 16, 146 (1988).
22
S. Roy and J. N. Reddy, Intl. J. Numer. Meth. Eng. 26, 2531 (1988).
23
B. G. Schaffer and D. F. Adams, J. Appl. Mech. 48, 859 (1981).
24
W. G. Knauss, The Deformation in Fracture of High Polymers, New York: Plenum, 501
(1973).
25
R. A. Schapery, Intl. J. Fracture 11, 369 (1975).
26
R. A. Schapery, Intl. J. Fracture 11, 549 (1975).
27
R. A. Schapery, Intl. J. Fracture 11, 141 (1975).
28
W. G. Knauss, J. Eng. Mater. Technol., Trans. ASME 115, 262 (1993).
29
W. G. Knauss and G. U. Losi, J. Appl. Mech., Trans. ASME 60, 793 (1993).
30
D. H. Allen and C. R. Searcy, Intl. J. Fracture 107, 159 (2001).
31
B. Chen and D. A. Dillard, Intl. J. Solids Structures 38, 6907 (2001).
32
F. Dubois, C. Chazal and C. Petit, Mech. Time-Dependent Materials 2, 269 (1998).
33
P. Rahulkumar, A. Jagota, S. J. Bennison and S. Saigal, Intl. J. Solids Structures 37, 1873
(2000).
34
A. Muliana and K. A. Khan, Computational Mater. Sci. 41, 576 (2008).
35
J. N. Reddy, An Introduction to Continuum Mechanics, Cambridge University Press,
New York (2008).
36
ABAQUS, USER MANUAL 6.8.3.
37
O. Ishai, H. Rosenthal and E. D. N. Sela, Composites 19, 49 (1988).


![Finite Element Modeling of Viscoelastic Behavior and ...employed by Becker et al. [19] in developing a finite element program named VISTA for stress analysis of adhesively bonded joints](https://img.pdfslide.us/doc/110x75/5e881059ac5d68371b003377/finite-element-modeling-of-viscoelastic-behavior-and-employed-by-becker-et-al.jpg)


![Dynamic Behavior of Axially Functionally Graded Pipes ...pipes conveying fluid with simply supported ends. Zhang et al. [14] presented a viscoelastic finite element approach to the](https://img.pdfslide.us/doc/110x75/60c3e5065b18141ae64f6a56/dynamic-behavior-of-axially-functionally-graded-pipes-pipes-conveying-fluid.jpg)
![Finite element analysis of viscoelastic nanofluid flow ...usir.salford.ac.uk/39095/1/INT J APPL COM MATH finite element viscoelastic nanofluid...element methods. Khomami et al. [54]](https://img.pdfslide.us/doc/110x75/5e7ddb53137a81676f69cb9b/finite-element-analysis-of-viscoelastic-nanofluid-flow-usir-j-appl-com-math.jpg)