Embed Size (px)
Citation preview

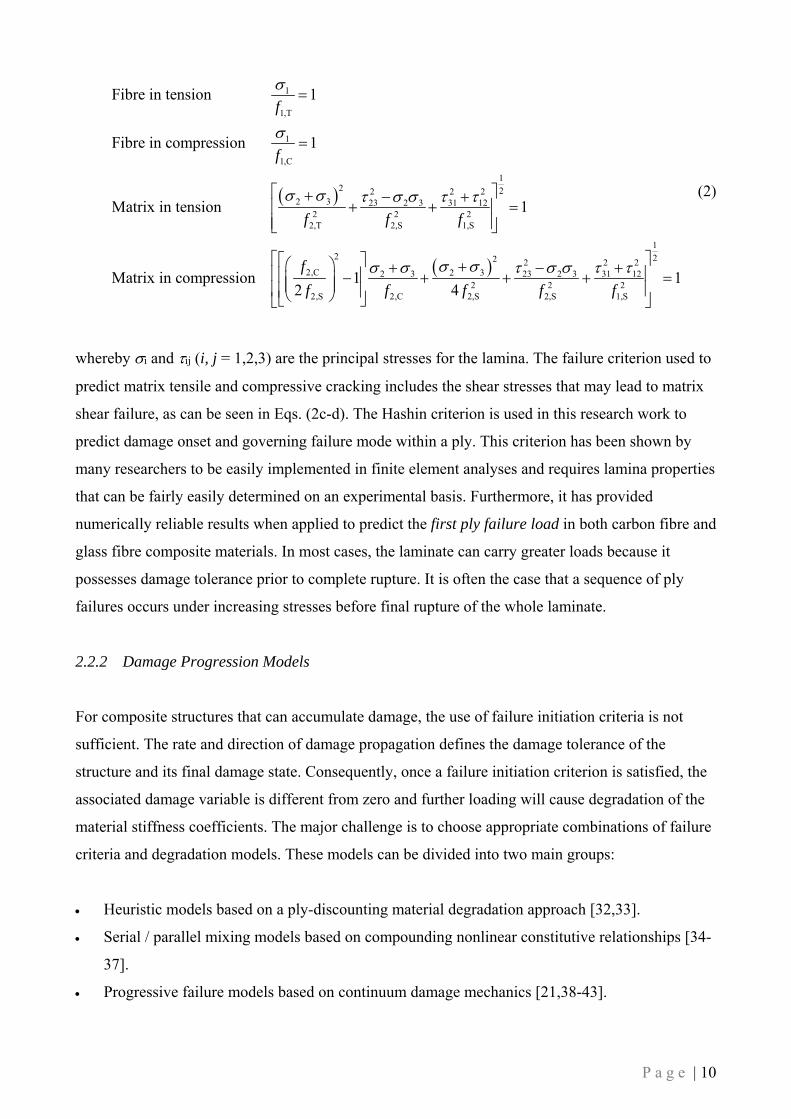
This work is licensed under a
Creative Commons Attribution-NonCommercial-NoDerivatives 4.0 International licence
Newcastle University ePrints - eprint.ncl.ac.uk
Girão-Coelho AM. Finite element guidelines for simulation of delamination
dominated failures in composite materials validated by case studies. Archives
of Computational Methods in Engineering 2016, 1-26.
Copyright:
The final publication is available at Springer via http://dx.doi.org/10.1007/s11831-015-9144-1
Date deposited:
26/01/2016
Embargo release date:
21 February 2016
P a g e | 1
Finite Element Guidelines for Simulation of Delamination Dominated Failures
in Composite Materials Validated by Case Studies
Abstract The focus of this paper is on the computational modelling of progressive damage in
composite structures of fibre reinforced laminae. A general review of modelling approaches to
failure in the context of the finite element method is first presented, with an emphasis on models
based on continuum damage mechanics. The way in which delamination and matrix splitting (that
may or may not interact with fibre-tension damage) should be addressed in the framework of a
commercial finite element code is considered next. An important feature of the analysis is it does
not rely on customized user-subroutines but solely on the analysis capabilities of the general
purpose software Abaqus, thus ensuring that the numerical results can be universally reproduced. It
is shown that the finite element simulations can accurately represent the physical mechanisms
controlling damage development and progression and reproduce a number of phenomena including
delamination, laminate in-plane failure and behaviour at notches. The paper ends giving guidelines
for the generalized modelling methodology using Abaqus without user-subroutines.
Keywords Delamination; Finite element modelling; In-plane failure; Notched strength.
1 Introduction
Composite structures commonly found in aerospace, automotive and civil engineering applications
exhibit a distinctively nonlinear behaviour. This nonlinearity can arise in various ways. The
heterogeneous nature of the material, which consists of fibres of one material (usually carbon or
glass) in a matrix material of another (typically a polymer resin), makes the mechanical behaviour
complex. This observation holds with respect to the stress-strain constitutive response, with
directionally dependent properties, and to the failure behaviour, usually of a brittle type. In addition,
since many composite structures consist of thin plates, they are likely to undergo large deflections.
The description of real composite behaviour is a challenge, either using experimental
procedures, or numerical methods. In this respect, virtual tests for composite materials carried out
by means of numerical modelling are increasingly replacing some mechanical and physical tests to
predict and substantiate their structural performance and integrity due to recent developments in

P a g e | 2
software-based nonlinear finite element analysis methods, particularly in composite-specific tools.
This includes the computational advances in fracture modelling, especially the improvement of
cohesive models of fracture and the formulation of hybrid stress-strain and traction-displacement
models that combine continuum and discrete material damage representations in one single
calculation.
Finite element simulations as virtual tests can be performed at any scale level of the structural
composite. Fig. 1 illustrates a composite laminate with unidirectional plies and the three different
modelling scales: (i) the microscale (constitutive modelling of fibre and matrix), (ii) the mesoscale
(ply level as a multiphase material), and (iii) the macroscale (the laminate is modelled as a series of
stacked unidirectional plies). In this contribution, modelling is performed on the mesoscale at which
the ply is considered to be a homogeneous continuum. In other words, the material is homogenized
by smearing the behaviour of the fibres and the matrix over a single ply. Interface elements between
plies serve as the basis to model delamination.
Fig. 1 Modelling scales for laminates
In order to obtain meaningful and reliable finite element simulations, the analysis has to
account for the different failure (or damage) processes, mitigation, progression and their interaction.
Matrix-dominated processes, especially delaminations, correspond to the onset of damage in most
composite designs, and are one of the characteristics that distinguish their behaviour from that of
metallic structures. Delamination can occur during manufacturing or due to interlaminar stresses,
combined with a typically low through-thickness strength. Delaminations are often seen to occur at
stress free edges due to the mismatch in properties of the individual plies, sections with thickness
variation, at regions subjected to out-of-plane loading, and at notches. The introduction of notches
to composite systems leads to stress concentrations that cannot be redistributed by plastic flow as in
ductile metals.
These damage initiation mechanisms do not necessarily lead to loss of structural integrity.
Further load can be accommodated due to stress redistribution over the fibres. This introduces the
concept of progressive failure (or damage) of the composite material. In this framework, the
Constituents (matrix and fibres)
Microscale
Lamina Mesoscale
Laminate Macroscale
P a g e | 3
numerical models are based on critical stress/strain values that trigger failure initiation, critical
energy release values or damage mechanics considerations that describe failure propagation, as
explained later. As this process progresses from mesoscale and macroscale to a large composite
structure, the result is a continuing weakening of the whole structure, up to the point where the
structure can no longer carry more load. This process is highly nonlinear as it degrades the ply and
the laminate stiffness and extends beyond damage initiation.
This paper focuses on the analysis of the crucial role of delamination in determining in-plane
strength of laminates that frequently leads to premature initiation of failure. The current study has
been broken down into the following sections:
• Section 2 reviews the main features of computational finite element modelling of failure of
composite materials. This review is also intended to serve as a point of departure for those who
wish to pursue the subject matter. Therefore it is designed to offer as comprehensive a coverage
as possible of the current state-of-the-art in the subject.
• Section 3 is concerned with (i) the application of cohesive zone interface elements to model
delamination, and (ii) the benchmark analysis of notched composite plates, using the
commercial finite element software Abaqus [1]. We first study delamination failures in simple
configurations such as Double Cantilever Beam (DCB) and End Notched Flexure (ENF) tests.
Splitting and delamination failures (and their interaction with fibre-breakage) are modelled next
in centre notched cross-ply laminates. The numerical models include a continuum damage
approach to intralaminar failure modelling and a cohesive zone model to represent the
delamination behaviour at the interfaces. A simplified procedure to ensure damage localization
is proposed. It is shown that the proposed model clearly captures the tendency of matrix
dominated failure to propagate in the fibre direction using a continuum modelling approach,
without the need to explicitly model the cracks by means of interface elements as in the original
works. When properly implemented, the proposed methodology is shown to ensure a large
degree of objectivity with respect to finite element discretization, and, simultaneously it
requires little or no modification to standard commercial finite element codes, such as Abaqus
[1]. This latter aspect is particularly relevant to practising engineers in industry who are
concerned with virtual testing related to structural integrity and damage tolerance of fibre
reinforced polymers for safety critical structures.
A summary of guidelines for analysis and conclusions are presented in Sections 4 and 5,
respectively.

P a g e | 4
2 Failure Analysis in the Context of the Finite Element Method
The full behaviour of composite structures can be predicted with numerical finite element
simulations. The numerical modelling of this type of problem in the elastic range is quite
straightforward. However, the nature of failure initiation and progression to rupture, involving
matrix, fibre and/or interface damage and fracture, makes the analysis rather complex. Loads in
composite structures are predominantly carried by axial forces in the fibres, and the failure process
is driven by the energy released as they are unloaded after fracture. As well as this occurring by
fibres failing, it can also happen by matrix dominated failures, in the form of cracks and
delamination, joining-up to produce a fracture surface without the need to break reinforcing fibres.
The typical constitutive behaviour is characterized by an initial linear response followed by a
second nonlinear phase of reduced stiffness that involves the formation of micro-cracks in the
vicinity of the crack tip. The strain energy accumulated in the material specimen is released at the
peak-load and a stable crack propagates progressively with a reduction in strength and stiffness until
it eventually breaks. This is a typical quasi-brittle behaviour, although most polymer based matrices
can deform plastically before damage when subjected to shear loading. This progressive damage
modelling is carried out in three steps [2]:
1. Stress analysis: the geometry of the structure being known, together with the history of loading
and initial conditions, the fields of stress and strain are first calculated by means of strain
constitutive equations and a numerical procedure, e.g. finite element modelling.
2. Failure criterion or criteria: the most critical location(s) with regard to fracture is (are)
determined and, the load corresponding to a macro-crack initiation at that point is calculated by
integration of damage constitutive equations for the history of local stress or strain.
3. Degradation of material properties based on damage progression models to calculate the
evolution of that macro-crack up to the final rupture of the whole structure.
This section reviews the main features of computational finite element modelling of failure of
composite laminated structures. Some of the key concepts are considered first, including the
element types and the material parameters. The mechanisms by which composites may fail are then
discussed, first for intralaminar failure, and then for interlaminar delamination. The different
approaches for the modelling of such mechanisms are also considered. Numerical aspects to the
effective application of the progressive damage modelling are finally discussed.

P a g e | 5
2.1 Key Concepts
2.1.1 Element Types
An efficient geometric modelling has to account for the non-homogeneous and layered nature of the
laminate. The finite element model must firstly represent the ply (or lamina) orientation, the
stacking sequence and thickness variation, and secondly provide an adequate representation of the
global stress field, the through-thickness stress variations, local stress concentrations and failure
modes. The analysis has then to be treated as being three-dimensional. Solid (brick) elements with
one layer of bricks representing each ply can be used. This option is not practical because the
analysis would be computationally expensive to run if the layup had just more than a few plies.
Additionally, conventional solids show an overly stiff behaviour and different effects of locking,
especially the Poisson thickness locking effect, when used in very thin applications [3]. In practice,
it is usual to employ shell elements, particularly in the form of continuum shells, which are elements
that have the geometry of bricks but their kinematic and constitutive behaviour are similar to those
of conventional shell elements. The continuum shell elements are able to reproduce reliable results
in simulations of thin-walled structures by means of only one element over the thickness due to a
higher-order displacement field. First approaches of this kind assumed a constant strain field over
the thickness and can be found in Parisch [4], and Hauptmann and co-workers [5,6]. This approach
was later extended by Remmers et al. [7] who considered an additional set of internal degrees of
freedom to add a quadratic term to the displacement field that allows for a linear variation of the
strain field over the thickness.
There are displacement and stress field singularities due to combined material/geometrical
discontinuities between plies where intralaminar stresses develop during thermo-mechanical
loading. This can lead to discrete delamination failures. This type of failure can be physically
captured by means of a cohesive zone approach. Cohesive interface elements are currently adopted
as a way of modelling this type of phenomenon [8-15]. In this approach, the discontinuous
displacement field is described by relative displacements or relative jumps between a double set of
nodes, for the normal (opening) and the two shear modes (sliding and tearing) [16]. An important
feature of interface elements is that they include the effect of first failure, and the subsequent
fracture propagation by means of critical strain energy release ratios. The interface layer is usually
considered to be of zero (or nearly zero) thickness for analysis purposes.

P a g e | 6
2.1.2 Material Parameters
The unidirectional ply is an orthotropic material whose planes of symmetry are parallel and
transverse to the fibre direction. The material coordinate axes are quite often designated as 1, 2 and
3, see Fig. 2:
Axis-1 runs parallel to the direction of the fibres (longitudinal direction).
Axis-2 runs normal to axis-1 in the plane of the ply (in-plane transverse direction).
Axis-3 runs normal to the plane of the ply (through-thickness direction).
Fig. 2 Ply coordinate system
The mechanical behaviour of the materials in both continuum and interface modelling
approaches is characterized by means of a constitutive law that includes the fundamental
parameters. Damage-based material models for composite materials usually contain:
1. A law for the elastic behaviour of the elementary ply, which is idealized as a homogeneous
material by smearing the distinct properties of the fibre and matrix, based on the transversely
isotropic version of Hooke’s law [17]. The relevant engineering constants are the moduli of
elasticity in the fibre and transverse directions, E1 and E2, the longitudinal and transverse
Poisson’s ratios, 21 and 23, the longitudinal and transverse shear moduli, G12 and G23.
2. Longitudinal, transverse and shear strength of the lamina [18]:
f1,T: axial strength in tension; f2,C: transverse strength in compression;
f1,C: axial strength in compression; f1,S: shear strength in the axial direction;
f2,T: transverse strength in tension; f2,S: shear strength in the transverse direction.
3. Fracture energy (or fracture thoughness), Gc, in the above directions [19-21]. Gc governs crack
growth and is defined as the work needed to create a unit area of a fully developed crack.
The interface behaviour is represented by cohesive laws, first introduced by Dugdale [22] and
Barenblatt [23] in the context of the problem of equilibrium cracks. These constitutive relations
describe the stress-separation behaviour (also known as the cohesive traction versus jump
1 2
3
Fibres
P a g e | 7
displacement law) of a failure process zone. In fracture mechanics, any cohesive law consists of
three main features that are identical to the above:
1. An elastic region characterized by a scalar stiffness parameter, which can be interpreted as a
penalty factor.
2. The interfacial strength.
3. The area enclosed by the traction-displacement curve that is equal to the fracture toughness of
the material.
The shape assumption of the curve completes the cohesive law. Although a variety of
geometric shapes have been proposed (e.g. Tvergaard and Hutchinson [24], Xu and Needleman
[25], who proposed trapezoidal and exponential laws, respectively), the simple bi-linear curve
representation (e.g. Mi et al. [8], Camanho et al. [26], Jiang et al. [14]) is usually implemented for
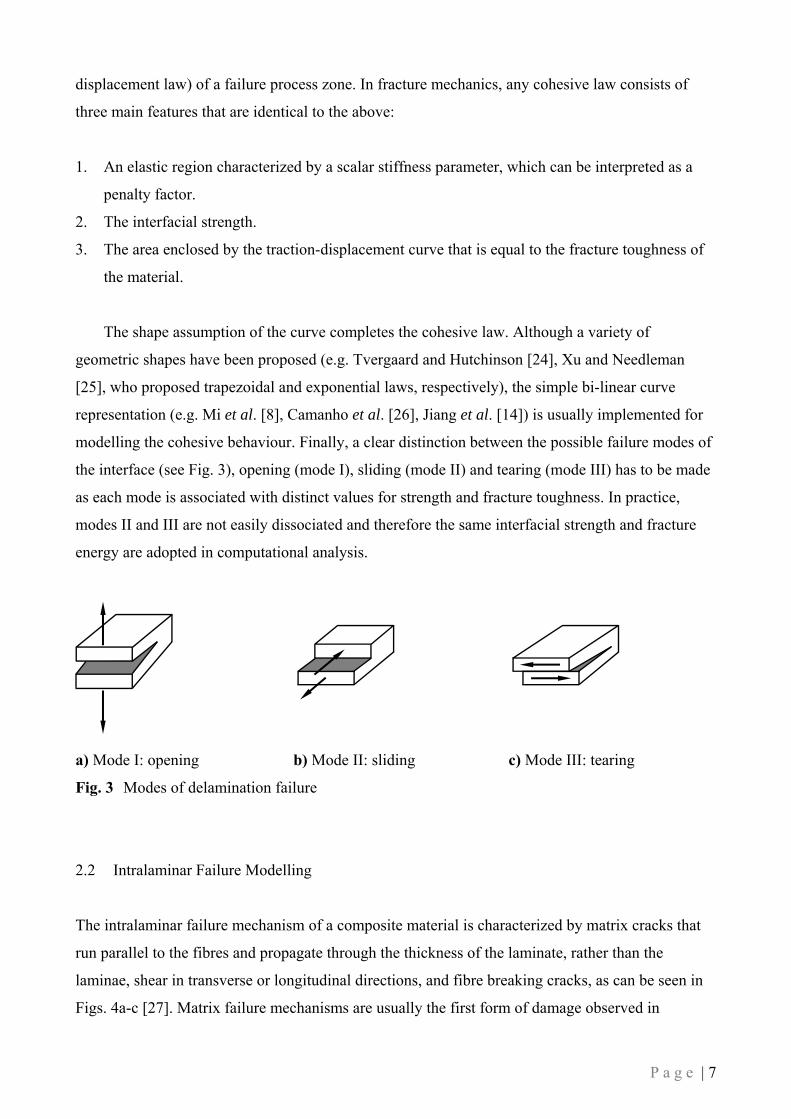
modelling the cohesive behaviour. Finally, a clear distinction between the possible failure modes of
the interface (see Fig. 3), opening (mode I), sliding (mode II) and tearing (mode III) has to be made
as each mode is associated with distinct values for strength and fracture toughness. In practice,
modes II and III are not easily dissociated and therefore the same interfacial strength and fracture
energy are adopted in computational analysis.
a) Mode I: opening b) Mode II: sliding c) Mode III: tearing
Fig. 3 Modes of delamination failure
2.2 Intralaminar Failure Modelling
The intralaminar failure mechanism of a composite material is characterized by matrix cracks that
run parallel to the fibres and propagate through the thickness of the laminate, rather than the
laminae, shear in transverse or longitudinal directions, and fibre breaking cracks, as can be seen in
Figs. 4a-c [27]. Matrix failure mechanisms are usually the first form of damage observed in

P a g e | 8
laminates. Fibre fracture marks the ultimate failure in a well-designed laminate. In fact, fibre
fracture can be seen as the only desirable fracture mechanism, since the fibre reinforcement forms
the main load carrying structure. In Figs. 4a and 4b the fracture surfaces caused by transverse
compression and transverse shear respectively are illustrated too. The fracture angle ±35° to ±40° is
typical for pure compression [28]. The fracture angle for pure transverse shear is approximately
45°. This fracture behaviour is well known for brittle materials.
Transverse tension (mode 2,T) Transverse compression (mode 2,C)
a) Matrix failure
Transverse shear (mode 2,S) Longitudinal shear (mode 1,S)
b) Shear failure
Fibre breakage
Tension (mode 1,T)
Fibre fracture in shear Micro-buckling Kinking
Compression (mode 1,C)
c) Fibre failure
Fig. 4 Forms of failure (after Knops [27])
35° to 40°
45°

P a g e | 9
Continuum damage mechanics models for the prediction of intralaminar failure are used in this
work with a range of examples on different applications. The damage mechanics of composites is
the modelling of the initiation and degradation phenomena at a structural analysis scale. At this
scale, the laminate is modelled as a stacking of homogeneous layers connected by interfaces.
Relative variations of stiffness are the damage indicators. The progressive transverse matrix
cracking and the brittle fracture of fibres are included at the single lamina level. The damage state at
every (1,2) point, see Fig. 2, is assumed to be uniform within the layer thickness.
2.2.1 Failure Initiation Theories of a Lamina
Literature presents two types of failure initiation criteria for a lamina: phenomenological and
physically-based. Phenomenological criteria have been proposed by extending and adapting failure
theories to account for the anisotropy in stiffness and strength, but they do not reflect the level of
complexity that is inherent to this type of structural material. Underlying such complexity is the fact
that composites consist of mechanically dissimilar phases, stiff elastic brittle fibres and a compliant
yielding matrix. Physically-based criteria distinguish between states of stress not leading to fracture
and those implying fracture.
The Tsai-Wu interactive (phenomenological) criterion [29] is the most commonly adopted in
research methodologies and essentially consists of a single relation for the interaction of the
different internal stress components i in the material frame. For a general anisotropic material the
failure surface in the stress-space has the following scalar form:
2i i ij i j ii jj ij1 and 0 F F F F F (1)
whereby Fi, Fij are strength tensors of the second and fourth rank, respectively. The following
contracted notation is used in the above equation: i, j = 1, 2, ... 6.
The first failure theory that makes a clear distinction between the different lamina failure
modes was developed by Hashin and Rottem [30], later modified by Hashin [31] to predict the
onset of damage. This theory consists of the following expressions:
P a g e | 10
1
1,T
1
1,C
12 22 2 2
2 3 23 2 3 31 122 2 2
2,T 2,S 1,S
2 2 22,C 2 32 3 23
22,S 2,C 2,S
Fibre in tension 1
Fibre in compression 1
Matrix in tension 1
Matrix in compression 12 4
f
f
f f f
f
f f f
1
22 22 3 31 12
2 22,S 1,S
1f f
(2)
whereby i and ij (i, j = 1,2,3) are the principal stresses for the lamina. The failure criterion used to
predict matrix tensile and compressive cracking includes the shear stresses that may lead to matrix
shear failure, as can be seen in Eqs. (2c-d). The Hashin criterion is used in this research work to
predict damage onset and governing failure mode within a ply. This criterion has been shown by
many researchers to be easily implemented in finite element analyses and requires lamina properties
that can be fairly easily determined on an experimental basis. Furthermore, it has provided
numerically reliable results when applied to predict the first ply failure load in both carbon fibre and
glass fibre composite materials. In most cases, the laminate can carry greater loads because it
possesses damage tolerance prior to complete rupture. It is often the case that a sequence of ply
failures occurs under increasing stresses before final rupture of the whole laminate.
2.2.2 Damage Progression Models
For composite structures that can accumulate damage, the use of failure initiation criteria is not
sufficient. The rate and direction of damage propagation defines the damage tolerance of the
structure and its final damage state. Consequently, once a failure initiation criterion is satisfied, the
associated damage variable is different from zero and further loading will cause degradation of the
material stiffness coefficients. The major challenge is to choose appropriate combinations of failure
criteria and degradation models. These models can be divided into two main groups:
Heuristic models based on a ply-discounting material degradation approach [32,33].
Serial / parallel mixing models based on compounding nonlinear constitutive relationships [34-
37].
Progressive failure models based on continuum damage mechanics [21,38-43].
P a g e | 11
The classical ply discount method assumes that a failed ply cannot take any further load. In
reality, a fractured ply can exhibit significant load-carrying capacity. In addition, delamination
damages are not taken into account by ply discount methods.
Serial / parallel mixing models are able to predict the failure and post-failure behaviour of
laminates. These models can be understood as constitutive equations managers that obtain the
composite constitutive performance by combining the mechanical behaviour of its different
constituents, i.e. matrix and fibres [35]. These models are able to simulate both intralaminar [34,35]
and interlaminar [36,37] failures by means of continuum mechanics.
The basic approach of progressive failure analysis is to assume that all material nonlinearity is
due to damage in the form of reduced stiffness. Accordingly, the majority of existing models for
progressive intralaminar failure analyses are based on softening constitutive models that use (i)
scalar damage variables, or (ii) mode-specific strain energy release rates (fracture toughness) and
total dissipated strain energy [40,44-46]. Displacements due to crack opening are smeared over a
characteristic element, as defined in Section 2.4. The shape of the softening law is often assumed to
be inconsequential for the prediction of fracture, provided that it is defined as a function of the
fracture toughness [47].
The approach used in this research work is based on the energy requirement for the
deterioration of stiffness within a characteristic or unit volume per unit time. It also assumes that the
strain energy dissipates gradually as damage develops. Damage evolution laws are defined for the
various possible failure modes (Fig. 4). Each damage evolution law includes the corresponding
fracture toughness, representing the energy dissipated by inelastic processes in the fracture process
zone. Guidelines for the computation of these values are summarized in [21] and [42].
2.2.3 Simulation of Progressive Damage in Abaqus
The present continuum damage model in Abaqus predicts the onset and accumulation of
intralaminar damage mechanisms, as well as final structural collapse by the propagation of a macro-
crack. For this modelling, the Hashin criteria are used for damage initiation, see Eqs. (2). The
influence of damage on the constitutive model is based on the work of Matzenmiller et al. [39]. A
drawback of this damage progression model is that it does not reproduce localization of tensile
fracture properly. This aspect is of concern, and will be resolved by means of the crack band
approach, initially developed by Bažant and Oh [48]. The crack band model uses a modification of
the post-peak part of the constitutive law (damage progression) to enforce the energy dissipation as
determined by experiments by a localized crack band. This simple approach will be further detailed
in Section 2.4.

P a g e | 12
2.3 Interlaminar Delamination Modelling
The fibre-matrix interface gives composites their structural integrity. The interface consists of the
bond between fibre and matrix and the immediate adjacent region. The load transfer from the matrix
to the fibre that takes place at the interface layer is primarily a mechanistic process and involves the
interfacial bond and friction. Delamination is defined as the separation of layers from each other, as
a consequence of shear stresses acting in planes parallel to the layers interfaces and/or tensile
stresses acting in the through-thickness direction. This phenomenon is a typical crack growth
problem and is treated in the framework of fracture mechanics. Today, the most popular
computational method for the prediction of delamination between plies in laminated composites is
based on cohesive zone models that provide a natural bridge between strength-based models and
energy-based models for fracture, allowing delamination to be described by a single framework that
covers a range of applications for which the strength or energy criteria alone might not be sufficient.
Cohesive zone models describe highly localized inelastic processes by traction-separation laws that
link the cohesive traction transmitted by a discontinuity line or surface to the displacement jump,
characterized by the separation vector [49-51]. Independent cohesive laws are used for the opening
mode I, and the sliding and tearing modes, II and III, i.e. the toughness and interfacial strength
values for the three modes are different. Following the approach of Yang and Cox [52], the same
cohesive law can be assumed for the shear modes II and III.
The simulation of interlaminar damage will be based on the cohesive zone approach using the
Abaqus three-dimensional cohesive element COH3D8 at the plies interfaces. The study is
performed in quasi-static regime. The traction-separation law formulation assumes a nonzero elastic
stiffness of the cohesive zone, which is physically motivated by the reduced stiffness of the matrix
rich interface layer as compared to a perfect bond between matrix and fibres. From a numerical
point of view, this elastic stiffness can be understood as a penalty-type enforcement of displacement
continuity in the elastic range. Different guidelines have been proposed for selecting the stiffness of
the interface. Daudeville et al. [53] calculated the stiffness in terms of the thickness and the elastic
modulus of the interface. Camanho et al. [26] used a fixed value of 106 N/mm3 for the modelling of
graphite fibre/epoxy matrix laminates, which is a numerical parameter large enough to ensure the
displacement continuity at the interface. Turon et al. [54] proposed the following relationship:
3 maxK E t (3)
whereby is a coefficient ( >> 1), and tmax is the larger of the sub-laminate thicknesses above or
below the cohesive layer. The choice of the coefficient has to account for the adverse effect that

P a g e | 13
relatively large stiffness values have (i) on the conditioning of the global stiffness matrix for
implicit methods, and (ii) on the critical time step for explicit methods. In order to satisfy these
requirements, Turon et al. [54] proposed a value of 50.
A quadratic stress criterion is used for the damage initiation criterion, i.e. to specify the
conditions for separation in the cohesive zone model [26,55,56] and can be expressed as follows:
2 2 2
n s t
I II III
1f f f
(4)
whereby n is the stress in pure normal mode, s is the stress in the first shear direction,t is the
stress in the second shear direction, fI, fII and fIII are the peak strength values in the same directions,
and:
n n n n nfor 0 and 0 for 0 (5)
because compressive normal stresses do not open the crack.
Progression of damage at the interfaces is modelled using a linear softening law and a critical
mixed mode energy behaviour based on the Benzeggagh-Kenane criterion [57], which is expressed
by the following expression:
c I,c II,c I,c II I IIG G G G G G G
(6)
whereby Gm,c (m = I, II, III) is the total critical strain energy release rate associated with
delamination mode m, and is the semi-empirical criterion exponent applied to delamination
initiation and growth.
2.3.1 Numerical Aspects of Cohesive Zone Modelling
In the cohesive zone modelling framework, implemented in Abaqus, two parameters are needed: the
interfacial strength and the energy release rate, which control delamination initiation and
propagation, respectively.
The use of cohesive zone models in finite element analyses requires that a very fine mesh is
used to ensure that enough interface elements exist within the cohesive zone length at the crack tip.
If the mesh is too coarse, the cohesive stress at the discontinuity may not even reach the interfacial
P a g e | 14
strength and, as a result, failure is missed. Falk et al. [50] suggest a minimum of two to five
elements in order to perform a reliable simulation. To have an idea of the figures involved, Turon et
al. [54] indicate that for typical graphite-epoxy or glass-epoxy composite materials, the length of
the cohesive zone should be smaller than one or two millimetres. As a consequence, the mesh size
required in order to have more than two elements in the cohesive zone should be smaller than half a
millimetre. For large structural models this has the obvious consequence of a computational
expensive solution.
To overcome this problem, it is common practice to use interfacial strength values that are
lower than those determined experimentally [54,58] whilst maintaining the same fracture toughness,
see Fig. 5. This procedure is based on an artificial increase of the cohesive zone length by reducing
the interfacial strength and keeping the energy release rate constant. While the implications of this
procedure have been discussed in literature for the finite element analysis of DCB and ENF
specimens, which are designed to produce pure normal mode I and pure shear mode II
delamination, respectively, without any intralaminar material damage, this method has been also
applied in many other instances in which delamination interacts with matrix splitting.
Fig. 5 Bi-linear traction-separation response (particular case: curve for mode I): variation of
interfacial strength
Inte
rfac
ial s
tren
gth
Opening displacement
fI
fI*
I I*
fI
fI*
I I*
fI
fI*
I I*
GI,c
fI* = 0.80fI
I* = 1.25I
P a g e | 15
2.4 Regularization in Quasi-Static Regime
The underlying mathematical problem of damage-induced deformation localization is that of an ill-
posed boundary-value problem, i.e. a system of ordinary differential equations with solution and
derivative values specified at different points. In general, numerical methods for analysing and
solving ill-posed problems include a so-called regularization parameter, which controls the degree
of smoothing (or regularization) applied to the problem. The technique involves a mathematical
scheme called localization limiter, in order to avoid size effect and numerical instability.
Failure occurs by progressive damage that involves strain localization processes that result in a
sharp decrease of the load-carrying capacity. Strain localization is a concept that describes a
deformation mode, in which the whole deformation of a structure (made from a specific material)
occurs in one or more narrow bands, referred to as the fracture process zone. The formation of these
bands is accompanied by a softening response, usually leading to complete collapse. The width and
direction of localization bands depend on the material parameters, geometry, boundary conditions,
internal stresses/strains, loading distributions and loading rate. As a consequence, numerical
predictions using continuum damage mechanics are found to be strongly dependent on the size of
the finite element mesh. This problem is known as spurious mesh sensitivity: the energy that is
released by cracking damage depends on the mesh size and tends to zero in the limit of an
infinitesimally refined mesh. The explanation for this phenomenon is rather trivial. The release of
stored energy into the fracture front, as described by the local stress-strain relationship per unit
volume, tends to zero when the length of the crack tends to zero. To overcome this difficulty, the
material constitutive model has to be supplemented with some mathematical condition that prevents
localization of smeared cracking into arbitrarily small regions [59]. Nonlocal damage theories have
emerged as an effective means for capturing the size effects. These theories basically relate the
stress at any point to the state of deformation within a finite volume about that point [51,60,61]. The
simplest, and computationally most effective, type of nonlocal approach is the crack band model
[48]. The model ensures the correct energy dissipation in a localized damage band by rescaling the
energy of the post-localization part of the stress-strain relationship by taking the size of the finite
elements into account [51]. The crack band model provides only a partial regularization of the
problem, i.e. it is not a true localization limiter, as it allows the global response characteristics to be
truly captured, but the width of the numerically resolved fracture process zone is still dependent on
the mesh density [62]. In this context, Bažant and Oh [48] derived the following critical size l*
(element characteristic length or length of the fracture process zone) by adjusting the energy
dissipated by each failure mechanism M:
P a g e | 16
M M,c*2
M
2E Gl
f (7)
whereby EM, GM,c and fM are the relevant modulus of elasticity, fracture energy and strength,
respectively. The authors suggest a practical critical size of about half of that determined from Eq.
(7).
The crack band model performs best if the path of the fracture process zone is known in
advance (e.g. tension failure of open hole laminates loaded in tension), and if the mesh is designed
to coincide with this zone.
Strain-softening constitutive models cause additional convergence problems when using global
solution methods because the tangential matrix of the softening material ceases to be positive
definite. This leads to lack of robustness within the equilibrium iterations. The numerical
instabilities can be prevented by adding viscosity to the constitutive model (rate-dependent
behaviour). The artificial viscosity regularization leads to corresponding stiffness matrices that shall
guarantee stable equilibrium iterations. This approach was first proposed by Needleman [63] to
overcome this type of problem when analysing fracture processes in metals. Needleman also
showed why introducing viscous terms in damage laws could be a convenient way to regularize the
ill-posed problems of rate-independent laws.
In this contribution, the general framework of viscous regularization is adopted, as
recommended by Abaqus with its composite damage model, although it involves a nonphysical rate
dependence, and consequently additional effort in model calibration and validation. Values for this
parameter are generally determined by using inverse modelling techniques because it cannot be
explicitly related to any physical quantity. Both Lapczyk and Hurtado [41] and Maimí et al. [64]
successfully implemented artificial viscosity in their continuum material models to improve the
convergence of the numerical algorithm. Chaboche et al. [65], Gao et al. [66] and Hamitouche et al.
[67] used viscous regularization to solve localization problems related to the application of the
cohesive zone model.
2.5 Nonlinear Solution Process
The nature of a progressive failure methodology requires a nonlinear implicit or explicit solver to
establish equilibrium. In implicit formulations, the current stress state and a consistent local tangent
material stiffness matrix are needed to form the internal force vector for the residual force vector
computation, to generate the Jacobian matrix, and to solve the set of algebraic equations at every

P a g e | 17
time step using a Newton-Raphson-like method. In explicit formulations, only the current stress
state is needed to evaluate the current internal force vector in order to advance the transient solution
forward in time. Explicit solvers do not need to form a global stiffness matrix because the linear
equations are not solved simultaneously for the entire system (like in implicit method), but the
stress wave propagates element-to-element (local).
Abaqus implements both implicit (Abaqus/Standard) and explicit (Abaqus/Explicit) solvers.
The implicit solution strategy is suitable for problems involving smooth geometric and material
nonlinear analyses. The geometric nonlinearity is due to large strain and large rotation kinematics.
The nonlinear material behaviour is due to the degradation of the mechanical properties of the
laminae and the matrix rich layer between laminae to simulate intralaminar and interlaminar
damage mechanisms. A load stepping routine is used in Abaqus/Standard. There is no restriction on
the magnitude of the load step as the procedure is unconditionally stable. The increment size
follows from numerical accuracy and convergence criteria. Within each increment, the equilibrium
equations are solved by means of the Newton-Raphson method, which is stable and converges
quadratically. In this method, for each load step, the residuals are eliminated by an iterative scheme.
In each iteration, the load level remains constant and the structure is analysed with a redefined
tangent stiffness matrix. The accuracy of the numerical solution is measured by means of
appropriate convergence criteria. Their selection is of the utmost importance. Too tight convergence
criteria may lead to an unnecessary number of iterations and a consequent waste of computer
resources, whilst a loose tolerance may result in incorrect or inaccurate solutions. Generally
speaking, in nonlinear geometrical analyses relatively tight tolerances specific to the problem are
required, while in nonlinear material problems slack tolerances are admitted, since high local
residuals are not easy to eliminate. Abaqus/Standard provides the option of including a line search
algorithm [68] to improve the robustness of the Newton-Raphson method.
With respect to the incremental method, a load curve is defined. Loads should be applied to the
specimen in a displacement-control fashion that enforces a better conditioning of the tangent
stiffness matrix when compared to the classical load-control procedure.
Explicit schemes offer a more robust alternative for convergence for quasi-static load cases but
may come at an even higher computational cost as smaller solution time steps are required, in
addition to unwanted inertial effects. The time step must be less than a critical value based on the
highest eigenvalue in the model. The stable time increment tstable is the minimum time that a
dilatational wave takes to move across any element in the model, and is given by:
*stable 1t l E (8)
P a g e | 18
where is the material density. The stable time steps for quasi-static explicit analyses are very
small, of the order of 10-8 s or less, and the whole calculation process requires hundreds of
thousands of increments. Mass scaling and damping are common approaches to assist in artificially
reducing the computational time. Quality checks, such as the ratio of kinetic energy to internal
energy have to be carried out to ensure that the problem is still essentially quasi-static. An
acceptable rule of thumb is to set acceptance of this ratio to 0.01~0.05.
3 Benchmark Applications
The present section describes the finite element models developed in the current work. The models
incorporate separate finite element types for laminae and interfaces to simulate damage evolution of
combined intralaminar and delamination failures. The evolution of these two physical damage
forms is strongly coupled. Experimental and numerical results available from literature on advanced
composites are used for calibration and validation of the proposed models.
First, and for the purpose of trying to use experimental and numerical data to characterize
cohesive material properties the DCB and ENF tests that isolate delamination behaviour are
simulated.
Second, notched laminates under in-plane tensile loading are considered. Two cases are
analysed: a laminate with a centre crack, and a double edged-V-notched laminate. These are
challenging problems in composite materials because failure involves complex mechanisms such as
fibre breakage, matrix cracking and delamination. In addition, the laminate strength and dominant
failure modes can depend on geometrical parameters and material properties, such as notch
dimensions, stacking sequence and ply thickness. The detailed matrix damage development at
notches under tensile loading, in the form of matrix splitting cracks in the plies perpendicular to the
notch, together with narrow triangular areas of delamination, is well captured by modelling
laminates with sharp notches, as a centre crack, or a double edge-V-notch.
P a g e | 19
3.1 Delamination Fracture Testing
Numerical results on modes I and II fracture of glass fibre and carbon fibre unidirectional
composites, using the DCB and ENF specimens, respectively, are presented in this section. Results
are validated with experimental results published by Davidson and Waas [69] and Turon [13].
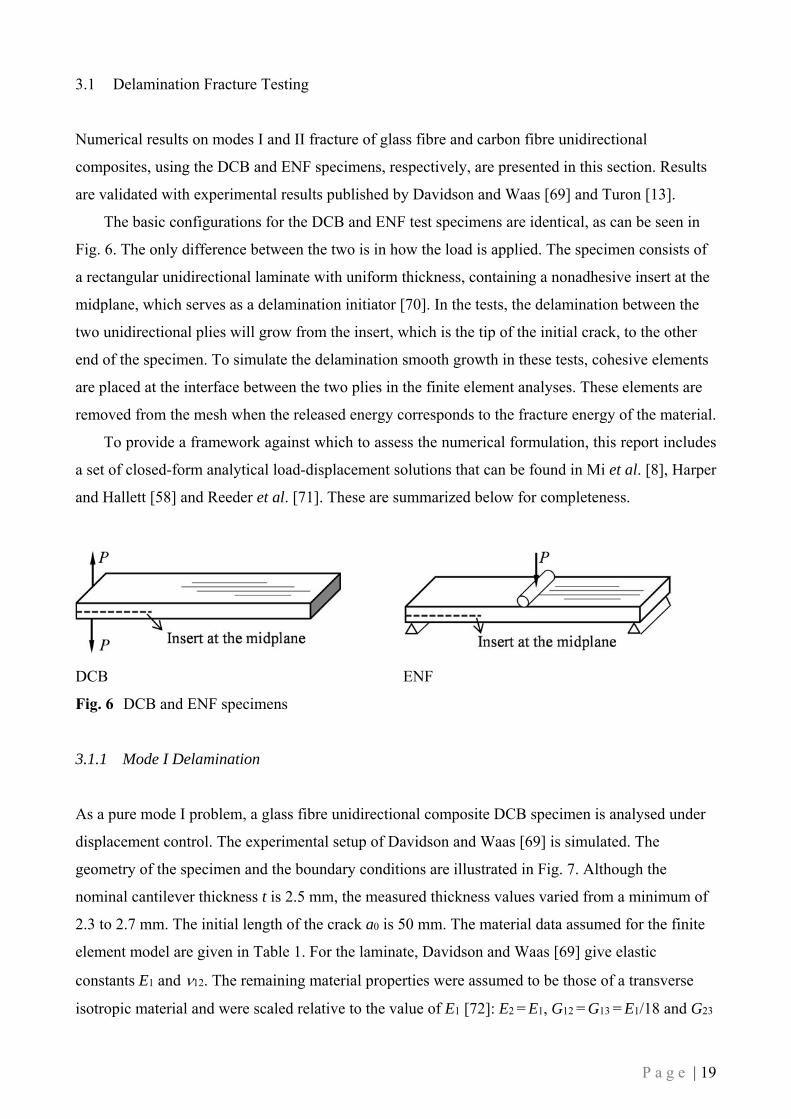
The basic configurations for the DCB and ENF test specimens are identical, as can be seen in
Fig. 6. The only difference between the two is in how the load is applied. The specimen consists of
a rectangular unidirectional laminate with uniform thickness, containing a nonadhesive insert at the
midplane, which serves as a delamination initiator [70]. In the tests, the delamination between the
two unidirectional plies will grow from the insert, which is the tip of the initial crack, to the other
end of the specimen. To simulate the delamination smooth growth in these tests, cohesive elements
are placed at the interface between the two plies in the finite element analyses. These elements are
removed from the mesh when the released energy corresponds to the fracture energy of the material.
To provide a framework against which to assess the numerical formulation, this report includes
a set of closed-form analytical load-displacement solutions that can be found in Mi et al. [8], Harper
and Hallett [58] and Reeder et al. [71]. These are summarized below for completeness.
DCB ENF
Fig. 6 DCB and ENF specimens
3.1.1 Mode I Delamination
As a pure mode I problem, a glass fibre unidirectional composite DCB specimen is analysed under
displacement control. The experimental setup of Davidson and Waas [69] is simulated. The
geometry of the specimen and the boundary conditions are illustrated in Fig. 7. Although the
nominal cantilever thickness t is 2.5 mm, the measured thickness values varied from a minimum of
2.3 to 2.7 mm. The initial length of the crack a0 is 50 mm. The material data assumed for the finite
element model are given in Table 1. For the laminate, Davidson and Waas [69] give elastic
constants E1 and 12. The remaining material properties were assumed to be those of a transverse
isotropic material and were scaled relative to the value of E1 [72]: E2 = E1, G12 = G13 = E1/18 and G23

P a g e | 20
= E1/31, although a sensitivity analysis of the finite element model to the value of these parameters
has shown their influence to be irrelevant. For the cohesive elements, the distribution of the critical
energy release rate GI,c shows values ranging from a minimum of 1.5 N/mm to a maximum of 2.2
N/mm and a mean value of 1.8 N/mm. The single interface stiffness value for KI, KII and KIII were
computed by means of Eq. (3).
Fig. 7 DCB benchmark test coupon geometry (nominal dimensions)
Table 1 Material properties of the DCB specimen
Lamina properties Interfacial properties
Mean Min Max
E1 (N/mm2) 11500 GI,c (N/mm) 1.8 1.5 2.2
E2 (N/mm2) 11500 GII,c = GIII,c (N/mm) 3.6 ̅ ̅
G12 = G13 (N/mm2) 640 fI (N/mm2) 13 ̅ ̅
G23 (N/mm2) 370 fII = fIII (N/mm2) 20 ̅ ̅
12 0.3 KI = KII = KIII (N/mm3) 23000 ̅ ̅
The material properties set out in Table 1 deserve comment. The modulus of elasticity E1 is
relatively low for practical unidirectional glass fibre composites. Generally speaking, these type of
laminates with 55%~60% of fibre volume content has E1 40000 N/mm2, which is approximately
3.5 times the value specified by Davidson and Waas [69]. Although the authors do not give an
explanation for such an unusual value, a careful analysis of the glass composite laminates tested by
the authors shows that the actual specimen is not an unidirectional laminate. It can be seen in the
referenced paper that the laminae have 90° fibre reinforcement towards the outer surfaces in the
thickness direction. The fibre bridging seen in the experiments can be for a unidirectional layer at
the mid-plane of the laminate where the crack is forced to propagate. A value for E1 of 11500
N/mm2 can only be a real elastic modulus for the laminate if the unidirectional layer with 55%~60%
of fibre volume content is a thin mid-plane core. There is a technical reason why the construction
could be a three-layered sandwich having a biaxial reinforcement in the outer layers. If the laminate
P a g e | 21
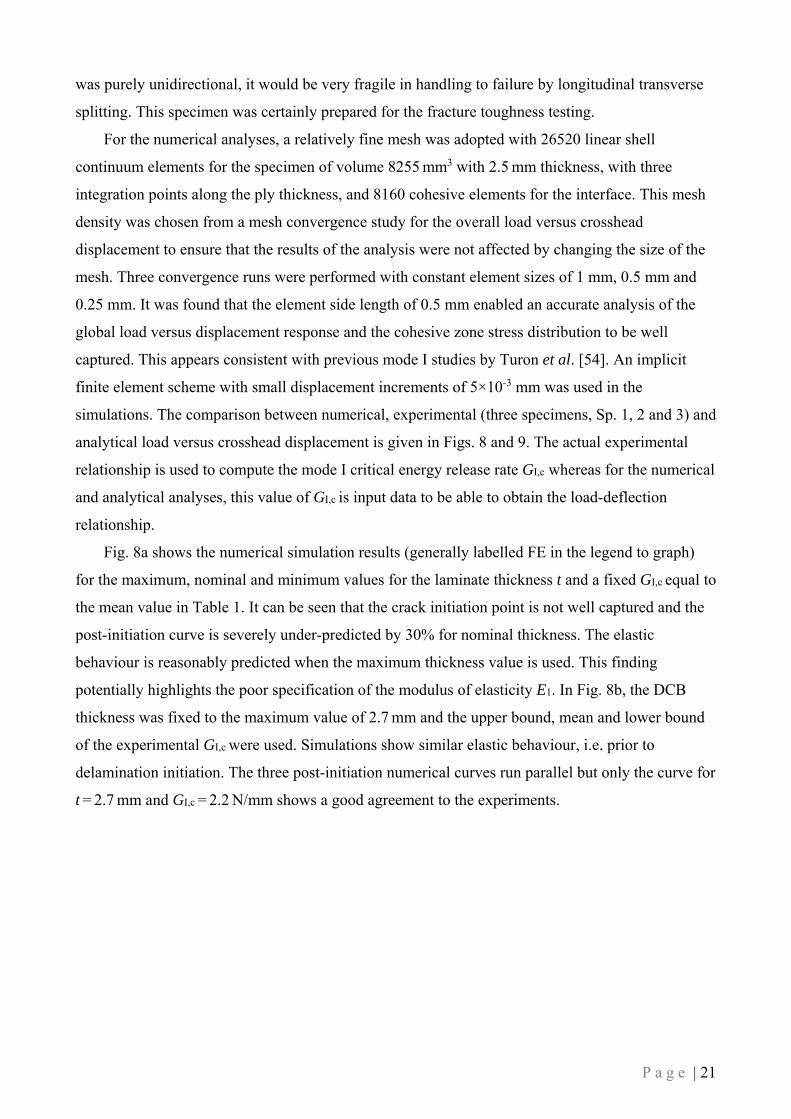
was purely unidirectional, it would be very fragile in handling to failure by longitudinal transverse
splitting. This specimen was certainly prepared for the fracture toughness testing.
For the numerical analyses, a relatively fine mesh was adopted with 26520 linear shell
continuum elements for the specimen of volume 8255 mm3 with 2.5 mm thickness, with three
integration points along the ply thickness, and 8160 cohesive elements for the interface. This mesh
density was chosen from a mesh convergence study for the overall load versus crosshead
displacement to ensure that the results of the analysis were not affected by changing the size of the
mesh. Three convergence runs were performed with constant element sizes of 1 mm, 0.5 mm and
0.25 mm. It was found that the element side length of 0.5 mm enabled an accurate analysis of the
global load versus displacement response and the cohesive zone stress distribution to be well
captured. This appears consistent with previous mode I studies by Turon et al. [54]. An implicit
finite element scheme with small displacement increments of 5×10⁻³ mm was used in the
simulations. The comparison between numerical, experimental (three specimens, Sp. 1, 2 and 3) and
analytical load versus crosshead displacement is given in Figs. 8 and 9. The actual experimental
relationship is used to compute the mode I critical energy release rate GI,c whereas for the numerical
and analytical analyses, this value of GI,c is input data to be able to obtain the load-deflection
relationship.
Fig. 8a shows the numerical simulation results (generally labelled FE in the legend to graph)
for the maximum, nominal and minimum values for the laminate thickness t and a fixed GI,c equal to
the mean value in Table 1. It can be seen that the crack initiation point is not well captured and the
post-initiation curve is severely under-predicted by 30% for nominal thickness. The elastic
behaviour is reasonably predicted when the maximum thickness value is used. This finding
potentially highlights the poor specification of the modulus of elasticity E1. In Fig. 8b, the DCB
thickness was fixed to the maximum value of 2.7 mm and the upper bound, mean and lower bound
of the experimental GI,c were used. Simulations show similar elastic behaviour, i.e. prior to
delamination initiation. The three post-initiation numerical curves run parallel but only the curve for
t = 2.7 mm and GI,c = 2.2 N/mm shows a good agreement to the experiments.

P a g e | 22
a) Variation in thickness
b) Variation in critical energy release rate
Fig. 8 Load versus crosshead displacement: comparison between experimental (three
specimens, Sp. 1, Sp. 2, Sp. 3) and numerical results
0
15
30
45
60
75
90
105
0 5 10 15 20 25 30 35 40 45 50
Loa
d P
(N
)
Crosshead Displacement I (mm)
Experimental results (Sp. 1)Experimental results (Sp. 2)Experimental results (Sp. 3)FE_t=2.7_GI,c=1.8FE_t=2.5_GI,c=1.8FE_t=2.3_GI,c=1.8
0
15
30
45
60
75
90
105
0 5 10 15 20 25 30 35 40 45 50
Loa
d P
(N
)
Crosshead Displacement I (mm)
Experimental results (Sp. 1)Experimental results (Sp. 2)Experimental results (Sp. 3)FE_t=2.7_GI,c=2.2FE_t=2.7_GI,c=1.8FE_t=2.7_GI,c=1.5
P a g e | 23
a) Maximum thickness of 2.7 mm
b) Nominal thickness of 2.5 mm
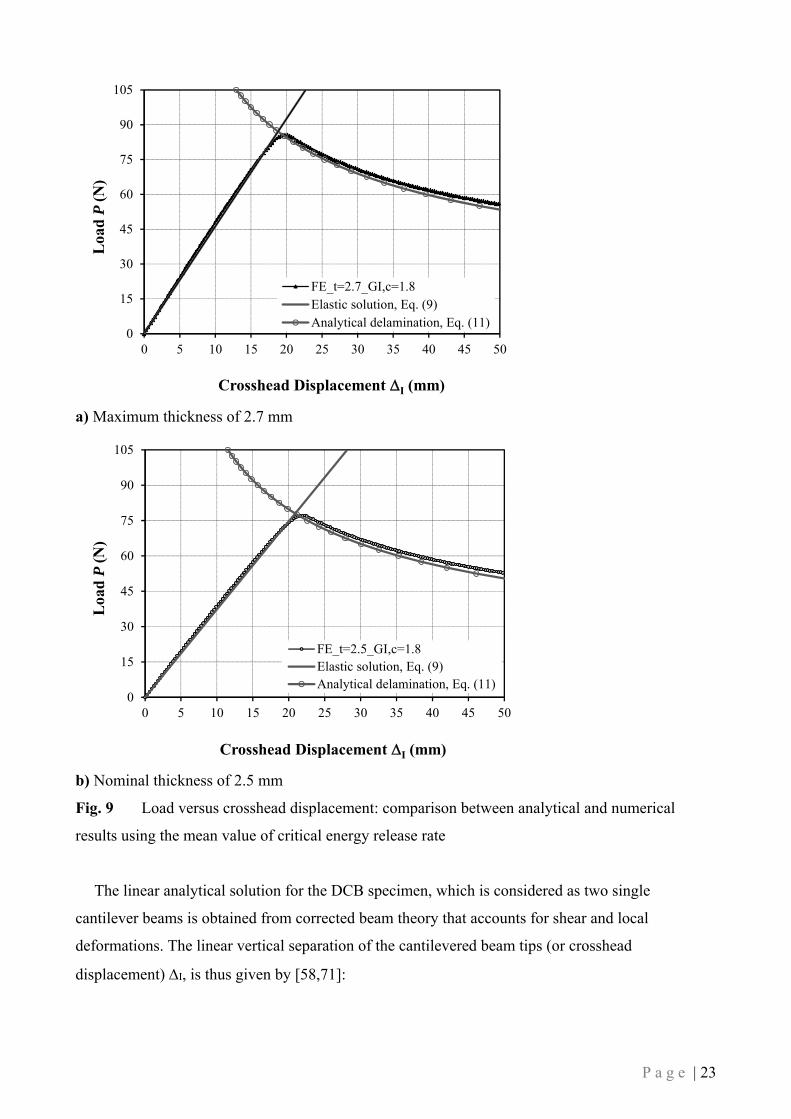
Fig. 9 Load versus crosshead displacement: comparison between analytical and numerical
results using the mean value of critical energy release rate
The linear analytical solution for the DCB specimen, which is considered as two single
cantilever beams is obtained from corrected beam theory that accounts for shear and local
deformations. The linear vertical separation of the cantilevered beam tips (or crosshead
displacement) I, is thus given by [58,71]:
0
15
30
45
60
75
90
105
0 5 10 15 20 25 30 35 40 45 50
Loa
d P
(N
)
Crosshead Displacement I (mm)
FE_t=2.7_GI,c=1.8Elastic solution, Eq. (9)Analytical delamination, Eq. (11)
0
15
30
45
60
75
90
105
0 5 10 15 20 25 30 35 40 45 50
Loa
d P
(N
)
Crosshead Displacement I (mm)
FE_t=2.5_GI,c=1.8Elastic solution, Eq. (9)Analytical delamination, Eq. (11)

P a g e | 24
3
0I
1
2
3
P a t
E I
(9)
where P is the point load applied to the free end of each cantilever, a0 is the initial crack length
prior to crack propagation, I is the second moment of area of each cantilever (I = wt3/12, w: width),
and is a correction parameter, defined as:
2
1 21
13 13
3 2 with 1.181 11
E EE
G G
(10)
The subsequent falling part of the load-displacement relationship is given by [8]:
3 2
I,c 1
I 21
2
3
wG E I
E IP (11)
The numerical responses for different specimen thicknesses are compared with the above
analytical solutions in Fig. 9. It can be seen from the curves plotted that the finite element solutions
are in very close agreement with the analytical predictions.
Some issues related with the numerical solution of the DCB problem are now considered.
In Fig. 8a the finite element results for nominal thickness and average GI,c have been compared with
the experiments. The experimental results are found to be 1.6 times stiffer than this numerical
response by simple inspection of the curves. One may argue that the difference in the elastic
responses can be solved by adopting a “corrected” value of the modulus of elasticity
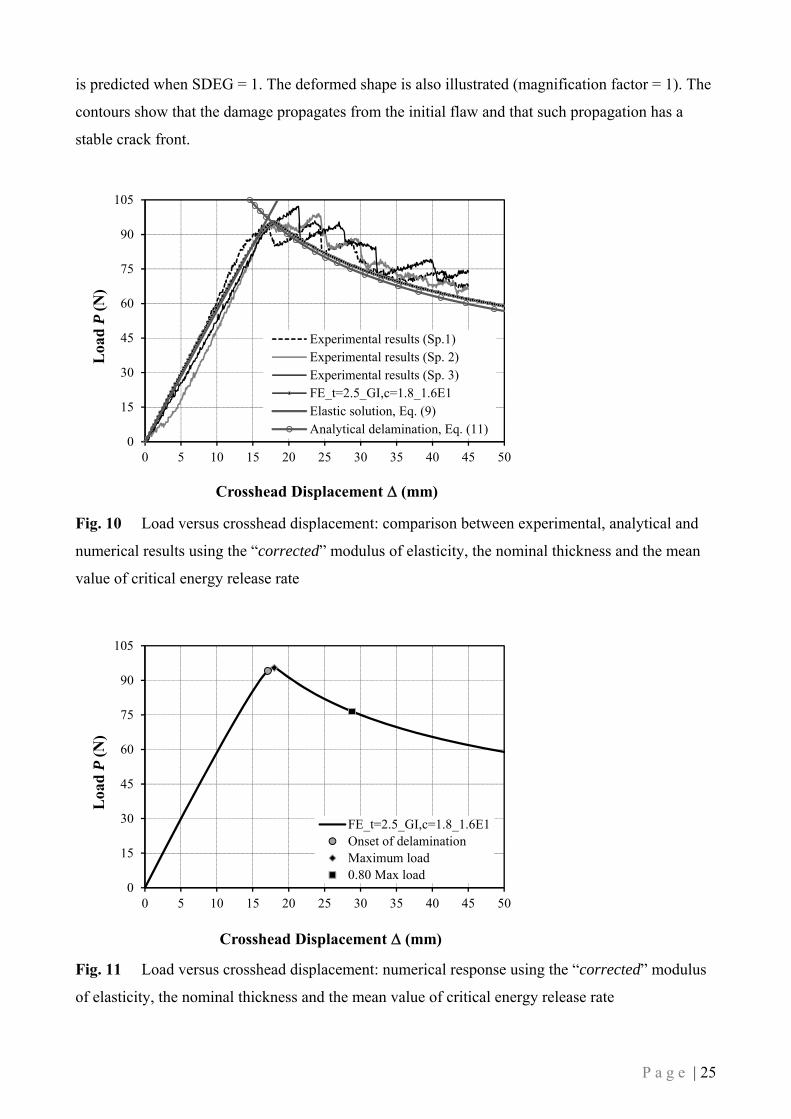
E1* = 1.6E1 = 18400 N/mm2. Fig. 10 shows the improvements obtained by this modification to input
data. It can be seen that the numerical elastic solution agrees well with the experiments and the
damage propagation curves follow the same trend. The finite element results for this “corrected”
are considered for further comparisons (FE_t=2.5_GI,c=1.8_1.6E1 in the graph in Fig. 10). The
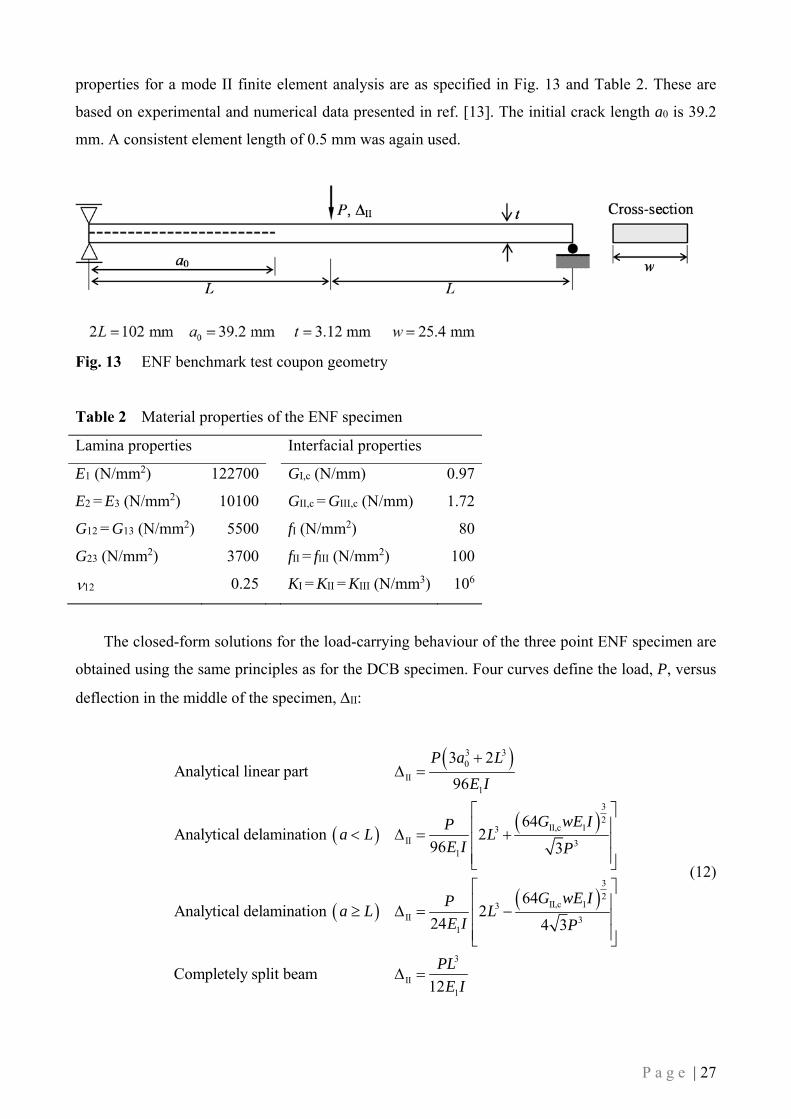
load versus crosshead displacement behaviour for this specific case is shown in Fig. 11. Three load
levels are identified, corresponding to the onset of delamination, the maximum load and a load level
corresponding to 80% of the maximum load on the descending portion of the curve. Some
modelling results for the delamination development and growth in the DCB specimen are shown in
Fig. 12 for these three load levels. The contour plots for the variable Stiffness DEgradation Scalar
(SDEG) [1], which indicates the state of damage in the cohesive elements and thereby provides
insight into the damage initiation and propagation, are shown. Complete interlaminar delamination
P a g e | 25
is predicted when SDEG = 1. The deformed shape is also illustrated (magnification factor = 1). The
contours show that the damage propagates from the initial flaw and that such propagation has a
stable crack front.
Fig. 10 Load versus crosshead displacement: comparison between experimental, analytical and
numerical results using the “corrected” modulus of elasticity, the nominal thickness and the mean
value of critical energy release rate
Fig. 11 Load versus crosshead displacement: numerical response using the “corrected” modulus
of elasticity, the nominal thickness and the mean value of critical energy release rate
0
15
30
45
60
75
90
105
0 5 10 15 20 25 30 35 40 45 50
Loa
d P
(N
)
Crosshead Displacement (mm)
Experimental results (Sp.1)Experimental results (Sp. 2)Experimental results (Sp. 3)FE_t=2.5_GI,c=1.8_1.6E1Elastic solution, Eq. (9)Analytical delamination, Eq. (11)
0
15
30
45
60
75
90
105
0 5 10 15 20 25 30 35 40 45 50
Loa
d P
(N
)
Crosshead Displacement (mm)
FE_t=2.5_GI,c=1.8_1.6E1Onset of delaminationMaximum load0.80 Max load

P a g e | 26
a) Onset of delamination: P = 94 N
b) Maximum load: P = 96 N
c) 0.80 of the maximum load: P = 77 N
Fig. 12 Evolution of mode I delamination zone in the DCB test specimen
3.1.2 Mode II Delamination
Mode II delamination fracture is caused by interlaminar shear that results in a sliding motion
between two adjacent plies. To evaluate the pure mode II critical strain energy release rate, a three
point bending apparatus is used to conduct an ENF test, as depicted in Fig. 13. Delamination
fracture is constrained to grow between two unidirectional plies with their interface at mid-plane.
The load is applied under displacement control and eventually a delamination crack initiates from
the end of the pre-crack length a0 and propagates to the midspan, and further in a very sudden way.
The specimen geometry and boundary conditions, the carbon fibre laminate and interfacial
Completely damaged Partially damaged Undamaged
P a g e | 27
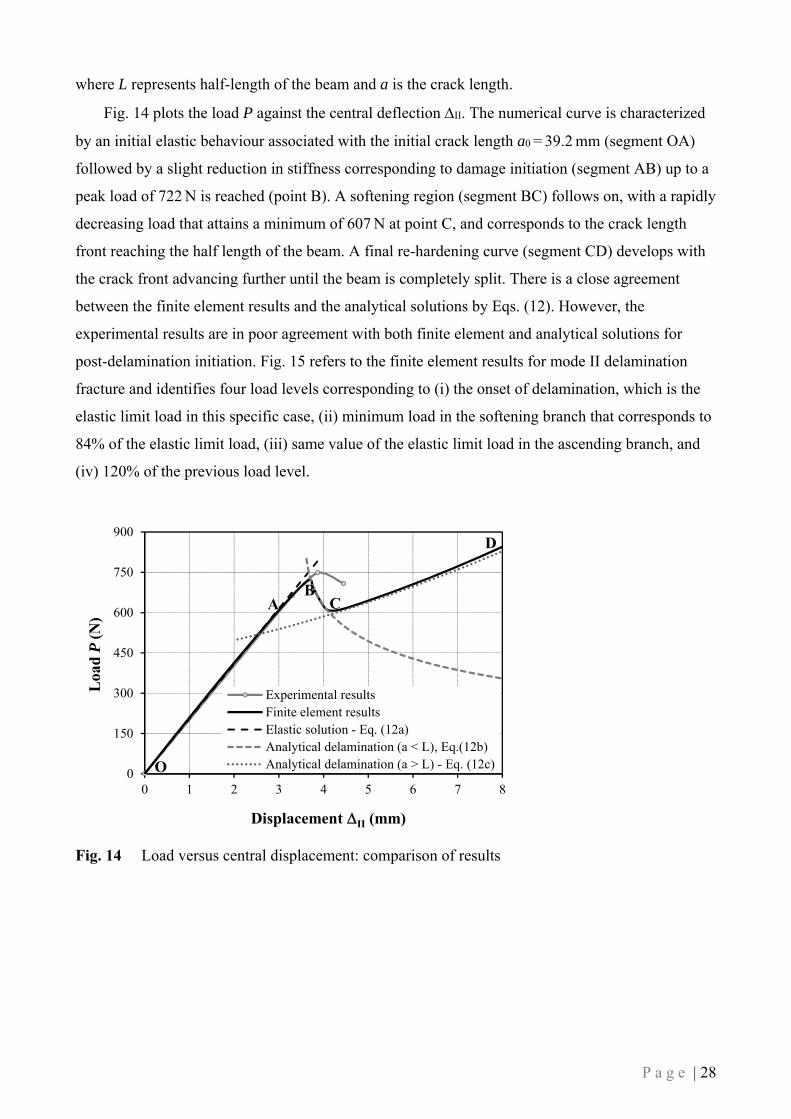
properties for a mode II finite element analysis are as specified in Fig. 13 and Table 2. These are
based on experimental and numerical data presented in ref. [13]. The initial crack length a0 is 39.2
mm. A consistent element length of 0.5 mm was again used.
Fig. 13 ENF benchmark test coupon geometry
Table 2 Material properties of the ENF specimen
Lamina properties Interfacial properties
E1 (N/mm2) 122700 GI,c (N/mm) 0.97
E2 = E3 (N/mm2) 10100 GII,c = GIII,c (N/mm) 1.72
G12 = G13 (N/mm2) 5500 fI (N/mm2) 80
G23 (N/mm2) 3700 fII = fIII (N/mm2) 100
12 0.25 KI = KII = KIII (N/mm3) 106
The closed-form solutions for the load-carrying behaviour of the three point ENF specimen are
obtained using the same principles as for the DCB specimen. Four curves define the load, P, versus
deflection in the middle of the specimen, II:
3 30
II1
3
2II,c 13
II 31
3
2II,c 13
II 31
II
3 2Analytical linear part
96
64Analytical delamination 2
96 3
64Analytical delamination 2
24 4 3
Completely split beam
P a L
E I
G wE IPa L L
E I P
G wE IPa L L
E I P
3
112
PL
E I
(12)
P a g e | 28
where L represents half-length of the beam and a is the crack length.
Fig. 14 plots the load P against the central deflection II. The numerical curve is characterized
by an initial elastic behaviour associated with the initial crack length a0 = 39.2 mm (segment OA)
followed by a slight reduction in stiffness corresponding to damage initiation (segment AB) up to a
peak load of 722 N is reached (point B). A softening region (segment BC) follows on, with a rapidly
decreasing load that attains a minimum of 607 N at point C, and corresponds to the crack length
front reaching the half length of the beam. A final re-hardening curve (segment CD) develops with
the crack front advancing further until the beam is completely split. There is a close agreement
between the finite element results and the analytical solutions by Eqs. (12). However, the
experimental results are in poor agreement with both finite element and analytical solutions for
post-delamination initiation. Fig. 15 refers to the finite element results for mode II delamination
fracture and identifies four load levels corresponding to (i) the onset of delamination, which is the
elastic limit load in this specific case, (ii) minimum load in the softening branch that corresponds to
84% of the elastic limit load, (iii) same value of the elastic limit load in the ascending branch, and
(iv) 120% of the previous load level.
Fig. 14 Load versus central displacement: comparison of results
0
150
300
450
600
750
900
0 1 2 3 4 5 6 7 8
Loa
d P
(N
)
Displacement II (mm)
Experimental resultsFinite element resultsElastic solution - Eq. (12a)Analytical delamination (a < L), Eq.(12b)Analytical delamination (a > L) - Eq. (12c)
A
O
BC
D

P a g e | 29
Fig. 15 Load versus central displacement: finite element results
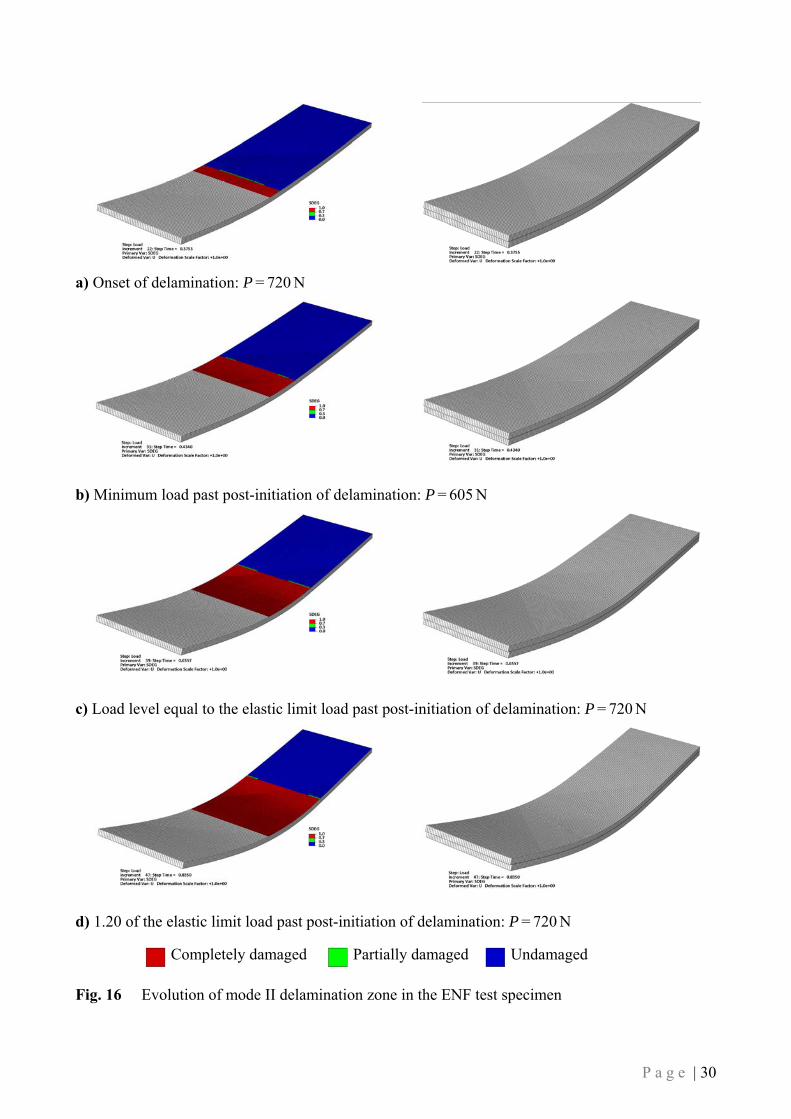
In Fig. 16 the delamination zone of the plate and the specimen deformed shape are shown at
several load levels during the computation (see Fig. 15). The delamination damage (variable SDEG)
grows uniformly with the load. The deformed shape clearly shows the relative sliding between the
two sub-laminates as expected for the pure mode II delamination failure.
0
150
300
450
600
750
900
0 1 2 3 4 5 6 7 8 9
Loa
d P
(N
)
Displacement II (mm)
Finite element results
Onset of delamination (= elastic limit load)
0.84 x Elastic limit load
1.0 x Elastic limit load
1.2 x Elastic limit load
P a g e | 30
a) Onset of delamination: P = 720 N
b) Minimum load past post-initiation of delamination: P = 605 N
c) Load level equal to the elastic limit load past post-initiation of delamination: P = 720 N
d) 1.20 of the elastic limit load past post-initiation of delamination: P = 720 N
Fig. 16 Evolution of mode II delamination zone in the ENF test specimen
Completely damaged Partially damaged Undamaged

P a g e | 31
3.2 Notched Laminates under In-Plane Tensile Loading
In-plane failure of composites may be governed by two possibilities:
Delamination and matrix cracking that coalesce to produce a fracture surface.
Fracture of the fibres.
Whilst the second failure mode is a quasi-brittle fracture type, the first is expected to possess
damage tolerance and is especially important at stress concentrations such as notches. Both failure
events are analysed in this section.
The numerical studies presented in this section include a continuum damage model with a
cohesive zone approach to composite modelling. Continuum damage models address the
intralaminar failure mechanisms from a global view, where individual damage mechanisms are
homogenized and constructed around a failure criterion. This approach is the least complex and
uses the composite layup modeller tool within the Abaqus pre-processor to define the individual ply
layers through the laminate thickness, each layer then being cohesively bonded together to form the
laminate ply stack. Interface layers are assumed to have a thickness of 10-3tply, being tply the
thickness of the ply. This dimension plays the role of a length scale and it will be shown that the
thickness of the cohesive layer does not affect the model performance provided its value is small
enough as compared to the ply thickness.
3.2.1 Laminate of Carbon/Epoxy with a Centre Crack
Here the static analysis of the delamination dominated progressive failure process in central-sharp
notched carbon/epoxy laminates is examined and the predictions are compared with experimental
and numerical results taken from the literature. This kind of analysis is relevant to assess the
efficiency of a modelling strategy. In particular, perhaps the simplest (yet extremely important)
composite layup is considered: a cross-ply laminate with a [90/0]s arrangement.
The dominant failure mechanisms in cross-ply laminates subjected to mechanical loading are
(i) transverse matrix cracking in the 90° plies around the notch, (ii) splitting, i.e. longitudinal matrix
cracking that propagates from the notch along the direction of the 0° plies, and (iii) delamination
between the 0° and 90° plies, which consist of narrow regions elongated along the load direction
and developing transversely from the splitting. The laminate tensile strength is usually reached as a
result of excessive delamination. In some cases, specimens can fail by fibre breakage rather than by
gross delamination. The role of delamination in fibre-dominated failure notched specimens is
P a g e | 32
analysed in Section 3.2.2. The governing failure mode naturally depends on the relative
delamination and fibre failure stresses.
Initial Results The specimen is modelled with one-quarter symmetry finite element mesh, as
shown in Fig. 17 for the particular case of the laminate with a centre sharp crack tested
experimentally by Spearing and Beaumont [73], and numerically by Wisnom and Chang [74] and
van der Meer et al. [75]. (The two numerical approaches to the matrix-crack failure processes are
different, as explained above.) The model is built up from stacked continuum shell elements, with
each individual ply being modelled as a separate layer. Cohesive interface elements connect the two
plies to allow for delamination damage. The in-plane mesh of the interface is the same as that of the
ply. A monotonic longitudinal tensile load is applied in the form of an applied uniform
displacement in the direction of the longitudinal axis at both ends. The analysis is performed
using a global stabilization factor of 2×10⁻⁴.
a) Schematic
b) Layup
Fig. 17 Specimen geometry (Spearing and Beaumont [73])
The continuum material model adopted in the commercial finite element code Abaqus for the
analysis of progressive intralaminar failure (Section 2.2) is used in the numerical simulations. Early
work on the progressive modelling of the splitting crack that grows from the notch tip in the 0° ply
and the transverse cracks in the 90° ply used spring or interface elements [52,74,76,77]. This
requires the specification of the crack in advance. More recently, van der Meer and Sluys [78]
showed that this failure mode could be similarly captured by using continuum models that do not
require any assumption on the crack localization and thus show a better predictive potential. Failure
in the interface elements is modelled with the damage law presented in Section 2.3. The material

P a g e | 33
properties used in the current analysis are summarized in Table 3. Most parameters in the table are
taken from refs. [73,74]. The lamina strength properties in compression and shear are taken from
Hancox and Mayer [79]. The interfacial strength properties were reduced from those of the matrix
by adopting a weakening factor fw, according to Puck’s guidelines [27,28]. It was found that the
overall response for fw = 0.5 is the one closer to the experimental results, which may indicate a
weaker interface. Other values for fw are also analysed below to provide insight on the effects of the
chosen values on the strength behaviour of this specific notched laminate. The fracture energy
related to fibre breakage is assumed to be 100 N/mm, in line with the values proposed by Pinho et
al. [80].
Table 3 Lamina and interfacial properties of the laminate with a centre crack
Elastic lamina properties
Lamina strength properties
Fracture energy Interfacial properties
E1 (N/mm2)
135000 f1,T (N/mm2)
1673 G1,T,c (N/mm)
100 GI,c (N/mm)
0.15
E2 = E3 (N/mm2)
9600 f1,C (N/mm2)
1500 G1,C,c (N/mm)
100 GII,c = GIII,c (N/mm)
0.4
G12 = G13 (N/mm2)
5800 f2,T (N/mm2)
60 G2,T,c (N/mm)
0.15 fI (N/mm2)
30
G23 (N/mm2)
4000 f2,C (N/mm2)
150 G2,C,c (N/mm)
1.1 fII = fIII (N/mm2)
37.5
12 0.31 f1,S = f2,S
(N/mm2) 75 KI = KII = KIII
(N/mm3) 3×10⁵
The finite element mesh used in our study has a total of 63056 continuum shell SC8R elements,
and 31258 COH3D8 cohesive elements, and is shown in Fig. 18. A preliminary analysis is run with
the nonlinear material properties from Table 3 assigned to the plies. Although this is the most
realistic numerical model, the actual failure behaviour cannot be captured. The damage observed
experimentally consisted of transverse matrix cracking, delamination and longitudinal splitting [73].
The proposed finite element model initiates and propagates the split in the 0° ply, as shown in Fig.
19a. Following this split, a band of localized matrix failure appears in the 90°ply, as can be seen in
Fig. 19b. Because this process requires less energy, delamination between plies does not occur, see
Fig. 19c. This is an unrealistic failure mode that has already been observed in numerical simulations
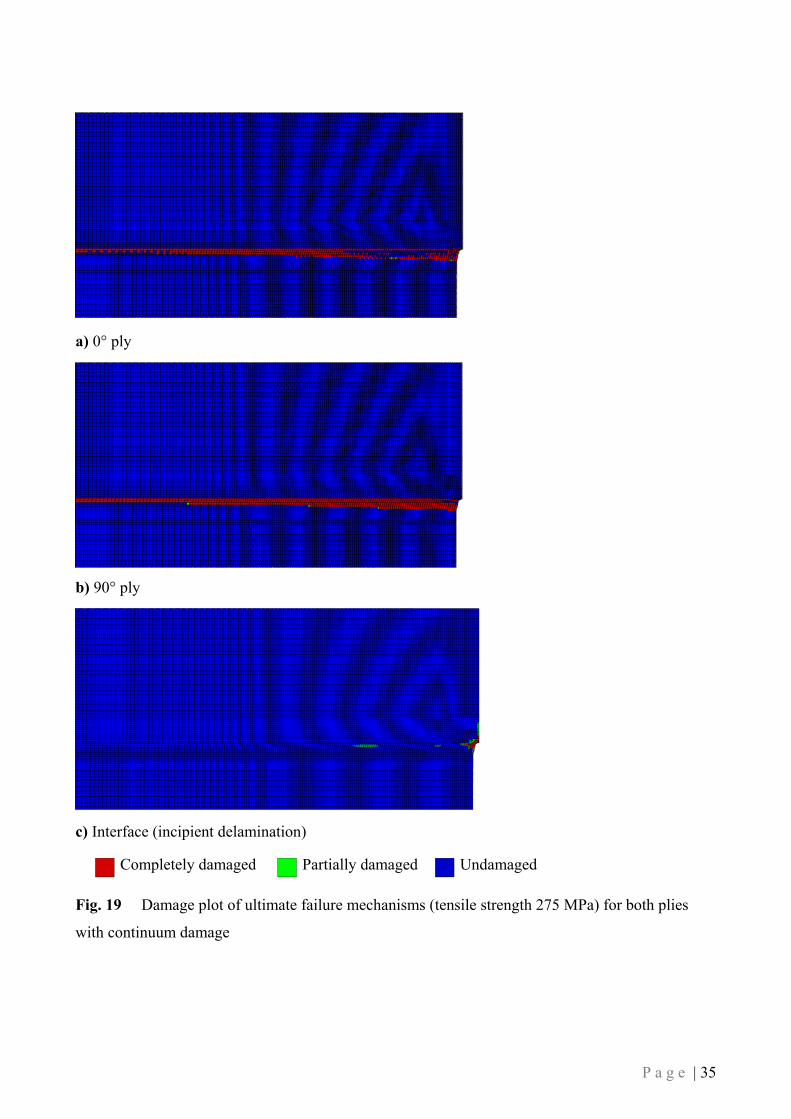
by van der Meer and Sluys [77]. In order to allow delamination between plies to occur, a second
analysis is performed under the assumption of linear behaviour in the outer 90° ply. This approach
does not cater for the representation of transverse matrix cracks in the off-axis ply. Nevertheless,
this mode of failure is not significant for the overall behaviour when compared to the splitting and
delamination modes, as shown by van der Meer [81]. In Fig. 20 the final deformed mesh is shown.

P a g e | 34
The longitudinal split that develops at the 0° ply (top ply in the figure) can be clearly observed, as
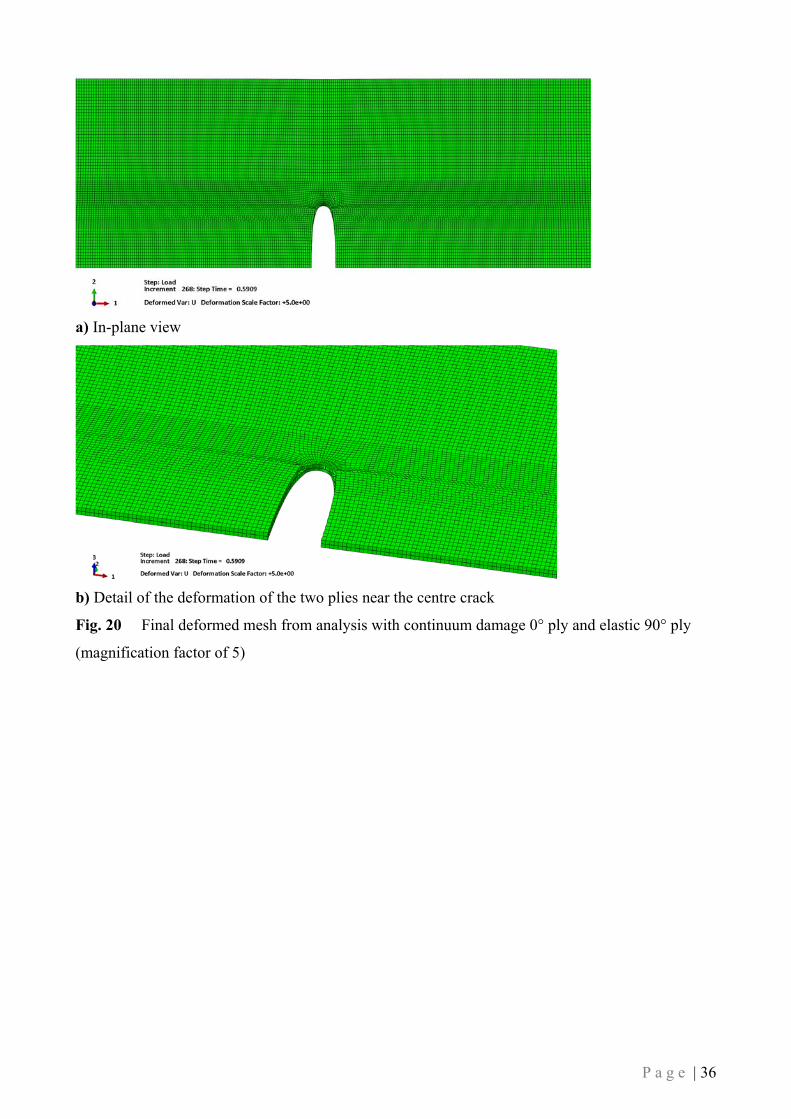
well as the shear mode delamination (sliding and tearing modes), see Figs. 20a and 20b,
respectively. The tensile stress (i.e. the applied load averaged over the nominal gross cross-section)
versus the end displacement plots for the current modelling approach are compared with the finite
element predictions from van der Meer [81] in Fig. 21. Results are in good agreement, not
unexpectedly as both represent acceptable formulations of the problem, and this provides validation
for the Abaqus model used here.
Fig. 18 Mesh of the model implemented for the analysis of the laminate with a centre crack
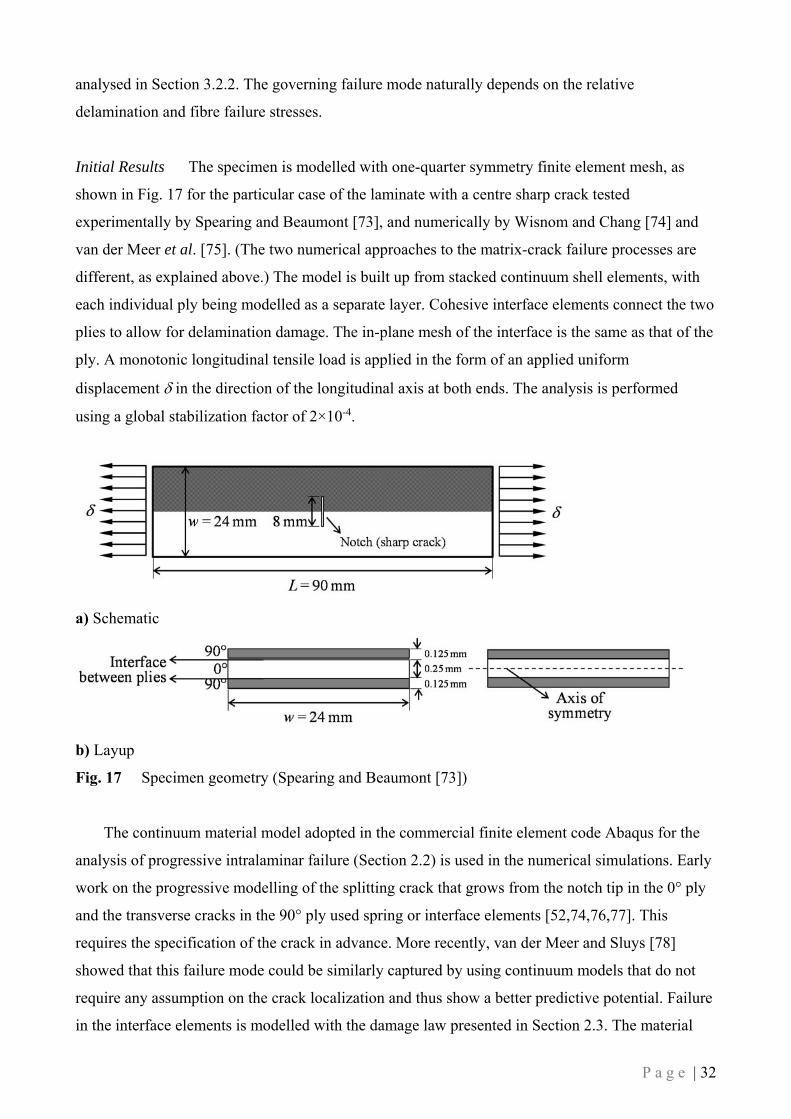
P a g e | 35
a) 0° ply
b) 90° ply
c) Interface (incipient delamination)
Fig. 19 Damage plot of ultimate failure mechanisms (tensile strength 275 MPa) for both plies
with continuum damage
Completely damaged Partially damaged Undamaged
P a g e | 36
a) In-plane view
b) Detail of the deformation of the two plies near the centre crack
Fig. 20 Final deformed mesh from analysis with continuum damage 0° ply and elastic 90° ply
(magnification factor of 5)
P a g e | 37
Fig. 21 Tensile stress-end displacement plot resulting from implementing the finite element
model with continuum damage 0° ply and elastic 90° ply, and comparison with existing numerical
data
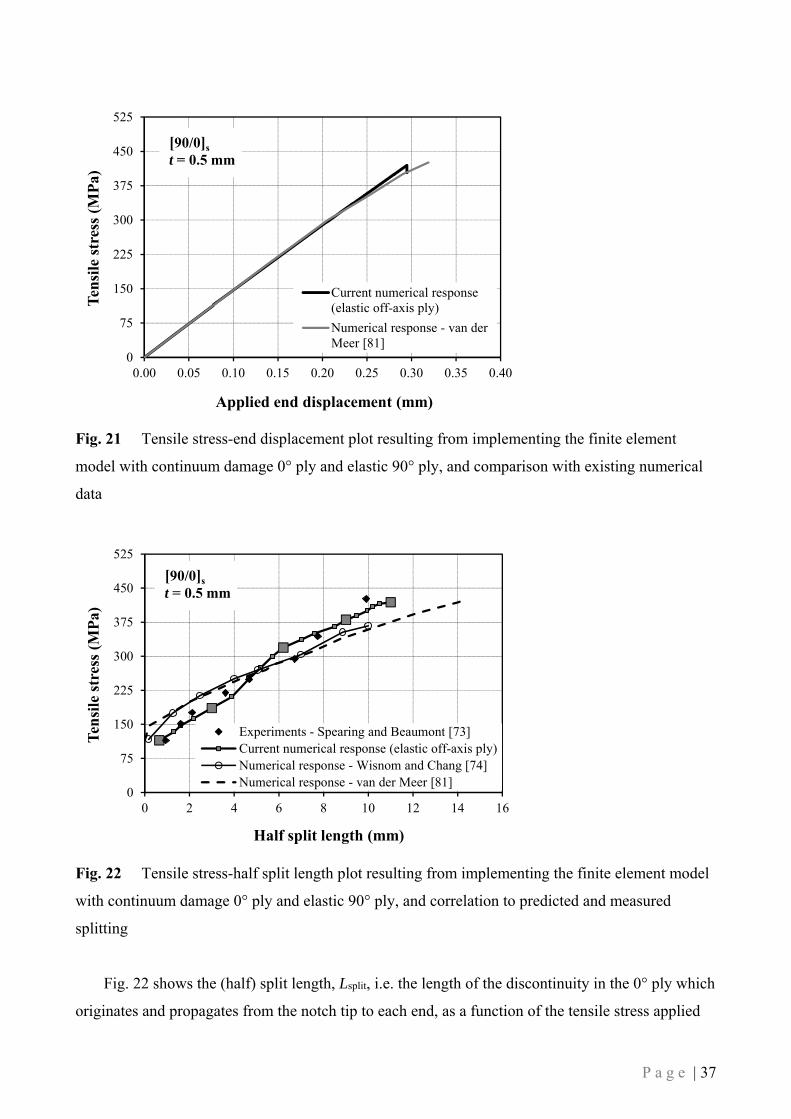
Fig. 22 Tensile stress-half split length plot resulting from implementing the finite element model
with continuum damage 0° ply and elastic 90° ply, and correlation to predicted and measured
splitting
Fig. 22 shows the (half) split length, Lsplit, i.e. the length of the discontinuity in the 0° ply which
originates and propagates from the notch tip to each end, as a function of the tensile stress applied
0
75
150
225
300
375
450
525
0.00 0.05 0.10 0.15 0.20 0.25 0.30 0.35 0.40
Ten
sile
str
ess
(MP
a)
Applied end displacement (mm)
Current numerical response(elastic off-axis ply)
Numerical response - van derMeer [81]
[90/0]s
t = 0.5 mm
0
75
150
225
300
375
450
525
0 2 4 6 8 10 12 14 16
Ten
sile
str
ess
(MP
a)
Half split length (mm)
Experiments - Spearing and Beaumont [73]Current numerical response (elastic off-axis ply)Numerical response - Wisnom and Chang [74]Numerical response - van der Meer [81]
[90/0]s
t = 0.5 mm
P a g e | 38
to the specimen. Our results are compared with the experimental observations of Spearing and
Beaumont [73] and the numerical predictions from Wisnom and Chang [74] and van der Meer [81].
Current predictions show a better agreement with the experiments. The current finite element model
underestimates the strength by 1.5% and overestimates the half split length by 11%. Finally, Fig. 23
gives split and delamination plots at incipient interlaminar failure and subsequent propagation for
the specific stress levels and corresponding half split lengths displayed in Fig. 22 as large squares.
The growth of delamination between the two plies is stable. The width and length of the
delamination area is 0.65 mm and 11 mm, respectively, when the laminate strength is reached. This
gives a predicted angle of 3.4° that compares very well to the experimentally observed angle of the
delamination front of 3.5°. The delamination extent is consistently less than the split length and this
is also in line with the numerical results from Wisnom and Chang [74]. The pattern of delamination
can be roughly approximated by a triangular shape, as seen in the tests of Spearing and Beaumont
[73].
The current finite element simulations are able to mimic the most significant failure modes that
are observed in the experiments and other numerical works. Comparisons with reported stress-
displacement and stress-half split length validate the global behaviour predicted by the proposed
model. Further comparisons with damage patterns confirm the accuracy of our approach for the
modelling of matrix cracking and delamination. The model is not validated for fibre breakage as
this was not a governing failure mode in the notched laminate analysed.
The notch strength reduction factor k, defined as the ratio between the actual notched laminate
strength and the unnotched strength, is 0.5 for this specific example, which suggests that a centre
crack with half of the laminate width has a detrimental effect in the overall resistance.

P a g e | 39
Stress level = 115 MPa and incipient delamination
Stress level = 186 MPa and Lsplit = 3 mm
Stress level = 319 MPa and Lsplit = 6.2 mm
Stress level = 380 MPa and Lsplit = 9 mm
Stress level = 420 MPa (laminate strength) and Lsplit = 11 mm
a) 0° ply b) Interface Fig. 23 Split and delamination onset and propagation with applied load the damage in the 0° ply
and in the interface at maximum (numerical) tensile strength.
Completely damaged Partially damaged Undamaged
P a g e | 40
Numerical Interfacial Strength Sensitivity Study Simulations are now carried out for different
weakening factors for the interface strength (or interfacial strength values) while keeping the critical
energy release rate constant in order to develop an understanding of the interfacial effect on failure
of notched composites. The following values of fw are selected to be 1.0 (perfect interface), 0.85
(strong interface), 0.35 and 0.25 (weak interface). The corresponding half split length and laminate
strength, max, are shown in Table 4. The strength ratios to the baseline model (max,base for fw = 0.5)
are also computed. The stress level at incipient delamination, del, is given as a ratio to the laminate
strength. It is interesting to find that the laminate strength is very much dependent on the value of
the interfacial strength. It is also found that the laminate strength does not vary proportionately to
that of the interface. In terms of numerical analysis, this implies that there is an optimum value for
this property as far as longitudinal tensile test is concerned. A very strong interface may result in a
brittle failure of the composite thereby decreasing the strength (in about 20% for this specific case).
It is worthwhile to note that in this case there is hardly any variation in the half split length. Similar
results are observed for very weak interfaces, for which delamination starts at lower stress levels. In
these cases, and as expected, the split length increases. These are important points to be considered
while selecting specific interfacial strength values for a given problem.
Table 4 Effect of interfacial strength
Model fw Lsplit (mm) max (MPa) max/max,base del/max
Baseline 0.5 11.0 420 1.0 0.27
A 1.0 11.2 327 0.78 0.30
B 0.85 11.3 343 0.82 0.29
C 0.35 15.0 388 0.92 0.26
D 0.25 16.5 340 0.81 0.22
3.2.2 Double-Edge-V-Notched Laminate
This data set is taken from the experimental work conducted by Hallett and Wisnom [82] for E-
glass/epoxy double-edge-notched cross-ply laminates. Fig. 24 shows the notched plate geometry
and Table 5 sets out the material properties. The half of the geometry shaded in the plane view is
modelled.
Experiments at Bristol University show that ultimate failure is governed by fibre breakage in the
0° ply. Failure of the fibres starts at the notch tip and propagates across the laminate width and is
preceded by longitudinal splitting and delamination. The laminate eventually fails in a brittle way,
with a crack running perpendicular to the fibre direction. Initiation and progression of failure in this
P a g e | 41
case occurs through several competing and interacting mechanisms. The computational modelling
now has to account for these three failure mode interactions.
a) Schematic
b) Layup
Fig. 24 Specimen geometry (Hallett and Wisnom [82])
Table 5 Lamina and interfacial properties of the double-edge-notched laminate
Elastic lamina
properties
Lamina strength
properties
Fracture energy Interfacial properties
E1
(N/mm2)
43900 f1,T
(N/mm2)
1060 G1,T,c
(N/mm)
80 GI,c
(N/mm)
0.25
E2 = E3
(N/mm2)
15400 f1,C
(N/mm2)
2000 G1,C,c
(N/mm)
100 GII,c = GIII,c
(N/mm)
1.8
G12 = G13
(N/mm2)
4340 f2,T
(N/mm2)
75 G2,T,c
(N/mm)
0.25 fI
(N/mm2)
56
G23
(N/mm2)
4340 f2,C
(N/mm2)
120 G2,C,c
(N/mm)
0.75 fII = fIII
(N/mm2)
75
12 3200 f1,S = f2,S
(N/mm2)
88 KI = KII = KIII
(N/mm3)
1×10⁶
A preliminary model based on a continuum damage approach for individual plies (as above, the
off-axis ply behaves elastically) and a cohesive zone model for the interface is developed. The finite
element mesh density used in the current study is identical to the above model. In order to trigger
fibre fracture, the fracture energy related to fibre failure is reduced by 90% of its original value (see
Table 5) in a 0.25 mm wide localization band at the net-tension plane [83]. This band is wider than
P a g e | 42
the finite elements to ensure the mesh objectivity of the results. In this model, the element sizes in
the notch area are about 0.125 mm.
Figs. 25 and 26 show the global stress-strain response under the applied tensile load and the
damage in the 0° ply and in the interface at maximum (numerical) tensile strength. The following
observations can be made:
1. The numerical response is linear until a maximum (tensile strength) is reached at which a load
drop is observed. The tensile strength is 174 MPa. This number does not compare well against
the measured experimental strength (267 MPa) reported by Hallett and Wisnom [82].
2. The interaction of matrix failure, in the form of splitting and delamination, and fibre failure
does not agree qualitatively with the experimental observations.
3. The failure patterns show (i) a band with fibre-tension damage (Fig. 26a), which determines the
laminate strength, (ii) longitudinal splitting crack that grows from the notch tip (Fig. 26b), and
also matrix cracking damage smeared out over the elements, with rows of damaged elements
opposite the notch tip.
4. Although the interface between the two plies delaminates (Fig. 26c), the extent of delamination
damage is much less severe than that observed in the experiments.
Clearly, the numerical model is not able to capture both global and local behaviours. The fact that
the matrix cracking is too smeared out over the elements, rather than being a discrete crack, does
not allow the notch to blunt and delay the onset of fibre failure. As a consequence, the predicted
tensile strength is very low as compared to the measured value.
In order to solve this problem, the finite element model was reformulated to enable the
individual representation of the damage modes. The matrix longitudinal splitting in the 0° ply is
now forced to localize and is modelled as a strip tangent to the notch. This method is very similar to
the localization band approach to fibre-tension damage simulation and is a relatively simple
approach to circumvent some of the limitations of the continuum damage models when the fracture
path is known a priori. Although the continuum description of laminate failure is still present, this
method implies the specification of the location of splitting in advance as matrix damage is
confined to the pre-defined strip. This strip is 0.22 mm wide in this problem (again, wider than the
typical element size) and is assigned with the mechanical properties summarized in Table 5. The
rest of the laminate behaves elastically.
P a g e | 43
Fig. 25 Tensile stress-strain plot resulting from implementing the preliminary finite element
model with continuum damage 0° ply and elastic 90° ply, and comparison with existing
experimental data
0
50
100
150
200
250
300
0 1 2 3 4 5 6 7 8 9 10
Ten
sile
str
ess
(MP
a)
Strain (m/mm)
Experimental strength
Current numerical response(preliminary Abaqus model)
[90/0]s
t = 0.5 mm

P a g e | 44
a) 0° ply: fibre-tension damage
b) 0° ply: longitudinal splitting
c) Interface: delamination
Fig. 26 Damage plot of ultimate failure mechanisms (tensile strength 174 MPa) for 0° ply with
continuum damage and interface
The model is now able to reproduce the correct sequence of failure events (see Fig. 27): (i) 0°
splits emanating from the notch tip at about 30% of the failure load, (ii) 90°/0° ply-interface
delaminations (at about 50% of the failure load) and increase in length of the splits, and (iii) fibre-
tension fracture. Fig. 28 illustrates how the model also captures the correct deformation: (i) ply
separation mainly caused by interlaminar shearing stresses, and (ii) blunting of the notch.
Completely damaged Partially damaged Undamaged

P a g e | 45
a) Damage initiation: longitudinal splitting ( = 80 MPa)
b) Damage progression: axial splits grow in length along the load direction and delaminations
develop at the interface between the 90° and the 0° layers ( = 125 MPa)
c) Fibre-tension fracture and final failure ( = 255 MPa)
Fig. 27 Progressive damage from analysis with continuum damage 0° ply and elastic 90° ply, and
localized longitudinal cracking in the 0° ply
Completely damaged Partially damaged Undamaged
P a g e | 46
Fig. 28 Final deformed mesh from analysis with continuum damage 0° ply and elastic 90° ply,
and localized longitudinal cracking in the 0° ply
Figs. 29 and 30 plot the current finite element predictions of tensile strength versus strain and
half split length, respectively, and compare those predictions with the experimental data [82]. The
experimental results and model predictions show good correlation both in terms of overall trend and
the absolute values, despite the simplifications in the idealized model.
Fig. 29 Tensile stress-strain plot resulting from implementing the finite element model with
continuum damage 0° ply and elastic 90° ply, and localized longitudinal cracking in the 0° ply;
comparison with existing experimental data
0
50
100
150
200
250
300
0 1 2 3 4 5 6 7 8 9 10 11 12
Ten
sile
str
ess
(MP
a)
Strain (m/mm)
Experimental strength
Experimental failure strain
Current numerical response(localized longitudinal cracking)
[90/0]s
t = 0.5 mm

P a g e | 47
Fig. 30 Tensile stress-half split length plot resulting from implementing the finite element model
with continuum damage 0° ply and elastic 90° ply, and localized longitudinal cracking in the 0° ply;
correlation to measured splitting
Contours of the calculated intralaminar damage indices at an applied pull-plate stress of 200
MPa, equal to 78% of the ultimate strength are shown in Fig. 31. These contours have to be
compared with identical numerical predictions by Hallett and Wisnom [82]. The agreement is,
again, good, although the delamination patterns are slightly different. Our delaminations consist of
narrow regions elongated along the load direction and developing transversally from the splitting,
with a geometry slightly different from the triangular shape reported by Hallett and
Wisnom [76,82]. Our pattern shows that the delamination at the interface also progresses to the
centre of the laminate and to the free edge, see Fig. 32, as eventually happens when (ultimate)
failure by the fibres occurs.
Overall, the current predictions for the V-notched specimen are fairly repeatable and accurate
with respect to the experimental and numerical observations from Hallett and Wisnom [76,82]. This
demonstrates the ability of our model to accurately predict failures in cases where the interaction
between intralaminar and interlaminar modes is strongly coupled.
0
50
100
150
200
250
300
0 1 2 3 4 5 6 7 8 9 10
Ten
sile
str
engt
h (
MP
a)
Half split length (mm)
Experiments - Hallett andWisnom [82]
Current numerical response(localized longitudinal cracking)
P a g e | 48
a) Longitudinal splitting
b) Fibre fracture
Fig. 31 Predicted damage at a stress level of 200 MPa from analysis with continuum damage 0°
ply and elastic 90° ply, and localized longitudinal cracking in the 0° ply
Fig. 32 Delamination pattern at final failure of the laminate
Completely damaged Partially damaged Undamaged
Completely damaged Partially damaged Undamaged

P a g e | 49
4 Summary of Modelling Guidance
In this study, a progressive damage approach for composite materials has been adopted using
only the predictive capabilities of the general purpose software Abaqus. This results from a
combination of the prediction of intralaminar damage initiation by means of the Hashin failure
theory and a material damage model to simulate loss in the load-carrying capability of the part and
advances the progression of damage based on mode-specific strain energy release rates. Similarly, a
strength-based failure criterion adequately predicted the interlaminar failure which caused initial
delamination onset. Delamination was predicted to extend by using the strain energy release rate
analysis. The following guidelines are provided to address common problems faced by analysts
when simulating the behaviour of cross-ply notched laminates under in-plane tensile loading:
1. Interface layers should not be thicker than 10-3tply.
2. Boundary conditions consistent with the geometric symmetry of the plates can and should be
employed but not on the longitudinal direction as the conditions restraining movement may
change the stress field.
3. Loads should be applied by imposing incremental displacements, as opposed to the classical
load control method.
4. Global stabilization and artificial viscosity prevent numerical instabilities. The values proposed
in this study are 2×10⁻⁴ and 1×10⁻⁵, for the two coefficients (respectively).
5. In order to allow delamination to occur between plies in cross-ply laminates, the assumption of
linear behaviour in the off-axis
6. By using implicit methods, the mesh density that ensured convergence to the “actual” results
implies a minimum element size equal to the ply thickness around the notch, corresponding to
the element sizes adopted in our models (see Section 3.2).
7. The split and fibre-tension localization bands width should be at least 1.25 times wider than the
surrounding elements in the mesh.
5 Concluding Remarks
Computational structural modelling has been used to analyse delamination dominated failures in
composite materials that were observed in physical and numerical tests of notched laminates of
carbon/epoxy and E-glass/epoxy. It is shown that the proposed finite element approach is able to

P a g e | 50
represent all the main features of the structural behaviour. In particular, it offers a reliable
alternative to physical testing and to complex modelling that often relies on proprietary user-
subroutines to define the material mechanical behaviour.
The study has highlighted the crucial role of delamination for in-plane failure by example of
cross-ply notched laminates from the literature, where a characteristic pattern of damage initiating
from the notch and propagating towards the loaded edge.
This paper expands previous research by using state-of-the-art solution techniques and
composite modelling provided by Abaqus. It also provides guidelines and addresses common
problems faced by analysts.
Acknowledgments
This paper was produced in the framework of the project Structural joints for building frames of
pultruded fibre reinforced polymers. This research was supported by a Marie Curie Intra European
Fellowship within the 7th European Community Framework Programme under contract grant PIEF-
GA-2012-327142. The author would like to thank Dr. Paul Davidson and Professor Anthony Waas
for providing raw data for the finite element modelling of the DCB test presented in this paper, and
Professor Stephen Hallett for taking time to discuss some modelling issues.
References
1. Abaqus Manual (2013) Version 6.13 Dassault systems http://www.simulia.com
2. Lemaitre J (1986) Local approach of fracture. Eng Fract Mech 25:523-537
3. Schwarze M, Reese (2009) A reduced integration solid-shell finite element based on the EAS
and the ANS concept – Geometrically linear problems. Int J Numer Meth Eng 806:1322-1355.
4. Parisch H (1995). A continuum-based shell theory for non-linear applications. Int J Numer
Meth Eng 38:1855-1833
5. Hauptmann R, Schweizerhof K (1998) A systematic development of ‘solid-shell’ element
formulations for linear and non-linear analyses employing only displacement degrees of
freedom. Int J Numer Meth Eng 42:49–69
P a g e | 51
6. Hauptmann R, Schweizerhof K, Doll S (2000) Extension of the ‘solid-shell’ concept for
application to large elastic and large elastoplastic deformations. Int J Numer Meth Eng
49:1121–1141
7. Remmers JC, Wells GN, de Borst R (2003) A solid-like shell element allowing for arbitrary
delaminations. Int J Numer Meth Eng 58:1701-1736
8. Mi Y, Crisfield MA, Davies GAO, Hellweg HB (1998) Progressive delamination using
interface elements. J Compos Mater 32(14):1246-1272
9. Petrossian Z, Wisnom MR (1998) Prediction of delamination initiation and growth from
discontinuous plies using interface elements. Compos Part A – Appl S 29:503-515
10. Chen J, Crisfield M, Kinloch AJ, Busso EP, Matthews FL, Qiu Y (1999) Prediciting
progressive delamination of composite material specimens via interface elements. Mech
Compos Mater St 6:301-317
11. Alfano G, Crisfield MA (2001) Finite element interface models for the delamination analysis of
laminated composites: mechanical and computational issues. Int J Numer Meth Eng 50:1701-
1736
12. Borg R, Nilsson L, Simonsson K (2001) Simulation of delamination in fiber composites with a
discrete cohesive failure model. Compos Sci Technol 61:667-677
13. Turon A (2006) Simulation of delamination in composites under quasi-static and fatigue
loading using cohesive zone models. PhD thesis, Univ. Girona
14. Jiang WG, Hallett SR, Green BG, Wisnom MR (2007) A concise interface constitutive law for
analysis of delamination and splitting in composite materials and its application to scaled
noteched tensile specimens. Int J Numer Meth Eng 69:1982-1995
15. Wisnom MR (2010) Modelling discrete failures in composites with interface elements. Compos
Part A – Appl S 41:795-805
16. Schellekens JCJ, de Borst R (1993) On the numerical integration of interface elements. Int J
Numer Meth Eng 36:43-66
17. Hashin Z (1983) Analysis of composite materials. J Appl Mech 50:481-505
18. Jones RM (1999) Mechanics of composite materials, 2nd edition. Taylor and Francis, USA.
19. Nairn JA (2000) Matrix microcracking in composites. In: Kelly A, Zweben C (eds.)
Comprehensive composite materials, Vol. 2, Elsevier Science, Amsterdam, Chapter 2.13, 433-
528
20. Sims GD, Broughton WR (2000) Glass fiber reinforced plastics – Properties. In: Kelly A,
Zweben C (eds.) Comprehensive composite materials, Vol. 2, Elsevier Science, Amsterdam,
Chapter 2.05, 151-197

P a g e | 52
21. Pinho ST (2005) Modelling failure of laminated composites using physically-based failure
models. PhD thesis, Imperial College London
22. Dugdale DS (1960) Yielding of steel sheets containing slits. J Mech Phys Solids 8:100-104
23. Barenblatt GI (1962) The mathematical theory of equilibrium cracks in brittle fracture. In:
Dryden HL, von Kármán Th, Kuerti G, van den Dungen FH, Howarth L (eds.) Advances in
Applied Mechanics, Vol. 7, 55-129
24. Tvergaard V, Hutchinson JW (1992) The relation between crack growth resistance and fracture
process parameters in elastic-plastic solids. J Mech Phys Solids 40:1377–1397
25. Xu XP, Needleman A (1994) Numerical simulations of fast crack growth in brittle solids. J
Mech Phys Solids 42(9):1397–1434
26. Camanho PP, Dávila CG, Moura MF (2003) Numerical simulation of mixed-mode progressive
delamination in composite materials. J Compos Mater 37(16):1415-1438
27. Knops M (2008) Analysis of failure in fiber polymer laminates – the theory of Alfred Puck.
Springer, Germany
28. Puck A, Schürmann H (2002) Failure analysis of FRP laminates by means of physically based
phenomenological models. Compos Sci Technol 62:1633-1662
29. Tsai SW, Wu EM (1971) A general theory of strength for anisotropic materials. J Compos
Mater 5(1):58–80
30. Hashin Z, Rottem A (1973) A fatigue failure criterion for fiber reinforced materials. Report
AFOSR-TR-73-0686, Department of Materials Engineering, Technion, Israel Institute of
Technology
31. Hashin Z (1980) Failure criteria for unidirectional fiber composites. J Appl Mech 47:329-334
32. Murray YD (1989) Theory and verification of the fiber composite damage model implemented
in DYNA3D. Report DNA-TR-89-132
33. Barbero EJ (2010) Introduction to composite materials design, 2nd edition. CRC Press,
Philadelphia, USA
34. Rastellini F, Oller S, Salomón O, Oñate E (2008) Composite materials non-linear modelling for
long fibre-reinforced laminates – Computational basis, computational aspects and validations.
Comput Struct 86(9):889-896
35. Martínez X, Oller S (2009) Numerical simulation of matrix reinforced composite materials
subjected to compression loads. Arch Comput Methods Eng 16:357-397
36. Martínez X, Rastellini F, Oller S, Flores F, Oñate E (2011) Computationally optimized
formulation for the simulation of composite materials and delamination failures. Compos Part
B – Eng 42:134-144
P a g e | 53
37. Pérez MA, Martínez X, Oller S, Gil L, Rastellini F, Flores F (2013) Impact damage prediction
in carbon fiber-reinforced laminated composite using the matrix-reinforced theory. Compos
Struct 104:239-248
38. Ladeveze P, Le Dantec E (1992) Damage modelling of the elementary ply for laminated
composites. Compos Sci Technol 43:257-267
39. Matzenmiller A, Lubliner J, Taylor RL (1995) A constitutive model for anisotropic damage in
fiber-composites. Mech Mater 20:125-152
40. Lemaitre J (1996) A course on damage mechanics, 2nd edition. Springer-Verlag, Heidelberg,
Germany
41. Lapczyk I, Hurtado JA (2007) Progressive damage modeling in fiber-reinforced materials.
Compos Part A – Appl S 38:2333-2341
42. Maimí P, Camanho PP, Mayugo JA, Dávila CG (2007) A continuum damage model for
composite laminates. Part I: constitutive model. Mech Mater 39:897-908
43. Flatscher Th, Pettermann HE (2011) A constitutive model for fiber-reinforced polymer plies
accounting for plasticity and brittle damage including softening – Implementation for implicit
FEM. Compos Struct 93:2241-2249
44. Lemaitre J, Dufailly J (1987) Damage measurements. Eng Fract Mech 28:643-661
45. Krajcinovic D (1989) Damage mechanics. Mech Mater 8:117-197
46. Ju JW (1990) Isotropic and anisotropic damage variables in continuum damage mechanics. J
Eng Mech-ASCE 116(12):2764-2770
47. Catalanotti G, Camanho PP, Xavier J, Dávila CG, Marques AT (2010) Measurement of
resistance curves in the longitudinal failure of composites using digital image correlation.
Compos Sci Technol 70:1986-1993
48. Bažant ZP, Oh BH (1983) Crack band theory for fracture of concrete. Mater Struct 16:155-177
49. Allix O, Ladevèze P (1992) Interlaminar interface modelling for the prediction of delamination.
Compos Struct 22(4):235-242
50. Falk ML, Needleman A, Rice JR (2001) A critical evaluation of cohesive zone models of
dynamic fracture. J Phys IV, Proc 11(Pr.5):43–50
51. Bažant ZP, Jirásek M (2002) Nonlocal integral formulations of plasticity and damage: survey
of progress. J Eng Mech-ASCE 128(11):1119-1149
52. Yang Q, Cox B (2005) Cohesive models for damage evolution in laminated composites. Int J
Fract 133:107–37
53. Daudeville L, Allix O, Ladevèze P (1995) Delamination analysis by damage mechanics. Some
applications. Compos Engng 5(1):17–24

P a g e | 54
54. Turon A, Dávila CG, Camanho PP, Costa J (2007) An engineering solution for mesh size
effects in the simulation of delamination using cohesive zone models. Eng Fract Mech
74:1665-1682
55. Brewer JC, Lagace PA (1988) Quadratic stress criterion for initiation of delamination. J
Compos Mater 22:1141-1155
56. Mohammadi S, Owen DRJ, Peric D (1998) A combined finite/discrete element algorithm for
delamination analysis of composites. Finite Elem Anal Des 28:321-336
57. Benzeggagh ML, Kenane M (1996) Measurement of mixed-mode delamination fracture
toughness of unidirectional glass/epoxy composites with mixed-mode bending apparatus.
Compos Sci Technol 56:439-449
58. Harper PW, Hallett SR (2008) Cohesive zone length in numerical simulations of composite
delamination. Eng Fract Mech 75:4774-4792
59. Bažant ZP, Planas J (1998) Fracture and size effect in concrete and other quasi-brittle materials.
CRC Press, Boca Raton, USA
60. Belytschko T, Bažant ZP, Hyun YW, Chang TP (1986) Strain-softening materials and finite-
element solutions. Comput Struct 23(2):163-180
61. Pijaudier-Cabot G, Bažant ZP (1987) Nonlocal damage theory. J Eng Mech-ASCE
113(10):1512-1533
62. Jirásek M, Patzák B (2001) Models for quasi-brittle failure: theoretical and computational
aspects. Proceedings of the 2nd European Conference on computational mechanics; solids,
structures and coupled problems in engineering, 70-71 (full paper on CD Rom)
63. Needleman A (1988) Material rate dependence and mesh sensitivity in localization problems.
Comput Method Appl M 67:69-85
64. Maimí P, Camanho PP, Mayugo JA, Dávila CG (2007) A continuum damage model for
composite laminates. Part II: computational implementation and validation. Mech Mater
39:909-919
65. Chaboche JL, Feyel F, Monerie Y (2001) Interface debonding models: a viscous regularization
with a limited rate dependency. Int J Solids Struct 38:3127-3160
66. Gao YF, Bower AF (2004) A simple technique for avoiding convergence problems in finite
element simulations of crack nucleation and growth on cohesive interfaces. Model Simul Mater
Sc 12:453-463
67. Hamitouche L, Tarfaoui M, Vautrin A (2008) An interface debonding law subject to viscous
regularization for avoiding instability: application to the delamination problems. Eng Fract
Mech 75:3084-3100

P a g e | 55
68. Crisfield M (1997) Non-linear finite element analysis of solids and structures, Volume 1 –
Essentials. John Wiley & Sons Ltd., Chichester, UK
69. Davidson P, Waas AW (2012) Non-smooth mode I fracture of fibre-reinforced composites: an
experimental, numerical and analytical study. Phil Trans R Soc A 370:1942-1965
70. ASTM International 2001. ASTM D 6671 – 01: Standard test method for mixed mode I-mode
II interlaminar fracture toughness of unidirectional fiber reinforced polymer matrix composites,
USA
71. Reeder JR, Demarco K, Whitley KS (2004) The use of doubler reinforcement in delamination
toughness testing. Compos Part A – Appl S 35:1337-1344
72. Gustafson PA, Waas AW (2009) The influence of adhesive constitutive parameters in cohesive
zone finite element models of adhesively bonded joints. Int J Solids Struct 46:2201-2215
73. Spearing SM, Beaumont PWR (1992) Fatigue damage mechanics of composite materials. I:
Experimental measurement of damage and post-fatigue properties. Compos Sci Technol
44:159-168
74. Wisnom MR, Chang FK (2000) Modelling of splitting and delamination in notched cross-ply
laminates. Compos Sci Technol 60:2849-2856
75. van der Meer FP, Oliver C, Sluys LJ (2010) Computational analysis of progressive failure in a
notched laminate including shear nonlinearity and fiber failure. Compos Sci Technol 70:692-
700
76. Hallett SR, Wisnom MR (2006) Numerical investigation of progressive damage and the effect
of layup in notched tensile tests. J Compos Mater 40(14):1229-1245
77. Yashiro S, Okabe T, Toyama N, Takeda N (2007) Monitoring damage in holed CFRP
laminates using embedded chirped FBG sensors. Int J Solids Struct 44:603-613
78. van der Meer FP, Sluys LJ (2009) Continuum models for the analysis of progressive failure in
composite laminates. J Compos Mater 43(20):2131-2156
79. Hancox NL, Mayer NL (1994) Design data for reinforced plastics: a guide for engineers and
designers. Chapman & Hall, London, UK
80. Pinho ST, Robinson P, Iannucci L (2006) Fracture toughness of the tensile and compressive
fibre failure modes in laminated composites. Compos Sci Technol 66:2069-2079
81. van der Meer FP (2010) Computational modeling of failure in composite laminates. PhD thesis,
Delft Univ. Tech.
82. Hallett SR, Wisnom MR (2006) Experimental investigation of progressive damage and the
effect of layup in notched tensile tests. J Compos Mater 40(2):119-141
83. Finite element guidelines for simulation of fibre-tension dominated failures in composite
materials validated by case studies. Compos Struct (under review)