Embed Size (px)
Citation preview
FUNDAMENTALS July 2014
620 Newport Center Drive, Suite 900Newport Beach, CA 92660+1 (949) 325-8700
Media ContactsTucker HewesHewes Communications+ 1 (212) [email protected]
RAFI® Managed Assets*
*Includes RAFI® and Research Affiliates EquityTM assets managed or sub-advised by Research Affiliates or RAFI licensees. 0
$10$20$30$40$50$60$70$80$90
$100$110$120$130$140$150
2Q14E1Q144Q134Q124Q114Q104Q094Q084Q074Q064Q05
USD in Billions
Jason Hsu, Ph.D.
Factor ProliferationWhen we were in the Ph.D. program at UCLA, we were taught the four-factor model in our asset pricing class. The world was simple; there were the market risk factor and the value, small-cap, and momentum return factors.2 The three non-market factors car-ried juicy return premia that could be had by investors willing to diversify into non-market exposures and exploit retail investors’ behav-ioral biases.
Fifteen years later, we are shocked to learn that some quant shops now use an 81-factor model to build equity portfolios. This infla-tion in factors has certainly made us feel inadequate and has potentially eroded the real value of our paper diploma. Understand-ably, we are concerned with the relentless onslaught of shiny, exciting, and sexy new factors introduced by bright-eyed, bushy-tailed young financial engineers.3
Frankly, we expected the number of “accepted” factors to decrease rather than explode over time. We expected that at least
one of the three documented anomalies would be revealed as a fluke—a data artifact that would disappear with better qual-ity international data and with additional decades of out-of-sample data following the original discovery.
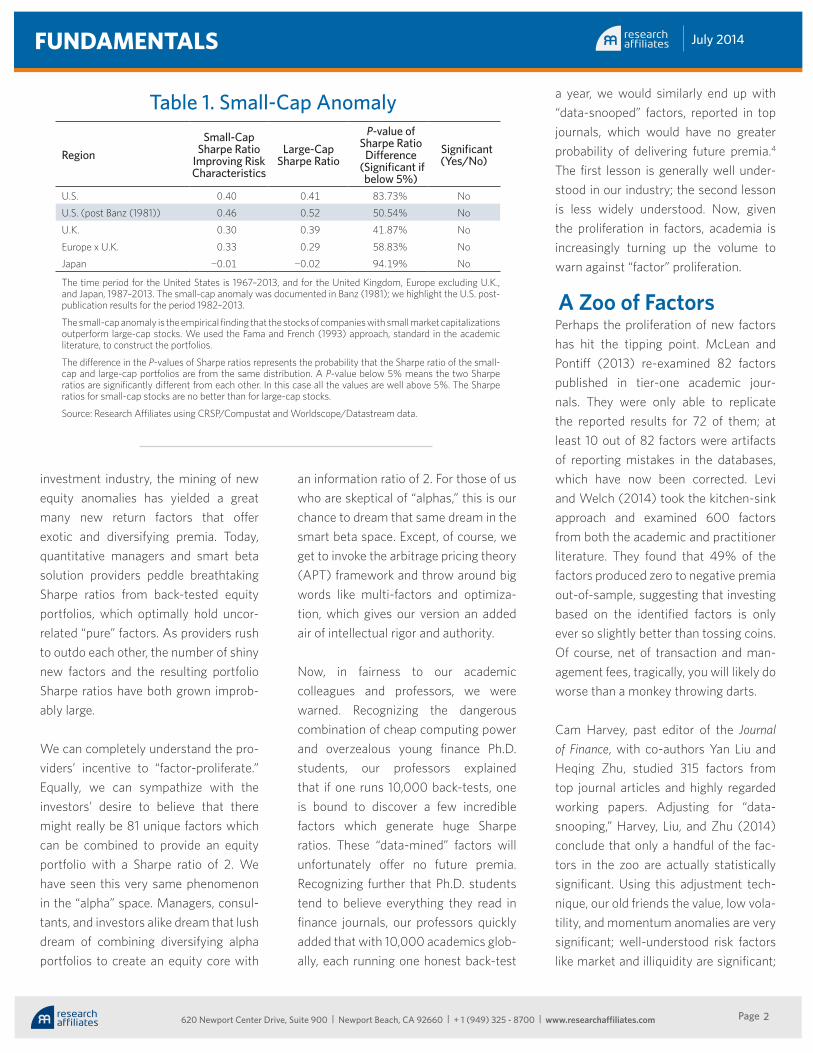
Indeed, that is what we have seen. The small-cap anomaly has not been observed in the United States since the early 1980s and does not exist outside the U.S. dataset (Table 1). This lack of “robustness” out-of-sample led Tyler Shumway and Vincent Warther to re-exam-ine the small-cap anomaly; they concluded that it was likely driven by a mistake in how researchers treated missing data for delisted stocks. Apparently, missing returns for del-isted stocks in the CRSP database created a systematic bias in the computed returns for small stocks, which are more likely to face delisting. When this bias is adjusted for, the small-cap anomaly is no longer observed (Shumway and Warther, 1999).
Oddly, the nullification of the small-cap anomaly has received scant notice. At the same time, between academia and the
Finding Smart Beta in the Factor Zooby Jason Hsu, Ph.D., and Vitali Kalesnik, Ph.D.
KEY POINTS1. The purported discovery of
many new anomalies and the consequent proliferation of sup-posedly uncorrelated factors in recent years raises questions about the quality of financial research.
2. We find that the value, low vola-tility, and momentum anomalies are very significant; the market and illiquidity factors are signifi-cant; and other asserted factors, including various definitions of quality, are insignificant.
3. Among other characteristics, a factor is more likely to generate a return premium out-of-sample if it has survived over time, works outside the United States, stands up to minor definitional varia-tions, has a credible explanation, and exceeds a higher-than-usual t-stat threshold to adjust for data-snooping.
Factors are becoming so numerous and exotic that John Cochrane referred to the collection as a zoo.1 While the concept is entertaining, the proliferation of factors is deeply troubling. The sheer number of factors suggests that it’s better to have more factors than less, but how can investors determine how to use factors in their equity portfolios? The options are endless, particularly given the smart beta movement under way today. We believe one cannot make intelligent choices regarding smart betas without first understanding factors and their role in investment portfolios. Luckily for investors, most so-called factors can be ignored.
Luckily for investors, most so-called factors can be ignored.
“ “
July 2014
2Page
FUNDAMENTALS
620 Newport Center Drive, Suite 900 | Newport Beach, CA 92660 | + 1 (949) 325 - 8700 | www.researchaffiliates.com
investment industry, the mining of new equity anomalies has yielded a great many new return factors that offer exotic and diversifying premia. Today, quantitative managers and smart beta solution providers peddle breathtaking Sharpe ratios from back-tested equity portfolios, which optimally hold uncor-related “pure” factors. As providers rush to outdo each other, the number of shiny new factors and the resulting portfolio Sharpe ratios have both grown improb-ably large.
We can completely understand the pro-viders’ incentive to “factor-proliferate.” Equally, we can sympathize with the investors’ desire to believe that there might really be 81 unique factors which can be combined to provide an equity portfolio with a Sharpe ratio of 2. We have seen this very same phenomenon in the “alpha” space. Managers, consul-tants, and investors alike dream that lush dream of combining diversifying alpha portfolios to create an equity core with
a year, we would similarly end up with “data-snooped” factors, reported in top journals, which would have no greater probability of delivering future premia.4 The first lesson is generally well under-stood in our industry; the second lesson is less widely understood. Now, given the proliferation in factors, academia is increasingly turning up the volume to warn against “factor” proliferation.
A Zoo of FactorsPerhaps the proliferation of new factors has hit the tipping point. McLean and Pontiff (2013) re-examined 82 factors published in tier-one academic jour-nals. They were only able to replicate the reported results for 72 of them; at least 10 out of 82 factors were artifacts of reporting mistakes in the databases, which have now been corrected. Levi and Welch (2014) took the kitchen-sink approach and examined 600 factors from both the academic and practitioner literature. They found that 49% of the factors produced zero to negative premia out-of-sample, suggesting that investing based on the identified factors is only ever so slightly better than tossing coins. Of course, net of transaction and man-agement fees, tragically, you will likely do worse than a monkey throwing darts.
Cam Harvey, past editor of the Journal of Finance, with co-authors Yan Liu and Heqing Zhu, studied 315 factors from top journal articles and highly regarded working papers. Adjusting for “data-snooping,” Harvey, Liu, and Zhu (2014) conclude that only a handful of the fac-tors in the zoo are actually statistically significant. Using this adjustment tech-nique, our old friends the value, low vola-tility, and momentum anomalies are very significant; well-understood risk factors like market and illiquidity are significant;
an information ratio of 2. For those of us who are skeptical of “alphas,” this is our chance to dream that same dream in the smart beta space. Except, of course, we get to invoke the arbitrage pricing theory (APT) framework and throw around big words like multi-factors and optimiza-tion, which gives our version an added air of intellectual rigor and authority.
Now, in fairness to our academic colleagues and professors, we were warned. Recognizing the dangerous combination of cheap computing power and overzealous young finance Ph.D. students, our professors explained that if one runs 10,000 back-tests, one is bound to discover a few incredible factors which generate huge Sharpe ratios. These “data-mined” factors will unfortunately offer no future premia. Recognizing further that Ph.D. students tend to believe everything they read in finance journals, our professors quickly added that with 10,000 academics glob-ally, each running one honest back-test
RegionSmall-Cap
Sharpe Ratio Improving Risk Characteristics
Large-Cap Sharpe Ratio
P-value of Sharpe Ratio
Difference (Significant if
below 5%)
Significant (Yes/No)
U.S. 0.40 0.41 83.73% NoU.S. (post Banz (1981)) 0.46 0.52 50.54% No
U.K. 0.30 0.39 41.87% No
Europe x U.K. 0.33 0.29 58.83% NoJapan -0.01 -0.02 94.19% No
The time period for the United States is 1967–2013, and for the United Kingdom, Europe excluding U.K., and Japan, 1987–2013. The small-cap anomaly was documented in Banz (1981); we highlight the U.S. post-publication results for the period 1982–2013.
The small-cap anomaly is the empirical finding that the stocks of companies with small market capitalizations outperform large-cap stocks. We used the Fama and French (1993) approach, standard in the academic literature, to construct the portfolios.
The difference in the P-values of Sharpe ratios represents the probability that the Sharpe ratio of the small-cap and large-cap portfolios are from the same distribution. A P-value below 5% means the two Sharpe ratios are significantly different from each other. In this case all the values are well above 5%. The Sharpe ratios for small-cap stocks are no better than for large-cap stocks.
Source: Research Affiliates using CRSP/Compustat and Worldscope/Datastream data.
Table 1. Small-Cap Anomaly
July 2014
3Page
FUNDAMENTALS
620 Newport Center Drive, Suite 900 | Newport Beach, CA 92660 | + 1 (949) 325 - 8700 | www.researchaffiliates.com
and small-cap is insignificant, as are many of the newer and more exotic factors (such as idiosyncratic volatility and various definitions of quality5 like default risk, ROE, and ROI).
So far, many of the re-examinations of equity factors have used U.S. data exclusively. Our research on factors used both U.S. and non-U.S. data to examine robustness. Our results corroborate
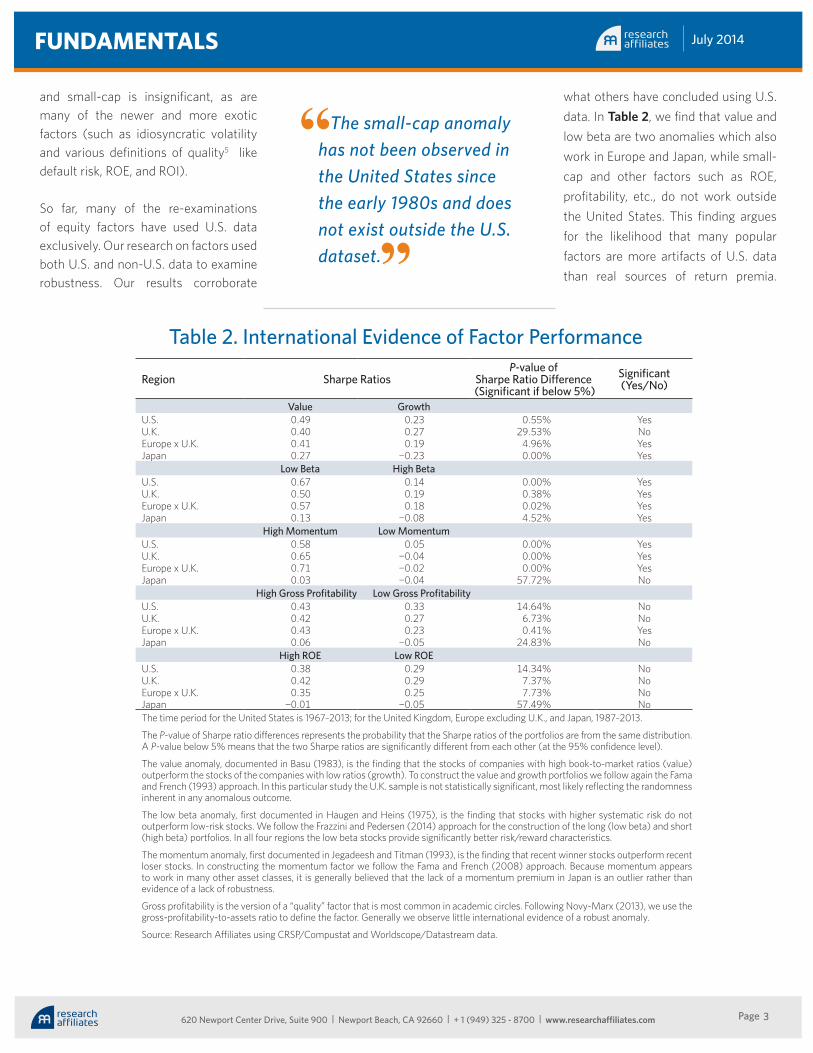
what others have concluded using U.S. data. In Table 2, we find that value and low beta are two anomalies which also work in Europe and Japan, while small-cap and other factors such as ROE, profitability, etc., do not work outside the United States. This finding argues for the likelihood that many popular factors are more artifacts of U.S. data than real sources of return premia.
The small-cap anomaly has not been observed in the United States since the early 1980s and does not exist outside the U.S. dataset.
“
“
Region Sharpe RatiosP-value of
Sharpe Ratio Difference (Significant if below 5%)
Significant (Yes/No)
Value GrowthU.S. 0.49 0.23 0.55% YesU.K. 0.40 0.27 29.53% NoEurope x U.K. 0.41 0.19 4.96% YesJapan 0.27 -0.23 0.00% Yes
Low Beta High BetaU.S. 0.67 0.14 0.00% YesU.K. 0.50 0.19 0.38% YesEurope x U.K. 0.57 0.18 0.02% YesJapan 0.13 -0.08 4.52% Yes
High Momentum Low MomentumU.S. 0.58 0.05 0.00% YesU.K. 0.65 -0.04 0.00% YesEurope x U.K. 0.71 -0.02 0.00% YesJapan 0.03 -0.04 57.72% No
High Gross Profitability Low Gross ProfitabilityU.S. 0.43 0.33 14.64% NoU.K. 0.42 0.27 6.73% NoEurope x U.K. 0.43 0.23 0.41% YesJapan 0.06 -0.05 24.83% No
High ROE Low ROEU.S. 0.38 0.29 14.34% NoU.K. 0.42 0.29 7.37% NoEurope x U.K. 0.35 0.25 7.73% NoJapan -0.01 -0.05 57.49% NoThe time period for the United States is 1967–2013; for the United Kingdom, Europe excluding U.K., and Japan, 1987–2013.
The P-value of Sharpe ratio differences represents the probability that the Sharpe ratios of the portfolios are from the same distribution. A P-value below 5% means that the two Sharpe ratios are significantly different from each other (at the 95% confidence level).
The value anomaly, documented in Basu (1983), is the finding that the stocks of companies with high book-to-market ratios (value) outperform the stocks of the companies with low ratios (growth). To construct the value and growth portfolios we follow again the Fama and French (1993) approach. In this particular study the U.K. sample is not statistically significant, most likely reflecting the randomness inherent in any anomalous outcome.
The low beta anomaly, first documented in Haugen and Heins (1975), is the finding that stocks with higher systematic risk do not outperform low-risk stocks. We follow the Frazzini and Pedersen (2014) approach for the construction of the long (low beta) and short (high beta) portfolios. In all four regions the low beta stocks provide significantly better risk/reward characteristics.
The momentum anomaly, first documented in Jegadeesh and Titman (1993), is the finding that recent winner stocks outperform recent loser stocks. In constructing the momentum factor we follow the Fama and French (2008) approach. Because momentum appears to work in many other asset classes, it is generally believed that the lack of a momentum premium in Japan is an outlier rather than evidence of a lack of robustness.
Gross profitability is the version of a “quality” factor that is most common in academic circles. Following Novy-Marx (2013), we use the gross-profitability-to-assets ratio to define the factor. Generally we observe little international evidence of a robust anomaly.
Source: Research Affiliates using CRSP/Compustat and Worldscope/Datastream data.
Table 2. International Evidence of Factor Performance
July 2014
4Page
FUNDAMENTALS
620 Newport Center Drive, Suite 900 | Newport Beach, CA 92660 | + 1 (949) 325 - 8700 | www.researchaffiliates.com
Again, we find value, low beta, and momentum to be robust... and we find other factors show significantly less robustness.
ROE, defined as the earnings-to-book-value ratio, is frequently used in practitioner settings to identify high-quality stocks. There is very little evi-dence of any premium associated with profitability.
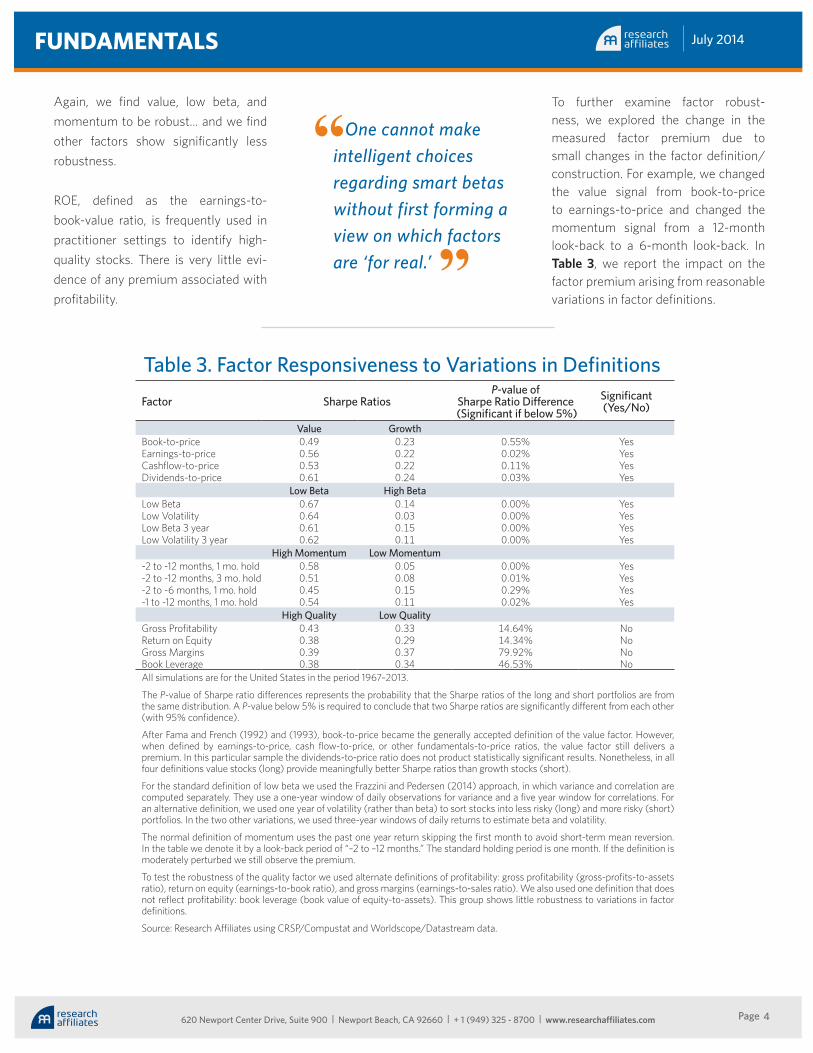
To further examine factor robust-ness, we explored the change in the measured factor premium due to small changes in the factor definition/construction. For example, we changed the value signal from book-to-price to earnings-to-price and changed the momentum signal from a 12-month look-back to a 6-month look-back. In Table 3, we report the impact on the factor premium arising from reasonable variations in factor definitions.
One cannot make intelligent choices regarding smart betas without first forming a view on which factors are ‘for real.’
“
“
Factor Sharpe RatiosP-value of
Sharpe Ratio Difference (Significant if below 5%)
Significant (Yes/No)
Value GrowthBook-to-price 0.49 0.23 0.55% YesEarnings-to-price 0.56 0.22 0.02% YesCashflow-to-price 0.53 0.22 0.11% YesDividends-to-price 0.61 0.24 0.03% Yes
Low Beta High BetaLow Beta 0.67 0.14 0.00% YesLow Volatility 0.64 0.03 0.00% YesLow Beta 3 year 0.61 0.15 0.00% YesLow Volatility 3 year 0.62 0.11 0.00% Yes
High Momentum Low Momentum-2 to -12 months, 1 mo. hold 0.58 0.05 0.00% Yes-2 to -12 months, 3 mo. hold 0.51 0.08 0.01% Yes-2 to -6 months, 1 mo. hold 0.45 0.15 0.29% Yes-1 to -12 months, 1 mo. hold 0.54 0.11 0.02% Yes
High Quality Low QualityGross Profitability 0.43 0.33 14.64% NoReturn on Equity 0.38 0.29 14.34% NoGross Margins 0.39 0.37 79.92% NoBook Leverage 0.38 0.34 46.53% NoAll simulations are for the United States in the period 1967–2013.
The P-value of Sharpe ratio differences represents the probability that the Sharpe ratios of the long and short portfolios are from the same distribution. A P-value below 5% is required to conclude that two Sharpe ratios are significantly different from each other (with 95% confidence).
After Fama and French (1992) and (1993), book-to-price became the generally accepted definition of the value factor. However, when defined by earnings-to-price, cash flow-to-price, or other fundamentals-to-price ratios, the value factor still delivers a premium. In this particular sample the dividends-to-price ratio does not product statistically significant results. Nonetheless, in all four definitions value stocks (long) provide meaningfully better Sharpe ratios than growth stocks (short).
For the standard definition of low beta we used the Frazzini and Pedersen (2014) approach, in which variance and correlation are computed separately. They use a one-year window of daily observations for variance and a five year window for correlations. For an alternative definition, we used one year of volatility (rather than beta) to sort stocks into less risky (long) and more risky (short) portfolios. In the two other variations, we used three-year windows of daily returns to estimate beta and volatility.
The normal definition of momentum uses the past one year return skipping the first month to avoid short-term mean reversion. In the table we denote it by a look-back period of “–2 to –12 months.” The standard holding period is one month. If the definition is moderately perturbed we still observe the premium.
To test the robustness of the quality factor we used alternate definitions of profitability: gross profitability (gross-profits-to-assets ratio), return on equity (earnings-to-book ratio), and gross margins (earnings-to-sales ratio). We also used one definition that does not reflect profitability: book leverage (book value of equity-to-assets). This group shows little robustness to variations in factor definitions.
Source: Research Affiliates using CRSP/Compustat and Worldscope/Datastream data.
Table 3. Factor Responsiveness to Variations in Definitions
July 2014
5Page
FUNDAMENTALS
620 Newport Center Drive, Suite 900 | Newport Beach, CA 92660 | + 1 (949) 325 - 8700 | www.researchaffiliates.com
Smart Beta in the Factor ZooThe smart beta movement makes it particularly important to understand this zoo of factors and how best to capture factor premia in an equity portfolio.
Equity smart beta indices are often described as portfolios which tilt toward various (combinations of) equity factors. Thus, one cannot make intelligent choices regarding smart betas without first forming a view on which factors are “for real” and which are data-mined or data-snooped. The academic literature provides useful guidance on decision heuristics that investors can lean on to ascertain whether a factor truly contains a return premium. Summarizing from the studies cited above, the following set of characteristics would constitute evidence of an actual factor:
1. The factor was discovered many decades ago; it has survived numerous database revisions as well as extensive out-of-sample data.
2. The factor has been vetted, replicated, and debated in top academic journals over decades.
3. The factor works in non-U.S. countries and regions.
4. The factor premium does not change materially due to minor variations in the factor definition/construction.
5. The factor has a credible reason to offer a persistent premiuma. It is related to a macro risk
exposure, orb. It is related to a deep-rooted
behavioral bias that is present in a meaningful fraction of investors, or
c. It is related to an institutional feature that cannot be easily changed.
6. The factor exceeds a more stringent t-stat threshold of 3.5 (preferably 4.0) instead of 2.0 to adjust for data-snooping and other biases evidenced by the recent explosion in factor proliferation.
Once investors have determined which factors they actually believe in, they then need to figure out how best to capture the factor premia in their equity portfolios. For example, which factor premia can be accessed in low cost, transparent, and formulaic smart beta indices and which are better accessed through high-fee actively managed products? It is generally believed that the momentum premium is best accessed through skilled active managers, who can trade carefully and get ahead of the crowd in buying and selling, given the short holding horizon and liquidity-taking nature of the strategy. If that hypothesis is true, a smart beta index chassis may fail to effectively capture the momentum premium.
Similarly, an illiquidity premium requires active managers with either market making capabilities or sophisticated trading skill, so an index replication approach is unlikely to be successful in capturing this premium. High-fee active management may be necessary.
On the other hand, value and low beta strategies require no more than 10% and 20% annual turnover, respectively, and have very slow signal decay. These two premia are well-suited to be captured in low cost smart beta index products.
In determining an appropriate core equity portfolio, investors need to consider their measure of risk. For example, is tracking error to a cap-weighted policy benchmark the measure of risk? And, relatedly, is the value-added return relative to a benchmark the primary measurement of success? Or is portfolio volatility the dominant risk measure with absolute return the key success criterion?
Once investors define their portfolio “bull’s-eye,” it is relatively straightforward to determine which mix of smart beta index products and active products would lead to the desired equity holdings.
In ClosingWe have become what we hated when we were in graduate school. We are now the curmudgeonly party poopers who scoff at the latest and greatest new factors discovered by enthusiastic financial engineers. We like to think we have become wiser and thus developed a healthy skepticism, not merely grown more cynical of academia and the industry. Fortunately, we seem to be in good company; the titans of academia have similarly grown weary of the factor proliferation, which has created a dizzying zoo of factors. The sheer variety seems to serve the purposes of publication for tenure and product creation more than better investor outcomes. We will gladly bet a simple blend of market, value, low beta, and momentum exposures against anyone’s optimized 81-factor portfolio.
Which factor premia can be accessed in smart beta indices and which are better accessed through actively managed products?
“
“
July 2014
6Page
FUNDAMENTALS
620 Newport Center Drive, Suite 900 | Newport Beach, CA 92660 | + 1 (949) 325 - 8700 | www.researchaffiliates.com
Endnotes
1. John Cochrane of the University of Chicago coined the term “zoo of factors” in his 2011 presidential address to the American Finance Association.
2. We use risk factor to mean factors whose premia are compensation for risk and behavioral factors to mean factors whose premia are excess returns from exploiting behavioral mistakes. We use return factor to mean factors which may be behavioral or risk in nature. The literature remains divided on whether factors like value and momentum are driven by risk or behavioral biases.
3. Harvey, Liu, and Zhu (2014) reported that 59 new factors were discovered between 2010 and 2012.
4. The phrase “data snooping” was coined by Lo and MacKinley (1990). 5. We have argued elsewhere that quality is not a factor in itself. On the other
hand a value investor can benefit from knowing the financial and economic health of a company. See “The Moneyball of Quality Investing,” Research Affiliates, June 2014.
References
Banz, Rolf W. 1981. “The Relationship between Return and Market Value of Common Stocks.” Journal of Financial Economics, vol. 9, no. 1 (March):3–18.
Basu, Sanjoy. 1983. “The Relationship Between Earnings’ Yield, Market Value and Return for NYSE Common Stocks: Further Evidence.” Journal of Financial Economics, vol. 12, no. 1 (June):129–156.
Cochrane, John H. 2011. “Presidential Address: Discount Rates.” Journal of Finance, vol. 66, no. 4 (August):1047–1108.
Fama, Eugene F., and Kenneth R. French. 1992.”The Cross-Section of Expected Stock Returns.” Journal of Finance, vol. 47, no. 2 (June):427–465.
———. 1993. “Common Risk Factors in the Returns on Stocks and Bonds.” Journal of Financial Economics, vol. 33, no. 1 (February):3-56.
———. 2008. “Dissecting Anomalies.” Journal of Finance, vol. 63, no. 4 (August):1653–1678.
Frazzini, Andrea, and Lasse H. Pedersen. 2014. “Betting Against Beta.” Journal of Financial Economics, vol. 111, no. 1 (January):1–25.
Harvey, Campbell R., Yan Liu, and Heqing Zhu. 2014. “…and the Cross-Section of Expected Returns.” Available at http://papers.ssrn.com/sol3/papers.cfm?abstract_id=2249314.
Haugen, Robert A., and James Heins. 1975. “Risk and Rate of Return on Financial Assets: Some Old Wine in New Bottles.” Journal of Financial and Quantitative Analysis, vol. 10, no. 5 (December):775–784.
Jegadeesh, Narasimhan, and Sheridan Titman. 1993. “Returns to Buying Win-ners and Selling Losers: Implications for Stock Market Efficiency.” Journal of Finance, vol. 48, no. 1 (March):65–91.
Levi, Yaron, and Ivo Welch. 2014. “Long Term Capital Budgeting.” Working Paper (March 29). Available at SSRN: http://papers.ssrn.com/sol3/papers.cfm?abstract_id=2327807.
Lo, Andrew W., and A. Craig MacKinley. 1990. “Data-Snooping Biases in Tests of Financial Asset Pricing Models.” Review of Financial Studies, vol. 3, no. 3 (Fall):431–467.
McLean, David R., and Jeffrey Pontiff. 2013. “Does Academic Research Destroy Stock Return Predictability?” Working Paper (May 16). Available at http://papers.ssrn.com/sol3/papers.cfm?abstract_id=2156623.
Novy-Marx, Robert. 2013. “The Other Side of Value: The Gross Profitability Premium.” Journal of Financial Economics, vol. 108, no. 1 (April):1–28.
Shumway, Tyler, and Vincent A. Warther. 1999. “The Delisting Bias in CRSP’s Nasdaq Data and Its Implications for the Size Effect.” Journal of Finance, vol. 54, no. 6 (December):2361–2379.
July 2014
7Page
FUNDAMENTALS
620 Newport Center Drive, Suite 900 | Newport Beach, CA 92660 | + 1 (949) 325 - 8700 | www.researchaffiliates.com
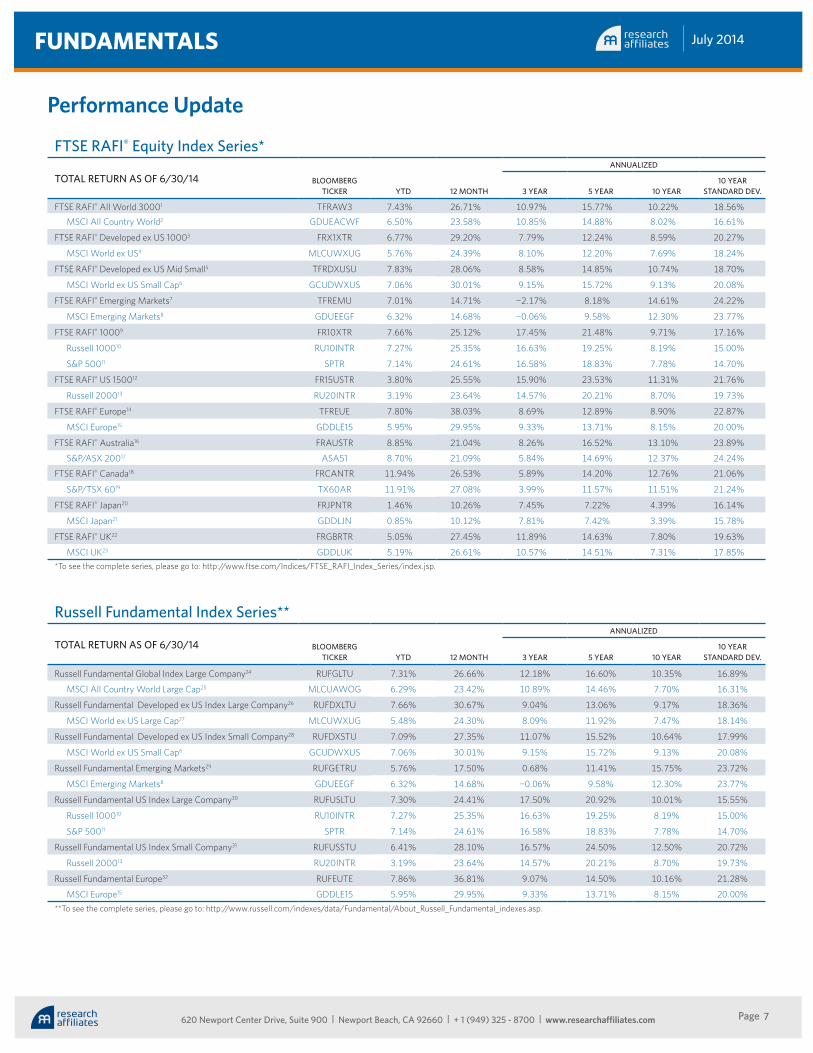
FTSE RAFI® Equity Index Series*
TOTAL RETURN AS OF 6/30/14 BLOOMBERG TICKER YTD 12 MONTH
ANNUALIZED
3 YEAR 5 YEAR 10 YEAR10 YEAR
STANDARD DEV.
FTSE RAFI® All World 30001 TFRAW3 7.43% 26.71% 10.97% 15.77% 10.22% 18.56%
MSCI All Country World2 GDUEACWF 6.50% 23.58% 10.85% 14.88% 8.02% 16.61%
FTSE RAFI® Developed ex US 10003 FRX1XTR 6.77% 29.20% 7.79% 12.24% 8.59% 20.27%
MSCI World ex US4 MLCUWXUG 5.76% 24.39% 8.10% 12.20% 7.69% 18.24%
FTSE RAFI® Developed ex US Mid Small5 TFRDXUSU 7.83% 28.06% 8.58% 14.85% 10.74% 18.70%
MSCI World ex US Small Cap6 GCUDWXUS 7.06% 30.01% 9.15% 15.72% 9.13% 20.08%
FTSE RAFI® Emerging Markets7 TFREMU 7.01% 14.71% -2.17% 8.18% 14.61% 24.22%
MSCI Emerging Markets8 GDUEEGF 6.32% 14.68% -0.06% 9.58% 12.30% 23.77%
FTSE RAFI® 10009 FR10XTR 7.66% 25.12% 17.45% 21.48% 9.71% 17.16%
Russell 100010 RU10INTR 7.27% 25.35% 16.63% 19.25% 8.19% 15.00%
S&P 50011 SPTR 7.14% 24.61% 16.58% 18.83% 7.78% 14.70%
FTSE RAFI® US 150012 FR15USTR 3.80% 25.55% 15.90% 23.53% 11.31% 21.76%
Russell 200013 RU20INTR 3.19% 23.64% 14.57% 20.21% 8.70% 19.73%
FTSE RAFI® Europe14 TFREUE 7.80% 38.03% 8.69% 12.89% 8.90% 22.87%
MSCI Europe15 GDDLE15 5.95% 29.95% 9.33% 13.71% 8.15% 20.00%
FTSE RAFI® Australia16 FRAUSTR 8.85% 21.04% 8.26% 16.52% 13.10% 23.89%
S&P/ASX 20017 ASA51 8.70% 21.09% 5.84% 14.69% 12.37% 24.24%
FTSE RAFI® Canada18 FRCANTR 11.94% 26.53% 5.89% 14.20% 12.76% 21.06%
S&P/TSX 6019 TX60AR 11.91% 27.08% 3.99% 11.57% 11.51% 21.24%
FTSE RAFI® Japan20 FRJPNTR 1.46% 10.26% 7.45% 7.22% 4.39% 16.14%
MSCI Japan21 GDDLJN 0.85% 10.12% 7.81% 7.42% 3.39% 15.78%
FTSE RAFI® UK22 FRGBRTR 5.05% 27.45% 11.89% 14.63% 7.80% 19.63%
MSCI UK23 GDDLUK 5.19% 26.61% 10.57% 14.51% 7.31% 17.85%*To see the complete series, please go to: http://www.ftse.com/Indices/FTSE_RAFI_Index_Series/index.jsp.
Russell Fundamental Index Series**
TOTAL RETURN AS OF 6/30/14 BLOOMBERG TICKER YTD 12 MONTH
ANNUALIZED
3 YEAR 5 YEAR 10 YEAR10 YEAR
STANDARD DEV.
Russell Fundamental Global Index Large Company24 RUFGLTU 7.31% 26.66% 12.18% 16.60% 10.35% 16.89%
MSCI All Country World Large Cap25 MLCUAWOG 6.29% 23.42% 10.89% 14.46% 7.70% 16.31%
Russell Fundamental Developed ex US Index Large Company26 RUFDXLTU 7.66% 30.67% 9.04% 13.06% 9.17% 18.36%
MSCI World ex US Large Cap27 MLCUWXUG 5.48% 24.30% 8.09% 11.92% 7.47% 18.14%
Russell Fundamental Developed ex US Index Small Company28 RUFDXSTU 7.09% 27.35% 11.07% 15.52% 10.64% 17.99%
MSCI World ex US Small Cap6 GCUDWXUS 7.06% 30.01% 9.15% 15.72% 9.13% 20.08%
Russell Fundamental Emerging Markets29 RUFGETRU 5.76% 17.50% 0.68% 11.41% 15.75% 23.72%
MSCI Emerging Markets8 GDUEEGF 6.32% 14.68% -0.06% 9.58% 12.30% 23.77%
Russell Fundamental US Index Large Company30 RUFUSLTU 7.30% 24.41% 17.50% 20.92% 10.01% 15.55%
Russell 100010 RU10INTR 7.27% 25.35% 16.63% 19.25% 8.19% 15.00%
S&P 50011 SPTR 7.14% 24.61% 16.58% 18.83% 7.78% 14.70%
Russell Fundamental US Index Small Company31 RUFUSSTU 6.41% 28.10% 16.57% 24.50% 12.50% 20.72%
Russell 200013 RU20INTR 3.19% 23.64% 14.57% 20.21% 8.70% 19.73%
Russell Fundamental Europe32 RUFEUTE 7.86% 36.81% 9.07% 14.50% 10.16% 21.28%
MSCI Europe15 GDDLE15 5.95% 29.95% 9.33% 13.71% 8.15% 20.00%
**To see the complete series, please go to: http://www.russell.com/indexes/data/Fundamental/About_Russell_Fundamental_indexes.asp.
Performance Update
July 2014
8Page
FUNDAMENTALS
620 Newport Center Drive, Suite 900 | Newport Beach, CA 92660 | + 1 (949) 325 - 8700 | www.researchaffiliates.com
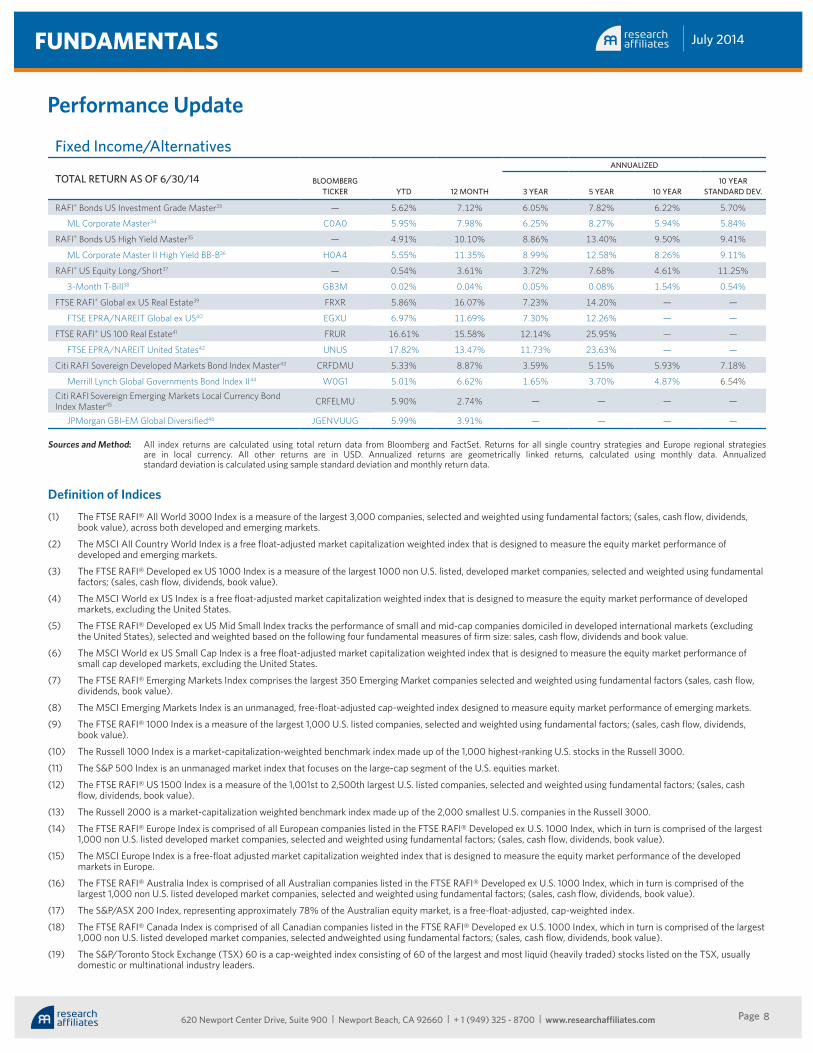
Fixed Income/Alternatives
TOTAL RETURN AS OF 6/30/14 BLOOMBERG TICKER YTD 12 MONTH
ANNUALIZED
3 YEAR 5 YEAR 10 YEAR10 YEAR
STANDARD DEV.
RAFI® Bonds US Investment Grade Master33 — 5.62% 7.12% 6.05% 7.82% 6.22% 5.70%
ML Corporate Master34 C0A0 5.95% 7.98% 6.25% 8.27% 5.94% 5.84%
RAFI® Bonds US High Yield Master35 — 4.91% 10.10% 8.86% 13.40% 9.50% 9.41%
ML Corporate Master II High Yield BB-B36 H0A4 5.55% 11.35% 8.99% 12.58% 8.26% 9.11%
RAFI® US Equity Long/Short37 — 0.54% 3.61% 3.72% 7.68% 4.61% 11.25%
3-Month T-Bill38 GB3M 0.02% 0.04% 0.05% 0.08% 1.54% 0.54%
FTSE RAFI® Global ex US Real Estate39 FRXR 5.86% 16.07% 7.23% 14.20% — —
FTSE EPRA/NAREIT Global ex US40 EGXU 6.97% 11.69% 7.30% 12.26% — —
FTSE RAFI® US 100 Real Estate41 FRUR 16.61% 15.58% 12.14% 25.95% — —
FTSE EPRA/NAREIT United States42 UNUS 17.82% 13.47% 11.73% 23.63% — —
Citi RAFI Sovereign Developed Markets Bond Index Master43 CRFDMU 5.33% 8.87% 3.59% 5.15% 5.93% 7.18%
Merrill Lynch Global Governments Bond Index II44 W0G1 5.01% 6.62% 1.65% 3.70% 4.87% 6.54%
Citi RAFI Sovereign Emerging Markets Local Currency Bond Index Master45 CRFELMU 5.90% 2.74% — — — —
JPMorgan GBI-EM Global Diversified46 JGENVUUG 5.99% 3.91% — — — —
Performance Update
Sources and Method: All index returns are calculated using total return data from Bloomberg and FactSet. Returns for all single country strategies and Europe regional strategies are in local currency. All other returns are in USD. Annualized returns are geometrically linked returns, calculated using monthly data. Annualized standard deviation is calculated using sample standard deviation and monthly return data.
Definition of Indices(1) The FTSE RAFI® All World 3000 Index is a measure of the largest 3,000 companies, selected and weighted using fundamental factors; (sales, cash flow, dividends,
book value), across both developed and emerging markets.
(2) The MSCI All Country World Index is a free float-adjusted market capitalization weighted index that is designed to measure the equity market performance of developed and emerging markets.
(3) The FTSE RAFI® Developed ex US 1000 Index is a measure of the largest 1000 non U.S. listed, developed market companies, selected and weighted using fundamental factors; (sales, cash flow, dividends, book value).
(4) The MSCI World ex US Index is a free float-adjusted market capitalization weighted index that is designed to measure the equity market performance of developed markets, excluding the United States.
(5) The FTSE RAFI® Developed ex US Mid Small Index tracks the performance of small and mid-cap companies domiciled in developed international markets (excluding the United States), selected and weighted based on the following four fundamental measures of firm size: sales, cash flow, dividends and book value.
(6) The MSCI World ex US Small Cap Index is a free float-adjusted market capitalization weighted index that is designed to measure the equity market performance of small cap developed markets, excluding the United States.
(7) The FTSE RAFI® Emerging Markets Index comprises the largest 350 Emerging Market companies selected and weighted using fundamental factors (sales, cash flow, dividends, book value).
(8) The MSCI Emerging Markets Index is an unmanaged, free-float-adjusted cap-weighted index designed to measure equity market performance of emerging markets.
(9) The FTSE RAFI® 1000 Index is a measure of the largest 1,000 U.S. listed companies, selected and weighted using fundamental factors; (sales, cash flow, dividends, book value).
(10) The Russell 1000 Index is a market-capitalization-weighted benchmark index made up of the 1,000 highest-ranking U.S. stocks in the Russell 3000.
(11) The S&P 500 Index is an unmanaged market index that focuses on the large-cap segment of the U.S. equities market.
(12) The FTSE RAFI® US 1500 Index is a measure of the 1,001st to 2,500th largest U.S. listed companies, selected and weighted using fundamental factors; (sales, cash flow, dividends, book value).
(13) The Russell 2000 is a market-capitalization weighted benchmark index made up of the 2,000 smallest U.S. companies in the Russell 3000.
(14) The FTSE RAFI® Europe Index is comprised of all European companies listed in the FTSE RAFI® Developed ex U.S. 1000 Index, which in turn is comprised of the largest 1,000 non U.S. listed developed market companies, selected and weighted using fundamental factors; (sales, cash flow, dividends, book value).
(15) The MSCI Europe Index is a free-float adjusted market capitalization weighted index that is designed to measure the equity market performance of the developed markets in Europe.
(16) The FTSE RAFI® Australia Index is comprised of all Australian companies listed in the FTSE RAFI® Developed ex U.S. 1000 Index, which in turn is comprised of the largest 1,000 non U.S. listed developed market companies, selected and weighted using fundamental factors; (sales, cash flow, dividends, book value).
(17) The S&P/ASX 200 Index, representing approximately 78% of the Australian equity market, is a free-float-adjusted, cap-weighted index.
(18) The FTSE RAFI® Canada Index is comprised of all Canadian companies listed in the FTSE RAFI® Developed ex U.S. 1000 Index, which in turn is comprised of the largest 1,000 non U.S. listed developed market companies, selected andweighted using fundamental factors; (sales, cash flow, dividends, book value).
(19) The S&P/Toronto Stock Exchange (TSX) 60 is a cap-weighted index consisting of 60 of the largest and most liquid (heavily traded) stocks listed on the TSX, usually domestic or multinational industry leaders.
July 2014
9Page
FUNDAMENTALS
620 Newport Center Drive, Suite 900 | Newport Beach, CA 92660 | + 1 (949) 325 - 8700 | www.researchaffiliates.com
(20) The FTSE RAFI® Japan Index is comprised of all Japanese companies listed in the FTSE RAFI® Developed ex U.S. 1000 Index, which in turn is comprised of the largest 1,000 non U.S. listed developed market companies, selected and weighted using fundamental factors; (sales, cash flow, dividends, book value).
(21) The MSCI Japan Index is an unmanaged, free-float-adjusted cap-weighted index that aims to capture 85% of the publicly available total market capitalization of the Japanese equity market.
(22) The FTSE RAFI® UK Index is comprised of all UK companies listed in the FTSE RAFI® Developed ex U.S. 1000 Index, which in turn is comprised of the largest 1,000 non-U.S. listed developed market companies, selected and weighted using fundamental factors; (sales, cash flow, dividends, book value).
(23) The MSCI UK Index is an unmanaged, free-float-adjusted cap-weighted index that aims to capture 85% of the publicly available total market capitalization of the British equity market.
(24) The Russell Fundamental Global Index Large Company is a measure of the largest companies, selected and weighted using fundamental factors; (adjusted sales, retained cash flow, dividends + buybacks), across both developed and emerging markets.
(25) The MSCI All Country World Large Cap Index is a free float-adjusted market capitalization weighted index that is designed to measure the equity market performance of developed and emerging markets.
(26) The Russell Fundamental Developed ex US Large Company is a subset of the Russell Fundamental Developed ex US Index, and is a measure of the largest non-U.S. listed developed country companies, selected and weighted using fundamental factors; (adjusted sales, retained cash flow, dividends + buybacks).
(27) The MSCI World ex US Large Cap Index is a free float-adjusted market capitalization weighted index that is designed to measure the equity market performance of large cap-developed markets, excluding the United States.
(28) The Russell Fundamental Developed ex US Index Small Company is a subset of the Russell Fundamental Developed ex US Index, and is a measure of small non-U.S. listed developed country companies, selected and weighted using fundamental factors; (adjusted sales, retained cash flow, dividends + buybacks).
(29) The Russell Fundamental Emerging Markets Index is a measure of Emerging Market companies, selected and weighted using fundamental factors; (adjusted sales, retained cash flow, dividends + buybacks).
(30) The Russell Fundamental U.S. Index Large Company is a subset of the Russell Fundamental US Index, and is a measure of the largest U.S. listed companies, selected and weighted using fundamental measures; (adjusted sales, retained cash flow, dividends + buybacks).
(31) The Russell Fundamental US Index Small Company is a subset of the Russell Fundamental US Index, and is a measure of U.S. listed small companies, selected and weighted using fundamental measures; (adjusted sales, retained cash flow, dividends + buybacks).
(32) The Russell Fundamental Europe Index is a measure of European companies, selected and weighted using fundamental factors; (adjusted sales, retained cash flow, dividends + buybacks).
(33) The RAFI® Bonds US Investment Grade Master Index is a U.S. investment-grade corporate bond index comprised of non-zero fixed coupon debt with maturities ranging from 1 to 30 years issued by publicly traded companies. The issuers held in the index are weighted by a combination of four measures of their fundamental size—sales, cash flow, dividends, and book value of assets.
(34) The Merrill Lynch U.S. Corporate Master Index is representative of the entire U.S. corporate bond market. The index includes dollar-denominated investment-grade corporate public debt issued in the U.S. bond market.
(35) The RAFI® Bonds US High Yield Master is a U.S. high-yield corporate bond index comprised of non-zero fixed coupon debt with maturities ranging from 1 to 30 years issued by publicly traded companies. The issuers held in the index are weighted by a combination of four measures of their fundamental size—sales, cash flow, dividends, and book value of assets.
(36) The Merrill Lynch Corporate Master II High Yield BB-B Index is representative of the U.S. high yield bond market. The index includes domestic high-yield bonds, including deferred interest bonds and payment-in-kind securities. Issues included in the index have maturities of one year or more and have a credit rating lower than BBB-/Baa3, but are not in default.
(37) The RAFI® US Equity Long/Short Index utilizes the Research Affiliates Fundamental Index® (RAFI®) methodology to identify opportunities that are implemented through long and short securities positions for a selection of U.S. domiciled publicly traded companies listed on major exchanges. Returns for the index are collateralized and represent the return of the strategy plus the return of a cash collateral yield.
(38) The 3-Month T-bill return is calculated using the Bloomberg Generic 3-month T-bill. The index is interpolated based off of the currently active U.S. 3 Month T-bill and the cash management bill closest to maturing 90 days from today.
(39) The FTSE RAFI® Global ex US Real Estate Index comprises 150 companies with the largest RAFI fundamental values selected from the constituents of the FTSE Global All Cap ex U.S. Index that are classified by the Industry Classification Benchmark (ICB) as Real Estate.
(40) The FTSE EPRA/NAREIT Global ex US Index is a free float-adjusted index, and is designed to represent general trends in eligible listed real estate stocks worldwide, excluding the United State. Relevant real estate activities are defined as the ownership, trading and development of income-producing real estate.
(41) The FTSE RAFI® US 100 Real Estate Index comprises of the 100 U.S. companies with the largest RAFI fundamental values selected from the constituents of the FTSE USA All Cap Index that are classified by the Industry Classification Benchmark (ICB) as Real Estate.
(42) The FTSE EPRA/NAREIT United States Index is a free float-adjusted index, is a subset of the EPRA/NARIET Global Index and the EPRA/NAREIT North America Index and contains publicly quoted real estate companies that meet the EPRA Ground Rules. EPRA/NARIET Index series is seen as the representative benchmark for the real estate sector.
(43) The Citi RAFI Sovereign Developed Markets Bond Index Series seeks to reflect exposure to the government securities of a universe of 22 developed markets. By weighting components by their fundamentals, the indices aim to represent each country’s economic footprint and proxies for its ability to service debt. Performance may be positive or negative. Past performance is not an indication of future results. Historical data used from index inception date of 09/30/2001 (index = 100) until 12/31/2011. Live data used since 01/01/2012.
(44) The Merrill Lynch Global Government Bond Index II tracks the performance of investment grade sovereign debt publicly issued and denominated in the issuer’s own domestic market and currency.
(45) The Citi RAFI Sovereign Emerging Markets Local Currency Bond Index Series seeks to reflect exposure to the government securities of a universe of 15 emerging markets. By weighting components by their fundamentals, the indices aim to represent each country’s economic footprint and proxies for its ability to service debt. Performance may be positive or negative. Past performance is not an indication of future results. Historical data used from index inception date of 09/30/2011 (index = 100) until 12/31/2011. Live data used since 1/1/2012.
(46) The JPMorgan GBI-EM Diversified Index seeks exposure to the local currency sovereign debt of over 15 countries in the emerging markets.
July 2014
10Page
FUNDAMENTALS
620 Newport Center Drive, Suite 900 | Newport Beach, CA 92660 | + 1 (949) 325 - 8700 | www.researchaffiliates.com
Disclosures
The material contained in this document is for general information purposes only. It is not intended as an offer or a solicitation for the purchase and/or sale of any security or financial instrument, nor is it advice or a recommendation to enter into any transaction. Research results relate only to a hypothetical model of past performance (i.e., a simulation) and not to an asset management product. No allowance has been made for trading costs or management fees, which would reduce investment performance. Actual results may differ. Index returns represent back-tested performance based on rules used in the creation of the index, are not a guarantee of future performance, and are not indicative of any specific investment. Indexes are not managed investment products and cannot be invested in directly. This material is based on information that is considered to be reliable, but Research Affiliates® and its related entities (collectively “Research Affiliates”) make this information available on an “as is” basis without a duty to update, make warranties, express or implied, regarding the accuracy of the information contained herein. Research Affiliates is not responsible for any errors or omissions or for results obtained from the use of this information. Nothing contained in this material is intended to constitute legal, tax, securities, financial or investment advice, nor an opinion regarding the appropriateness of any investment. The information contained in this material should not be acted upon without obtaining advice from a licensed professional. Research Affiliates, LLC, is an investment adviser registered under the Investment Advisors Act of 1940 with the U.S. Securities and Exchange Commission (SEC). Our registration as an investment adviser does not imply a certain level of skill or training.
Citigroup Index LLC, a subsidiary of Citigroup Inc., and Research Affiliates, LLC have agreed to jointly create and distribute investable fixed income indices (the “Citi RAFI Bonds Index Series”) based on the Research Affiliates’ patented Fundamental Index methodology. All intellectual property, including trademarks, contributed by Research Affiliates, LLC and Citigroup Index LLC shall remain solely vested with the respective contributor. Neither Citigroup Index LLC nor Research Affiliates, LLC makes any warranties, expressed or implied, to any of their customers nor anyone else regarding the accuracy or completeness of any data related to the Citi RAFI Bonds Index Series. All information is provided for information purposes only. Neither Citigroup Index LLC nor Research Affiliates, LLC accepts any liability for any errors or any loss arising from the use of any data or information set forth in this publication. CITI is a registered trademark and service mark of Citigroup Inc. or Citibank, N.A., is used under license by Research Affiliates, LLC, and is used and registered throughout the world.
The RAFI® US Equity Long/Short Index is calculated by S&P Dow Jones Indices LLC or its affiliates. S&P® is registered trademark of Standard & Poor’s Financial Services LLC and Dow Jones® is a registered trademark of Dow Jones Trademark Holdings LLC; the marks have been licensed for use by S&P Dow Jones Indices LLC and its affiliates. Investment products based on the RAFI® US Equity Long/Short Index are not sponsored, endorsed, sold or promoted by S&P Dow Jones Indices LLC, Dow Jones, S&P or their respective affiliates and none of S&P Dow Jones Indices LLC, Dow Jones, S&P or their respective affiliates makes any representation regarding the advisability of investing in such product(s). S&P Dow Jones Indices LLC, its affiliates, sources and distribution agents, and each of their respective officers, directors, employees, agents, representatives and licensors (collectively, the “Index Calculation Agent”) shall not be liable to Research Affiliates, any customer or any third party for any loss or damage, direct, indirect or consequential, arising from (i) any inaccuracy or incompleteness in, or delays, interruptions, errors or omissions in the delivery of the RAFI® US Equity Long/Short Index or any data related thereto (the “Index Data”) or (ii) any decision made or action taken by Research Affiliates, any customer or third party in reliance upon the Index Data. The Index Calculation Agent does not make any warranties, express or implied, to Research Affiliates, any of its customers or anyone else regarding the Index Data, including, without limitation, any warranties with respect to the timeliness, sequence, accuracy, completeness, currentness, merchantability, quality or fitness for a particular purpose or any warranties as to the results to be obtained by Research Affiliates, any of its customers or other person in connection with the use of the Index Data. The Index Calculation Agent shall not be liable to Research Affiliates, its customers or other third parties for loss of business revenues, lost profits or any indirect, consequential, special or similar damages whatsoever, whether in contract, tort or otherwise, even if advised of the possibility of such damages.
The RAFI® Bonds US Investment Grade Index and RAFI® Bonds US High Yield Index are calculated by ALM Research Solutions, LLC, (ALM) in conjunction with Research Affiliates. All rights and interests in the RAFI® Bonds US Investment Grade Index and the RAFI® Bonds US High Yield Index vest in Research Affiliates. All rights in and to the Research Affiliates Fundamental Index® concept used in the calculation of the RAFI® Bonds US Investment Grade Index and the RAFI® Bonds US High Yield Index vest in Research Affiliates. The above RAFI® indexes are not sponsored or promoted by ALM or its respective affiliates. Neither ALM nor Research Affiliates make any warranties, express or implied, to any of their customers or anyone else regarding the accuracy or completeness of any data related to the RAFI® Bonds US Investment Grade Index, or the RAFI® Bonds US High Yield Index. All information is provided for information purposes only. Neither ALM nor Research Affiliates accept any liability for any errors or any loss arising from the use of information in this publication.
Russell Investments is the source and owner of the Russell Index data contained or reflected in this material and copyrights related thereto. Russell Investments and Research Affiliates have entered into a strategic alliance with respect to the Russell Fundamental Index Series. Subject to Research Affiliates’ intellectual property rights in certain content (see below), Russell Investments is the owner of all copyrights related to the Russell Fundamental Indexes. Russell Investments and Research Affiliates jointly own all trademark and service mark rights in and to the Russell Fundamental Indexes. The presentation may contain confidential information and unauthorized use, disclosure, copying, dissemination, or redistribution is strictly prohibited. Russell Investments is not responsible for the formatting or configuration of this material or for any inaccuracy in the presentation.
MSCI returns information provided under license through MSCI. All returns based calculations are calculated by Research Affiliates, LLC. MSCI Index returns information provided under license through MSCI. Without prior written permission of MSCI, this information and nay other MSCI intellectual property may only be used for your internal use, may not be reproduced or re-disseminated in any form and may not be used to create any financial instruments or products or any indices. This information is provided on an “as is” basis, and the user of this information assumes the entire risk of any use made of this information. Neither MSCI nor any third party involved in or related to the computing or compiling of the data makes any express or implied warranties, representations or guarantees concerning the MSCI index-related data, and in no event will MSCI or any third party have any liability for any direct, indirect, special, punitive, consequential or any other damages (including lost profits) relating to any use of this information.
Investors should be aware of the risks associated with data sources and quantitative processes used in our investment management process. Errors may exist in data acquired from third party vendors, the construction of model portfolios, and in coding related to the index and portfolio construction process. While Research Affiliates takes steps to identify data and process errors so as to minimize the potential impact of such errors on index and portfolio performance, we cannot guarantee that such errors will not occur.
Research Affiliates is the owner of the trademarks, service marks, patents and copyrights related to the Fundamental Index methodology. The trade names Fundamental Index®, RAFI®, the RAFI logo, and the Research Affiliates corporate name and logo among others are the exclusive intellectual property of Research Affiliates, LLC. Any use of these trade names and logos without the prior written permission of Research Affiliates, LLC is expressly prohibited. Research Affiliates, LLC reserves the right to take any and all necessary action to preserve all of its rights, title and interest in and to these terms and logos.
Various features of the Fundamental Index® methodology, including an accounting data-based non-capitalization data processing system and method for creating and weighting an index of securities, are protected by various patents, and patent-pending intellectual property of Research Affiliates, LLC. (See all applicable US Patents, Patent Publications, and Patent Pending intellectual property located at http://www.researchaffiliates.com/Pages/legal.aspx#d, which are fully incorporated herein.)
©2014 Research Affiliates, LLC. All rights reserved.


![SMART BETA: DEFINING THE OPPORTUNITY AND SOLUTIONSpeople.duke.edu/~ebr4/DB/smart beta.pdf · [2] SMART BETA: DEFININ THE OPPORTUNITY AND SOLUTIONS Within asset classes, there are](https://img.pdfslide.us/doc/110x75/5b4b23657f8b9a9a2c8caa05/smart-beta-defining-the-opportunity-and-ebr4dbsmart-betapdf-2-smart-beta.jpg)