Embed Size (px)
Citation preview
Finding �-heli es in skeletonsNina Amenta Sunghee Choi Maria E. JumpRavi Krishna KolluriThomas WahlTe hni al Report TR-02-27Computer S ien es DepartmentUniversity of Texas at Austin yKeywords: Crystallography, Computational Geometry, Obje t Re ognitionO tober 16, 2002Abstra tWe onsider a problem whi h is part of the pro ess of determin-ing the three-dimensional stru ture of a protein mole ule using X-ray rystallography: given an estimated map of the ele tron density of themole ule as a fun tion on three-dimensional spa e, we identify regionswhi h are likely to belong to �-heli es. Our approa h is to omputea new kind of skeleton - the power shape - and then identify the heli- al substru tures within the power shape with a variant of geometri hashing.1 Introdu tionX-ray rystallography is one of the main te hniques for determining three-dimensional protein stru ture. Experimental di�ra tion data provides theamplitudes of some of the Fourier oeÆ ients of a three-dimensional mapof ele tron density in a rystal of the protein. The phases of the Fourier oeÆ ients are estimated using a variety of experimental and omputationalte hniques. When there is high-resolution di�ra tion data and the phases arewell-estimated, individual atoms are visible in the ele tron density map anddetermining the three-dimensional stru ture is easy. Often, however, only anoisy low-resolution map is available.y Computer S ien es Dept., Austin, TX 78712, USA. Fax: 512-471-8885. Sup-ported by NSF/CCR-9731977 and an Alfred P. Sloan Foundation Resear h Fellowship.amenta� s.utexas.edu 1
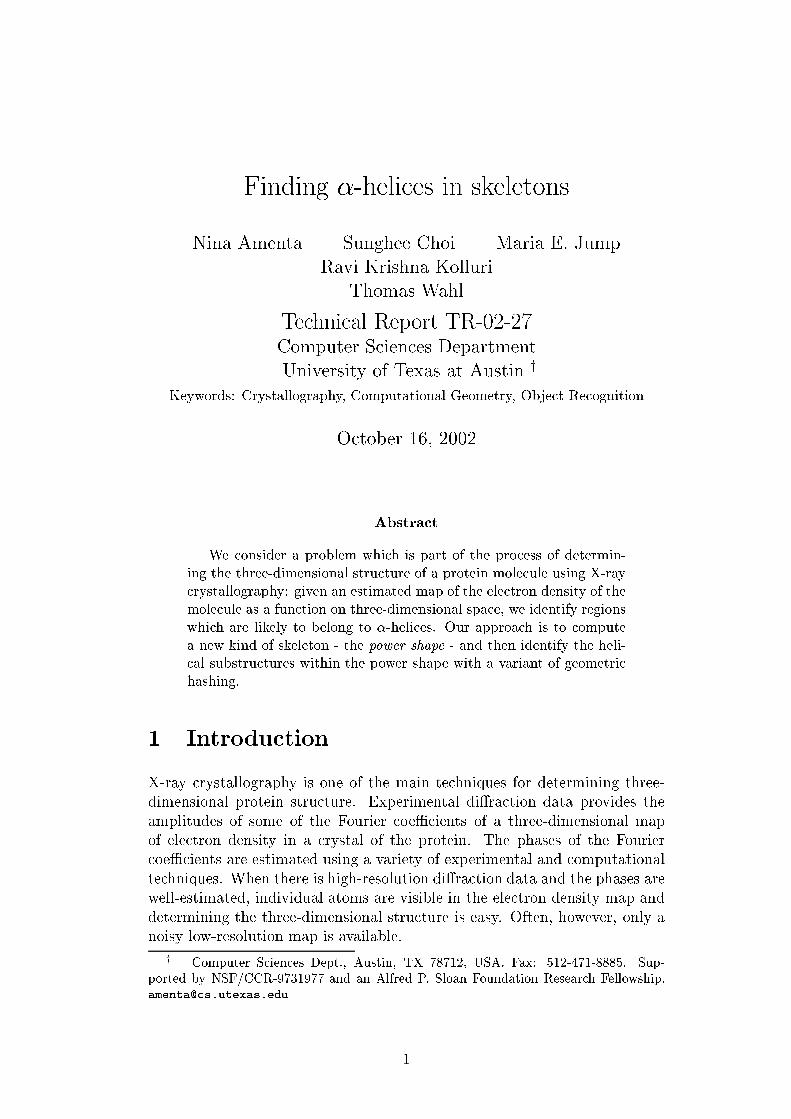
At this point, a hemist will spend days or weeks at a omputer graphi s ter-minal, manually aligning a sti k-�gure mole ular model ontaining thousandsof atoms to the density map. Most of the really time onsuming, diÆ ult butde ipherable, maps are at between 3 and 4 �Aresolution. Finding se ondarystru tures, espe ially the �-heli es, is one of the �rst steps a human experttakes when aligning the model with the map, and hen e it is one of the �rststeps we should attempt to automate.Our work: Given a density map represented by a three-dimensional gridof fun tion values as input, we ompute an isosurfa e. We then ompute askeletal representation of the solid bounded by the isosurfa e, known as thepower shape, omposed of triangles. For ea h triangle in the power shape,we examine a set S 0 of nearby power shape verti es and �nd the helix thatbest agrees with S 0 by geometri hashing. If there is suÆ ient agreement, wereport the points as part of a helix. Sin e there is a dire t mapping betweenthe power shape and the isosurfa e, this orresponds to labeling a se tion ofisosurfa e as belonging to a helix, as in Figure 1.We have tested the method su essfully on two density maps, one at 3.0Angstroms and the other at 3.5 Angstroms. At these resolutions �{heli esare visible as twisted shapes in the isosurfa e. See Figure 1.Importan e of the problem: There are at least three ways in whi hautomati ally lo ating �-heli es an be useful. First, it an be used as adomain-spe i� visualization tool. Highlighting heli al portions of the iso-surfa e an make things easier for the hemist during manual model building.Se ond, �nding heli es is used as part of a density map re�nement algorithm.Information about the three-dimensional stru ture of the mole ule is used toimprove the estimated phases, thus improving the quality of the map itself.Often re onstru tion is an iterative pro ess in whi h model building alter-nates with phase improvement. This would be most useful for noisier, lowerresolutions maps than those we have onsidered so far, but our te hniquemight be appli able. Finally, it might be possible to ombine automati geometri interpretation of the density map with AI methods for predi t-ing se ondary stru ture from sequen e data to automati ally form tentativemat hes of portions of sequen e data to the map.2 Related workThere is an ex ellent existing tool for �nding stru tural fragments su h as �{heli es in ele tron density maps. The most re ent version of Kevin Cowtan'sfffear program [19℄ an �nd heli es in very low quality low resolution maps(6-8 Angstroms, larger than a single turn of a helix). It sear hes a dis reteset of possible orientations of the fragment. For ea h orientation, it onvolvesthe map with a �lter resembling the fragment, by multipli ation in the fre-quen y domain. This is quite eÆ ient, and independent of the fragment size.It takes advantage of the fa t that the frequen y domain representation is2
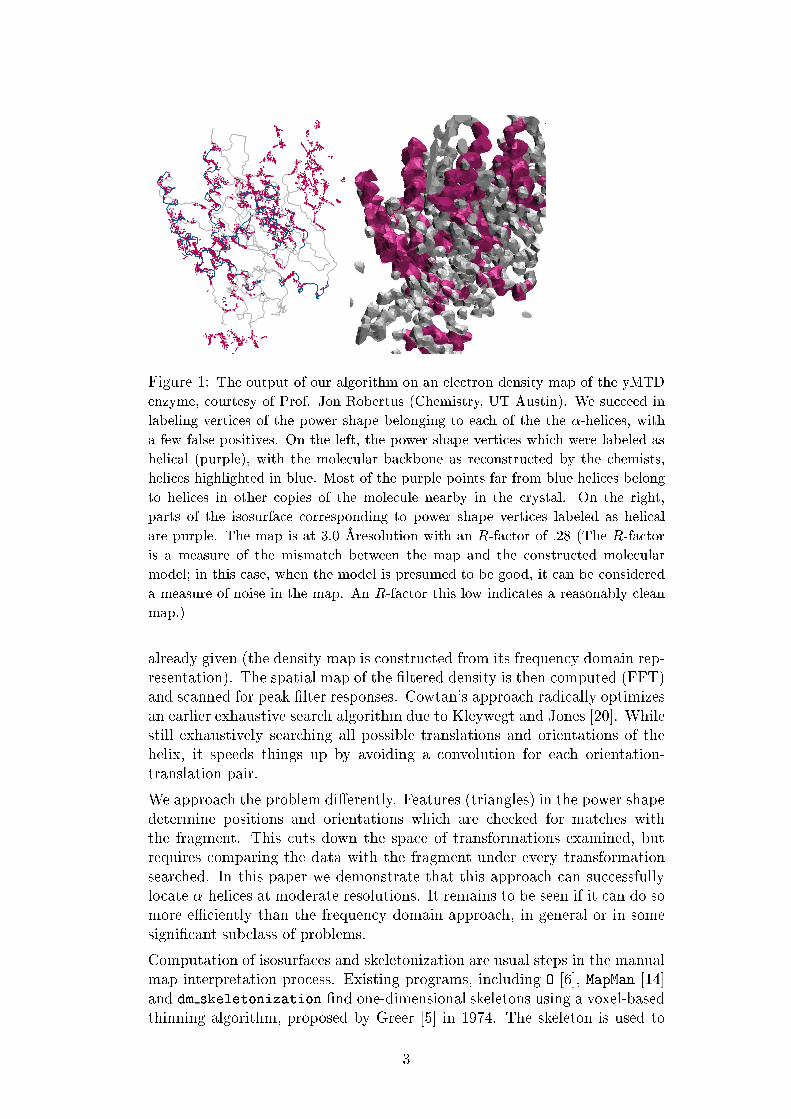
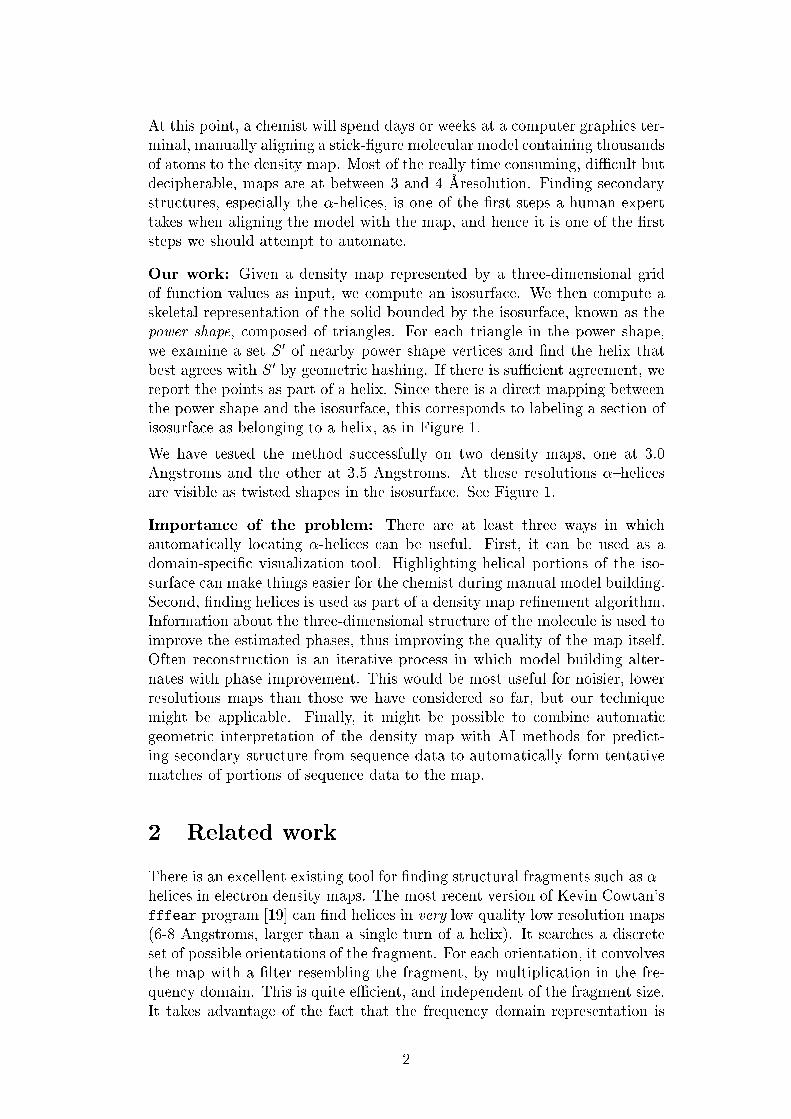
Figure 1: The output of our algorithm on an ele tron density map of the yMTDenzyme, ourtesy of Prof. Jon Robertus (Chemistry, UT Austin). We su eed inlabeling verti es of the power shape belonging to ea h of the the �-heli es, witha few false positives. On the left, the power shape verti es whi h were labeled asheli al (purple), with the mole ular ba kbone as re onstru ted by the hemists,heli es highlighted in blue. Most of the purple points far from blue heli es belongto heli es in other opies of the mole ule nearby in the rystal. On the right,parts of the isosurfa e orresponding to power shape verti es labeled as heli alare purple. The map is at 3.0 �Aresolution with an R-fa tor of .28 (The R-fa toris a measure of the mismat h between the map and the onstru ted mole ularmodel; in this ase, when the model is presumed to be good, it an be onsidereda measure of noise in the map. An R-fa tor this low indi ates a reasonably leanmap.)already given (the density map is onstru ted from its frequen y domain rep-resentation). The spatial map of the �ltered density is then omputed (FFT)and s anned for peak �lter responses. Cowtan's approa h radi ally optimizesan earlier exhaustive sear h algorithm due to Kleywegt and Jones [20℄. Whilestill exhaustively sear hing all possible translations and orientations of thehelix, it speeds things up by avoiding a onvolution for ea h orientation-translation pair.We approa h the problem di�erently. Features (triangles) in the power shapedetermine positions and orientations whi h are he ked for mat hes withthe fragment. This uts down the spa e of transformations examined, butrequires omparing the data with the fragment under every transformationsear hed. In this paper we demonstrate that this approa h an su essfullylo ate �-heli es at moderate resolutions. It remains to be seen if it an do somore eÆ iently than the frequen y domain approa h, in general or in somesigni� ant sub lass of problems.Computation of isosurfa es and skeletonization are usual steps in the manualmap interpretation pro ess. Existing programs, in luding O [6℄, MapMan [14℄and dm skeletonization �nd one-dimensional skeletons using a voxel-basedthinning algorithm, proposed by Greer [5℄ in 1974. The skeleton is used to3
help identify the main hain of the protein during manual model building.A di�erent skeletonization pro edure was proposed by Leherte et al. [8, 9℄.They onstru t a topologi al network on the set of riti al points of themap, resulting in a sparser 1D skeleton (ours is a denser 2D skeleton). Theyhave had some su ess in using this skeleton to identifying �-heli es at 3�Aresolution (thus, omparable to this work), but it seems unlikely that itwould extend to mu h lower resolutions be ause the number of riti al pointsde reases with the map resolution.There is some quite impressive work on the ompletely automati determi-nation of the entire 3D stru ture from di�ra tion data. The wARP systemof Perrakis et al. [10℄ has been su essful with density maps in the 1-2.5Angstrom range. Their approa h is based on the `dummy atom' method ofLamzin and Wilson [7℄ for phase improvement. A di�erent approa h wastaken re ently by Wang [11℄, who employs a bran h-and-bound algorithm in onformation spa e.3 Skeletonization with the medial axisWe begin by des ribing the power shape onstru tion. The power shape wasdevised as an approximation of the medial axis of a three-dimensional solid,a di�erent kind of skeleton from that approximated by the one-dimensionalskeletons used in urrent systems. Medial axes are somewhat more expres-sive, and might be of independent interest for visualization and other shapeanalysis tasks.Figure 2: On the left, the medial axis of an obje t is formed by the enters ofthe maximal balls ontained in the obje t. In three dimensions, the medial axis istwo-dimensional. On the right, the power shape approximates the medial axis bythe enters of a �nite set of balls. In three dimensions the power shape is madeup of triangles.The medial axis: Given a losed surfa e F , we say a ball B is empty (withrespe t to F ) if the interior of B ontains no point of F . A medial ball isa maximal empty ball; that is, it is not ompletely ontained in any otherempty ball. The medial axis is de�ned as (the losure of) the set of the entersof the medial balls. In general, the medial axis of a three-dimensional solidis a two-dimensional surfa e. 4
Given the medial axis and the radius of the maximal empty ball for ev-ery point of the medial axis, the surfa e an be re onstru ted perfe tly. Inthis sense the medial axis ontains more information than a one-dimensionalskeleton ould. For example, big side- hains like tryptophan usually showup as attened blobs in the isosurfa e at 3 �A. The medial axis of su h ablob is roughly a disk, while the medial axis of a tubular region is loser toa one-dimensional urve.Power shape: Computing the exa t medial axis of a three-dimensionalobje t is diÆ ult. We approximate the medial axis - an in�nite union ofballs - by a �nite union of balls using the Voronoi diagram. To onstru tthe �nite union of balls approximating the in�nite set of medial balls, wesample the surfa e and ompute the Voronoi diagram of the sample set. Wesele t a set of verti es of the Voronoi diagram far from the sample set asour approximate medial axis points. We dis over the adja en ies of thesepoints using the power diagram, an kind of weighted Voronoi diagram. Theresulting polygonal stru ture is the power shape. A detailed des ription ofthe onstru tion, and an analysis of its quality as an approximation of themedial axis, as a fun tion of the quality of the sample set, an be found inour papers [1℄, [2℄.To sample an isosurfa e from a density map, we extra t a set of verti es usingthe mar hing ubes algorithm [15℄ as implemented in VTK [16℄. We use theverti es of the isosurfa e to ompute the power shape. When the density mapis given on a sparse grid, mar hing ubes returns a sparse sample from theisosurfa e and the resulting power shape is very rough. Choosing more sam-ples from the isosurfa e, using a smooth interpolant of the mar hing ubesverti es gives power shapes whi h do a mu h better job of approximating themedial axis; see Figure 3.Simpli� ation of the power shape: Unfortunately, the medial axis tendsto be ompli ated-looking and unstable with respe t to its input. Smallperturbations on the surfa e introdu e large \spikes" in the medial axis. Onthe other hand, portions of the medial axis indu ed by big shape features arequite stable and give a good approximate des ription of the shape.To isolate the stable portions, we de�ne a noise threshold �, and de�ne an un-stable medial axis feature as one that might disappear if the surfa e were per-turbed by �; note that su h a perturbation might indu e topologi al hangesin the obje t. The feature is in danger of disappearing if the points on thesurfa e to whi h it orresponds are within distan e � of ea h other. To elim-inate su h features, we remove any ball whi h tou hes the surfa e at pointsthat are within distan e �. The remaining balls may still be very redundant.We therefore remove balls whi h are almost ompletely overed by otherballs, using a greedy algorithm, des ribed in more detail elsewhere [1℄.The net e�e t of this simpli� ation pro ess is to produ e a two-dimensionalskeletonization whi h re e ts only large shape features. In Figure 3, weshow the power shape of an isosurfa e for two di�erent values of �, one whi hmerely removes quantization noise and another whi h eliminates many shape5
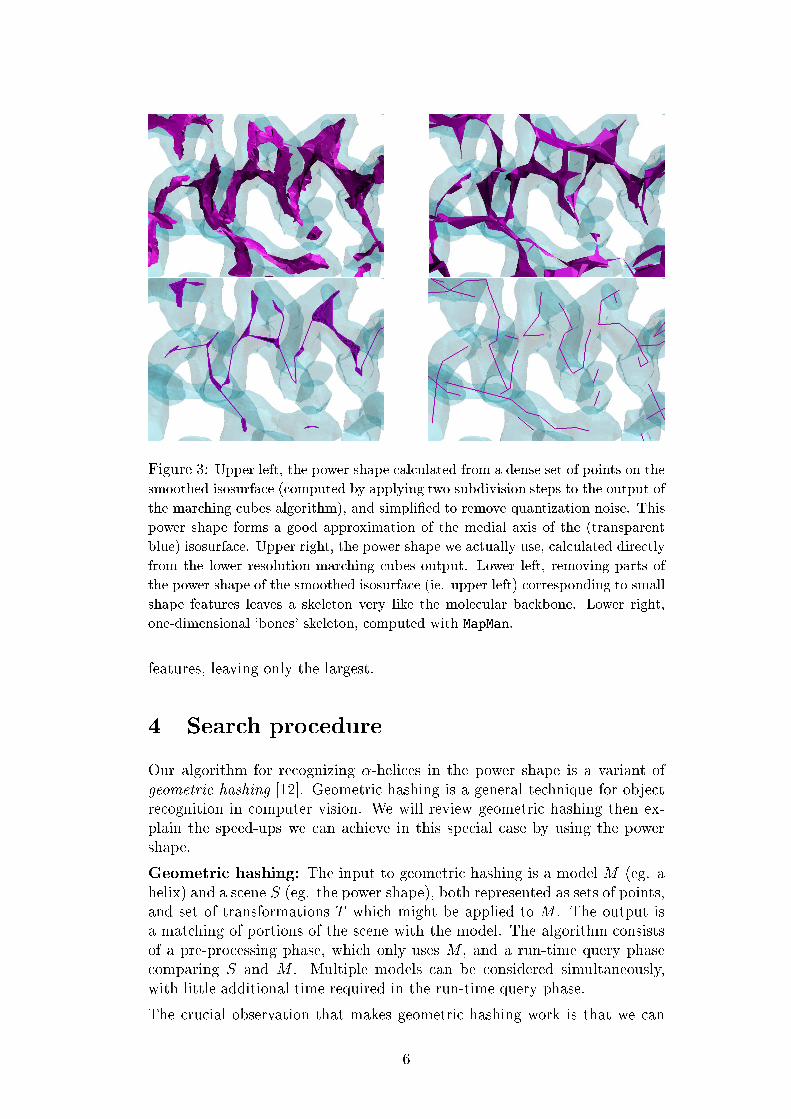
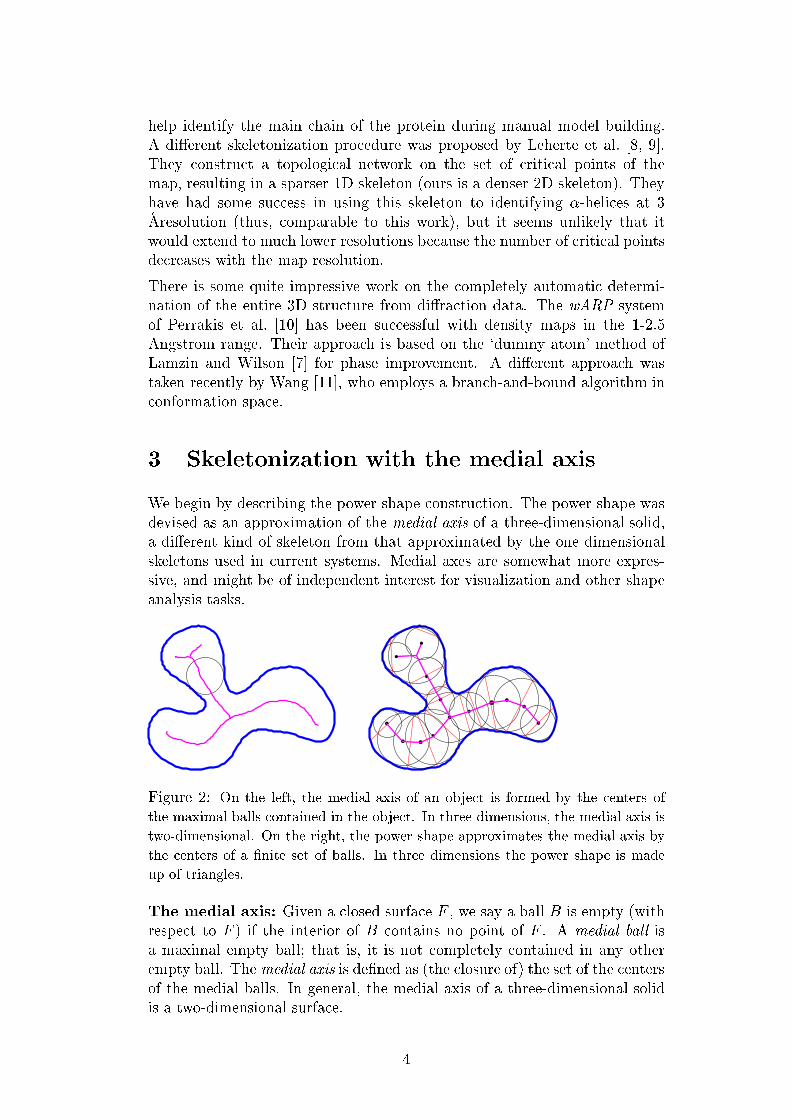
Figure 3: Upper left, the power shape al ulated from a dense set of points on thesmoothed isosurfa e ( omputed by applying two subdivision steps to the output ofthe mar hing ubes algorithm), and simpli�ed to remove quantization noise. Thispower shape forms a good approximation of the medial axis of the (transparentblue) isosurfa e. Upper right, the power shape we a tually use, al ulated dire tlyfrom the lower resolution mar hing ubes output. Lower left, removing parts ofthe power shape of the smoothed isosurfa e (ie. upper left) orresponding to smallshape features leaves a skeleton very like the mole ular ba kbone. Lower right,one-dimensional `bones' skeleton, omputed with MapMan.features, leaving only the largest.4 Sear h pro edureOur algorithm for re ognizing �-heli es in the power shape is a variant ofgeometri hashing [12℄. Geometri hashing is a general te hnique for obje tre ognition in omputer vision. We will review geometri hashing then ex-plain the speed-ups we an a hieve in this spe ial ase by using the powershape.Geometri hashing: The input to geometri hashing is a model M (eg. ahelix) and a s ene S (eg. the power shape), both represented as sets of points,and set of transformations T whi h might be applied to M . The output isa mat hing of portions of the s ene with the model. The algorithm onsistsof a pre-pro essing phase, whi h only uses M , and a run-time query phase omparing S and M . Multiple models an be onsidered simultaneously,with little additional time required in the run-time query phase.The ru ial observation that makes geometri hashing work is that we an6
express the oordinates of the points in the model M in a basis B de�nedby a onstant number of points of the model, so as to be invariant under theset T of transformations.For instan e, if T onsists just of translations, it suÆ es to onsider any pointp 2 M as the origin of the set B of basis ve tors. In that simple ase, wemat h M to S as follows. Choose a point p in the model as the origin of oordinate system given by B. Use the oordinates of ea h point of M , withrespe t to B, as the index of an item in a hash table H. This ompletes thepre-pro essing phase. In the query phase, for ea h point q in S, use q as theorigin for a basis B. If q is a point in the s ene su h that translating p toq mat hes M with a subset of S, orresponding points in the s ene and themodel will now have the same oordinates. We look up ea h point in S inthe hash table H; if it �nds a orresponding point of M , we ount one `vote'for this translation. If the number of votes is equal to the number of pointsin M , we on lude that is a mat h, and we output the translation.To be useful in most settings, the requirements for a mat h have to be relaxedsomewhat to a ommodate error. First, the points of M and S might notmat h exa tly. This is solved by rounding the oordinates used to index andlook up items in the hash table. It might be that some points of M arenot mat hed by points of S. In general this an be solved by requiring thenumber of votes to be at least a �xed per entage of the number of points inM . But if the point q orresponding to the orre t origin is missing from Sthen the entire mat h is missed. This is solved by storing the oordinates ofthe model points inM with respe t to every origin p 2M into the hash table.Votes are ounted separately for ea h hoi e of p; translations mat hing pairsp 2 M; q 2 S whi h re eive many votes are output. Note that although thehash table gets larger, the number of hash-table lookups in the run-timequery phase remains the same.Finally, there are some obvious optimizations. Using the relaxations de-s ribed in the previous paragraph, every transformation mat hing M to asubset of S will be found multiple times. On e a mat h is found, the orre-sponding points of S an be eliminated from further onsideration. Also, ifM is small (geometri ally) with respe t to S, only points of S near q needto be looked up in the hash table.Our algorithm: In our ase, we used 80 points distributed along a two-turnsegment of an ideal �-helix ba kbone as the modelM and the verti es of thepower shape as the s ene S, and the rigid motions (rotation and translation)as the set T of transformations. The prepro essing step involves building thehash table H. For this set of transformations we need three non- ollinearpoints to de�ne a referen e frame. Given model points x1; x2; x3, we let x1be the origin and de�ne the three orthogonal basis axes by by the ve torsv1 = n( ~x2 � ~x1)v2 = n( ~x3 � ~x1 � (( ~x3 � ~x1) � v1)v3 = v2 � v17
where n() represents normalization. Ea h non- ollinear triple of points in the�rst turn of our model helix is used to onstru t a basis and the oordinatesof all the points inM are expressed in this basis and stored in the hash table.This prepro essing step needs to be done only on e, for the parti ular helixmodel. Note that sin e order matters, every three points need to be taken inea h of six permutations.We use some observations about the stru ture of power shapes of heli esin density maps to speed up the run-time query phase. First, heli es tendto be dense, so that the parts of the power shape belonging to a helix are ontained in a single onne ted omponent of the power shape. And se ond,be ause they are tightly wound, heli es tend to ontain rather large trianglesspanning urves or even entire turns of the helix.In generi geometri hashing, all triples of power shape verti es are tried asbases. But sin e only one triple from a parti ular helix in the s ene has tobe hosen for the helix to be found, and any helix in the s ene has manytriangles spanning three of its verti es, we limit our attention to triples ofpoints whi h form triangles in the power shape. The verti es of ea h triangleonly have to be onsidered in one order, sin e the basis a ording to ea hpermuation was used to reate entries in the hash table. For ea h triangle,we use the the onne tivity of the power shape to sele t a subset S 0 of thepower shape verti es in the neighborhood of the basis triangle. We perform abreadth �rst traversal of the graph formed by the power shape edges, startingat the basis triangle. We stop either when we have exhausted the onne ted omponent or at most a onstant number (we use = 200) of verti es havebeen rea hed. We then look up only these points in the hash table H.Finally, when a mat h is found, we try to label as many power shape verti esas belonging to the helix as possible. When a basis is su essful, meaningthat at least one model-basis pair re eives many votes, we expand the set ofpower shape verti es onsidered using another breadth-�rst sear h, and lookthose up in the hash table as well.This results in the following algorithm:For ea h triangle t in the powershape do:1: Let B be the orthonormal basis de�ned by the verti es of t2: Starting at the verti es of t obtain the neighborhoodof t by breadth �rst traversal . This neighborhood forms S 0 � S.3: Compute the oordinates of all verti es in S 0 with respe t to basis B.4: Look up ea h vertex in S 0 in the hash tableand vote for (model,basis) pairs.5: If the number of votes for a given (model,basis) pairis above a threshold:a: Label all verti es that voted for this transformation as part of a helix.b: Expand the set S 0 by breadth-�rst traversal and label as many new points as possible.8
5 ResultsThe input �les for the run-time query phase were power shapes for the yMTDenzyme shown in Figure 1 and the barley hitinase shown in Figure 4, on-taining respe tively 14,692 and 80,542 verti es and 144,420 and 203,774 tri-angles. We visually ompared the sets of power shape verti es labeled asbelonging to heli es with the models of the mole ular ba kbones onstru tedby the hemists, with the heli ies on the ba kbone labeled by the DSSP al-gorithm [13℄. We found that some of the power shape verti es around ea hof the heli es in ea h mole ule were labeled, ex ept for a single-turn helixin the hitinase mole ule (a twist in the hitinase ba kbone is erroneouslylabeled as heli al by DSSP; our algorithm did not label any verti es in thatarea). We also labeled a few `false positive' regions near short urves in theba kbone. In the images, there appear to be many `false positives'. Thisis be ause ea h density map ontains parts of several mole ules whi h arenear the entral mole ule in the rystal. Most of the labeled verti es whi hdo not appear to be near heli es in the ba kbone are near heli es in theseother opies of the mole ule. About 35% of the verti es of the yMTD powershape were labeled as belonging to heli es and about 11% of the verti es inthe hitinase power shape.The run-time query phase of the algorithm as des ribed in the previous se -tion required about 2 hours and 15 minutes on the hitinase and about 2hours for the yMTD. This large running time is mostly spent sear hing largeportions of the power shape that do not represent a helix.Re all, however, that only one basis de�ning a mat h for the helix in the s enemust be found, and many bases are generally found for ea h helix, so it shouldbe possible to skip some andidate bases and still �nd every helix. A ommonoptimization in geometri hashing is to randomly hoose a small subset ofbases to try. Here, we hose instead to heuristi ally eliminate triangles thatare very small (assuming that the tightly-wound heli es almost universally ontain long triangles) and those that were numeri ally unsuitable as bases.Using about 30% of the triangles in the hitinase power shape redu ed therunning time to 40 minutes with no appre iable di�eren e in the quality ofthe output, as shown in Figure 4.We also onsidered a di�erent heuristi , eliminating triangles from onsider-ation if ea h of their verti es belonged to another triangle whi h had alreadyformed a basis. This redu ed the running time even more, but seemed harderto justify.6 Dis ussionThere is a lot of potential here for further work. We have demonstrated that�-shapes an be found in density maps at moderate resolution by examining askeletal representation. We are urrently engaged in further experimentationwith this implementation, in luding randomly hoosing bases, experiments9
with noisier, poorly-phased maps, and a dire t omparison with fffear.In addition, there are interesting alternative implementations of both of thetwo basi building blo ks of this approa h, skeletonization and dis rete shapemat hing. Geometri hashing is one of several te hniques, in luding thepossibly more eÆ ient random sample with onsensus [18℄ and alignmentmethods [17℄, for lo ating a model in a s ene. `Bones' skeletons might beused instead of power shapes, and the very simpli�ed power shapes fromsmoothed isosurfa es (Figure 3, lower left) might be more sensitive thanthe rough power shape we are urrently using. Medial axis approximations omputed by voxel-based methods might also work well, and would probablybe faster to ompute in this ontext.7 A knowledgmentsWe thank Prof. Leonides Guibas (CS Stanford) for suggesting that we exploreX-ray rystallography.We are deeply grateful to Prof. Jon Robertus (UT Chemistry) for sharingyMTD and barley hitinase density maps and his view of the model onstru -tion pro ess, and to Je� Almrud (UT Chemistry) for sharing many referen esand insights into the state of the art in protein rystallography.Referen es[1℄ N. Amenta, S. Choi and R. Kolluri. The power rust. Manus ript, 2001.Available at http://www. s.utexas.edu/users/amenta/power rust.[2℄ N. Amenta, S. Choi and R. Kolluri. The power rust, unions of balls,and the medial axis transform. Submitted by invitation to Computa-tional Geometry: Theory and Appli ations, spe ial issue on surfa e re- onstru tion. http://www. s.utexas.edu/users/amenta/pubs/[3℄ C. Bajaj, V. Pas u i, D. S hikore. Visualization of S alar Topology forStru tural Enhan ement Pro eeding of the IEEE Visualization, (1998),pp. 51-58.[4℄ Blum, H., A transformation for extra ting new des riptors of shape,Models for the Per eption of Spee h and Visual Form (Walthen-Dunn,W., ed.) MIT Press, 1967.[5℄ J. Greer. Three-dimensional pattern re ognition" an approa h to auto-mated interpretation of ele tron density maps of proteins. Journal ofMole ular Biology 82 (1974) pp. 279{301.[6℄ T.A. Jones, J.-Y. Zou, S.W. Cowen, and M. Kjeldgaard. A ta Crystel-lographi a A47(1991)pp.110-119.[7℄ V.S. Lamzin and K.S. Wilson. A ta Crystellographi a D 49 (1993) pp.129-147. 10
[8℄ L. Leherte, S. Fortier, J. Glasgow, and F. H. Allen. Mole ular s ene anal-ysis: A topologi al approa h to the automated interpretation of proteinele tron density maps. A ta Crystallographi a, D50:155-166, 1994.[9℄ L. Leherte, J. Glasgow, K. Baxter, E. Steeg, and S. Fortier. Analysisof three-dimensional protein images. Journal of Arti� ial Intelligen eresear h, 7 (1997) pp. 125{159.[10℄ A. Perrakis, R. Morris, and V.S. Lamzin. Automated protein modelbuilding ombined with iterative stru ture re�nement. Nature Stru turalBiology, 6:5 (1999), pp. 458{463.[11℄ C. Wang. Determining mole ular onformation from distan e or densitydata. PhD thesis, MIT, Feb, 2000.[12℄ Y. Lamdan and H. Wolfson. Geometri hashing: a general and eÆ ientmodel-based re ognition s heme. In Pro eedings ICCV '88, pages 238{249, 1988.[13℄ W. Kabs h and C. Sander. DSSP : De�nition of se ondary stru ture ofproteins given a set of 3D oordinates, Biopolymers 22 (1983) , pages2577-2637[14℄ G.J. Kleywegt and T.A. Jones. Halloween ... Masks and Bones. In FromFirst Map to Final Model, edited by S. Bailey, R. Hubbard and D.Waller. SERC Daresbury Laboratory, Warrington, pp. 59-66.[15℄ W.E. Lorensen and H.E. Cline. Mar hing Cubes: a high resolution 3Dsurfa e re onstru tion algorithm, Pro . of SIGGRAPH '87 (1987), pp163-169.[16℄ W. S hroeder, K. Martin, and B. Lorensen. The Visualization Toolkit:An Obje t-Oriented Approa h To 3D Graphi s, Prenti e Hall, 1997.[17℄ D.P. Huttenlo her and S. Ullman. Re ognizing Solid Obje ts by Align-ment with an Image, Inter. Journ. Comp. Vision 5(2):195{212 (1990).[18℄ M. A. Fis hler and R. C. Bolles. Random sample onsensus: A paradigmfor model �tting with appli ations to image analysis and automated artography. Comm. Asso . Comp. Ma h., 24(6):381{395, (1981).[19℄ K. Cowtan. Modi�ed phased translation fun tions and their appli ationto mole ular fragment lo ation, A ta Cryst. D54, (1998), pp. 750-756.[20℄ G. J. Kleywegt and T.A. Jones. Template onvolution to enhan e or de-te t stru tural features in ma romole ular ele tron-density maps, A taCryst., D53, (1997) 179-185.11
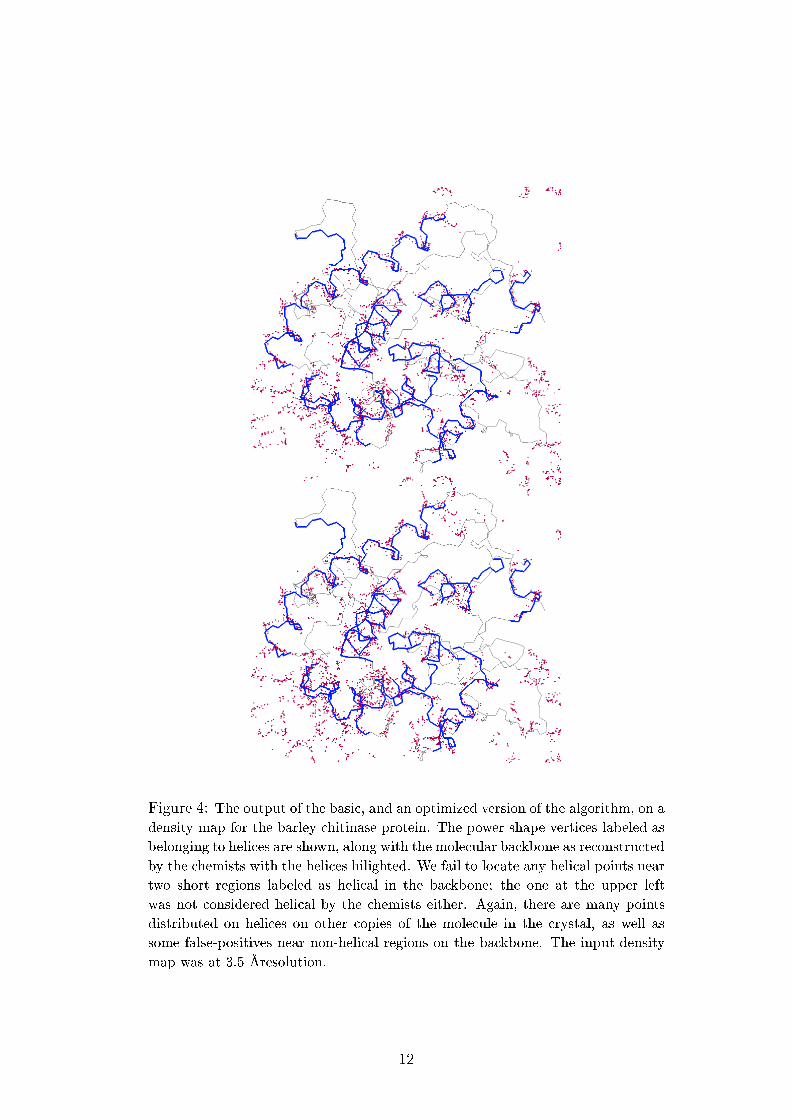
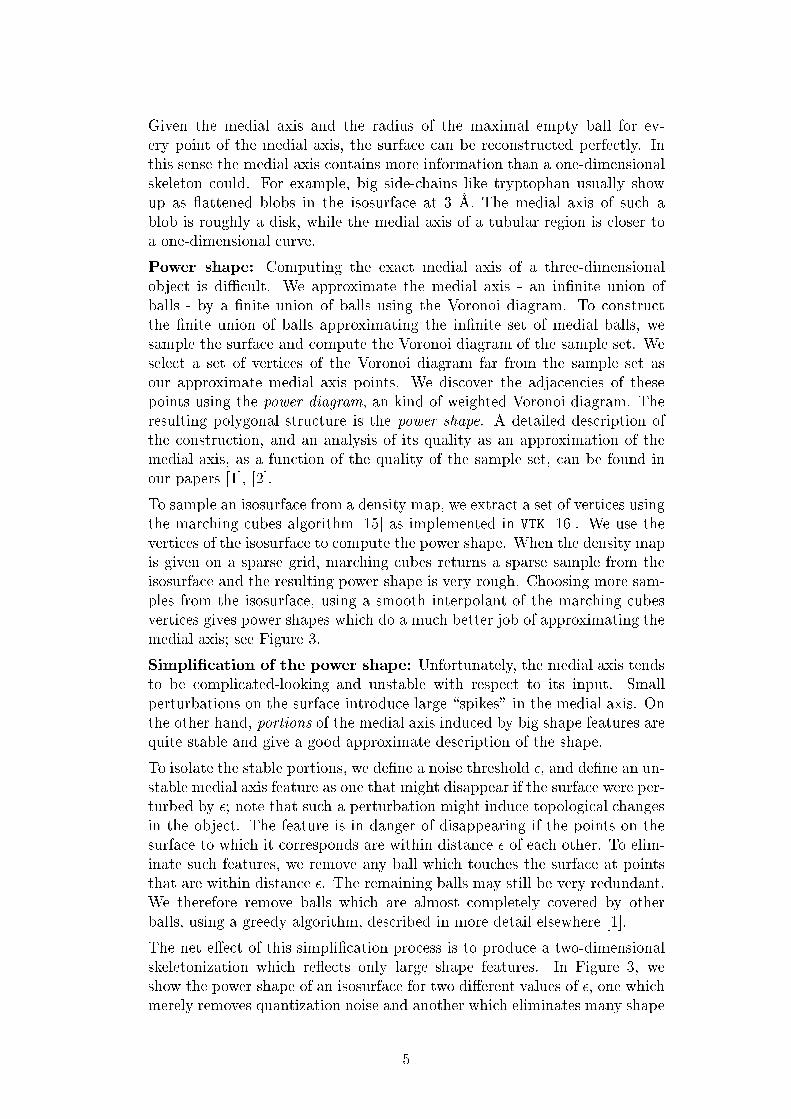
Figure 4: The output of the basi , and an optimized version of the algorithm, on adensity map for the barley hitinase protein. The power shape verti es labeled asbelonging to heli es are shown, along with the mole ular ba kbone as re onstru tedby the hemists with the heli es hilighted. We fail to lo ate any heli al points neartwo short regions labeled as heli al in the ba kbone; the one at the upper leftwas not onsidered heli al by the hemists either. Again, there are many pointsdistributed on heli es on other opies of the mole ule in the rystal, as well assome false-positives near non-heli al regions on the ba kbone. The input densitymap was at 3.5 �Aresolution.12