Embed Size (px)
Citation preview

An Appraisal of Risk Assessmentand Safeguard Procedures
Financing Pulp Mills
Financing Pulp Mills
An Appraisal of Risk Assessment and Safeguard Procedures
Machteld Spek
Machteld Spek


Machteld Spek
Financing Pulp Mills:An Appraisal of Risk Assessmentand Safeguard Procedures

© 2006 by CIFORAll rights reserved. Published in 2006Printed by SUBUR printing
Cover photo by Christian CossalterDesign and layout by Catur Wahyu
ISBN 979-24-4612-5
Published byCenter for International Forestry ResearchJl. CIFOR, Situ Gede, Sindang Barang, Bogor Barat 16680, IndonesiaTel.: +62 (251) 622622; Fax: +62 (251) 622100E-mail: [email protected] Web site: http://www.cifor.cgiar.org
National Library of Indonesia Cataloging-in-Publication DataSpek, MachteldFinancing pulp mills: an appraisal of risk assessment and safeguard procedures/ Machteld SpekBogor, Indonesia: Center for International Forestry Research (CIFOR), 2006.86p.ISBN 979-24-4612-51. pulp and paper industry 2. risk assessment 3. investment planning 4. environmental impact 5. social impact. I. title

Contents
Preface vExecutive Summary viiiAcknowledgements xiiiIntroduction 1Trends in pulp investment: Capacity and financing 4 Pulp production process and impacts 4 Pulp production capacity and industry structure 5 Investments in pulp capacity after 1995 10 Financing raised by pulp producers 12 Conclusion 15Principal sources of funding for pulp mills 16 Development funding from multilateral development banks 16
World Bank 17 IFC 20 MIGA 23 ADB 24 EIB & EBRD 24 Other multilaterals 26
Export credit agencies 26 Commercial financings 28
Market access 31 Lending cost 33 Domestic banks 35 Equity 36
Conclusion 37Financial risk assessment 39 Credit risk assessment 39 Due diligence 42 Ongoing (risk) analysis 45
Credit rating agencies 45 Securities research 49
Corporate disclosure 51 Conclusion 52

iv
Impact assessment and safeguards 53 Equator Principles 53 Safeguard implementation 55 Implementing safeguards in transactions in the international capital markets 59 Improving standards and implementing safeguards in existing operations 59 The Global Reporting Initiative 61 Conclusion 64Key findings and recommendations 66 Key findings 66 Recommendations 70Sources 72Appendices 75Glossary 83

Preface
In October 2003, the World Bank hosted the Forest Investment Forum, a two-day conference which brought together 150 senior executives of forest product companies, private and public sector financial institutions, and conservation organizations. The Forum’s central aim was “to explore opportunities for private sector companies, the World Bank, the IFC, and other financial institutions to invest in environmentally, socially, and economically sustainable forest enterprises in developing and economic transition countries.”
Perhaps not surprisingly, much of the discussion at the Forest Investment Forum focused on anticipated capacity expansion in the global pulp and paper sector. It was projected that some 128 million tonnes of new paper and paperboard capacity will likely be needed to meet growing world demand by 2015. While much of this new capacity will be fed by recovered paper, it is estimated that 36 million tonnes of new wood pulp capacity will be installed over the next decade, including 22 million tonnes of hardwood kraft pulp. This expansion of wood-based pulp capacity is likely to require approximately US$ 54 billion in capital investment through 2015. Several billion dollars more will be needed to develop millions of hectares of fast-growing pulpwood plantations.
Even if only a fraction of this is ultimately realised, these projections suggest that a new wave of pulp mill financings may soon be underway. Existing plans indicate that much of the new capacity will be brought online in Brazil, China, Indonesia, the Mekong region of Southeast Asia, and the Baltic states.
Several speakers at the Forum – including Masya Spek, the author of this study – emphasised that such projections underscore the need for investment institutions to employ stronger practices in assessing the financial risks, legal compliance, and social and environmental impacts of pulp and plantation investments. Pulp mills require special attention for a number of reasons: First, the enormous scale of modern pulp mills means that they consume very substantial volumes of wood. A single BHKP mill with an annual capacity of 1.0 million tonnes, for instance, will typically require between 4.5 – 5.0 million cubic meters of roundwood per year – roughly equivalent to 15 percent of the total annual timber harvest from the Brazilian Amazon. Large-scale pulp mills can also place considerable pressures on natural forests when production capacity is installed before supporting plantations are brought online, as prior CIFOR research in Indonesia has shown. In countries or regions with poor forest governance, demand for pulpwood can be a significant

vi
factor driving illegal logging. Plantation development, too, is often associated with displacement of forest communities and social conflicts.
The present study examines how pulp mill projects – including both the development of greenfield mills and capacity expansions – get financed. The analysis is based on a close review of 67 pulp projects, with a combined 25.5 million tonnes/year of planned new capacity, that were proposed between 1995 and 2003. Spek, a Chartered Financial Analyst who has covered markets in Southeast Asia for over 13 years and worked in the financial sector for over 20 years, traces the sources of financing available, respectively, to producers seeking to expand existing operations and those planning to build new mills. She assesses why some projects got financed and why some ultimately did not. This analysis illuminates the fact that most pulp capacity expansions are funded through commercial financings – that is, through loans, bonds, or equity issues – while greenfield mill projects generally require government or multilateral support.
The study also examines how financial institutions assess the risks and potential impacts of the pulp mill projects they fund. The picture that emerges suggests that most export credit agencies, merchant banks, and other private sector investment institutions have little in-house expertise related to forestry issues and/or social and environmental impact assessment. Many prefer to rely on information provided by the project sponsor and, whenever possible, on the participation of the IFC or other multilateral agencies, which have stronger capacity to carry out such evaluations. In practice, this often means that a range of issues which may have critical importance to the success of a proposed project-- such as growth rates and productivity levels at supporting plantation sites; the legality of wood to be consumed by a proposed mill; and the likely impacts of a project on local livelihoods -- are poorly assessed.
The good news is that a growing number of financial institutions have, in recent years, adopted stronger safeguards to limit negative social and environmental impacts of forest- related investments. In 2001, for instance, Dutch banks ABN AMRO and Rabobank introduced policies that explicitly prohibit making loans for projects that involve conversion of primary forest, purchase of illegally harvested timber, or displacement of indigenous peoples. Moreover, since 2003 some 33 lending institutions have endorsed the Equator Principles, an initiative led by the IFC to enhance the use of social and environmental safeguards for project financings in all industry sectors, including forestry. That same year, many of the world’s leading export credit agencies adopted the OECD ‘Common Approaches on Environment’, which require environmental impact assessments to be conducted before most forest-related projects can be approved.
In this study, Spek examines the relevance of such initiatives to pulp mill finance, giving particular attention to the Equator Principles. She rightly applauds signatory banks for taking an important step towards incorporating social and environmental considerations into lending practices. Yet she points out that the Equator Principles cover only project finance – and, therefore, apply only to a very small portion of total bank funding for pulp mill projects. There is clearly considerable room to expand the relevance of the Equator Principles to pulp investments if they could be broadened to include other types of financial arrangements, as well.
This study also emphasises the importance of improved corporate reporting practices on the part of pulp producers and associated plantation and forestry companies, in order to enhance transparency and accountability. In particular, Spek highlights the potentially important role that the UNEP-sponsored Global Reporting Initiative could play in establishing an industry standard for corporate reporting on key operational variables, including fiber supply.

vii
This study is being published by CIFOR, with support from the DFID-funded Multi-stakeholder Forestry Programme and from the European Commission’s Asia Pro Eco Programme, with the aim of improving risk analysis and due diligence practices on the part of financial institutions involved in funding pulp mill projects globally. We sincerely hope that the analysis and recommendations presented here will help financial institutions to better assess the risks and impacts of the projects they fund – and, in doing so, to support more environmentally, socially, and economically sustainable investments in this important sector.
Christopher BarrSenior Policy Scientist, CIFOR
December 22, 2005

This study was conducted to see how investors and lenders assess the financial risks and social and environmental impacts associated with pulp mills. Despite the large amounts of capital tied up in these projects, it has been apparent that there are weaknesses in the risk assessment system that allow poor practice to go undetected. As a result, highly unsustainable pulp producers can often obtain funding, even though the existence of safeguards should make this impossible. Once they begin operating, the high capital cost of such mills means that they are unlikely to be closed down, while their scale frequently poses a challenge to remedial action. Moreover, once pulp projects are in existence, they can generally continue to obtain funding irrespective of the standard of their operations. Efforts to tighten the quality net so that the poorest operators do not obtain financing will therefore need a two-pronged approach, with one focusing on ensuring minimum standards are effectively upheld in new projects, and another focusing on raising standards in existing projects.
To better understand to how pulp projects obtain funding, and to what extent financiers can and do assess the quality of the proposed project and borrower, a sample of transactions proposed between 1995-2003 was studied. Over this period, 25.5 million tonnes of annual new pulp production capacity was proposed, of which 41% is now going ahead.
Capacity additions proposed by existing players in the pulp sector have the highest chance of going ahead with a 66% success rate. Where projects did not go through, this tended to be the result of changed corporate strategies as opposed to an inability to obtain funding. 27.1% of proposed greenfield mills went on to being realised. Funding forms a bigger barrier for greenfield projects in the absence of an existing business that provides the cashflows. Increasing comfort levels is critical to obtaining financing, and the level of sponsor-provided capital plays an important role.
Since 2000, pulp producers raised US$ 215.5 billion in funding from commercial sources. The majority (82.7%) of this took the form of loans typically extended to existing producers in traditional producing centres (North America, Western Europe and Japan). Narrowing the focus to producers in developing countries and in countries with transitioning economies, US$ 37.8bn in debt and equity financing was found for the period covering 1990 - 2004.
Funding is a key barrier to entry for proposed pulp mills, and funding institutions jointly and singly hold significant power with regard to determining which projects are ultimately realised. Smaller scale pulp mills will typically be financed by banks in their home markets. Mills with annual production capacities in excess of 200,000 tonnes will generally find themselves
Executive Summary
This study looks at how investors
and lenders assess pulp mills…
…with reference to transactions
proposed between 1995 – 2003.
Two-thirds of proposed capacity
additions succeeded, as compared
to only 27% of proposed new mills.
Before start-up is the time to weed
out poor projects.

ix
Multilateral development banks
play a key role at this stage.
Along with Export Credit Agencies
that facilitate purchases of state of
the art equipment.
Large mills can secure easy
financing in the international
capital markets. Size is the
key criterion for entry, and this
provides an incentive to up-scale in
excess of direct market needs.
Pulp production is less of an equity
market play due to the poor returns
across the cycle.
Even when due diligence identifies
poor practise, this does not normally
result in financing being denied.
Sectoral considerations and
ratings, rather than issuer and
project quality, drive investment
decision making processes.
addressing larger institutions, either multilateral development banks, or raising financing in the international capital markets because the size of their funding needs are harder to accommodate in the domestic market.
From the 1960s to the 1980s multilateral development banks were significant catalysts in the funding of new pulp mills. They pulled back considerably in the late 1990s, providing only some US$ 1.9 billion to the sector during the past decade as a result of restrictive lending policies adopted by the World Bank Group that considerably limited the ability of these institutions to finance forest based activities. Because non-engagement was considered to be more damaging than engagement, a new policy was introduced in 2003. This policy placed greater emphasis on the objectives to be achieved in making loans, as opposed to outlining what could not be done. As a result of this policy, the World Bank Group is accelerating its activities in forest based financing, in particular in China, the near East and former Eastern Europe. As a result of early stage involvement, multilaterals can significantly influence project structure and standards, and they are ostensibly organised to do just this.
Industrial country export credit agencies play a prominent role in financing machinery and equipment purchases. Over the last two decades, export credit financing has opened the way for pulp producers to buy technologically advanced equipment that causes limited pollution. At the same time, changes in pulping technologies have led to a substantial increase in the production capacity of world-class pulp mills. ECA’s have financed projects of ever-increasing scale, posing a rising challenge to fiber supply, placing substantial demands on both water and energy supplies, as well as requiring a transport and logistical infrastructure surrounding the mill that is not always available. In some cases, the needs of the producing country may be better served by smaller mills; however, there are often considerable financial and political factors that result in the construction of the largest mills possible. Existing pulp producers of scale will typically tap the international capital markets for funding. This funding can take the form of syndicated loans, bonds or equity offerings. The international capital markets have no formal entry requirements or a central regulatory body, but informal requirements include a listing on one’s domestic stock exchange for commercial entities, a credit rating and an issue size of at least US$ 100 million, if not US$ 200-300 million. This effectively limits access to only the larger players. Once a pulp producer gains entry to the capital markets, repeat issuance is relatively easy. It is thus seen that a handful of developing country pulp companies have dominated issuance in the sector.
Even the pulp producers with very low cost production bases, such as those in Latin America and Indonesia, have not succeeded in delivering superior returns to their equity holders. This has resulted in only a lukewarm stock market reception – while the companies were listed, they were hardly core to investors’ portfolios. The pulp producers did at various times raise additional equity, as this was needed to support growing debt burdens taken on to finance continuing expansions. Eager to get more bond issuance mandates, the lead underwriters for these issues were keen to launch them and place them to their clientele.
The risk assessment and due diligence practices of banks are not in themselves sufficient to identify poorly performing or unsustainable pulp producers. While extensive due diligence may be conducted, it generally does not result in financing being denied when weaknesses are found, though the cost and pricing of the offering may increase. The weakness in question may be discussed in the prospectus, though cases have been found where such weaknesses are deliberately de-emphasised. In many cases critical risk factors are not (properly) addressed.
Financial institutions generally take a portfolio approach to risk management where sector and country allocation take precedence over individual issuer analysis. Issuer strength is critical with regard to loan pricing, but this is typically assessed based on credit risk ratings that are given

x
by rating agencies. Due to disintermediation and competitive pressures, lenders and investors do not have access to unambiguous and relevant data about their investee companies that would allow them to make a more detailed credit assessment at the company level should they want to.
Lenders and investors use the work of the parties who do monitor companies and industries on an continuous basis for changes in issuer-specific or industry-wide conditions, such as credit risk agencies and securities analysts. However, their work does not provide evidence that they proactively and effectively track issues related to fiber supply and other key factors influencing the company’s competitiveness, and make an effort to obtain or estimate these data where they are not given. The work also reflects a high level of reliance on information provided by the borrower or sponsor companies, and little independent investigation into areas on which these parties are silent. In such cases, when problems come to the surface, the damage will already have been done, and the credit downgrade that follows is reactive rather than predictive.
Risk control and monitoring mechanisms are in place, but in actual practise these are geared to avoiding liabilities and meeting legal requirements, rather than to actively uncover risks and operational weaknesses. Incentives to do the deal today are effectively greater than the incentive to preserve portfolio quality.
Commercial banks, working with the IFC have adopted the Equator Principles to guide their cross-border project finance activities. In so doing, banks are looking to create a level playing field among themselves, while upholding recognised quality standards, particularly regarding social and environmental impacts.
The Equator Principles – as currently structured - have little direct impact on pulp mill financing activities of the signatory banks because pulp companies rarely use project finance. Nevertheless if user experiences with the Equator Principles are positive, this initiative is likely to be more broadly extended to other areas of financing.
Most financial institutions and ECAs still lack in-house capacity to assess a project’s likely social and environmental impacts as required by the Equator Principles. EP signatories therefore tend to rely on the assessment of the IFC and other multilaterals which have greater capacity and expertise in conducting such assessments. This mechanism will do little to internalise a rounded decision making process within the banks or ECAs financing a project. Moreover, it gives insufficient recognition to the fact that even multilateral development banks cannot guarantee positive development outcomes.
A structural weakness in the application of safeguard policies is that they are guided by Environmental Assessments that are typically commissioned by the project sponsor. At present, Environmental Assessments are often of mediocre quality that goes undetected in the absence of review by informed parties. Nor are Environmental Assessments structured to provide an effective framework for follow-up monitoring once a project is in place. Sponsor quality has been found to be a critical factor in project success. As a more balanced picture of sponsor quality emerges only well into the project, there are no effective means to enforce quality when a sponsor does not truly care about the impact of his project. Raising environmental assessment standards and defining hard implementation targets is one way to increase the effectiveness of safeguard mechanisms.
The Equator Principles (and multilateral development bank lending guidelines) apply to new projects when ample information about the prospective project is being made available to lenders. Disclosure drops significantly once a company is already in operation. To the extent such companies are under a requirement to report their results, this applies to the financial results, but not to details about their operations. At the simplest level, these disclosures should
Lenders and investors often have
little first hand knowledge of their
clients…
… because they rely on third
parties for inputs in the risk
monitoring process. When major
problems surface, the damage will
already have been done.
The Equator Principles guide
project finance transactions and
aim to uphold common quality
standards across its signatories.
Because pulp mills are rarely
structured as project finance
transactions, the EP don’t impact
this sector with its significant
environmental and social impacts.
EP signatories still need to build
capacity to effectively apply the
Principles so that they result in
higher project quality on the ground.
A key weakness in the appraisal
and implementation process is
that it is driven by a sponsor
commissioned Environmental
Assessment. This EA is often too
general in nature to be able to
serve as an effective tool to guide
project quality.
A lack of hard operational data
stands in the way of an objective
observation of operating standards
of projects once they are in
operation.

xi
encompass (1) capacity per type of product produced; (2) use and cost of resources/inputs per type of product; (3) output/sales and price received per type of product; (4) source of fibre, supply contracts; (5) condition of plantations, including key operational variables such as acreage planted, productivity levels, and volumes harvested. Because observing operational performance, and collecting data over time is important to arrive at a balanced assessment of what has been achieved, where standards are and how these are changing, the reporting of relevant hard operational variables by companies is a critical step in raising standards.
The voluntary Global Reporting Initiative, spondored by the UN Global Compact, is well positioned to serve as the framework for non-financial reporting on a company’s operations. As part of this initiative, industry specific reporting guidelines are established that have to be followed if a reporting company is to be in compliance. The GRI has already produced sector supplements for six industries, with two more in progress, but so-far these do not cover the pulp and paper sector. For the GRI to succeed with pulp producers, stakeholder recognition that accepted practices of existing companies in some areas will fall short of best practices is critical to success. At present, none of the 13 pulp and paper companies that are part of the GRI are reporting in accordance with the GRI, but we expect this to change over time. The focus of reporting should be on determining what minimum acceptable standards are, what behaviour is not acceptable, and how to get the bottom quartile to raise standards.
Recommendations
To users of safeguard measuresThe safeguard measures that currently guide the implementation of new pulp mill projects are still insufficient to anticipate likely problems, and act to contain them. With regard to pulp mills, this is partly because the full impact of a pulp mill on its environment is not yet properly understood. In recognition of this, it is recommended that pulp mill investments are henceforth considered as sensitive and irreversible (Category A) investments, rather than as manufacturing investments with an environmental impact (Category B).
We recommend that that Environmental Assessments (EA) are externally reviewed to ensure that they comprehensively and objectively address all material aspects and impacts. We recommend that EA’s include a specific schedule for implementation with a built-in monitoring programme. As a condition for obtaining financing, companies should be required to make periodic reports releasing key operational and social/environmental variables, that may periodically be subjected to external audits.
To all stakeholders A meaningful discussion about what behaviour is acceptable is necessary if financiers are to meaningfully apply safeguards to existing projects. This discussion can only be had based on observed behaviour, not based on theoretical best operating practices. As such there is a need for more detailed reporting of operational, in addition to purely financial, data by companies. For companies to make such reports on a voluntary basis, there must be stakeholder acceptance that actual operating standards are bound to be lower than best operating practices. It is recommended that stakeholders with divergent interests and agendas - including, for instance, both pulp producers and NGO’s - find ways to engage constructively to raise standards across the industry.
To the financial communityHaving signed on to the Equator Principles or adopted safeguard measures to guide lending to environmentally sensitive sectors, the financial community now needs to work on effectively implementing these across their respective organisations and in the face of aggressive and hungry dealmakers, and managers pushing for a higher slot in the ranking tables.
Within the scope of the GRI sectoral
key operational disclosures could
be designed to allow for a picture
of actual operating standards to
emerge over time. Focus should
then be on improving standards
of those players that do not meet
minimum acceptable standards.

xii
Effective implementation of safeguards requires that safeguard assessment is embedded in the credit function. As a result, it is recommended that financiers develop in-house assessment capability, rather than relying on external assessments. Financial institutions also need to think about how to uphold these standards in the many areas of their business where they are currently not effectively applied.
Because sponsor quality and commitment is a critical variable in the long-term performance of both a project and the securities/loans that finance them, sponsor track records need to be critically reviewed. In view of the damage that can be caused by unsustainable pulp mills, it is recommended that no pulp mill financing is extended to sponsors with a poor trackrecord.
To regulatorsWe recommend that those (self-) regulatory authorities that set disclosure levels for companies with listed debt or equity securities include the reporting of concise and material operational variables in the periodic requirement. In setting these requirements, it is advisable that there is cross-coordination with the GRI to minimise the burden on the reporting entity.
In regulating lending institutions, regulators are advised to give due considerations to the broader societal and economic impact of lax lending practises, and pay closer attention to loan specific due diligence and credit risk assessment practises in their oversight.
To pulp producersPulp producers can make a first step toward fostering a better understanding of their operations by raising disclosure levels. We recommend that this is done within the existing framework of the GRI that already has a number of pulp producers as members. These producers can now move forward by establishing a common, industry-wide reporting standard. As proper impact assessment also necessitates an understanding of the operations of a company, the quality of reporting would be enhanced if it includes a comprehensive mapping of meaningful resource use in and flows through the production process, as final output. The minimum disclosures that this would entail include: (1) capacity per type of product produced, (2) use and cost of resources/inputs per type of product, (3) output/sales and price received per type of product, (4) source of fibre, supply contracts, (5) condition of plantations: acreage planted, amounts harvested.
To the Equator PrinciplesWe recommend that the Equator Principles, working through the organisations that signed up to it, aims to expand adoption of its principles to include all financings in excess of US$50m raised by companies active in environmentally sensitive areas. In addition to project finance, this would include syndicated loans, issues of notes and bonds, and equity.
The Equator Principles assume disclosure levels that are only available for new projects, and then in the format of projections. A first step should be to ensure that projects financed with Equator funds commit to publishing these variables. The dissemination of relevant information about their operations and the impact thereof will deepen the understanding of the financial community and other relevant parties about working with safeguards.
To the Global Reporting InitiativeFor the GRI to be of use to investors, it needs to be concise and material. We recommend that the tendency to indulge in overly complex reporting is tempered by the question of what is material. The inclusion of summary GRI outputs in annual reports and periodic stock exchange filings will allow the results to reach a broader audience. The GRI is progressively implementing industry-specific reporting standards with the collaboration of member companies. The issuance of a pulp and paper industry supplement can be accellerated with the active participation of those pulp and paper producers that are already GRI members.

The research and analysis presented in this study has been funded by the Multi-stakeholder Forestry Programme (MFP) and the United Kingdom’s Department for International Development (DfID). The European Commission’s Asia Pro Eco Programme has also provided funds to support publication and dissemination of the study. The generous support of each of these institutions is gratefully acknowledged. The contents of the report, however, are the sole responsibility of CIFOR and in no way should be taken to reflect the views of the MFP, DFID or the European Commission.
This desk study was conducted as part of CIFOR’s project on Financial Institutions and Forestry Investment. I extend my warm thanks to its project leader, Chris Barr, for giving me the opportunity to write this study. Both he and David Kaimowitz, Director General of CIFOR, took great interest in the work and provided useful input along the way.
This paper was reviewed by people across a range of relevant industries, who devoted considerable time and attention to reading the study and providing the comments that contributed to the final version that is presented here. My thanks go to Claire Barnes, James L. Brown, Reiner de Man, David Gait, Andrew Gittler, Luc Mongeon, Drake Pike, Sara Webb, as well as those who did not want to be explicitly acknowledged. Additional thanks are due to Luc Mongeon for arranging free use of financing data provided by Thomson Financial covering the period 2000 - 2005 (Jan), and used in Chapter 2.
At CIFOR, special thanks are due to Catur Wahyu for setting this document, and accommodating a number of revisions as this paper moved from a review draft to finished product; and to Ambar Liano for coordinating my visits to the campus.
The CIFOR campus is a welcoming place to be, and the guest house a most comfortable and stimulating workplace. My appreciation goes to all those people, visible and invisible, who make it thus.
Machteld SpekSingapore, September 2005
Author contact
Machteld Spek ([email protected]) is a Chartered Financial Analyst who has covered markets in Southeast Asia for over 13 years and worked in the financial sector for over 20 years. She is based in Singapore, and conducted this study as a consultant to CIFOR.
Acknowledgements


A CIFOR/WWF study on Indonesia’s pulp and paper industry conducted in 2000 found, among other things, that ‘weak due diligence practices and inadequate financial reporting standards led the international investment community to channel over US$ 15 billion to Indonesian pulp producers without a secure, legal, and sustainable supply of wood fibre’. In response to this finding, CIFOR’s project on Financial Institutions and Forestry Investment began working to strengthen the financial due diligence practices, risk assessment techniques, and regulatory reporting standards associated with forestry and plantation investments. The present study was commissioned as part of this project.
This study provides a review of how pulp mills are being financed, what (credit) risk assessment and safeguard implementation practices are applied to these financing decisions, and what their impact is. This study is concerned with plantations to the extent that these are part of pulp producing entities, but otherwise focusses on pulp producers because it is in financing them that most of the weak due diligence practices are found. Because such practices are universally applied, and because the safeguards aim to address all critical impacts of a project, and not just fibre supply, the scope of this study is set accordingly: global, not just Indonesia, and dealing with fibre supply as one of a number of aspects of pulp mill sustainability.
The word sustainability is used in this paper to mean ‘Meeting the needs of the present generation without compromising the ability of future generations to meet their needs.’. With respect to fiber supply the word is used to mean ‘Not using more fibre than can be re-generated from the forest/plantation area, and without damaging the ecology of the forest and the livelihood of those that depend on this forest area’. Sustainability is a complex issue however, and we refer readers to the 1996 study of the International Institute for Environment and Development (IIED) entitled ‘Towards a Sustainable Pulp Cycle’ for a good introduction to the issues that are involved in sustainable pulp and paper production. This study does not aim to lay down the absolute criteria that should be applied to assess new projects, or what constitutes acceptable behaviour. This is the role of a multi-stakeholder debate, and not of CIFOR.
At the time of writing, the majority of parties involved in financing pulp mills recognise their moral obligation to ensure that projects they finance do not cause harm, and have adopted a range of safeguards to guard against this in addition to conventional (credit) risk analysis. Applied effectively, these measures should be able to identify structural weaknesses in proposed pulp and plantation projects. Some of the simple reasons why they are not are that the safeguards that exist do not correctly recognise the principal impacts of pulp mills, and that the safeguards do not apply to the international capital markets where most of the financing for pulp mills is
1 Introduction

2
raised. This study therefore looks at how the existing measures can be applied to greater effect, rather than pushing for further perfection of these measures to utopian standards.
This study is directed at all parties that are involved financing new pulping capacity, and in the design and practical implementation of safeguard measures in the pulp financing process. This group includes first and foremost the commercial and merchant banks that, having recently adopted safeguard standards, now have to work to implement them across their business activities.
The second target audience is the multilateral development banks. More than other groups of lenders, they that are often involved in financing pulp mills at the start-up stage, and act as an arbiter of quality, in which role they are implicitly recognised by the private sector. Yet, despite a long history of safeguard implementation, even the multilateral development banks cannot always guarantee positive outcomes, although this is not universally recognised. Within the arena of multilaterials, this study pays special attention to the IFC in recognition of the fact that its standards are the most widely followed by commercial financial institutions.
The third major audience of this paper are NGOs and other bodies seeking to influence the behaviour of pulp mill financiers. It is hoped that the review of how pulp mills get financed and the markets and financiers involved will be of use to them, and allow them to work more effectively. NGOs have played a critical role in getting financial institutions to recognise that they have a more obligation to uphold safeguards in their business practices. Now the time has come to translate these commitments into action, and this will require a willingness to accept the reality on the ground, and work to improve this as opposed to an insistence that anything short of the very best operating practices will not do.
Last but not least, this study is directed at the pulp industry. This study calls on pulp producers and plantation companies to collaborate in defining a set of meaningful operational data that companies can use to disclose their performance to the market so that discussions on safeguard implementation can be rooted in the realities on the ground.
This study is organised into five main sections, preceded by an introduction. Chapter 2 sets the scene by looking at the size of the global pulp industry, its location and expansion. It looks at what proportion of previously proposed new capacity has been realised realised and why, and how it has been financed. Financing for the overall industry is also addressed. Chapter 3 looks at the most important sources of financing for pulp mills. Funding sources for entirely new mills differ from those of expansions, and given the importance of getting mill design right from the start, much emphasis is placed on those markets and institutions with input at the early stages. The chapter next reviews the international capital markets where in actual practice the large mills of newly emerging pulp producing countries have been able to fund themselves. Chapter 4 deals with financial risk assessment. This chapter is relevant primarily for the financing of existing facilities, and thus relates more to the activities of banks and other players in the international capital markets. It shows why institutional investors assess risks the way they do, and why this process is not effective in identifying company specific weaknesses, even though the overall credit process would be enhanced by this. Chapter 5 discusses safeguard measures. It shows that their application is very limited with respect to new pulp mill capacity, and that where they are applicable, there are weaknesses in the implementation as a result of which they do not succeed in screening out projects that rely on unrealistic assumptions to become sustainable and/or do not effectively address the implementation processes necessary to address negative impacts. There is considerable room to enhance safeguard implementation by more effectively embedding it into the lending process in a way that is not the case now. To extend the application of safeguards to existing operations there needs to be an understanding of what actual standards at these mills are, what behaviour is not acceptable and which projects therefore should not receive financing. This requires that the behaviour in existing mills can be observed, and this is

3
not yet the case at present. Therefore, a first critical step to make is to work towards improved operational reporting by the industry, that could opt to do so on a volutary basis through the Global Reporting Initiative. The Key findings and recommendations of this study are presented as the final chapter and can also be read as an Executive Summary. More factual summaries of the chapter contents may be found at the end of every chapter.

2.1 Pulp production process and impacts
Pulp is used to manufacture materials such as paper, board, tissue and rayon. Pulp can be made from a variety of fibers, of which wood is most predominant.
Pulp has traditionally been made from coniferous wood found in temperate countries. This type of wood is also known as softwood, and specific species include pine, aspen, spruce, fir and hemlock. These types of wood derive their consistency from cellulose fibers that are extracted in the pulp production process. The length of these fibers is critical in determining the strength and consistency of the final product into which it is processed. The hardwood species that grow in tropical countries, including eucalyptus, acacia and trees of the family of dipterocarp, are comparatively less suited to pulp production as they yield shorter fibers. It was only with improvements in papermaking technology that such woods could be used, and this became a facilitating factor in the move of pulp production capacity to tropical countries as further discussed below. Despite the improvements in paper making technology, longfiber pulp remains preferred over shortfiber pulp, and the pricing of the relevant pulp grades expresses this. Longfiber pulp trades at a premium over shortfiber pulp, and pulp produced from a single species trades at a premium over pulp produced from a mixture of wood species. Different products use different proportions of long- and shortfiber pulp, whereas for some grades, considerable amounts of recycled fibre are also used. Because fibers break in the recycling process, pulp products can only be recycled for a limited number of times, even where the recycled fibre is used in conjunction with virgin fibre.
The cellulose fibers can be extracted from the wood in various ways. Extraction of the fibers with grinders followed by soaking results in groundwood that is used in lower grade product such as newsprint and board. Such pulp is also called mechanical pulp. Thermomechanical pulp (TMP) is made with a slightly more sophisticated method involving the use of steam at high pressure, rather than soaking, in the extraction process. When chemicals are also used in this process, one obtains chemithermomechanical pulp (CTMP). The drawback of each of these mechanical pulp production processes is that there is considerable fibre breakage. This is overcome in the production of pure chemical pulp when chemicals (typically chlorine) are combined with woodchips to dissolve the lignin after which the cellulose fibers can be extracted without crushing. The remaining lignin slurry is known as black liquid, and a potential source of pollution. Black liquid can now be further reprocessed to be used as fuel or as a pulping agent itself, but this is a more costly option than simply disposing of it. Chlorine in particular is highly pollutive. Recent innovations in production technologies involve the use of alternative chemicals such as oxygen, ozone and hydrogen peroxide. Depending on the ultimate quantity of chlorine used, such pulp is known as elementally chlorine free (ECF) or totally chlorine free
2 Trends in pulp investment: Capacity and financing
The cellulose fibre in wood is used
to make pulp. Pulp made from
long fibres is stronger than pulp
made from short fibres. Some pulp
grades use recycled fibre.
The process of extracting cellulose
fibres from the wood using
chemicals is highly pollutive.
Improvements in production
techniques have yielded less
pollutive processes.

5
(TCF). Research efforts now focus on the use of biological agents such a fungi in the fibre separation process, but these have yet to yield a viable production process alternative.
The pulp production process has evolved to an extent that much of the pollutive impact can be mitigated, provided a producer is prepared to purchase the state of the art machinery that offers these capabilities. In proportion, the impact of the fibre demand has become more pronounced. As the pulp industry has grown in size, more fibre is needed as raw material. While this demand is increasingly being met by plantation grown fibre, the magnitude of this fibre source is still insufficient to meet aggregate demand, so that much of it is still met by culling wood from the natural forest. This wood culling is not always done on a sustainable basis. The opening of new production facilities in resource rich countries further added to the complexities of impact. Many of these countries had forest dependent populations whose livelihoods were disturbed by the establishment of these large industries. The interests of these communities were never recognised let alone taken into account when these mills were established. It was typically an era of more autocratic regimes, and around the world there was a greater belief in the fact that that modernisation meant progress, and a lesser understanding that not all countries had adequate systems to ensure that the benefits of megaprojects would flow through to the broader population as opposed to specific elites.
A full discussion of all the impacts of pulp and paper making would fill a volume of its own. Readers can find these issues discussed in the 1996 study of the International Institute for Environment and Development (IIED) entitled ‘Towards a sustainable pulp cycle’. The reader can consult the bibliography for additional sources.
2.2 Pulp production capacity and industry structure
The wood pulp industry currently has an estimated installed annual production capacity of 187.6 million air dried tonnes per year (hereafter ‘tonnes’). An additional 12.7 million tonnes of confirmed capacity expansions or projects with a high likelihood of going through could raise this figure to 201.6 million tonnes over the next five years1.
1. The capacity figures excludes Chinese production capacity based on any fibre other than wood, where higher numbers are found these are likely to include bagasse and bamboo based capacity as well.
Table 2.1 Global pulp production capacity 2003 and growth since 1996[data in k air-dried metric tonnes]
Area/country Capacity 7yr growth % of total North AmericaUnited States 60,455 -2.0%Canada 27,679 -0.8% Total Nth America 88,134 -1.6% 47.0
Japan 15,694 6.6% 8.4
EuropeFinland 14,320 17.5%Sweden 12,221 12.6%France 3,047 -8.4%Norway 2,417 -12.3%Germany 2,435 28.2%Spain 2,085 18.6%Portugal 1,938 11.1%Austria 1,760 -2.5%Other W-Europe 2,236 -3.7% Total W-Europe 42,459 9.8% 22.6
Source: compiled from FAO (1996-04) and Paperloop
Wood pulp industry capacity
is 187.6m tpa and confirmed
expansions will raise this to
201.6m tpa by 2010.
Technological advances have
mitigated the impact of pollution.
The impact of fibre demand
has meanwhile become more
pronounced, and is not yet well-
understood.

6
Traditional producer countries dominate existing pulp production capacity. The US, W- Europe and Japan account for 78% of total capacity. While large, this share is gradually declining. The US and Canada are experiencing negative net capacity growth, with new capacity being added at a rapid rate in a number of developing countries and countries with transitioning economies. Brazil, Indonesia and Chile accounted for only 10% of total capacity in 2003, but for 73% of net observed capacity growth since 1996.
Table 2.2 gives summary data for the principal producing countries. The traditional production centres are primarily geared to meeting the needs of their domestic markets, as evidenced by low export rates. In these markets, per capita consumption is also proportionally higher. The US, Canada, Europe and Japan account for 18.6% of global population, but consume 73% of global pulp and paper output. The new production centres of the 1970s and the 1980s established their pulp industries to serve the export markets. Although domestic demand has increased in these countries, their pulp industries are still primarily oriented towards serving the export market. More recently, large countries with emerging economies are looking to establish wood pulp capacity to serve their domestic markets, and the paper and packaging needs of their export oriented industries. A prime example is China. Here, the new capacity will partly replace older non-wood fibre based capacity that previously met the domestic demand for paper. The challenge in these countries is posed by the shortage of wood and competion for arable land.
Table 2.1 Global pulp production capacity 2003 and growth since 1996 (continued)Area/country Capacity 7yr growth % of total Russian Federation 5,900 -42.5%Poland 1,137 13.4%Czech Republic 925 25.9%Other E-Europe 813 -35.3% Total E-Europe 8,775 -33.8% 4.7
Middle East & Magreb 813 -8.3% 0.4
Latin AmericaBrazil 9,681 38.9%Chile 2,793 26.2%Argentina 929 -3.0%Mexico 530 -27.0%Other Latin America 409 0.2% Total Latin America 14,342 27.2% 7.6
AsiaChina 2,254 50.6%Indonesia 6,150 118.7%India 1,414 18.1%Other Asia 2,349 33.3% Total Asia 12,167 67.4% 6.5
AustralasiaNew Zealand 1,714 5.2%Australia 1,273 4.3% Total Australasia 2,987 4.8% 1.6
South Africa 1,872 8.2%Other Africa 409 0.2% Total Africa 2,281 6.7% 1.2
Grand total 187,652 3.9% 100.0 Developing countries 29,603 37.3% 15.8
Source: compiled from FAO (1996-04) and Paperloop
Developing countries account for a
small proportion of total capacity,
but they dominate capacity growth.
Pulp industries were favoured
investments for resource rich
developing economies as a means
to earn foreign exchange from
value added processing of natural
resources.
China and India are currently
building their pulp industries with
a view to meeting rising domestic
demand.

Table 2.2 Key statistics for major pulp producing countries (2003)
Chile Argentina Brazil China Indonesia Australia New Zealand Japan Finland Sweden US CanadaRussian
Federation France Norway Germany Austria Spain Portugal India South Africa Thailand
Population (m) 15.4 37.5 169.7 1,285.0 210.0 19.3 4.0 127.0 5.2 8.9 284.8 31.1 146.1 59.0 4.5 82.4 8.1 40.5 10.4 1,025.0 44.4 63.0
Land area (km2) 756,096 2,791,810 8,514,000 99,596,961 2,050,000 7,686,848 270,530 77,800 304,590 41,000,000 9,372,614 9,970,000 17,075,200 551,500 324,000 357,020 83,749 505,988 91,906 3,287,263 1,220,088 513,115
Forest area (km2) 154,790 440,000 4,120,000 1,337,000 1,410,000 420,000 107,260 251,460 230,090 28,000,000 2,095,730 4,170,000 7,855,000 146,800 120,000 108,000 39,471 262,732 33,494 663,000 18,000 129,722
of which commercial 19,891 11,000 2,450,000 110,000 17,988 22,700,000 1,955,965 2,340,000 139,500 75,000 33,715 147,322 245,000 13,300
P&B capacity k tonnes 933 1,730 8,338 36,000 9,904 1,000 34,279 14,605 11,084 93,040 21,663 7,600 11,700 3,596 20,246 4,695 5,545 1,436 5,400 2,615 3,676
Pulp capacity k tonnes 2,793 929 9,681 2,254 6,150 1,273 1,714 15,694 14,320 12,221 60,455 27,679 5,900 3,047 2,417 2,435 1,760 2,085 1,938 1,414 1,872 958
Pulp exports (% of production) 74.2% 0
P&B per capita consumption (kg; 2001) 57.0 46.0 38.0 29.0 24.0 193.0 184.0 242.0 194.0 247.0 324.0 250.0 38.0 183.0 228.0 225.0 241.0 158.0 108.0 5.0 42.0 32.0
P&B operating rate (2001) 92% 71% 88% 70% 84% 90% 86% 95% 91% 82% 88% 88% 93% 99% 87% 66%
Pulp operating rate (2001) 85% 92% 77% 88% 69% 80% 91% 88% 98% 96% 90% 87% 98% 96%
P&B mills 12 73 196 4,700 77 21 5 464 46 48 499 101 89 129 14 195 30 132 60 395 18 45
Pulp mills 11 11 68 4,500 14 11 6 44 47 45 176 47 35 18 14 22 12 15 7 120 9 5Number of employees in pulp and paper industry (direct) 9,165 8,100 100,000 1,130,000 107,150 4,156 6,180 41,707 34,350 30,000 198,800 66,700 23,785 7,300 45,400 9,459 17,750 4,428 300,000 14,800 14,500
Mean cap - k tonnes 253.91 84.45 142.37 0.50 439.29 115.73 285.67 356.68 304.68 271.58 343.49 588.91 168.57 169.28 172.64 110.68 146.67 139.00 276.86 11.78 208.00 191.60
Employees/ tonne of P&B 9.82 4.68 11.99 31.39 10.82 3.26 6.18 1.22 2.35 2.71 2.14 3.08 - 2.03 2.03 2.24 2.01 3.20 3.08 55.56 5.66 3.94
Companies in the top 150 2 6 3 4 2 1 14 7 10 32 11 3 7 2 5 5 2 1 2 3 2
# employees (*) 11,475 28,649 9,118 - 33,300 10,771 57,149 113,977 67,209 621,372 82,851 65,500 13,328 13,145 8,474 22,273 2,454 2,485 1,685 56,614 4,357
Paper & board 708 3,250 640 4,914 823 950 22,866 28,595 9,444 68,650 16,125 1,883 847 5,261 1,816 3,538 250 842 447 8,157 1,244
Market pulp 859 2,434 15 - - 450 543 645 3,016 9,498 4,490 965 - 616 - 188 829 651 89 1,138 -
Total output vs. total cap (adj) 51% 47% 2% 50% 70% 68%
N/A as data include sales of overseas subsidiaries
80% 84% 60% 37% 7%
N/A as data include sales of overseas subsidiaries
9% 79% 19% 63% 10%
N/A as data include sales of overseas subsidiaries
34%
Number of companies in the top 150 3 6 3 4 2 1 14 7 10 31 11 3 7 2 5 5 2 1 2 3 2
(*) reported employee numbers in some cases exceed national totals. National totals only include direct employees. Companies count all people (including temporary staff) on their payroll. These need not necessarily be directly involved in pulp and paper production, nor be employed within national borders. Source: paperloop, FAO, company annual reports
7

8
Pulp is an intermediate product and for this reason much of the pulp capacity is controlled by companies that are involved in the production of paper and board. Where a mill is integrated, the pulp line is linked directly to the paper/board production lines. When the pulp is produced for sale to external parties, it is dried in sheetform. Pulp produced for external sale is known as marketpulp. Marketpulp is by definition always dry pulp, but not all dry pulp is necessarily market pulp. Whereas paper can be made using longfiber pulp only, the lower cost of shortfiber pulp has made it attractive to use at least a proportion of this fibre in papergrades. Paper cannot be made from shortfiber pulp only, so that integrated shortfiber pulp and paper producers still use a proportion of (imported) longfiber pulp in their manufacturing process.
Of the world’s 150 largest pulp and paper producers, 124 are based in the 20 principal producing countries (Table 2.2), accounting for 69% of total output of these countries. This figure has been on the increase as a result of continued consolidation in the industry. Many industry participants and observers expect this process to continue as compared to other industries the pulp industry is still highly fragmented. For example, jetliner production is concentrated in the hands of only two companies, Boeing and Airbus, and global passenger car production is controlled by some 20 companies. Proponents of consolidation argue that they need to be of a greater scale to be able to compete effectively. There is however no evidence from industries with greater consolidation that this in fact helps corporate profitability in the absence of oligarchic pricing practices. Conversely, quite a number of smaller producers can compete effectively and profitably. In many cases, acquisitions provide the answer to growth that companies feel they have to deliver and that investors often demand of them. Because of their large base, it is difficult for such companies to deliver acceptable rates of growth organically, so that acquisitions become an attractive alternative. Where pulp companies operate in countries where they have to control the forest land that yields the fibre, an additional aspect enters into the discussion of optimal company size. Already the size of the land controlled by some pulp producing companies (including their holding companies) exceeds that of some sovereign nations! Weyerhaeuser owns 2.7 million hectares of forest land outright, which is as much as 68% of the size of the Netherlands, and the land it controls is 3.6x the size of this country. Policymakers in each of the major pulp producing countries deserve to give this issue serious thought.
In 2002, the 100 largest pulp and paper companies had consolidated sales of US$ 311.2 billion and assets of US$ 396.3 billion. This is slightly ahead of the numbers for December 1999 that are shown in Table 2.3 along with key balance sheet data. The sales number is heavily influenced by the price of paper and pulp. As pulp prices have risen over the past three years, the 2004 sales and profit figures would be higher, while one could reasonably expect there to be more equity (as higher earnings are retained) and somewhat less debt. The balance sheets show that pulp and paper is a capital intensive business with the value of one year sales not exceeding the assets needed to generate these sales. The industry typically employs two persons per tonne of pulp/ paper produced while indirect employment levels are up to three times as high.
The focus of the remainder of this chapter is to see how expansions and new capacity have been financed, and equally important, which projects did not secure financing. In order to ensure that a representative set of data was used, an extensive search was done for both (proposed) investments in pulp producing capacity and financing raised by pulp producers.
The data on actual and proposed investments were primarily obtained from the industry website Paperloop. The cut-off date was 1990 but given the paucity of data for these earlier years, the results effectively covered the period 1995 – 2003. A minimum annual production capacity of 50,000 tonnes was taken as the lower threshold for inclusion, and projects that got a single mention without any additional information were removed from the list. It should be stressed that this list is representative, but not exhaustive. Some projects will simply have gone unreported, as would capacity expansions as a result of debottlenecking or mill rebuilds that are actually quite common for larger producers. After obtaining the list, we determined how many of these projects
Pulp production capacity is
concentrated in the hands of
some 150 large producers that
continue to consolidate.
Policymakers in each of the major
pulp producing countries should
give serious thought to desired
levels of concentration.
We compiled a list of 67 projects
that were proposed between 1995
and 2003 as a starting point for
analysing how pulp projects obtain
financing.
Consolidated sales of the 100
largest producers totalled
US$311.2bn in 2002 and boasted
an asset base of US$396.3bn.
Typical employment levels are
2 persons per ton of pulp/paper
produced and indirect employment
levels are up to 3x as high.

9
Tabl
e 2.
3 Su
mm
ary
finan
cial
dat
a fo
r the
100
larg
est l
iste
d pu
lp a
nd p
aper
com
pani
es[d
ata in
US$
m]
Sale
sOp
erat
ing
profi
t/los
sNe
t inc
ome
Asse
tsFi
xed
asse
tsLT
deb
tEq
uity
(com
mon
)DE
RGr
gea
ring
Empl
oym
ent
ROCE
emp/
asse
tsem
p/sa
les
Cana
da
16,9
12
1,70
8 10
.1%
516
23,2
58
16,8
55
7,95
9 10
,712
74
.3%
2.17
92
,100
5.
0%3.
96
5.45
Japa
n 37
,335
45
9 1.
2%(2
85)
52,9
62
26,2
27
13,4
47
13,5
93
98.9
%3.
90
41,0
00
4.0%
0.77
1.
10
USA
144,
035
13,8
86
9.6%
7,10
4 16
1,59
6 93
,941
50
,406
53
,306
94
.6%
3.03
54
6,70
0 6.
8%3.
38
3.80
Euro
pe
Finl
and
32,1
93
3,83
1 11
.9%
2,59
7 37
,426
22
,551
8,
567
14,4
20
59.4
%2.
60
105,
800
8.1%
2.83
3.
29
Swed
en
15,4
22
1,23
1 8.
0%65
4 22
,724
12
,536
4,
175
10,1
55
41.1
%2.
24
77,9
00
4.6%
3.43
5.
05
UK
517
5,93
5 2,
514
742
2,64
0 28
.1%
2.25
29
,500
7.
3%4.
97
Othe
r Eur
25
,491
1,
326
5.2%
1,05
8 19
,186
9,
147
5,37
2 6,
965
77.1
%2.
75
71,5
00
5.0%
3.73
2.
80
Total
73
,106
6,
905
9.4%
4,30
9 85
,271
46
,748
18
,856
34
,180
55
.2%
2.49
28
5,00
0 6.
5%3.
34
3.90
Othe
r
Aus/
NZ
7,52
4 59
5 7.
9%24
8 16
,084
10
,005
4,
491
7,45
8 60
.2%
2.16
46
,000
2.
8%2.
86
6.11
Othe
r Asia
5,
942
1,05
2 17
.7%
43
22,7
40
13,2
65
8,15
0 5,
338
152.
7%4.
26
54,6
00
3.5%
2.40
9.
19
of w
hich
: APP
3,
135
807
25.7
%(2
3)17
,512
11
,113
7,
017
2,87
4 24
4.2%
6.09
45
,500
3.
1%2.
60
14.5
1
and:
APR
IL
414
(26)
Sth
Afric
a 7,
937
536
6.8%
122
6,23
3 4,
365
1,38
5 2,
004
69.1
%3.
11
42,3
00
6.1%
6.79
5.
33
Sth
Amer
ica
4,42
2 1,
318
29.8
%84
6 17
,766
12
,632
4,
451
9,02
2 49
.3%
1.97
35
,500
5.
6%2.
00
8.03
Othe
r tot
25
,825
3,
501
13.6
%1,
259
62,8
23
40,2
67
18,4
77
23,8
22
77.6
%2.
64
178,
400
4.4%
2.84
6.
91
Gran
d to
tal
297,
213
26,4
59
8.9%
12,9
03
385,
910
224,
038
109,
145
135,
613
80.5
%2.
85
1,14
3,20
0 5.
4%2.
96
3.85
Sour
ce: P
riceW
aterh
ouse
Coop
ers G
loba
l For
est &
Pap
er In
dustr
y Sur
vey,
2000

10
were realised, while trying to see what held back those that were not realised. All this is discussed in the section ‘Investments in pulp capacity after 1995’. This section is followed by a section on ‘Financing raised by pulp producers’ that looks at financing raised by pulp and paper producers in the international capital markets, and then relates these numbers to the capacity that has been commissioned, as well as putting them within context of the entire size of the international capital markets.
2.3 Investments in pulp capacity after 1995
The project list comprises of 67 projects accounting for a proposed 25.5 million tonnes of new annual production capacity. Of this capacity 59.2% is accounted for by greenfield plants of new sponsors, 38.3% by expansions and the balance by brownfields. Greenfield plants are projects that are started entirely from scratch. A brownfield refers to a plant constructed on a site where there used to be a plant previously. Under expansions, we count both the increase in capacity at an existing mill-site and capacity expansions by way of greenfield projects at a different site within the same country by an established producer. Thus, Advance Agro’s Khon Kaen mill is counted in with expansions. APP China’s Hainan pulp mill and the Aracruz-Stora Enso Veracel mill are treated as greenfield plants of new sponsors.
Table 2.4 Significant expansions proposed between 1994 and 2002, by region
Number Capacity (k tpa) % of totalEurope 18 5,347 21.0%Asia 30 11,731 46.0%Africa 1 145 0.6%Latin America 16 7,282 28.6%Australia & New Zealand 2 700 2.7%North America 1 300 1.2%
66 25,505 100%
Source: processed raw data compiled from www.paperloop.com
Table 2.5 Significant pulp capacity proposed between 1994 and 2002, by type
Number Capacityk tpa % by type Proceeding
k tpaSuccessrate[% of cap]
Greenfield 36 15,111 59.7% 4,100 27.1%Brownfield 3 632 2.5% - 0.0%Expansion 28 9,562 37.8% 6,314 66.0%
67 25,305 100.0% 10,414 41.2%
Source: processed raw data compiled from www.paperloop.com
The majority of the proposed projects were in new producer centers with Asia accounting for 46.0%, Latin America for 28.6%, and Europe for 21%. The projects in Europe are predominantly in former Soviet block countries. Of the proposed projects 41.2% now look to be going ahead, led by expansions (66% success rate in terms of capacity) and greenfields (27% success rate in terms of capacity). Since these data were compiled, perceived economic prospects brightened considerably, and with it, the pulp price. This led to an increase or accelleration of projects, as well as the emergence of new proposals. Table 2.6 details the successful expansions, and Table 2.7 lists the successful greenfield projects of new sponsors that we identified. As compared to greenfield projects by new sponsors, expansions have the highest chance of succeeding when proposed, although the actual timing of the expansion will still have been influenced by the ability to secure financing and the cycle of the pulp market. In Asia, many projects were put on hold after the Asian Crisis (1997) and
The 67 proposed projects involved
25.5m tpa of new capacity. 59.2%
were greenfield plants proposed
by new sponsors, and 38.3%
were projects and expansions by
existing producers.
Of the total 41% of proposed
volume is presently going
ahead, with a higher proportion
of proposed expansions being
realised as compared to
greenfields.

11
Latin America saw a slowdown after 2001. Various reasons contributed to announced projects not getting realised. In some cases, companies decided to retreat from what was for them a non-core activity. Thus the proposed 600,000 tonnes per annum expansion at Celulose do Maranhao (CelMar) was cancelled because major shareholder Companhia Vale do Rio Doce retreated from pulp production in 2001 and sold its stake in CelMar to Cenibra. The other shareholder in CelMar, Votorantim, decided on an expansion at one of its own sites instead. In other cases, companies realised capacity expansions by buying capacity in the market. In 2003, Aracruz bought Klabin’s Riocell unit and Indonesia’s Raja Garuda Mas Group bought Bacell. In other cases, lack of certainty over required operating standards and/or the availability of furnish put projects on hold. Finally there are also financial constraints, seen if a new sponsor cannot gather sufficient equity.
Table 2.6 Successful expansions proposed between 1994-2002
Company name Location StartedCapacity(k tpa) Comments
Advance Agro Thailand 1997 252 85% financed with supplier creditAlto Parana SA Argentina 1996 40 later expanded by a further 50k tpaAPRIL Indonesia 1997 400 = Fiberline 2A first announced as 600k tpa APRIL Indonesia 2001 700 = Fiberline 2BAsia Pulp & Paper Indonesia 1995 250 one of many expansionsAracruz Brazil 2003 700 Fiberline-CArauco Chile 2004 700 ValdiviaBahia Sul (Suzano) Brazil 2007 1,000 Go-ahead in 2004CMPC Chile 2006 750 Go-ahead in 2004Ence Spain 80 Ilim Pulp Enterprise Russia in progress 400 Mondi Sth Africa 2004 145 Richards Bay facilitiesPhoenix Pulp & Paper Thailand 2003 270 Line 3 at Khon KaenRipasa Brazil 167 at LimeiraNeusiedler Poland 130 pulp line upgrade at Frantschach SwiecieVinapimex Vietnam 130 Votorantim Brazil 200 rebuild at Jacarei, utimately 620k tpa addedTotal 6,314Total proposed 9,562Success rate 66.0%
Source: processed raw data from www.paperloop.com (1Q03)
Table 2.7 Successful new projects proposed between 1994-2002
Company name Location StartedCapacity(k tpa) Financing
Guangxi Jindaxing Paper China 2003 120 Not known
Kiani Kertas Indonesia 1997 450 Project finance, government assistance (DR)
Estonia Cell (Larvik Group) Estonia 2004 120 EBRD
Tanjung Enim Lestari Indonesia 450 Project finance, Barito Pacific IPO proceeds
Shandong Rizhao Wood Pulp China 170 Not knownHainan Gold Hai Pulp & Paper (Jiang Lin) China Hainan 1,095 Chinese banks, export credit
Veracel (JV of Aracruz and Stora Enso) Brazil 2005 900 Corporate investors, EIB
Visi Industries Australia 2004 175Uzbek Government Uzbekistan 2002 70 Not knownZellstoff Stendhal GmBH Germany 2004 550 Project financeTotal 4,100Total proposed 15,111Success rate 27.1%
Source: processed raw data from www.paperloop.com (1Q03)
Temporary unavailability of
financing will have affected the
timing of expansions, but the
inability to secure financing was
never the reason to defer a
proposed expansion alltogether.

12
The success rate for greenfield projects by new sponsors is considerably lower than that for expansions. Looking at the projects in this category that were successful, we note that they were without exception sponsored by governments or existing companies with interests in the forestry sector. This indicates that the field of pulp production is effectively closed to complete newcomers to the forest sector. Two recent exceptions to this have been Tanjong Enim Lestari and Kiani Kertas in Indonesia. The companies had sponsors with existing businesses in forestry, and the ability to secure equity for the new venture. Both these companies enjoyed the support of the contemporary ruling elite. Even in cases where governments support a new mill by granting access to forest resources, the absence of an operating partner with relevant experience can still be a major stumbling block in obtaining financing. Metsalito deferred its project in Latvia over uncertainty concerning fibre supply and government insistence on what the company felt were inappropriate environmental standards.
The sources of financing for the greenfield mills by new sponsors are distinct from those of expansions. Project finance, domestic bank credit and multilateral finance combined with export credit are the key sources of external financing for these projects. Note here that we use the term project finance only to relate to project financing given by commercial financial institutions, as distinct from financing from multilateral development banks. In terms of absolute amounts, the financing raised from these sources (project finance, domestic bank credit, multilateral financing and export credit) is significantly smaller as compared to that raised in the international capital markets – even when financing drawn by non-traditional producers is considered. However, as a source of funding these sources are as, if not more, important than the international capital markets. At the initial stage, financing is a key determinant as to whether a project makes it and a new pulp producing entity is born, and consistent application of minimum standards should have a beneficial impact on deciding which projects will be realised. If finance is to play a role in shaping the future pulp industry, it is at this stage that meaningful impact can be made.
At the expansion stage, lenders are dealing with a going concern that already generates cash flow. At current levels of disclosure, quality is harder to discern, but only in exceptional cases would it meet current standards set for new mills given that these have increased over time.
2.4 Financing raised by pulp producers
Having reviewed capacity expansions, financing raised by pulp producers is considered next. This review is based on data obtained from Dealogic and Thomson Financial to which manual adjustments were made in case of omissions that could be confirmed based on a company’s
Table 2.8 Funding raised by pulp producers, global 2000 - Jan 2005[data in US$ m]
Loans Bonds Equity Project fin.
North America 151,908.0 17,587.1 1,874.3 171,369.4
Japan 1,206.7 2,121.1 145.4 3,473.2
W-Europe 17,771.0 6,359.2 2,886.0 10.0 27,026.1
E-Europe 80.0 - - 80.0
Latin America 4,579.5 2,960.9 709.3 8,249.7
Asia 960.1 1,471.4 30.3 2,461.8
Australia & New Zealand 765.0 - - 765.0
Africa 903.3 857.0 99.3 1,859.6
Other 65.8 147.7 - 213.5
Grand total 178,239.6 31,504.3 5,744.6 10.0 215,498.5
Share of total 82.7% 14.6% 2.7% 0.0%
Source: Transactions as reported by Dealogic, Thomson Financial and company annual reports
Conversely, for proposed greenfield
mills, inability to secure financing
was a critical barrier particularly
where the proposed sponsor
does not have a strong financial
standing.
Expansion projects that are
being proposed by existing pulp
producers address different
markets for funding that are not
open to greenfield projects. If the
latter wish to raise commercial
international financing they need to
secure project financing.
When existing companies raise
additional financing, disclosure
levels are lower than what would
be required if an entirely new
project was being proposed.

13
annual report. These data should still be treated with caution. Neither dataset included data on transactions arranged and/or funded by multilateral agencies, export credit agencies and smaller bi-lateral loans. Where a group with pulp interests raised financing and was captured by either one of the providers, it was included, even though the financing need not all have benefited the pulp producing subsidiary. The tally excludes paper makers with no captive pulp capacity, but includes integrated companies.
Pulp producers raised a total of US$215.5 billion between January 2000 and January 2005. The composition of this funding is shown in Table 2.8. The amount is large when viewed in relation to the total asset base of the industry of around US$ 300 billion. In fact many of the financings will have been of a short-term nature, so that there is a considerable amount of double counting. The majority of the financing was also raised by companies in countries where no expansions took place. Thus this financing reflected refinancing or acquisition financing. To determine the financing raised for expansions, it is more accurate to look only at the financing activity of companies in those developing countries and countries with transitioning economies that are at the forefront of capacity expansion. This group accounted for US$ 12.7 billion or 6% of financing raised since 2000. Since 1990, they raised US$ 37.8 billion in financing, as detailed in Table 2.9.
Table 2.9 Funding raised by pulp producers in emerging production centres, 1990 - Jan 2005
[data in US$ m]
Loans Bonds Equity Proj. Fin Total
Brazil 4,505.8 2,175.8 1,075.8 7,757.4
Chile 2,696.0 3,209.0 - 5,905.0
South Africa 2,088.8 1,220.5 617.9 3,927.2
China 339.2 - 49.5 388.7
India 78.0 28.6 - 106.6
Indonesia 5,708.5 6,393.9 5,713.2 1,060.0 18,875.7
Philippines - - 135.0 135.0
Thailand 235.3 339.0 85.2 659.5
E-Europe 80.0 11.6 - 91.6
Total 15,731.7 13,378.4 7,676.8 1,060.0 37,846.8
Source: Transactions as reported by Dealogic, Thomson Financial and company annual reports
Again this US$ 37.8 billion figure is large relative to the actual capacity increases being financed. At an expansion cost of roughly US$ 1,000 per tonne of annual production capacity, one would expect a figure of at most slightly over US$ 10 billion, before counting the funds used in downstream investments such as paper making and specialised coating machinery. The distortion in these figures is largely due to the funding activity of Asia Pulp and Paper (APP) and Asia Pacific Resources International Limited (APRIL) that raised far more financing than strictly needed for the capacity they put on stream. In Brazil, some distortion can be explained by the fact that all debt raised by the Voto-Votorantim Group was included although only a portion would have benefited the pulp offshoot. The Voto-Votorantim Group is also engaged in cement production and banking.
The majority of the US$ 37.8 billion that the producers in newly emerging centres raised was achieved in the international capital markets. While the amount is large in absolute terms, it is small relative to the total amount of debt outstanding in the international capital markets (only cross border financing). US$ 14 billion in bonds raised compares to US$ 11.7 trillion of bonds oustanding in the international capital markets (as at December 2003, source International Primary Markets Association), and US$ 15.7 billion in loans is again small when compared to the total of US$ 14.9 trillion in cross border bank claims outstanding between all banks that report to the Bank for International Settlements (BIS). These figures are quoted to put the financing activity of pulp companies into some form of perspective. It should be noted that we are not comparing
Between 2000 and Jan-05 pulp
producers raised US$215.5bn in
debt and equity financing.
Producers in newly emerging
production centres raised
US$37.8bn since 1990, and
accounted for 6% of financing
raised since 2000.
US$37.8bn is a large amount
relative to the capacity expansions
financed.
The majority of the US$37.8bn was
raised in the international capital
markets. The amount is small
compared to total amounts of debt
outstanding internationally.

14
12 borrowers accounted for 70%
of the US$37.8bn raised.
Quoted figures exclude financings
by ECAs and multilaterals. These
have made US$1.9bn in pulp
related investments that formed
part of projects with a total value
of US$7.34bn.
like for like because the bond and loan figures reflect funding activity over a 15-year period as opposed to actual amounts outstanding at a given date. The relative insignificance of pulp mill financing within the entire capital markets is important to note and relevant to bear in mind when reading the chapter on financing. For investors it offers welcome sectoral diversification in their portfolios.
The financings included in the tally above were extended almost exclusively to corporate entities with existing operations in the pulp and paper sector, as opposed to financing entirely new projects. The number of recipients was also extremely concentrated, with 12 borrowers accounting for 70% of total financings identified.
The US$ 37.8 billion excludes financing provided by export credit agencies (ECA) and multilateral development banks (MDB). We identified US$ 1.9 billion in direct financings of
Table 2.10 Major projects in Latin America, China and the Baltic States[figures reflect capacity added in k tonnes]
Base 2003 2004 2005 Beyond CommentsBrazil
Veracel nil 900 900 potentially two more 900 k tpa per annum lines post 2010, infrastructure largely in place.
Suzano Bahia Sul 588 60 750 decided to add 750 k tpa in 2004, projected start-up 2007
Suzano 420 109 Cenibra 830 110 860 announced Jan-05Aracruz 1,240 700 VCP 850 400 370 Ripasa 428 229 Bacell (RGM)
ChileArauco 1,500 700 800 additional line at ItataCMPC 1,100 750 additional line at Santa Fe
Uruguay 800 Weyerhaeuser These are just a few of the
companies that have plans to start a 800 k tpa pulp mill in Uruguay.
BotniaEnce
ChinaJiang Lin - 1,095 Shandong Bohui Paper - 219 Shandong Chenming 200.75
Shandong Rizhao 220 1,500 being considered by new owner APRIL
UPM Kymmene* 1,000 May-03 as big as possible, would import chips
Stora Enso 1,000
Baltic StatesLatvian Government/ Metsalitto 600 proposed mill of 600 k tpa.
Baltic Pulp 600
Total 1,160 2,434 2,099 8,960 7,960
Source: Pulp & Paper International, various issues*project withdrawn in 2005

15
the International Finance Corporation (IFC), European Investment Bank (EIB) and the European Bank for Reconstruction and Development (EBRD) for market pulp and integrated pulp and paper facilities. This US$ 1.9 billion was part of investment programmes that totalled an estimated US$ 7.34 billion. In quite a number of these cases, the multilateral participation acted as a catalyst for the entry of other financiers.
Going forward, more new capacity will be built in the new production centres of the late 20th century, while we will also see significant activity in the Baltic States and China that are new to large scale pulp manufacturing. It is important to realise that despite the lessons learned in the past, today’s financing mechanisms are still not designed to favour the higher quality players. Instead, the lack of minimum standards effectively discriminates against those players that impose high standards on their operations, with everybody being the poorer for it. The following chapters take a closer look at pulp capacity financiers and markets, and the risk assessment and safeguard mechanisms that they employ.
2.5 Conclusion
This chapter analysed how proposed new pulp capacity obtained its financing and looked at financing available to pulp producers. Capacity additions proposed by existing players in the pulp field have the highest chance of going ahead with a 66% success rate. Where projects did not go through, this tended to be the result of changed corporate strategies as opposed to an inability to obtain funding. 27% of greenfield mills went on to being realised. Funding forms a bigger barrier here in the absence of an existing business that provides the cash flows. Raising comfort levels is critical to obtaining financing: the level of sponsor-provided capital plays an important role.
Since 2000, pulp producers raised US$ 215.5 billion in funding from commercial sources. The majority (82.7%) of this took the form of loans typically extended to existing producers in traditional producing centres. To obtain a figure for expansion financing, we narrowed the focus to producers in developing countries, and transitioning economies. Since 1990, these raised US$ 37.8 billion in debt and equity.
Funding from multilateral development banks and export credit agencies is not included in the above tally. We identified US$ 1.9 billion in direct financings since the late 1980s that would have enabled projects with a total value of US$ 7.34 billion. This low level of funding reflects the impact of an abstemious World Bank forest policy, as will be discussed in the next chapter. The 1990s also did not see many significant new entrants into the pulp industry.
Looking out, there are changes on the horizon. New producers are looking to enter the field of pulp production, with China at the head of the queue. With limited woodfiber, water and arable land, properly implementing these projects will present challenges of their own. Changed multilateral forest sector lending strategies are resulting in a significant increase in their presence in financing projects in this sector, and export credit agencies remain keen financiers of the sector. We are thus entering a period of ample new capacity and funding. The challenge is to ensure that this crop of new capacity yields projects of a high quality.
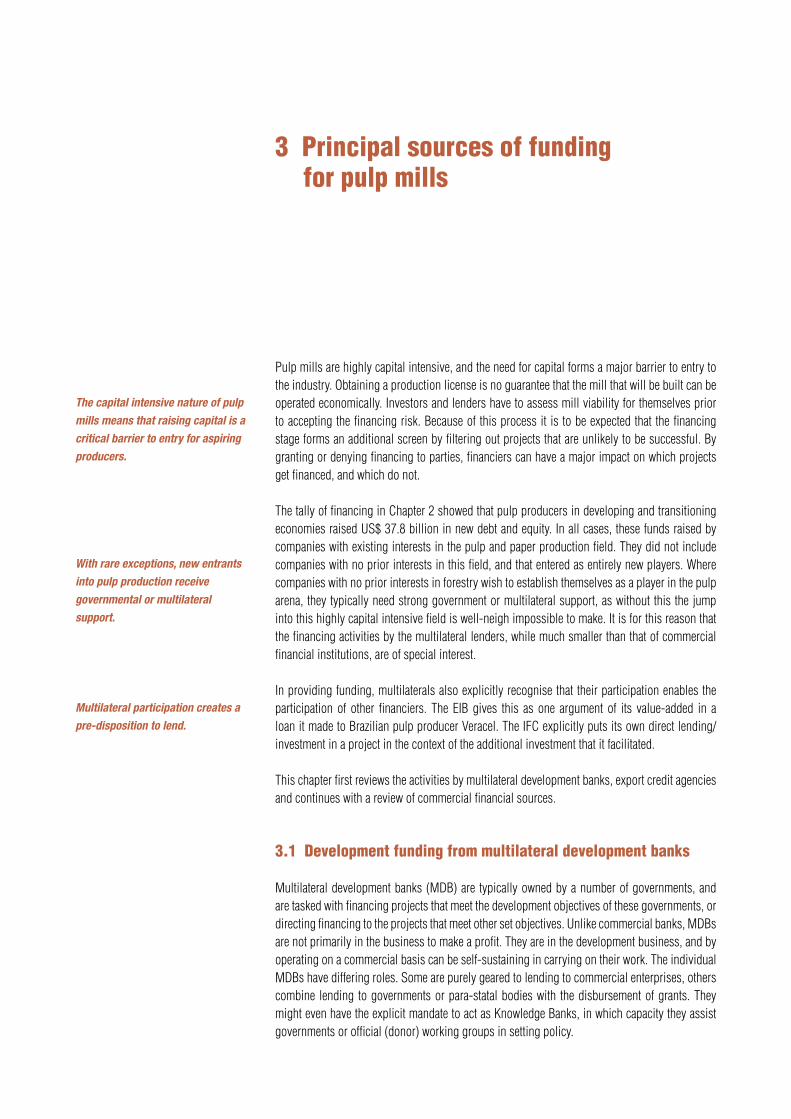
The capital intensive nature of pulp
mills means that raising capital is a
critical barrier to entry for aspiring
producers.
With rare exceptions, new entrants
into pulp production receive
governmental or multilateral
support.
Multilateral participation creates a
pre-disposition to lend.
Pulp mills are highly capital intensive, and the need for capital forms a major barrier to entry to the industry. Obtaining a production license is no guarantee that the mill that will be built can be operated economically. Investors and lenders have to assess mill viability for themselves prior to accepting the financing risk. Because of this process it is to be expected that the financing stage forms an additional screen by filtering out projects that are unlikely to be successful. By granting or denying financing to parties, financiers can have a major impact on which projects get financed, and which do not.
The tally of financing in Chapter 2 showed that pulp producers in developing and transitioning economies raised US$ 37.8 billion in new debt and equity. In all cases, these funds raised by companies with existing interests in the pulp and paper production field. They did not include companies with no prior interests in this field, and that entered as entirely new players. Where companies with no prior interests in forestry wish to establish themselves as a player in the pulp arena, they typically need strong government or multilateral support, as without this the jump into this highly capital intensive field is well-neigh impossible to make. It is for this reason that the financing activities by the multilateral lenders, while much smaller than that of commercial financial institutions, are of special interest.
In providing funding, multilaterals also explicitly recognise that their participation enables the participation of other financiers. The EIB gives this as one argument of its value-added in a loan it made to Brazilian pulp producer Veracel. The IFC explicitly puts its own direct lending/investment in a project in the context of the additional investment that it facilitated.
This chapter first reviews the activities by multilateral development banks, export credit agencies and continues with a review of commercial financial sources.
3.1 Development funding from multilateral development banks
Multilateral development banks (MDB) are typically owned by a number of governments, and are tasked with financing projects that meet the development objectives of these governments, or directing financing to the projects that meet other set objectives. Unlike commercial banks, MDBs are not primarily in the business to make a profit. They are in the development business, and by operating on a commercial basis can be self-sustaining in carrying on their work. The individual MDBs have differing roles. Some are purely geared to lending to commercial enterprises, others combine lending to governments or para-statal bodies with the disbursement of grants. They might even have the explicit mandate to act as Knowledge Banks, in which capacity they assist governments or official (donor) working groups in setting policy.
3 Principal sources of funding for pulp mills

17
The International Finance Corporation (IFC), European Investment Bank (EIB) and the European Bank for Reconstruction and Development (EBRD) are the multilateral development banks that have been the most active participants in pulp mill investments over the past two decades. This reflects the fact that, unlike the other multilateral lenders, they have a mandate to lend directly to the private sector. We expect them to remain active, and going forward also anticipate significant pulp mill financing activity by the Inter-American Development Bank (IADB) and the Multilateral Investment Guarantee Agency (MIGA). The World Bank does not itself make loans to the private sector, and therefore does not appear as a direct financier of pulp mills. The Bank nevertheless is a highly influential actor, as its investment policies also guide the IFC and MIGA, and as it has a significant impact on shaping forest policy in a number of its client countries. The ADB has provided technical assistance grants to various pulp mills and plantation pulp projects in the Asian region, and also provides policy input to governments.
3.1.1 World BankThe World Bank (hereafter: the Bank) provides development loans to its client countries. As at 30 June 2003, it had a balance sheet size of US$ 230.3 billion with US$ 108.5 billion in loans outstanding. These amounts were roughly stable for the past five years. The current loan book is dominated by projects in healthcare, education, agriculture, infrastructure, electricity generation, urban poverty alleviation. The Bank, through these loans, gets significant input in the policies of its clients, and this is part of the intention of the Bank, as it aims to steer these policies to reflect what it judges to be most desirable for the development of its client. The Bank also chairs or provides input to country consultative groups dealing with joint-aid provision or budget support. The Bank further administers aid provided by third parties by way of Trust Funds. The combination of these roles gives the bank a global leadership role on social and environmental matters as well as development issues.
After having actively encouraged forest based investment through the 1970s and the 1980s, the Bank virtually retreated from this field in the 1990s following the adoption of the 1991 Forest Strategy. (See the summary in Box 3.1)
The IFC, EIB and EBRD ahave been
the most active participants in pulp
mill investments over the past two
decades. The WB influences client
country forest policies, and its own
policies influence those of the IFC
and other multilateral lenders.
The WB’s forestry policy has
evolved over the past 25 years.
Through the late 1980s, it actively
encouraged the development of
export oriented pulp industries in
developing countries.
Box 3.1 The 1991 Forest Strategy of the World Bank
The 1991 Forest Strategy of the World Bank
Recognises five key challenges:• externalities that prevented market forces from achieving
socially desired outcomes• strong incentives, particularly for the poor, to cut trees• weak property rights in many forests and wooded areas• high private discount rates among those encroaching on the
forests• inappropriate government policies, particularly concession
arrangements.
Introduced five principles:• multisectoral approach• international cooperation• policy reform and institutional strengthening• resource expansion• land use controls including zoning, demarcation and tenure
issues to preserve intact forests.
Imposed seven conditions on bank-financed activities:• no Bank Group financing for commercial logging in primary
tropical moist forests• adoption of policies and an institutional framework consistent
with sustainability• a participatory approach to the management of natural
forests• adoption of comprehensive and environmentally sound
conservation and development plans with clear definitions of the roles and the rights of key stakeholders, including local people
• basing commercial use of forests on adequate social, environmental, and economic assessments
• making adequate provisions to maintain biodiversity and safeguard the interests of local people, including forest dwellers and indigenous peoples
• establishing adequate enforcement mechanismsSource: World Bank
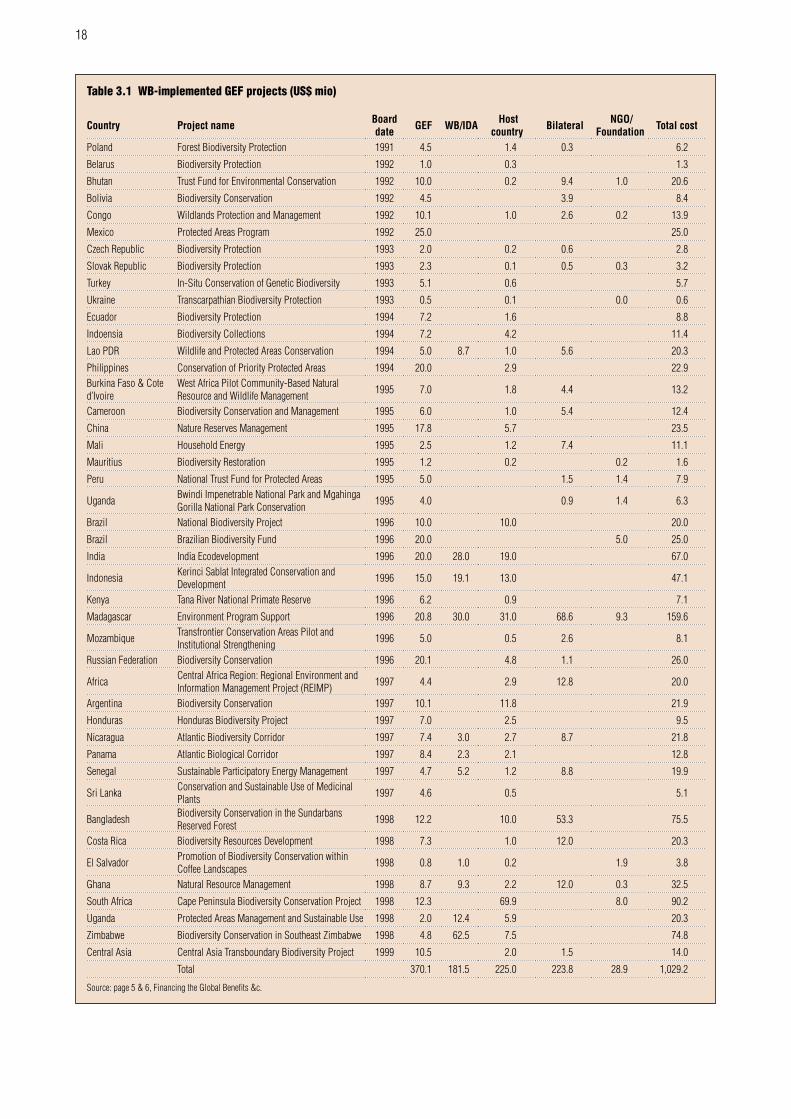
18
Table 3.1 WB-implemented GEF projects (US$ mio)
Country Project name Board date GEF WB/IDA Host
country Bilateral NGO/ Foundation Total cost
Poland Forest Biodiversity Protection 1991 4.5 1.4 0.3 6.2
Belarus Biodiversity Protection 1992 1.0 0.3 1.3
Bhutan Trust Fund for Environmental Conservation 1992 10.0 0.2 9.4 1.0 20.6
Bolivia Biodiversity Conservation 1992 4.5 3.9 8.4
Congo Wildlands Protection and Management 1992 10.1 1.0 2.6 0.2 13.9
Mexico Protected Areas Program 1992 25.0 25.0
Czech Republic Biodiversity Protection 1993 2.0 0.2 0.6 2.8
Slovak Republic Biodiversity Protection 1993 2.3 0.1 0.5 0.3 3.2
Turkey In-Situ Conservation of Genetic Biodiversity 1993 5.1 0.6 5.7
Ukraine Transcarpathian Biodiversity Protection 1993 0.5 0.1 0.0 0.6
Ecuador Biodiversity Protection 1994 7.2 1.6 8.8
Indoensia Biodiversity Collections 1994 7.2 4.2 11.4
Lao PDR Wildlife and Protected Areas Conservation 1994 5.0 8.7 1.0 5.6 20.3
Philippines Conservation of Priority Protected Areas 1994 20.0 2.9 22.9 Burkina Faso & Cote d’Ivoire
West Africa Pilot Community-Based Natural Resource and Wildlife Management 1995 7.0 1.8 4.4 13.2
Cameroon Biodiversity Conservation and Management 1995 6.0 1.0 5.4 12.4
China Nature Reserves Management 1995 17.8 5.7 23.5
Mali Household Energy 1995 2.5 1.2 7.4 11.1
Mauritius Biodiversity Restoration 1995 1.2 0.2 0.2 1.6
Peru National Trust Fund for Protected Areas 1995 5.0 1.5 1.4 7.9
Uganda Bwindi Impenetrable National Park and Mgahinga Gorilla National Park Conservation 1995 4.0 0.9 1.4 6.3
Brazil National Biodiversity Project 1996 10.0 10.0 20.0
Brazil Brazilian Biodiversity Fund 1996 20.0 5.0 25.0
India India Ecodevelopment 1996 20.0 28.0 19.0 67.0
Indonesia Kerinci Sablat Integrated Conservation and Development 1996 15.0 19.1 13.0 47.1
Kenya Tana River National Primate Reserve 1996 6.2 0.9 7.1
Madagascar Environment Program Support 1996 20.8 30.0 31.0 68.6 9.3 159.6
Mozambique Transfrontier Conservation Areas Pilot and Institutional Strengthening 1996 5.0 0.5 2.6 8.1
Russian Federation Biodiversity Conservation 1996 20.1 4.8 1.1 26.0
Africa Central Africa Region: Regional Environment and Information Management Project (REIMP) 1997 4.4 2.9 12.8 20.0
Argentina Biodiversity Conservation 1997 10.1 11.8 21.9
Honduras Honduras Biodiversity Project 1997 7.0 2.5 9.5
Nicaragua Atlantic Biodiversity Corridor 1997 7.4 3.0 2.7 8.7 21.8
Panama Atlantic Biological Corridor 1997 8.4 2.3 2.1 12.8
Senegal Sustainable Participatory Energy Management 1997 4.7 5.2 1.2 8.8 19.9
Sri Lanka Conservation and Sustainable Use of Medicinal Plants 1997 4.6 0.5 5.1
Bangladesh Biodiversity Conservation in the Sundarbans Reserved Forest 1998 12.2 10.0 53.3 75.5
Costa Rica Biodiversity Resources Development 1998 7.3 1.0 12.0 20.3
El Salvador Promotion of Biodiversity Conservation within Coffee Landscapes 1998 0.8 1.0 0.2 1.9 3.8
Ghana Natural Resource Management 1998 8.7 9.3 2.2 12.0 0.3 32.5
South Africa Cape Peninsula Biodiversity Conservation Project 1998 12.3 69.9 8.0 90.2
Uganda Protected Areas Management and Sustainable Use 1998 2.0 12.4 5.9 20.3
Zimbabwe Biodiversity Conservation in Southeast Zimbabwe 1998 4.8 62.5 7.5 74.8
Central Asia Central Asia Transboundary Biodiversity Project 1999 10.5 2.0 1.5 14.0
Total 370.1 181.5 225.0 223.8 28.9 1,029.2
Source: page 5 & 6, Financing the Global Benefits &c.

19
This 1991 policy resulted in reduced Bank involvement in commercial forestry. The new policy focus of bank lending was less attractive to many of its clients, and resulted in a reduced demand for forestry loans. What forest loans the Bank made through the 1990s were typically tied to grants from the Global Environmental Facility (GEF) The GEF was launched in October 1991 as a new financial mechanism to protect the global environment. GEF funds are disbursed as grants to recipient countries as payment for the provision of environmental benefits. The GEF is administered by the Bank, and all its clients are eligible for GEF grants.
The GEF was a major instrument in maintaining World Bank involvement in forestry after it adopted its 1991 Forest Strategy. In the words of the Operations Evaluation Department assessment of the World Bank’s GEF portfolio ‘without the GEF’s ability to provide grant funding […] it is unlikely that the Bank could have persuaded as many client countries to borrow funds – even on a concessional basis – for [forest biodiversity conservation]’ ‘GEF funding allowed the Bank to remain active in forest sector policy making’. [source: Campbell G.J. and Martin, A. 2000]
GEF funds could be used as a sweetener to get client countries to accept Bank funding but the mere fact that this is necessary reflects the fact that ‘many countries are reluctant to borrow for environmental projects and to implement Bank environmental policies’ [Liebental A., 2002] Seeing its role in forestry decline in this way was deemed undesirable, and the Bank revisited its Forest Strategy. The Bank found that it had been ‘irrelevant’ in slowing down deforestation, and that its strict policies acted as a severe barrier to forest investment by Bank staff. [World Bank, Sustaining Forests, undated] The Bank’s lower involvement meanwhile translated into less engagement, declining knowledge of the sector and reduced contact with stakeholders. These considerations motivated the World Bank to reformulate its Forest Strategy.
The focus of the new Forest Strategy was no longer on what the Bank was not allowed to do, but what its financings should achieve. The new Forest Strategy builds on the recognition that private capital flows into developing countries and transitioning economies are more significant than official development assistance. The Bank sets itself the target of playing a role in creating enabling environments for foreign direct investment in the forestry sector, seeing it as a key stimulant for poverty alleviation that is a key Bank development objective: ‘relative to the potential of well-managed forest resources to contribute to poverty alleviation, to sustainable economic growth and to protection of vital environmental services, current levels of investment, both domestic and foreign, fall far short of developing and transition country investment requirements.’ [Source: proceedings from the Forest Investment Forum July 2004] Stimulating pulp mill investments
It reversed this policy in 1990,
resulting in a significant decline
in importance in forest finance. In
the decade that followed, the WB
maintained some influence in the
field by giving GEF grants.
The 2002 forest sector strategy
looks to reposition the WB as
an important actor in forest
finance. The strategy hopes to
achieve poverty alleviation of
forest dwellers by encouraging
investment into this sector. The
previous ban WB involvement on all
forms of logging in tropical moist
forest was also removed.
Box 3.2 The 2002 Forest Strategy of the World Bank
The 2002 Forest Strategy of the World Bank has three main pillars1. Harness the potential of forests to reduce poverty
a. Support the scaling up of collaborative and community forest management so that local people can manage their own resources, freely market forest products, and benefit from security of tenure.
2. Integrate forests into sustainable economic developmenta. Address finance, fiscal and trade issues related to the forest sector and forest products to enable governments to capture a
higher portion of forest revenues for sustainable social and economic developmentb. Promote catalytic investments in the full range of goods and environmental serices available from well-managed forests –
including sustainable timber harvesting and management… in situations that can be independently monitored through a system of verification or certification that meets nationally agreed and internationally acceptable standards.
3. Protect vital local and global environmental services and valuesa. Help governments to strengthen forest investments, policies and institution…[to minimize adverse impacts]b. Ensure that Bank investments and programs in both the forest sector and in other sectors that could potentially harm protected
forests and antural habitats are implanted accorfding to the Bank’s operational policies and safeguards. Source: World Bank: Sustaining Forests 2002.

20
Table 3.2. World Bank Projects in the pulp and paper industry
Project Name ID Commitment Amount Product Line Country/Area Status Approval Date
Loan to the Russian pulp and paper industry 55.00 IBRD Russia 2003
Pulp & Paper Rehabilitation Project P008959 55.10 IBRD/IDA Turkey Closed 16-May-85
Viphya Wood Industries Project P001624 6.40 IBRD/IDA Malawi Closed 15-Jan-85
Wood Industries Project (02) P003361 25.00 IBRD/IDA Myanmar Closed 6-Mar-84
Ouesso Wood Processing Project P000550 12.00 IBRD/IDA Congo, Republic of Closed 31-May-83
Mufindi Pulp and Paper Technical Assistance Project P002741 18.00 IBRD/IDA Tanzania Closed 19-May-83
Pulp and Paper Engineering Project P003823 5.50 IBRD/IDA Indonesia Closed 21-Sep-82
Sao Hill Forestry Project (02) P002735 12.00 IBRD/IDA Tanzania Closed 13-Apr-82
Forestry Project P000354 17.00 IBRD/IDA Cameroon Closed 16-Feb-82
Tamil Nadu Newsprint Project P009791 100.00 IBRD/IDA India Closed 15-Sep-81
Wood Industries Project (0l) P003354 32.00 IBRD/IDA Myanmar Closed 17-Mar-81
Pulp and Paper Project P005024 50.00 IBRD/IDA Egypt, Arab Republic of Closed 20-May-80
Forestry Plantation Project P002039 31.00 IBRD/IDA Nigeria Closed 27-Mar-79
Mufindi Pulp and Paper Project P002721 60.00 IBRD/IDA Tanzania Closed 4-Jan-79
Forestry Project (01) P001431 6.00 IBRD/IDA Liberia Closed 11-Jul-78
Sao Hill Forestry Project (01) P002707 7.00 IBRD/IDA Tanzania Closed 1-Jul-76
Balikesir Newsprint Project P008913 70.00 IBRD/IDA Turkey Closed 18-May-76
Forestry Project (02) P001244 20.00 IBRD/IDA Kenya Closed 19-Jun-75
Water Pollution Control Project P037382 20.00 IBRD/IDA Finland Closed 6-May-75
Industrial Investment and Smallholder Treefarming Project P004428 50.00 IBRD/IDA Philippines Closed 11-Jun-74
Antalya Forestry Project P008906 40.00 IBRD/IDA Turkey Closed 15-Jan-74
Forestry Project (01) P001229 2.60 IBRD/IDA Kenya Closed 28-Oct-69
Industrial Modernization Project (01) P009142 10.50 IBRD/IDA Yugoslavia, former Closed 18-Jul-67
Wood Processing Project P037372 25.00 IBRD/IDA Finland Closed 8-Aug-61
Pulp and Paper Project P037371 37.00 IBRD/IDA Finland Closed 13-Mar-59
Paper Mill Project P010007 4.20 IBRD/IDA Pakistan Closed 4-Aug-55
Pulp and Paper Project P006580 20.00 IBRD/IDA Chile Closed 10-Sep-53
Total 791.30
Source: www.worldbank.org project database
is integral to this approach, and this became evident during the Bank’s October 2003 Forest Investment Forum where proposed pulp mill investments dominated much of the discussions.
The Bank’s role in stimulating forest-based investments will only be indirect by way of creating a favourable policy environment. There has been no explicit World Bank involvement in pulp mills after 1983 (see Table 3.2), although the bank remained active by giving Forest Conservation and Management Project Loans that helped countries in encouraging forest-based investments2. Direct investment action would be taken by its sister, the International Finance Corporation (IFC).
3.1.2 IFCThe International Finance Corporation (IFC) was founded in 1956 as part of the World Bank Group, but it is legally and financially independent of the Bank itself. The IFC provides financing to private sector companies operating in developing countries ‘where sufficient capital is not available on reasonable terms’, and often aims to act as a catalyst for other sources of financing for developing countries. IFC loans are granted on commercial terms but with the explicit condition that they contribute to sustainable development.
2. Eg. IDA project No. 4 LAOPAO20 ‘Laos Forest Conservation and Management Project’.
The IFC is a World Bank affiliate
geared to financing commercial
enterprises in developing countries.

21
As at June 2003, the IFC’s balance sheet totaled US$ 31.5 billion, and its investments (disbursed loans and equity) totaled US$ 12 billion. The bank maintains a 49% capital adequacy ratio, that compares to a 12% minimum level set for banks by the Bank for International Settlements. The high capitalisation, and the bank’s unparalleled access to additional capital by calling on further subscriptions from its 175 members, give the IFC a triple-A credit rating. This rating gives the IFC easy access to capital markets which is where, just like the World Bank itself, the IFC derives the majority of its funding.
In its operations, the IFC holds the middle between a development organisation and a commercial bank. The IFC competes with banks and sometimes direct investors in providing funding to commercial organisations. Unlike a commercial bank, and as seen above, the IFC has a strict set of additional funding criteria to meet. Yet because its loans are made at commercial terms, lenders get no additional benefit from dealing with the IFC. Furthermore, the IFC often requires that it is engaged as a paid adviser to advise on the structure of the project and its funding prior to actually making an investment. In this capacity the IFC is part merchant bank, and part industrial expert. Despite these additional barriers to obtaining IFC funding, its long client list shows that companies see the value of the IFCs services. IFC involvement signals that certain quality standards have been met, thus facilitating obtaining future funding independent of the IFC. The IFC itself often brings in a syndicate, thus also contributing directly to securing additional funding sources that might not be available otherwise (see Table 3.3). Because reserve requirements for IFC-led loans are well below the reserve requirements for ordinary developing country loans, banks are keen participants in IFC syndicates. Banks are also attracted by the comfort of being part of an IFC syndicate. This highlights another difference between the IFC and commercial banks3.
A commercial bank will make a loan (or a merchant bank will originate a loan) based on the economic merit of the proposed transaction alone. If the risk/return ratio of the credit is acceptable, and if the loan fits within the overall portfolio, it will be granted. The IFC, in giving loans, pursues both a commercial and a development objective. This objective is achieved either directly through the project it finances, or indirectly by acting as a stimulant for capital flows to a country. The investments that are thus enabled can be critical to provide stimulus to countries that have recently undergone major political and/or economic transitions. The IFC’s lending to Chile in 1989-90, to Brazil in 1992 and to Eastern Europe in the 1990s are clear examples of how this policy works. A side effect of the policy is that for the IFCs capital flows to be meaningful, loans of a substantial size have to be made. Such loans can be distortive, as the transitioning investee countries often lack the legal infrastructure to deal with the investments these loans might finance.
The IFC bases its lending policies on the relevant sectoral operational policies and good practices as laid down by the World Bank. This is not a straight forward process, because the Bank’s activities are not commercially based, whereas the IFC acts as a commercial lender. In the case of the 1991 Forest Strategy, the IFC wrote an interpretation that reconciled the Strategy to its operations, while adhering to the ‘spirit and intent’ of the Strategy. Later, the IFC automatically adoped Operational Policy 4.36 (OP4.36) to guide its forestry lending4. In actual fact this led to significantly reduced IFC involvement in the forest sector. On the one hand, there were constraints in encouraging private sector operators to adopt sustainable forest management. Many derived their wood from government owned forests against payment of stumpage rates that resulted in lower cost fibre than that yielded by sustainable forest management. On the other hand, concerns
3. In an interview with Latin Finance, Bernard Pasquier, Head of Latin America and the Caribbean for the IFC, is quoted as saying ‘Under our B-loan structure, IFC only guarantees that if a payment is made, it will share the payments with other lenders. We do not guarantee the performance of the company or the credit.’ The article goes on to write: ‘Participants under the IFC B-loan structure take the credit risk of a project, but country risk is significantly mitigated due to the IFC’s preferred creditor status. As a result, regulators exempt private sector lenders in IFC B-loans from mandatory country risk provisioning requirement applicable to conventional loans.’ Geiger, 2002.
4. OP 4.36 reflected the policy content of the World Bank’s 1991 Forest Strategy.
The IFC will also lend at times
when ordinary commercial
borrowers have retreated. In this
way it ensures a continued flow
of funds, while its presence might
reassure commercial borrowers.
Some of its pulp mill financings
have taken place in this context.
It gives loans on commercial
terms but these have to meet a
development objective, and the
IFC has the in-house expertise to
assess projects and structure loans
accordingly.
During the 1990s, applying the
stringent World Bank standards
to its commercial activities
posed a significant challenge and
effectively led to the withdrawal
of the IFC from the field of forest
finance.

22
about being associated with deforestation led to a de-facto IFC decision to avoid this type of operation entirely. (Ojumu 2002). By comparison, the World Bank itself remained more active, in particular through GEF loans (see Tables 3.1 + 3.2).
As remarked above, the implementation of the 1991 Forest Strategy led to reduced IFC involvement in the forestry sector. In the period 1985 – 91, the IFC approved 54 direct impact projects with a total cost of US$ 5 billion of which the IFC financed $677 million. From 1992 through 1998, the IFC approved 65 projects with a project cost of US$ 3 billion with an IFC share of $578 million (Ojumu 2002). This suggests a decline in absolute terms, while reflecting an even greater decline relative to total lending. This was in part due to a higher rejection rate: reports from the IFC’s Operations Evaluation Department show that the IFC rejected 6 projects in the first, and 42 projects in the second period5. Specifically with respect to financing pulping capacity, it should be noted that on a world-wide basis the 1990s saw less new investment in pulp capacity, as a result of the sharp downturn in prices following the investment boom in the late1980s. The IFC did not participate in the Indonesian expansions, most of which did take place during the 1990s.
Table 3.3 IFC financing of pulp related projects
IFC All*
1988 Arauco US$59m 59.0 59.0 plant modernisation Loan
1989 Arauco US$45.5m 45.5 800.0 Exor mill US$800m package
1989 Celulosa del Pacifico US$10m 10.0 new mill Equity, BoA led syndicate for loans
1990 Celulosa del Pacifico US$147m 147.0 Co-financing with EDC, KfW
1992 Bahia Sul start-up equity 500/- mill Greenfield Equity & loans, including
commercial banks1992 Pan African Pulp mill US$38m 38.0 Co-financing
1994 Klabin Bacell US$60.3m 60.3 rebuild of pulp mill to make dissolving pulp Co-financing
1994 Advance Agro
1995 AO Volga US$150m 150.0 Upgrade of production facilities
1996 Plantation Timber Products (Leshan), Ltd US$59.1m 15.2 59.1 $1 equity $14.2 loan $20 syndication total project $59.10 More in 1998
1997 Plantation Timber Products (Hubei), Ltd US$59.5m 26.8 59.5 equity $1.53m, loan $25.3, syndication $38 Second tranche in 1999/2000
1997 Horizon Pulp & Paper, Estonia US$20.1 20.1 Integrated pulp & paper producer, rehabilitation first tranche
1998 Celhart AD, Bulgaria US$42m 16.5 42.0 Modernisation & expansion seel also EBRD
1998 United Pulp & Paper Co, Philippines US$98.4 27.5 98.4 $20m loan, $7.5m equity
1999 Horizon Pulp & Paper, Estonia US$28.1 28.1 second tranche
2001 Ballarpur Industries Ltd. Rs 150 crore 32.6 integrated pulp capacity Partial guarantee
2001 Sino Forest US$50m 25.0 $25m loan
Pipeline
2004 Jiangxi Chenming (Shandong) US$81.5m 81.5 180.0 $60m loan and $21.5m equity (12.5%). Project # 22164
2004 Aracruz US$50m 50.0 for plantation development Project # 23271
2004 Andhra Pradesh Paper Mills US$40m 40.0 121.0 $35m loan and $5m equity. Total project is US$121 - mill upgrade Project # 21499
2005 Nuqul Pulp & Paper, Jordan US$150m 25.0 Expansion of facilities. Focus is on hygiene paper
2005 Botnia S.A., Uruguay US$1.2bn 100.0 200.0 US$100m loan and US$100m syndication for Board approval Jun-05
898.1 1,419
Source: IFC Website (search projects, sector = pulp and paper)* - denotes IFC share and the portion syndicated out to other lenders/investors.
5. Sponsors whose projects were not likely to gain approval have been known to withdraw them, to facilitate making a new approach based on modified plans. It is not clear how such projects have been treated in the Operations Evaluation Department statistics quoted here.
In general, the IFC accomodates
lending to companies and projects
that do not meet its high standards
from the outset by incorporating a
commited set of improvements into
the loan. But once the funds have
been disbursed, there is little that
the IFC can do when a sponsor is
unwilling or unable to improve.

23
The IFC is set to become more active in pulp financing. At the end of 2001, the IFC had a disbursed forestry portfolio of US$515 million out of a total loan and equity portfolio fo US$13.5 billion. As at October 2003, it had US$605 million (IFC share) worth of transactions in the pipeline spread between E-Europe (36%), East Asia (21%) and Latin America (21%). The IFC currently expects to have a US$ 1 billion forest sector loan pipeline by the middle of 2005, reflecting a doubling of its forestry exposure.
This rapid increase in forest-based activity is the result both of the new Forest Strategy, but also as a result of an internal reorganisation that created dedicated sector teams. The IFC now has a dedicated Forest Product Sector team that is systematically covering the sector, and actively looking to identify targets where the IFC can add value. At the same time this signals a transition from a reactive approach, where the institution responds to financing requests, to a pro-active approach where they may help stimulate potential investments.
In India, where the IFC signals growing paper demand and a structural shortage of wood fiber, the IFC has engaged major domestic Indian pulp and paper companies in large scale forestry programs to develop a fiber base. It is currently seeing whether it can replicate such programmes with medium-size players. In China, the IFC again actively looks at financing plantations, resulting in added fibre supply as opposed to pulp mills per-se. Recognising the shortage of wood-fiber throughout Asia, the IFC also supports efforts to develop clean non-wood pulping technologies. The IFC does support wood pulp projects in areas that have a competitive advantage in growing wood fibre, such as Brazil and Uruguay, thought it insists these projects have to adhere to its Environmental and Social Guildelines.
With its pro-active approach to lending, and its conscious effort to maximise its value added, IFC is unique amongst the multilateral institutions that directly finance commercial enterprises. The next chapter will have a more detailed discussion of the safeguard process guiding the implementation of these loans, and how we feel this process could be strengthened as it relates to pulp mills.
3.1.3 MIGAThe Multilateral Investment Guarantee Agency (MIGA) was founded in 1988. MIGA’s principal mission is to facilitate foreign direct investment into developing countries by guaranteeing non commercial risks. Membership of the MIGA is open to all World Bank members. MIGA’s guarantees cover investments against political risk, currency inconvertibility, expropriation, war and civil disturbance and breach of contract, and have maturities up to 20 years. In recent years, MIGA guaranteed US$ 1 billion to US$ 1.6 billion per annum, in each case facilitating foreign direct investment of about three times that magnitude. Since inception, MIGA has issued more than US$ 12 billion in guarantees for 650 projects (translating into an average guarantee size of US$ 18.5m), helping facilitate more than US$ 50 billion in foreign direct investment.
The project list in the company’s annual report does not show any forest-based investments, but with the increased activity of the Group in this sector, this is likely to change soon. Because of its ability to issue long-dated guarantees, MIGA is well positioned to facilitate investment in developing country industrial forest plantations by institutional timber investors. It yet has to take steps in this direction, and the only recent example of potential involvement in a pulp mill has been the case of UFS.
At the time of writing, United Fiber Systems (UFS) is attempting to raise funding for a pulp mill with 600,000 tonnes of annual capacity. This company has no existing operations but controls land, and 75,751 hectares of industrial plantations that were planted by a predecessor entity between 1995 and 1999. The company developed this plan in 2001, but so far has failed to raise any funding, as a result of which even the industrial forest plantations have not been developed as per the plan presented to investors at the time they sought shareholder approval to acquire this
Since the revision of the WB Forest
Strategy, the IFC has aggressively
stepped up its activities, reporting a
US$600bn forest sector transactions
pipeline in Oct-03. This amount
increased to US$1bn by Feb-05.
MIGA, another World Bank affiliate,
provides investment risk insurance.
So far it has not been active in pulp
mill financing, but it is considering
projects in this sector.
MIGA gives guarantees up to 20
years, and could play a positive
role in making developing country
forest plantation investments
acceptable to pension funds.

24
project. They project to be able to meet their entire fibre demand from newly planted plantations by 2010. This assumes that the company started planting 20,000 hectares annually starting from 2003, something that is not the case. All four major Indonesian pulp producers, when they started their operations in the late 1980s and early 1990s, similarly projected to be self sufficient in the production of plantation fibre at the latest 8 years after the start of operations. Only one of four major companies met the target with a delay, and the overall industry still relies on wood from the natural forest for 70% of their fibre needs.
MIGA publishes no information about the UFS project on its website, reporting only transactions that have already closed. However, informed sources report that MIGA came within a hair’s breath of providing a guarantee to this project and was only in the end dissuaded from doing so after a local member of the World Bank Group raised very strong objections to MIGA participation in this project. It is critical to note that MIGA’s internal review process did not identify the obvious weaknesses in this project.
3.1.4 ADBThe Asian Development Bank (ABD) was founded in 1966 and focuses its attention on the Asia Pacific region, where it works to achieve poverty reduction by promoting economic growth, developing human resources and protecting the environment. Other key development objectives include legal and policy reform, regional cooperation, private sector and social development. The ADB is owned by 66 countries, mainly from the Asia-Pacific region.
The ADB provides loans, technical assistance and credit enhancement guarantees for projects that pursue the above goals. As at 31 December 2003, the ADB’s balance sheet totaled US$ 49.8 billion, and its loan book US$ 29.5 billion. It also administers three Trust Funds on behalf of Japan. The ADB is an active lender to the natural resources sector, but the thrust of its activities are in the agriculture and fisheries sector.
The ADB does have a forest policy, but has not been very active in the sector. Ongoing projects with a pulp element include technical assistance for Hexian pulp mill (approved in 1988) and for Yunnan Simao (approved in 1994). Its list of proposed loans for 2003-05 (October 2002 update) does not include pulp related investment proposals, but the ADB is actively supporting large scale plantation development in Laos, with a view to attracting a major pulp producer to establish a production unit in this country.
The ADB is also active in policy consultation in the region, and advises a number of governments and consultative committees/ working groups. Through this mechanism it has a greater impact on the forest sector. With regard to the forest sector, a relevant example is the ADB’s role in the Donors’ Working Group on Natural Resource Management for Cambodia. This Group is heavily focused on the forestry sector. Another example are institutional support grants and loans given the forestry departments of various client countries, eg. the 1994-2002 US$ 1.5 million to the Laotian Department of Forestry, funded by the Japan Special Fund.
3.1.5 EIB & EBRDThe European Bank for Reconstruction and Development (EBRD) was founded in 1991 to stimulate the development of private sector investment in Central and Eastern Europe, and selected countries in Central Asia. It is owned by 60 countries and two multilateral institutions. As at December 2003, it had assets of Euro 22.0 billion, Euro 6.8 billion in loans outstanding and Euro 2.6 billion in equity participations, against which it held Euro 1.1 billion in bad debt reserves. The Bank has a AAA rating, and funds itself in the international bond markets. The Bank’s disbursed portfolio is Euro 21.7 billion. Pulp and paper disbursements total Euro 219.3 million for projects with a total value of Euro 1,078.1 million.
The ADB influence forest policy and
investment in Asian countries.
The EBRD is a multilateral lender
focussing mainly on former Eastern
Europe. There is an overlap between
some of its activities and those of
the EIB, where the latter is distinct
in acting as a European ECA.

25
The European Investment Bank was founded in 1958 to contribute to European integration and social cohesion by supporting capital investment furthering EU economic objectives and, in particular, by financing projects located in the EU’s weaker regions. Outside the European Union the EIB implements the financial components of agreements concluded under European development aid and cooperation policies. The EIB functions as a pure lending institution. In 1994 it got a sister organisation, the European Investment Fund that is tasked with achieving the former objective by making selected investments.
The EIB has disbursed Euro 147.2 billion in loans between 1998 and 2002. For the period 1998 –2004 (inclusive) the EIB reported Euro 784.9 million in loans for forestry projects with a total value of Euro 2.2 billion.
The activities of the EBRD and EIB are heavily Europe centered. As a result, neither of these institutions has been confronted extensively with the potential problems that arise when investments are implemented in localities with different levels of development and different legal systems. In Chapter 2 it was discussed how new problems arose with respect to pulp mill investments once these were located in countries that had no history of dealing with such large scale, resource intensive investments.
Both the EBRD and the EIB have had considerable involvement with pulp mills, and in both cases, these involvements focussed on mill upgrades that would be expected to result in improved production practices. However, both institutions have also played a critical enabling role in financing proposed mills, that without their participation would not have seen the light.
The EIB provided the lead financing for the Stendal pulp mill in former Eastern Germany. The financing was made despite industry overcapacity, and its key justification was that the project by created 580 direct, and 1,000 jobs. It should be noted that at an investment cost of E245m (and a total project cost of E 1 bn) the cost of creating these jobs was high, and there must have been political considerations – such as promoting the integration of Eastern Germany into the EU – that also played a role.
The EBRD provided the catalytic financing for Estonia Cell/Baltic Pulp in Estonia. This example will be discussed in more detail in chapter 5 with relevance to safeguard implementation.
The level of reporting transparency of the EBRD lags that of the IFC, and the EIB reports very little, although it is at present reviewing its disclosure policies. The lesser reporting means it has been more difficult to gain insight into what goes on behind the scenes. Their actions meanwhile do not
Table 3.4 EBRD financing of pulp related projects
Borrower Country Project Year signed
Total investment
[E m]
EBRD loan [E m]
Celhart AD Bulgaria modernisation & expansion 1998 40.4 14.0
Estonia Cell Estonia new mill 2004 153.0 19.0
Kwidzyn Poland modernisation 1994 231.6 15.4
Kondoponga Karelian Republic (CIS) modernisation and expansion 1997 209.0 46.3
KZP (Trebruk) Poland mill restructuring 1993 109.2 13.5
1996 42.3 10.2
2000 56.9 25.0
Sepap Steti Czechoslovakia new mill 1995 171.0 58.9
Sical Romaniamodernisation of facilities and improvement of environmental conditions
1999 64.7 17.0
TOTAL 1,078.1 219.3
Source: www.ebrd.com

26
betray a pro-active approach with respect to structuring their investments so that they maximise development outcomes and added value. In each institution, investments are tested against the mission of the institution which can be interpreted in a rather liberal fashion. Particularly with respect to the EIB’s financing in developed Europe, the question can be asked whether these transactions need an EIB, given that these transactions could easily have been done in the commercial capital markets. Where it concerns the impact of the projects themselves, available evidence suggests that both the EBRD and the EIB are happy to focus on macro benefits such as balance of payments improvement, job creation and as yet do not work actively to mitigate any potential negative impacts that their investments might have.
3.1.6 Other multilateralsOf the other multilateral organisations, we want to mention the Inter-American Development Bank (IADB). The IADB has a portfolio of 60 forest projects with a total value of approximately US$ 690 million (60 x US$ 11.5 million on average). This institution has so-far not been active in pulp mill projects, but we expect this to change. In 2002 the IADB published a report on Forest Financing in Latin America, that identified a financing potential of US$ 6.8 billion annually for the forest sector through 2010, with industrial investments accounting for US$ 4.8 billion of this amount. Separate studies identified areas where these investments would be needed. With regard to the pulp sector, it notes a need for training and technology upgrades in Colombia, upgrading and modernization in Mexico, Chile and Argentina (mainly for paper grades), and industrial forest development in Mexico to replace part of the fibre supply from the natural forest.
3.2 Export credit agencies
Export credit agencies (ECAs) are founded/supported by a single government, and have as their aim to promote the exports of their home country. Pulp mills are highly capital intensive, and for this reason, ECAs are a prominent player in pulp projects. ECAs normally provide their support in the form of a guarantee of a commercial loan. Some ECAs may provide financing directly.
ECAs have a large involvement in pulp mill financing. ECA involvement typically points to the purchase of state-of-the-art machinery that is based on increasingly environmentally friendly production processes (Sonnenfeld 1999). As without ECA financing this equipment might not necessarily be bought, ECA funding has a beneficial role for pulp mill projects. The benefits are not universal, because until very recently, ECAs have neglected other impacts of their projects.
ECAs finance or guarantee
machinery exports and will take on
the risk of both greenfield mills and
expansions by existing players.
Table 3.5 EIB financing of pulp related projects
Borrower Country Project Year signed
Total investment
[E m]
EIB loan [E m]
Veracel Brazil new Eucalyptus pulp mill 2003 746.1 65.2
Stendal Germany new NSBK mill 2004 1,000.0 245.0
Metsae Botnia Finland 1998 49.7 49.7
UPM Kymmene Finland modernisation of pulp production at 7 mills 1999 40.0 40.0
Sodra Monsteras Sweden increase of pulp capacity, construction of new saw mill 2003 100.0 100.0
Metsae Botnia Finland modernisation of pulp mill 2000 25.0 25.0
Stora Enso Finland modernisation of p&p complex 2000 160.0 160.0
Metsa Serla Finland upgrading of 3 p&p mills 2000 100.0 100.0
TOTAL 2,220.8 784.9
0.53%
Source: www.eib.org

27
The principal aim of ECAs is to
support exports by the home
country. Fearing a loss of business,
they have been reluctant to actively
apply screening. Agreement on
standards was finally reached
within the context of the OECD
common approaches, but ECAs
have yet to develop in-house
screening capabilities.
The US Ex-Im Bank was, in 1995, the first ECA to adopt explicit safeguard policies to govern its financing policies, with many other OECD ECAs following between 1999-2002. Subsequently, the OECD have made a recommendation of Common Approaches for export credits by its member nations, that will bring practice closely in line with the safeguards and guidelines currently adhered to by the World Bank Group. The implementation of environmental standards place a high emphasis on water and air pollution, risking that other equally important aspects get overlooked.
The Export Import Bank of the US (US Ex-Im) was the first ECA to have applied environmental screening to their projects, starting in 1995. Its screening criteria are based on World Bank Group operating guidelines, and include an explicit policy prohibiting logging in tropical moist forests. These policies did not prevent US Ex-Im from financing APP, which continued to use considerable amounts of mixed tropical hardwoods (obtained from clearing of natural forests) in its operations, a fact that would be clear from reading any of its bond prospectuses or annual reports on form 20-F filed by it or its key Indonesian subsidiaries. These reports would also have reported that the company is subject to Indonesian environmental legislation and government controls. While the quality of the legislation varies – it supports high standards of water and air pollution control, but condones the clear cutting of natural forest by pulp companies with fibre deficits – it cannot be assumed that these laws are effectively enforced. The fact that APP’s significant fibre deficit could go unnoticed does reinforce the need to focus on effective implementation on the ground. At present, ever rising standards can still not ensure that guarantees or funding will be denied to poor sponsors/projects.
ECAs have been slow to sign up to safeguards out of concern of loss of business. The introduction of OECD Common Approaches levels the playing field, but could still at the margins result in a
Table 3.6 Selected export transactions of pulp production machinery projects
Year Borrower Amount Project ECA Comments
1988 Arauco unknown plant modernisation Canadian EDC Also received an IFC loan
1989 Arauco US$130m supplier credits Finland, SK, FR & Canada
1989 Arauco DEM 30m
Deutsche Finanzierungsgesellschaft fuer Beteiligungen in Entwicklungslandern GmbH (DEG)
1990 CMPC Celpac US$147m EDC, KfW Co financing with IFC
1994 Phoenix P&P US$80m Mill - 2 Finnish Export Credit g’tee to disbursing Scandinavian banks
Total cost of project US$240m
1995 Cenibra US$200m Capacity doubling from 350/- to 700/- J-Exim Cenibra then approx. 48.5% Japanese owned
1997-9 RAPP Finnish Export Credit Agency
1995-98 APP
Baltic Pulp
Valdivia
2004 Jiang Lin (APP Hainan) Aker Kvaerner 3,000 tpd fibre line
2004 Bahia Sul Celulosa SEK 165.5m Kvaerner Pulping/Elof Hansson Fabriks AB EKN
2003 VCP, Brazil Aker Kvaerner rebuild & expansion of existing facility
new fibre line and drying machine
2003 Mondi, South Africa SEK 12.8m Aker Kvaerner EKN rebuild and modernisation of Richards Bay unit
2003 Ripasa, Brazil SEK 138.6 m Aker Kvaerner EKN Limeira mill upgrade & expansion
2003 Suzano SEK 116.2m Metso Paper Sundsvall EKN
2004 Arauco Itata/ Aker Kvaerner
Note: ECAs typically include in IFC syndications, see Table 4.2Source: trade press, websites of ECAs annual reports

28
loss of business to non-OECD suppliers and ECAs. The net result may be lower standards, and this will in practice be a driver to accept projects with conditionality, which is at present not yet a widely accepted practice for ECAs.
3.3 Commercial financings
The foregoing sections approached the types of financing discussed per agency or agency group because each of these operate with specific mandates. The discussion of commercial financing will be held with reference to the major types of financial instrument rather than by granting institution.
Commercial financings can take various forms, of which credit and equity (shares) are the principal categories. Credit is obtained from banks, or by issuing debt securities in the capital markets. In their simplest way, bank loans are provided directly by the bank to the borrower. When loans are larger, the desire to spread risk usually means that the loan will be provided by a syndicate of banks, with one bank responsible for negotiating pricing and documentation within parameters that are acceptable to the syndicate. In this case we talk about syndicated loans.
Table 3.7 Date of first adoption of screening policies and/or environmental guidelines by key export credit agencies
ECA Country Policy Date
JBIC Japan
J-Exim established environmental guidelines 1999
New Guidelines for JBIC & NEXI Apr-02
Implementation of full guidelines Oct-03
Export-Import Bank United States
Environmental Procedures & Guidelines Feb-95
Subject to periodic review, frequent revisions/ additions made
EFIC Australia Environment Policy & associated procedures Jul-00
Exportkreditnamnden SwedenIntroduction of policy Apr-00
Revision of policies Jul-02
Finnvera Plc Finland
Environmental principles Jun-00
Environmental process Sep-00
Introduces Environmental Questionaire Jan-02
Guarantee Institute for Export Credits Norway
Environmental policy and guidelines introduced 1998/99
Review of policies, alignment with OECD Common Approaches Dec-03
Euler-Hermes Kreditversicherungs-AG (part of Allianz Group)
Germany
incorporates ecological, social and developmental aspects into its loan procedures Jul-00
Guiding Priniples formalised Apr-01
Implements OECD Common Approaches Jan-02
Oesterreichische Kontrollbank AG Austria
Evnironmental assessment pocedure Jun-00
Procedures modified to incorporate OECD Common Approaches Feb-02
Export Credits Guarantee Department UK
Environment screening introduced Jan-00
Statement of Business Principles & revised impact assessment Dec-00
Changes to environmental and disclosure policies following a review of existing policies Apr-03
Export DevelopmentCanada Canada
Environmental Review Directive & related procedures Dec-01
Environmental Review Framework (formalised then existing review practices) 1999
Source: OECD, ECA websites as cited
Abbreviated from Appendix I: Screening proceedures applied by various Export Credit Agencies
Commercial financing takes the
form of loans from a bank, bonds
issued on the capital market, or
equity on a stock exchange.

29
Tabl
e 3.
8 Fi
nanc
ing
rais
ed b
y pu
lp p
rodu
cers
sin
ce 1
990
(org
anis
ed b
y re
gion
)
1990
1991
1992
1993
1994
1995
1996
1997
1998
1999
2000
2001
2002
2003
2004
2005
Total
since
199
0sin
ce 2
000
Nth
Amer
ica
loa
ns
2,22
6.6
1,88
9.0
2,33
9.1
975.
5 88
0.0
2,71
7.6
1,91
3.3
6,61
9.1
3,03
7.4
1,11
5.7
55,3
83.5
57
,353
.0
18,5
96.3
9,
554.
2 11
,021
.0
-17
5,62
1.3
151,
908.
0
bon
ds
--
--
-65
0.0
--
320.
0 10
0.0
4,38
9.9
3,05
9.6
1,85
3.8
5,98
7.3
2,29
6.5
-18
,657
.1
17,5
87.1
equ
ity
--
6.9
--
--
--
431.
5 -
1,36
1.4
420.
4 92
.5
--
2,31
2.7
1,87
4.3
tot
al 2,
226.
61,
889.
0 2,
346.
097
5.5
880.
0 3,
367.
6 1,
913.
3 6,
619.
1 3,
357.
4 1,
647.
2 59
,773
.4
61,7
74.0
20
,870
.5
15,6
34.0
13
,317
.5
-19
6,59
1.1
171,
369.
4
Japa
n
loa
ns
--
--
--
--
--
69.0
9.
3 73
.0
490.
6 56
4.9
-1,
206.
7 1,
206.
7
bon
ds
-43
.8-
12.5
50
.0
--
-42
9.4
-36
8.6
79.8
-
1,02
6.8
645.
8 -
2,65
6.7
2,12
1.1
equ
ity
--
--
--
--
--
--
145.
4 -
--
145.
4 14
5.4
tot
al -
43.8
-12
.5
50.0
-
--
429.
4 -
437.
6 89
.1
218.
4 1,
517.
4 1,
210.
7 -
4,00
8.9
3,47
3.2
Euro
pe
loa
ns
2,04
6.8
--
135.
0 15
0.0
573.
8 72
0.4
187.
0 53
1.5
-2,
460.
1 4,
667.
9 1,
755.
9 4,
516.
8 2,
013.
0 2,
357.
2 22
,115
.4
17,7
71.0
bon
ds
--
--
-30
5.0
--
-52
1.7
853.
0 1,
256.
6 1,
865.
3 80
3.1
1,58
1.2
-7,
185.
9 6,
359.
2
equ
ity
--
--
951.
2 -
-18
8.3
--
167.
0 1,
182.
4 69
4.1
57.4
78
5.1
-4,
025.
5 2,
886.
0
tot
al 2,
046.
8-
-13
5.0
1,10
1.2
878.
8 72
0.4
375.
3 53
1.5
521.
7 3,
480.
1 7,
106.
9 4,
315.
3 5,
377.
3 4,
379.
3 2,
357.
2 33
,326
.8
27,0
16.1
Latin
Am
eric
a
loa
ns
73.0
66
.742
0.0
15.3
11
0.3
185.
0 84
0.0
574.
0 32
0.0
50.0
49
0.0
2,11
0.0
679.
5 15
0.0
1,15
0.0
-7,
233.
9 4,
579.
5
bon
ds
--
-63
0.0
120.
0 60
0.0
100.
0 52
0.0
650.
0 -
606.
6 90
0.3
551.
6 73
5.4
167.
0 -
5,58
0.9
2,96
0.9
equ
ity
--
132.
5-
-23
4.0
--
--
283.
1 -
-42
6.2
--
1,07
5.8
709.
3
tot
al 73
.0
66.7
552.
564
5.3
230.
3 1,
019.
0 94
0.0
1,09
4.0
970.
0 50
.0
1,37
9.7
3,01
0.3
1,23
1.1
1,31
1.6
1,31
7.0
-13
,890
.6
8,24
9.7

30
Tabl
e 3.
8 Fi
nanc
ing
rais
ed b
y pu
lp p
rodu
cers
sin
ce 1
990
(org
anis
ed b
y re
gion
) (co
ntin
ued)
1990
1991
1992
1993
1994
1995
1996
1997
1998
1999
2000
2001
2002
2003
2004
2005
Total
since
199
0sin
ce 2
000
Asia
loa
ns
29.8
31
.037
0.5
254.
1 51
5.2
1,03
2.3
1,09
8.1
1,79
5.0
100.
0 17
5.0
487.
5 47
2.6
--
--
6,36
1.1
960.
1
bon
ds
--
-28
5.0
500.
0 1,
350.
0 1,
715.
3 2,
099.
4 -
-60
9.9
358.
7 28
2.9
142.
5 77
.5
-7,
421.
0 1,
471.
4
equ
ity
346.
360
.010
2.9
28.2
25
8.0
460.
5 23
2.0
3,27
2.9
723.
8 50
4.4
21.9
3.
9 -
4.5
--
6,01
9.3
30.3
tot
al 37
6.1
91.0
473.
356
7.2
1,27
3.2
2,84
2.8
3,04
5.4
7,16
7.3
823.
8 67
9.4
1,11
9.3
835.
2 28
2.9
147.
0 77
.5
-19
,801
.3
2,46
1.8
Aust
ralia
& N
ew Z
eala
nd
loa
ns
328.
618
.019
0.9
1,10
1.2
181.
1 60
0.0
--
-19
5.6
-23
8.4
526.
7 -
--
3,38
0.5
765.
0
bon
ds
equ
ity
tot
al 32
8.6
18.0
190.
91,
101.
2 18
1.1
600.
0 -
--
195.
6 -
238.
4 52
6.7
--
-3,
380.
5 76
5.0
Othe
rs
loa
ns
--
88.0
-
251.
3-
100.
037
9.5
160.
039
1.3
65.8
90
3.3
0.0
30
.0
50.0
-
2,41
9.3
1,04
9.1
bon
ds
--
--
-11
.6
--
363.
5-
0.0
59.7
88
5.9
59.1
-
-1,
379.
8 1,
004.
7
equ
ity
--
176.
0 -
0.0
0.0
12.0
-
-38
4.6
(0.0
)99
.3
-0.
0 -
-67
1.9
99.3
tot
al -
-26
4.0
-25
1.3
11.6
11
2.0
379.
5 52
3.5
776.
0 65
.8
1,06
2.3
885.
9 89
.1
50.0
-
4,47
1.0
2,15
3.1
Tota
l
loa
ns
4,70
4.9
2,00
4.8
3,40
8.5
2,48
1.1
2,08
8.0
5,10
8.6
4,67
1.8
9,55
4.6
4,14
8.9
1,92
7.6
58,9
55.9
65
,754
.5
21,6
31.4
14
,741
.6
14,7
98.9
2,
357.
2 21
8,33
8.3
178,
239.
6
bon
ds
-43
.8-
927.
5 67
0.0
2,91
6.6
1,81
5.3
2,61
9.4
1,76
2.9
621.
7 6,
828.
0 5,
714.
7 5,
439.
4 8,
754.
2 4,
768.
0 -
42,8
81.4
31
,504
.3
equ
ity
346.
360
.041
8.3
28.2
1,
209.
2 69
4.5
244.
0 3,
461.
2 72
3.8
1,32
0.5
472.
0 2,
646.
9 1,
260.
0 58
0.6
785.
1 -
14,2
50.6
5,
744.
6
tot
al 5,
051.
22,
108.
53,
826.
8 3,
436.
8 3,
967.
2 8,
719.
7 6,
731.
0 15
,635
.1
6,63
5.7
3,86
9.9
66,2
55.9
74
,116
.1
28,3
30.8
24
,076
.4
20,3
52.0
2,
357.
2 27
5,47
0.3
215,
488.
5
See A
ppen
dix I
I ‘Fin
ancin
g ra
ised
by p
ulp
prod
ucer
s sin
ce 1
990’
for f
urth
er d
etail

31
Companies can also issue bonds that are then sold by banks to end investors, such as pension funds, insurance companies, mutual funds or even individuals.
When a loan is first raised, or when a bond is sold by the issuer to an investor, this is referred to as a primary market transaction. A key aspect of a primary market transaction is that money passes from investors to the issuer of a security. In the case of this study this would be the forest-based company. The first investor to buy a security is very likely to sell this security in the course of its life. Financial institutions make a market between themselves for bonds, and even loans are traded in this way. None of these transactions result in raising fresh money for the issuer of the security. Transactions of this nature are said to take place in the secondary market. Secondary market investments can be made for relatively short periods of time – a trader may hold a bond for only a few hours, and even end-investors may hold bonds for only a few weeks if they were trading them with a view to anticipated changes in yields. This would be true for hedge-funds, that manage money for institutions and private individuals, and have as their objective to make money in absolute terms. Insurance companies, who buy bonds to match liabilities that they have to their policy holders, are more likely to be longer term investors. They will be active as buyers both in the primary and the secondary market.
This paper is primarily concerned with primary market transactions, as these result in actually raising new funding for the issuing companies. Thus it is at this stage that safeguards and standards should be implemented. Investor action in the secondary market affects issuers only to the extent that it influences pricing in the primary market, and sends a signal about the relative desirability of paper from a given issuer/sector.
Pulp and paper companies raised a total of US$215.5bn in primary market debt and equity transactions in the US and international capital markets to finance ongoing operations, re-pay old debt or to support horizontal and vertical expansions. In almost all cases, these funds were extended to companies that were already in existence, as a result of which the potential ability of the financiers to influence the operations of the issuer – by insisting it upholds certain standards – is less as compared to those financings that are explicitly raised to finance entirely new plants. Having said that, there is much more that can be done by commercial financial institutions to ensure that they do not finance unsustainable pulp mills, and this is the subject of the final chapter.
Commercial credit has financed most pulp expansions, but because commercial credit in most cases finance companies and operations that are already existing, it has less of an impact to shape pulp mill investment policies as compared to the actions of the first-stage financiers. As we have seen, the financial institutions in first-stage financing tend to have different mandates and objectives than the purely commercial financial institutions we find in the next stage.
Statistics on US and international syndicated loan, bond and equity issues show that pulp and paper companies raised US$215.5 billion between 1990 and January 2005 to finance ongoing operations or to support horizontal and vertical expansions. The funds were raised as loans, bonds, equity or project finance transactions, but by a comparatively limited number of players. This reflects the reality that gaining access to capital market funding is complex, but that once entrance has been gained, renewed tapping of these markets is comparatively easy.
3.3.1 Market accessThis section discusses cross border syndicated loans and bond issues. Pulp producers tap these markets to obtain funding in larger amounts and with longer maturities than can be obtained in the domestic banking system in the newly emerging production centres. The number of companies that is sufficiently creditworthy for such amounts and tenors is automatically limited, and this results in a relatively high concentration of issuers.
Most pulp capacity expansions
have been financed from
commercial sources.
The international capital markets
are the focus of pulp financings.
The international debt markets
exist to provide large amounts of
financings with large tenors.

32
As a result of the high cost of origination of international syndicated loans or bond issues, the minimum economic issue size is upwards of US$ 100 million, with US$ 200-300 million being the norm. This size requirement is reinforced by the reality that only large and well known companies are likely to meet with demand for their debt. For issuers in countries with weak currencies, access to capital markets is typically restricted to sovereign names, and the largest exporters of US$ -priced products with a meaningful competitive advantage. In case of a devaluation, the sovereign is assumed to be able to raise further foreign currency debt, while the currency risk for strong exporters is much reduced, as their revenues would, in US Dollar terms, remain unaffected. The individual company needs to be a profitable enterprise with real cash flow, as ordinary loans are given (or bonds issued) on the strength of the existing business, although the purpose of the loan might well be to finance an expansion. The creditworthiness will usually be assessed by looking at the issuer’s credit rating – having one is effectively mandatory. Because the international capital markets have no umbrella regulator that dictates disclosure standards, industrial companies need to have a stock market listing as that mechanism ensures the company reports periodic financial information to the financial markets. Issuers with debt issues registered with the Securities and Exchange Commission (SEC) in the US will also need to report financial statements to the Securities and Exchange Commission. Unlisted issuers are more likely to raise syndicated loans, as these have a mechanism built in where the lead bank will have access to credit information. Once companies have made a maiden issue, returning to the markets is easy. Only twelve companies jointly accounted for 70% of all emerging market pulp and paper issues. The implication is that market access forms a barrier to entrance, and provides an incentive for companies to gamble big time to make it into the big league ahead of the competition.
Size is a principal criterium for market access, and this is true even for new projects. E.M. Capital increased the size of its proposed mill in Estonia from 210,000 tonnes per annum to 500,000 tonnes per annum because the former figure was too small to attract financing. The mill never materialised, and the plan was formally abandoned in 2004 because the company could not find an operating partner. However, the message about size is clear.
Capital market access requirements preclude greenfield projects by new sponsors from being financed in this market, but the international capital markets do lend themselves to effective
Table 3.9 Structure of APP’s debt financing[data in US$ m]
Indonesian Overseas Total APP
Commercial loans - secured 860.9 318.6 1,179.5 12.2%
Commercial loans - unsecured 465.6 177.1 642.7 6.7%
Bank loans - secured 25.2 218.0 243.2 2.5%
Bank loans - unsecured 15.2 60.1 75.3 0.8%
Supplier credit -secured 164.4 3.6 168.0 1.7%
Trade suppliers 232.3 306.0 538.4 5.6%
Trade notes - secured 247.9 - 247.9 2.6%
Trade notes - unsecured 89.8 - 89.8 0.9%
Notes - secured 800.0 24.9 824.9 8.6%
Notes - unsecured 2,735.9 1,047.5 3,783.4 39.3%
Convertible notes - unsecured - 641.5 641.5 6.7%
Bonds 230.8 - 230.8 2.4%
Capital lease 5.6 1.9 7.4 0.1%
Export credit - unsecured 609.3 249.8 859.1 8.9%
Export credit - secured 5.3 - 5.3 0.1%
Other 84.3 10.6 94.9 1.0%
6,572.4 3,059.6 9,632.0 100.0%
68.2% 31.8%
Source: Asia Pulp & Paper Company Ltd, Financial Advisor’s Report Phase I, KPMG June 2002
The international capital markets
have no formal regulator. Market
participants decide for themselves
whose credit they will accept. New
issues are subject to due diligence,
but there is no formal mechanism
for continued reporting. It is
expected that issuers already
report financials to another
regulator, and these reports will be
sufficient.
Pulp producers with a hard
currency based business of a
meaningful size are amongst the
developing country issuers that
can gain access to the international
capital markets.
Returning to the markets after a
maiden issue is relatively easy.
A key criterium for access is size.

33
expansion financing. Banks do sometimes finance greenfields, but these are then structured as project finance transactions, or loans are made with an ECA guarantee. Project finance refers to the financing of projects that have yet to be realised. In project finance, the principal source of repayment are the future cashflows of the project to be financed. Unlike in ordinary loan transactions, there is no existing business whose cash flow can help support the debt. Because of the significantly higher risk, project finance transactions take a longer time to structure than ordinary loans or bonds, and typically involve in-house industry experts. The period under review (1990 – January 2005) showed US$ 1.0 billion in project finance transactions (2.8% of total) for developing country pulp and paper companies.
Investor risk preference will determine whether a borrower can obtain funding, and if so at what cost. For any of the developing country pulp producers, the first consideration would have been the country credit. What level of credit is acceptable to banks and other providers of capital depends entirely on their risk appetite. Low interest rates or investment returns in their home market tend to increase the appetite for risk, while on the other hand recent defaults or financial turbulence tends to result in a declining appetite for risk. Petrobras, the state oil company of Brazil had to postpone a bond issue in the summer of 2002, when investors, with the hurt of the Argentinan default fresh in their mind, were spooked by the prospects of a socialist president taking the reins in Brazil. Privately owned pulp producer Aracruz fared slightly better and raised US$ 250 million in export backed securities in February 2002. Still this reflected a relative deterioration in the terms: the company made its maiden Eurobond issue in 1993, and returned to the Euromarkets three more times through 1997 when the Asian crisis cooled demand for emerging market debt for a while and Aracruz could not raise financing. Chart 2.1 in Chapter 2 is a graphical representation of this phenomenon. The uncertainty of continued market access encourages opportunistic financing by companies when there is a window of opportunity. The IFC sets itself apart in that it will provide financing in down markets at times when commercial lenders will not take this risk. The IFC’s most notable recent involvement in a down market in the pulp sector was its 2002 assistance to Klabin by providing bridging financing to facilitate this company’s restructuring at a time when the markets were effectively closed to Brazilian risk.
3.3.2 Lending costThe interest that a lender will charge is a function of repayment risk. The higher the assumed repayment risk, the greater the cost of the debt. The debt is priced relative to the best credit in the market, for US Dollar issues this is the debt of the US Government (Treasury notes and bonds). A company’s creditworthiness is a function of many factors, but many lenders are content to base their conclusions on the findings of rating agencies that give a company a rating depending on the strength of their business, and individual issues ratings reflecting both the structure of the instrument and the strength of the borrower. Relative supply and demand of credit also plays a role.
The requirement for an operational
trackrecord precludes access
by aspiring entrants to the pulp
industry. These are more likely to
secure funding through project
finance.
Market access is determined by
investor risk preference at any
given point in time. At all times,
country risk will be the first
investor consideration.
The lending cost is primarily
influenced by repayment risk, and
to a lesser extent by supply and
demand for the type of debt (sector,
tenor, grade) being issued.
BrazilChileIndonesia
1990
1992
1994
1996
1998
2000
2002
2004
9.08.07.06.05.04.03.02.01.0
-
US$
bnChart 3.1 Debt financing raised by year, key issuing countries: 1990 - Dec-04
Source: data reported by Dealogic & Thomson Financial, includes debt component of project finance transactions

34
Table 3.10 Emerging market bond spreads and changes therein
Country S&P Moody’s Fitch IBCA SpreadChange
1D 1W 1M YTD
BBB 147 + 7 + 0 + 6 + 8
BB 274 + 6 + 6 + 9 + 5
B 512 - 0 + 22 + 10 - 11
Brazil B+ B2 B+ 538 + 65 + 36 + 65 + 127
Chile A Baa1 A- 100 - 2 + 1 - 7 + 3
Indonesia B B2 B+ 252 - 1 + 30 + 33 + 49
Russia BB+ Baa3 BB+ 266 + 1 + 5 + 13 + 11
Thailand BBB Baa1 BBB 53 - 7 - 11 - 15 - 22
Source: Deutsche Bank debt price sheet Mar-04
A study by the Bank for International Settlements on developing country syndicated loan pricing finds that lenders focus more on macroeconomic factors than on issuer specific factors to determine the pricing of their loans (Altunbas et al 2003). This is clearly reflected in actual trading.
Table 3.10 shows the spreads at which debt of various countries was traded in March 2004. A spread is the differential of the yield on the debt of the issuer as compared to that of the benchmark issue for the same maturity. This table shows that spreads for countries with higher ratings are generally lower, but also that within rating categories there can be meaningful spread differences. These would then reflect investor preferences at that particular point in time as well as supply and demand of paper from the issuer in question. At the time that these observations were made, the perceived credit risk for Asian borrowers was significantly lower than that of those from Latin American as a result of the Argentine default. Spreads decline as more investors are keen on the credit, and/or expect it to improve further, thus justifying a lower compensation for the risk taken. The movement of relative spread levels of developing countries tends to be affected by common factors such as investor risk preference. Whereas in any country the government is normally is considered to be the best credit by definition, in developing countries, strong exporters often trade at a premium to the debt of the national government. In Brazil, the majority of investment grade Eurobond issuers trade at a negative spread to Brazil itself, and even non-investment grade exporters, such as Votorantim can be traded at lower yields, and thus comparatively higher prices. For instance on 16 March 2004 the 7.875% bond maturing 2014 issued by Votorantim traded at Treasuries plus 526 basis points as compared to a spread of Treasuries plus 560 basis points for a comparable bond issued by the Brazilian State.
Lending cost is expressed as
a spread over a benchmark
issue. These spreads are subject
to constant change reflecting
changing market conditions
affecting issuer credit status, and
investor risk preference.
Country risk is a key determinant
in lending cost.
Country spread levels are the deciding factor in the cost of capital for a pulp mill. CMPC and Aracruz have balance sheets of similar strength, and are involved in the same export industry, but CMPC’s effective cost of funding is half that of Aracruz because it operates in a country with a single-A credit rating.
When the outlook for a country is not clear, or risk is perceived to be high, it is possible that there is no market for a borrower’s debt. The most recent example of this is the decline in demand for Latin American debt after the Argentine default. At such times companies buy credit enhancements, although risk aversion can move to such levels that even then demand is weak. In 2001, Latin American companies raised US$ 7.3 billion in asset backed transactions. In 2002, it was hardly possible to raise straight debt, and the volume of asset-backed transactions also declined to US$ 5.8 billion. Moreover a larger percentage (56%) of cross-border transactions had enhancements from triple-A guarantors, as compared to only 21% in 2001. (Latin Finance 7 March 2003). Concurrently, the cost of guarantees would have gone up, and the tenor of transactions down. Ratings mirror this risk perception. 2002 saw most downgrades in Latin America, even though
There are periods when a country’s
credit – or that of a group of
countries – is not wanted in the
market so that companies have to
look for other sources of funding.

35
Table 3.11 Key financial data for Aracruz and CMPC[USD mio]
Aracruz CMPC
2002 2004 2002 2003
Cash & bank 273.9 450.2 155.1 230.5
Other current assets 250.5 382.9 665.8 839.7
Property, plant & equipment 2,000.1 2,133.9 2,808.2 3,571.0
Investment in affiliate 273.9
Total assets 2,698.8 3,529.7 3,757.8 4,732.1
Short-term loans 10.8 11.7 24.7 48.7
Current portion of long-term debt 167.3 141.3 135.8 67.1
Bonds (short-term) 0.8 1.3
Long-term debt 611.1 1,222.7 238.8 237.3
Bonds (long-term) 250.0 550.0
Equity 1,760.6 1,814.3 2,633.4 3,383.2
Gross gearing 44.8% 75.8% 24.7% 26.7%
Net gearing 29.3% 51.0% 18.8% 19.9%
Sales 669.0 1,167.1 1,235.5 1,672.3
Gross profit 200.1 452.3 661.0
Operating profit 95.5 356.7 185.1 305.0
Operating margin 14.3% 30.6% 15.0% 18.2%
Financing charges (82.0) (120.0) (51.8)
Interest income 61.6 56.1 7.0
net financing cost (20.40) (63.85) (31.8) (44.8)
Interest cover
gross 1.2 3.0 5.9
net 4.7 5.6 5.8 6.8
Ratings (Standard & Poors)
National scale BrAAA
Foreign currency BB- A-
Sovereign BB- A
Source: financial data from company annual reports, results releases; ratings from Standard and Poors (Feb-05)www.aracruz.com, www.cmpc.cl
in terms of actual defaults, more were seen amongst higher leveraged US borrowers. Of US$ 34 billion in defaults in 1Q04 (47 issuers), 32 were US corporates ($22.6 billion) and 7 Argentine names defaulted on $4.2 billion (‘only’). (Latin Finance 18 June 2002)
The next chapter will deal with credit risk assessment and due diligence.
3.3.3 Domestic banksDomestic banks and capital markets have played a minimal role in financing the large pulp mills in developing countries. Once mill sizes entered the jumbo category, the international capital markets were a more attractive source of financing both because of the ability to provide large amounts of funding and because of the ability to provide funds for long maturities. At this stage, the role of the domestic bank is more as a facilitator of payments and trade facilities (letters of credit).
Domestic banks do play an important role in financing smaller domestically oriented mills. Whereas larger mills finance themselves internationally, at the outset all purely domestically owned mills will have been financed by local banks. These banks have a knowledge advantage
Once pulp producers have gained a
certain scale they cease to rely on
the domestic banking system for
expansion financing. In this way
the superior knowledge that an
independent domestic bank might
have is lost to the lending syndicate.

36
over international lenders, although when these banks operate in countries with poor financial sector governance this may not stop them from financing poor projects proposed by powerful interests. Domestic banks are however, also more likely to place a higher emphasis on national priorities – building a pulp industry to gain self-sufficiency or to gain market share – over and above considering the safeguards at the mill level.
The large funding size requirement to gain access to the international capital markets is a major incentive for producers to try and get into the big league. Conversely, this should mean that in countries where more domestic funding is available, and therefore reduced need to tap international sources), the pulp industry might be more balanced with respect to numbers of players and their size. After all, there is no need to up the mill size to meet the criterion of large lenders. This is somewhat true in Brazil and Thailand, but not in Chile and Indonesia.
3.3.4 EquityThe majority of the large pulp producers are publicly listed companies. Pulp production is a capital intensive business, and even when expansions can be debt financed, there are limits on the effectively permissible debt-to-equity ratio, meaning that the equity base determines a company’s ability to raise debt. A company’s equity base is made up of its paid up capital, and grows over time by the amount of earnings that are not paid to the shareholders in dividends. When the rate of natural growth is insufficient to sustain the higher debt levels that come with expansion or when a take-over is envisaged; an additional offering of shares will be made.
Of the countries in our sample, Indonesian companies were most active as issuers of equity, and in all cases it concerned additional equity offerings either the operating companies that already had small domestic listings, or by the formation of a holding company that was subsequently listed overseas.
The pulp and paper sector has only been of middling interest to equity investors. From the perspective of a buy-and-hold investor, the sector is not attractive as its return on equity through a cycle is well below levels seen in other sectors. For most of the 1990s, investors would have expected to see returns on equity in the low to mid teens. These were never delivered, not even during peak years (see Table 3.12). Initially, the equity of developing country issuers was of interest to investors because of the promise of higher returns on investment inherent in the competitive fibre source. This promise was never made good, and even if a company showed superior operating margins, some of the benefit was handed back in the form of higher borrowing costs. Brokers kept on promoting equity in these companies – the Indonesian producers in particular. Morgan Stanley’s pulp and paper analyst kept on topping the league tables that ranked analysts on the basis of client polls, even though his work failed to recognise the steady deteriorating financial condition at APP. APP reported below average profitability in most years. Yet it needed to raise equity to support further debt issues.
The equity of these issuers performed poorly, but one of the reasons why these companies could place such substantial amounts of it was the active support of the lead underwriter for the issues. These underwriters have tremendous placement power, and high incentives to complete the issue, as this would lead to more demand for debt, and thus, more fees in addition to those being earned on the equity placement. It should be noted here that at the institutional level, commissions paid on broking transactions are very slim (0.25% to 0.40% would have been representative for the late 1990s, depending on the market and service). After covering the costs of sales staff, back offices and research departments, profits are minimal. The real money is made in origination and mergers and acquisitions. A representative fee for would be 2.5% debt origination and 7.5% for equity placements. It was these transactions, rather than secondary broking volume that the banks were after, and in order to facilitate getting access to the clients, such banks would employ large research departments. Since the dot-com fall out, lead managers may no longer write research in
In Brazil and Thailand, the existence
of a relatively strong domestic
banking system allowed for the
emergence of a number of medium
size pulp producers that effectively
serve the domestic market.
Low returns on equity through the
cycle means that the pulp industry
is of below-average interest to
equity investors.
Equity issuance has been
subordinated to debt funding
needs, with companies issuing
equity only to be able to support a
larger debt burden.
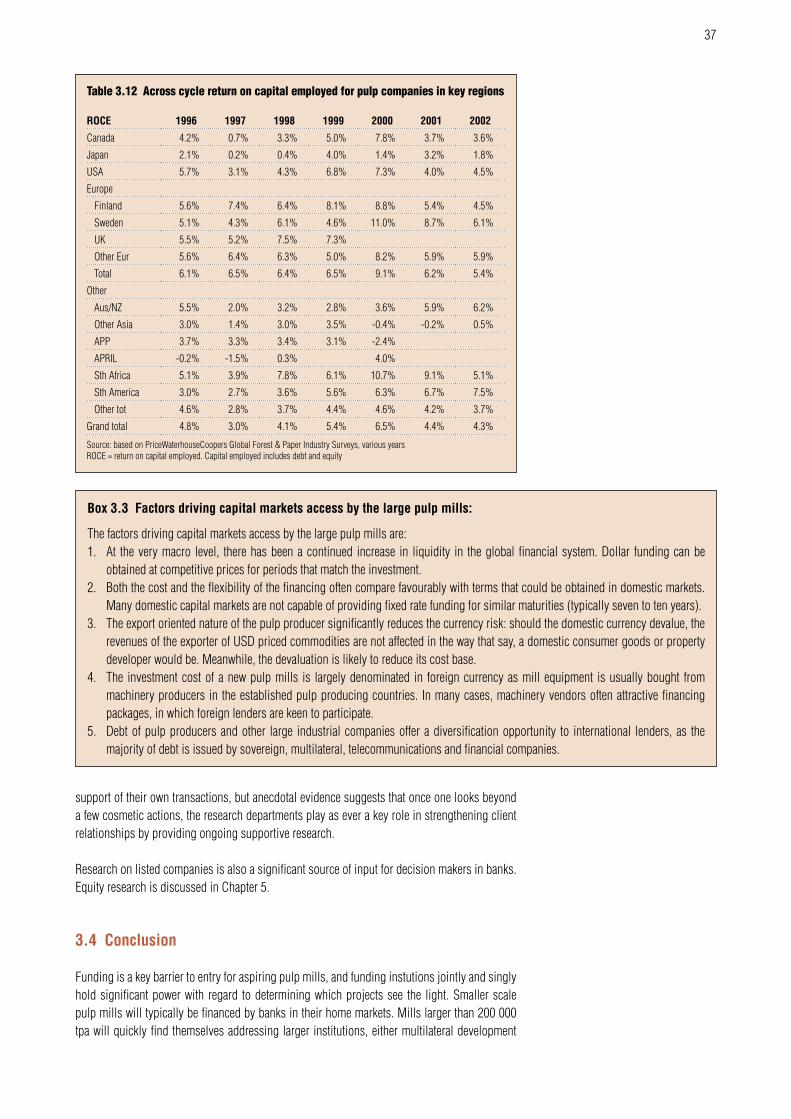
37
support of their own transactions, but anecdotal evidence suggests that once one looks beyond a few cosmetic actions, the research departments play as ever a key role in strengthening client relationships by providing ongoing supportive research.
Research on listed companies is also a significant source of input for decision makers in banks. Equity research is discussed in Chapter 5.
3.4 Conclusion
Funding is a key barrier to entry for aspiring pulp mills, and funding instutions jointly and singly hold significant power with regard to determining which projects see the light. Smaller scale pulp mills will typically be financed by banks in their home markets. Mills larger than 200 000 tpa will quickly find themselves addressing larger institutions, either multilateral development
Table 3.12 Across cycle return on capital employed for pulp companies in key regions
ROCE 1996 1997 1998 1999 2000 2001 2002
Canada 4.2% 0.7% 3.3% 5.0% 7.8% 3.7% 3.6%
Japan 2.1% 0.2% 0.4% 4.0% 1.4% 3.2% 1.8%
USA 5.7% 3.1% 4.3% 6.8% 7.3% 4.0% 4.5%
Europe
Finland 5.6% 7.4% 6.4% 8.1% 8.8% 5.4% 4.5%
Sweden 5.1% 4.3% 6.1% 4.6% 11.0% 8.7% 6.1%
UK 5.5% 5.2% 7.5% 7.3%
Other Eur 5.6% 6.4% 6.3% 5.0% 8.2% 5.9% 5.9%
Total 6.1% 6.5% 6.4% 6.5% 9.1% 6.2% 5.4%
Other
Aus/NZ 5.5% 2.0% 3.2% 2.8% 3.6% 5.9% 6.2%
Other Asia 3.0% 1.4% 3.0% 3.5% -0.4% -0.2% 0.5%
APP 3.7% 3.3% 3.4% 3.1% -2.4%
APRIL -0.2% -1.5% 0.3% 4.0%
Sth Africa 5.1% 3.9% 7.8% 6.1% 10.7% 9.1% 5.1%
Sth America 3.0% 2.7% 3.6% 5.6% 6.3% 6.7% 7.5%
Other tot 4.6% 2.8% 3.7% 4.4% 4.6% 4.2% 3.7%
Grand total 4.8% 3.0% 4.1% 5.4% 6.5% 4.4% 4.3%
Source: based on PriceWaterhouseCoopers Global Forest & Paper Industry Surveys, various years ROCE = return on capital employed. Capital employed includes debt and equity
Box 3.3 Factors driving capital markets access by the large pulp mills:
The factors driving capital markets access by the large pulp mills are:1. At the very macro level, there has been a continued increase in liquidity in the global financial system. Dollar funding can be
obtained at competitive prices for periods that match the investment. 2. Both the cost and the flexibility of the financing often compare favourably with terms that could be obtained in domestic markets.
Many domestic capital markets are not capable of providing fixed rate funding for similar maturities (typically seven to ten years). 3. The export oriented nature of the pulp producer significantly reduces the currency risk: should the domestic currency devalue, the
revenues of the exporter of USD priced commodities are not affected in the way that say, a domestic consumer goods or property developer would be. Meanwhile, the devaluation is likely to reduce its cost base.
4. The investment cost of a new pulp mills is largely denominated in foreign currency as mill equipment is usually bought from machinery producers in the established pulp producing countries. In many cases, machinery vendors often attractive financing packages, in which foreign lenders are keen to participate.
5. Debt of pulp producers and other large industrial companies offer a diversification opportunity to international lenders, as the majority of debt is issued by sovereign, multilateral, telecommunications and financial companies.

38
banks or export credit agencies. If their existing operations are of a sufficiently large scale, or if the markets happen to be accomodating, these companies might even tap the international capital markets directly.
In terms of actual amounts, pulp and paper companies have raised far more money in the US and international capital markets as compared to from multilateral lenders. Financing activity in the former markets totalled US$215.5bn between 1990 and Jan-05 which compares to direct investment/lending by the IFC, EIB and EBRD of US$2.1bn. The significance of multilateral lending is that multilateral involvement creates a pre-disposition to lend by commercial financial institutions, and in the case of the IFC the linkage is stronger as the IFC will even arrange commercial financings. In this way, multilateral involvement can make a pulp project. An example of this is the UFS pulp mill in Kalimantan. This mill has repeatedly failed to get commercial financing, and came within a hair’s breath of getting a MIGA guarantee. While the proposed guarantee size was small, MIGA’s involvement would almost certainly have unlocked other financing sources.
Because of the size of pulp mill investments, and the attendant large funding need, most mills derive their funding as large syndicated loans or bonds. In these markets, there is less of an ongoing and direct link between the issuer and the provider of the funds, and funding is often made available based on market demand for certain types of debt just at that moment. This demand is influenced first by macro factors, such as the industry cycle, the credit status of the country of the issuer, the relative demand for debt securities by stronger or weaker issuers, and maturity. Only then will the attention turn to the individual issuer. This emphasis of investor attention goes a long way to explaining why apparently weak issuers with obvious sustainability problems can still obtain funding.
The majority of issuers in the international capital markets are financial institutions, sovereign countries, municipalities, telecommunications companies and large multinationals. For many of these issues, the macro-based assessment is appropriate. The pulp sector is almost unique in the way that relatively less well known issuers can still have access to this market. Furthermore, by often moving straight from being financed by domestic financial institutions to the international capital markets, they can lack the scrutiny that comes with a long-term bilateral banking relationship with an international bank. It is there that pulp companies are in a somewhat unique position, and why special attention to this class of issuers is needed.
Even the pulp producers with very low cost production have not succeeded in delivering superior returns to their equity holders. This has resulted in only a lukewarm stock market reception for issuers from this sector. As a result, and also because of the high cost of capital investment, debt dominates the financing activity of pulp and paper companies. The listed equity of pulp producers is hardly core to investors’ portfolios, and many institutions hold zero weightings in the sector, although this is also a function of where the pulp cycle is. Pulp producers did nevertheless at various times raise additional equity, as this was needed to support growing debt burdens taken on to finance ever greater expensions. This equity would still get sold, with typically the lead bond underwriter for the firm playing an active role in marketing the issue. Underwriter fee levels and pricing would further determine the appetite for (placing) the issue.

The most common form of risk affecting all lending transactions, whether direct in the form of loans, or indirect in the form of the purchase of a debt security, is the possibility that the obligor fails to meet its obligations in accordance with agreed terms. If a debt issue is publicly traded, even a change in relative creditworthiness has an impact on the price at which the security is traded, so that credit risk considerations are relevant for companies across the spectrum of financial strength, and not just those at the edge of default. The primary objective of bank risk management is to maximise a bank’s risk-adjusted rate of return by maintaining credit risk exposure within acceptable parameters. For large loan and bond issues, the credit risk assessment process will transcend the limited analysis of the borrower’s ability to repay, and will extensively address legal and operational issues by way of due diligence. Actual due diligence exercises have shown up weaknesses in companies, but in the past lenders have not accorded much importance to such weaknesses, proceeding with funding where the rating was deemed satisfactory. As a result bank/investor credit standards do not by themselves ensure responsible financing, or deny credit to poor performers.
4.1 Credit risk assessment
All forms of lending carry risk, and as the risk increases, so does the cost of funds. It is the business of a lender to understand risk, price it correctly, and make a profit by earning more on its loans than it has to write off. Credit risk is assessed both at the individual loan basis, and at the aggregate portfolio basis in order to avoid concentrations of risk in a single sector. In actual practice banks place a greater emphasis on the sector and geographical spread of the loan portfolio than on a thorough credit assessment of the individual borrower. If in a given year a rural area experiences poor harvests and poor prices for its products, banks that lend to this area are likely to experience above average defaults on their loans irrespective of individual borrower quality. Banks manage this risk by also lending in other areas, and to industries that have little relation to each other.
At head office level, credit management will focus on ensuring that limits are set per region and per industry, so as to cushion the impact of bad years in certain regions or industries. The existence of aggregate limits on risk also means that banks can sometimes be more flexible at the company level, especially where they see good yields. Lender behaviour during the 1990s suggested that both the high coupon and the diversification characteristics of the pulp industry provided enough of an incentive to lend, despite awareness of weaknesses at the individual borrower level. This comment refers to aggregate behaviour, because there will definitely have been banks with sensible credit departments that noted the over-leverage that characterised some of these issuers. But where these banks passed, others were keen takers.
4 Financial risk assessment
In lending, the most common form
of risk is the possibility that the
obligor fails to meet its obligations
in accordance with agreed terms.
Loans are priced to reflect their
level of risk. Banks manage risk at
the individual loan level and across
the entire loan portfolio.
Actual bank risk management
practices place more emphasis
on managing the structure of
the loan portfolio, as oppossed
to rigourously assessing each
individual component.

40
Box 4.1 Key credit assessment criteria for commercial banks
Key credit assessment criteria include:• the purpose of the credit and sources of repayment;• the current risk profile (including the nature and aggregate amounts of risks) of the borrower or counterparty and collateral and its
sensitivity to economic and market developments;• the borrower’s repayment history and current capacity to repay, based on historical financial trends and future cash flow projections,
under various scenarios; for commercial credits, the borrower’s business expertise and the status of the borrower’s economic sector and its position within that sector;
• the proposed terms and conditions of the credit, including covenants designed to limit changes in the future risk profile of the borrower; and
• where applicable, the adequacy and enforceability of collateral or guarantees under various scenarios. In addition, in approving borrowers or counterparties for the first time, consideration should be given to the integrity and reputation of the borrower or counterparty as well as their legal capacity to assume the liability. Once credit-granting criteria have been established, it is essential for the bank to ensure that the information it receives is sufficient to make proper credit-granting decisions. This information will also serve as the basis for rating the credit under the bank’s internal rating system.
Source www.BIS.org
A major trend that took place over the past three decades was a shift away from one-to-one bank-to-borrower lending towards club or syndicated transactions, which has resulted in reduced contact between the borrower and the provider of the risk capital (i.e. disintermediation).This has also had a direct impact on risk analysis6. If previously banks lent to companies close to home and had a good knowledge of their customer, now they were lending increasingly far afield. This gave them the major benefit of a better portfolio spread, but removed them from the credit assessment process. The competitive pressures present in the bank lending business also means that banks don’t have due diligence access to the borrower that they would have had they originated the loan themselves. As a result, many lenders and investors place undue reliance on the due diligence and credit risk analysis done by the syndicate leader or underwriter or by rating agencies. This is especially so for those institutions that trade exposure, and do not aim to hold it on their books from the date of origination until its final maturity. This goes a long way to explaining why so much of the debt of the weakest pulp producers was issued in the form of bonds, rather than as bilateral or even syndicated loans.
Banks are commercial enterprises in pursuit of maximisation of profits, but because of the key role they play in the economy, they are subject to different regulatory treatment as compared to ordinary commercial enterprises. Banks are subject to regulation and supervision, but supervisors will not tell banks what loans they can and cannot make. Supervisors do ensure that banks have adequate capital, as well as adequate systems in place to manage and monitor risk. In actual fact supervisors find many basic weaknesses in credit granting and monitoring by banks involved in the international loan markets. This appears at odds with the observation that there have been remarkably few international bank failures over the past decade. The low failure rate might well be due to the steady decline in US Dollar interest rates, the increase in global liquidity seen over this period and the proliferation of sophisticated instruments such as CDOs (collateralised debt obligations) that packaged risks and disseminated them across the financial system. When these trends reverse, we will see a serious test of the quality of loan- and derivatives portfolios and risk management.
6. This shift was the direct result of Regulation Q, that limited the absolute level of interests that banks were allowed to pay on loans, and the availability of large amounts of US Dollars outside of the US after the oil crisis of the 1970s. The Petrodollars that were thus created were not reinvested in the US, but instead lent overseas via London where the interest ceilings in USD funding did not apply. The market for offshore USD funds is known as the Eurodollar market.
This trend has been reinforced
by the rise of loan syndication
and/or bond issuance that has
eroded the one-to-one bank-client
relationship. The desire to spread
risk geographically also meant
that banks were lending further
away from home, and more reliant
on other parties for information.
Combined with competitive
pressures, these trends resulted
in reduced bank access to their
borrowers.
Bank supervisors will ensure that
banks have adequate systems in
place to manage and monitor risk,
but will not tell them what risks
(not) to take. Supervisors have
found many bais weaknesses in
bank risk management.

41
Box 4.2 Structure of credit control mechanisms
In assessing bank credit control mechanisms, regulators focus on the following points:A Credit risk environment
1. Credit risk strategy and significant policies 2. Policies and procedures for identifying, measuring, monitoring and controlling credit risk in all the bank’s activities at the
individual credit and portfolio levels.3. Mechanisms to identify credit risk across all products and activities.
B Credit granting process4. Credit-granting criteria; should reflect the bank’s target market and show a good understanding of the borrower or counter party,
structure and purpose of the credit and the source of repayment.5. Credit limits: should be based on a meaningful aggregation of various types of exposure, and applicable to the banking and
trading book, and on and off the balance sheet.6. Credit approval process, and process applicable to amending (refinancing) existing ones.7. Procedures applicable to non arm’s-length lending.
C. Credit administration, measurement and monitoring8. System for the ongoing administration of credit risk-bearing portfolios.9. Monitoring system for individual credits, and mechanisms to determine adequacy of provisions and reserves10. Internal risk system in managing credit risk.11. Systems and analytics to measure credit risk inherent in all on- and off- balance sheet activity, and risk concentration12. Systems for aggregate credit portfolio quality monitoring13. Ability and extent to anticipate the impact of changes in economic conditions on individual positions and the aggregate
portfolioD. Credit risk controls
14. Independent review and assessment of credit risk management process15. Management of the credit-granting function, effectiveness of internal controls16. Systems to deal with deteriorating and problem credits.
Based on: Basel Committee on Banking Supervision 2000 Principles for the Management of Credit Risk
Central Banks also guard against bank failures providing emergency funding by way of loan discounting. If failure cannot be prevented, most countries have explicit or implicit deposit insurance systems in place to protect depositors and contain damage to the broader banking sector and economy. The cost of an actual bank failure in terms of the economic disruption cost would be deemed higher to everybody than the taxpayer subsidy given when a bank is rescued. The knowledge that banks are too important to fail does skew the risk/return tradeoff, favouring riskier lending practices.
Even if banks do enjoy implicit official protection against failure, it is still in their best interest to maintain a high credit quality on their portfolio. A banks’ cost of funds is affected by the strength of its balance sheet and the quality of its business (relative stability). Normally the credit ratings from the major agencies are taken as a proxy for this strength, and this forms a key driver for banks to guard the quality of their portfolio. However, even at this level the greatest risk to aggregate ratings comes from known exposure to a troubled sector or country, with less weight given to factors on how the individual institutions manage exposure. In October 2002, the first rating agencies started downgrading Brazil’s sovereign credit ratings. Latin Finance (7 March 2003) quotes Diana Adams, Managing Director in Emerging Markets at AMBAC Assurance Corporation ‘All the insurers are worried about taking on additional risk in Brazil because of the risk of credits being downgraded to non-investment grade, even if they are performing.’ This quote deals with insurance companies, but could be equally valid for banks. What it illustrates is that by having portfolio exposure to Brazil, the institution could be downgraded, irrespective of the actual performance of the assets to which the downgrade was being applied.
Maintaining a quality loan book is
nevertheless in a bank’s interest as
strong banks have superior access
to competitive funding.
Bank failures can cause economic
disruption, and authorities will
go a long way to prevent a failing
bank for collapsing. This skews the
risk/return tradeoff for banks.

42
The risk discovery process is
known as due diligence.
4.2 Due diligence
Due diligence is defined as the effort a party makes to avoid harm to another party. Within the context of issues of debt or equity securities, it is the information provided by the issuer of a security and is intended to give information about all risks that could be inherent in its operations. Typical information provided includes legal, operational and financial audits. In a broader context, due diligence refers to the process preceding the granting of a loan, or the issuance of a debt or equity security, and relates to risk discovery in a broad context. The information uncovered and provided as part of the due diligence process is shared between underwriters or participants in an issue, and a portion of this information is included in the prospectus or circular that is used to market the security to investors. All too often however, investors are being given very little time to study the prospectus, and often are asked to make commitments based on incomplete documentation.
When a company lists its securities, it is required to disclose certain information by the relevant stock exchange. The focus of providing this information is risk discovery and identification, and not the regulation of the merit of an issue per-se. As part of a long list of requirements, the Securities and Exchange Commission (SEC) requires that issuers in the overview of their business discuss the sources and availability of raw materials, and whether the prices of the principal raw materials are volatile. The SEC does not set limits for or otherwise proscribe acceptable levels raw material price volatility and other such operational variables, it just requires that the information is disclosed.
Foreign issuers that wish to list their securities with the SEC are required to submit information that needs to be updated on an annual basis. For companies with more than US$ 10 million in assets, and with a class of equity that is held by more than 500 persons, this is done on form 20-F. In subsequent years, the issuer updates this information by filing its annual report on form 20-F, and is not required to follow the standard US format (known as 10-K). Additionally, companies are required to file financial information in the format and with the frequency that they do to their home exchange (this is a current event filing done on Form 8-K). The implication of the fact that the company needs to have a home-country listing underlines the fact that the SEC registration requirements relate to transparency, but that the SEC itself cannot and does not regulate this issuer beyond ensuring compliance with the SEC and its laws governing the trading of securities in the US.
Form 20-F requires the issuer to disclose whether they have a Code of Ethics that calls, inter alia, for compliance with applicable governmental laws, rules and regulations. If the issuer has such a Code, it is also required to disclose how it operates. However, the Issuer is not explicitly required to state whether it is in compliance with applicable governmental laws, rules and regulations. Ensuring that it is, and taking action if it isn’t, is deemed to be the job of the home country regulator. If there is a case of non-compliance, and if this is viewed as being material by the company it would need to be disclosed elsewhere in the form. Clearly, this leaves room for omissions.
Within the context of non-public issues, the due diligence process would still comprise the same risk discovery process, except that some aspects of it would be less formal. The issuer will be required to meet whatever disclosures are needed to provide comfort to the lenders. In practice borrowers would want to deal with the lenders that require the lowest levels of disclosure.
The length of prospectuses can run into the hundreds of pages with every risk factor commented upon. Missing is the consistent reporting of factors that allow for monitoring of these variables as they relate to a company’s operations. In other cases, the prospectus does not focus on analyzing the true source of risk. Barito Pacific is an Indonesian plywood producer that issued equity securities to domestic and institutional investors in 1993. A detailed prospectus covered all
Prospectusses can run into the
100s of pages, but often fail to
address critical information.
The result of the due diligence
process is contained in the offering
prospectus that provides all key
information about the issue, issuer
and industry for potential investors.
For new bond and stock issues, the
due diligence process involves the
reporting of a significant amount of
operational and other information
that allows investors to make
their own assessment about the
company and the merit of the issue
being offered.

43
Table 4.1 Risk factors outlined offering prospectuses of Inti Indorayon Utama (1992) and APRIL (1995)
Inti Indorayon Utama 5.8% Convertible Bond 23 Sep 1992 Initial public offering: 20m shares APRIL 6 April 1995Lead manager: Salomon Smith Barney Lead manager: Salomon Smith BarneyINRU Page APRIL PageOffering memorandum summary 4 Reports to shareholders 3 Terms and conditions of the bond 5 Enforcement of civil liabilities 3 Risks attached to the Global bond 25 Certain defined terms, convension and currency of presentation 3
Prospectus summary 5 Risk factors 27 Risk factors 13
Dependence on government concessions Dependency of company on successful operation of the Riau pulp mill (wood wupply adequacy was <non-reviewed information> 13
Company projects not yet completed Inability to successfully implement expansion plans 14 Competition from related parties Exposure to price fluctuations and other market factors 14 Authorised share capital Substantial international competition 15 Restructions on common share ownership by non Indonesian nationals Dependence on Indonesian Government concessions 15
Expiration of tax holiday Risks relating to Indonesia 15 Enforcement of proceedings Risks relating to China 16
Filing and reporting requirements Penalties for failure to comply with Indonesian environmental and forestry regulations 17
Use of proceeds 29 Control of company, conflicts of interest 18 Exchange rate information 30 Exposure to exchange rate fluctuations 18 Capitalisation 30 Risks relating to swaps and derivative product activities 19 The company 31 Potential restrictions on payments of dividends 19
Introduction 31 Shares eligible for public sale 20 Summary of financial information 31 Absence of prior capital market for stock 20 Results of operations & financial condition 32 Dilution. 20 Products 32 Use of proceeds 21 Production 33 Dividend policy 22 Resources 33 Dilution 23 wood sources Capitalization 24 re afforestation program Exchange rates 26 nursery operations Selected combined financial and other information 27
Sales & marketing 35 Management’s discussion and analysis of financial condition and results of operations 29
Pulp mill capacity expansion 36 Business 42 Construction of rayon plant 36 including:Capital expenditure 37 Wood sources and other raw materials 52 Environement 37 Indonesian Government concessionsManagement and employees 37 Planting programsTaxation 38 Other wood sources
The RGM Group 39 Concession feesSummary share information 41 (other RMs for pulp production)Description of common shares 45 Management 63 Differences between Indonesian GAAP and US GAAP 48 The reorganization 66 Report of Registered Public Accountants 50 Principal shareholders 68 Financial Statements for 1991 and 1990 51 Description of capital stock 70 Unaudited Financial Statements for June 30, 1992 and 1991 67 Shares eligible for future sale 72 The Indonesian Capital Markets 77 Taxation 73 Taxation and Exchange Controls 81 Certain foreign issuer considerations 75 Transfer Restrictions 83 Underwriting 77 Underwriting 85 Legal matters 80 General Information 86 Experts 81
Additional information 81 Index to financial statements F-1 Annex A - Riau financial forecast A-1 Annex B - The Republic of Indonesia B-1 Annex C - The People’s Republic of China C-1 Annex D - Summary of significant differences between Indonesian GAAP and US GAAP D-1
157
The prospectus for the IPO of APRIL shares, written by the same underwriter as Indorayon’s 1992 prospectus contained significantly more information, and was almost twice the length. This did not necessarily reflect improved quality as the 1995 prospectus coolly states that wood supply was non-reviewed information.Source: offering prospectuses for: Inti Indorayon Utama 5.8% Convertible Bond 23 Sep 1992 and 20m shares APRIL 6 April 1995

44
aspects of its operations, but said little about the pulp mill that the proceeds of the offering were to be invested in. The listing prospectus of APRIL identifies the dependency of the company on successful operation of the Riau Andalan pulp mill as a key risk factor. However, the prospectus coolly states that wood supply adequacy (for this mill) was ‘non-reviewed information’! (see Table 4.1)
It is common practise to use external experts for valuation reports, feasilibility studies or industry overviews in conjuction with proposed transactions. Jaakko Pöyry Consulting is with regard to forestry related investments the most common name, whereas Hawkins Wright is frequently used to assess proposed new investments in production capacity. Often, the mere existence of a consultants’ report is taken as a confirmation that all is in order. The pitfalls lie in the scope of these reports and / or the (implicit) assumptions on which they are based. In 2001, a valuation report was prepared for the benefit of publicly listed Singapore construction company Poh Lian that was proposing to (and did) take a stake in the company that ultimately controls what is now known as the United Fiber Systems’ Kalimantan pulp project at Satui. At the time of the acquisition, the tangible assets comprised of a 259,900 hectares forestry concession covered with 75,751 hectares of plantation forest and 44,220 hectares of merchantable timber. The consultant issued a valuation for these assets and another 14,400 ha of more recently acquired land, and based the valuation on the discounted value of timber to be harvested. The assumed harvest volumes in turn assumed that this company was planting 23,500 hectares of plantations per annum and did not even question the ability of the company to do so. Even for a company with ample financial resources, restarting dormant operations and successfully planting 23,500 hectares is a tall order. But because the consultants did not even pause to discuss any pitfalls that might arise in the implementation of these plans, investors would be unlikely to do so either. Indeed, four years later, no additional plantings have taken place, but the same consultants’ report is still quoted by analysts recommending the security to their clients, without even commenting on the implication of the inactivity between 1999 and 2004.
The lack of first-hand borrower knowledge in international loan and bond issues, combined with the greater reliance placed on sector and geographical diversifications as a means of controlling risk have both led to a deterioration of effective credit risk analysis at the borrower level. Careful reading of annual reports on form 20-F or issue prospectuses would have shown up problems for a number of the issuers that went on to become bad credits. Most lenders of bond investors did not make this effort, and traded based on the credit ratings instead.
Despite the poor quality of prospectuses, competition and time pressures are such that when banks cannot get adequate or reliable information needed for a credit analysis, banks may dispense with financial and economic analysis altogether and support credit decisions with simple indicators of credit quality, of which ratings are one. Because credit ratings are widely
Table 4.2 Statements made by Indah Kiat in its annual reports about its affiliated plantation resources
Year Comments on plantation resources/activity Actual pulp capacity1990 none1991 cumulative forest replanting reaches 50,000 ha and will proceed at 20,000 ha per annum1992 cumulative re-plantings at Arara Abadi cover an area of 65,000 ha 380 k tpa1993 HTI covers 75,000 ha, having expanded annually by 20,000 - 30,000 ha
1994 continues to plant trees at Arara Abadi, its 300,000 ha HTI of which 90,000 ha has been set aside as an environmental reserve. About 94,000 already has been planted
1995 Receives the <Green Award>1996 no comment on HTI 925 k tpa1997 no comment on HTI1998 no comment on HTI1999 no comment on HTI
Source: Indah Kiat annual reports. Table extracted from Spek, 2000
Time constraints often mean that
minimal due diligence is done, with
investors making their decisions
on the cost of the issue, the rating
of the issuer and their view on the
outlook for the industry/ country of
operations.
Where relevant, external experts
are called in to value some or a
part of the company’s business or
to express an opinion about the
industry the company is engaged
in. However investors often fail
to read the actual experts’ report
or take note of the scope and/or
underlying assumptions.

45
used by bank regulators as a proxy measure for credit quality, there is a tendency for lenders/investors to use them as substitutes for their own credit decisions.
A low cost source of fibre is at the core of a pulp mill’s competitiveness. Having sufficient information on this score, and of such a quality that would allow a lender to detect a relative improvement or deterioration of the situation is key to conducting an effective credit analysis and/or to make a sound assessment about the ongoing profitability of a company. This makes it key information for analysts of both debt and equity securities.
Determining whether a pulp mill has sufficient fibre from legal sources falls within the realm of due diligence, yet is a key piece of information needed in the credit risk assessment. There is no formal mechanism to do repeat follow-up due diligence exercises once an issue has been launched. If a company lists its shares or bonds on a stock exchange it is under the obligation to file its annual reports (or 20-Fs) with the relevant exchange. The formal due diligence process is only repeated once the company decides to return to the market for debt or equity, but typically the repeat process is significantly simpler as the issuer has a track record in the market, and for many investors, the fact that a prospectus has been produced is deemed sufficient assurance.
A key challenge for credit risk analysis is that much of the operational information that is needed to make an informed assessment of the company’s performance is often not disclosed by the company on a routine basis, making it difficult for the user to identify trends or make insightful comparisons with peer companies. In other cases, the information can only be inferred. Table 4.2. shows the statements Indah Kiat made about fibre supply between 1990 and 1999 in its annual report about the plantations that would be supplying its operations with wood. During this period, the company’s deadline date for fibre self sufficiency slipped from 1994 to 2003, and shortly after to 2007. Today, the company expects to be self sufficient by 2007.
4.3 Ongoing (risk) analysis
The materials available for ongoing risk analysis are annual and interim financial reports, other information released by the company, such as that contained on its website or in a general or investor newsletter, information released by similar companies, industry information and market observations. This can be supplemented with direct contact with the company. Companies will normally take visits from major institutional shareholders, and analysts employed by securities houses and banks. Depending on the country of incorporation and its securities laws, companies are available to all shareholders during its annual general meeting and or other open days. It is also increasingly common for companies to make presentations at broker-sponsored forums.
Ongoing (risk) analysis is carried out by a wide range of institutions, but the work of two groups of institutions is published and widely used in the broader investment community. These are credit rating agencies and security analysts. Both are discussed in turn.
4.3.1 Credit rating agenciesCredit rating agencies have been in existence for over a century, but their importance has grown over the past three decades since they became a formal tool to distinguish among grades of credit in various regulations under US federal securities laws. Credit ratings are also widely used as benchmarks in rules issued by financial and other regulations, investment guidelines for pension funds and other investors. Both the rating and the rating report are inputs into the credit approval and review process of lenders and institutional investors. In the unregulated international bond markets, credit ratings are the primary means by which investors assess the quality of an issuer and individual debt issues.
The work of credit rating agencies
and security analysts is widely
used in ongoing (risk) analysis by
investors and lenders.
Credit rating agencies assign
grades to companies and
securities issues that express the
perceived financial strength of
subject companies. These ratings
are formally recognised by the
government and are incorporated
into various securities laws.
The routine disclosures
by companies are not as
comprehensive as disclosures at
the due diligence stage. This lack
of information complicates the
credit monitoring process.

46
Having a credit rating is a de-facto
requirement for a companies
wishing to issue securities in the
international capital markets.
Credit rating agencies are private companies that are licensed by the relevant capital markets authority to provide credit ratings for companies and their debt issues. A company pays to get its debt rated, and the agency derives additional revenues from selling information about its ratings, as well as ancilliary services, to institutional investors. In the US, two of the four leading credit rating agencies are (part of) listed companies, and the industry is not subject to formal regulatory oversight.
The objective of the work of a credit rating agency is to determine the creditworthiness of a borrower and a specific issue (these can be different, because debt is issued in different classes and will have different security/collateral attached to it). In specifics this means the company’s ability to service its debt, and to redeem the issue on maturity. Each agency has strict guidelines on how the establish these levels, and on how the identified parameters translate into a given rating. A credit rating is typically expressed on an alpha or alpha numeric scale that has about 12-16 gradations. In addition to the credit rating per-se, which becomes public knowledge after issuance, the agency will produce a report explaining the rating. These reports are available to subscribers only.
A major input for credit rating agencies are a company’s financials. It is not the job of the agency to determine whether these financials are correct: the responsibility the financial statements lies with a company’s management; and auditors express an opinion on these statements after ensuring that these statements are presented according to the generally accepted accounting standards of the relevant jurisdiction. What the agency does or should do, is determine a company’s ability to meet its financial obligations, and extrapolate how future developments (debt issues, investments, changes in the industry dynamic) will impact the financial position, and apply their knowledge of developments of the industry that the borrower is engaged in to strengthen their assessment. The rating expresses this ability, and when an agency sees relative improvement or deterioration, it will first signal a revision and its direction (Credit Watch positive or negative) followed later by the revised rating. The agency will also monitor the trend of a company’s financial strength: the financials might show continued profitability with a declining cashflow. It would be the agency’s job to notice this, and to highlight the impact on debt serviceability.
Credit rating agencies base their work on access to a company and its financials, and supplement this with the unique insights they have into industries as a result of consistently tracking large numbers of companies in any given industry across the globe. While they have no superior access to a company as compared to major holders of their debt, they do have a knowledge advantage that is unmatched by individual lenders, and for this reason these lenders feel comfortable to rely on the assessment of rating agencies. Many lenders also do not have the resources to track each credit as closely as might be warranted based on the exposure. For them, buying the ratings reports that provide the background behind the ratings is a more efficient means of tracking the credit. A look at bond-dealers’ price lists show that price, issuer domicile, issue maturity and duration, rating and industry are the key parameters on the basis of which debt is traded.
Lenders are often under time and competitive pressure in making loans, and preference of borrowers prefer to deal with undemanding lenders. A lender who wants to drill down too deeply into a company’s operations and financials is likely to be cold shouldered by the company in favour of a hungrier institution that has more automatic faith in the management; spurning a leading rating agency is not quite so easy. This is a reason why rating agencies provide a valuable service. Credit rating agencies are not free from pressures. A company’s rating and changes therein have a direct impact on the cost of a company’s debt, and/or changes in the traded value thereof. If the downgrade would result in a company losing its investment grade status, the reverberations would be even more serious, as many holders of its debt would be forced to divest it. An example of the importance of ratings applies to Weyerhaeuser when it took on US$ 8 billion in additional debt to finance its acquisition of Willamette. This debt raised its ratio of long-term debt to total capital to 62%. At the time nearly 1,000 public companies had a similar financial structure, but only 47, including Weyerhaeuser could boast a rating of triple-
In actual fact ratings are not as
objective as their legal status
might suggest them to be.
Judgement plays a considerable
role in the rating process.
Ratings are widely used when
investment decisions have to be
made at short notice.
Companies pay the credit rating
agency to monitor it, and the
agency will issue a report when it
changes the credit rating assigned
to a given company.

47
Table 4.3 S&P Rating actions on APP
Date Issuer Issue Guarantee Old rating New rating Comment
1994 Tjiwi Kimia BB
Oct-97 Indonesian sovereign rating lowered
1998 Indonesian sovereign rating lowered
Mar-99 APP has US$9.1bn of consolidated net debt
1H99
07-Mar-00 APP China Group Ltd. CCC+ New rating
07-Mar-00 APP corporate & subsiaries corporate rating CCC+ Affirmed. CW Developing (u/changed)
The ratings reflect the APP group’s aggressive financial profile, heavy debt maturity schedule over the next three years, and exposure to uncertainties in Indonesia’s economic, political, and regulatory environment, which could severely impact its liquidity and fibre supply. These factors are mitigated by low operating cash costs, access to abundant fibre, extensive operational integration, and a diversity of production facilities and end markets. The group’s low-cost operations, achieved through low labour costs, high utilization rates, and its access to cheap mixed tropical hardwood from Indonesian forestry concessions, allow it to compete aggressively in global markets. The terms of licenses to forestry concessions held through affiliate companies, however, could be subject to change, or the cost of fibre may rise, particularly given the current uncertain economic and political environment in Indonesia. Such events could lead to a weakening of the group’s fibre security position for pulp production.
Apr-00 Indonesia restructures US$850m of debt, sovereign rating cut to SD
19-Sep-00 APP announced exchange offer
20-Sep-00 APP foreign currency rating. CCC+ CCC+ Credit Watch Positive
19-Jan-01 Asia Pulp & Paper Finance VII US$500m Convertible notes APP CC
19-Jan-01 APP & operating subsidiaries Credit Watch Developing from Positive
30-Jan-01 APP asked some key suppliers for longer payment terms, has also been late in paying suppliers.
31-Jan-01 Asia Pulp & Paper Co. Ltd. & subsidiaries, finance entities CCC+ Credit Watch Negative
APP, Indonesian Units & APP China Group Ltd. CCC-
01-Feb-01 Tjiwi Kimia misses coupon payment. APP group bonds decline some 20% in price within 24 hrs.
05-Feb-01 Tjiwi Kimia corporate rating CCC+ D missed coupon 1.2
05-Feb-01 APP Group & operating subs except TK CCC+ D
05-Feb-01 APP & related companies B3 Caa3 by Moody’s
08-Feb-01 Tjiwi Kimia Finance Mauritius Ltd. US$600m Sr unsecured Aug-04 D CC belated payment of
coupon08-Feb-01 Tjiwi Kimia D SD
16-Feb-01 APP Finance (II) MauritiusUS$375m unsecured, cum, red pref shares
D missed coupon on 15.2
02-Mar-01 Pabrik Kertas Tjiwi Kimia SD CCC- coupon of 1.2 on US$200m now paid
02-Mar-01 Tjiwi Kimia Int’l Fin. Co. BV D CCC- coupon of 1.2 on US$200m now paid
02-Mar-01 Tjiwi Kimia Finance Mauritius Ltd. CC CCC- coupon of 1.2 on US$200m now paid
12-Mar-01 APP announces debt standstill for holding company and its subsidiaries. Appoints CSFB as debt restructuring adviser
13-Mar-01 APP, Indonesian Units & APP China Group Ltd. CCC- CC Remain on Credit Watch Negative
03-Apr-01 APP & Indonesian Units
Long term local & foreign currency corporate credit and senior debt ratings
CC D missed bond coupon payments on 1.4
02-May-01 Asia Pulp & Paper Finance VII US$500m Convertible notes APP CC D missed coupon on 30.4
19-Jun-01 Indah Kiat Pulp & Paper US$200 m Senior secured due 2002 APP CC D missed coupon on 15.6
19-Jun-01 Indah Kiat Pulp & Paper US$150 m Senior secured due 2006 APP CC D missed coupon on 15.6
Source: contemporary media reports as carried on factiva / Reuters Business Briefing

48
B or higher. This rating was higher than that of Georgia Pacific Co (long-term debt of 68% of capital), and equal to that of International Paper with long-term debt at 52% of capital. Cynthia Werneth, forest products analyst for the rating agency Standard and Poor’s gave the following explanation for this ‘The difference in the ratings revolves around the “strategic opportunity” at Weyerhaeuser compared with its competitors. With the Willamette acquisition nearly completed … Weyerhaeuser will have opportunities to expand markets and cut costs. Georgia Pacific and International Paper are both in later stages of their recent acquisitions and the quick benefits of a merger are behind them’ In its discussions with Standard and Poor’s Weyerhaeuser indicated it would rely on cash flow to pay down debt (as opposed to selling assets). The rating also assumed that ‘Standard & Poor’s does not anticipate meaningful additional acquisition or share repurchase activity within the next two years’ [Jones, Dow Jones Newswires 19 February 2002]
It is thus seen that the assessment of credit rating agencies is very important. For this very reason also, agencies are reluctant to give ratings that anticipate, or that could be controversial. Ratings have therefore become more of a lagging than a leading indicator, and the agencies consistently fail to sound adequate warnings before corporate failures. A US Senate investigation on the rating agencies’ work on Enron found that their work ‘fell far below the careful efforts one would have expected from organisations whose ratings hold so much importance’ (Kanjorski 2003). Ratings reports also show that the agencies implicitly trust what companies tell them, and will not double check that information. Rating agencies may be viewed as independent and without conflict of interest, but this does not necessarily mean that the quality of their work is always of the highest level. In many cases, this is a function of the diligence of the individual credit analyst. Table 4.3 shows how APP company ratings changed in response to, rather than anticipation of key events.
Opinion also has a role in ratings. Following the Argentinian default in 2002, many Latin American borrowers faced downgrades. (Latin Finance 10 August 2002). Clearly, these are ex-
Box 4.3 Rating agencies and fibre sources.
Standard and Poor’s website lists the rating criteria that it applies to its ratings. These are general criteria, and mention that for specific industries (pulp and paper is mentioned), other factors may be taken on board. Standard and Poor’s has not responded to CIFOR’s queries on how they deal with the evaluation of woodfibre supply for pulp mills. Part of the answer may be gleaned by reading the Standard and Poor’s rating report that Aracruz posted on its website in 2003.
This report states that Aracruz controls 100% of its fibre needs, even though Aracruz, in its 20-F of 2002 writes that ‘during 2001 and 2002, we were able to meet almost 65% of our wood fibre requirements from our own eucalyptus forests’ (p 19) On page 27, the company further clarifies that it obtained 6.2 million cubic metres from its own eucalyptus forests, and that 2.2 million cubic metres. were purchased externally. Of this amount 905,000 cubic metres were bought through its Forestry Partners Program, effectively reflecting a source of captive supply. However, even if the Forestry Partners Program is deemed to be a controlled source (look at palmoil in Indonesia and it will be apparent that this assumption might not always hold up), this translates into 85% control over raw materials. The Standard and Poor’s report states that because of the access to wood grown by Veracel, Aracruz has sufficient fibre to feed Fiberline-C, but does not deal with the question what happens in 2005, when the wood supply agreement with Veracel runs out, and Veracel’s own mill will start production. Aracruz in its 2002 annual report mentions that it needs an increase in its forest base of about 72,000 hectares of eucalyptus plantations to meet the demand for Fiberline-C. Implicit in this number is that the company expects annual mean annual increment of 56 cubic metres per hectare over the entire 72,000 hectares if it is to obtain sufficient fibre. This number (56) is higher than what the company is currently getting. Standard and Poor’s does not deal with these issues of fibre supply, nor do we find these discussed as a risk factor. The section on risk factors in Aracruz’s 20-F is extremely comprehensive, and even analyses the risk of terrorist events such as 9/11. With respect to plantations, the risk factors identified are: [1] changes in laws limiting the extent of land the company can own, and [2] overall statal restrictions on planting. The risk of disease in its clonal plantations, or a slowdown in the mean annual increment are not addressed, nor is there any direct mention about the risk of starting Fiberline-C without secured fibre, even those though these factors would be more critical to the direct operations of the company than 9/11 like events are. These factors are also less evident to an officer in charge of general credit than terrorism-related disturbances are. The rating agencies do little to put this straight.
Ratings and changes therein have a
material impact on the cost of debt
for a company. For this reason, the
rating agencies tend to be cautious
in changing ratings. In actual fact,
ratings are more of the lagging as
opposed to leading indicators of
company financial strength.

49
post changes with no predictive value, as the debt of the affected countries would have been sold off ahead of the rating change in line with the higher perceived risk by the market.
4.3.2 Securities researchSecurities research does not constitute due diligence or a risk assessment exercise per-se. Securities research is published by stockbrokers or banks as a service to their clients who deal in the securities discussed in the reports. The best research correctly anticipates how a security of a company will perform in the future based on a sound analysis of the company, its industry, and what changes are likely that will impact the earnings of subject companies. Thus the narrow value of research lies in the analysis provided, the investment recommendations made and the ability to enhance the decision making process of the investor. The broader value lies in the information flow provided by a number of (one hopes) competent and intelligent observers of an industry who spend significant amounts of time tracking companies and should thus be intimately comfortable and familiar with their operations. Securities research is also widely read by banks and other groups of investors, who use it to be updated both about the industry as well as about individual companies. This explains its inclusion in this discussion of credit risk analysis. Research can relate both to existing debt issues or the equity that are being traded in the secondary market.
The process by which securities research is produced is more flexible than the process underlying credit ratings. Industry ethics as expressed by Code Of Ethics and Standards of Professional Conduct of the CFA institute demand that investment recommendations have a ‘reasonable basis’ (Standard IV, item A 1). They do not prescribe what information has to included in a report; this is left to the best judgment of the analyst – rightfully so. The best research calls come from a deep insight and understanding of the industry combined with a thorough understanding of the market where the security is traded, and can be made in a very concise report. There is no requirement that an analyst publish reports with a given frequency nor that these reports need to cover all aspects of a company’s operations (although sometimes they do). Securities research can thus be useful as one source of input, but it cannot replace the need for a lender or investor to conduct its own due diligence.
Research is a key differentiating factor between brokerage houses, and a major pull factor in attracting clients, alongside such factors as broadness of coverage across industries and countries, placement power (for primary business, i.e. the selling of debt or equity newly issued by a company to investors) and execution (for secondary business, i.e. the trading of debt or equity issues after these have been placed for the first time). A number of financial publications organise formal rankings of brokerage houses and their research based on client polls. Achieving a top ranking is often an explicit business goal of brokerage houses, and can be stated ahead of actually being profitable. The thinking here is relative: broking and underwriting revenue flows can be highly cyclical, but the house with the highest ranking is likely to get a larger share of the pie.
Just as an analyst can make recommendations on a given company, the analyst can also make recommendations for a specific industry. This is particularly so when the key determinants for profitability are industry-wide as is the case for commodity producers. Pulp producer A may be more competitive than pulp producer B, but both companies profitability trends will be influenced by the same major factor: the price of pulp. For such companies the first decision is whether or not one wants to be invested in pulp. The next decision is then which company’s stock to buy, and up to what price.
In keeping with the investment characteristics of the sector, most research on the pulp sector is published as industry wide research, and its objective is to keep a pulse on the aggregate market by looking at product pricing trends, and updating stock valuations, or simply by reporting
Securities research is published by
brokers as a source of investing/
trading ideas for thei clientele.
Securities research is also widely
read by banks and other groups of
investors, who use it to be updated
both about the industry as well as
about individual companies.
Industry ethics demand that
investment recommendations have
a reasonable basis, but otherwise
there are no formal requirements
for securities research.
Industry journal run rankings on
the quality of broker research, and
research plays a role in winning
mandates.
Securities research can be
company or sector specific. For
pulp, sectoral considerations are
key in the investment decision
making process, and this is
reflected by the dominance of
sector over individual company
research.

50
industry relevant news snippets. Company specific pieces accounted for less than 15% of 1,585 items retrieved when searching the First Call electronic database that is widely used by the investment community for research on the forestry sector (including logging, pulp and paper, and plantations) published between 1 July – 31 December 2003. The vast majority of company specific items are short notes on earnings. All of the former count as maintenance research. Value added research, that delves deep into sectors and companies accounted for an estimated less than 2% of the total amount of research produced during the period.
We saw above that the focus of pulp sector research is sectoral, rather than company specific. The key drivers of profitability – pulp prices and sector-wide capacity utilization – affect the entire sector. Corporate profitability is, however, also influenced by costs, and when a number of Latin American and Indonesian companies started issuing securities they attracted ample attention. These companies operate in countries where wood costs are 50% to 35% of their developed markets competitors. Such competitive advantages make a compelling investment case for holders of debt, though high interest charges typically dilute much of the cost advantage to the shareholders of the company. The low cost base of these companies has consistently been one of the major drivers for investors to buy the stock of developing country pulp producers.
Given the key importance of fibre supply to cost competitiveness, it is surprising to find that only 7 documents out of 1,585 relevant publications issues between 1 July – 31 December 2003 explicitly dealt with this issue. These 7 documents contained 13 references to fibre supply. In all instances these were reactive: the analysts wrote about it, because fibre supply affected the company’s expected earnings at that point in time and because the companies themselves raised the issue. The specific instances involved fibre shortages in the US North East (January 2004) and US South (September 2003) and their impact on pulp prices, the impact of fires in British Columbia on fibre supply (August 2003), expected declining production costs once wood supply self sufficiency would be achieved (results conference call of Aracruz October 2003), higher cash costs due to increased wood supply costs resulting from additional purchases of third parties (Votorantim, November 2003), and restructurings of Stora Enso’s forest holdings (December 2003).
It is more difficult the find a reference to fibre supply without this being in direct reaction to some news item. Such a reference was found in the January 2000 Brazilian Paper and Forest Sector review published by J.P. Morgan. The 133-page report initiated coverage of the pulp and paper sector and discussed three companies, Aracruz, Klabin and Votorantim, and carried on average 25-pages of information per company. A close analysis of this information, however, quickly showed that the information provided was the information that could be obtained from the company, but that no effort was made to comment on areas where information was not provided. The section on Aracruz detailed its land holdings and planted status of its plantations, the improvements in harvests per hectare on the one hand, and the reduction in the use of fibre per tonne of pulp on the other. But we read nothing about the actual cost of this plantation fibre. The report on Klabin again detailed landholdings, but did not comment on how the company meets the fibre needs of one of its entities, Bacell, that according to Klabin’s own admission needed to source fibre externally. For Klabin we get no data on average annual growth rates, or fibre consumption per tonne of pulp. Comparing these numbers against Aracruz would be interesting, both to see how the plantations of the two are different in absolute terms, and to what extent one is catching up with the other. The final report on Votorantim makes no mention on fibre supplies at all. This again shows that the analyst produced information that was available, but made no effort to test the claim of the low cost fibre.
Analysts have access to the management of a company, and are in a position to ask about fibre supplies or other factors relevant to the company’s operations and financing, but do not appear to do so. Even if a company might not answer as such information is non-public, the analyst might still try and piece the fibre supply picture together independently. This did not happen.
Much company specific research
takes the form of short notes on
earnings, and comprehensive
reports on individual issuers are
rare.
Securities research can fail to
address key drivers of operational
success. It was accepted as
a matter of course that Latin
American and Indonesian pulp
producers had a competitive cost
base, and fibre supply would only
feature in reports if this at a given
point was in the news.
Industry analysts pay scant
attention to fibre costs and
supplies despite the key
importance that fibre plays in cost
competitiveness.

51
This is not to say that the analyst in question did a poor job: this report was by far one of the most comprehensive introductions to the Brazilian pulp industry that we have seen published over the past five years. What the report does show, is that analysts deal with information that is (relatively) readily available for them. If one were to look at plywood sector research produced by the same broking firm at the same time in Malaysia and Indonesia (actual example is WI Carr), there would be a consistent view on the development of the plywood price, but the discussions of the sectors in each of these countries would not cover the same ground. In Indonesia, the research (whether by this broker or a sector piece from another broker) would typically include the description of the sector – the available forest resources and annual cut – but this information would not be included in the Malaysian report because in that market these statistics were not so readily available. That the statistic is quoted does not reflect that the analyst viewed this as necessary information and therefore provided it, than that the analyst had the statistic at hand, and therefore included it. In the former case, the analyst, or the common research director overseeing efforts by both analysts, would have wanted to make sure that the analyst for Malaysia also tried to estimate these statistics for Malaysia, and think about how they would affect the sector call.
Given the crucial role that fibre supplies have in pulp production and its costs, one might expect analysts to pay some attention to both availability and cost. As it is, this is not happening, also because equity does not value forest holdings in the way that, for instance, oil and gas and mineral reserves are integral to the valuation of energy and mining companies. At present, the implicit assumption is that there are ample fibre supplies so that their availability nor cost need serious contemplation, and only temporary disruptions in this otherwise stable supply merit notice. The starting of a trend by European producers (Stora Enso and Mreal) to sell their forest resources off to pension investors might change this.
4.4 Corporate disclosure
Corporate annual reports and websites are a key source of information of creditors and analysts. Companies are under the obligation to publish audited financials, but there are no formal standards governing what non-financial information companies report about their operations (although this is beginning to change, see Chapter 5 below). Relevant information here would be production capacity, and actual production and sales volumes and prices received for each product line, as well as consumption volumes of key raw materials and energy, and labour statistics. In the case of a pulp producing company, this information should comprise an accounting for log consumption and log sources. This information, some of which may be found in a thoroughly compiled prospectus, has a place in annual or periodic reports, yet is not always reported, and when it is, the format from year to year might differ.
Lenders can require that their clients make key information available, but not all companies are necessarily willing to provide the detail required, and for large syndicated credits it is fair to say that information disclosed in annual report and to the markets by way of the website or periodic releases is all that a creditor will ever see. In many cases, companies will be extremely reluctant to provide any additional information, either for competitive reasons, or out of fear of running into problems with regulatory authorities for being selective in the disclosure of information.
We anticipate that reporting standards will evolve significantly from here, following the launch of the Global Reporting Initiative (GRI) in 2002. The GRI is discussed in more detail in the next chapter.
Longer reports can contain a
lot of information, but this is
typically information that is readily
available. There is less evidence of
analysts drawing up a schedule of
relevant information, and trying to
piece together this data as well as
is possible.
The growth in popularity of the GRI,
along with a movement for higher
disclosures is likely to result in
improved reporting in the future.
If companies do not want to
release operational information,
they will shun lenders who
demand it, settling instead for less
demanding lenders.
Corporate disclosure has typically
taken the form of the financial
results of its operations, because
this is required by financial
regulators. The understanding
of these data could be enhanced
is supplementary information
about operational variables were
available but there are no formal
reporting requirements for this.

52
4.5 Conclusion
The risk assessment and due diligence practices of banks are not in themselves sufficient to identify poorly performing or unsustainable pulp producers. While extensive due diligence may be conducted, it does not result in financing being denied when weaknesses are found. The more usual approach is to look the other way and de-emphasize the weak point in question. In many cases critical risk factors are not addressed.
Financial institutions take a portfolio approach to risk management where sector and country allocation take precedence over individual issuer analysis. Issuer strength is critical with regard to loan pricing, but this is typically assessed based on credit risk ratings that are given by rating agencies.
Owing to disintermediation and competitive pressures, lenders and investors do not have access to unambiguous and relevant data about their investee companies that would allow them to make a more detailed credit assessment at the company level should they want to. Work of the parties who do monitor companies and industries on an ongoing basis, such as credit rating agencies, similarly does not provide evidence that they proactively and effectively track key factors influencing the company’s competitiveness, and make an effort to obtain or estimate these data where they are not given. The work also reflects a high level of reliance on information provided by the company, and little independent investigation into areas on which the company is silent. In such cases, when problems come to the surface, the damage will already have been done, and the credit downgrade that follows is reactive rather than predictive.

Since the late 1990s commercial banks have taken greater responsibility for their lending actions by integrating social and environmental considerations into lending policies that were previously guided by economics alone. This was both an expression of Corporate Social Responsibility and a response to criticism by green parties and non-governmental organisations (NGOs). Initially, banks adopted corporate values and business principles, that in some cases later found expression in explicit do-no-harm policies. In 2002 a large number of commercial banks took a step further, by proactively drawing up a code that would govern their project finance activities. This code is the Equator Principles.
5.1 Equator Principles
The financing of the proposed Chad-Cameroon oil pipeline was the direct catalyst for the formulation of the Equator Principles. A bank that was bidding for a lead role knew that participation would invite a barrage of criticism from various parties, and on the other hand realised that turning the business down would be handing the mandate to a less scrupulous competitor. This dilemma was shared by a number of banks, and as such the concept of creating a level playing field by way of formulating a code of financing principles found rapid acceptance. In order to ensure the impartiality necessary for broad acceptance, the IFC was approached as a knowledgeable third party. This was a logical choice: the IFC combines practical project finance experience with the application of standards that have evolved over more than 20 years to take account of changing notions of development and of how to effectively apply such standards to commercial, rather than concessionary loans or development grants. The speed with which banks and even ECAs are now signing up to the Principles is indicative of the need that they meet (Lazarus 2004).
The Equator Principles are an industry approach for financial institutions in determining, assessing and managing environmental and social risk in project financing. The signatories of the Equator Principles have committed to only finance projects that meet World Bank /IFC industry standards, and if the project is located in a developing country, IFC safeguard policies are also applied. Based on the Equator Principles, potential projects will be classified based on the environmental impact. The classification guidelines follow those of the IFC, and dictate what safeguards have to be followed, for which detailed sector-specific policies are then available. Projects that fail to meet the Safeguards will be denied financing.
The Equator Principles apply only to a small portion of total funding extended to pulp sector, because commercial financial institutions typically finance pulp projects with structures that do not count as, and are not subject to the same screening processes as project finance, such as a Eurobond issue. The Equator Principles are nevertheless highly significant, firstly, because
5 Impact assessment and safeguards
Lacking the experience to
formulate lending guidelines, a
plurality of commercial banks
worked with the IFC to develop a
code that would guide their cross-
border project finance activities.
This code is known as the Equator
Principles, and is continuing to
gain in popularity.
Banks have begun to incorporate
social and environmental
considerations into lending
practises that used to be guided by
economics alone.
Project finance accounts for only
2.8% of developing country pulp
mill financings, and for this reason
the Equator Principles have a
negligible direct impact on shaping
pulp mill investments.
The Equator Principles apply to
project finance.

54
Box 5.1 Signs of success for the Equator Principles
• growing share of project finance transactions are Equator Principles compliant• project finance transactions show a rising quality standard.• the capacity of banks to assess the non-economic impact of their transactions independently is growing.• Positive cost/benefit ratio
they were initiated by banks as a pro-active move to adopt safeguards, and secondly, because bank experience with them is likely to determine whether, how and what speed their application could be extended to other areas of lending. For pulp this is extremely relevant because pulp is relatively untouched by project finance, even at the initial project stage. The ultimate goal is to ensure that a growing percentage of all (in this case) pulp production is sustainable, not just that fraction touched by project finance.
The principal motivation of the banks to forge the Equator Principles, or to join the initiative, is to have a standard by which they can assess their project finance operations, and know that provided these standards are followed, their financing actions will not become subject to negative publicity. At the same time, these standards create a level playing field among banks, and with the number of signatories growing, significantly reduce the risk of lost business as a result of applying high lending standards. Properly implemented, the Equator Principles also come with critical benefits, such as higher project quality, and a greater information flow, both of which directly benefit the credit assessment process. For banks, the Equator Principles will have been successful if their implementation does not lead to a loss of business, if the repayment performance of the loans is higher than average, and if their role in project finance transactions in developing countries invites less criticism as a result. The Equator Principles will have been successful if progressively more financing transactions adhere to them. Nobody wins if the Equator Principles only succeed in moving business away to less scrupulous financiers or different markets whose players have not committed to the Equator Principles, and this is why it is important to get as broad acceptance for the Equator Principles as possible. The majority of commercial banks active in project finance have already signed up, with the first MDBs and ECAs now following.
The experience of Equator Principles signatories is key to progress in implementing the safeguards across other lines of business. The press releases issued by the signatory banks and posted on the Equator Principles website give insight into their motivations for signing, and in some cases also reveal what they hope to gain from it. For the majority of banks, the Equator Principles are one way of giving recognition to environmental and social issues in business conduct. For these banks, the Equator Principles fit within the broader framework of Corporate Social Responsibility, and are a way to achieve progress ahead of legislation. Another attraction of the Equator Principles is that they are both a practical approach grown from actual banking experience and a common framework to address the issues than can arise in the sensitive business of project finance in developing countries. HVB Bank made its commitment ‘based on the conviction that sustainability not only acts as security for our basic life, but is also an important driving force behind corporate value. Sustainability creates new growth and earnings potential, reduces credit risks and optimizes work flows’ and also sees the Equator Principles as a form of promoting transparency in business dealings. Credit Lyonnais welcomed ‘the adoption, over time, of meaningful, internationally recognised standards in this respect to the benefit of stakeholders in project companies worldwide.’ This reflects concerns that it is, as an institution new to incorporating sustainability and environmental concerns into its policies, and will need time for effective implementation. Post Equator Principles mistakes could invite even sharper criticism, as the case presently with Equator Banks being criticised for not warning the World Bank to adopt the recommendation by the Extractive Industries Review. Aware that success of the Principles also hinges on maintaining an active stakeholder dialogue, signatories to the Equator Principles initiated a dialogue with leading international NGOs in July 2004, and inaugurated a joint working group at the same time.
The EP would have been
successful if a growing number of
transactions are governed by them,
and if these transactions result in
higher quality projects than would
be otherwise achieved. Failure
would mean that the EP result in a
loss of business to less stringent
lenders, with overall lower project
standards as a result.
Positive lender experiences with
the EP is critical in getting broader
application of safeguards across the
banks’ entire portfolio of business.
Banks look to the EP to define
consensus quality that will be
recognised by all stakeholders.

55
Because the banks themselves were the driving force behind the Equator Principles, they want these to succeed. (a more cynical view might be that the Equator Principles are a green-wash for business-as-usual). We also recognise that in spite of this desire, the road to effective implementation will be bumpy. Banks will have to deal with institutional and capacity constraints, yet they have to recognise that they have to start taking responsibility for implementing the safeguards, rather than delegating this responsibility away.
There is a difference between the will and the ability to do something. Even where banks as institutions have signed up to the Equator Principles, implementation will only be effective when employees are encouraged to focus on the implementation process. Down the line, there will be managers hungry for business who view the Corporate Social Responsibility Department as another cost center eating into their bonuses. These managers are unlikely to encourage their staff to properly implement and monitor the Equator Principles, and will be glad when this responsibility can somehow be delegated away.
Box 5.2 Potential issues arising with Equator Principles implementation
In implementing the Equator Principles, the following issues can arise:• Given that the perfect project does not exist, compromises will have to be made. The IFC often does this in cases where it deems a
project to be a positive net beneficiary. Real life consists of compromises, but when external forces decide what values should be compensated for what benefits, it is possible that the relative order of importance of the values differs.
• Application of the Equator Principles at present demands that all financing meets all standards, and has no room for Corrective Action Plans. We recommend defining generally accepted practice and minimum accepted practice per sector (see Global Reporting Initiatives section below) and stipulating that Corrective Action Plans can only apply to raising generally accepted practice to best practice, while not allowing any criteria to be below mimum accepted practice
• The effective implementation of Corrective Action Plans requires considerable in-depth knowledge of industries, social and environmental issues, in addition to monitoring capacity. Commercial banks, and for that matter, ECAs, do not have this capacity, possibly with the exception of having industry experts. The Corrective Action Plans do not require them to make an individual judgment, and thus it will come to pass that the assessment of the IFC, seen as vested with superior environmental creditials, will be accepted as final.
• Sponsorship of the Corrective Action Plans will in most cases give the IFC a final say in what constitutes a clean environmental bill of health. In a perverse way, this could lead to a declining, rather than an inproved quality of due diligence. The participation of the IFC will, in the eyes of many bankers, result in reduced loan risk, because of the perceived leverage emanating from its multilateral status.
5.2 Safeguard implementation
The safeguards that the Equator Principles apply to their investments are those of the IFC. At the IFC, these standards have evolved over more than two decades, and draw on almost half a century of cumulative experience. The IFC categorises investments according to their socio/economic impact, and applies screening accordingly. Sensitive and irreversible investments (category A) are subject to the most extensive screening, followed by manufacturing investments with an environmental impact (category B) (See Appendix III). Category C investments are deemed to have no environmental impact and are not subject to screening. For the purposes of IFC’s classification system, a pulp mill is considered category B. Given the broader impacts of pulp mills especially in the newer production countries, it might be useful to revisit this classification.
Even at the IFC, properly integrating safeguards into their operations is still a challenge. As recent as 1991, many of its loan officers were unaware of lending safeguards, and those that were aware often saw them as one more hurdle to doing business. In a survey done in 1991, many were found to not even be aware of them. Investment officers that were aware of the safeguards often saw them as one more hurdle to doing business. Ten years later, significant progress was achieved, but actual performance still left room for improvement. A review of the IFC’s safeguard policies found that ‘the accountabilities that exist within IFC to date do not reinforce the message
Banks also need to give thought
to how to take responsibility
for effective implentation of the
EP. Blind reliance on third party
assessments will not result in the
institutional capacity development
necessary to internalise social and
environmental risk assessment
into decisionmaking. Yet this is an
essential ingredient in EP success.
As a result more than 40% of
the IFC’s investments approved
between 1994-96 failed to meet
their development objectives.
The IFC has worked with safeguards
for more than 15 years, but they
still have some way to go in
fully internalising them into the
investment decisionmaking process.

56
from the top that the Safeguard Policies and their values are everybody’s business, regardless of whether they are a staff or manager’s function.’. [Compliance Advisor/ Ombudsman 2003]
The IFC’s own Operations Evaluation Group reviewed 56% of investments approved in 1994 and 1996, and that were in a stage of early operating maturity. It found that 40% had a high development outcome and a high financial return, 17% had a high development outcome with a low financial return, 10% had a low development outcome with a high financial return, and 33% of projects were unsatisfactory both from a development and a financial standpoint. The projects reviewed were initiated about a decade ago, and to assess a more recent performance we turn to a more recent review.
In 2003, the Compliance Advisor/Ombudsman published a review of the IFC’s Safeguard Policies. This review found that sponsor commitment was key to successful implementation of safeguard policies. Other critical determinants of success were ‘teamwork between investment, environmental and social staff, clear communication with the sponsor and a strong and enforced national regulatory framework’. The Compliance Advisor/Ombudsman notes that ‘because the sponsor is key… assessing commitment and capacity on environmental and social issues should be a fundamental aspect of investment departments’ due diligence of a prospective sponsor’. The report finds weaknesses in the Environmental Assessment, and recommends improved quality control. In terms of the safeguard policies it finds a lack of specific objectives, weak project monitoring and supervision and poor integration of safeguard policies into IFC’s core business. It recommends that safeguard policies state explicit goals and targets, report on them and demonstrate accountability for achieving them or not.
The Compliance Advisor/Ombudsman’s recommendations are currently being reviewed, and are expected to result in refined policies and guidelines early 2006. A source close to the IFC who read this report in a private capacity expected that the new procedures would go a long way to improving the IFC’s handling of environmental and social issues, without however going as far as commenting on the nature of the changes. It is to be hoped that at least some of these focus on how Environmental Assessments are being produced and used. In the Equator Principles (and elsewhere in the ECA/MDB universe) the responsibility for the Environmental Assessment continues to lie with the project sponsor, leaving the risk that a poorly committed sponsor serves up an Environmental Assessment that is of poor quality. This is a key weakness given the Environmental Assessment’s role as umbrella policy for Safeguard Policies. The Equator Principles sets the scope for the Environmental Assessment, but covering a topic in general terms rather than specifics is still accepted practice. Nor is there evidence that the Environmental Assessments are subjected to a truly critical review by qualified staff in the lending organisation, or that implementation is conform the Environmental Assessment. The criticism that the safeguard policies lack explicit goals also remains true (eg. IUCN/WWF 2001). The Equator Principles require monitoring and measurement, but seem content to have this done by external review. While not dismissing the value of an external reviewer/auditor, this should not relieve the sponsor and the team responsible for drawing up the safeguards of the responsibility to measure performance against clearly stated goals, and to act on it. Moreover, setting clear targets, and measuring actual performance will result in a tangible benchmark of what best practices are, and at what rate progress is being achieved. This is particularly true where projects do not meet all standards from day one, and where non-financial conditionality clauses are a part of the loan.
The IFC has environmental and social experts on staff. As such, the problems lie in effectively integrating them into the investment process to make sure that recommendations are taken on board at an early stage of structuring a project and not as an afterthought. Banks and ECAs have no such experts, and all will gladly defer to a syndicate member with superior environmental credentials. We quote Johan Mowickel, Assistant Director General at Norway’s Garanti-Instituttet for eksportkreditt (GIEK): ‘When support is already offered by the World Bank, Norad or some other organization with strong environmental credentials, GIEK will not question the conclusion
The shortcomings of current
safeguard implementation should
be realised by other lenders who
look to the IFC for leadership if
disappointment down the road is to
be avoided.
Clearly defined goals and targets,
for which the sponsor takes
outright responsibility can enhance
the quality of the EA.
The sponsor-commissioned
Environmental Assessment directs
safeguard implementation. Many
EA are very general and not subject
to critical review by lenders, so that
they fail to realise the objective for
which they are compiled.
A more recent internal assessment
of safeguard implementation
still found weaknesses, but also
stressed that sponsor commitment
to successful SP implementation is
critical for success.
Lending institutions need time
to develop in-house capacity to
assess social and environmental
impacts. The ultimate challenge will
be to ensure that higher standards
translate into higher project quality.

57
Box 5.3 Limitations of Environmental Assessments: Estonia Cell and Metsä-Botnia (Uruguay)
Estonia CellEnvironmental Assessments can be made with serious omissions. An example of this appears to exist in the case of the Estonia Cell pulp project. Estonia Cell are proposing to erect a 140,000 tonne Bleached Chemi Thermo Mechanical Pulp mill. It will be the first new pulp mill in Estonia since the 1960s and is expected to stimulate exports by way of adding value to local raw materials. The turn-key contractor is RWE Industrie Loesungen (Germany) and the main equipment supplier is Andritz (Austria). The total project cost is Euro 165 million of which the EBRD will provide Euro 19 million by way of taking an equity stake and providing a subordinated shareholders’ loan. In this case the Environmental Assessment appears to overlook critical issues with regard to fibre supply.
The estimated fibre consumption of a 140,000 tonne pulp mill is 560,000 cubic metre per annum. The project documents for Estonia Cell state that the fibre needs of the mill will be met from Estonia’s 115,900 hectare of aspen forests, that have a reported annual volume increment of 800,000 cubic metre At first sight, this appears ample. However, the project documents do not clarify what other demand there is for these resources. Given that Estonia presently only has one kraft pulp mill (using long fibre), there might be none. This assumption, however, counts without exports. Pulp and Paper International (August 2000) quotes Mr. Johnson, the Managing Director of Larvik Cell, Estonia Cell’s Norwegian shareholders: ‘“Estonia has an abundance of aspen wood and the country’s only existing pulp mill produces unbleached kraft and runs on long fibre. There is no outlet for aspen.” Johnson pointed out that Larvik Cell’s pulp mill in Norway already runs on aspen sourced in Estonia.’ This shows that despite there being ‘no outlet for aspen’, the fibre is already being exported to Norway. The impact of illegal logging is equally ignored, despite there being widespread evidence of extensive illegal logging in the Baltic and Russia (WWF Latvia 2003) Finally, the study does not appear to deal with the impact on fibre demand by proposed other mills.
In the course of the review process, the Estonian Fund for Nature has insisted on the use of FSC certified wood, and according to the latest project documents (April 2004) this is now being included as a condition. Verifying wood sources is nevertheless not part of routine monitoring. Monitoring focuses on water levels, emissions and the condition of flora and fauna in the vicinity of the mill. If the certification requirement is in practice upheld, the project will have the additional benefit of acting as a catalyst for the development of a market for certified fibre. But the fact remains that had it not been for Estonian Fund for Nature, the issue would not have been properly dealt with.
Metsä-Botnia (Uruguay)Metsä-Botnia Group subsidiary Botnia S.A. is proposing to build a 1m tpa pulp mill in Uruguay. It has applied for funding to the IFC, and supplied an environmental impact assessment as part of this process. The project information was disclosed on April 20th, 2005, and the investment will be proposed to the Board on June 23, 2005.
The June 2004 Socio-economic study of the impacts of Botnia S.A. pulp mill project in Uruguay provides a review of the macro and micro impacts of this mill. The table of contents of the 132-page report is produced in Appendix IV, and the report even includes a commentary on the methodology followed to model the impacts of the pulp mill. The report, while apparently comprehensive, does not not provide clarity on a number of critical issues, and falls far short of what a proper assessment of the mill should consider. The following paragraphs highlight three concrete examples of where the analysis in the report is insufficient: forestry, land use and traffic impact.
Forestry The company is proposing to establish a 1 million tonnes per annum pulp mill that will obtain its wood supply from sustainably managed plantations. The report does not clearly show from where this fibre will be sourced, and how incremental plantation land has to be planted to meet in this demand. The report does state that some of this (eucalyptus) wood will be obtained from Compañía Forestal Oriental S.A. (FOSA) of which Botnia is part-owner, while the balance will be sourced externally. According to the report, the mill will have an annual fibre demand of 3.5 m cu.m. that we assume refers to debarked volume. The plantation stands of FOSA were 31,754 ha as at 2004. In the same year, there were two more certified plantations with stands of 13,059 ha and 5,040 ha respectively. The report gives no information about the productivity of these plantations, however there is mention of fungal attacks of the eucalyptus, implying less than optimal productivity, and a problem to be tackled. Even at optimal production, these stands are insufficient to meet future wood demand. The total amount of plantations in Uruguay is given as 575,000 ha, but this is nationwide, and not restricted to eucalyptus. Charts of future fibre supply meanwhile show that ample resources will be available, presumably by assuming that wood can be imported from adjacent Argentinian provinces that have about 330,000 ha of eucalyptus plantations. The report nevertheless concedes that there is a fibre deficit, and in the section on woodharvesting states: ‘As of the present wood volume, by the turn of the first decade, the apparent shortage of wood resources will be covered with the wood coming from plantations established from 2003 onwards.’ In the

58
section on recommendations, it states (and this is quoted literally) ‘Foster investments if present harvesting technologies are limiting considering the available wood.’ Clearly, this recommendation is too vague to even be of use. There is no discussion about what the impact would be if the necessary investments in plantations were not made, nor what would happen if any of the other mills that are on the drawing board were to be realised. The fibre deficit is not even mentioned in the summary and conclusions that also does not make mention of any of the concerns of the surrounding population.
Land use If the mill is to obtain its fibre from sustainably managed plantations, more of these will have to be established. This is conceded by the report. The report does not provide a meaningful analysis of how the establishment of these plantations would impact land used by the current economic activities of the population, such as agriculture, cattle farming etcetera.
Infrastructure The report discusses traffic loads and infrastructure. The point is made that road maintainance is the responsibility of the Road Directorate where it concerns national roads, and the municipality where it concerns other non-forest roads. The analysis for Rio Negro shows that the cost for this municipality will be US$1m p.a. but this is balanced against US$1.4m in inflows. The report is silent about the cost of road maintainance in the other two departments (as Uruguay’s states are referred to) through which wood will be transported, but that derive little taxes from the mill.
The traffic volume generated by the wood transport is calculated to be 20% of the magnitude of long-distance trucking traffic to and from Montevideo. But because this traffic will not be going to Montevideo, there will be no overburden. This is painting an overly optmistic picture. The daily transport of 10,000 tonnes of wood necessitates 324 trucks that make 1.5 round trips a day. So, on certain stretches of road close to the mill there will be incessant trucking volume. This will have a deteriorating impact on the road condition, and also result in considerable traffic delays to the farmers that rely on these roads to take their cattle and crops to the market. No effort is made to estimate the latter impact.
The national/municipal authorities may be responsible for road maintainance, but the critical issue is whether they will have the funding. This is dependent not only on how taxes are shared between the central and municipal government, but also on whether any tax is actually being paid directly. Many large industrial companies are experts at working the tax code to their full advantage to minimise actual tax payments. In Brazil, Aracruz reported taxes due of US$82.0m, US$32.7m for 2000 and 2001, and a tax credit of US$15.5m in 2002. The taxes due were never actually paid. Much of the tax took the form of deferred taxes, while others were added to liabilities as future payables. In the cash flow statements, these amounts were duly added back, and actual income taxes paid were reported as only US$20,000, US$66,000 and US$140,000 in each of these years respectively. Aracruz is no exception in this case. Given the low actual level of income taxes that is paid on the forestry activities, despite large reported profits, any unwillingness of the relevant department to do proper road maintainance works should not come as a major surprise.
of that other institution.’ (Mowickel 2002) In practice this will mean that the IFC will likely end up as a lead manager or key advisor in all environmentally sensitive projects. This can lead to disappointments while banks and ECAs assume that the IFC can effectively implement the Equator Principles. A better result might be achieved if all syndicate members would feel responsible for ensuring a sustainable outcome, as this would enhance everybody’s bargaining power against companies whose bias will always be towards non-disclosure of critical facts.
The lack of institutional capacity to assess social and environmental impacts has acted as a barrier both for ECAs and banks to effectively implement higher standards. Remedying this will take time. First, there is a cost element: while the IFC is a commercial operation, it operates in a different competitive environment from most commercial banks because development is officially recognised as being as important as achieving financial returns. This allows for the existence of environmental and social experts that will not be found in the realm of commercial banks whose need to deliver returns on their capital is resulting in an obsessive drive to maximise employee productivity. Progress is being made in that the IFC is devoting time to training bankers in Equator Principles assessments; and the fact that these bankers are being taught also reflect that institutions are recognising the need to let their staff attend such sessions. The ultimate challenge will be to ensure that higher standards translate into higher project quality. With many other forms of compliance putting severe demands on bank time and resources, active thinking
Measuring progress will be a
key component in assessing
the effectiveness of the EP, and
encouraging broader active
adoption of the principles into
lending decisions.

59
needs to take place on how the best results can be achieved most efficiently. This is further discussed in the section entitled ‘Improving standards and implementing safeguards in existing operations’.
Projects that score weakly on some points of the Environmental Assessment can often still secure funding provided their sponsors commit to a schedule of improvements that over time results in full compliance with the sustainability guidelines that the IFC adheres to. Other lenders working with safeguards will have similar policies. At the IFC, such a schedule of improvements is known as the Corrective Action Plan, and adherence to the plan is a condition of the financing. If a company fails to comply with the CAP it can be called in default, although we are not aware of any case where this has actually happened.
The rewards of the Equator Principles do not lie around the corner, and best practice will not be achieved overnight. Measuring progress is therefore important, also because progress will encourage broader adoption. Actively measuring real outcomes will also enhance the learning experience. ‘What works and why, and what does not work?’ is a valid question to be asked over and over again, with differing answers, depending on circumstance. The IFC does publish lessons on its site, but these are necessarily general, and are still heavily oriented towards the commercial and financial aspects of its lending policies, with less focus on environmental and social issues. The section on timber, pulp and paper contained no lessons relevant to fibre supply for pulp mills, whereas this is a highly sensitive area, where the IFC has both bad and good experiences.
5.3 Implementing safeguards in transactions in the international capital markets
The majority of fund raising by pulp producers takes place in the international bond and syndicated loan markets. For the Equator Principles to be effective for all new projects, and not just in the pulp field, its reach needs to be expanded to include the international capital markets. While there is some overlap between Equator Principles signatories and major players in the international capital markets, there are also significant omissions, notably in the realm of merchant banks without a High Street presence. Because of the need for a level playing field, these institutions need to be brought on board before existing Equator Principles players can realistically be expected to adopt an in-principle agreement about extending the scope of the Equator Principles to other forms of financing. Merchant banks have lagged behind commercial banks in recognising the role of Corporate Social Responsibility in their business, and adoption will likely be driven by existing Equator Principles participants with a significant capital markets presence, such as Citigroup and Credit Suisse First Boston (CSFB). Because the international capital markets finance existing operations as opposed to new projects, a workable means of applying safeguards to existing operations is a precondition for extending the Equator Principles to the international capital markets.
5.4 Improving standards and implementing safeguardsin existing operations
The Equator Principles lay down stringent requirements on areas of operations that companies rarely report on. In the case of project finance, these deal with anticipated events, not with actual operational realities – after all, the project is to be financed, it is not already in existence. There has to be a mechanism, preferably in the form of an explicit commitment by the sponsor, that those operational variables will be reported once the project is in operation. Presently, external advisers
The EP presently only apply to
project finance transactions, and
not to loans, bonds and equity
raised in the international capital
markets. Many key players in the
ICM are not part of the EP because
they are not visible corporate
lenders in that the lack a high
street presence.

60
are employed to check, but this does not bring data into the public arena. Transparent reporting, and in a format that all interested parties can digest without requiring extensive time investments, will foster a greater understanding of what is being reported and how to assess the numbers. This will allow for more effective monitoring, and over time will lead to the emergence a body of actual performance standards, that a growing number of people (including banks) will learn to read and interpret. Best practice is one thing, but how to define average realisable practice? Consistent reporting will also allow for trend monitoring. Is a company improving or not? And if a company is sliding back, what causes the problem? Over time, greater bank familiarity with assessing non-financial performance will enhance their skill in assessing new projects.
Because of the absence of public data, we are in no position to measure progress with the Equator Principles. The Equator Principles website, citing Dealogic data, reports that Equator Banks arranged US$ 55.1 billion in of project loans in 2003, accounting for 75% of the total excluding transactions by government agencies (estimated at US$ 10 billion). What one would like to know is what the specific impact of the Equator Principles on the structure and conditions of these transaction was, and in what cases application of the Equator Principles resulted in the sponsor increasing standards.
Success with the Equator Principles, for all stake holders but specifically for the banks that are part of the initiative, will be a determining factor in how fast, and with what tangible effect safeguards are extended to other areas of lending. The more positive the experience, the faster we can see effective adoption.
Box 5.4 Limitations to the effectiveness of due diligence: Sino-Forest and the IFC
The IFC leads amongst the multilateral development banks in terms of the depth and breath of its due diligence, but this by itself is no guarantee that this automatically results in water tight investments. All investors and lenders will find that some projects are more successful than others, and once in a while get caught. The IFC is no exception to this. Due diligence can overlook critical aspects of a company, or a company can deliberately mislead. It is not clear which was the cause of the slip-up with Sino Forest. In May 2000 the IFC made an investment in Sino Forest, a company that in March 2004 revealed that it had significantly less plantations than it stated all along in its periodic and annual reports to the investment community.
In 2000, the year that the IFC made its first investment, Sino-Forest reported 177,000 hectares of its own plantations, and an intention to develop up to 603,000 hectares with local Chinese partners. The company would not own these plantations, but be entitled to 70% of the woodharvest. The 50-year land use agreements would be held in the partners’ names. Though 31 December 2002, the last annual report available for the company, the company reported plantation holdings of 232,600 hectares, without commenting on progress in the joint-ventures. In March 2004, it appeared that the actual extent of the plantations controlled by the company was only 120,000 hectares, though in June 2004, a figure of 146,000 hectares is reported. Both these figures are significantly less than the area the company claimed to have when the IFC invested. In the intervening period, the company’s debt increased from US$ 47.9million to US$ 155.3 million (liquidity levels were constant at around US$ 30 million in cash and short-term deposits, and the reported value of its timber holdings in the fixed asset account increased from US$ 118 million to US$ 172.4 million), reflecting also that a considerable amount of the debt raised and cash flow derived from operations went to support these plantations. The IFC made a second investment in 2002, and as a result is likely to have been in close contact with the company.
It later materialised that plantations developed by the joint-ventures were only 34,000 hectares and this will go some way towards explaining why the proposed initial public offering (IPO) of Sino-Wood (the entity whose subsidiaries entered into the joint-ventures) had to be cancelled. Sino-Forest instead did an equity issue of its own that was fully subscribed! Most remarkable is that after having significantly overstated its plantation holdings, the one broker that we found covered the company, and that downgraded the company after the shortfall became known, reinstated its buy on the stock three months later, without explicitly touching on the implications of the plantation area shortfall on the quality and integrity of management. It should be mentioned that the downgrade to sell was made at US$5.48, whereas the price had fallen to US$2.50 by the time the upgrade was made.
Setting a mechanism for periodic
public reporting of operational
variables under the EP will allow
for a record of actual standards
to arise, that can serve as a
benchmark to assess performance
across the (growing) sample.
Existing corporate disclosure on
operations is insufficient to yield
the information necessary to
apply the EP.

61
This would require a slight
broadening of the reporting
focus that is currently limited to
sustainability.
Companies could be encouraged
to supply more comprehensive
reporting about their operations
within the framework of the Global
Reporting Initiative.
Effective application of the Equator Principles outside the realm of project finance requires that lenders can observe companies’ actual operating performance and how this compares to best practices. Currently, and as already noted in the section on credit risk, this is not yet possible, as companies are only required to report the financial result of their operations. The reporting of actual data about operations is only done at the time when new financing is raised, and there is no set format that has to be used, leaving room for gaps in reporting.
5.5 The Global Reporting Initiative
The framework in which more comprehensive reporting can be obtained already exists in the form of the Global Reporting Initiative (GRI). The GRI’s mission is to develop and disseminate globally applicable sustainability reporting guidelines for voluntary use by corporations. The Initiative was started in 1997 as part of the UN Global Compact, and became independent as an official collaborating centre of the United Nations Environment Programme (UNEP) in 2002. Companies that follow the Guidelines, report on the economic, environmental, and social dimensions of their activities, products, and services conform specific reporting standards set by the GRI. At the start of 2004, 380 companies and organizations used the GRI Sustainability Reporting Criteria to report their performance. The GRI is developing sector standards that guide implementation per sector.
The value of the GRI lies in that it provides a framework for the actual reporting of performance indicators, and that it provides standards for how these indicators should be measured, and what should be reported. Thus, the actual sustainability reporting guidelines are supported by technical protocols, issue guidance documents and sector supplements. At first sight, the apparent reporting complexity may be discouraging to users, and many financial sector participants despair at yet more paper hitting their desks when they already do not have the time to even read a company’s annual report. The counter argument is that only a well thought-out and well defined reporting framework can yield the data necessary to objectively observe performance. Because the report has a separate section of performance indicators, the information that is obtained by way of a lengthy process is available in raw format to the end user. Readers are highly recommended to visit the www.globalreporting.org website and look at the tables with economic, environmental and social performance indicators.
GRI reporting focuses on the sustainability of a company’s operations, and therefore has no comprehensive reporting requirements governing all of a company’s operations. However, even its present scope is already impressive and meaningful for companies with environmentally sensitive operations and can easily form the basis of the Operating Reviews that companies
Box 5.5 Basis of GRI Reporting
Reporting principles Recommended report contentTransparencyInclusivenessAuditabilityCompletenessRelevanceSustainability contextAccuracyNeutralityComparability
1. Vision and strategy2. Profile of the reporter’s organisation,
operations, stakeholdersand the scope of the report
3. Governance structure and management systems
4. GRI content index5. Performance indicators: economic,
environmental and social
www.globalreporting.org (May 2005)

62
A number of leading pulp
producers are members of the GRI,
but they do not yet report data in
compliance with the GRI, as it has
yet to develop specific reporting
guidelines for the pulp sector.
increasingly have to provide as part of their financial or annual reports. As sectoral supplements are produced, these could be drawn up to provide a format that is useful for a comprehensive operating review.
The scope to expand the GRI to the pulp and paper sector exists, with 24 pulp and paper producers already using GRI reporting guidelines. 13 among them are also pulp producers. So far, membership is tilted towards developed country players, but we expect the membership list to grow. Aracruz and CMPC are, as part of the UN Global Compact, obvious candidates to join. So far, only International Paper reports in accordance with GRI although each is making progress in terms of what is reported in its annual and/or sustainability reports. The GRI has, however, not yet developed a specific reporting template for the pulp and paper industry.
With regard to pulp production, GRI sector standards can add value by devoting recognition not only to pollution in the production process, but also explicitly addressing the raw materials supply chain, and the chain of custody for traded product. This will prevent companies from disavowing responsibility for raw materials that are obtained from third parties. The reporting format has to be such that it provides a clear picture on the complete fibre supply, covering all fibre used in the operations and allowing for a cross check on this figure relative to total output.
Broader application of the GRI will allow for the emergence of a picture of best current practice across industries and across localities. Best current practice will always lag behind best practice for new projects because production technologies continue to evolve, as does the notion of what constitutes best behaviour. All stakeholders will need to recognise that best current practice lags behind best practice, and place the focus on raising standards, as opposed to outright rejection of anything that falls short of best practice. Alongside this, standards of minimum accepted practice could be drawn up, with financial institutions, ECAs and other relevant providers of funding committing not to finance expansions by companies whose standards fail minimum accepted practice. If all Equator Banks commit to this, there is again a level playing ground. Banks win to the extent that identifing actual levels of practice can lead to more accurate pricing of risk. Responsible corporates win because this mechanism also allows for a more level competitive playing field: the mechanism prevents funding from flowing to poorly compliant companies and/or rogue operators.
The voluntary nature of the GRI means that the poorest performers are unlikely to adopt GRI reporting, allowing their poor practice to go undetected. A sensible policy might be for financial institutions and regulatory authorities to require that companies wishing to raise incremental funding and/or obtain export credit funding for a pulp mill supply GRI compliant sustainability reports. Even GRI reporting will not eliminate all problems. For instance, a business group with poor practices could easily form a new company in which selected assets are held, and hold this company to GRI standards. Through inter group loans, this GRI compliant company could
Box 5.6 GRI sector supplements
Sector supplementsReady to use In developmentAutomotive Financial servicesMining and metalsPublic agencyTour operatorsTelecommunications
Apparel and footwearLogistics and transportation
www.globalreporting.org (May 2005)
Broader application of the GRI
will allow for the emergence of a
picture of best current practice
across industries and across
localities.
Best current practice will lag best
practise, and broad stakeholder
recognition that this is so will be
critical in getting companies to
report under the GRI.
A sensible policy might be for
financial institutions and regulatory
authorities to require that companies
wishing to raise incremental funding
and/or obtain export credit funding
for a pulp mill supply GRI compliant
sustainability reports.

63
then raise funding to support the arms of the group whose operations might not meet minimum accepted practice. The old adage that bankers have to know their clients rings true as ever.
GRI reporting comes with costs and benefits. Companies incur a financial cost to produce GRI compliant sustainability reports. According to the GRI FAQ page, the cost of GRI reporting is less than US$500,000 per year, but more so for very large multinationals. This is a large amount, but not an excessive amount in comparison to the fee costs associated with large debt and equity issues. Moreover, a growing number of companies already produce sustainability reports, and go through certification exercises, suggesting that companies see a value in them. The major threshold to cross in adopting GRI is that companies will be reporting hard information on a comprehensive set of data rather than on selected data only. If there is dirty laundry, it will be exposed. This is where broad stakeholder recognition that best current practice lags behind best
GRI reporting is voluntary and is
likely to be shunned by the poorest
performers. The worst performers
would then automatically be
disadvantaged in the funding
process.
Table 5.1 GRI members (pulp producers only)
CompanyProduction (1,000 tonnes)
Country Market pulp Paper & board
Georgia-Pacific 1,397 10,586 United StatesInternational Paper 2,290 13,712e United StatesMeadWestvaco Co 0 5,800e United StatesMondi Paper Ltd. 260 4,087 South AfricaNeusiedler AustriaNorske Skog 0 4,991 NorwaySappi 907 4,322 South AfricaSiam Kraft Industry ThailandStora Enso Oyj R 900 13,743e FinlandSvenska Cellulosa A/B 0 9,490 SwedenUPM-Kymmene 0 10,046 FinlandVisy Industries AustraliaWeyerhaeuser 2,281 8,212 United States
Source: www.globalreporting.org for list, www.paperloop.com for capacity
Once GRI reporting is embedded,
high quality operators can set
themselves apart, and use this as
an opportunity to conquer markets.
Box 5.7 Raising reporting standards governing fibre supplies
Stora Enso has extensive forest holdings in Sweden, Finland and Canada, but is still dependent on external sources for a large proportion of its fibre. It has wood purchase and logging operations in the Baltic Sates, Canada, Central Europe, Finland, Portugal, Russia, Sweden and the US. This division supplies wood to its operations whose self sufficiency rate is 5% in Finland, 30% in Sweden and 12% in North America. Stora Enso is a GRI member, and in its 2001 annual report writes that ‘the company pursues an environmental and social responsibility policy that is committed to developing business towards economical, social and economic sustainability’. In 2001 the Principles for Corporate Social Responsibility were formulated to complement the policy and values of the Group in a concrete way. The company’s Mission Statement says ‘We promote communication and well-being of people by turning renewable fibre into paper, packaging and process wood products’. These statements could be backed up by providing transparent reporting on its fibre consumption.
The 2001 annual report announces the company’s intention to move into sawmilling to get more recovered fibre, and also states that a new newsprint mill will run completely on recovered fibre, so that the company’s total usage would come to 2.8 million tonnes per year. Its investment in the Veracel pulp mill in Brazil will further increase the company’s share of sustainable fibre use. However, the report is silent on the status of its total fibre consumption, the source, and the grade in terms of sustainability. Similarly, we get no information regarding the standards the company sets with regard to wood obtained through traders, or even by the company’s own wood procurement department. Nor do we know what the company’s targets for improvement are. Yet, Stora Enso have a reputation as having a cost-competitive fibre base, and also as being a responsible company. Unfortunately, this cannot be independently verified based on consistent reports about its operations. In the author’s view, hard data would be worth more than multiple statements of intent and policy.

64
Industry wide adoption of the GRI
will lead to greater transparency
that will allow poor performance to
be identified. However, no matter
how well the various safeguards are
implemented, they can only address
issues at the company level.
possible practice is important. However, if minimum acceptable practice is properly defined, GRI reporting can help a company meet consensus quality, with hard information to back it up. Any consumer has direct access to this information, and need not feel that he/she is being led astray by slick PR talk that might not properly reflect the true state of affairs. We would also argue that once GRI reporting is embedded, there is a multiple payoff in terms of reduced financing risk premiums and improve (consumer) market acceptance.
GRI reporting differs from certification in that the GRI is a comprehensive and objective framework for reporting standards. Unlike certification, the GRI does not focus on only one aspect of a company’s operations, and does not specify what particular standards are to be upheld. The actual reporting of indicators by company under the GRI allows users to see what standards a company applies, and to decide whether these standards meet what they expect of the company. For a company to be recognised as a GRI compliant reporter, its reports have to cover its entire operations, limiting the opportunity to mislead. As such, the comprehensive observation of company-wide data affored by GRI reporting can only enhance the quality of external certification.
External certification of a company’s operation has value in that it communicates to stakeholders that certain standards have been met in the area that was certified, but certification should never take the place of a company’s own responsibility for its actions. But because certification typically extends to limited areas of a company’s operation, it can sometimes backfire by giving a false sense of security. That a company’s mill meets ISO 14001 standards is no guarantee that its fibre supply is sustainable. Yet this may not be immediately apparent to the consumer who buys the final product that has ISO 9002 and ISO 14001 certifications on the wrapper.
5.6 Conclusion
Commercial banks, working with the IFC have adopted the Equator Principles to guide their cross-border project finance activities. In so doing, banks are looking to create a level playing field between themselves, while upholding recognised quality standards. If user experiences with the Equator Principles are positive, this initiative is likely to be more broadly extended to other areas of financing.
The Equator Principles has little direct impact on pulp mill financing activities of the signatory banks, because the majority of commercial financial institutions fund pulp mills through loans and bonds that are not classified as project finance, and thus not covered by the Equator Principles. At present a limited percentage of the institutions that dominate the markets where pulp mills raise their funding are not part of the Equator Principles. In the interest of creating a level playing field, it will be important to get these companies on board, as this in turn will stimulate existing Equator Banks to extend the Equator Principles to their capital markets activities.
The full benefits of Equator Principles application will come only when every lender accepts and takes responsibility for ensuring project quality, as opposed to delegating this responsibility away. The fact that even the IFC by its own admission cannot guarantee positive development outcomes shows that there is as yet no fool-proof way that results in high quality projects.
GRI reporting requies that
companies report hard information
on a comprehensive set of data
rather than on selected data only.
This makes it a powerful tool to use
alongside certification, because
much certification is limited in scope
and can therefore create a deceptive
image of corporate quality.

65
The Equator Principles apply to new projects when ample information about the prospective project is being made available to lenders. Disclosure drops significantly once a company is already in operation. If such companies are under a requirement to report their results, the requirement applies to the financial results, but not to details about their operations. Because observing operational performance, and collecting data over time is important to arrive at a balance assessment of what has been achieved, where standards are and how these are changing, the reporting of relevant hard operational variables by companies is a critical step in raising standards.
We recommend that increased reporting is done within the framework of the voluntary Global Reporting Initiative. As part of this Initiative, industry specific reporting guidelines are established that have to be followed if a reporting company is to be in compliance. For the GRI to succeed with pulp producers, stakeholder recognition that accepted practices of existing companies will fall short of best practices is critical to success. At present, none of the 13 pulp and paper companies that are part of the GRI are reporting in accordance with the GRI, but we expect this to change over time. The focus of reporting should be on determining what minimum acceptable standards are, what behaviour is not acceptable, and how to get the bottom quartile to raise standards. We would also recommend the formulation of industry guidelines for the pulp and paper sector.

Due diligence and credit risk
assessment standards used by
most financial institutions do not
effectively filter out unsustainable
pulp mill investments.
This study shows how existing
tools and processes can be used
better to filter out (potentially)
unsustainable pulp mill projects.
Principally recognised as a
manufacturing investment, pulp
mills have a much broader impact
on their environment as a result
of the fibre they consume. The
irreversible nature of pulp mill
investments mean that the utmost
effort should be made to structure
the project correctly from the start.
6 Key findings and recommendations
This study has reviewed how investments in new pulp producing capacity obtain funding, and the criteria that these investments have to meet. The specific focus of the review was to see why it is that companies operating unsustainable mills could still obtain financing despite the fact that such companies pose a higher default risk as a result of being controlled by sponsors with a poor commitment to their business. A key finding here was that once mills are in existence, financiers assume they operate within the standards laid down by relevant national legislation, and on that basis these financiers go about their job of raising financing for these mills at terms that the market will accept. Meanwhile, at the project stage, no mill is unsustainable, though rigorous application of safeguard screens could provide clear indicators as to which mills might go on to be unsustainable as a result of the use of unrealistic assumptions at the planning stage. Once a project goes on to be unsustainable, the high capital cost means that they are unlikely to be closed down, while the scale poses a challenge to remedial action.
Until a decade or so ago, financiers saw their task purely as providers of capital, and did not accept any responsibility for ensuring that certain minimum social and environmental safeguards were upheld in the projects that were thus financed. This attitude has changed considerably over the past decade, and the majority of commercial financial institutions have now adopted policies or signed on to initiatives to uphold certain social and environmental safeguards in their lending practices. Along with conventional due diligence and credit risk assessment, this now means that both the will, and the tools to filter out unsustainable pulp projects exist. This study also shows why it is that nevertheless proposed pulp mills that have a very high likelihood to go on to be unsustainable, and companies running unsustainable pulp mills can still obtain financing. The study identifies existing processes and mechanisms that, if made more effective and/or applied to the pulp industry could result in higher standards. Below we summarise the key conclusions by topic, followed by recommendations to specific parties.
6.1 Key findings
Unique nature of pulp millsPulp mills are highly capital intensive investments that are generally made in locations close to a fibre resource, as opposed to in highly industrialised locales, close to ports and large pools of labour. They will often be the single largest investment in a wide area, unless there is a competitor upstream. Their operations will impact on the environment, in terms of demand for fibre, land and water, and in terms of increased traffic flows. A previously tranquil locale will be turned into a factory site, with significant impact on the surrounding environment. For some this spells

67
opportunity, others find their livelihoods threatened without having the ability to adapt. When pulp mills are established in countries with low levels of relevant regulation that properly takes care of net negative beneficiaries, or where the implementation of these regulations may not be effective, they can cause considerable harm. This, combined with their de-facto irreversible nature calls for great care in their planning and establishment.
Yet, for all these impacts, that may even be more material than those of a pure resource based investment, pulp mills are typically classified as manufacturing investments. Regulations governing them focus on pollution while ignoring the broader set of issues surrounding the entire mill and its impacts on the communities and biophysical environment where it operates. This is not only true for regulators in producing countries, but also for many of the arbiters of safeguard implementation.
Financing new capacityProposed and existing mills access different pools of financing. Proposed mills have to attract financing based on the projected future cashflows of the project, where existing mills can do so based on their existing operations. Combined with the highly capital intensive nature of pulp mills, this has meant that new mills almost invariably are started with large proportions of export financing and multilateral credit, as these organisations find the higher risk of these financings balanced by the attainment of some of their organisational objectives (stimulation of export or development). Of the multilateral development banks, the IFC applies the most stringent screening criteria to proposed new investments, and these very criteria have now been adopted by the private sector for project finance transactions exceeding US$ 50 million. However, most private sector lending to the pulp sector takes the form of syndicated loan and bond issues, and is therefore not subject to these safeguards. Multilateral lenders have been effectively absent from the financing of forest-based industries during the 1990s, but are now stepping up their activities again, in response to changed policies and a new pulp mill investment boom. On paper these proposed projects will all look good; the key challenge lies in looking beyond rosy projections to see where the weaknesses are, and to see how and whether these can be overcome.
Limitations of projectionsWhen a new project is designed, all that investors are working with are projections. Projections tend to be optimistic in nature and not necessarily comprehensive, especially where they are provided by the project sponsor. There is therefore an extra onus on first-stage financiers to look beyond the projections and assess the sponsors, their business track record and their commitment and ability to deliver. It is then important to see at every stage how actual performance lives up to projections. In Indonesia’s case, the four major pulp producers all projected to be self-sufficient in plantation fiber eight years after the start the commissioning of new capacity installed since 1990, but to this date the industry still obtains approximately 70% of its fibre from the natural forest. The shortfall in plantation yields were apparent from an early stage, and should have sent a warning to anybody financing their capacity expansions.
The Environmental Assessment For projects that are subject to social and environmental screening, the project sponsor has to provide an Environmental Assessment. The Environmental Assessment addresses environmental, and to a lesser extent social, impacts of the proposed investment. The quality of these Environmental Assessments are highly variable, and in some cases fail to effectively and adequately address the social and environmental issues that are critical for the mill in question. Generally such assessments do not include the design of an effective system for monitoring the mill’s performance over time. In many cases, there is no external review process of the Environmental Assessment that could point out perceived weaknessess and potential problems. Instead of preparing an Environmental Assessment with the intention of producing a tool that will contribute to the structuring of a sustainable project over the long term, it is often produced to ‘tick a box’ on the loan process form and is, therefore, of limited actual use.
Multilateral development banks
and export credit agencies are the
principal financiers of greenfield
projects. Changed lending strategies
at MDBs are now translating into
considerable increases in available
funding for pulp mills.
Companies that already have
pulp operations normally finance
expansions in the unregulated
international capital markets.
Greenfield projects obtain funding
on the basis of projections that are
often not realistic, and financiers
need to look beyond the projections
at the realistic willingness and
ability of the sponsor to deliver.
The EA that assesses the impact of
an investment is provided by the
sponsor in support of his project,
and it is not subject to critical
external review.

68
Lenders have no power over
borrowers, and the threat to call a
loan in default if a sponsor fails to
meet promised standards is idle.
Commercial providers of debt
financing manage their risk on a
portfolio-wide basis, where macro-
level credit risk management takes
precedence over stringent quality
control of individual loans/securities.
Competitive and time pressures
discourage thorough borrower
and project specific credit risk
appraisals.
The unregulated capital markets
are the principal source of funding
for developing country pulp mills
where they meet financiers who
fail to appreciate the need to
investigate a mill’s sustainability
track record, and its impact on loan
performance.
Not all externally bought research
is of a uniform high quality or
comprehensive in its approach.
SafeguardsSafeguards are principally applied with proposed projects. At the planning and initial financing stage, they have the potential to be most effective, because they can help structure better projects in a way that is more difficult, if not impossible, to achieve once a mill has already been built. To have maximum effectiveness, they need to be implemented early on in the investment process, before project design is too far along to incorporate meaningful changes. After safeguards have been agreed upon and applied, there also need to be clear mechanisms for observing key variables related to a mill’s performance and monitoring the effectiveness of those safeguards over time.
Whereas the IFC and MIGA incorporate a clause allowing them to call for early repayment of a loan if a sponsor is not meeting the requirements of the safeguards, the reality, especially for pulp mills, is that this call has no teeth, and that even calling the loan will not result in a reversal of the investment.
Due diligence and risk assessmentDue diligence and risk assessment procedures in commercial lending/investment transactions could be expected to reveal unsustainable practices where these result in threatening the economic viability of a project. In most cases of companies with unsustainable practices, these have been duly noted along with a host of other potential risks in a prospectus that protects the underwriter and issuer against certain liabilities, but that most investors do not even read. The underwriter, taking the view that the markets should decide what level of risk they are comfortable with, has disclosed the risk and priced the issue such that investors felt that they were being adequately compensated for the risk taken.
In actual fact, while there are no doubt individual financial institutions that have declined to finance mills for such reasons, the aggregate financial markets have been found willing to finance mills with severe operating weaknesses that would have been apparent had they bothered to look. Within the banking world, regulators and supervisers continue to bemoan the superficiality of the credit risk assessment process. This clearly has much to do with the large amounts of liquidity in the financial system, and the competition between financial institutions to lend/invest and maintain marketshare and critical size. Thus we are dealing with a systemic weakness, and not a weakness that is unique to the granting of credit to the pulp and paper sector. This does not change the urgency of raising standards such that mills that fail to meet certain agreed standards do not have automatic market access.
Due diligence and risk assessment of pulp mill investmentsThe international capital markets are a key source of financing for pulp mills in countries with shallow domestic capital markets as a result of the capital intensive nature of pulp manufacturing. Based on the assumption that if a mill is allowed to operate, it must be in accordance to the law, credit is given on the strength of a financial strength rating, and the industry outlook, as a means to estimate the risk of non-payment. Whereas the chance of a non-sustainable mill not repaying its debts is frequently greater than that of a sustainable mill, financiers often fail to address this issue because they view it as falling outside of their areas of competence and responsibility. More generally, they all-too-frequently underestimate the risks that unsustainability poses to a company’s ability to carry on its operations. In many cases, financial institutions also fail to rigorously assess whether the pulp mills they fund are operating in full compliance with the laws of the country in which they are located.
Limitations to, and quality of analysisIn making their investment decisions, the international financial community relies heavily on industry and borrower reports produced by external sources. There is a tendency for these reports to discuss only what information is available, but not necessarily what is relevant. With respect to the pulp and paper sector, we found that the majority of analyst reports deal with industry factors such as projected product price development and supply and demand factors, but much less with
Safeguards can be at their most
effective when applied to new
projects provided also that they
incorporate a clear monitoring
process.

69
Lenders who have signed on to the
Equator principles have pledged to
uphold IFC-standard safeguards in
their project finance transactions
exceeding US$ 50m. This excludes
most pulp mill financings.
the intricacies of a company’s operations and product flows, let alone its impact on the social and biophysical environments in which it operates - each of which might have meaningful repercussions for the continuity of its operations.
Equator PrinciplesMany lenders now recognise that they have a responsibility to prevent financing from flowing to poor quality projects, and have signed on to the Equator Principles. The Equator Principles apply IFC categorisation and safeguard screening to environmentally sensitive projects that use more than US$50 million in project finance. Because few new pulp mills are financed using project financing, the Equator Principles - as currently structured - are of limited use in fostering higher standards of pulp mill financing by the international financial community.
Safeguard assessment capacityBanks and export credit agencies generally have no in-house capacity dedicated to implementing social and environmental safeguards, and therefore, they commonly rely on the judgment of a senior environmental partner (read: multilateral development bank) in the investment process. Banks must realize that even those institutions they believe are vested with such credentials face internal constraints in effectively implementing safeguards. Higher quality projects can only be originated if the origination officers themselves develop the ability to assess the quality and sustainability of a company’s operations, and in doing so learn to look beyond what the company is showing.
Observing performanceTo give meaning to discussions about where standards should be, it is important to move forward with means to report actual operating performance. To be useful, these reports should provide a comprehensive accounting of resource flows and use through the organisation, from the start of production through to the final product, as well key impacts based on the EP guidelines. This reporting can start on a voluntary basis within the Global Reporting Initiative (GRI). The GRI is already recognised as a reporting forum by a growing number of companies, and it will provide a more level reporting playing field. Including a summary of the key operating information in annual and financial reports to the financial community should over time foster better informed analysis of the structure of a company’s operations, and the company’s conduct of these operations.
Defining standardsThe increased observation of actual operating performance will result in a picture of actual operating practice that is bound to differ from the ideal, high standards currently being debated. The ranges of actual operating practice should form the basis for multi-stakeholder discussions on what acceptable ranges are, what behaviour is not acceptable, and what targets are. Basing the discusions on the current reality provides a greater opportunity for a larger number of players to actually implement improvements, and report on these so that they can be measured. To the extent that the benchmark is an ideal state that even the best players haven’t achieved, the remoteness of the target is bound to result in less real action on the ground.
Certification and auditsCertification and audits have a role to play in verifying previously reported data by a company. Certifications typically apply to only a portion of a company’s operation, and criteria differ across certification bodies, and in this way can be misleading. It is possible for a company to get its manufacturing processes and its forestry operations certified. What might not have been picked up in the process is that the crop of the forest plantations is insufficient to support the company’s production volume, so that a considerable portion of the fibre demand would be filled from external sources that might not be sustainable. While certification and audits can play a useful supporting role, they cannot and should not take the place of a comprehensive operating report that, like the financial statements, is signed by management. Similarly, audits may be made to verify what a company reports, but should not take away managements’ responsibility for its operations.
All institutions upholding
safeguards in their lending practice
should aim to internalise the
application of such standards
rather than relying on third parties.
To make an adequate assessment
of a mill’s operating standards
there is a need for more consistent
and comprehensive reporting of
operating and impact data.
Based on an observation of
where standards currently stand
stakeholders can have a better
informed discussion on where they
should be, and what behaviour is
not acceptable.
Certification has a use, but cannot
replace the need for an objective
and comprehensive report of
material raw operating and impact
data by a company’s management.
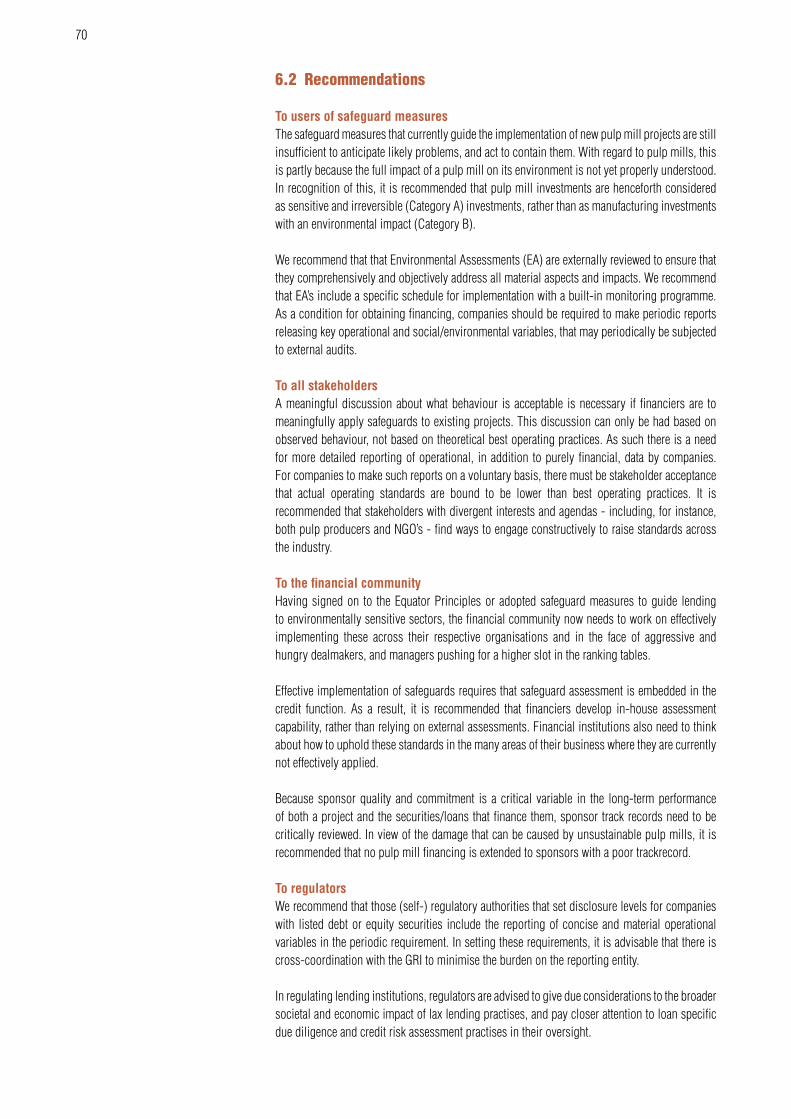
70
6.2 Recommendations
To users of safeguard measuresThe safeguard measures that currently guide the implementation of new pulp mill projects are still insufficient to anticipate likely problems, and act to contain them. With regard to pulp mills, this is partly because the full impact of a pulp mill on its environment is not yet properly understood. In recognition of this, it is recommended that pulp mill investments are henceforth considered as sensitive and irreversible (Category A) investments, rather than as manufacturing investments with an environmental impact (Category B).
We recommend that that Environmental Assessments (EA) are externally reviewed to ensure that they comprehensively and objectively address all material aspects and impacts. We recommend that EA’s include a specific schedule for implementation with a built-in monitoring programme. As a condition for obtaining financing, companies should be required to make periodic reports releasing key operational and social/environmental variables, that may periodically be subjected to external audits.
To all stakeholders A meaningful discussion about what behaviour is acceptable is necessary if financiers are to meaningfully apply safeguards to existing projects. This discussion can only be had based on observed behaviour, not based on theoretical best operating practices. As such there is a need for more detailed reporting of operational, in addition to purely financial, data by companies. For companies to make such reports on a voluntary basis, there must be stakeholder acceptance that actual operating standards are bound to be lower than best operating practices. It is recommended that stakeholders with divergent interests and agendas - including, for instance, both pulp producers and NGO’s - find ways to engage constructively to raise standards across the industry.
To the financial communityHaving signed on to the Equator Principles or adopted safeguard measures to guide lending to environmentally sensitive sectors, the financial community now needs to work on effectively implementing these across their respective organisations and in the face of aggressive and hungry dealmakers, and managers pushing for a higher slot in the ranking tables.
Effective implementation of safeguards requires that safeguard assessment is embedded in the credit function. As a result, it is recommended that financiers develop in-house assessment capability, rather than relying on external assessments. Financial institutions also need to think about how to uphold these standards in the many areas of their business where they are currently not effectively applied.
Because sponsor quality and commitment is a critical variable in the long-term performance of both a project and the securities/loans that finance them, sponsor track records need to be critically reviewed. In view of the damage that can be caused by unsustainable pulp mills, it is recommended that no pulp mill financing is extended to sponsors with a poor trackrecord.
To regulatorsWe recommend that those (self-) regulatory authorities that set disclosure levels for companies with listed debt or equity securities include the reporting of concise and material operational variables in the periodic requirement. In setting these requirements, it is advisable that there is cross-coordination with the GRI to minimise the burden on the reporting entity.
In regulating lending institutions, regulators are advised to give due considerations to the broader societal and economic impact of lax lending practises, and pay closer attention to loan specific due diligence and credit risk assessment practises in their oversight.

71
To pulp producersPulp producers can make a first step toward fostering a better understanding of their operations by raising disclosure levels. We recommend that this is done within the existing framework of the GRI that already has a number of pulp producers as members. These producers can now move forward by establishing a common, industry-wide reporting standard. As proper impact assessment also necessitates an understanding of the operations of a company, the quality of reporting would be enhanced if it includes a comprehensive mapping of meaningful resource use in and flows through the production process, as final output. The minimum disclosures that this would entail include: (1) capacity per type of product produced, (2) use and cost of resources/inputs per type of product, (3) output/sales and price received per type of product, (4) source of fibre, supply contracts, (5) condition of plantations: acreage planted, amounts harvested.
To the Equator PrinciplesWe recommend that the Equator Principles, working through the organisations that signed up to it, aims to expand adoption of its principles to include all financings in excess of US$50m raised by companies active in environmentally sensitive areas. In addition to project finance, this would include syndicated loans, issues of notes and bonds, and equity.
The Equator Principles assume disclosure levels that are only available for new projects, and then in the format of projections. A first step should be to ensure that projects financed with Equator funds commit to publishing these variables. The dissemination of relevant information about their operations and the impact thereof will deepen the understanding of the financial community and other relevant parties about working with safeguards.
To the Global Reporting InitiativeFor the GRI to be of use to investors, it needs to be concise and material. We recommend that the tendency to indulge in overly complex reporting is tempered by the question of what is material. The inclusion of summary GRI outputs in annual reports and periodic stock exchange filings will allow the results to reach a broader audience. The GRI is progressively implementing industry-specific reporting standards with the collaboration of member companies. The issuance of a pulp and paper industry supplement can be accellerated with the active participation of those pulp and paper producers that are already GRI members.

Sources
Altunbas, Y and Gadanecz, B, 2003 Developing Country Economic Structure and the Pricing of Syndicated Credits. Bank for International Settlements, Monetary and Economic Dept, BIS Working Papers 132.
Barr, C. 2001 Banking on sustainability: structural adjustment and forestry reform in post-Suharto Indonesia. Washington, DC., USA, WWF Macroeconomics Program Office and CIFOR.
Basel Committee on Banking Supervision 2000 Principles for the Management of Credit Risk.Bonita, M. et al 2002 Forest clusters: A competitive model for Latin America. Inter-American
Development Bank Sustainable Development Division. Campbell G.J.and Martin, A 2000 Financing the global benefits of forests, the Bank’s GEF
portfolio and the 1991 Forest Strategy. World Bank Operations Evalutation Department, The World Bank, Washington D.C.
Carrere, R. and Lohman, L. 1996 Pulping the South: Industrial Tree Plantations and the World Paper Economy. World Resources Management.
Carrere, R. The environmental and social effects of corporate environmentalism in the Brazilian market pulp industry. Paper to Business Responsibility for Environmental Protection in Developing Countries organised by the United Nations Research Institute for Social Development (UNRISD) and the Universidad Nacional (UNA). Costa Rica, September 1997.
CFA Institute, Code of Ethics and Standards of Professional Conduct.Compliance Advisor/ Ombudsman, 2003 A Review of IFC’s Safeguard Policies. The World Bank. Encyclopedia BrittanicaEstrella, A. 2000 Credit ratings and complementary sources of credit quality information. Working
Paper of the Basel Committee on Banking Supervision, Bank for International Settlements, Basel.
Food and Agriculture Organization of the United Nations 2002 Pulp and Paper Capacities: Survey. 2001 – 2006. Rome.
Geiger, K. 2002 IFC answers the SOS. Latin Finance 13 DecemberGlobal Reporting Initiative, 2002. Sustainability Reporting Guidelines. Boston.IUCN/WWF (The World Conservation Union, World Wildlife Fund), 2001. Proposed Elements for
a World Bank Safeguard Policy on Forests. IUCN/WWF Position Paper.International Institute for Environment and Development, 1996. Towards a Sustainable Pulp
Cycle. World Business Council for Sustainable Development.Jeanneau, S and Micu, M 2002 Determinants of International Bank Lending to Emerging Market
Countries. BIS Working Papers No. 112 JuneJones, S.D 2002 Weyerhaeuser Shoulders Debt With a Smile. ‘In the Money’ Dow Jones
Newswires column. 19 February

73
Jurgens, E., Barr, C. Cossalter, C. 2005 Brief on the Planned United Fiber System (UFS) Pulp Mill Project for South Kalimantan, Indonesia No. 3/2005 Forests and Governance Programme Series, CIFOR, Bogor.
Kivimaa, P & Mickwitz, P 2003 Driving forces for environmentally sounder innovations. The case of the Finnish pulp and paper industry. Finnish Environment Institute, 2003. Paper to the 2003 Berlin Conference of the Human Dimensions of Global Environmental Change: ‘Governance for Industrial Transformation’
Lang, C. 2002 The Pulp Invasion. The International Pulp and Paper Industry in the Mekong Region. World Resources Management.
Latin Finance, 2002 LatAm Corporate Performance: Taking their Temperature. Latinfinance.com 10 August 2002
Latin Finance, 2003 LatAm Structured Finance: Looking for new lifelines. Latinfinance.com 7 March 2003
Laurila, E.J. 1989 Pulp and paper in Indonesia: Prospects for Development. Directorate General of Forest Utilization, Ministry of Forestry, Government of Indonesia, FAO of the UN.
Lazarus, S. 2004 The Equator Principles: a milestone or just good PR. Global Agenda 26 January 2004 as posted on www.equator -pinciples.com/ga1.shtml
Liebental, A. 2002 Promoting environmental sustainability in development. An evaluation of the World Bank’s performance, World Bank Operations Evalutation Department. The World Bank, Washington D.C.
Morales, E. 2002. Chile Country Study. Paper to Changing ownership and management of state forest plantations: Issues Approaches and Implications. Cape Town, South Africa 6 – 8 November 2002.
Mowickel, J. 2002 Export credits - The dirtiest secret of globalisation? Address to Globaliseringskonferansen 2002, Folkets Hus, Oslo, 29 November 2002
OECD: Recommendation on Common Approaches on Environment and Officially Supported Export Credits, OECD [undated]
OECD: Environment and Export Credits: 2002 Revised Coverage Matrix (situation as at 2.4.2003)
Ojumu, A. 2002 Implementation of the 1991 Forest Strategy in IFC’s Projects, Vols I & II, Operations Evaluation Group (preliminary draft for public consultation, downloaded from the IFC website).
OU Ecoman (Estonian environmental impact assessment company) 2003. The assessment of the environmental impact and the integrated environmental permit of the aspen pulp plant to be constructed at Kunda by A/S Estonian Cell, Executive Summary Posted on the EBRD website: http://www.ebrd.com/enviro/eias/estonia/34548eng.pdf
Paperloop magazine, various issuesPfefferman, G.P. 2001 Attracting FDI for Development. Power point presentation. GFP Chief
Economist IFC 26 April 2001PriceWaterhouseCoopers. Global Forest & Paper Industry Survey. Years 1998 – 2003. Program on Forests (Profor), The World Bank, 2004 The Forest Investment Forum: Investment
Opportunities and Constraints. The World Bank, Washington D.C.Rich, B. 1994. Mortgaging the Earth: the World Bank, Environmental Impoverishment and the
Crisis of Development. Beacon Press Boston.Sen, A. 1981 Poverty and Famines: an essay on entitlement and deprivation. ILO World
Employment Programme – Income Distribution and Employment. Oxford University Press.Simula, M., Salmi, J., Puustajaervi, E. 2002 Forest Financing in Latin America: The Role of
the Inter-American Development Bank. Inter-American Development Bank, Sustainable Development Department Best Practises Series. Washington D.C.
Sonnenfeld, D.A 1999. Vikings and Tigers: Finland, Sweden and adoption of environmental technologies in South-East Asia’s pulp and paper industries. Journal of World Systems Research Vol 5 No. 1

74
Spek, M. 2000 Indah Kiat: Company Update. GK Goh Ometraco Research, Jakarta.Sustainable Forestry Working Group, 1999. The Business of Sustainable Forestry – Case Studies.
The John D. and Catherine T. MacArthur Foundation.World Bank Group, 1998. Pollution Prevention and Abatement Handbook: Pulp & Paper Mills.
Washington D.C.World Bank, undated. Sustaining Forests: A World Bank Strategy. Booklet based on A Revised
Forest Strategy for the World Bank Group, endorsed in 2002.World Wildlife Fund of Latvia, 2003 The features of illegal logging and related trade in the Baltic
Sea Region. WWF Discussion Paper. Websites of multilateral development banks, export credit agencies, financial institutions, pulp
producers, policy research institutions and NGOs, industry associations, regulators and government departments.
Annual reports and prospectuses of pulp producers.

Appendix I: Screening proceedures applied by various Export Credit Agencies
Major ECAs Country Policy Date Screening Environmental Review Author/ Responsible Site visits Benchmarks Post disbursement conditionality Monitoring Public disclosure Public consultation CostsJBIC(www.jbic.go.jp)
Japan J-Exim established environmental guidelines
1999 Classification into A, B, C or FI. Screening as appropriate for category.
Cat A Supplied by applicant, but sponsor responsible.
Very likely for Cat A as a substantial process of environmental assessment. Less frequent for Cat B.
Compliance with host national and local government standards, and conformity with their environmental policies and plans. Also consider standards of international and regional organizations and developed countries.
No funding if env. & soc. Considerations are not ensured. Conditions precedent may be set for disbursement.
By the project sponsor of items with a significant environmental impact. Reported to JBIC by the borrower.
In accordance with Guidelines. Headline data disclosure post screening, including status of EIA.
All by JBIC, except for EIA
New Guidelines for JBIC & NEXI Apr-02Implementation of full guidelines Oct-03
Export-Import Bank(www.exim.gov)
United States Environmental Procedures & Guidelines
Feb-95 US$10m + financial coverage or maturity > 7 years must have a Screening Document. Based on SD Ex-Im determines if an Env Rev. is necessary & scope. Other projects screening intrnally to see whether there is impact, subsequent env.rev. may follow if deemed necessary.
Full evaluation to see whether Ex-Im and local Guidelines are met. Review in line with scope and complexity of environmental effects and the potential for greater adverse environmental impact. EIA for Cat B.
Responsibility of applicant. Can be commissioned by the project sponsor or applicant but must be recognised by the sponsors as the official EIA fo the project.
Conducted as needed (pre- or post-project operation) to verify degree or env. Effects and project compliance with guidelines.
No benchmarking. Minimum compliance is Ex-Im standards or higher and local guidelines must be met. Ex-Im Bank guidelines are industry specific, and based on IFC guidelines.
Conditions precedent prior to disbursement. Subsequent completion of planned ecological mitigation measures accepted where completion is contingent on the project (eg. Oil pipeline, power project)
Mandatory for all reviewed projects. Site visits and submission of operating reports. Non-compliance is a condition for default.
Governed by the Trade Secrets Act and the Freedom of Information Act. Applicants have to allow publication of EIAs.
EIAs for Cat B projects on receipt of final application. Board and loan committee meeting agendas and summary minutes posted on website.
2 full-time environmental specialists/engineers, w/ assistance from sector specialist engineers employed. Site visits & EIA at sponsors expense. Bank engineers conduct multi-site visits for post-construction monitoring.
Subject to periodic review, frequent revisions/ additions made
EFIC(www.efic.gov.au)
Australia Environment Policy & associated procedures
Jul-00 Classification into A, B or C. Env.: A,B & C; Soc: A&B. Dev: A (sometimes)
Cat A & B: EIA with ref to WBG Pollution Prevention and Abatement Handbook. Cat A: mitigation or management plan.
By sponsor or exporter case-by-case basis Cat A - World Bank. B & C in-country standards
Limited to A & B. Applied to ensure compliance with specific nominated mitigants, sponsor undertakings or nominated environmental standards.
Depending on assessment of transaction’s impact. Compliance monitoring in-house or through independent impact reviews or compliance audits by suitable external parties.
Reports how its actions accord with the principles of Ecologically Sustainable Development in its Annual Report.
45-day public consultation on EIA (not deemed to be commercially sensitive).
EIA costs may be shared with transaction sponsors.
Exportkreditnamnden(www.ekn.se)
Sweden Introduction of policy Apr-00 Prelim screening through questions in application form. Further screening through a separate env. questionaire.
Cat A: full EIA with supplementary studies and technical reviews as deemed necessary. Cat B: Limited EIAor other for the project sufficient environmental information.
Exporter responsible. EIA must be produced by an independent and reputable consultant.
Not part of the regular routine. Only done when necessary, and frequency is expected to increase going forward.
World Bank PPAH and EU (Reference documents on Best Available Techniques) when appropriate.
No environmental covenants, but exceptions in co-financing cases to follow financing bank. Offers stipulate environmental pre-conditions for the issue of guarantees.
Env. Monitoring can be part of overall project monitoring. Where necessary can be a stand-alone process. Explicit monitoring of covenants, but these are rare.
Public access stipulated by Swedish Freedom of Press Act. Restrictions imposed by Secrecy act. Publication of headline data for guarantees > SEK 10 mio listed on website.
No info prior to the final decision. Annual Reports from FY02 onwards include information on Cat A and Cat B projects.
Has 500k SEK budget for outside expertise. Other costs covered directly or indirectly (via primia) by Swedish exporters and banks.
Revision of policies Jul-02Finnvera Plc(www.finnvera.fi)
Finland Environmental principles Jun-00 All medium & l/t transactions based on env. Questionnarie. Env. & Soc considered in assessment.
Cat A: EIA according to international standards. Other types of IA for Cat B.
Independent experts. Provided by applicant but sponsor responsible.
Not usuaal Local environmental legislation, then benchmarked against WB/ EBRD, NIB, IFC, Finnish & EU standards on a case-by-case basis.
case-by-case basis case-by-case basis No disclosure of <business secrets> to outside parties. No disclosure unless with borrower consent.
From 2003 key details of signed transactions published.
80% in-house environmental specialist.
Environmental process Sep-00Introduces Environmental Questionaire Jan-02
Guarantee Institute for Export Credits(www.giek.no)
Norway Environmental policy and guidelines introduced
1998/99 Prelim screening through questions in application form. Further analyses as necessary.
Cat A: full EIA Exporter responsible. EIA must be produced by an independent and reputable consultant.
case-by-case basis Highest international standards for Cat A & B. conditions have to be met when the policy is issued. Special conditions which represent default on the borrower if not met in the down-payment period.
case-by-case. Monitoring required in case of resettlement.
Subject to restrictions on business confidentiality by Public Administration Legislation.
None prior to issuance of policy. Extra costs in connection with actual cases will normally be borne by exporters.
Review of policies, alignment with OECD Common Approaches
Dec-03
Euler-Hermes Kreditversicherungs-AG (part of Allianz Group)(www.eulerhermes.com)
Germany incorporates ecological, social and developmental aspects into its loan procedures
Jul-00 Pre-Screening and Screening. Env. Soc & Dev considered.
EIA for high impact projects. Follows Annex I of OECD CA
Sponsor responsible. Exceptional Host country standards minimal level. Then benchmarked against internationally recognised and customary regulations (WB, German or EBRD standards)
Environmental covenants if the previous review procedure has shown that improvements of adverse environmental impacts are necessary.
Where convenants are in place, exporter can be bound to report on fulfillment. Monitoring measures and frequency are then incorporated into the guarantee contract.
Data published on the internet after the final commitment with the approval of the applicant. Publication without approval contravenes criminal and administrative legal regulations.
See public disclosure. EIA costs by sponsor/exporter. Env. Costs by Hermes
Guiding Priniples formalised Apr-01Implements OECD Common Approaches
Jan-02
Oesterreichische Kontrollbank AG(www.okb.co.at)
Austria Evnironmental assessment pocedure Jun-00 Classification into A, B or C. Review based on class
Cat a: EIA requrired. Scope following Annex of Common Approaches. Other forms of env. Reviews and reports also taken into accounts. Additional due diligence done.
Responsibility of the Exporter to submit. Carried out by the sponsor/ project owner
case-by-case basis. Yes if necessary for proper assessment.
EC, WB/IFC, Austria & buyer country. Also Common Approaches benchmarking.
EA results incorporated in conditions for cover. Only conditions with the exporter can fulfill.
Will ask sponsor or third parties (eg. Guarantee holding banks) to be responsible for proper environmental monitoring.
Confidentiality under the Export Guarantees Act, Data Protection Act and Banking Act (stipulates banking secrecy). Will publish E10m + projects with prior written consent of the exporter.
EIA will be published for E10m up where possible and with permission.
E10k cost for A or B project reviews, exclusive of onsite visit costs, consultant fees &c.
Procedures modified to incorporate OECD Common Approaches
Feb-02
Export Credits Guarantee Department(www.ecgd.gov.uk)
UK Environment screening introduced Jan-00 Classification into A, B or C based on info in application. B: Impact Questionnaire. A: EIA, SIA and/or resettlement action plan.
Cat A Greenfield: EIA required. Others assessed by a combination of desk-review and consultation with the exporters, sponsor &c.
EIA by an independent consultant on behalf of the project sponsor.
Yes for major greenfield Cat A projects. WBG Guidelines and Safeguard Policies, UK/EU and local standards and industry best practice.
Env. Cov and conditions precedent where necessary.
Introduced for major projects. Annual auditing and reporting, preferably by an independent party.
Disclosure of project information encouraged, consistent with legal requirements to respect commercial confidentiality.
Cat A projects incl. Source of E/SIA report data published prior to underwriting. Typically 60 days exposure prior to final decision. Disclosure subject to UK client agreement.
EIA review paid by project sponsor. Site visit costs met by sponsor or exporter. Other costs met indirectly through premium income.
Statement of Business Principles & revised impact assessment
Dec-00
Changes to environmental and disclosure policies following a review of existing policies
Apr-03
Export Development Canada(www.edc.ca)
Canada Environmental Review Directive & related procedures
Dec-01 All medium & l/t transactions. Soc & Env: A & B
Cat A full EIA. B requires an Environmental Management Plan.
Responsibility of the sponsor. Exporter may have to submit additional information if project documentation is deemed insufficient. EIAs need to be prepared/reviewed independently.
case-by-case basis. Primarily on Category A A & B: international standards, and good practices and guidelines of EDC.
Limited to A & B. Applied to ensure compliance with, e.g. host-country and international standards.
Determined and negotiated as part of the env. Review prior to providing support. In-house by EDC environmental specialists or by consultants hired by the lending group.
Has a corporate disclosure policy. EDC encourages sponsors to publicly release available environmental impact information. Where EDC is considering support, it seeks sponsor disclosure consent.
Cost of reviews and site visits may be shared with exporters/sponsors. Has 5 full-time environmental specialists.
Environmental Review Framework (formalised then existing review practices)
1999
Source: OECD, ECA websites as cited
Appendices

76
Appe
ndix
II:
Fina
ncin
g ra
ised
by
pulp
pro
duce
rs s
ince
199
0
Lo
ans
Tota
l
1990
1991
1992
1993
1994
1995
1996
1997
1998
1999
2000
2001
2002
2003
2004
2005
since
199
0sin
ce 2
000
US
2,01
3.8
555.
0 1,
835.
0 32
9.0
880.
0 1,
310.
0 70
3.1
775
.5
1,20
0.0
700.
0 53
,606
.3
51,8
97.4
17
,825
.0
9,55
4.2
10,9
43.5
-
154
,127
.9
143
,826
.4
Can
ada
212.
81,
334.
050
4.1
646.
5-
1,40
7.6
1,21
0.2
5,84
3.6
1,83
7.4
415.
7 1,
777.
2 5,
455.
6 77
1.3
- 77
.5
- 2
1,49
3.5
8,0
81.6
Japa
n -
- -
- -
- -
- -
- 69
.0
9.3
73.0
49
0.6
564.
9 -
1,20
6.7
1,2
06.7
Fin
land
- -
- -
- -
- -
- -
1,57
5.9
2,20
2.0
1,07
3.3
4,30
4.3
855.
9 2,
357.
2 1
2,36
8.6
12,
368.
6
Nor
way
200.
0 -
- 13
5.0
- 57
3.8
470.
0 1
87.0
45
0.0
- -
1,37
1.2
682.
6 97
.6
1,00
0.0
- 5,
167.
1 3
,151
.4
Swe
den
1,84
6.8
- -
- 15
0.0
- 25
0.4
- 81
.5
- 88
4.2
1,09
4.8
- 11
5.0
157.
1 -
4,57
9.8
2,2
51.1
- -
Aus
tria
- -
- -
- -
- -
- -
- -
- -
- -
- -
Fra
nce
- -
- -
- -
- -
- -
- -
- -
- -
- -
Ger
man
y -
- -
- -
- -
- -
- -
- -
- -
- -
-
Por
tuga
l -
- -
- -
- -
- -
- -
- -
- -
- -
-
Spa
in
- -
- -
- -
- -
- -
- -
- -
- -
- -
Rus
sia
- -
- -
- -
- -
- -
- -
- 30
.0
50.0
-
80.
0 8
0.0
Cze
ch R
epub
lic
- -
- -
- -
- -
- -
- -
- -
- -
- -
Bra
zil
- -
420.
0 -
60.3
65
.0
160.
0 6
0.0
70.0
50
.0
490.
0 1,
675.
0 54
5.5
- 91
0.0
- 4,
505.
8 3
,620
.5
Ara
cruz
- -
360.
0 -
- -
- -
- -
- 20
0.0
- -
- -
Bac
ell
- -
- -
- -
- -
- -
- -
- -
- -
Bah
ia Su
l -
- 60
.0
- -
- 14
5.0
- 70
.0
- -
100.
0 -
- -
-
Klab
in
- -
- -
60.3
-
- 6
0.0
- 50
.0
310.
0 -
165.
5 -
- -
Rio
cell
- -
- -
- -
55.0
-
- -
- -
- -
- -
Rip
asa
- -
- -
- -
- -
- -
- 75
.0
- -
- -
Suz
ano
- -
- -
- -
- -
- -
- 40
0.0
- -
- -
Vot
oran
tim
- -
- -
- -
- -
- -
180.
0 90
0.0
380.
0 -
910.
0 -
Chi
le 73
.0
50.0
-
- 50
.0
120.
0 68
0.0
514
.0
250.
0 -
- 43
5.0
134.
0 15
0.0
240.
0 -
2,69
6.0
959.
0
Ara
uco
- -
- -
- -
300.
0 1
82.0
-
- -
335.
0 -
- -
-
CM
PC
73.0
50
.0
- -
- 12
0.0
380.
0 3
32.0
25
0.0
- -
100.
0 12
5.0
150.
0 24
0.0
-

77
Appe
ndix
II:
Fina
ncin
g ra
ised
by
pulp
pro
duce
rs s
ince
199
0 (c
ontin
ued)
Lo
ans
Tota
l
1990
1991
1992
1993
1994
1995
1996
1997
1998
1999
2000
2001
2002
2003
2004
2005
since
199
0sin
ce 2
000
Ven
ezue
la -
16.7
-
15.3
-
- -
- -
- -
- -
- -
- 3
2.0
-
Mex
ico
- -
- -
- -
- -
- -
- -
- -
- -
- -
Sou
th A
frica
-
- -
- 20
0.0
- 10
0.0
379
.5
160.
0 34
6.0
- 90
3.3
- -
- -
2,08
8.8
903.
3
Sap
pi
- -
- -
200.
0 -
100.
0 3
79.5
16
0.0
346.
0 -
903.
3 -
- -
-
Ken
ya
- -
38.0
-
- -
- -
- -
- -
- -
- -
38.
0 -
Aus
tralia
-
- -
- -
- -
- -
195.
6 -
238.
4 27
0.4
- -
- 7
04.4
50
8.8
New
Zea
land
328.
6 18
.0
190.
9 1,
101.
2 18
1.1
600.
0 -
- -
- -
- 25
6.3
- -
- 2,
676.
2 25
6.3
Kor
ea (S
outh
) -
- -
- -
- -
- -
- -
- -
- -
- -
-
Chi
na
- -
- -
- 21
6.2
- -
- -
123.
0 -
- -
- -
339
.2
123.
0
Indi
a -
- -
- -
- 40
.0
18.
0 -
- -
20.0
-
- -
- 7
8.0
20.
0
Indo
nesia
29
.8
- 36
6.2
254.
1 51
5.2
736.
1 1,
028.
1 1,
687.
0 10
0.0
175.
0 36
4.5
452.
6 -
- -
- 5,
708.
5 81
7.1
APP
29
.8
- 31
6.2
36.9
47
5.9
752.
3 42
3.6
400
.0
100.
0 17
5.0
487.
5 -
- -
- -
APR
IL
- -
50.0
21
7.2
39.3
-
- 2
17.0
-
- -
- -
- -
-
Kian
i -
- -
- -
- 40
9.5
120
.0
- -
- 45
2.6
- -
- -
TEL
-
- -
- -
- -
950
.0
- -
- -
- -
- -
Phi
lippi
nes
- -
- -
- -
- -
- -
- -
- -
- -
- -
Tha
iland
-
31.0
4.
3 -
- 80
.0
30.0
9
0.0
- -
- -
- -
- -
235
.3
-
Total
in sa
mpl
e 4,
704.
9 2,
004.
8 3,
358.
5 2,
481.
1 2,
036.
6 5,
108.
6 4,
671.
8 9,
554.
6 4,
148.
9 1,
882.
3 58
,890
.1
65,7
54.5
21
,631
.4
14,7
41.6
14
,798
.9
2,35
7.2
218
,125
.8
178
,173
.8
Oth
er
- -
50.0
-
51.3
-
- -
- 45
.4
65.8
-
- -
- -
212
.5
65.
8
Total
in d
ataba
se
4,70
4.9
2,00
4.8
3,40
8.5
2,48
1.1
2,08
8.0
5,10
8.6
4,67
1.8
9,55
4.6
4,14
8.9
1,92
7.6
58,9
55.9
65
,754
.5
21,6
31.4
14
,741
.6
14,7
98.9
2,
357.
2 2
18,3
38.3
1
78,2
39.6
431.
4 11
5.7
1,01
9.4
1,37
0.6
1,00
6.6
1,81
7.3
2,03
8.1
2,74
8.5
580.
0 76
6.6
977.
5 3,
724.
3 1,
206.
2 18
0.0
1,20
0.0
- 1
9,18
2.3
7,2
88.0

78
Appe
ndix
II:
Fina
ncin
g ra
ised
by
pulp
pro
duce
rs s
ince
199
0 (c
ontin
ued)
Bo
nds
Tota
l
1990
1991
1992
1993
1994
1995
1996
1997
1998
1999
2000
2001
2002
2003
2004
2005
US
- -
- -
- -
- -
- -
2,99
6 2,
557
1,50
4 5,
390
1,89
8 -
14,
344.
8 1
4,34
4.8
Can
ada
- -
- -
- 6
50
- -
320
1
00
1,39
4 5
03
350
5
97
398
-
4,31
2.3
3,2
42.3
Japa
n -
44
- 1
3 5
0 -
- -
429
-
369
8
0 -
1,02
7 6
46
- 2,
656.
7 2
,121
.1
Fin
land
- -
- -
- 3
05
- -
- 2
60
853
1,
008
1,86
5 2
50
1,33
1 -
5,87
2.3
5,3
07.3
Nor
way
- -
- -
- -
- -
- -
- 2
49
- 5
53
250
-
1,05
1.9
1,0
51.9
Swe
den
- -
- -
- -
- -
- 2
62
- -
- -
- -
261
.6
-
- -
Aus
tria
- -
- -
- -
- -
- -
- -
- -
- -
- -
Fra
nce
- -
- -
- -
- -
- -
- -
- -
- -
- -
Ger
man
y -
- -
- -
- -
- -
- -
- -
- -
- -
-
Por
tuga
l -
- -
- -
- -
- -
- -
- -
- -
- -
-
Spa
in
- -
- -
- -
- -
- -
- -
- -
- -
- -
Rus
sia
- -
- -
- -
- -
- -
- -
- -
- -
- -
Cze
ch R
epub
lic
- -
- -
- 1
2 -
- -
- -
- -
- -
- 1
1.6
-
Bra
zil
- -
- 4
80
120
3
00
100
12
0 -
- -
101
5
39
250
1
67
- 2,
175.
8 1
,055
.8
Ara
cruz
- -
- 8
0 1
20
300
-
120
- -
- -
250
-
- -
Bac
ell
- -
- -
- -
- -
- -
- -
- -
- -
Bah
ia Su
l -
- -
- -
- 1
00
- -
- -
101
-
- -
-
Klab
in
- -
- 1
20
- -
- -
- -
- -
289
-
- -
Rio
cell
- -
- -
- -
- -
- -
- -
- -
- -
Rip
asa
- -
- -
- -
- -
- -
- -
- -
- -
Suz
ano
- -
- 8
0 -
- -
- -
- -
- -
- -
-
Vot
oran
tim
- -
- -
- -
- -
- -
- -
- 2
50
- -
Chi
le -
- -
150
-
300
-
400
650
-
599
8
00
13
297
-
- 3,
209.
0 1
,709
.0
Ara
uco
- -
- 1
50
- 3
00
- 40
0 -
- 3
00
400
-
- -
-
CM
PC
- -
- -
- -
- -
650
-
299
4
00
- 2
97
- -

79
Appe
ndix
II:
Fina
ncin
g ra
ised
by
pulp
pro
duce
rs s
ince
199
0 (c
ontin
ued)
Bo
nds
Tota
l
1990
1991
1992
1993
1994
1995
1996
1997
1998
1999
2000
2001
2002
2003
2004
2005
Ven
ezue
la -
- -
- -
- -
- -
- 8
-
- -
- -
7.6
7
.6
Mex
ico
- -
- -
- -
- -
- -
- -
- 1
89
- -
188
.5
188.
5
Sou
th A
frica
-
- -
- -
- -
- 3
64
- -
- 8
57
- -
- 1,
220.
5 85
7.0
Sap
pi
- -
- -
- -
- -
364
-
- -
857
-
- -
Ken
ya
- -
- -
- -
- -
- -
- -
- -
- -
- -
Aus
tralia
-
- -
- -
- -
- -
- -
- -
- -
- -
-
New
Zea
land
- -
- -
- -
- -
- -
- -
- -
- -
- -
Kor
ea (S
outh
) -
- -
- -
- -
- -
- 5
4 1
31
254
1
42
78
- 6
59.5
65
9.5
Chi
na
- -
- -
- -
- -
- -
- -
- -
- -
- -
Indi
a -
- -
- -
- -
- -
- -
- 2
9 -
- -
28.
6 2
8.6
Indo
nesia
-
- -
285
5
00
1,35
0 1,
715
1,9
88
- -
556
-
- -
- -
6,39
3.9
555.
7
APP
-
- -
175
5
00
1,05
0 1,
350
1,9
88
- -
556
-
- -
- -
APR
IL
- -
- 1
10
- 3
00
235
-
- -
- -
- -
- -
Kian
i -
- -
- -
- -
- -
- -
- -
- -
-
TEL
-
- -
- -
- -
- -
- -
- -
- -
-
Phi
lippi
nes
- -
- -
- -
- -
- -
- -
- -
- -
- -
Tha
iland
-
- -
- -
- -
111
- -
- 2
28
- -
- -
339
.0
227.
6
Total
in sa
mpl
e -
43.8
-
927.
5 67
0.0
2,91
6.6
1,81
5.3
2,61
9.4
1,76
2.9
621.
7 6,
828.
0 5,
655.
0 5,
410.
5 8,
695.
1 4,
768.
0 -
42,
733.
7 3
1,35
6.6
Oth
er
- -
- -
- -
- -
- -
- 6
0 2
9 5
9 -
- 1
47.7
14
7.7
Total
in d
ataba
se
- 4
4 -
928
6
70
2,91
7 1,
815
2,6
19
1,76
3 6
22
6,82
8 5,
715
5,43
9 8,
754
4,76
8 -
42,
881.
4 3
1,50
4.3
- -
- 91
5.0
620.
0 1,
961.
6 1,
815.
3 2,
619.
4 1,
013.
5 -
1,21
6.5
1,25
9.0
1,69
1.5
877.
9 24
4.5
- 1
4,23
4.0
5,2
89.3
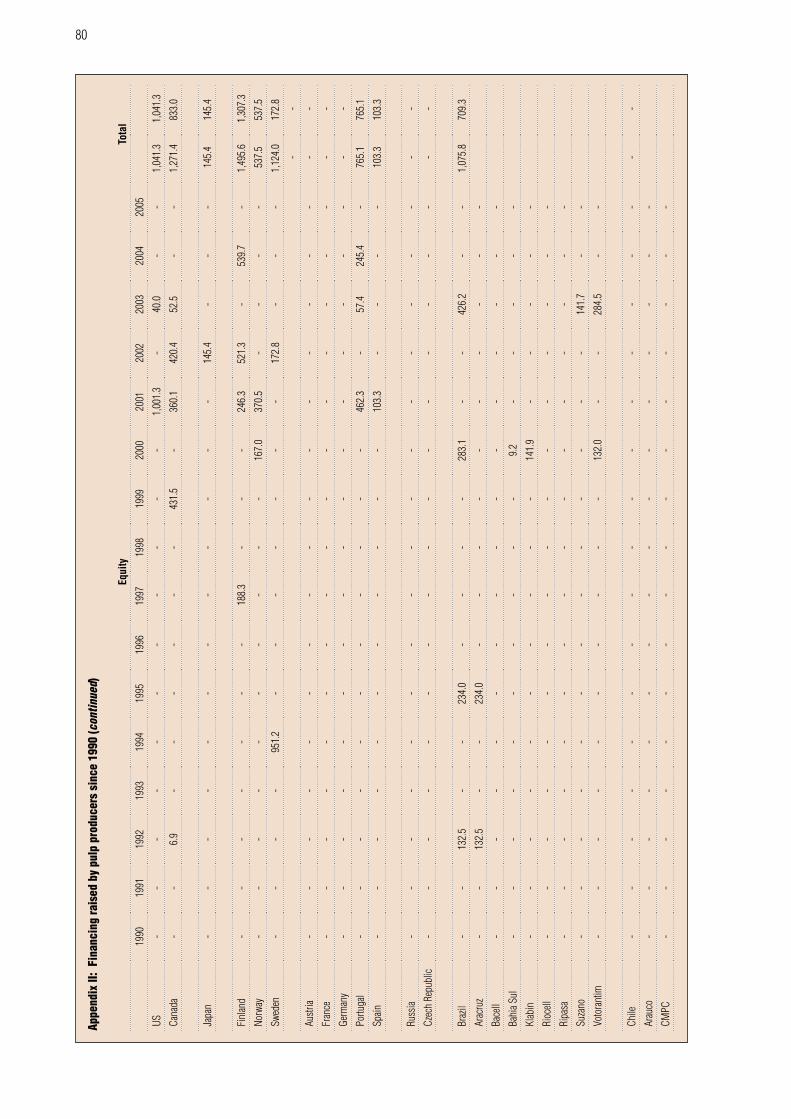
80
Appe
ndix
II:
Fina
ncin
g ra
ised
by
pulp
pro
duce
rs s
ince
199
0 (c
ontin
ued)
Eq
uity
Tota
l
1990
1991
1992
1993
1994
1995
1996
1997
1998
1999
2000
2001
2002
2003
2004
2005
US
- -
- -
- -
- -
- -
- 1,
001.
3 -
40.0
-
- 1,
041.
3 1
,041
.3
Can
ada
- -
6.9
- -
- -
- -
431.
5 -
360.
1 42
0.4
52.5
-
- 1,
271.
4 83
3.0
Japa
n -
- -
- -
- -
- -
- -
- 14
5.4
- -
- 1
45.4
14
5.4
Fin
land
- -
- -
- -
- 1
88.3
-
- -
246.
3 52
1.3
- 53
9.7
- 1,
495.
6 1
,307
.3
Nor
way
- -
- -
- -
- -
- -
167.
0 37
0.5
- -
- -
537
.5
537.
5
Swe
den
- -
- -
951.
2 -
- -
- -
- -
172.
8 -
- -
1,12
4.0
172.
8
- -
Aus
tria
- -
- -
- -
- -
- -
- -
- -
- -
- -
Fra
nce
- -
- -
- -
- -
- -
- -
- -
- -
- -
Ger
man
y -
- -
- -
- -
- -
- -
- -
- -
- -
-
Por
tuga
l -
- -
- -
- -
- -
- -
462.
3 -
57.4
24
5.4
- 7
65.1
76
5.1
Spa
in
- -
- -
- -
- -
- -
- 10
3.3
- -
- -
103
.3
103.
3
Rus
sia
- -
- -
- -
- -
- -
- -
- -
- -
- -
Cze
ch R
epub
lic
- -
- -
- -
- -
- -
- -
- -
- -
- -
Bra
zil
- -
132.
5 -
- 23
4.0
- -
- -
283.
1 -
- 42
6.2
- -
1,07
5.8
709.
3
Ara
cruz
- -
132.
5 -
- 23
4.0
- -
- -
- -
- -
- -
Bac
ell
- -
- -
- -
- -
- -
- -
- -
- -
Bah
ia Su
l -
- -
- -
- -
- -
- 9.
2 -
- -
- -
Klab
in
- -
- -
- -
- -
- -
141.
9 -
- -
- -
Rio
cell
- -
- -
- -
- -
- -
- -
- -
- -
Rip
asa
- -
- -
- -
- -
- -
- -
- -
- -
Suz
ano
- -
- -
- -
- -
- -
- -
- 14
1.7
- -
Vot
oran
tim
- -
- -
- -
- -
- -
132.
0 -
- 28
4.5
- -
Chi
le -
- -
- -
- -
- -
- -
- -
- -
- -
-
Ara
uco
- -
- -
- -
- -
- -
- -
- -
- -
CM
PC
- -
- -
- -
- -
- -
- -
- -
- -
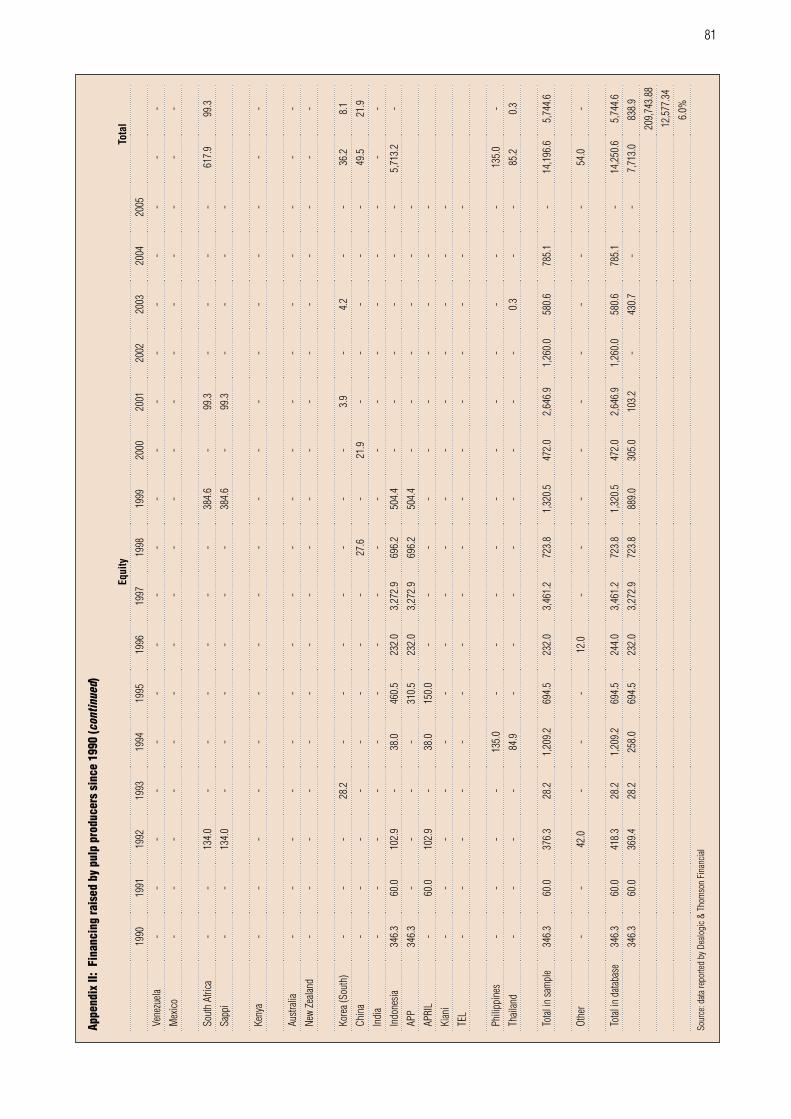
81
Appe
ndix
II:
Fina
ncin
g ra
ised
by
pulp
pro
duce
rs s
ince
199
0 (c
ontin
ued)
Eq
uity
Tota
l
1990
1991
1992
1993
1994
1995
1996
1997
1998
1999
2000
2001
2002
2003
2004
2005
Ven
ezue
la -
- -
- -
- -
- -
- -
- -
- -
- -
-
Mex
ico
- -
- -
- -
- -
- -
- -
- -
- -
- -
Sou
th A
frica
-
- 13
4.0
- -
- -
- -
384.
6 -
99.3
-
- -
- 6
17.9
9
9.3
Sap
pi
- -
134.
0 -
- -
- -
- 38
4.6
- 99
.3
- -
- -
Ken
ya
- -
- -
- -
- -
- -
- -
- -
- -
- -
Aus
tralia
-
- -
- -
- -
- -
- -
- -
- -
- -
-
New
Zea
land
- -
- -
- -
- -
- -
- -
- -
- -
- -
Kor
ea (S
outh
) -
- -
28.2
-
- -
- -
- -
3.9
- 4.
2 -
- 3
6.2
8.1
Chi
na
- -
- -
- -
- -
27.6
-
21.9
-
- -
- -
49.
5 2
1.9
Indi
a -
- -
- -
- -
- -
- -
- -
- -
- -
-
Indo
nesia
34
6.3
60.0
10
2.9
- 38
.0
460.
5 23
2.0
3,27
2.9
696.
2 50
4.4
- -
- -
- -
5,71
3.2
-
APP
34
6.3
- -
- -
310.
5 23
2.0
3,27
2.9
696.
2 50
4.4
- -
- -
- -
APR
IL
- 60
.0
102.
9 -
38.0
15
0.0
- -
- -
- -
- -
- -
Kian
i -
- -
- -
- -
- -
- -
- -
- -
-
TEL
-
- -
- -
- -
- -
- -
- -
- -
-
Phi
lippi
nes
- -
- -
135.
0 -
- -
- -
- -
- -
- -
135
.0
-
Tha
iland
-
- -
- 84
.9
- -
- -
- -
- -
0.3
- -
85.
2 0
.3
Total
in sa
mpl
e 34
6.3
60.0
37
6.3
28.2
1,
209.
2 69
4.5
232.
0 3,
461.
2 72
3.8
1,32
0.5
472.
0 2,
646.
9 1,
260.
0 58
0.6
785.
1 -
14,
196.
6 5
,744
.6
Oth
er
- -
42.0
-
- -
12.0
-
- -
- -
- -
- -
54.
0 -
Total
in d
ataba
se
346.
3 60
.0
418.
3 28
.2
1,20
9.2
694.
5 24
4.0
3,46
1.2
723.
8 1,
320.
5 47
2.0
2,64
6.9
1,26
0.0
580.
6 78
5.1
- 1
4,25
0.6
5,7
44.6
346.
3 60
.0
369.
4 28
.2
258.
0 69
4.5
232.
0 3,
272.
9 72
3.8
889.
0 30
5.0
103.
2 -
430.
7 -
- 7,
713.
0 83
8.9
209
,743
.88
12,
577.
34
6.0%
Sour
ce: d
ata re
porte
d by
Dea
logi
c & T
hom
son
Fina
ncial

82
Appendix III: Scope of the Environmental Assessment for category A & B projects of the Equator Principles
Items covered by the Environmental Assessment are:- baseline environmental and social conditions- requirements under host country laws and regulations, applicable international treaties
and agreements- sustainable development and use of renewable natural resources- protection of human health, cultural properties, and biodiversity, including endangered
species and sensitive ecosystems- use of dangerous substances- major hazards- occupational health and safety- fire prevention and life safety- socioeconomic impacts- land acquisition and land use- involuntary resettlement- impacts on indigenous peoples and communities- cumulative impacts of existing projects, the proposed project, and anticipated future
projects- participation of affected parites in the design, review and implementation of the project- consideration of feasible environmentally and socially preferable alternatives- efficient production, delivery and use of energy- pollution prevention and waste minimization, pollution controls (liquid effluents and air
emissions) and solid and chemical waste management
The Environmental Assessment has to refer to minimum standards applicable under the World Bank and IFC Pollution Prevention and Abatement Guidelines
Source: Equator Principles Statement of Principles, Item 3

Glossary
List of acronyms and abbreviations
ADB Asian Development Bank (www.adb.org)BIS Bank for International Settlements (www.bis.org)CIFOR Center for International Forestry Research (www.cifor.cgiar.org)EA environmental assessmentECA export credit agency (see Appendix I)EBRD European Bank for Reconstruction and Development (www.ebrd.org)EIB European Investment Bank (www.eib.org)EP Equator Principles (www.equator-principles.com)GEF Global Environmental Facility (www.gefweb.org)GRI Global Reporting Initiative (www.globalreporting.org)ha hectareIABD Inter-American Development Bank (www.iadb.org)IFC International Finance Corporation (www.ifc.org)IIED International Institute for Environment and Development (www.iied.org)k abbreviation of 1,000m millionMDB multilateral development bankMIGA Multilateral Investment Guarantee Agency (www.miga.org)NGO Non Governmental OrganisationSEC Securities and Exchange Commission (www.sec.gov)tonne 1,000 kgstpa tonnes per annumWB World Bank (www.worldbank.org)WWF World Wildlife Fund (www.wwf.org)
List of financial terms used in this paper
asset backed A security for which a specially identified pool of assets has been set aside out of the income of which payment of principal and interest on the security will be made.
assets What a company owns. This is used in contrast to liabilities, which is what a company owes. The sum of liabilities and capital equals a company’s assets. Assets are recorded on a balance sheet representing the book values at a given date of resources, rights or items of property owned.

84
balance sheet A schedule of property and obligations of a company as at a given date.
benchmark A security whose yield is taken as a representative reference for securities of a given grade and maturity. Other issues will be priced in relation to the yield on the benchmark. The difference between the two is known as the spread.
bond A debt instrument where the issuer is obliged to pay the holder of the bond periodic interest, and to repay the principal amount on maturity. Bonds are tradable, meaning that they can be bought and sold between investors.
books In a financial context refers to the balance sheet of the bank or underwriter. Keeping paper on the books means the underwriter is not selling (placing) the entire issue with other investors.
capital The proprietary claim in a business, normally being the difference between the total value of a company’s assets less its liabilities.
capital markets Market for long-term loan and equity capital. Companies, governments and other organisations access this market to raise long-term funding directly from investors.
cash flow Hard cash being generated by a business. This is not the same as reported profit, as the latter can be influenced by non-cash charges and timing of recognition of sales revenues.
commercial bank Here refers to a banks that takes (demand) deposits from the general public, and lends them to its clients.
commercial financial institutions
In this paper used to comprise all financial institutions except the multilaterals.
coupon The periodic interest payment made on a debt security.
credit rating An index of reliability of expected repayment normally issued by an officially accredited credit rating agency.
credit risk Risk due to the uncertainty that the obligor or counterparty might not be able to meet his obligations.
debt What is due or owed.
debt security Paper witnessing the obligation of the issuer to pay the holder. A debt security is outstanding for a pre-determined period (tenor or maturity) and pays a pre-determined amount of interest on pre-determined days.
default Failure to comply with the promises made at the time of issuing a security. This relates both to committed payments of interest and principal, and to non-payment related commitments such as not exceeding a certain leverage ratio or not selling one’s productive assets.
dividend Periodic payment made to owners in a business (holders of equity securities) out of the profit derived in a prior period.
equity Witnesses ownership (capital), as opposed to debt, that witnesses an obligation.
equity security A participation in a company’s capital.
export backed security A debt instrument where interest and principal are serviced out of specially seggregated export proceeds from the issuer.

85
fixed income Refers to securities with a pre-determined interest payment schedule. The interest amount may be absolute (as in 5% - fixed rate) or relative by referring to an interest index such as LIBOR for a given period (floating rate). LIBOR is the London Interbank Offered Rate, and refers to how much banks pay for deposits in the relevant currency for the given period.
guarantee A form of credit enhancement in which an entity that is financially stronger than the issuer, agrees to guarantee repayment if the issuer fails to do so. A guarantor can be a related party, such as a parent company, or an unrelated party. In the latter case one typically deals with an insurance company that sells the guarantee for a fee.
income statement A reconciliation of the result of a company’s business activities resulting in sales of goods and services, with the net profit derived from these.
insurance company A company providing insurance to its policy holders, by collecting money from each of them and holding this against future obligations that arise should certain events materialise. The funds an insurance company thus accrues are to be held as reserves against such events materialising, and until such time that the company’s liability expires. Insurance companies exist in two major types, property and casualty, that typically provide insurance on a yearly-rolling basis, and life insurance companies. Life insurance companies typically have long-dated obligations to their policy holders, and are major buyers (and holders) of long-term debt securities.
interest rate Periodic compensation paid by the borrower to the lender.
investment grade Refers to a credit rating of BBB- or higher (on Standard and Poor’s scale, where AAA+ is the highest rating given, and D the lowest).
issuer Refers to the company or body selling the security being offered.
leverage The proportion of debt and equity carried by a company. The higher the portion of debt relative to equity, the higher the leverage.
liabilities Any item of indebtedness, whether interest bearing or not. Liabilities are recorded on a balance sheet representing the book values at a given date of a company’s obligations.
loan Advance of money to a creditor who in turn commits to pay periodic interest, and to repay principal based on an agreed repayment schedule. Unlike a bond, which is negotiable (tradable), a loan is granted directly by the lender to the borrower, and only sold between lenders in exceptional cases.
maturity Date when the principal portion of a debt instrument (loan or bond) is due to be repaid.
merchant bank [in contrast to a commercial bank] A bank that provides in the banking needs of corporations, typically by arranging to place securities. Merchant banks are not licensed to take deposits from the public.
obligor Borrower; entity responsible for repayment of a debt security.
orgination The process of arranging to place, on behalf of an issuer, debt or equity securities with investors.
paper In a financial context refers to any type of traded debt security (so not equity, nor a loan).

86
par 100% of the face value of a bond. A bond can trade at, above or below par, but is normally redeemed at par.
placing The process of selling securities to investors by underwriters.
portfolio The securities held by an investor or a financial house.
primary market The (virtual) space in which securities pass from their issuer to the first investor, resulting in new inflows of capital or debt to the issuer.
project finance A financing package especially structured to support a proposed new project. The repayment of the package will be out of the cash flow to be generated by the project to be financed, as opposed to based on the existing cash flow generating ability of the sponsoring company.
public company A company whose shares are quoted on a stock exchange, and can be bought by members of the general public.
redemption The repayment of a debt security on its maturity or call-date.
registration The process of registering the information relating to a security to be sold to the relevant regulatory authority. This process is mandatory in certain countries if one has the intention of offering said securities for sale to inhabitants of that country. When a security has not been registered in a market where such registration is a requirement, it has so-called <selling-restrictions>
repayment risk The possibility that the issuer of a security fails to redeem the issue on maturity.
restructuring Corporate reorganisation. Typically relates to cases where a company can no longer meet its liabilities, as a result of which either the company or the liabilities will be reorganised in a manner that makes future repayment again a possibility.
risk The possibility of loss. Securities with a higher risk typically yield more than lower risk securities in order to make them attractive to holders.
risk preference An investors’ trade-off between the possibility of loss and the enhanced yield that higher risk securities bring.
secondary market A (virtual) market where holders of already issued securities sell these to others. In case of equity (shares) this market is physically present in the form of the stock exchange, bonds are traded between banks, in no fixed location.
security Tradable debt or equity issued by a company or other legal entity.
share Fractional ownership in the capital of a company.
sovereign Supreme power, here referring to a national government.
stock Equity or shares.
spread (yield ~) The difference between the yield on a given security with that of another, typically, benchmark security.
syndicate All participants in a syndicated loan.
syndicated loan A large loan that is originated by one bank and placed with a number of other banks.
tenor Number of years until the redemption of a debt security.
underwriter The institution that commits to buy a security from an issuer in case the issue fails to sell.
weighting The allocation of a proportion of an investment portfolio to a given type of security/risk.

The Center for International Forestry Research (CIFOR) is a leading international forestry research organization established in 1993 in response to global concerns about the social, environmental, and economic consequences of forest loss and degradation. CIFOR is dedicated to developing policies and technologies for sustainable use and management of forests, and for enhancing the well-being of people in developing countries who rely on tropical forests for their livelihoods. CIFOR is one of the 15 Future Harvest centers of the Consultative Group on International Agricultural Research (CGIAR). With headquarters in Bogor, Indonesia, CIFOR has regional offi ces in Brazil, Burkina Faso, Cameroon and Zimbabwe, and it works in over 30 other countries around the world.
DonorsThe Center for International Forestry Research (CIFOR) receives its major funding from governments, international development organizations, private foundations and regional organizations. In 2004, CIFOR received fi nancial support from Australia, African Wildlife Foundation (AWF), Asian Development Bank (ADB), Belgium, Brazil, Canada, Carrefour, China, CIRAD, Conservation International Foundation (CIF), European Commission, Finland, Food and Agriculture Organization of the United Nations (FAO), Ford Foundation, France, German Agency for Technical Cooperation (GTZ), German Federal Ministry for Economic Cooperation and Development (BMZ), Indonesia, International Development Research Centre (IDRC), International Fund for Agricultural Development (IFAD), Innovative Resource Management (IRM), International Tropical Timber Organization (ITTO), Italy, Japan, Korea, Netherlands, Norway, Organisation Africaine du Bois (OAB), Overseas Development Institute (ODI), Peruvian Institute for Natural Renewable Resources (INRENA), Philippines, Sweden, Swedish University of Agricultural Sciences (SLU), Switzerland, The Overbrook Foundation, The Nature Conservancy (TNC), Tropical Forest Foundation, United States, United Kingdom, United Nations Environment Programme (UNEP), Waseda University, World Bank, World Resources Institute (WRI) and World Wide Fund for Nature (WWF).

An Appraisal of Risk Assessmentand Safeguard Procedures
Financing Pulp Mills
Financing Pulp Mills
An Appraisal of Risk Assessment and Safeguard Procedures
Machteld Spek
Machteld Spek
An Appraisal of Risk Assessmentand Safeguard Procedures
Financing Pulp Mills
Establishing wood pulp manufacturing capacity is a complex issue as it involves both a potentially pollutive production process and a need for large volumes of wood fibre to run the mill. In recent years, advances in pulping technology have meant that clean manufacturing is now available to those willing to pay for it. However, substantial increases in the scale of pulp production facilities have also meant that individual mills now consume increasingly large volumes of wood fibre. Many producers, particularly in tropical and sub-tropical regions, have sought to secure their fibre resources through the development of fast-growing plantations.
This study analyses the risk assessment and socio-environmental safeguard procedures associated with the financing of pulp mill projects. The type and cost of the fibre source is clearly key to the economic competitiveness of any pulp mill. Nevertheless, investment institutions often carry out only limited assessment of the fibre source of the proposed mill. Although a growing number of financial institutions have adopted policies to employ social and environmental safeguard screening for investments in developing countries and transitioning economies, the scope of such screenings is in fact quite limited and they are often implemented ineffectively. In this way, investment institutions often underestimate both the financial risks associated with pulp mills, as well as their social and environmental impacts.
Most greenfield pulp mill projects developed by new sponsors are subject to safeguard screening. The primary focus of these screenings is on the manufacturing aspects of the mill, and not on fibre supply which in many cases is still years from being realised. This is an inherent weakness. Projections and reports provided by project sponsors are often insufficiently detailed to allow investment institutions to identify weaknesses and omissions. Better results can also be obtained by looking beyond the project at hand to review the project sponsor’s track record in existing and previous ventures.
At the root of better quality risk analysis are higher disclosure levels of non-financial operational information by existing producers. It is these producers who drive most of the expansions, with financing being obtained in unregulated markets and through instruments that are not currently subject to safeguard screening. The quality of the risk assessments that are made is severely limited by the lack of objective and consistent issuer-specific operational information. A platform for such disclosure exists in the UNDP-affiliated Global Reporting Initiative, but as yet, there has been no GRI compliant reporting by the pulp industry. This can change once stakeholders agree that more transparent reporting is a key step toward ensuring better risk and quality assessment of proposed expansion and new investments.
Embargoed For Release until Thursday, 11 May 2006 at 00:01 GMT (7:01 a.m. Jakarta, 11 May) or a.m. papers Thursday, 11 May 2006