Embed Size (px)
Citation preview

Free translation into English for convenience only - French version prevails
Website: www.airfranceklm-finance.com
1
29th October 2014
Financial Year 2014: Third Quarter results
THIRD QUARTER Significant impact of Air France pilot strike: estimated negative impact of 416
million euros on revenues and 330 million euros on operating result Revenues of 6.7 billion euros, stable (+0.2%) like-for-like1 EBITDA2 of 682 million euros, down 21 million euros like-for-like1 Operating result of 247 million euros, down 18 million euros like-for-like1 Tenth quarter of unit cost reduction: unit cost2 down 1.2% like-for-like1 Launch of new strategic plan, Perform 2020
FIRST NINE MONTHS OF 2014 Revenues of 18.7 billion euros, up 0.7% like-for-like1
Operating result of 40 million euros, up 267 million euros like-for-like1 Net result, group share of -514 million euros, improvement of 117 million euros Adjusted net result, group share2
of -231 million euros, improvement of 83 million euros
Net debt of 5.27 billion euros, down 76 million euros compared to 31st December 2013
The Board of Directors of Air France-KLM, chaired by Alexandre de Juniac, met on 28th October 2014
to examine the accounts for the Third Quarter of the Financial Year 2014.
Key data
Third quarter 9 months to 30th september
2014 2013* Change 2014 2013* Change
Revenues (€m) 6,695 7,175 -6.7% 18,700 19,397 -3.6%
Change like-for-like1 +0.2% +0.4%
EBITDA2 (€m) 682 1,079 -397 1,273 1,473 -200
EBITDA margin (%) 10.2 15.0 -4.8 pts 6.8 7.6 -0.8 pts
EBITDA change like-for-like1 -21 +222
Operating result (€m) 247 641 -394 40 193 -153
Operating margin (%) 3.7 8.9 -5.2 pts 0.2 1.0 -0.8 pts
Operating result like-for-like1 -18 +267
Net result, group share (€m) 100 148 -48 -514 -651 +137
Adjusted net result, group share2 (€m) 111 372 -261 -231 -314 +83
Earnings per share (€) 0.34 0.50 -0.16 (1.74) (2.20) +0.46
Diluted earnings per share (€) 0.28 0.39 -0.11 (1.74) (2.20) +0.46
Adjusted earnings per share2 (€) 0.37 1.26 -0.89 (0.78) (1.06) +0.28
Diluted adjusted earnings per share2 (€) 0.30 0.92 -0.62 (0.78) (1.06) +0.28
Operating free cash flow2 (€m) -158 -66 -92 -75 496 -571
Net debt2 at end of period (€m) - - - 5,273 5,348
3 -75
* Restated for IFRIC 21, CityJet reclassified as discontinued operation
1 On a constant currency basis and excluding pilot strike impact
2 See definition in appendix
3 Net debt at 31
st December 2013
2
Third Quarter 2014 activity was strongly affected by 14 days of strike by Air France pilots, which had an estimated negative impact of 330 million euros on the operating result. Total revenues were reduced by an estimated 416 million euros, partly offset by 86 million euros of net savings on costs. The strike led to the cancellation of an estimated 4,249 million ASKs (18% of September ASKs) and 213 million ATKs (16% of September ATKs) resulting in an equivalent cancellation of 4.75 billion EASKs (Equivalent Available Seat Kilometer). Total revenues amounted to 6,695 million euros versus 7,175 million euros in 2013, down 6.7%, but up +0.2% on a constant currency basis and adjusted for the Air France pilot strike (“like-for-like”). Currencies had a negative 78 million euro impact on revenues. Operating costs were 1.3% lower year-on-year and 0.7% lower on a constant currency basis. Ex-fuel, they increased by 0.7% and by 0.8% on a like-for-like basis. Unit cost per EASK
1 was reduced by
1.2%, on a constant currency, fuel price, pension expense and strike adjusted basis, against capacity measured in EASK up by 2.0%, corrected for the strike. The fuel bill amounted to 1,737 million euros, down 6.4%, but slightly up (+0.4%) on a constant currency and strike adjusted basis. Total employee costs including temporary staff were down 1.6% to 1,871 million euros, and by 1.7% on a constant currency basis. On a constant pension expense and adjusted for the strike, they declined by 9 million euros. EBITDA amounted to 682 million euros, a decrease of 397 million euros. On a like-for-like basis, EBITDA decreased by 21 million euros. The operating result stood at 247 million euros versus 641 million euros in 2013, a 394 million euro decrease. Like-for-like, the operating result decreased by 18 million euros. Currencies had a 47 million euro net negative impact on the Third Quarter operating result. The net result, group share stood at 100 million euros against 148 million euros a year ago. It includes the non current result of the Amadeus transaction (187 million euros), mainly offset by the change in value of the fuel hedging portfolio (-172 million euros). On an adjusted basis
4, the net result, group
share stood at 111 million euros against 372 million euros in Q3 2013, a 261 million euro decrease. In the first Nine Months of 2014, total revenues stood at 18,7 billion euros versus 19,4 billion euros in 2013, down 3.6%, but up +0.4% on a like-for-like basis. Currencies had a negative 365 million euro impact on revenues. Operating costs were reduced by 2.8% and by 1.4% on a constant currency basis. Ex-fuel, they decreased by 1.6%, and by 1.0% on a like-for-like basis. The fuel bill amounted to 4,926 million euros, down 6.1%, and down 0.8% on a constant currency and strike adjusted basis. Total employee costs including temporary staff were down 3.1% to 5,651 million euros, and by 3.0% on a constant currency basis. On a constant pension expense, scope and strike adjusted basis, they declined by 115 million euros as a result of the Transform 2015 actions.
EBITDA declined by 200 million euros to 1,273 million euros, resulting in an EBITDA margin of 6.8%, a 0.8 point decrease on 2013. On a like-for-like basis, EBITDA improved by 224 million euros. The operating result stood at 40 million euros versus 193 million euros in 2013. On a like-for-like basis, the operating result improved by 267 million euros. Currencies had a 92 million euro net negative impact on the operating result in the first nine months of 2014. The net result, group share stood at -514 million euros against -651 million euros a year ago. It includes the non-current result of the Amadeus transaction (187 million euros), the change in value of the fuel hedging portfolio (-146 million euros), foreign exchange losses (including the adjustment in the value of the cash held by the Group in Venezuela), and the impairment charges related to the Cargo business. On an adjusted basis
4, the net result, group share stood at -231 million euros against
-314 million in the first nine months of 2013, an 83 million euro improvement. Earnings and diluted earnings per share both stood at -1.74 euros (-2.20 euros in 2013), and at -0.78 euros on an adjusted basis (-1.06 euros in 2013).
4 See definition in appendix
3
Passenger business
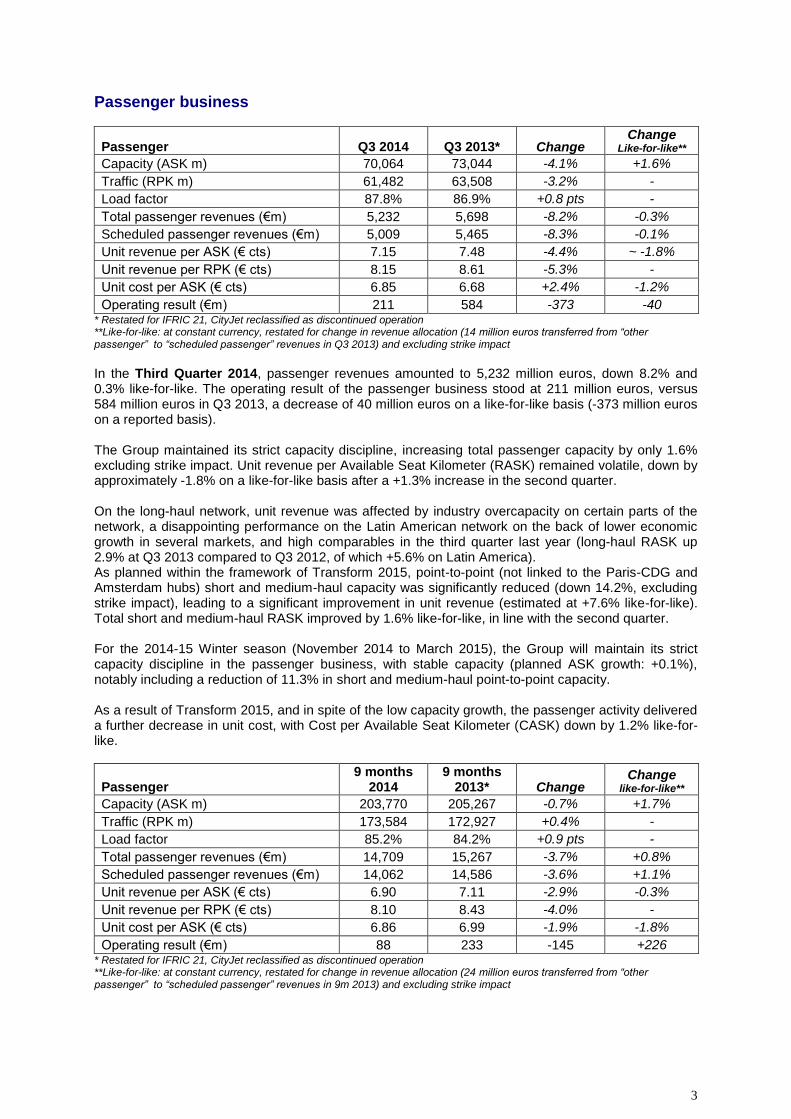
Passenger Q3 2014 Q3 2013* Change Change
Like-for-like**
Capacity (ASK m) 70,064 73,044 -4.1% +1.6%
Traffic (RPK m) 61,482 63,508 -3.2% -
Load factor 87.8% 86.9% +0.8 pts -
Total passenger revenues (€m) 5,232 5,698 -8.2% -0.3%
Scheduled passenger revenues (€m) 5,009 5,465 -8.3% -0.1%
Unit revenue per ASK (€ cts) 7.15 7.48 -4.4% ~ -1.8%
Unit revenue per RPK (€ cts) 8.15 8.61 -5.3% -
Unit cost per ASK (€ cts) 6.85 6.68 +2.4% -1.2%
Operating result (€m) 211 584 -373 -40 * Restated for IFRIC 21, CityJet reclassified as discontinued operation **Like-for-like: at constant currency, restated for change in revenue allocation (14 million euros transferred from “other passenger” to “scheduled passenger” revenues in Q3 2013) and excluding strike impact
In the Third Quarter 2014, passenger revenues amounted to 5,232 million euros, down 8.2% and 0.3% like-for-like. The operating result of the passenger business stood at 211 million euros, versus 584 million euros in Q3 2013, a decrease of 40 million euros on a like-for-like basis (-373 million euros on a reported basis). The Group maintained its strict capacity discipline, increasing total passenger capacity by only 1.6% excluding strike impact. Unit revenue per Available Seat Kilometer (RASK) remained volatile, down by approximately -1.8% on a like-for-like basis after a +1.3% increase in the second quarter. On the long-haul network, unit revenue was affected by industry overcapacity on certain parts of the network, a disappointing performance on the Latin American network on the back of lower economic growth in several markets, and high comparables in the third quarter last year (long-haul RASK up 2.9% at Q3 2013 compared to Q3 2012, of which +5.6% on Latin America). As planned within the framework of Transform 2015, point-to-point (not linked to the Paris-CDG and Amsterdam hubs) short and medium-haul capacity was significantly reduced (down 14.2%, excluding strike impact), leading to a significant improvement in unit revenue (estimated at +7.6% like-for-like). Total short and medium-haul RASK improved by 1.6% like-for-like, in line with the second quarter. For the 2014-15 Winter season (November 2014 to March 2015), the Group will maintain its strict capacity discipline in the passenger business, with stable capacity (planned ASK growth: +0.1%), notably including a reduction of 11.3% in short and medium-haul point-to-point capacity. As a result of Transform 2015, and in spite of the low capacity growth, the passenger activity delivered a further decrease in unit cost, with Cost per Available Seat Kilometer (CASK) down by 1.2% like-for-like.
Passenger 9 months
2014 9 months
2013* Change Change
like-for-like**
Capacity (ASK m) 203,770 205,267 -0.7% +1.7%
Traffic (RPK m) 173,584 172,927 +0.4% -
Load factor 85.2% 84.2% +0.9 pts -
Total passenger revenues (€m) 14,709 15,267 -3.7% +0.8%
Scheduled passenger revenues (€m) 14,062 14,586 -3.6% +1.1%
Unit revenue per ASK (€ cts) 6.90 7.11 -2.9% -0.3%
Unit revenue per RPK (€ cts) 8.10 8.43 -4.0% -
Unit cost per ASK (€ cts) 6.86 6.99 -1.9% -1.8%
Operating result (€m) 88 233 -145 +226 * Restated for IFRIC 21, CityJet reclassified as discontinued operation **Like-for-like: at constant currency, restated for change in revenue allocation (24 million euros transferred from “other passenger” to “scheduled passenger” revenues in 9m 2013) and excluding strike impact
4
In the first Nine Months of 2014, passenger revenues amounted to 14,709 million euros, down 3.7%, but up 0.8% like-for-like. The operating result of the passenger business stood at 88 million euros, versus 233 million euros in the same period last year. Like-for-like, it improved by 226 million euros.
Unit revenue per Available Seat Kilometer (RASK) fell by 2.9% and by 0.3% like-for-like. Unit costs (CASK) were reduced by 1.9%.
Cargo business
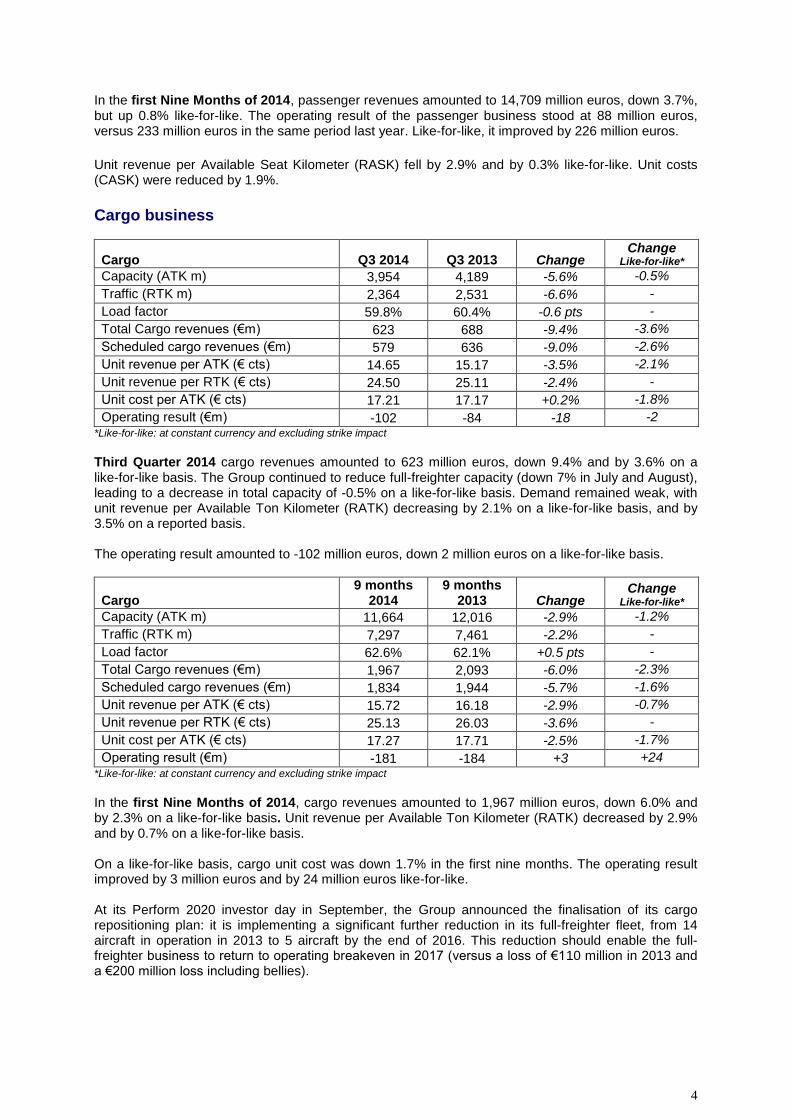
Cargo Q3 2014 Q3 2013 Change Change
Like-for-like* Capacity (ATK m) 3,954 4,189 -5.6% -0.5%
Traffic (RTK m) 2,364 2,531 -6.6% -
Load factor 59.8% 60.4% -0.6 pts -
Total Cargo revenues (€m) 623 688 -9.4% -3.6%
Scheduled cargo revenues (€m) 579 636 -9.0% -2.6%
Unit revenue per ATK (€ cts) 14.65 15.17 -3.5% -2.1%
Unit revenue per RTK (€ cts) 24.50 25.11 -2.4% -
Unit cost per ATK (€ cts) 17.21 17.17 +0.2% -1.8%
Operating result (€m) -102 -84 -18 -2 *Like-for-like: at constant currency and excluding strike impact
Third Quarter 2014 cargo revenues amounted to 623 million euros, down 9.4% and by 3.6% on a like-for-like basis. The Group continued to reduce full-freighter capacity (down 7% in July and August), leading to a decrease in total capacity of -0.5% on a like-for-like basis. Demand remained weak, with unit revenue per Available Ton Kilometer (RATK) decreasing by 2.1% on a like-for-like basis, and by 3.5% on a reported basis. The operating result amounted to -102 million euros, down 2 million euros on a like-for-like basis.
Cargo 9 months
2014 9 months
2013 Change Change
Like-for-like* Capacity (ATK m) 11,664 12,016 -2.9% -1.2%
Traffic (RTK m) 7,297 7,461 -2.2% -
Load factor 62.6% 62.1% +0.5 pts -
Total Cargo revenues (€m) 1,967 2,093 -6.0% -2.3%
Scheduled cargo revenues (€m) 1,834 1,944 -5.7% -1.6%
Unit revenue per ATK (€ cts) 15.72 16.18 -2.9% -0.7%
Unit revenue per RTK (€ cts) 25.13 26.03 -3.6% -
Unit cost per ATK (€ cts) 17.27 17.71 -2.5% -1.7%
Operating result (€m) -181 -184 +3 +24 *Like-for-like: at constant currency and excluding strike impact
In the first Nine Months of 2014, cargo revenues amounted to 1,967 million euros, down 6.0% and by 2.3% on a like-for-like basis. Unit revenue per Available Ton Kilometer (RATK) decreased by 2.9% and by 0.7% on a like-for-like basis. On a like-for-like basis, cargo unit cost was down 1.7% in the first nine months. The operating result improved by 3 million euros and by 24 million euros like-for-like. At its Perform 2020 investor day in September, the Group announced the finalisation of its cargo repositioning plan: it is implementing a significant further reduction in its full-freighter fleet, from 14 aircraft in operation in 2013 to 5 aircraft by the end of 2016. This reduction should enable the full-freighter business to return to operating breakeven in 2017 (versus a loss of €110 million in 2013 and a €200 million loss including bellies).

5
Maintenance
Maintenance Q3 2014 Q3 2013 Change Change
Like-for-like*
Total revenues (€m) 858 827 +3.8% -
Third party revenues (€m) 319 307 +4.2% +5.3%
Operating result (€m) 61 54 +7 +27
Operating margin (%) +7.1% +6.6% +0.5 pt +2.9 pts *Like-for-like: at constant currency and excluding strike impact
Third Quarter 2014 third party maintenance revenues amounted to 319 million euros, up 4.2% and by 5.3% on a constant currency basis, driven by the consolidation of Barfield, a US component support business. The operating result stood at 61 million euros, up 7 million euros year-on-year. The Air France pilot strike had a 22 million euro impact on operating result due to lower internal revenues from the maintenance of the Air France fleet. Excluding strike impact and at constant currency, the operating result was up 27 million euros.
Maintenance 9 months
2014 9 months
2013 Change Change
Like-for-like*
Total revenues (€m) 2,473 2,461 +0.5% -
Third party revenues (€m) 895 927 -3.5% -0.5%
Operating result (€m) 113 111 +2 +31
Operating margin (%) +4.6% +4.5% +0.1 pt +1.2 pt *Like-for-like: at constant currency and excluding strike impact
In the first Nine Months of 2014, third party maintenance revenues amounted to 895 million euros, down 3.5% and by 0.5% on a constant currency basis. The operating result increased by 2 million euros to 113 million euros. Like-for-like, the operating result improved by 31 million euros, representing a 1.2 point increase in operating margin. Over the period, the Group recorded a 20% increase in its order book to 5.3 billion euros, including a major contract with Air China covering the maintenance of GE90 engines.
Other business: Transavia
Transavia Q3 2014 Q3 2013 Change Change
ex currency Capacity (ASK m) 7,700 7,111 +8.3% -
Traffic (RPK m) 7,065 6,665 +6.0% -
Load factor 91.8% 93.7% -1.9 pts -
Total passenger revenues (€m) 427 397 +7.6% +7.6%
Scheduled passenger revenues (€m) 410 388 +5.6% +5.6%
Unit revenue per ASK (€ cts) 5.55 5.58 -0.6% -0.6%
Unit revenue per RPK (€ cts) 6.05 5.98 +1.1% +1.1%
Unit cost per ASK (€ cts) 4.52 4.53 -0.2% +0.4%
Operating result (€m) 62 66 -4 -
In the Third Quarter of 2014, Transavia capacity was up 8.3%, reflecting the accelerated development in France (up 21.4%) and the ongoing repositioning in the Netherlands (with scheduled capacity up 15.3% and charter capacity down 3.7%). Traffic rose 6.0%, and load factor remained high (91.8%, down 1.9 point). Unit revenue was down 0.6%, but up 0.5% in France despite the rapid increase in capacity. Transavia’s total revenue stood at 427 million euros, up 7.6%. The operating result was 62 million euros, down 4 million euros year-on-year.
6
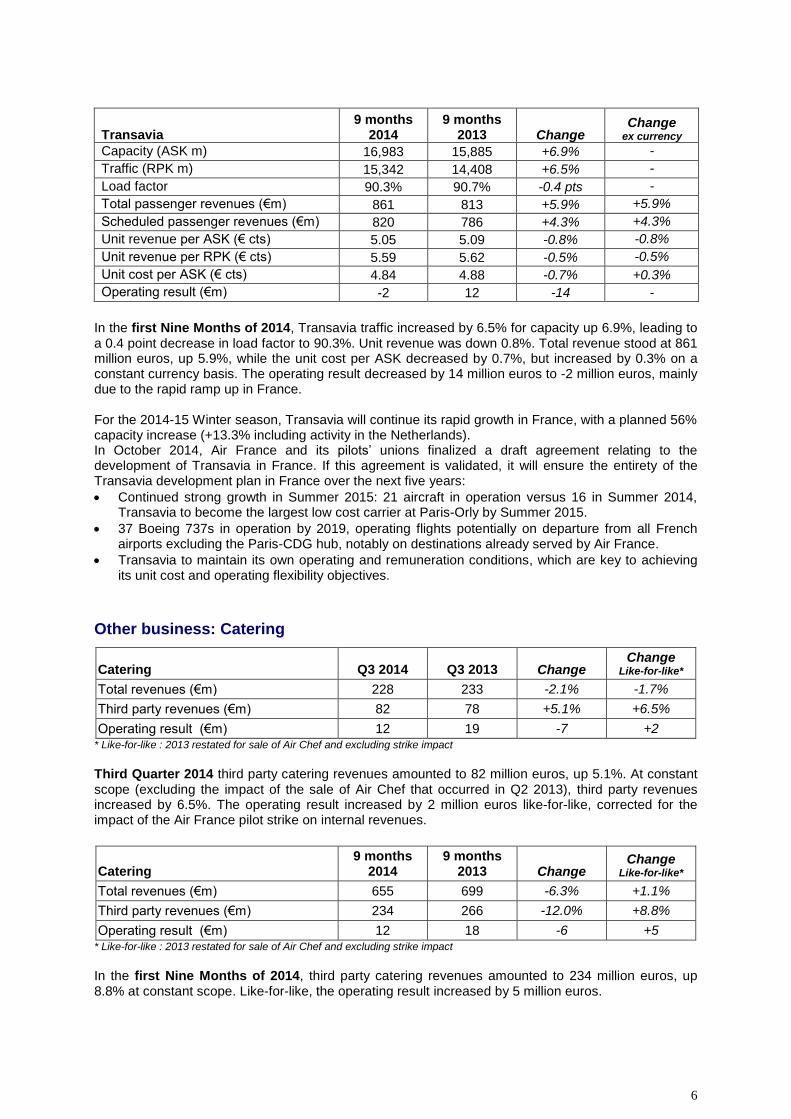
Transavia 9 months
2014 9 months
2013 Change Change
ex currency Capacity (ASK m) 16,983 15,885 +6.9% -
Traffic (RPK m) 15,342 14,408 +6.5% -
Load factor 90.3% 90.7% -0.4 pts -
Total passenger revenues (€m) 861 813 +5.9% +5.9%
Scheduled passenger revenues (€m) 820 786 +4.3% +4.3%
Unit revenue per ASK (€ cts) 5.05 5.09 -0.8% -0.8%
Unit revenue per RPK (€ cts) 5.59 5.62 -0.5% -0.5%
Unit cost per ASK (€ cts) 4.84 4.88 -0.7% +0.3%
Operating result (€m) -2 12 -14 -
In the first Nine Months of 2014, Transavia traffic increased by 6.5% for capacity up 6.9%, leading to a 0.4 point decrease in load factor to 90.3%. Unit revenue was down 0.8%. Total revenue stood at 861 million euros, up 5.9%, while the unit cost per ASK decreased by 0.7%, but increased by 0.3% on a constant currency basis. The operating result decreased by 14 million euros to -2 million euros, mainly due to the rapid ramp up in France. For the 2014-15 Winter season, Transavia will continue its rapid growth in France, with a planned 56% capacity increase (+13.3% including activity in the Netherlands). In October 2014, Air France and its pilots’ unions finalized a draft agreement relating to the development of Transavia in France. If this agreement is validated, it will ensure the entirety of the Transavia development plan in France over the next five years:
Continued strong growth in Summer 2015: 21 aircraft in operation versus 16 in Summer 2014, Transavia to become the largest low cost carrier at Paris-Orly by Summer 2015.
37 Boeing 737s in operation by 2019, operating flights potentially on departure from all French airports excluding the Paris-CDG hub, notably on destinations already served by Air France.
Transavia to maintain its own operating and remuneration conditions, which are key to achieving its unit cost and operating flexibility objectives.
Other business: Catering
Catering Q3 2014 Q3 2013 Change Change
Like-for-like*
Total revenues (€m) 228 233 -2.1% -1.7%
Third party revenues (€m) 82 78 +5.1% +6.5%
Operating result (€m) 12 19 -7 +2 * Like-for-like : 2013 restated for sale of Air Chef and excluding strike impact
Third Quarter 2014 third party catering revenues amounted to 82 million euros, up 5.1%. At constant scope (excluding the impact of the sale of Air Chef that occurred in Q2 2013), third party revenues increased by 6.5%. The operating result increased by 2 million euros like-for-like, corrected for the impact of the Air France pilot strike on internal revenues.
Catering 9 months
2014 9 months
2013 Change Change
Like-for-like*
Total revenues (€m) 655 699 -6.3% +1.1%
Third party revenues (€m) 234 266 -12.0% +8.8%
Operating result (€m) 12 18 -6 +5 * Like-for-like : 2013 restated for sale of Air Chef and excluding strike impact
In the first Nine Months of 2014, third party catering revenues amounted to 234 million euros, up 8.8% at constant scope. Like-for-like, the operating result increased by 5 million euros.

7
Financial situation
In € million 9 months
2014 9 months
2013* Change
Cash flow before change in Working Capital Requirement, Voluntary Departure Plans, continued operations 888 1071 -183
Cash out related to Voluntary Departure Plans -162 -106 +56
Change in WCR +272 +317 -45
Operating cash flow 998 1,282 -284
Net investments before sale & lease-back -1,106 -897 +209
Sale & lease-back transactions +33 +111 -78
Net investments after sale & lease-back -1,073 -786 +287
Operating free cash flow -75 +496 -571 * Restated for IFRIC 21, CityJet reclassified as discontinued operation
In the first Nine Months of 2014, the fall of 200 million euros in EBITDA, primarily due to the Air France pilot strike, translated into a 183 million euro reduction in cash flow before change in WCR and cash out related to Voluntary Departure Plans. The Group disbursed 162 million euros for Voluntary Departure Plans representing nearly all of the cash out expected in the Financial Year. Change in WCR was also affected by the strike, with delayed sales partly offset by not yet processed reimbursements. Net investments before sale & lease-back transactions stood at 1,106 million euros. As a result, operating free cash flow amounted to minus 75 million euros, versus a positive 496 million euros a year earlier. Operating free cash flow does not incorporate free cash flow from financial investments, including the cash-in of 339 million euros from the sale of Amadeus shares in September. Net debt amounted to 5.27 billion euros at 30
th September 2014, versus 5.35 billion euros at 31
st
December 2013. The 12 months trailing net debt / EBITDA ratio stood at 3.2x at 30 September 2014 compared to 3.1x at 31
st December 2013. Corrected for the strike impact, it was down to 2.7x.
Outlook
Delivery on the Transform 2015 plan is fully on track, and several key initiatives of Perform 2020, the new strategic plan covering the period 2015-2020, have been launched. In July, the tough operating environment led the Group to revise its 2014 EBITDA target to between 2.2 and 2.3 billion euros. Long-haul industry capacity growth remains high, though lower in comparison to the summer season, and economic activity is recovering slowly in Europe. In addition to the 330 million euro direct impact of the Air France pilot strike on the third quarter operating result, the Group noted the build-up of a delay in fourth quarter booking trends, without being able precisely to apportion responsibility for this delay between the strike and the unfavorable demand trend seen since the early summer and subsequently confirmed. The Group estimates that part of this delay could be progressively reduced over the coming weeks, without being able to quantify this adjustment exactly given the exceptional nature of the event. As announced on 8 October 2014, all of the above elements could have an impact of around 500 million euros on EBITDA for the 2014 financial year. Moreover, while continuing to implement the Perform 2020 plan, the Group has the firm intention to limit the financial consequences of the pilot strike and of the weaker unit revenue trend that developed over the past summer. This will be achieved thanks to the further adaptation of its investment plan, the acceleration of unit cost reduction measures, and through dynamic management of its asset portfolio.
*****
8
The Third Quarter 2014 accounts are not audited by the Statutory Auditors. The results presentation is available at www.airfranceklm-finance.com on 29
th October 2014 from
7:15am CET. A conference call hosted by Pierre-François Riolacci, Chief Financial Officer of Air France-KLM will be held on 29th October 2014 at 08.00 CET. To access the conference call, please dial: - France: +33 1 70 99 32 12 (code: 948694, password: AKH) - Netherlands: +31 20 7965 012 (code: 948694, password: AKH) - UK: +44 207 162 0125 (code: 948694, password: AKH) - US: +1 334 323 6203 (code: 948694, password: AKH) To listen to a recording of the conference call in English, please dial:
- France: +33 1 70 99 35 29 (code: 948694) - Netherlands: +31 20 7965 345 (code: 948694) - UK: +44 20 7031 4064 (code: 948694) - US: +1 954 334 0342 (code: 948694)
Investor relations
Press
Bertrand Delcaire France: +33 1 41 56 56 00 Head of Investor Relations Netherlands: +31 20 649 45 45 Tel : +33 1 49 89 52 59 Email: [email protected] Website: www.airfranceklm-finance.com Dirk Voermans Senior manager, Investor Relations Tel : +33 1 49 89 52 60 Email: [email protected]
www.airfranceklm-finance.com www.airfranceklm.com

9
INCOME STATEMENTS
* Restated for IFRIC 21, CityJet reclassified as discontinued
Third Quarter 9 Months to September 30th
In euro millions 2014 2013* Change 2014 2013* Change
Sales 6,695 7,175 -6.7% 18,700 19,397 -3.6%
Other revenues 8 8 0.0% 17 9 88.9%
External Expenses -4,132 -4,220 -2.1% -11,748 -12,103 -2.9%
Aircraft fuel -1,737 -1,855 -6.4% -4,926 -5,245 -6.1%
Chartering costs -120 -120 0.0% -329 -351 -6.3%
Aircraft operating lease costs -216 -227 -4.8% -646 -692 -6.6%
Landing fees and en route charges -494 -503 -1.8% -1,385 -1,397 -0.9%
Catering -161 -157 2.5% -444 -446 -0.4%
Handling charges and other operating costs -417 -359 16.2% -1,099 -1,056 4.1%
Aircraft maintenance costs -336 -339 -0.9% -979 -975 0.4%
Commercial and distribution costs -228 -218 4.6% -665 -652 2.0%
Other external expenses -423 -442 -4.3% -1,275 -1,289 -1.1%
Salaries and related costs -1,819 -1,852 -1.8% -5,506 -5,691 -3.3%
Taxes other than income taxes -37 -40 -7.5% -130 -137 -5.1%
Amortization -392 -395 -0.8% -1,156 -1,163 -0.6%
Depreciation and provisions -43 -43 0.0% -77 -117 -34.2%
Other income and expenses -33 8 N/A -60 -2 2900%
Income from current operations 247 641 -61.5% 40 193 -79.3%
Sales of aircraft equipment 0 -1 -100.0% -5 -5 0.0%
Sales of subsidiaries 0 0 N/A -3 9 N/A
Other non-current income and expenses 192 -222 N/A 78 -241 N/A
Income from operating activities 439 418 5.0% 110 -44 N/A
Income from cash and cash equivalents 18 21 -14.3% 57 60 -5.0%
Cost of financial debt -114 -119 -4.2% -337 -359 -6.1%
Net cost of financial debt -96 -98 -2.0% -280 -299 -6.4%
Foreign exchange gains (losses), net -38 10 N/A -149 44 N/A
Change in fair value of financial assets and liabilities -172 100 N/A -146 -15 -873%
Other financial income and expenses -3 -2 50.0% -38 -10 -280%
Income before tax 130 428 -69.6% -503 -324 -55.2%
Income taxes -23 -140 -83.6% 11 -68 N/A
Net income of consolidated companies 107 288 -62.8% -492 -392 -25.5%
Share of profits (losses) of associates -4 -132 -97.0% -15 -210 92.9%
Income from continuing operations 103 156 -34.0% -507 -602 15.8%
Net income from discontinued operations 0 -3 -100% -4 -41 90.2%
Net income for the period 103 153 -32.7% -511 -643 20.5%
Minority interest -3 -5 -40.0% -3 -8 -62.5%
Net income for the period - Group 100 148 -32.4% -514 -651 21.0%

10
CONSOLIDATED BALANCE SHEET
Assets In € millions
September 30, 2014
December 31, 2013*
Goodwill 250 237
Intangible assets 991 896
Flight equipment 9,122 9,391
Other property, plant and equipment 1,752 1,819
Investments in equity associates 161 177
Pension assets 465 2,454
Other financial assets 1,411 1,963
Deferred tax assets 904 434
Other non-current assets 192 113
Total non current assets 15,248 17,484
Assets held for sale 5 91
Other short term financial assets 806 1,031
Inventories 552 511
Trade receivables 2,030 1,775
Current income tax receivables 64 23
Other current assets 850 822
Cash and cash equivalents 3,213 3,684
Total current assets 7,520 7,937
Total assets 22,768 25,421
* Restated for IFRIC 21, CityJet reclassified as discontinued
Liabilities and equity In € millions
September 30, 2014
December 31, 2013*
Issued capital 300 300
Additional paid-in capital 2,971 2,971
Treasury shares (85) (85)
Reserves and retained earnings (3,472) (941)
Equity attributable to equity holders of Air France-KLM (286) 2,245
Non-controlling interests 35 48
Total Equity (251) 2,293
Provisions and retirement benefits 3,428 3,102
Long-term debt 8,001 8,596
Deferred tax liabilities 15 178
Other non-current liabilities 331 397
Total non-current liabilities 11,775 12,273
Liabilities relating to assets held for sale - 58
Provisions 612 670
Current portion of long-term debt 1,932 2,137
Trade payables 2,332 2,369
Deferred revenue on ticket sales 2,871 2,371
Frequent flyer programs 757 755
Current income tax liabilities 2 2
Other current liabilities 2,617 2,327
Bank overdrafts 121 166
Total current liabilities 11,244 10,855
Total liabilities 23,019 23,128
Total equity and liabilities 22,768 25 421
* Restated for IFRIC 21, CityJet reclassified as discontinued
11
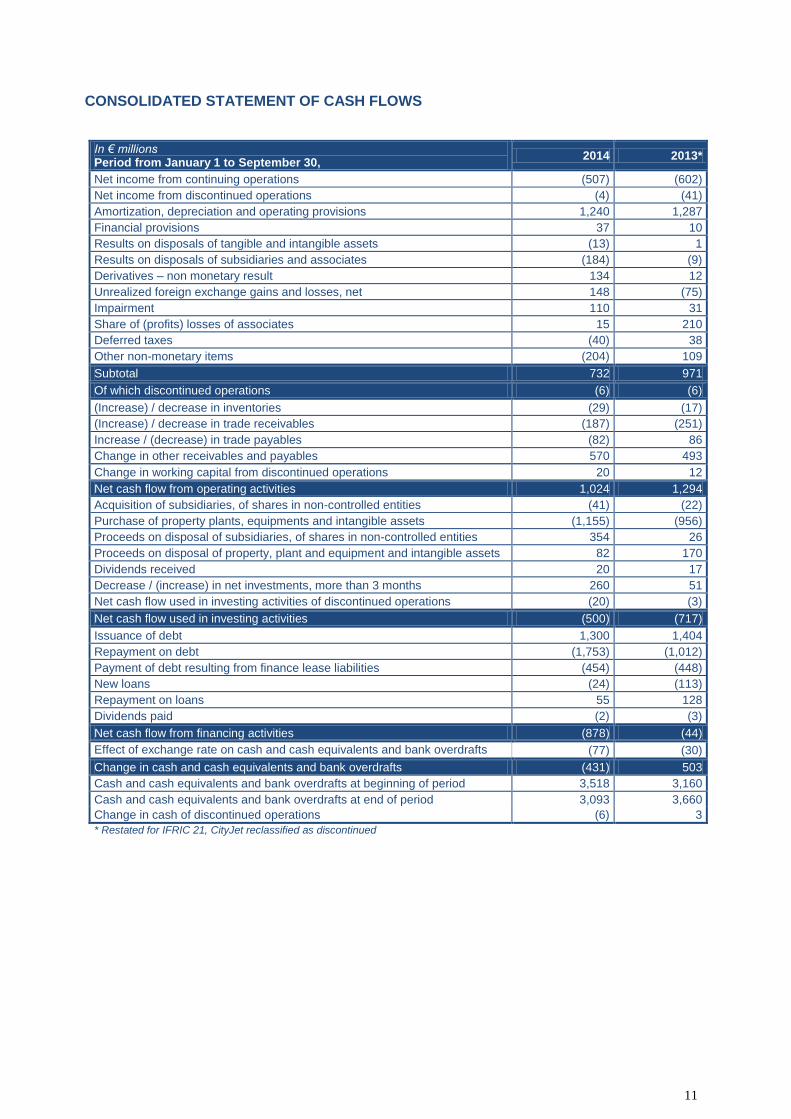
CONSOLIDATED STATEMENT OF CASH FLOWS
In € millions Period from January 1 to September 30,
2014 2013*
Net income from continuing operations (507) (602)
Net income from discontinued operations (4) (41)
Amortization, depreciation and operating provisions 1,240 1,287
Financial provisions 37 10
Results on disposals of tangible and intangible assets (13) 1
Results on disposals of subsidiaries and associates (184) (9)
Derivatives – non monetary result 134 12
Unrealized foreign exchange gains and losses, net 148 (75)
Impairment 110 31
Share of (profits) losses of associates 15 210
Deferred taxes (40) 38
Other non-monetary items (204) 109
Subtotal 732 971
Of which discontinued operations (6) (6)
(Increase) / decrease in inventories (29) (17)
(Increase) / decrease in trade receivables (187) (251)
Increase / (decrease) in trade payables (82) 86
Change in other receivables and payables 570 493
Change in working capital from discontinued operations 20 12
Net cash flow from operating activities 1,024 1,294
Acquisition of subsidiaries, of shares in non-controlled entities (41) (22)
Purchase of property plants, equipments and intangible assets (1,155) (956)
Proceeds on disposal of subsidiaries, of shares in non-controlled entities 354 26
Proceeds on disposal of property, plant and equipment and intangible assets 82 170
Dividends received 20 17
Decrease / (increase) in net investments, more than 3 months 260 51
Net cash flow used in investing activities of discontinued operations (20) (3)
Net cash flow used in investing activities (500) (717)
Issuance of debt 1,300 1,404
Repayment on debt (1,753) (1,012)
Payment of debt resulting from finance lease liabilities (454) (448)
New loans (24) (113)
Repayment on loans 55 128
Dividends paid (2) (3)
Net cash flow from financing activities (878) (44)
Effect of exchange rate on cash and cash equivalents and bank overdrafts (77) (30)
Change in cash and cash equivalents and bank overdrafts (431) 503
Cash and cash equivalents and bank overdrafts at beginning of period 3,518 3,160
Cash and cash equivalents and bank overdrafts at end of period 3,093 3,660
Change in cash of discontinued operations (6) 3
* Restated for IFRIC 21, CityJet reclassified as discontinued

12
KEY FINANCIAL INDICATORS
EBITDA
(In € millions) Q3 2014 Q3 2013* 9M 2014 9M 2013*
Income/(loss) from current operations 247 641 40 193
Amortization 392 395 1,156 1,163
Depreciation and provisions 43 43 77 117
EBITDA 682 1,079 1,273 1,473
* Restated for IFRIC 21, CityJet reclassified as discontinued operation
Adjusted operating result and adjusted operating margin
Q3 2014 Q3 2013* 9M 2014 9M 2013*
Income/(loss) from current operations (in €m) 247 641 40 193
Portion of operating leases corresponding to financial charges (34%) (in €m)
73 77 220 235
Adjusted income/(loss) from current operations (in €m) 320 718 260 428
Revenues (in €m) 6,695 7,175 18,700 19,397
Adjusted operating margin 4.8% 10.0% 1.4% 2.2%
* Restated for IFRIC 21, CityJet reclassified as discontinued operation
Restated net income
Q3 2014 Q3 2013* 9M 2014 9M 2013*
Net income/(loss), Group share (in €m) 100 148 (514) (651)
Net income/(loss) from discontinued operations (in €m) 0 3 4 41
Impairment of Alitalia shares (in €m) 0 119 0 119
Unrealized foreign exchange gains and losses, net (in €m) 31 (21) 148 (75)
Change in fair value of financial assets and liabilities (derivatives) (in €m)
172 (100) 146 15
Non current income and expenses (in €m) (192) 223 (70) 237
Depreciation of shares available for sale (in €m) 0 0 29 0
Cargo deferred tax assets (in €m) 0 0 26 0
Restated net income/(loss) (in €m) 111 372 (231) (314)
Restated net income/(loss) per share (in €) 0.37 1.26 (0.78) (1.06)
* Restated for IFRIC 21, CityJet reclassified as discontinued operation
Net debt
Balance sheet at (In € millions)
September 30, 2014
December 31, 2013
Current and non-current financial debt 9,933 10,733
Deposits on aircraft under finance lease (584) (626)
Financial assets pledged (OCEANE swap) (196) (393)
Currency hedge on financial debt (14) 8
Accrued interest (118) (144)
Gross financial debt (A) 9,021 9,578
Cash and cash equivalents 3,213 3,684
Marketable securities 97 126
Cash pledges 400 432
Deposits (bonds) 159 154
Bank overdrafts (121) (166)
Net cash (B) 3,748 4,230
Net debt (A) – (B) 5,273 5,348

13
Operating free cash flow
(In € millions) 9M 2014 9M 2013**
Net cash flow from operating activities 998 1,282
Investment in property, plant, equipment and intangible assets (1,155) (956)
Proceeds on disposal of property, plant, equipment and intangible assets 82 170
Operating free cash flow* (75) 496
* Excluding discontinued operations ** Restated for IFRIC 21, CityJet reclassified as discontinued operation
Net cost per EASK
Q3 2014 Q3 2013* 9M 2014 9M 2013*
Revenues (in €m) 6,695 7,175 18,700 19,397
Income/(loss) from current operations (in €m) 247 641 40 193
Total operating expense (in €m) (6,448) (6,534) (18,660) (19,204)
Passenger business – other passenger revenues (in €m) 223 232** 647 681**
Cargo business – other air freight revenues (in €m) 44 52 134 148
Third-party revenues in the maintenance business (in €m) 319 306 895 927
Other businesses – revenues other than Transavia transportation (in €m)
111 96 307 332
Net cost (in €m) 5,751 5,848 16,677 17,116
Capacity produced, reported in EASK 88,066 90,995 251,037 252,286
Net cost per EASK (in € cents per ESKO) 6,53 6,43 6,64 6,79
Gross change +1.6% -2.1%
Strike correction -3.7% -1.2%
Currency effect on net costs (in €m) (26) (226)
Change at constant currency -1.7% -2.0%
Fuel price effect (in €m) (20) (84)
Change on a constant currency and fuel price basis -1.3% -1.5%
Defined pension benefit expense included in salaries and related costs (in €m)
99 107 295 318
Net cost per EASK on a constant currency, fuel price and defined benefit pension expense basis (in € cents per EASK)
6,29 6,43 6,55
6,79
Change on a constant currency, fuel price and defined benefit pension expense basis
-1.2% -1.5%
* Restated for IFRIC 21, CityJet reclassified as discontinued operation ** Restated for change in revenue allocation (14 million euros transferred from “other passenger” to “scheduled passenger” revenues in Q3 2013 and 24 million euros in 9M 2013)
INDIVIDUAL AIRLINE RESULTS
Air France
Q3 2014 Q3 2013* 9M 2014 9M 2013*
Revenue (€ bn) 4.02 4.45 11.62 12.20
EBITDA (€m) 269 577 618 793
Operating result (€m) -21 280 -201 -93
* Restated for IFRIC 21, CityJet reclassified as discontinued operation
KLM
Q3 2014 Q3 2013* 9M 2014 9M 2013
Revenue (€ bn) 2.75 2.80 7.31 7.42
EBITDA (€m) 410 502 646 680
Operating result (€m) 265 358 232 281
NB: Sum of individual airline results does not add up to Air France-KLM total due to intercompany eliminations at Group level.

14
GROUP FLEET AT 30 SEPTEMBER 2014 Air France fleet
Aircraft type AF Hop! Transavia Owned Finance
lease Operating
lease Total
In operation
Change / 31/12/13
B747-400 7 3 1 3 7 7
B777-300 37 11 9 17 37 37
B777-200 25 14 3 8 25 25
A380-800 10 2 4 4 10 10 1
A340-300 13 4 6 3 13 13
A330-200 15 4 1 10 15 15
Total long-haul 107 38 24 45 107 107 1
B747-400ERF 2 2 2 2
B777-F 2 2 2 2
Total cargo 4 2 2 4 4
B737-800 14 14 14 14 3
A321 25 6 6 13 25 25
A320 46 8 3 35 46 45 1
A319 41 15 10 16 41 41
A318 18 11 7 18 18
Total short and medium-haul 130 14 40 26 78 144 143 4
ATR72-500 11 1 3 7 11 11 3
ATR72-200 -1
ATR42-500 13 4 4 5 13 13
Canadair Jet 1000 13 13 13 13
Canadair Jet 700 15 12 3 15 13
Canadair Jet 100 11 11 11 4 -3
Embraer 190 10 4 6 10 10
Embraer 170 16 8 2 6 16 16
Embraer 145 19 15 4 19 16 -2
Embraer 135 6 4 2 6 2
Total regional 114 72 18 24 114 98 -3
TOTAL 241 114 14 152 68 149 369 352 2
15
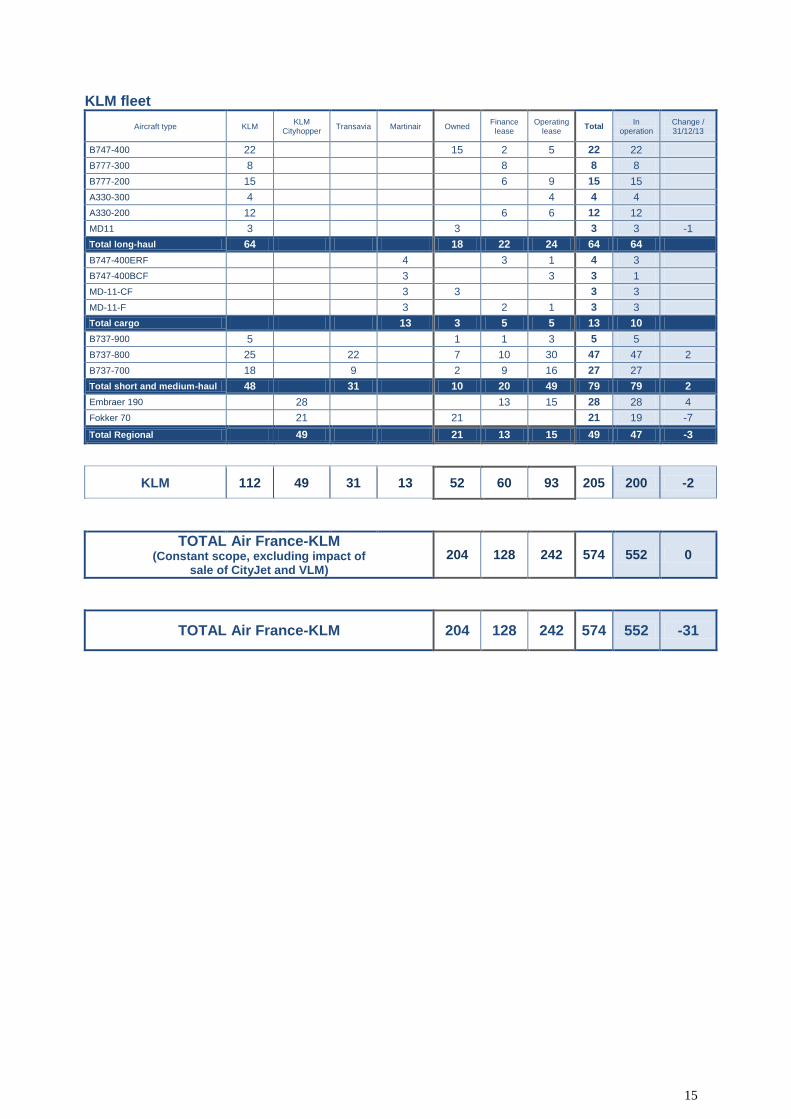
KLM fleet
Aircraft type KLM KLM
Cityhopper Transavia Martinair Owned
Finance lease
Operating lease
Total In
operation Change / 31/12/13
B747-400 22 15 2 5 22 22
B777-300 8 8 8 8
B777-200 15 6 9 15 15
A330-300 4 4 4 4
A330-200 12 6 6 12 12
MD11 3 3 3 3 -1
Total long-haul 64 18 22 24 64 64
B747-400ERF 4 3 1 4 3
B747-400BCF 3 3 3 1
MD-11-CF 3 3 3 3
MD-11-F 3 2 1 3 3
Total cargo 13 3 5 5 13 10
B737-900 5 1 1 3 5 5
B737-800 25 22 7 10 30 47 47 2
B737-700 18 9 2 9 16 27 27
Total short and medium-haul 48 31 10 20 49 79 79 2
Embraer 190 28 13 15 28 28 4
Fokker 70 21 21 21 19 -7
Total Regional 49 21 13 15 49 47 -3
KLM 112 49 31 13 52 60 93 205 200 -2
TOTAL Air France-KLM (Constant scope, excluding impact of
sale of CityJet and VLM) 204 128 242 574 552 0
TOTAL Air France-KLM 204 128 242 574 552 -31