Embed Size (px)
Citation preview

Financial Update
Investment Properties
Development Properties
1

Financial Update Investment Properties Development Properties
2
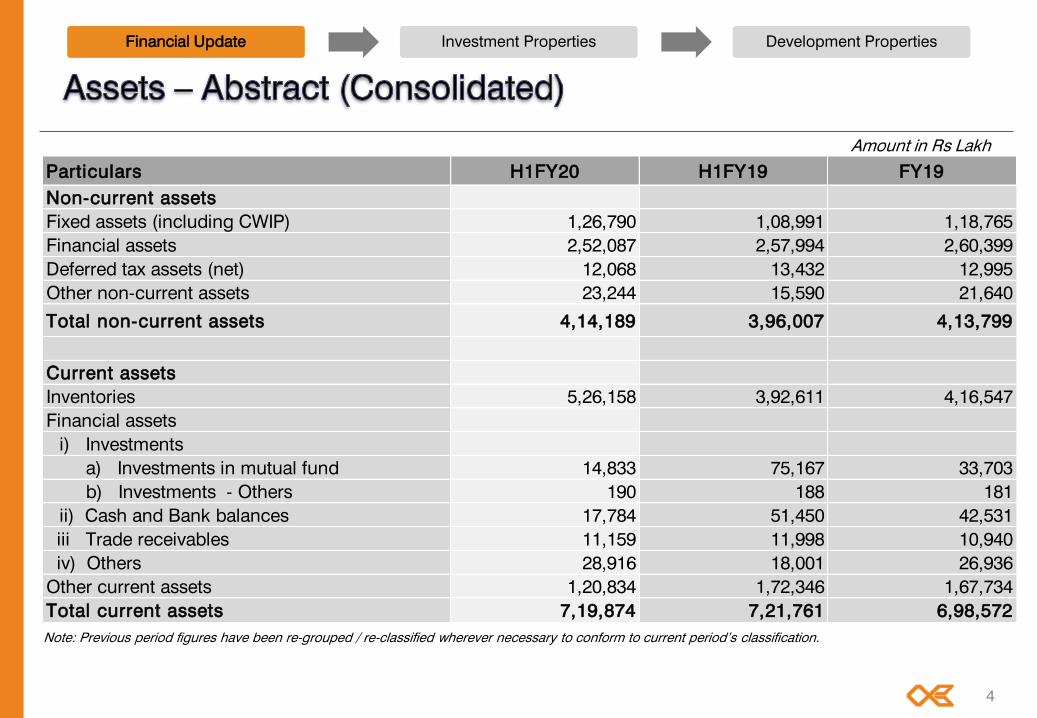
Amount in Rs Lakh
Particulars H1FY20 H1FY19 FY19
Non-current assets 4,14,189 3,96,007 4,13,799
Current assets 7,19,874 7,21,761 6,98,572
Total 11,34,063 11,17,768 11,12,371
Equity 8,23,125 7,72,235 8,02,918
Non-current liabilities 1,03,862 84,022 78,817
Current liabilities 2,07,076 2,61,511 2,30,636
Total 11,34,063 11,17,768 11,12,371
Note: Previous period figures have been re-grouped / re-classified wherever necessary to conform to current period’s classification.

Financial Update Investment Properties Development Properties
3
* Includes Rs. 1,285 lakhs for Q2FY20/H1FY20, Rs 865 lakhs for Q1FY20 , Rs. 2,273 lakhs for Q2FY19/H1FY19 shown under other financial assets
Note: Previous period figures have been re-grouped / re-classified wherever necessary to conform to current period’s classification.
Amount in Rs Lakh
Particulars Q2FY20 Q1FY20 Q2FY19 H1FY20 H1FY19
Opening Cash and Cash Equivalents 60,715 76,738 1,38,804 76,738 12,081
Operating Cash Flows (46,709) 3,608 4,743 (43,102) 28,043
Investing Cash Flows (4,676) (53,790) (83,530) (17,222) (90,764)
Financing Cash Flows 9,735 (7,085) (6,298) 2,650 1,04,359
Closing Cash and Bank Balance * 19,064 19,471 53,719 19,064 53,719
Add: Short-term Liquid Investments 14,833 41,244 75,167 14,833 75,167
Closing Cash and Bank Balance (incl.
Short-term Liquid Investments) 33,897 60,715 1,28,886 33,897 1,28,886
Financial Update Investment Properties Development Properties
4
Note: Previous period figures have been re-grouped / re-classified wherever necessary to conform to current period’s classification.
Amount in Rs Lakh
Particulars H1FY20 H1FY19 FY19
Non-current assets
Fixed assets (including CWIP) 1,26,790 1,08,991 1,18,765
Financial assets 2,52,087 2,57,994 2,60,399
Deferred tax assets (net) 12,068 13,432 12,995
Other non-current assets 23,244 15,590 21,640
Total non-current assets 4,14,189 3,96,007 4,13,799
Current assets
Inventories 5,26,158 3,92,611 4,16,547
Financial assets
i) Investments
a) Investments in mutual fund 14,833 75,167 33,703
b) Investments - Others 190 188 181
ii) Cash and Bank balances 17,784 51,450 42,531
iii Trade receivables 11,159 11,998 10,940
iv) Others 28,916 18,001 26,936
Other current assets 1,20,834 1,72,346 1,67,734
Total current assets 7,19,874 7,21,761 6,98,572

Financial Update Investment Properties Development Properties
5
Note: Previous period figures have been re-grouped / re-classified wherever necessary to conform to current period’s classification.
Amount in Rs Lakh
Particulars H1FY20 H1FY19 FY19
Non-current liabilities
Financial liabilities
i) Borrowings 85,337 65,421 58,851
ii) Trade Payables 1,329 1,971 2,390
iii) Others 11,446 10,040 11,685
Provisions 204 160 197
Deferred tax liabilities (Net) 2,714 3,460 2,600
Other non-current liabilities 2,832 2,970 3,094
Total Non-current liabilities 1,03,862 84,022 78,817
Current liabilities
Financial liabilities
i) Borrowings 47,332 30,973 24,756
ii) Trade Payables 8,092 5,625 20,840
iii) Others 69,556 97,850 1,01,728
Other current liabilities
i) Advance from customers 3,135 4,012 2,638
ii) Others 78,882 1,23,000 80,591
Provisions 79 51 83
Total current liabilities 2,07,076 2,61,511 2,30,636

Financial Update Investment Properties Development Properties
6
Amount in Rs. Lakh (Except EPS)
Particulars Q2FY20 Q1FY20 Q2FY19 H1FY20 H1FY19
Revenue from Projects 35,144 46,321 46,977 81,465 1,23,868
Revenue from Hospitality 3,122 3,186 3,167 6,308 6,205
Revenue from Rent 9,347 9,271 7,797 18,619 15,054
Property Management Revenues 1,282 1,372 1,109 2,654 2,327
Other Operating Revenues 250 175 161 424 583
Revenue from Operations 49,145 60,325 59,211 1,09,470 1,48,037
Non Operating Income 1,364 1,485 2,767 2,849 3,479
Total Income 50,509 61,810 61,978 1,12,319 1,51,516
Total Expenses 31,446 40,302 31,308 71,748 75,516
Profit before share of profit / (loss) of joint
ventures and exceptional items 19,063 21,508 30,670 40,571 76,000
Share of Profit / (loss) of associates 145 124 117 269 226
Profit Before Tax 19,208 21,632 30,787 40,840 76,226
Profit After Tax 13,807 15,207 21,383 29,014 52,325
Other comprehensive income, net of tax 15 6 22 21 45
Total Comprehensive Income for the period 13,822 15,213 21,405 29,035 52,370
Diluted EPS (Rs.) (not annualised) 3.80 4.18 5.88 7.98 14.82
Financial Update Investment Properties Development Properties
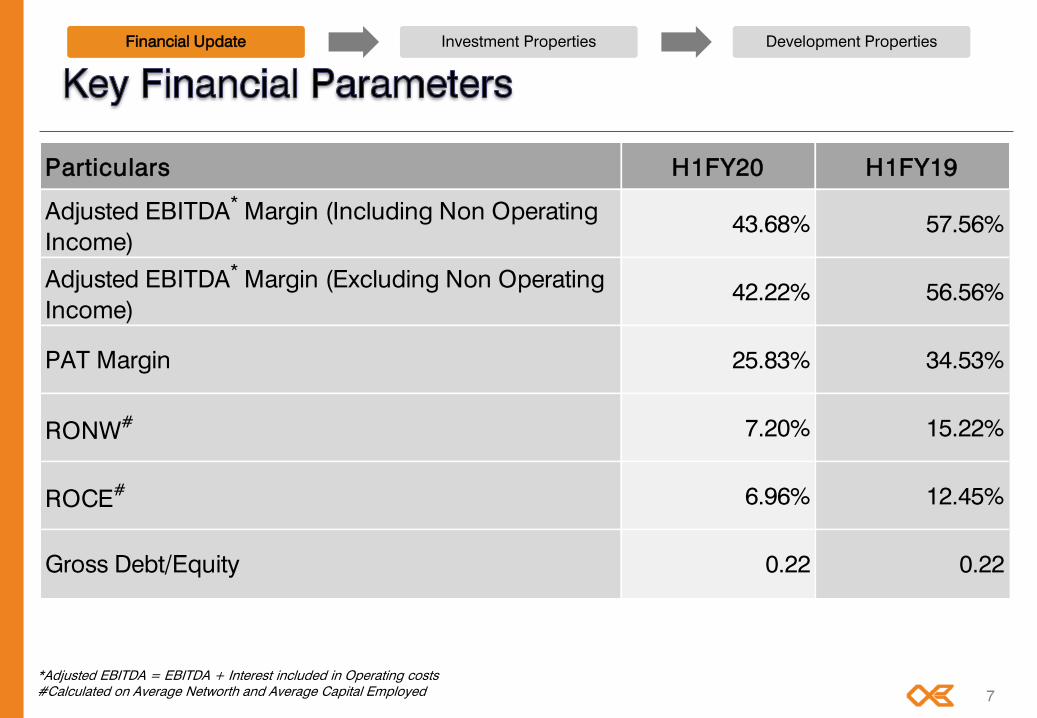
*Adjusted EBITDA = EBITDA + Interest included in Operating costs#Calculated on Average Networth and Average Capital Employed 7
Particulars H1FY20 H1FY19
Adjusted EBITDA* Margin (Including Non Operating
Income)43.68% 57.56%
Adjusted EBITDA* Margin (Excluding Non Operating
Income)42.22% 56.56%
PAT Margin 25.83% 34.53%
RONW# 7.20% 15.22%
ROCE# 6.96% 12.45%
Gross Debt/Equity 0.22 0.22

Financial Update Investment Properties Development Properties
8
* Adjusted EBITDA = EBITDA + Interest included in Operating costs
Amount in Rs Lakh
Particulars Total Residential Rental Hospitality
Property
Management
Services
Q2FY20 46.64% 37.01% 95.85% 33.15% -3.31%
Total Revenues 50,509 36,571 9,399 3,194 1,345
Adjusted EBITDA* 23,557 13,534 9,009 1,059 (45)
H1FY20 43.68% 34.40% 95.84% 33.13% -1.39%
Total Revenues 1,12,319 84,346 18,732 6,453 2,787
Adjusted EBITDA* 49,065 29,012 17,953 2,138 (39)
Q2FY19 62.87% 61.20% 94.73% 37.49% -13.17%
Total Revenues 61,978 49,562 7,993 3,246 1,177
Adjusted EBITDA** 38,966 30,332 7,572 1,217 (155)
H1FY19 57.56% 55.64% 94.43% 34.60% -12.94%
Total Revenues 1,51,516 1,27,410 15,284 6,368 2,454
Adjusted EBITDA* 87,205 70,887 14,433 2,203 (318)

9
Financial Update Investment Properties Development Properties
Note: Closing levels of Sensex and Realty Index as on Oct 20, 2010 was 19,872.15 and 3,787.98 respectively, the same has been indexed to 100
For Oberoi Realty the issue price of Rs. 260/- is indexed to 100.
Ind
ex
20.00 30.00 40.00 50.00 60.00 70.00 80.00 90.00
100.00 110.00 120.00 130.00 140.00 150.00 160.00 170.00 180.00 190.00 200.00 210.00 220.00
20-O
ct-
10
27-J
an
-11
6-M
ay-1
1
13-A
ug
-11
20-N
ov-1
1
27-F
eb
-12
5-J
un
-12
12-S
ep
-12
20-D
ec-1
2
29-M
ar-
13
6-J
ul-13
13-O
ct-
13
20-J
an
-14
29-A
pr-
14
6-A
ug
-14
13-N
ov-1
4
20-F
eb
-15
30-M
ay-1
5
6-S
ep
-15
14-D
ec-1
5
22-M
ar-
16
29-J
un
-16
6-O
ct-
16
13-J
an
-17
22-A
pr-
17
30-J
ul-1
7
6-N
ov-1
7
13-F
eb
-18
23-M
ay-1
8
30-A
ug
-18
7-D
ec-1
8
16-M
ar-
19
23-J
un
-19
30-S
ep
-19
Sensex BSE Realty Index Oberoi Realty

Financial Update Investment Properties Development Properties
10
Category 30-Sep-19 30-Jun-19 31-Mar-19 31-Dec-18 30-Sep-18
Promoter and Promoter Group 67.70% 67.70% 67.70% 67.70% 67.70%
Foreign Institutional Investors (FIIs) 25.77% 26.07% 25.38% 25.40% 25.54%
Domestic Institutional Investors
(Institutional investors other than
FIIs)
4.27% 3.88% 4.39% 4.48% 4.00%
Other public shareholders 2.25% 2.35% 2.53% 2.41% 2.76%
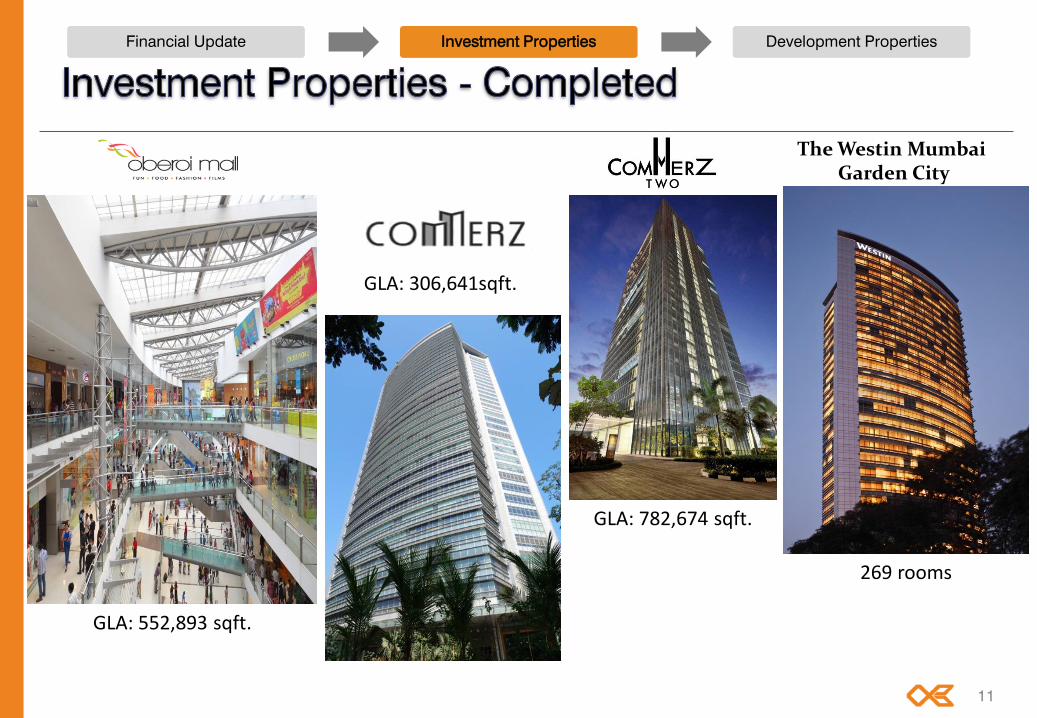
The Westin MumbaiGarden City
GLA: 552,893 sqft.
GLA: 306,641sqft.
269 rooms
Financial Update Investment Properties Development Properties
GLA: 782,674 sqft.
11

Financial Update Investment Properties Development Properties
12
Particulars Q2FY20 Q1FY20 Q2FY19 H1FY20 H1FY19
Operating Revenue (Rs. Lakh) 4,011 3,962 3,750 7,973 7,294
EBITDA (Rs. Lakh) 3,776 3,785 3,567 7,561 6,899
EBITDA Margin (%) 94.13% 95.53% 95.13% 94.83% 94.58%
Occupancy (%) 96.57% 96.57% 96.85% 96.57% 97.08%
Area Leased (Sqft.) 5,33,946 5,33,936 5,35,486 5,33,941 5,36,740
Revenue psf/month on area leased (Rs.) 250 247 233 249 226

Financial Update Investment Properties Development Properties
13
Particulars Q2FY20 Q1FY20 Q2FY19 H1FY20 H1FY19
Operating Revenue (Rs. Lakh) 1,028 1,038 1,012 2,066 2,084
EBITDA (Rs. Lakh) 973 985 990 1,958 2,043
EBITDA Margin (%) 94.67% 94.93% 97.81% 94.80% 98.05%
Occupancy (%) 76.99% 77.35% 77.74% 77.17% 78.12%
Area Leased (Sqft.) 2,36,098 2,46,049 2,47,299 2,45,492 2,48,514
Revenue psf/month on area leased (Rs.) 145 141 136 140 140

Financial Update Investment Properties Development Properties
14
* Calculated after excluding the area under rent free fit out period
Particulars Q2FY20 Q1FY20 Q2FY19 H1FY20 H1FY19
Operating Revenue (Rs. Lakh) 3,028 2,985 1,854 6,013 3,516
EBITDA (Rs. Lakh) 2,897 2,790 1,650 5,687 3,103
EBITDA Margin (%) 95.69% 93.46% 88.99% 94.58% 88.27%
Occupancy (%) 96.94% 95.72% 63.44% 96.33% 63.44%
Area Leased (Sqft.) 7,58,713 7,49,198 4,60,412 7,53,955 4,60,436
Revenue psf/month on area leased (Rs.)* 133 133 134 133 127

Financial Update Investment Properties Development Properties
15
Particulars Q2FY20 Q1FY20 Q2FY19 H1FY20 H1FY19
Operating Revenue (Rs. Lakh) 3,143 3,207 3,208 6,350 6,295
EBITDA (Rs. Lakh) 1,008 1,027 1,065 2,035 2,131
EBITDA Margin (%) 32.07% 32.03% 33.22% 32.05% 33.85%
Number of Rooms 269 269 269 269 269
Average Room Rate (Rs.) 8,588 8,946 8,715 8,767 8,540
Occupancy (%) 78.29% 79.86% 81.05% 79.08% 82.66%
RevPAR (Rs.) 6,717 7,148 7,055 6,933 7,053

Financial Update Investment Properties Development Properties
16
Financial Update Investment Properties Development Properties
17
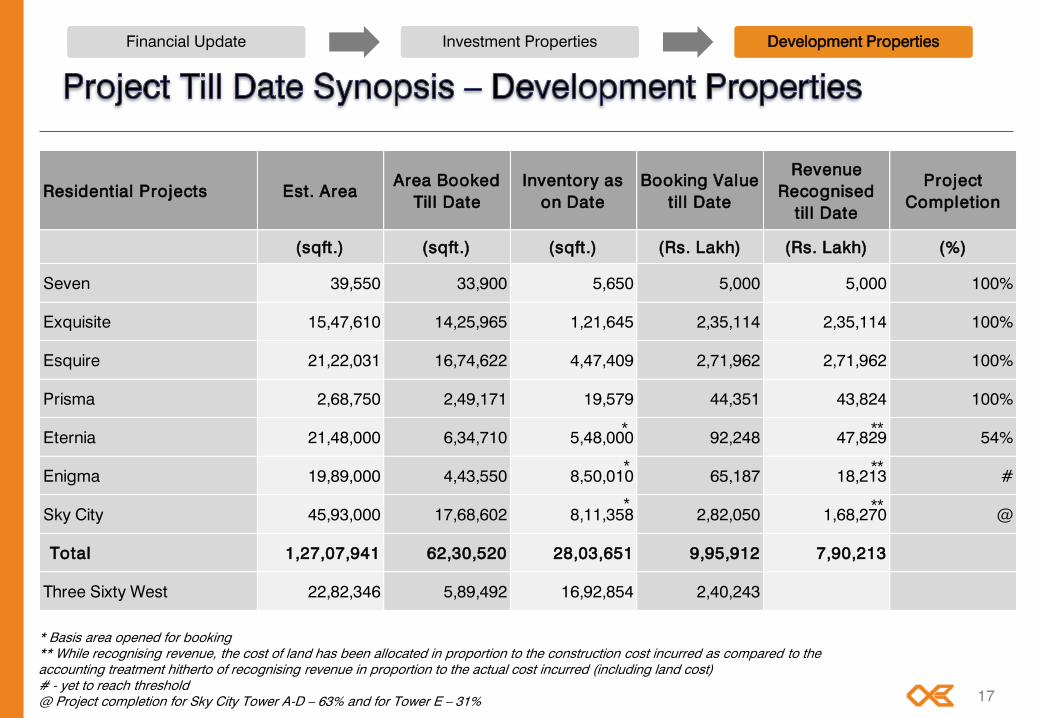
* Basis area opened for booking** While recognising revenue, the cost of land has been allocated in proportion to the construction cost incurred as compared to the accounting treatment hitherto of recognising revenue in proportion to the actual cost incurred (including land cost)# - yet to reach threshold @ Project completion for Sky City Tower A-D – 63% and for Tower E – 31%
Residential Projects Est. AreaArea Booked
Till Date
Inventory as
on Date
Booking Value
til l Date
Revenue
Recognised
til l Date
Project
Completion
(sqft.) (sqft.) (sqft.) (Rs. Lakh) (Rs. Lakh) (%)
Seven 39,550 33,900 5,650 5,000 5,000 100%
Exquisite 15,47,610 14,25,965 1,21,645 2,35,114 2,35,114 100%
Esquire 21,22,031 16,74,622 4,47,409 2,71,962 2,71,962 100%
Prisma 2,68,750 2,49,171 19,579 44,351 43,824 100%
Eternia 21,48,000 6,34,710 5,48,000 92,248 47,829 54%
Enigma 19,89,000 4,43,550 8,50,010 65,187 18,213 #
Sky City 45,93,000 17,68,602 8,11,358 2,82,050 1,68,270 @
Total 1,27,07,941 62,30,520 28,03,651 9,95,912 7,90,213
Three Sixty West 22,82,346 5,89,492 16,92,854 2,40,243
*
*
*
**
**
**

Financial Update Investment Properties Development Properties
18
Residential Projects Area Booked
in Q2FY20
Units Booked
in Q2FY20
Sales Value
for Q2FY20
Amount
Collected in
Q2FY20
Revenue
Recognised
in Q2FY20
(sqft.) (nos.) (Rs. Lakh) (Rs. Lakh) (Rs. Lakh)
Esquire 18,772 8 4,138 5,257 4,645
Prisma 9,171 3 1,937 1,735 1,410
Eternia 18,470 11 2,362 3,279 4,974
Enigma 11,841 4 1,575 3,985 2,093
Sky City 45,073 28 7,245 19,194 22,021
Total 1,03,327 54 17,257 33,450 35,143
Three Sixty West 36,127 4 15,022 36,087

Financial Update Investment Properties Development Properties
19
Particulars Q2FY20 Q1FY20 Q2FY19 H1FY20 H1FY19Project Till
Date
Estimated Total Area (sqft.) 21,22,031 21,22,031 21,22,031 21,22,031 21,22,031 21,22,031
Estimated Total Units (nos.) 882 882 882 882 882 882
Area Booked (sqft) 18,772 63,204 52,322 81,976 1,81,955 16,74,622
Units Booked (nos.) 8 27 22 35 76 697
Area in Inventory (sqft.) 4,47,409 4,66,181 6,05,950 4,47,409 6,05,950 4,47,409
Units in Inventory (nos.) 185 193 251 185 251 185
Booking Value (Rs. Lakh) 4,138 12,408 11,046 16,546 37,784 2,71,962
Amount Collected (Rs. Lakh) 5,257 12,122 19,419 17,379 47,308 2,69,100
Revenue Recognised (Rs. Lakh) 4,645 11,901 11,046 16,546 51,046 2,71,962
Average Rate per sqft (Rs.) 22,045 19,631 21,112 20,184 20,766 16,240

Financial Update Investment Properties Development Properties
20
Particulars Q2FY20 Q1FY20 Q2FY19 H1FY20 H1FY19Project Till
Date
Estimated Total Area (sqft.) 2,68,750 2,68,750 2,68,750 2,68,750 2,68,750 2,68,750
Estimated Total Units (nos.) 91 91 91 91 91 91
Area Booked (sqft) 9,171 8,004 8,397 17,175 22,985 2,49,171
Units Booked (nos.) 3 3 3 6 8 84
Area in Inventory (sqft.) 19,579 28,750 36,754 19,579 36,754 19,579
Units in Inventory (nos.) 7 10 13 7 13 7
Booking Value (Rs. Lakh) 1,937 1,643 1,726 3,580 4,360 44,351
Amount Collected (Rs. Lakh) 1,735 854 6,194 2,589 12,219 43,096
Revenue Recognised (Rs. Lakh) 1,410 1,643 1,726 3,054 10,644 43,824
Average Rate per sqft (Rs.) 21,125 20,528 20,560 20,847 18,968 17,799

Financial Update Investment Properties Development Properties
Artist Impression
21
Financial Update Investment Properties Development Properties
22
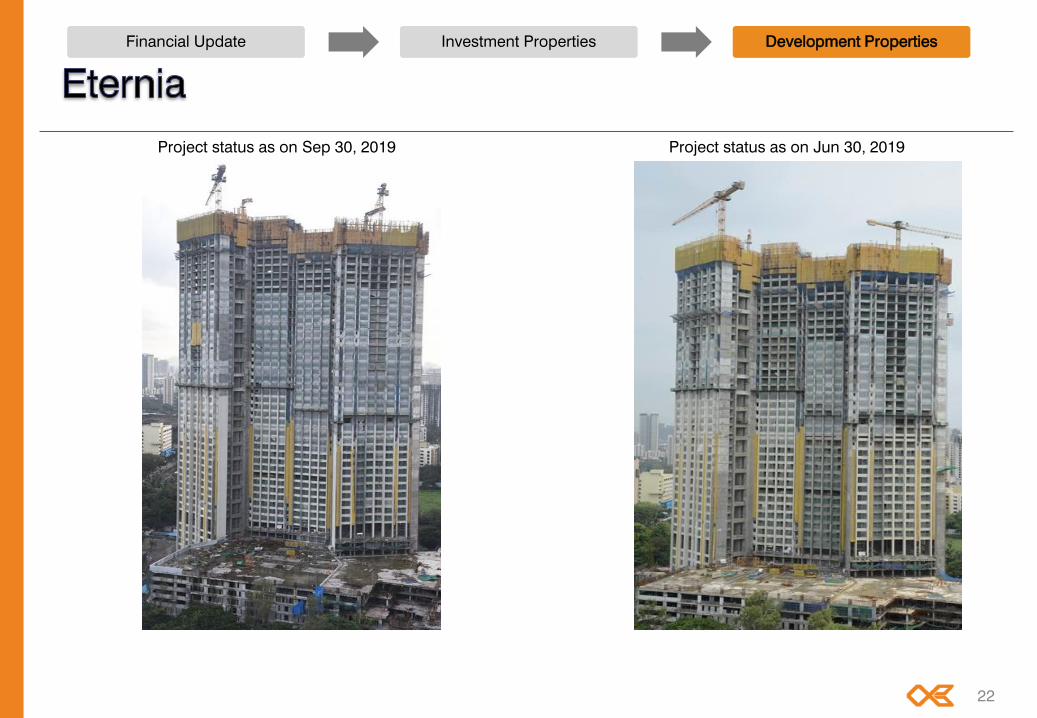
Project status as on Sep 30, 2019 Project status as on Jun 30, 2019

Financial Update Investment Properties Development Properties
23
Particulars Q2FY20 Q1FY20 Q2FY19 H1FY20 H1FY19Project Till
Date
Estimated Area of Project (sqft.) 21,48,000 21,48,000 21,48,000 21,48,000 21,48,000 21,48,000
Estimated Total Units (nos.) 1,277 1,277 1,277 1,277 1,277 1,277
Area opened for booking (sqft.) 11,82,710 11,82,710 8,92,250 11,82,710 8,92,250 11,82,710
Units opened for booking (nos.) 725 725 554 725 554 725
Area Booked (sqft) 18,470 20,260 24,170 38,730 54,360 6,34,710
Units Booked (nos.) 11 12 15 23 34 394
Area in Inventory (sqft.) 5,48,000 5,66,470 3,28,080 5,48,000 3,28,080 5,48,000
Units in Inventory (nos.) 331 342 203 331 203 331
Booking Value (Rs. Lakh) 2,362 2,711 3,464 5,073 7,694 92,248
Amount Collected (Rs. Lakh) 3,279 3,145 4,829 6,424 8,009 55,868
Revenue Recognised (Rs. Lakh) 4,974 5,939 12,066 10,913 14,461 47,829
Average Rate per sqft (Rs.) 12,789 13,382 14,334 13,099 14,154 14,534

Financial Update Investment Properties Development Properties
24

Financial Update Investment Properties Development Properties
25
Project status as on Sep 30, 2019 Project status as on Jun 30, 2019
Financial Update Investment Properties Development Properties
26
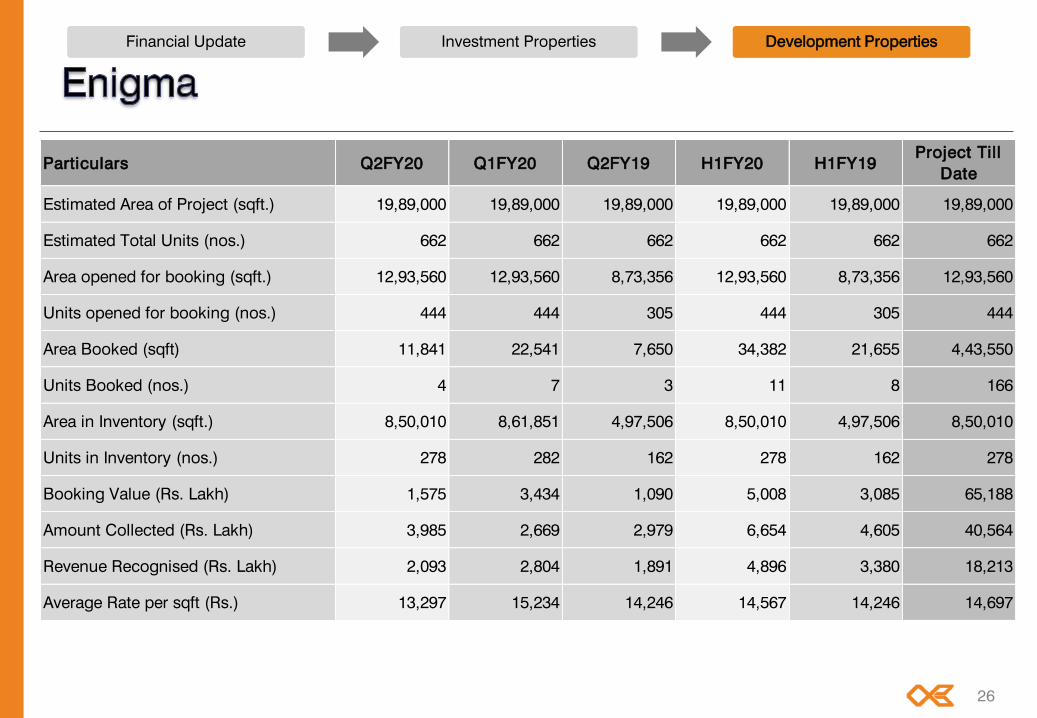
Particulars Q2FY20 Q1FY20 Q2FY19 H1FY20 H1FY19Project Till
Date
Estimated Area of Project (sqft.) 19,89,000 19,89,000 19,89,000 19,89,000 19,89,000 19,89,000
Estimated Total Units (nos.) 662 662 662 662 662 662
Area opened for booking (sqft.) 12,93,560 12,93,560 8,73,356 12,93,560 8,73,356 12,93,560
Units opened for booking (nos.) 444 444 305 444 305 444
Area Booked (sqft) 11,841 22,541 7,650 34,382 21,655 4,43,550
Units Booked (nos.) 4 7 3 11 8 166
Area in Inventory (sqft.) 8,50,010 8,61,851 4,97,506 8,50,010 4,97,506 8,50,010
Units in Inventory (nos.) 278 282 162 278 162 278
Booking Value (Rs. Lakh) 1,575 3,434 1,090 5,008 3,085 65,188
Amount Collected (Rs. Lakh) 3,985 2,669 2,979 6,654 4,605 40,564
Revenue Recognised (Rs. Lakh) 2,093 2,804 1,891 4,896 3,380 18,213
Average Rate per sqft (Rs.) 13,297 15,234 14,246 14,567 14,246 14,697

27
Financial Update Investment Properties Development Properties
Artist Impression

Financial Update Investment Properties Development Properties
Artist Impression
28
Project status as on Sep 30, 2019 Project status as on Jun 30, 2019
Financial Update Investment Properties Development Properties
29
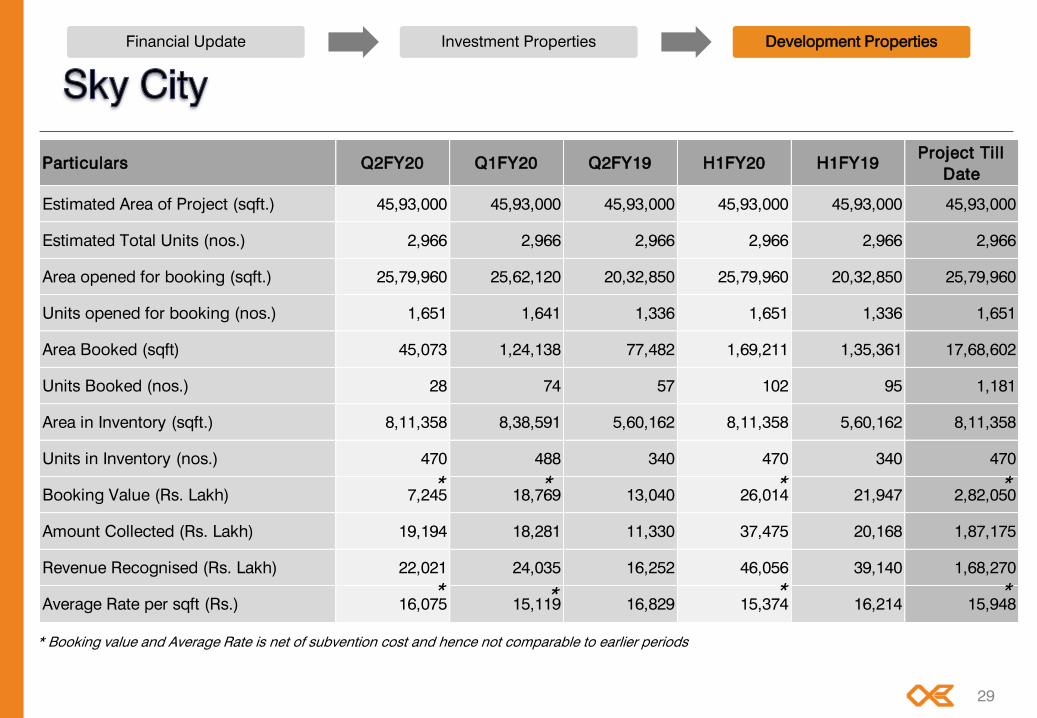
Particulars Q2FY20 Q1FY20 Q2FY19 H1FY20 H1FY19Project Till
Date
Estimated Area of Project (sqft.) 45,93,000 45,93,000 45,93,000 45,93,000 45,93,000 45,93,000
Estimated Total Units (nos.) 2,966 2,966 2,966 2,966 2,966 2,966
Area opened for booking (sqft.) 25,79,960 25,62,120 20,32,850 25,79,960 20,32,850 25,79,960
Units opened for booking (nos.) 1,651 1,641 1,336 1,651 1,336 1,651
Area Booked (sqft) 45,073 1,24,138 77,482 1,69,211 1,35,361 17,68,602
Units Booked (nos.) 28 74 57 102 95 1,181
Area in Inventory (sqft.) 8,11,358 8,38,591 5,60,162 8,11,358 5,60,162 8,11,358
Units in Inventory (nos.) 470 488 340 470 340 470
Booking Value (Rs. Lakh) 7,245 18,769 13,040 26,014 21,947 2,82,050
Amount Collected (Rs. Lakh) 19,194 18,281 11,330 37,475 20,168 1,87,175
Revenue Recognised (Rs. Lakh) 22,021 24,035 16,252 46,056 39,140 1,68,270
Average Rate per sqft (Rs.) 16,075 15,119 16,829 15,374 16,214 15,948
* * **
* * **
* Booking value and Average Rate is net of subvention cost and hence not comparable to earlier periods

Financial Update Investment Properties Development Properties
30
Project Status as on Sep 30, 2019
Amount spent in Q2FY20 : Rs. 73.43 crore
Financial Update Investment Properties Development Properties
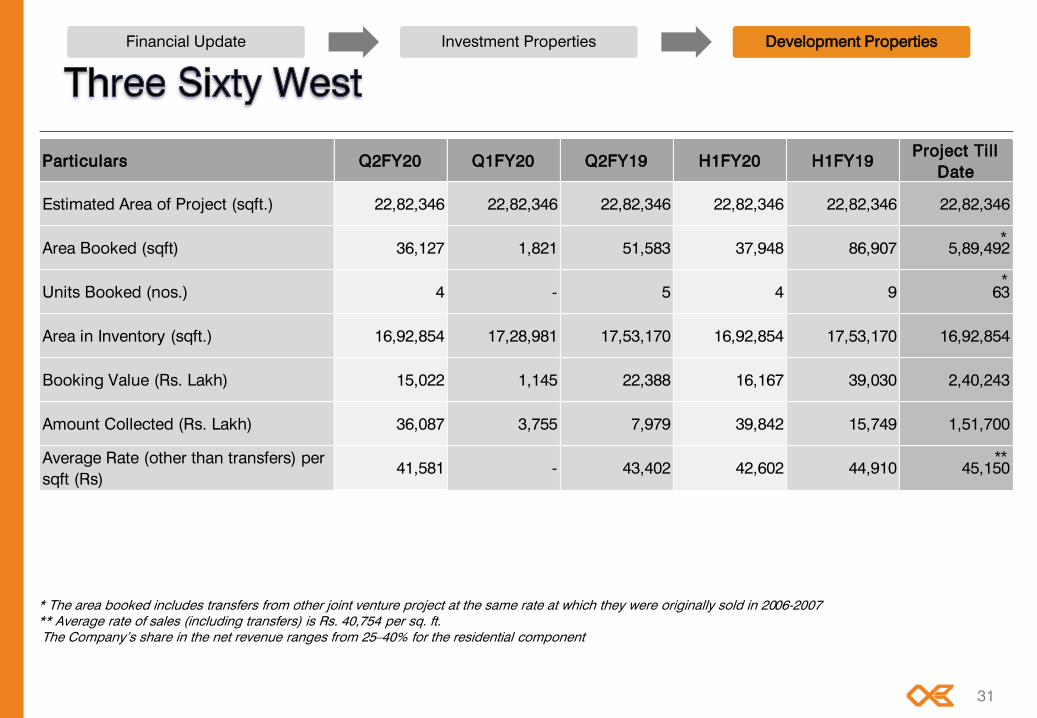
* The area booked includes transfers from other joint venture project at the same rate at which they were originally sold in 2006-2007** Average rate of sales (including transfers) is Rs. 40,754 per sq. ft.The Company’s share in the net revenue ranges from 25–40% for the residential component
31
Particulars Q2FY20 Q1FY20 Q2FY19 H1FY20 H1FY19Project Till
Date
Estimated Area of Project (sqft.) 22,82,346 22,82,346 22,82,346 22,82,346 22,82,346 22,82,346
Area Booked (sqft) 36,127 1,821 51,583 37,948 86,907 5,89,492
Units Booked (nos.) 4 - 5 4 9 63
Area in Inventory (sqft.) 16,92,854 17,28,981 17,53,170 16,92,854 17,53,170 16,92,854
Booking Value (Rs. Lakh) 15,022 1,145 22,388 16,167 39,030 2,40,243
Amount Collected (Rs. Lakh) 36,087 3,755 7,979 39,842 15,749 1,51,700
Average Rate (other than transfers) per
sqft (Rs) 41,581 - 43,402 42,602 44,910 45,150
*
**
*

32Note: Please refer to Annexure and Disclaimer at the end of the presentation
Esquire by Oberoi Realty was awarded “Residential Project of the Year” - Construction Week India Awards
The Westin Mumbai Garden City’s Restaurant “Seasonal Tastes” was recognised as “Favourite Weekend brunch” at the
PeakLife Gourmet Awards
Oberoi Realty awarded “Maharashtra Best Employer Brand” Award 2019
Awards
Key Developments
Successfully concluded the transaction with GlaxoSmithKline Pharmaceuticals Limited for the Thane land parcel after
acquiring necessary approvals and completing the legal documentation
Commerz II fully leased

33
Investor Relation efforts are coordinated by:
Saumil Daru Director - Finance [email protected]
Mayank Kapoor EA to MD and Investor Relations [email protected]
For any further information please write to [email protected] or contact on (+91 22) 6677 3333
34
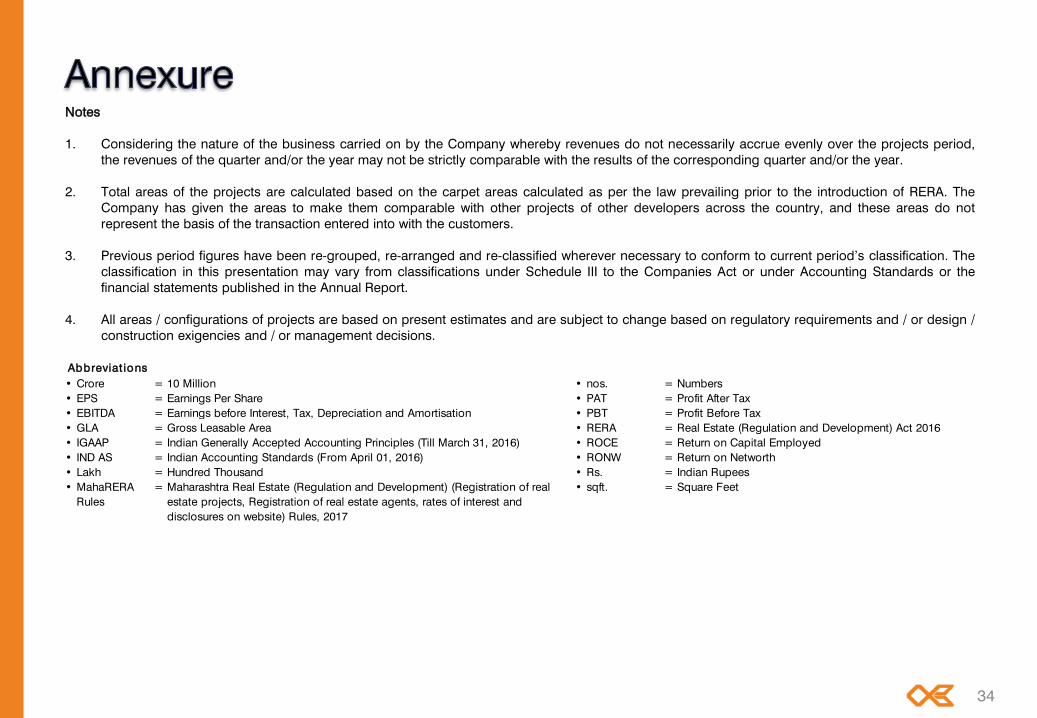
Notes
1. Considering the nature of the business carried on by the Company whereby revenues do not necessarily accrue evenly over the projects period,
the revenues of the quarter and/or the year may not be strictly comparable with the results of the corresponding quarter and/or the year.
2. Total areas of the projects are calculated based on the carpet areas calculated as per the law prevailing prior to the introduction of RERA. The
Company has given the areas to make them comparable with other projects of other developers across the country, and these areas do not
represent the basis of the transaction entered into with the customers.
3. Previous period figures have been re-grouped, re-arranged and re-classified wherever necessary to conform to current period’s classification. The
classification in this presentation may vary from classifications under Schedule III to the Companies Act or under Accounting Standards or the
financial statements published in the Annual Report.
4. All areas / configurations of projects are based on present estimates and are subject to change based on regulatory requirements and / or design /
construction exigencies and / or management decisions.
• Crore = 10 Million • nos. = Numbers
• EPS = Earnings Per Share • PAT = Profit After Tax
• EBITDA = Earnings before Interest, Tax, Depreciation and Amortisation • PBT = Profit Before Tax
• GLA = Gross Leasable Area • RERA = Real Estate (Regulation and Development) Act 2016
• IGAAP = Indian Generally Accepted Accounting Principles (Till March 31, 2016) • ROCE = Return on Capital Employed
• IND AS = Indian Accounting Standards (From April 01, 2016) • RONW = Return on Networth
• Lakh = Hundred Thousand • Rs. = Indian Rupees
• MahaRERA
Rules
= Maharashtra Real Estate (Regulation and Development) (Registration of real
estate projects, Registration of real estate agents, rates of interest and
disclosures on website) Rules, 2017
• sqft. = Square Feet
Abbreviat ions
This presentation has been prepared by Oberoi Realty Limited (ORL) and does not constitute a prospectus or placement memorandum or an offer to
acquire any securities of ORL. This presentation or any other documentation or information (or any part thereof) delivered or supplied should not be
deemed to constitute an offer to subscribe for ORL securities or the total areas mentioned herein should not be deemed to be the basis for transactions
with customers.
No representation or warranty, express or implied is made as to, and no reliance should be placed on, the fairness, accuracy, completeness or
correctness of such information or opinions contained herein. The information contained in this presentation is only current as of its date. Certain
statements made in this presentation may not be based on historical information or facts and may be “forward looking statements”, including those
relating to general business statements, plans and strategy of ORL, its future financial condition and growth prospects, future developments in its
industry and its competitive and regulatory environment, and statements which contain words or phrases such as ‘will’, ‘expected to’, ‘horizons of
growth’, ‘strong growth prospects’, etc., or similar expressions or variations of such expressions. These forward-looking statements are based on
expectations and projections, and may involve a number of risks, uncertainties and other factors that could cause actual results, opportunities and
growth potential to differ materially from those suggested by such statements. These risks and uncertainties include, but are not limited to risks with
respect to its real estate business, economic environment in India and overseas, changes in development regulations, changes in tax laws, changes in
other applicable laws, litigation and labour relations. ORL will not be in any way responsible for any action taken based on such statements and
undertakes no obligation to publicly update these forward-looking statements to reflect subsequent events or circumstances.
ORL may alter, modify or otherwise change in any manner the content of this presentation, without obligation to notify any person of such revision or
changes. This presentation cannot be copied and disseminated in any manner.
No person is authorized to give any information or to make any representation not contained in and not consistent with this presentation and, if given or
made, such information or representation must not be relied upon as having been authorized by or on behalf of ORL.
The MahaRERA Rules have been notified on 20th April 2017. All our under construction projects in which sales have commenced have been registered
under RERA. The information given in this presentation in the form of pictures, artistic renders, areas, consideration, project details etc does not purport
or tantamount to any disclosure under the MahaRERA Rules and should not be construed to be or constitute advertisements, solicitations, marketing,
offer for sale, invitation to offer, invitation to acquire including within the purview of RERA.
35