Embed Size (px)
Citation preview
Radford, Virginia
Financial StatementsFor the Year EndedJune 30, 2014
Table of Contents
Management’s Discussion and Analysis 3
Financial Statements 11
Statement of Net Position 12
Statement of Revenues, Expenses, and Changes in Net Position 13
Statement of Cash Flows 14
Notes to Financial Statements 15
Independent Auditor’s Report on Financial Statements 32
University Officials 35
2 Financial Report
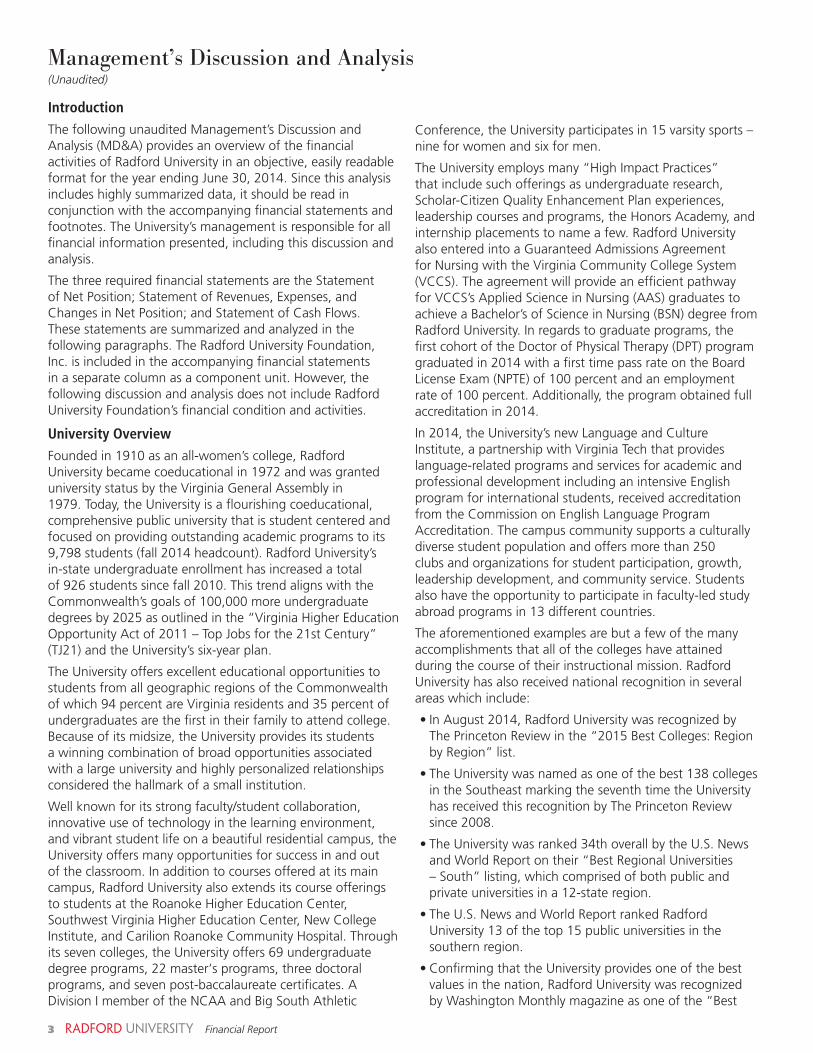
Management’s Discussion and Analysis(Unaudited)
Conference, the University participates in 15 varsity sports – nine for women and six for men
The University employs many “High Impact Practices” that include such offerings as undergraduate research, Scholar-Citizen Quality Enhancement Plan experiences, leadership courses and programs, the Honors Academy, and internship placements to name a few Radford University also entered into a Guaranteed Admissions Agreement for Nursing with the Virginia Community College System (VCCS) The agreement will provide an efficient pathway for VCCS’s Applied Science in Nursing (AAS) graduates to achieve a Bachelor’s of Science in Nursing (BSN) degree from Radford University In regards to graduate programs, the first cohort of the Doctor of Physical Therapy (DPT) program graduated in 2014 with a first time pass rate on the Board License Exam (NPTE) of 100 percent and an employment rate of 100 percent Additionally, the program obtained full accreditation in 2014
In 2014, the University’s new Language and Culture Institute, a partnership with Virginia Tech that provides language-related programs and services for academic and professional development including an intensive English program for international students, received accreditation from the Commission on English Language Program Accreditation The campus community supports a culturally diverse student population and offers more than 250 clubs and organizations for student participation, growth, leadership development, and community service Students also have the opportunity to participate in faculty-led study abroad programs in 13 different countries
The aforementioned examples are but a few of the many accomplishments that all of the colleges have attained during the course of their instructional mission Radford University has also received national recognition in several areas which include:
•InAugust2014,RadfordUniversitywasrecognizedbyThe Princeton Review in the “2015 Best Colleges: Region by Region” list
•TheUniversitywasnamedasoneofthebest138collegesin the Southeast marking the seventh time the University has received this recognition by The Princeton Review since2008.
•TheUniversitywasranked34thoverallbytheU.S.Newsand World Report on their “Best Regional Universities – South” listing, which comprised of both public and private universities in a 12-state region
•TheU.S.NewsandWorldReportrankedRadfordUniversity 13 of the top 15 public universities in the southern region
•ConfirmingthattheUniversityprovidesoneofthebestvalues in the nation, Radford University was recognized by Washington Monthly magazine as one of the “Best
IntroductionThe following unaudited Management’s Discussion and Analysis (MD&A) provides an overview of the financial activities of Radford University in an objective, easily readable format for the year ending June 30, 2014 Since this analysis includes highly summarized data, it should be read in conjunction with the accompanying financial statements and footnotes The University’s management is responsible for all financial information presented, including this discussion and analysis
The three required financial statements are the Statement of Net Position; Statement of Revenues, Expenses, and Changes in Net Position; and Statement of Cash Flows These statements are summarized and analyzed in the following paragraphs The Radford University Foundation, Inc is included in the accompanying financial statements in a separate column as a component unit However, the following discussion and analysis does not include Radford University Foundation’s financial condition and activities
University OverviewFounded in 1910 as an all-women’s college, Radford University became coeducational in 1972 and was granted university status by the Virginia General Assembly in 1979 Today, the University is a flourishing coeducational, comprehensive public university that is student centered and focused on providing outstanding academic programs to its 9,798students(fall2014headcount).RadfordUniversity’sin-state undergraduate enrollment has increased a total of 926 students since fall 2010 This trend aligns with the Commonwealth’s goals of 100,000 more undergraduate degrees by 2025 as outlined in the “Virginia Higher Education Opportunity Act of 2011 – Top Jobs for the 21st Century” (TJ21) and the University’s six-year plan
The University offers excellent educational opportunities to students from all geographic regions of the Commonwealth of which 94 percent are Virginia residents and 35 percent of undergraduates are the first in their family to attend college Because of its midsize, the University provides its students a winning combination of broad opportunities associated with a large university and highly personalized relationships considered the hallmark of a small institution
Well known for its strong faculty/student collaboration, innovative use of technology in the learning environment, and vibrant student life on a beautiful residential campus, the University offers many opportunities for success in and out of the classroom In addition to courses offered at its main campus, Radford University also extends its course offerings to students at the Roanoke Higher Education Center, Southwest Virginia Higher Education Center, New College Institute, and Carilion Roanoke Community Hospital Through its seven colleges, the University offers 69 undergraduate degree programs, 22 master‘s programs, three doctoral programs, and seven post-baccalaureate certificates A Division I member of the NCAA and Big South Athletic
3 Financial Report
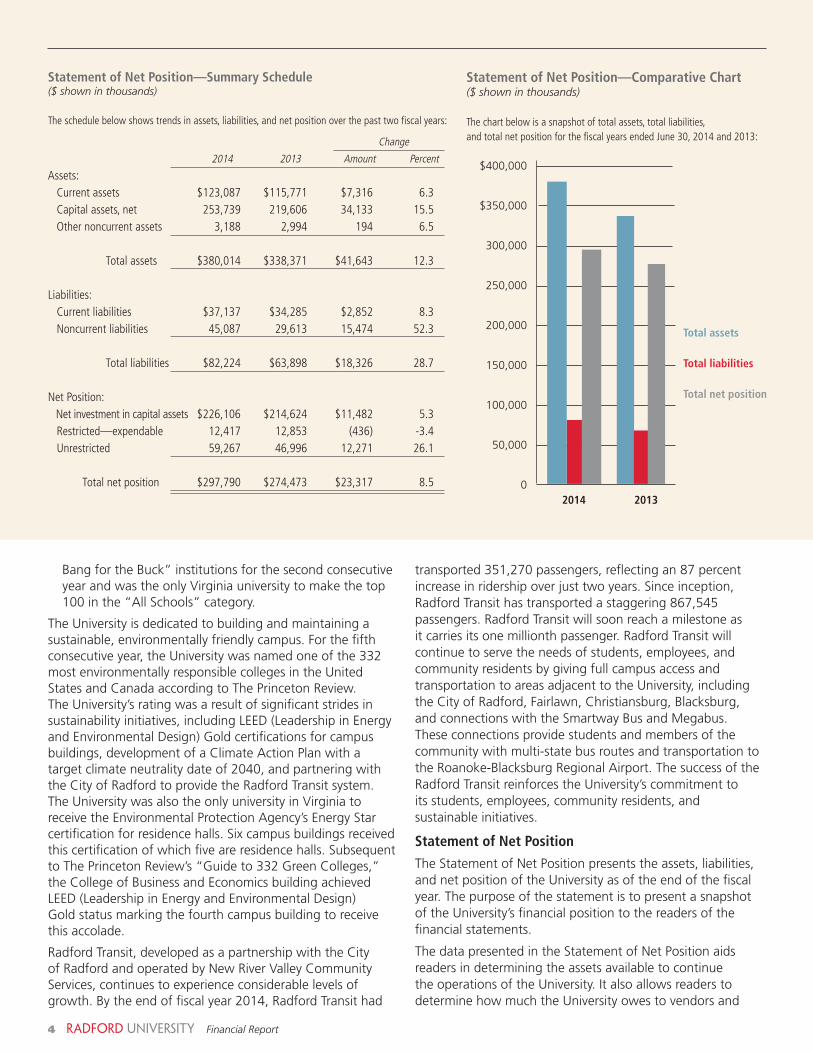
Statement of Net Position—Summary Schedule($ shown in thousands)
The schedule below shows trends in assets, liabilities, and net position over the past two fiscal years:
Change
2014 2013 Amount Percent
Assets: Current assets $123,087 $115,771 $7,316 6.3 Capital assets, net 253,739 219,606 34,133 15.5 Other noncurrent assets 3,188 2,994 194 6.5
Total assets $380,014 $338,371 $41,643 12.3 Liabilities: Current liabilities $37,137 $34,285 $2,852 8.3 Noncurrent liabilities 45,087 29,613 15,474 52.3
Total liabilities $82,224 $63,898 $18,326 28.7 Net Position: Net investment in capital assets $226,106 $214,624 $11,482 5.3 Restricted—expendable 12,417 12,853 (436) -3.4 Unrestricted 59,267 46,996 12,271 26.1
Total net position $297,790 $274,473 $23,317 8.5
Statement of Net Position—Comparative Chart($ shown in thousands)
The chart below is a snapshot of total assets, total liabilities, and total net position for the fiscal years ended June 30, 2014 and 2013:
$400,000
$350,000
300,000
250,000
200,000
150,000
100,000
50,000
02014 2013
Total assets
Total liabilities
Total net position
Bang for the Buck” institutions for the second consecutive year and was the only Virginia university to make the top 100 in the “All Schools” category
The University is dedicated to building and maintaining a sustainable, environmentally friendly campus For the fifth consecutive year, the University was named one of the 332 most environmentally responsible colleges in the United States and Canada according to The Princeton Review The University’s rating was a result of significant strides in sustainability initiatives, including LEED (Leadership in Energy and Environmental Design) Gold certifications for campus buildings, development of a Climate Action Plan with a target climate neutrality date of 2040, and partnering with the City of Radford to provide the Radford Transit system The University was also the only university in Virginia to receive the Environmental Protection Agency’s Energy Star certification for residence halls Six campus buildings received this certification of which five are residence halls Subsequent to The Princeton Review’s “Guide to 332 Green Colleges,” the College of Business and Economics building achieved LEED (Leadership in Energy and Environmental Design) Gold status marking the fourth campus building to receive this accolade
Radford Transit, developed as a partnership with the City of Radford and operated by New River Valley Community Services, continues to experience considerable levels of growth By the end of fiscal year 2014, Radford Transit had
transported351,270passengers,reflectingan87percentincrease in ridership over just two years Since inception, RadfordTransithastransportedastaggering867,545passengers Radford Transit will soon reach a milestone as it carries its one millionth passenger Radford Transit will continue to serve the needs of students, employees, and community residents by giving full campus access and transportation to areas adjacent to the University, including the City of Radford, Fairlawn, Christiansburg, Blacksburg, and connections with the Smartway Bus and Megabus These connections provide students and members of the community with multi-state bus routes and transportation to the Roanoke-Blacksburg Regional Airport The success of the Radford Transit reinforces the University’s commitment to its students, employees, community residents, and sustainable initiatives
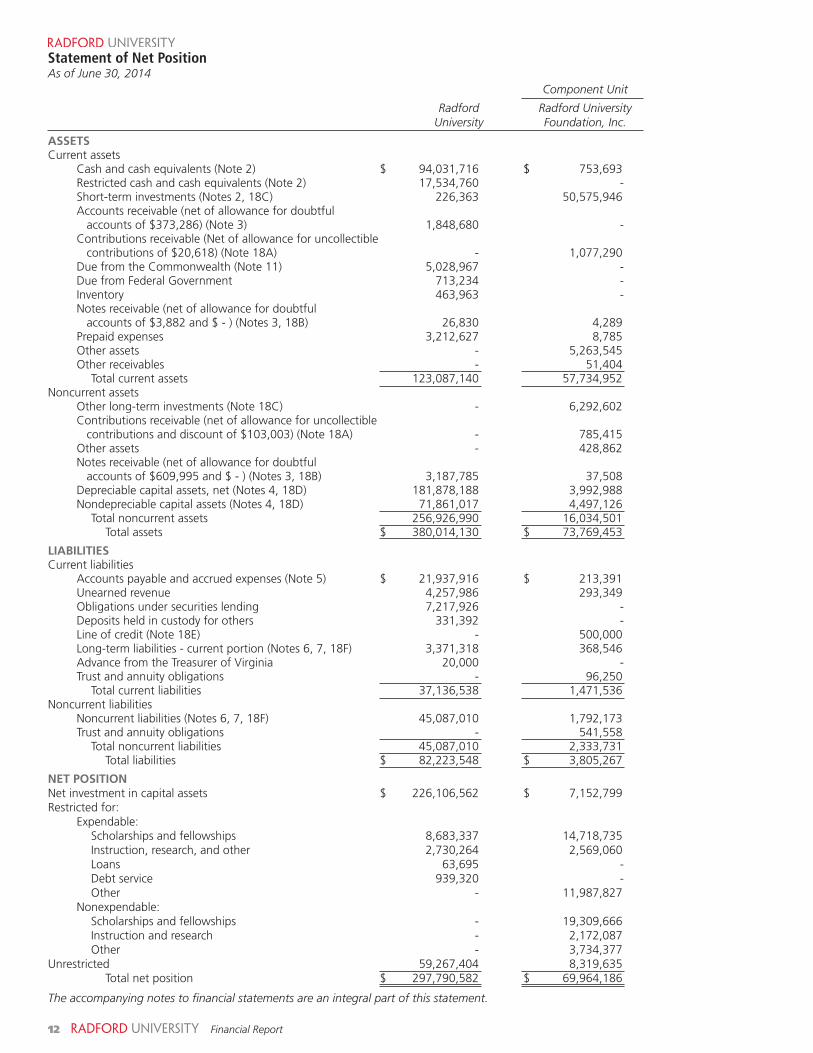
Statement of Net Position
The Statement of Net Position presents the assets, liabilities, and net position of the University as of the end of the fiscal year The purpose of the statement is to present a snapshot of the University’s financial position to the readers of the financial statements
The data presented in the Statement of Net Position aids readers in determining the assets available to continue the operations of the University It also allows readers to determine how much the University owes to vendors and
4 Financial Report
creditors Finally, the Statement of Net Position provides a picture of the net position or available resources of the University Sustained increases in net position over time are one indicator of the financial stability of an organization
Net position is classified into three major components: net investment in capital assets, restricted, and unrestricted
•Net investment in capital assets—Net investment in capital assets represents the University’s total capital assets, net of accumulated depreciation, reduced by the outstanding debt attributable to the acquisition, construction, or improvement of those assets Debt incurred, but not yet expended for capital assets, net of accounts and retainage payable to be paid with unspent debt proceeds, is not included as a component of net investment in capital assets
•Restricted–expendable—The expendable restricted component of net position includes resources the University is legally or contractually obligated to expend in accordance with restrictions imposed by external third parties
•Unrestricted—The unrestricted component of net position represents resources used for transactions relating to academic departments and general operations of the University, and may be used at the discretion of the University’s Board of Visitors to meet current expenses for any lawful purpose in support of the University’s primary missions of instruction, research, and outreach These resources are derived from student tuition and fees, state appropriations, recoveries of facilities and administrative (indirect) costs, and sales and services of auxiliary enterprises and educational departments The auxiliary enterprises are self-supporting entities that provide services for students, faculty, and staff Some examples of the University’s auxiliaries are intercollegiate athletics and student residential and dining programs
Total University assets increased by $41 6 million or 12 3 percent during fiscal year 2014, resulting in total assets of $380.0millionatyearend.Themajorityoftheincreaseintotal assets is attributable to a $7 3 million increase in current assets and $34 1 million increase in net capital assets The largest increases in current assets were in cash and cash equivalents of $4 2 million as outlined in the Statement of Cash Flows (discussed in a later section) and the receivable duefromtheCommonwealthof$2.8million.Theincreaseinthe receivable due from the Commonwealth is related to the timing of several significant requisitions for capital projects near fiscal year end Capital assets, net of accumulated depreciation, of $253 7 million accounts for the majority of the increase in noncurrent assets and reflects the ongoing expansion and renovation of facilities at the University as discussed in detail in the following section, Capital Asset and Debt Administration
Totalliabilitiesincreasedby$18.3millionor28.7percentduring fiscal year 2014 The current liabilities category increased $2 9 million and the noncurrent liabilities increased $15 5 million The rise in liabilities resulted from an increase in accounts payable and accrued expenses of $1 3 million
as well as Radford University’s participation in the pooled bond program (Series 2013A) for $5 1 million to construct the Student Recreation and Wellness Center and 9(c) general obligation bonds of $11 9 million for the renovation of three residence halls Further information regarding the debt issuance can be found in Notes 6 and 7 of the Notes to Financial Statements The decrease in restricted cash and cash equivalents of $3 6 million reflects the expenditure of funds for ongoing capital asset construction, which was offset in part by the proceeds of debt issued for the Student Recreation and Wellness Center and renovation of three residence halls
The increase in total assets was greater than the corresponding increase in total liabilities, thus improving the University’snetpositionby$23.3millionor8.5percent.Netinvestment in capital assets increased $11 5 million which is a reflection of the University’s continued investment in facilities and equipment to support the University’s missions
Capital Asset and Debt AdministrationThe development and renewal of the University’s capital assets is critical to ensure the necessary infrastructure required for achieving the University’s ongoing mission Accordingly, the University has continued to implement its long-range plans to modernize older facilities and to pursue new construction as needed These investments in renovation and new construction support and enhance the University’s high-quality instructional programs, residential lifestyles, and student quality of life
Note 4 of the Notes to Financial Statements describe the University’s ongoing investment in capital assets The value of the University’s net capital assets increased to $253 7 million at the end of fiscal year 2014, an increase of $34 1 million or 15 5 percent over fiscal year 2013 Net additions and reductions to capital assets during fiscal year 2014 totaled $44 6 million (excluding depreciation) The continued construction of the Student Recreation and Wellness Center and Center for the Sciences as well as beginning construction on the new academic building for the College of Humanities and Behavior Sciences and residence hall renovations account for the majority of the current year capital activity Current year depreciation expense totaled $14 0 million
Capital projects in progress carried commitments to construction contractors, architects, and engineers totaling $32 2 million at June 30, 2014 These obligations represent the unperformed portion of construction contracts and, as such, have not been accrued as expenses or liabilities on the University’s financial statements
Financial stewardship requires the effective management of resources, including the use of long-term debt to finance capital projects Notes 6 and 7 of the Notes to Financial Statements contain information about the long-term debt of the University In fiscal year 2014, one new note payable in the amount of $5 1 million was issued for the construction of the Student Recreation and Wellness Center and a bond in the amount of $11 9 million was issued for the renovation of three residence halls
5 Financial Report
6 Financial Report
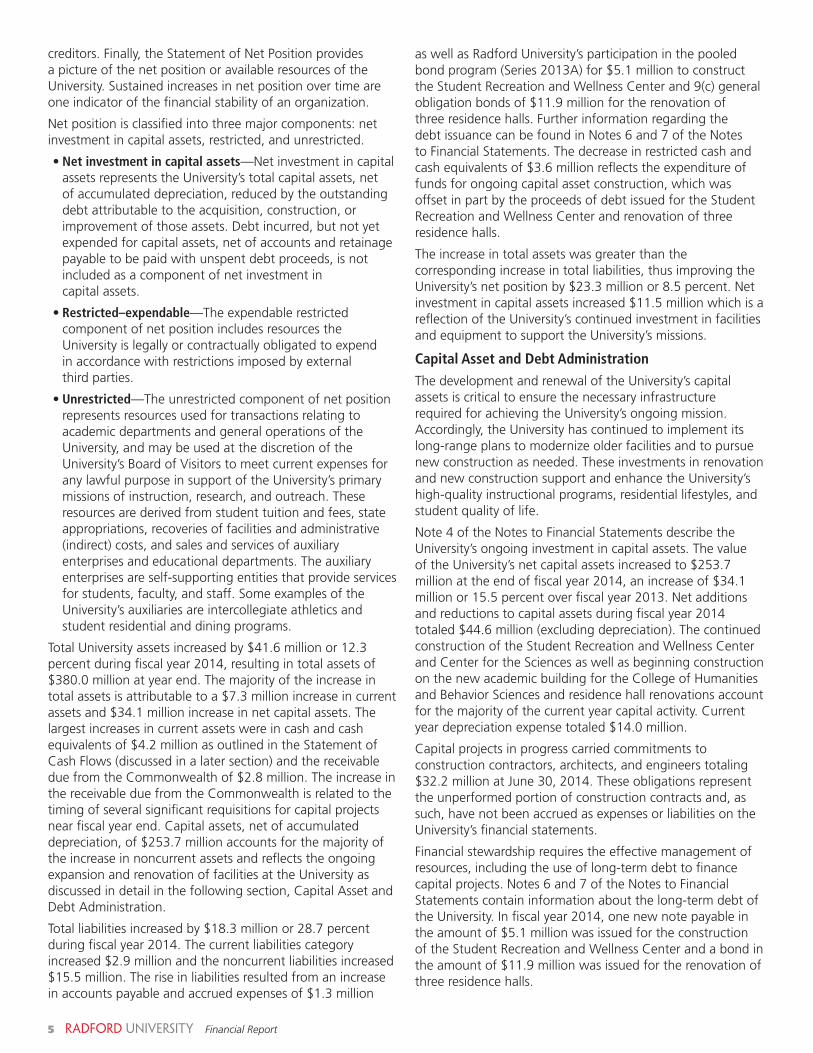
Statement of Revenues, Expenses, and Changes in Net Position—Summary Schedule($ shown in thousands)
Change
2014 2013 Amount Percent
Operating revenues $120,700 $115,437 $5,263 4 6Less:Operatingexpenses 178,663 172,059 6,604 3.8
Operating loss (57,963) (56,622) (1,341) 2 4 Nonoperating revenues and expenses 62,216 63,493 (1,277) (2 0) Income before other revenues, expenses,gains,orlosses 4,253 6,871 (2,618) (38.1)Otherrevenues,expenses,gains,orlosses 19,064 6,975 12,089 173.3
Increaseinnetposition 23,317 13,846 9,471 68.4Netposition—beginningofyear 274,473 260,627 13,846 5.3 Netposition—endofyear $297,790 $274,473 $23,317 8.5
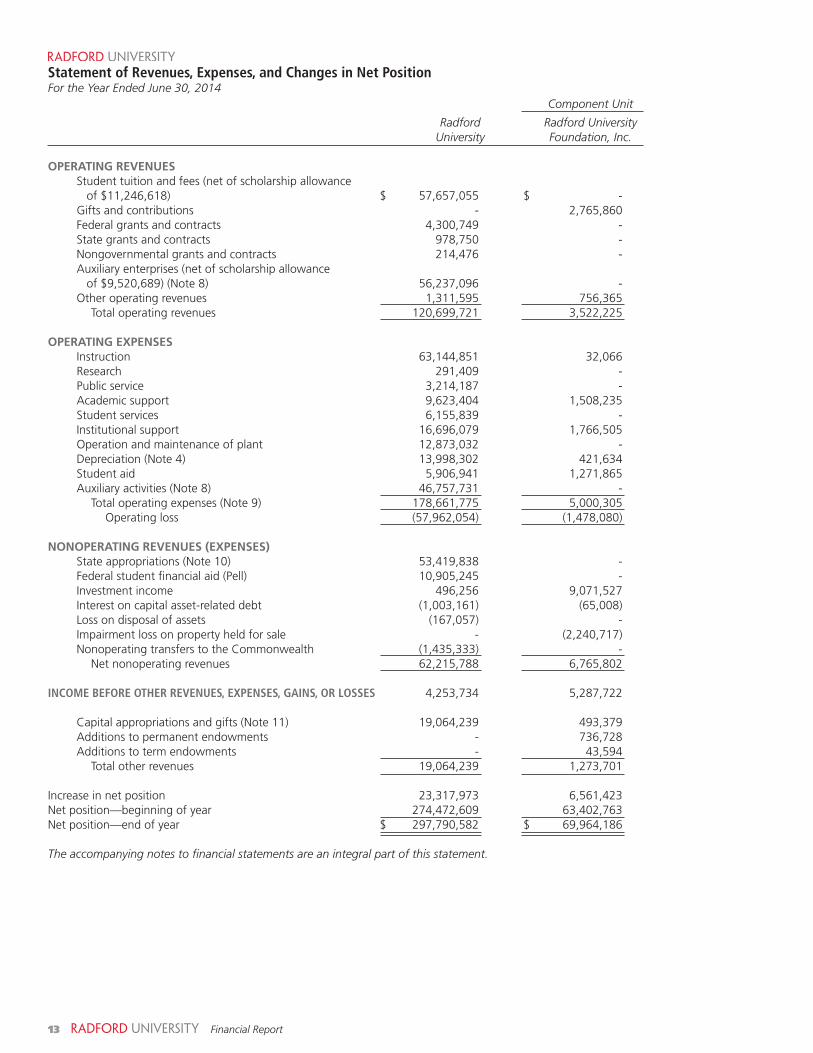
Statement of Revenues, Expenses, and Changes in Net PositionThe Statement of Revenues, Expenses, and Changes in Net Position presents the University’s operating and nonoperating activities, which changes the University’s total net position The purpose of the statement is to present all revenues received and accrued, all expenses paid and accrued, and gains or losses from investments and capital assets
Generally, operating revenues are received from providing goods and services to students and various customers and constituencies of the University Operating expenses are expenditures made to acquire or produce the goods and services provided in return for operating revenues and to carry out the mission of the University Compensation and fringe benefits for faculty and staff are the largest category of operating expense
Nonoperating revenues are revenues received for which goods and services are not directly provided State appropriations are included in this category, but provide substantial support for paying the University’s operating expenses Therefore, the University, like most public institutions, will expect to show an operating loss
Overall, the result from total fiscal year operations was an increase in net position of $23 3 million This increase was primarily attributable to the increase in capital appropriations and gifts described further below The increase in the operating loss of $1 3 million was the combination of increased expenses partially offset by an increase in operating revenues With the inclusion of state appropriations for the University in the nonoperating category, the University will
routinely display an operating loss for the year This operating loss is primarily covered by the state appropriations included in the nonoperating category as well as investment income and capital appropriations
Operating revenues of the University consist primarily of student tuition and fees and revenues generated by various auxiliary enterprises Operating revenues in total for fiscal year 2014 increased by $5 3 million as compared to fiscal year 2013 This increase was largely due to growth in tuition and fees and auxiliary revenues, net of scholarship allowances, which reflected an increase of 9 3 percent and 1 0 percent, respectively The growth in these revenues is attributed to a Board of Visitors approved tuition and fee rate increases and enrollment growth To address continuing programmatic and instructional needs resulting from sustained enrollment growth and to cover other mandatory cost increases including state mandated salary adjustments and health insurance rate changes, tuition rate increases ranged from 0.0to5.8percentandtheauxiliarycomprehensivefeerate increased 2 0 percent for fiscal year 2014 Although state appropriations remained unchanged in comparison to fiscal year 2013, nonoperating revenues and expenses for fiscal year 2014 decreased $1 3 million or 2 0 percent The decrease in nonoperating activities is the result of a decline in investment income coupled with increases in interest expense on capital asset-related debt and nonoperating transfers to the Commonwealth The growth in capital appropriations of $12 1 million was a result of an increase in capital construction funding, predominately related to the construction of the Center for the Sciences building funded via the 21st Century bond program
7 Financial Report
Operating expenses for fiscal year 2014 increased $6 6 millionor3.8percentoverfiscalyear2013.Fromanaturalexpense standpoint, compensation and benefits comprises 56.8percentoftheUniversity’soperatingexpensesandservices and supplies accounts for 25 6 percent These two categories contributed to the majority of the increase in operating expenses for 2014 Compensation and benefits increased $4 9 million or 5 1 percent Generally, changes to expenses in this category are from three sources: increases or reductions in the number of personnel, annual salary increases, and the general trends in the costs of fringe benefits The increase in compensation and benefits during fiscal year 2014 is largely due to an university-wide state mandated three percent salary increase for teaching and research and administrative and professional faculty as well
as an university-wide state mandated two percent salary increase for classified employees in addition to a salary compression adjustment for eligible classified employees based on years of service The additional hire of full-time faculty and support positions due to enrollment growth and a state mandated increase in fringe benefits costs also attributed to the increase in compensation and benefits during fiscal year 2014 Services and supplies increased $2.8millionor6.4percentoverfiscalyear2013.Theincreased activity in services and supplies is attributed to several factors including the completion of additional facility infrastructure improvements, increased dining contract payments due to increased meal plan sales, and an overall increase in contractual obligations related to student, administrative, and operational support Operating expenses
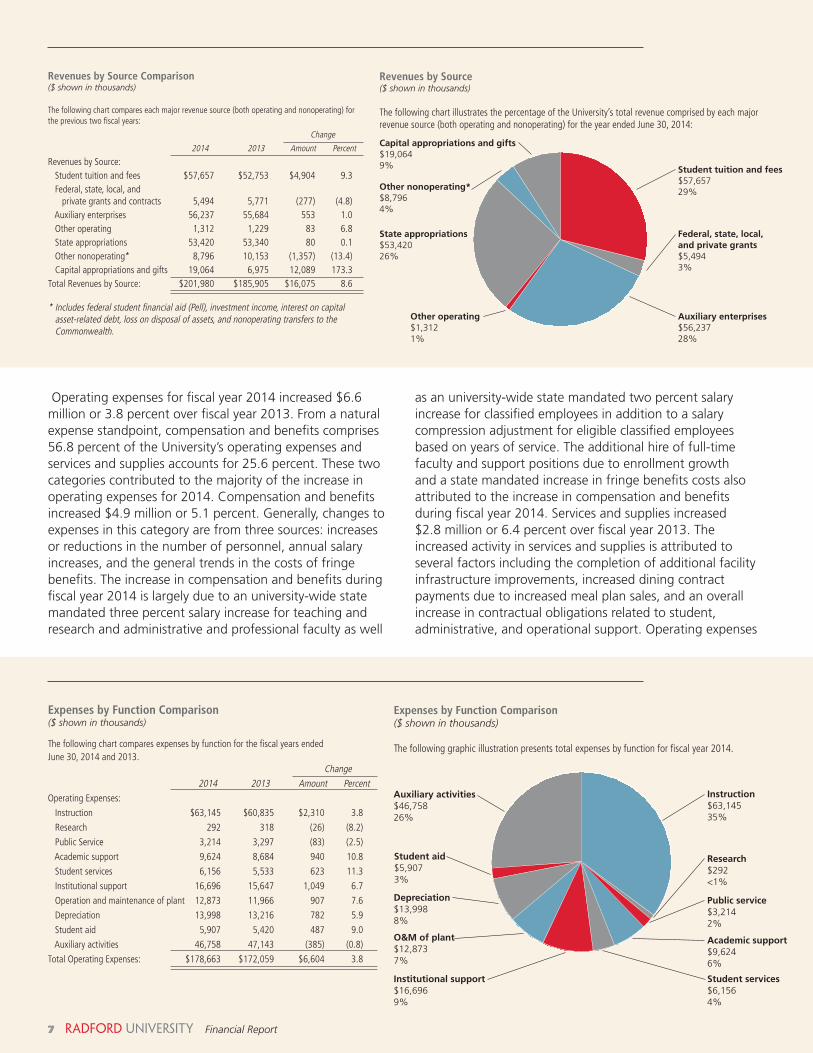
Expenses by Function Comparison($ shown in thousands)
The following chart compares expenses by function for the fiscal years ended June 30, 2014 and 2013. Change 2014 2013 Amount PercentOperating Expenses:
Instruction $63,145 $60,835 $2,310 3.8
Research 292 318 (26) (8.2)
Public Service 3,214 3,297 (83) (2.5)
Academic support 9,624 8,684 940 10.8
Student services 6,156 5,533 623 11.3
Institutional support 16,696 15,647 1,049 6.7
Operation and maintenance of plant 12,873 11,966 907 7.6
Depreciation 13,998 13,216 782 5.9
Student aid 5,907 5,420 487 9.0
Auxiliary activities 46,758 47,143 (385) (0.8)
Total Operating Expenses: $178,663 $172,059 $6,604 3.8
Institutional support$16,6969%
Student services$6,1564%
Auxiliary activities$46,75826%
Student aid$5,9073%
Depreciation$13,9988%
Academic support$9,6246%
Public service$3,2142%
Research$292<1%
Instruction$63,14535%
O&M of plant$12,8737%
Expenses by Function Comparison($ shown in thousands)
The following graphic illustration presents total expenses by function for fiscal year 2014.
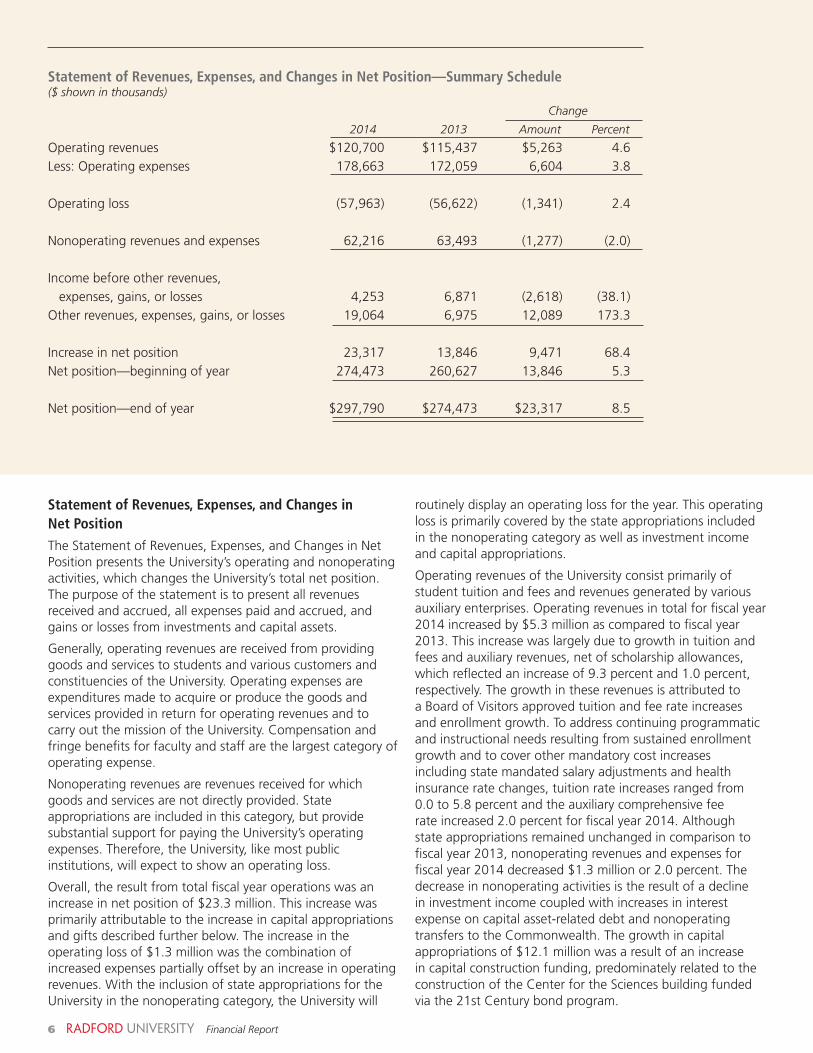
Revenues by Source Comparison($ shown in thousands)
The following chart compares each major revenue source (both operating and nonoperating) for the previous two fiscal years:
Change
2014 2013 Amount Percent
Revenues by Source: Student tuition and fees $57,657 $52,753 $4,904 9.3 Federal, state, local, and private grants and contracts 5,494 5,771 (277) (4.8) Auxiliary enterprises 56,237 55,684 553 1.0 Other operating 1,312 1,229 83 6.8 State appropriations 53,420 53,340 80 0.1 Other nonoperating* 8,796 10,153 (1,357) (13.4) Capital appropriations and gifts 19,064 6,975 12,089 173.3Total Revenues by Source: $201,980 $185,905 $16,075 8.6
* Includes federal student financial aid (Pell), investment income, interest on capital asset-related debt, loss on disposal of assets, and nonoperating transfers to the Commonwealth.
Revenues by Source($ shown in thousands)
The following chart illustrates the percentage of the University’s total revenue comprised by each major revenue source (both operating and nonoperating) for the year ended June 30, 2014:
Student tuition and fees $57,65729%
Other nonoperating*$8,7964%
State appropriations$53,42026%
Capital appropriations and gifts $19,0649%
Auxiliary enterprises$56,23728%
Other operating$1,3121%
Federal, state, local, and private grants$5,4943%
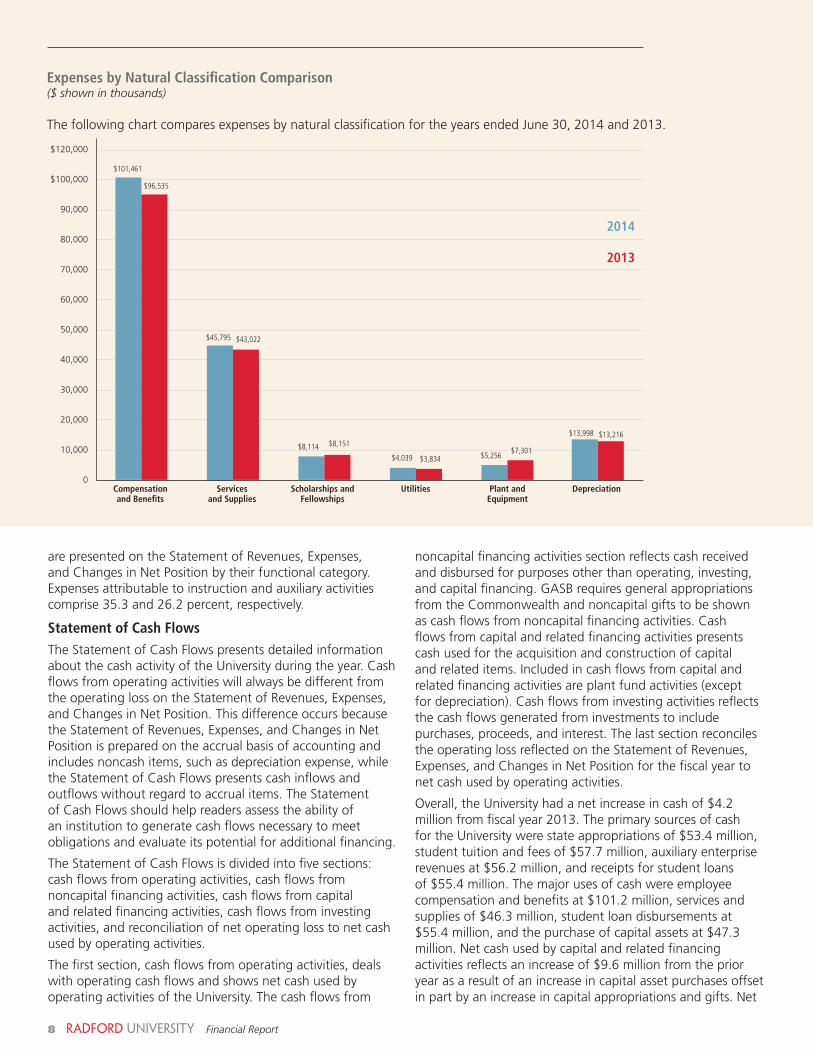
are presented on the Statement of Revenues, Expenses, and Changes in Net Position by their functional category Expenses attributable to instruction and auxiliary activities comprise 35 3 and 26 2 percent, respectively
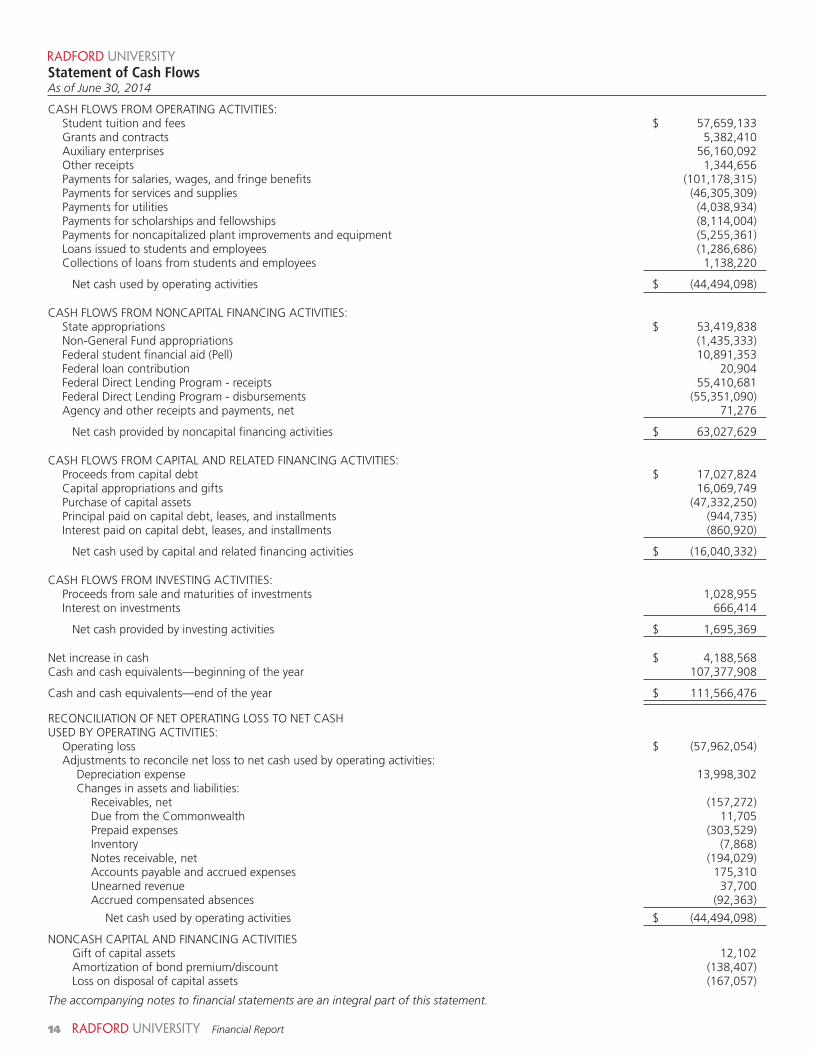
Statement of Cash FlowsThe Statement of Cash Flows presents detailed information about the cash activity of the University during the year Cash flows from operating activities will always be different from the operating loss on the Statement of Revenues, Expenses, and Changes in Net Position This difference occurs because the Statement of Revenues, Expenses, and Changes in Net Position is prepared on the accrual basis of accounting and includes noncash items, such as depreciation expense, while the Statement of Cash Flows presents cash inflows and outflows without regard to accrual items The Statement of Cash Flows should help readers assess the ability of an institution to generate cash flows necessary to meet obligations and evaluate its potential for additional financing
The Statement of Cash Flows is divided into five sections: cash flows from operating activities, cash flows from noncapital financing activities, cash flows from capital and related financing activities, cash flows from investing activities, and reconciliation of net operating loss to net cash used by operating activities
The first section, cash flows from operating activities, deals with operating cash flows and shows net cash used by operating activities of the University The cash flows from
noncapital financing activities section reflects cash received and disbursed for purposes other than operating, investing, and capital financing GASB requires general appropriations from the Commonwealth and noncapital gifts to be shown as cash flows from noncapital financing activities Cash flows from capital and related financing activities presents cash used for the acquisition and construction of capital and related items Included in cash flows from capital and related financing activities are plant fund activities (except for depreciation) Cash flows from investing activities reflects the cash flows generated from investments to include purchases, proceeds, and interest The last section reconciles the operating loss reflected on the Statement of Revenues, Expenses, and Changes in Net Position for the fiscal year to net cash used by operating activities
Overall, the University had a net increase in cash of $4 2 million from fiscal year 2013 The primary sources of cash for the University were state appropriations of $53 4 million, student tuition and fees of $57 7 million, auxiliary enterprise revenues at $56 2 million, and receipts for student loans of $55 4 million The major uses of cash were employee compensation and benefits at $101 2 million, services and supplies of $46 3 million, student loan disbursements at $55 4 million, and the purchase of capital assets at $47 3 million Net cash used by capital and related financing activities reflects an increase of $9 6 million from the prior year as a result of an increase in capital asset purchases offset in part by an increase in capital appropriations and gifts Net
$120,000
$100,000
90,000
80,000
70,000
60,000
50,000
40,000
30,000
20,000
10,000
0
2014
2013
Compensation Services Scholarships and Utilities Plant and Depreciation and Benefits and Supplies Fellowships Equipment
$101,461
$96,535
$45,795 $43,022
$8,114 $8,151
$4,039 $3,834 $5,256 $7,301
$13,998 $13,216
Expenses by Natural Classification Comparison($ shown in thousands)
The following chart compares expenses by natural classification for the years ended June 30, 2014 and 2013
8 Financial Report
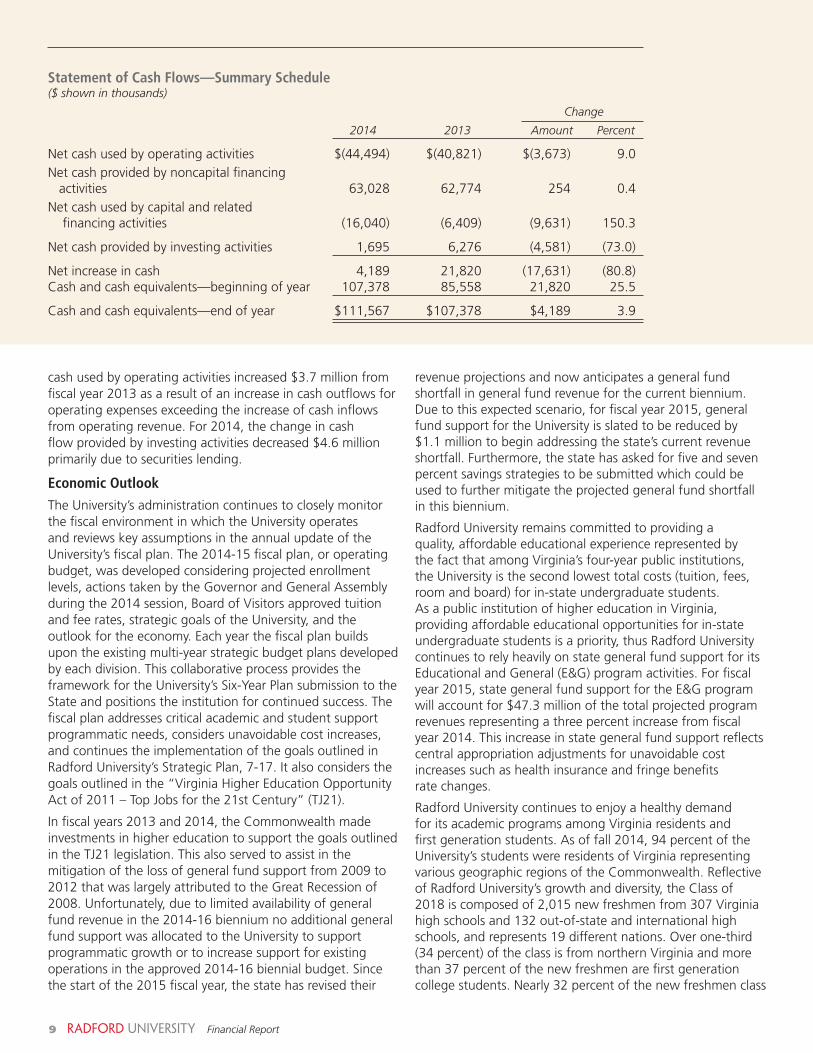
Statement of Cash Flows—Summary Schedule($ shown in thousands)
Change
2014 2013 Amount Percent
Netcashusedbyoperatingactivities $(44,494) $(40,821) $(3,673) 9.0Net cash provided by noncapital financing activities 63,028 62,774 254 0.4Net cash used by capital and related financing activities (16,040) (6,409) (9,631) 150 3
Netcashprovidedbyinvestingactivities 1,695 6,276 (4,581) (73.0)
Netincreaseincash 4,189 21,820 (17,631) (80.8)Cashandcashequivalents—beginningofyear 107,378 85,558 21,820 25.5
Cashandcashequivalents—endofyear $111,567 $107,378 $4,189 3.9
cash used by operating activities increased $3 7 million from fiscal year 2013 as a result of an increase in cash outflows for operating expenses exceeding the increase of cash inflows from operating revenue For 2014, the change in cash flow provided by investing activities decreased $4 6 million primarily due to securities lending
Economic OutlookThe University’s administration continues to closely monitor the fiscal environment in which the University operates and reviews key assumptions in the annual update of the University’s fiscal plan The 2014-15 fiscal plan, or operating budget, was developed considering projected enrollment levels, actions taken by the Governor and General Assembly during the 2014 session, Board of Visitors approved tuition and fee rates, strategic goals of the University, and the outlook for the economy Each year the fiscal plan builds upon the existing multi-year strategic budget plans developed by each division This collaborative process provides the framework for the University’s Six-Year Plan submission to the State and positions the institution for continued success The fiscal plan addresses critical academic and student support programmatic needs, considers unavoidable cost increases, and continues the implementation of the goals outlined in Radford University’s Strategic Plan, 7-17 It also considers the goals outlined in the “Virginia Higher Education Opportunity Act of 2011 – Top Jobs for the 21st Century” (TJ21)
In fiscal years 2013 and 2014, the Commonwealth made investments in higher education to support the goals outlined in the TJ21 legislation This also served to assist in the mitigation of the loss of general fund support from 2009 to 2012 that was largely attributed to the Great Recession of 2008.Unfortunately,duetolimitedavailabilityofgeneralfund revenue in the 2014-16 biennium no additional general fund support was allocated to the University to support programmatic growth or to increase support for existing operations in the approved 2014-16 biennial budget Since the start of the 2015 fiscal year, the state has revised their
revenue projections and now anticipates a general fund shortfall in general fund revenue for the current biennium Due to this expected scenario, for fiscal year 2015, general fund support for the University is slated to be reduced by $1 1 million to begin addressing the state’s current revenue shortfall Furthermore, the state has asked for five and seven percent savings strategies to be submitted which could be used to further mitigate the projected general fund shortfall in this biennium
Radford University remains committed to providing a quality, affordable educational experience represented by the fact that among Virginia’s four-year public institutions, the University is the second lowest total costs (tuition, fees, room and board) for in-state undergraduate students As a public institution of higher education in Virginia, providing affordable educational opportunities for in-state undergraduate students is a priority, thus Radford University continues to rely heavily on state general fund support for its Educational and General (E&G) program activities For fiscal year 2015, state general fund support for the E&G program will account for $47 3 million of the total projected program revenues representing a three percent increase from fiscal year 2014 This increase in state general fund support reflects central appropriation adjustments for unavoidable cost increases such as health insurance and fringe benefits rate changes
Radford University continues to enjoy a healthy demand for its academic programs among Virginia residents and first generation students As of fall 2014, 94 percent of the University’s students were residents of Virginia representing various geographic regions of the Commonwealth Reflective of Radford University’s growth and diversity, the Class of 2018iscomposedof2,015newfreshmenfrom307Virginiahigh schools and 132 out-of-state and international high schools, and represents 19 different nations Over one-third (34 percent) of the class is from northern Virginia and more than 37 percent of the new freshmen are first generation college students Nearly 32 percent of the new freshmen class
9 Financial Report
10 Financial Report
identify themselves as ethnic minorities, with 16 percent as African American and 7 percent as Hispanic/Latino
As a result of placing a continued emphasis on enrollment planning and management as well as implementing new master’s and doctoral programs, the University has witnessed and projects further growth in enrollment
During fiscal year 2015, the University piloted the RU Accelerate Program as a follow up to the successful Wintermester intersession that was specifically designed to help students progress more quickly in their degree programs by providing a variety of course offerings across multiple colleges The RU Accelerate Program is focused on high achieving incoming students and offers the ability to take an online class before arriving to campus and join an undergraduate research team Upon successful completion, students will arrive in the fall having already completed a high-demand three credit course
Radford University has also initiated an intensive retention and high impact practices effort to engage students immediately upon their arrival to campus The University contracted with industry leader Noel Levitz to develop a holistic retention plan, is researching best practices for student assistance programs, implemented an undergraduate research initiative, is developing yoked instructional and student engagement opportunities, and is evaluating enhancements for career services and experiential learning opportunities
Substantial progress was made on various capital projects during fiscal year 2014 For fiscal year 2015, the University is continuing to move forward with several major capital projects Construction nears completion on two
technologically advanced buildings, the Student Recreation and Wellness Center and the Center for the Sciences These facilities are expected to open in fall 2014 and fall 2015, respectively During the summer of 2014, the University initiated a multi-building residence hall renovation project for Pocahontas, Bolling, and Draper Halls These buildings have similar structures and floor plans which provide synergy and cost savings during design and construction Pocahontas and Bolling Halls will re-open in fall 2015 and Draper Hall will re-open in fall 2016 Additionally, construction is underway of a new academic building for the College of Humanities and Behavior Sciences The University has also taken steps to initiate the planning for the renovation of Whitt Hall The addition of each of these structures will certainly result in exciting changes and improve the landscape of Radford University
In the coming years, Radford University will continue to demonstrate sound judgment in the use of its financial resources and explore innovative strategies for continuous improvement Future planning efforts have positioned the University to respond immediately to changing economic conditions and will allow the institution to emerge even stronger Admission applications and student interest in the University continue to be robust which is producing strong enrollments while at the same time maintaining student quality The impact of these planning efforts demonstrates the University’s focus on the future and its ability to respond to unforeseen challenges by continuing to evaluate programmatic costs, identify efficiencies in operations, and prioritize the most critical needs in establishing and monitoring its operational budgets and finances
11 Financial Report
Financial Statements
12 Financial Report
Statement of Net Position As of June 30, 2014 Component Unit
Radford Radford University University Foundation, Inc.
ASSETSCurrent assets
Cash and cash equivalents (Note 2) $ 94,031,716 $ 753,693Restricted cash and cash equivalents (Note 2) 17,534,760 -Short-terminvestments(Notes2,18C) 226,363 50,575,946Accounts receivable (net of allowance for doubtful accountsof$373,286)(Note3) 1,848,680 -Contributions receivable (Net of allowance for uncollectible contributionsof$20,618)(Note18A) - 1,077,290DuefromtheCommonwealth(Note11) 5,028,967 -Due from Federal Government 713,234 -Inventory 463,963 -Notes receivable (net of allowance for doubtful accountsof$3,882and$-)(Notes3,18B) 26,830 4,289Prepaidexpenses 3,212,627 8,785Other assets - 5,263,545Other receivables - 51,404
Totalcurrentassets 123,087,140 57,734,952Noncurrent assets
Otherlong-terminvestments(Note18C) - 6,292,602Contributions receivable (net of allowance for uncollectible contributionsanddiscountof$103,003)(Note18A) - 785,415Otherassets - 428,862Notes receivable (net of allowance for doubtful accountsof$609,995and$-)(Notes3,18B) 3,187,785 37,508Depreciablecapitalassets,net(Notes4,18D) 181,878,188 3,992,988Nondepreciablecapitalassets(Notes4,18D) 71,861,017 4,497,126
Total noncurrent assets 256,926,990 16,034,501Totalassets $ 380,014,130 $ 73,769,453
LIABILITIESCurrent liabilities
Accounts payable and accrued expenses (Note 5) $ 21,937,916 $ 213,391Unearnedrevenue 4,257,986 293,349Obligations under securities lending 7,217,926 -Deposits held in custody for others 331,392 -Lineofcredit(Note18E) - 500,000Long-termliabilities-currentportion(Notes6,7,18F) 3,371,318 368,546Advance from the Treasurer of Virginia 20,000 -Trust and annuity obligations - 96,250
Totalcurrentliabilities 37,136,538 1,471,536Noncurrent liabilities
Noncurrentliabilities(Notes6,7,18F) 45,087,010 1,792,173Trustandannuityobligations - 541,558
Totalnoncurrentliabilities 45,087,010 2,333,731Totalliabilities $ 82,223,548 $ 3,805,267
NET POSITIONNet investment in capital assets $ 226,106,562 $ 7,152,799Restricted for:
Expendable: Scholarshipsandfellowships 8,683,337 14,718,735Instruction, research, and other 2,730,264 2,569,060Loans 63,695 -Debt service 939,320 -Other - 11,987,827
Nonexpendable: Scholarships and fellowships - 19,309,666Instructionandresearch - 2,172,087Other - 3,734,377
Unrestricted 59,267,404 8,319,635Totalnetposition $ 297,790,582 $ 69,964,186
The accompanying notes to financial statements are an integral part of this statement.
13 Financial Report
Statement of Revenues, Expenses, and Changes in Net PositionFor the Year Ended June 30, 2014 Component Unit
Radford Radford University University Foundation, Inc.
OPERATINg REVENUESStudent tuition and fees (net of scholarship allowance of$11,246,618) $ 57,657,055 $ -Giftsandcontributions - 2,765,860Federal grants and contracts 4,300,749 - Stategrantsandcontracts 978,750 -Nongovernmental grants and contracts 214,476 - Auxiliary enterprises (net of scholarship allowance of$9,520,689)(Note8) 56,237,096 -Other operating revenues 1,311,595 756,365
Total operating revenues 120,699,721 3,522,225
OPERATINg EXPENSESInstruction 63,144,851 32,066Research 291,409 - Publicservice 3,214,187 -Academicsupport 9,623,404 1,508,235Studentservices 6,155,839 -Institutional support 16,696,079 1,766,505 Operationandmaintenanceofplant 12,873,032 -Depreciation(Note4) 13,998,302 421,634Studentaid 5,906,941 1,271,865Auxiliaryactivities(Note8) 46,757,731 -
Totaloperatingexpenses(Note9) 178,661,775 5,000,305Operatingloss (57,962,054) (1,478,080)
NONOPERATINg REVENUES (EXPENSES)Stateappropriations(Note10) 53,419,838 -Federal student financial aid (Pell) 10,905,245 - Investment income 496,256 9,071,527 Interestoncapitalasset-relateddebt (1,003,161) (65,008)Loss on disposal of assets (167,057) -Impairment loss on property held for sale - (2,240,717)Nonoperating transfers to the Commonwealth (1,435,333) -
Netnonoperatingrevenues 62,215,788 6,765,802
INCOME BEFORE OThER REvENUES, ExPENSES, gAINS, OR lOSSES 4,253,734 5,287,722
Capital appropriations and gifts (Note 11) 19,064,239 493,379 Additionstopermanentendowments - 736,728Additions to term endowments - 43,594
Total other revenues 19,064,239 1,273,701
Increase in net position 23,317,973 6,561,423 Net position—beginning of year 274,472,609 63,402,763 Netposition—endofyear $ 297,790,582 $ 69,964,186
The accompanying notes to financial statements are an integral part of this statement.
14 Financial Report
Statement of Cash FlowsAs of June 30, 2014 CASH FLOWS FROM OPERATING ACTIVITIES: Student tuition and fees $ 57,659,133 Grantsandcontracts 5,382,410 Auxiliary enterprises 56,160,092 Other receipts 1,344,656 Paymentsforsalaries,wages,andfringebenefits (101,178,315) Payments for services and supplies (46,305,309) Paymentsforutilities (4,038,934) Paymentsforscholarshipsandfellowships (8,114,004) Payments for noncapitalized plant improvements and equipment (5,255,361) Loansissuedtostudentsandemployees (1,286,686) Collectionsofloansfromstudentsandemployees 1,138,220
Netcashusedbyoperatingactivities $ (44,494,098)
CASH FLOWS FROM NONCAPITAL FINANCING ACTIVITIES: Stateappropriations $ 53,419,838 Non-General Fund appropriations (1,435,333) Federalstudentfinancialaid(Pell) 10,891,353 Federal loan contribution 20,904 FederalDirectLendingProgram-receipts 55,410,681 Federal Direct Lending Program - disbursements (55,351,090) Agency and other receipts and payments, net 71,276
Net cash provided by noncapital financing activities $ 63,027,629
CASH FLOWS FROM CAPITAL AND RELATED FINANCING ACTIVITIES: Proceedsfromcapitaldebt $ 17,027,824 Capital appropriations and gifts 16,069,749 Purchase of capital assets (47,332,250) Principal paid on capital debt, leases, and installments (944,735) Interestpaidoncapitaldebt,leases,andinstallments (860,920)
Net cash used by capital and related financing activities $ (16,040,332)
CASH FLOWS FROM INVESTING ACTIVITIES: Proceedsfromsaleandmaturitiesofinvestments 1,028,955 Interest on investments 666,414
Net cash provided by investing activities $ 1,695,369
Netincreaseincash $ 4,188,568Cashandcashequivalents—beginningoftheyear 107,377,908
Cash and cash equivalents—end of the year $ 111,566,476
RECONCILIATION OF NET OPERATING LOSS TO NET CASH USED BY OPERATING ACTIVITIES: Operating loss $ (57,962,054) Adjustments to reconcile net loss to net cash used by operating activities:
Depreciationexpense 13,998,302 Changes in assets and liabilities: Receivables, net (157,272) Due from the Commonwealth 11,705 Prepaid expenses (303,529) Inventory (7,868) Notes receivable, net (194,029) Accounts payable and accrued expenses 175,310 Unearned revenue 37,700 Accrued compensated absences (92,363)
Netcashusedbyoperatingactivities $ (44,494,098)
NONCASH CAPITAL AND FINANCING ACTIVITIES Gift of capital assets 12,102 Amortizationofbondpremium/discount (138,407) Loss on disposal of capital assets (167,057)
The accompanying notes to financial statements are an integral part of this statement.

Notes to Financial Statements
15 Financial Report
16 Financial Report
Table of ContentsNotes to Financial Statements
NOTE 1: Summary of Significant Accounting Policies
NOTE 2: Cash and Cash Equivalents and Investments
NOTE 3: Accounts and Notes Receivable
NOTE 4: Capital Assets
NOTE 5: Accounts Payable and Accrued Expenses
NOTE 6: Noncurrent Liabilities
NOTE 7: Long-Term Debt
NOTE 8: Auxiliary Activities
NOTE 9: Expenses By Natural Classification
NOTE 10: State Appropriations
NOTE 11: Capital Appropriations
NOTE 12: Commitments
NOTE 13: Retirement Plans
NOTE 14: Postemployment Benefits
NOTE 15: Grant and Contracts Contingencies
NOTE 16: Federal Direct Lending Program
NOTE 17: Risk Management and Employee Health Care Plans
NOTE 18: Component Unit Financial Information
NOTE 19: Subsequent Events
17 Financial Report
NOTE 1: Summary of Significant Accounting Policies
Reporting EntityRadford University (the “University”) is a comprehensive university that is part of the Commonwealth of Virginia’s statewide system of public higher education The University’s Board of Visitors, appointed by the Governor, is responsible for overseeing governance of the University A separate report is prepared for the Commonwealth of Virginia which includes all agencies, higher education institutions, boards, commissions, and authorities over which the Commonwealth exercises or has the ability to exercise oversight authority The University is a component unit of the Commonwealth of Virginia and is included in the general purpose financial statements of the Commonwealth
Under Governmental Accounting Standards Board (GASB) Statement 61, The Financial Reporting Entity: Omnibus—an amendment of GASB Statements No. 14 and No. 34, the Radford University Foundation, Inc (the “Foundation”) meets the criteria to qualify as a component unit of the University The Foundation is a legally separate, tax-exempt organization formed to promote the achievements and further the aims and purposes of the University The Foundation accomplishes its purposes through fundraising and funds management efforts that benefit the University and its programs The 17-member board of the Foundation is self-perpetuating and consists of graduates and friends of the University Although the University does not control the timing or amount of receipts from the Foundation, the majority of resources, or income thereon, which the Foundation holds and invests are restricted to the activities of the University by the donors Because these restricted resources held by the Foundation can only be used by, or for the benefit of, the University, the Foundation is considered a component unit of the University and is discretely presented in the University’s financial statements During the year ended June 30, 2014, the Foundationmadedistributionsof$1,851,115tooronbehalfoftheUniversityforboth restricted and unrestricted purposes
Complete financial statements for the Foundation can be obtained from: Radford UniversityFoundationAdministrativeOffice,P.O.Box6893,Radford,Virginia24142.
Basis of PresentationThe University’s accounting policies conform with generally accepted accounting principles as prescribed by GASB, including all applicable GASB pronouncements as well as applicable Financial Accounting Standards Board (FASB) statements The financial statements have been prepared in accordance with GASB Statement 34, Basic Financial Statements—and Management’s Discussion and Analysis—for State and Local Governments, and GASB Statement 35, Basic Financial Statements and Management’s Discussion and Analysis of Public Colleges and Universities.
During the year ended June 30, 2014, the following GASB statements became effective: Statement 65, Items Previously Reported as Assets and Liabilities; Statement 66, Technical Corrections-2012-an amendment of GASB Statements No. 10 and No. 62; Statement 67, Financial Reporting for Pension Plans-an amendment of GASB Statement No. 25; Statement 70, Accounting and Financial Reporting for Nonexchange Financial Guarantees. Statement 65 establishes accounting and financial reporting standards that reclassify, as deferred outflows of resources or deferred inflows of resources, certain items that were previously reported as assets and liabilities Implementation of GASB Statement 65 had no effect on the University’s net position or changes in net position for the year ended June 30, 2014 Statement 66 provides clarification to conflicting guidance in Statements No 54 and No 62 by amending Statements No 10 and No 62 Statement 67 modifies the financial reporting for state and local governmental pension plans and Statement 70 requires the reporting and disclosure of nonexchange financial guarantees The University was not a participant in any nonexchange financial guarantees during the fiscal year
Notes to Financial StatementsFor the Year Ended June 30, 2014
18 Financial Report
The Foundation is a non-profit organization that reports under FASB standards, including FASB Statement 117, Financial Statements of Not-for-Profit Organizations As such, certain revenue recognition criteria and presentation features are different from GASB revenue recognition and presentation features With the exception of necessary presentation adjustments, no modifications have been made to the Foundation’s financial information in the University’s financial report for these differences
Basis of AccountingThe University’s financial statements have been prepared using the economic resources measurement focus and the accrual basis of accounting Under the accrual basis, revenues are recognized when earned and expenses are recorded when a liability is incurred, regardless of the timing of related cash flows All significant intra-agency transactions have been eliminated
Cash Equivalents For purposes of the Statement of Net Position and Statement of Cash Flows, the University considers all highly liquid investments with an original maturity of 90 days or less to be cash equivalents
InvestmentsIn accordance with GASB Statement 31, Accounting and Financial Reporting for Certain Investments and for External Investment Pools, modified by GASB Statement 59, Financial Instruments Omnibus purchased investments, interest-bearing temporary investments classified with cash, and investments received as gifts are recorded at fair value All investment income, including changes in the fair value of investments (unrealized gains and losses), is reported as nonoperating revenue in the Statement of Revenues, Expenses, and Changes in Net Position
Accounts ReceivableAccounts receivable consist of tuition and fees charges to students and auxiliary enterprise services provided to students, faculty, and staff Accounts receivable also include amounts due from federal, state and local governments, and non-governmental sources, in connection with reimbursement of allowable expenses made pursuant to the University’s grants and contracts Accounts receivable are recorded net of allowance for doubtful accounts See Note 3 for a detailed list of accounts receivable amounts
Notes ReceivableNotes receivable consist of amounts due from the Federal Perkins Loan Program, Nursing Student Loan Program, and other student loan programs administered by the University Notes receivable are recorded net of allowance for doubtful accounts See Note 3 for a detailed list of notes receivable amounts
InventoriesInventories are valued at the lower of cost (generally determined on the first-in, first-out method) or market, and consist primarily of expendable supplies held for consumption
Capital AssetsCapital assets consist of land, buildings, infrastructure, building and other improvements, equipment, intangibles, and library materials Capital assets are recorded at actual costs or estimated historical costs if purchased or constructed Donated capital assets are recognized at fair market value at the date of donation
Equipment with an expected useful life of greater than one year and with a value or cost of $5,000 or more at the date of acquisition are capitalized Intangibles, principally software, are capitalized when acquisition costs are $10,000 or more and the estimated useful life is three years or greater Library materials are valued using actual costs for library acquisitions Construction and renovation costs are recorded as construction in progress until the project is substantially complete at which the costs are removed from construction in progress and capitalized in the appropriate capital asset account (e g buildings, improvements, etc ) Such construction projects are capitalized when expenses total more than $100,000 The costs of routine repairs and maintenance that do not add to an asset’s value or extend its useful life are not capitalized and are charged to operating expenses
19 Financial Report
Depreciation is computed using the straight-line method over the estimated useful life of the asset and is not allocated to the functional expense categories Useful lives by asset categories are listed below:
Buildings 40 yearsBuilding improvements 20 yearsOther improvements and infrastructure 20 yearsEquipment 3-15 yearsIntangibles (software) 3-15 yearsLibrary materials 10 years
Unearned RevenueUnearned revenue primarily includes amounts received prior to the end of the fiscal year for tuition and fees and certain auxiliary activities related to the period subsequent to June 30, 2014
Accrued Compensated AbsencesThe amount of leave earned but not taken by salaried employees is recorded as a liability on the Statement of Net Position The amount reflects, as of June 30, 2014, all unused annual, sick, compensatory, and recognition leave, as well as the amount payable upon termination under the Commonwealth of Virginia’s sick leave pay-out policy The applicable share of employer related taxes payable on the eventual termination payments is also included See Note 6 for the current and noncurrent amounts
Noncurrent liabilitiesNoncurrent liabilities include: (1) the principal amounts of notes and bond payable and installment purchase obligations with maturities greater than one year, (2) estimated amounts for accrued compensated absences, and (3) contributions from the Federal government to fund the operations of the Perkins Loan Program and the Nursing Student Loan Program See Notes 6 and 7 for detailed information and amounts
Federal Financial Assistance ProgramsThe University participates in federally funded Pell Grants, Supplemental Educational Opportunity Grants, Federal Work-Study, Direct Lending, and Perkins Loans programs Federal programs are audited in accordance with the Single Audit Act Amendments of 1996, the Office of Management and Budget Revised Circular A-133, Audit of States, Local Governments and Non-Profit Organizations, and the Compliance Supplement
Net PositionGASB Statement 34, as amended by GASB Statement 63, requires that the Statement of Net Position report the difference between assets and liabilities as net position Net position is displayed in three broad components: Net investment in capital assets, restricted net position (expendable or nonexpendable), and unrestricted “Net investment in capital assets” consists of capital assets, net of accumulated depreciation and reduced by outstanding debt that is attributable to the acquisition, construction, or improvement of those assets Net position is reported as “Restricted” when constraints on net position are either externally imposed by creditors, grantors, or contributors, laws or government regulations, or imposed by law “Unrestricted” net position consists of net position that does not meet the definitions above When an expense is incurred that can be paid using either restricted or unrestricted resources, the University’s policy is to first apply the expense toward restricted resources before unrestricted resources
Revenue ClassificationsOperating revenues include activities that have the characteristics of exchange transactions, such as (1) student tuition and fees, net of scholarship allowances, (2) sales and services of auxiliary enterprises, net of scholarship allowances, and (3) federal, state, and nongovernmental grants and contracts
Nonoperating revenues include activities that have the characteristics of nonexchange transactions, such as gifts, state appropriations, investment income,
20 Financial Report
and other revenue sources that are defined as nonoperating revenues by GASB Statement 9, Reporting Cash Flows of Proprietary and Nonexpendable Trust Funds and Governmental Entities That Use Proprietary Fund Accounting, and GASB Statement 34, Basic Financial Statements—and Management’s Discussion and Analysis—for State and Local Governments
Scholarship Discounts and AllowancesStudent tuition and fees revenues, and certain auxiliary revenues from students, are reported net of scholarship discounts and allowances in the Statement of Revenues, Expenses, and Changes in Net Position Scholarship discounts and allowances are the difference between the stated charge for goods and services provided by the University and the amount paid by students and/or third parties on the students’ behalf Certain governmental grants, such as Pell grants, and other federal, state, or nongovernmental programs are recorded as either operating or nonoperating revenues in the University’s financial statements To the extent that such revenues are used to satisfy tuition and fees and other student charges, the University has recorded a scholarship discount and allowance
NOTE 2: Cash and Cash Equivalents and Investments
The following information is provided with respect to the University’s cash, cash equivalents, investments, and risk disclosures as of June 30, 2014, in accordance with GASB Statement 40, Deposit and Investment Risk Disclosures:
Custodial Credit Risk (Category 3 deposits and investments)—The custodial credit risk for deposits is the risk that, in the event of a failure of a depository financial institution, a government will not be able to recover deposits or will not be able to recover collateral securities that are in the possession of an outside party The custodial credit risk for investments is the risk that, in the event of the failure of the counterparty to a transaction, a government will not be able to recover the value of investment or collateral securities that are in possession of an outside party The University had no category 3 deposits or investments for fiscal year 2014
Credit Risk—The risk that an issuer or other counterparty to an investment will not fulfill its obligations This Statement requires the disclosure of the credit quality ratings of all investments subject to credit risk Information with respect to the University’s deposit exposure to credit risk is discussed below
Concentration of Credit Risk—The risk of loss attributed to the magnitude of a government’s investment in a single issuer This Statement requires disclosure of investments with any one issuer that represents 5 percent or more of total investments However, investments issued or explicitly guaranteed by the U S government and investments in mutual funds, external investment pools, and other pooled investments are excluded from the requirement The University does not have investments subject to risks due to the concentration of credit
Interest Rate Risk—The risk that changes in interest rates will adversely affect the fair value of an investment This Statement requires disclosure of the terms of the investments with fair values that are highly sensitive to changes in interest rates The University does not have an interest rate risk policy and no investments or deposits that are sensitive to changes in interest rates as of June 30, 2014
Foreign Currency Risk—The risk that changes in exchange rates will adversely affect the fair value of an investment or deposit The University had no foreign investments or deposits during fiscal year 2014
Cash and Cash EquivalentsPursuanttoSection2.2-1800,etseq.,Code of Virginia, all state funds of the University are maintained by the Treasurer of Virginia, who is responsible for the collection, disbursement, custody, and investment of state funds Cash deposits held by the University are maintained in accounts that are collateralized in accordance with the Virginia Security for Public Deposits Act, Section 2 2-4400,
21 Financial Report
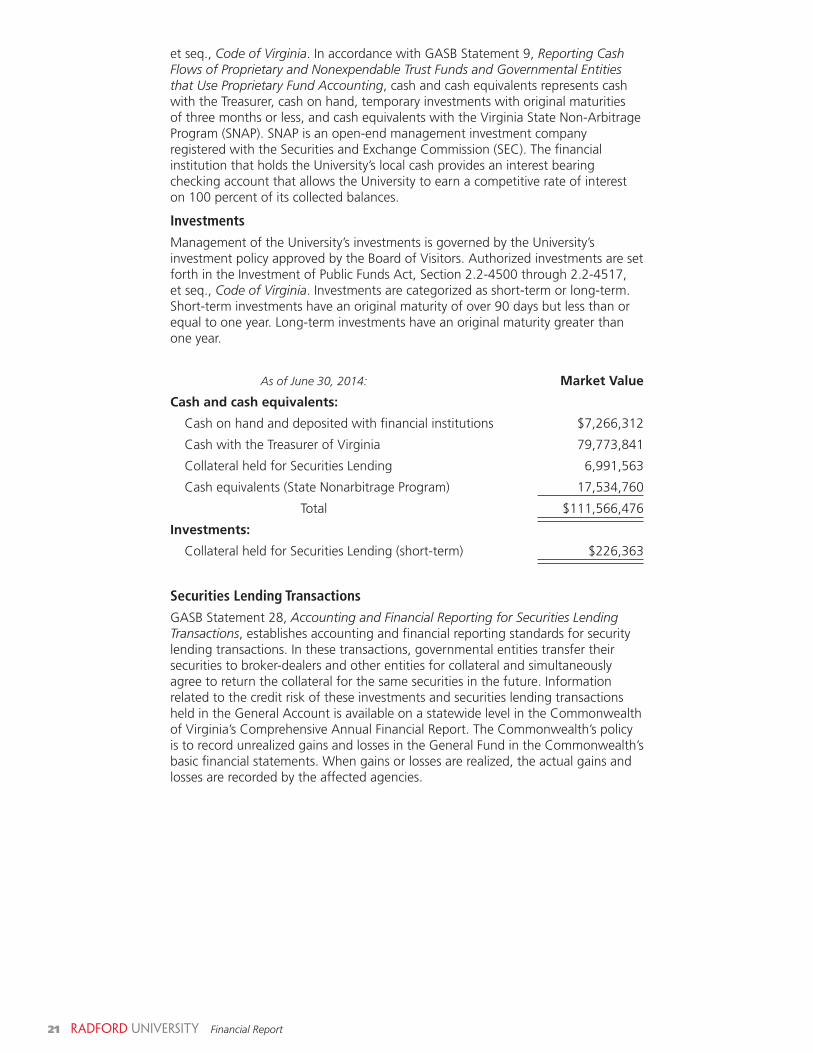
et seq , Code of Virginia In accordance with GASB Statement 9, Reporting Cash Flows of Proprietary and Nonexpendable Trust Funds and Governmental Entities that Use Proprietary Fund Accounting, cash and cash equivalents represents cash with the Treasurer, cash on hand, temporary investments with original maturities of three months or less, and cash equivalents with the Virginia State Non-Arbitrage Program (SNAP) SNAP is an open-end management investment company registered with the Securities and Exchange Commission (SEC) The financial institution that holds the University’s local cash provides an interest bearing checking account that allows the University to earn a competitive rate of interest on 100 percent of its collected balances
InvestmentsManagement of the University’s investments is governed by the University’s investment policy approved by the Board of Visitors Authorized investments are set forth in the Investment of Public Funds Act, Section 2 2-4500 through 2 2-4517, et seq , Code of Virginia Investments are categorized as short-term or long-term Short-term investments have an original maturity of over 90 days but less than or equal to one year Long-term investments have an original maturity greater than one year
As of June 30, 2014: Market Value
Cash and cash equivalents:
Cash on hand and deposited with financial institutions $7,266,312
CashwiththeTreasurerofVirginia 79,773,841
Collateral held for Securities Lending 6,991,563
Cash equivalents (State Nonarbitrage Program) 17,534,760
Total $111,566,476
Investments:
Collateral held for Securities Lending (short-term) $226,363
Securities lending TransactionsGASBStatement28,Accounting and Financial Reporting for Securities Lending Transactions, establishes accounting and financial reporting standards for security lending transactions In these transactions, governmental entities transfer their securities to broker-dealers and other entities for collateral and simultaneously agree to return the collateral for the same securities in the future Information related to the credit risk of these investments and securities lending transactions held in the General Account is available on a statewide level in the Commonwealth of Virginia’s Comprehensive Annual Financial Report The Commonwealth’s policy is to record unrealized gains and losses in the General Fund in the Commonwealth’s basic financial statements When gains or losses are realized, the actual gains and losses are recorded by the affected agencies
22 Financial Report
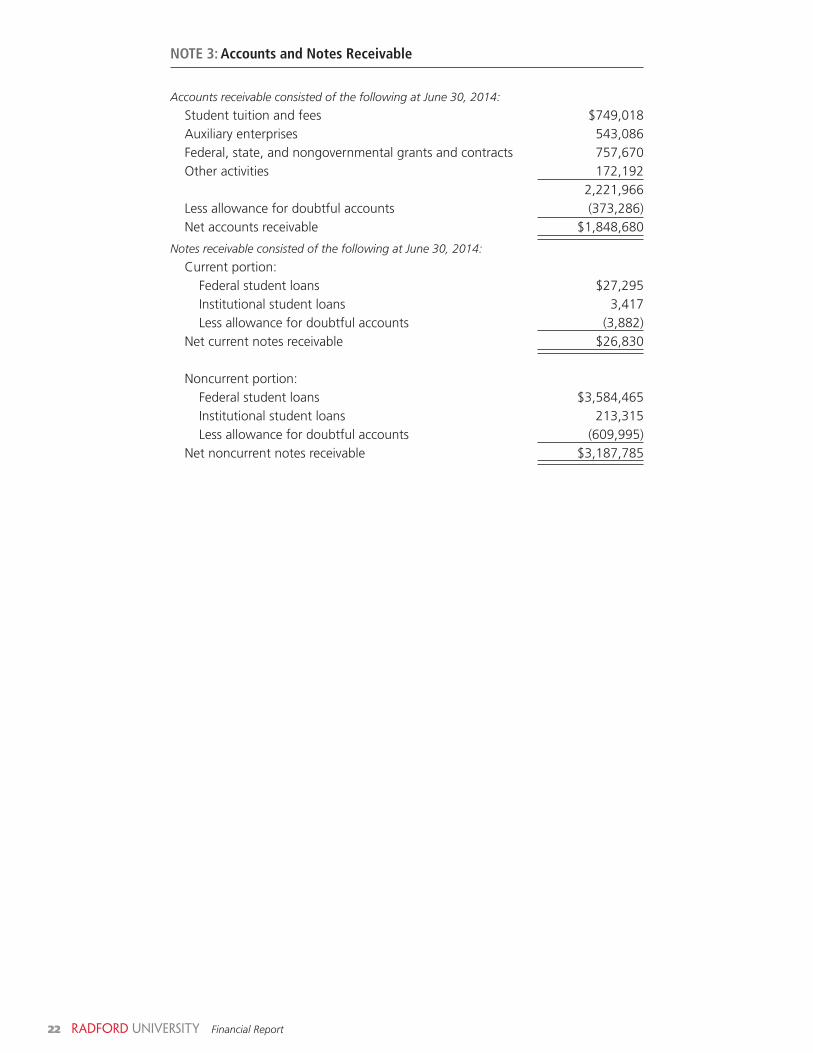
NOTE 3: Accounts and Notes Receivable
Accounts receivable consisted of the following at June 30, 2014:
Studenttuitionandfees $749,018Auxiliaryenterprises 543,086Federal, state, and nongovernmental grants and contracts 757,670Other activities 172,192 2,221,966Lessallowancefordoubtfulaccounts (373,286)Netaccountsreceivable $1,848,680
Notes receivable consisted of the following at June 30, 2014:
Current portion: Federal student loans $27,295Institutional student loans 3,417Lessallowancefordoubtfulaccounts (3,882)
Netcurrentnotesreceivable $26,830
Noncurrent portion:Federalstudentloans $3,584,465Institutional student loans 213,315Less allowance for doubtful accounts (609,995)
Netnoncurrentnotesreceivable $3,187,785
23 Financial Report
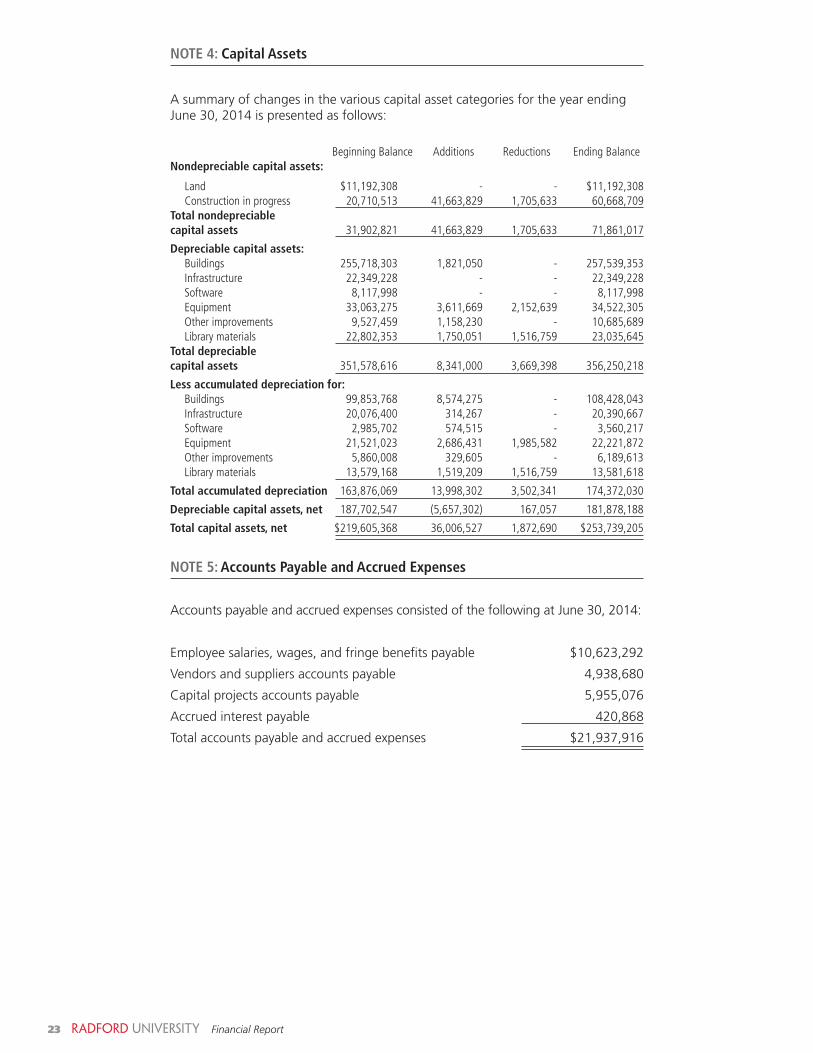
NOTE 4: Capital Assets
A summary of changes in the various capital asset categories for the year ending June 30, 2014 is presented as follows:
Beginning Balance Additions Reductions Ending BalanceNondepreciable capital assets:
Land $11,192,308 - - $11,192,308 Construction in progress 20,710,513 41,663,829 1,705,633 60,668,709Total nondepreciable capital assets 31,902,821 41,663,829 1,705,633 71,861,017
Depreciable capital assets: Buildings 255,718,303 1,821,050 - 257,539,353 Infrastructure 22,349,228 - - 22,349,228 Software 8,117,998 - - 8,117,998 Equipment 33,063,275 3,611,669 2,152,639 34,522,305 Other improvements 9,527,459 1,158,230 - 10,685,689 Library materials 22,802,353 1,750,051 1,516,759 23,035,645Total depreciable capital assets 351,578,616 8,341,000 3,669,398 356,250,218
less accumulated depreciation for: Buildings 99,853,768 8,574,275 - 108,428,043 Infrastructure 20,076,400 314,267 - 20,390,667 Software 2,985,702 574,515 - 3,560,217 Equipment 21,521,023 2,686,431 1,985,582 22,221,872 Other improvements 5,860,008 329,605 - 6,189,613 Library materials 13,579,168 1,519,209 1,516,759 13,581,618
Total accumulated depreciation 163,876,069 13,998,302 3,502,341 174,372,030
Depreciable capital assets, net 187,702,547 (5,657,302) 167,057 181,878,188
Total capital assets, net $219,605,368 36,006,527 1,872,690 $253,739,205
NOTE 5: Accounts Payable and Accrued Expenses
Accounts payable and accrued expenses consisted of the following at June 30, 2014:
Employee salaries, wages, and fringe benefits payable $10,623,292
Vendorsandsuppliersaccountspayable 4,938,680
Capital projects accounts payable 5,955,076
Accruedinterestpayable 420,868
Total accounts payable and accrued expenses $21,937,916
24 Financial Report
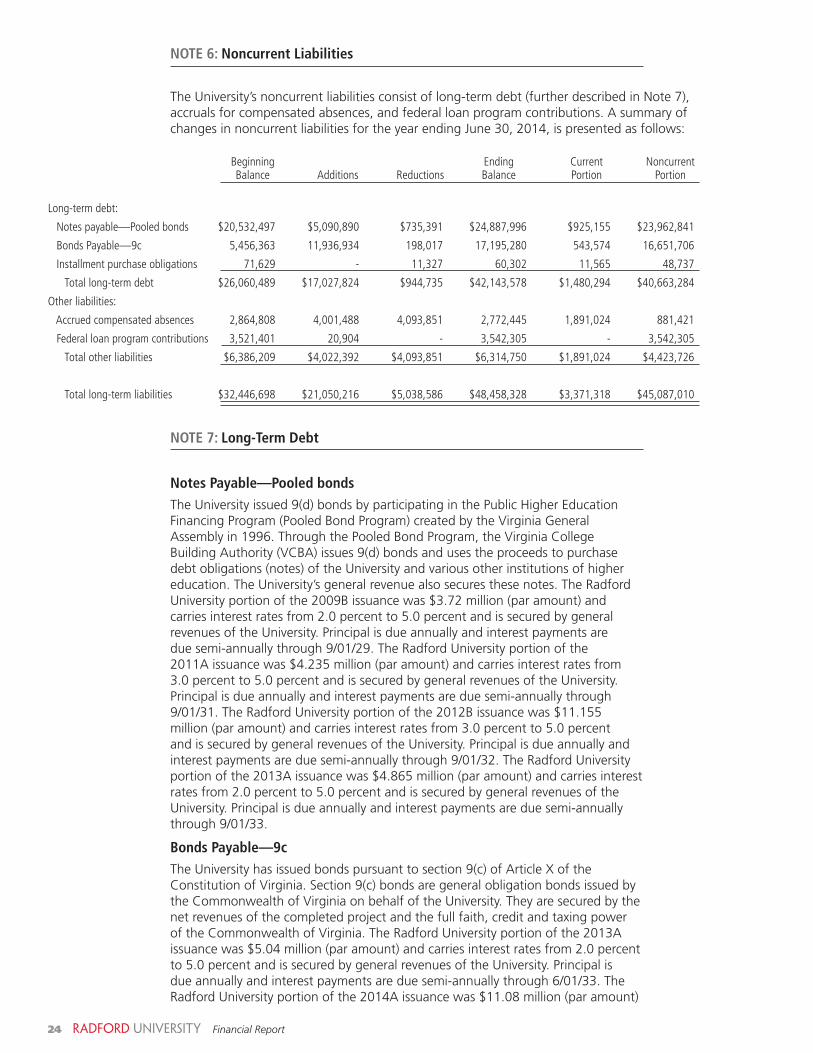
NOTE 6: Noncurrent liabilities
The University’s noncurrent liabilities consist of long-term debt (further described in Note 7), accruals for compensated absences, and federal loan program contributions A summary of changes in noncurrent liabilities for the year ending June 30, 2014, is presented as follows:
NOTE 7: long-Term Debt
Notes Payable—Pooled bondsThe University issued 9(d) bonds by participating in the Public Higher Education Financing Program (Pooled Bond Program) created by the Virginia General Assembly in 1996 Through the Pooled Bond Program, the Virginia College Building Authority (VCBA) issues 9(d) bonds and uses the proceeds to purchase debt obligations (notes) of the University and various other institutions of higher education The University’s general revenue also secures these notes The Radford University portion of the 2009B issuance was $3 72 million (par amount) and carries interest rates from 2 0 percent to 5 0 percent and is secured by general revenues of the University Principal is due annually and interest payments are due semi-annually through 9/01/29 The Radford University portion of the 2011A issuance was $4 235 million (par amount) and carries interest rates from 3 0 percent to 5 0 percent and is secured by general revenues of the University Principal is due annually and interest payments are due semi-annually through 9/01/31 The Radford University portion of the 2012B issuance was $11 155 million (par amount) and carries interest rates from 3 0 percent to 5 0 percent and is secured by general revenues of the University Principal is due annually and interest payments are due semi-annually through 9/01/32 The Radford University portionofthe2013Aissuancewas$4.865million(paramount)andcarriesinterestrates from 2 0 percent to 5 0 percent and is secured by general revenues of the University Principal is due annually and interest payments are due semi-annually through 9/01/33
Bonds Payable—9cThe University has issued bonds pursuant to section 9(c) of Article X of the Constitution of Virginia Section 9(c) bonds are general obligation bonds issued by the Commonwealth of Virginia on behalf of the University They are secured by the net revenues of the completed project and the full faith, credit and taxing power of the Commonwealth of Virginia The Radford University portion of the 2013A issuance was $5 04 million (par amount) and carries interest rates from 2 0 percent to 5 0 percent and is secured by general revenues of the University Principal is due annually and interest payments are due semi-annually through 6/01/33 The RadfordUniversityportionofthe2014Aissuancewas$11.08million(paramount)
Beginning Ending Current Noncurrent Balance Additions Reductions Balance Portion Portion
Long-term debt:
Notes payable—Pooled bonds $20,532,497 $5,090,890 $735,391 $24,887,996 $925,155 $23,962,841
Bonds Payable—9c 5,456,363 11,936,934 198,017 17,195,280 543,574 16,651,706
Installment purchase obligations 71,629 - 11,327 60,302 11,565 48,737
Total long-term debt $26,060,489 $17,027,824 $944,735 $42,143,578 $1,480,294 $40,663,284
Other liabilities:
Accrued compensated absences 2,864,808 4,001,488 4,093,851 2,772,445 1,891,024 881,421
Federal loan program contributions 3,521,401 20,904 - 3,542,305 - 3,542,305
Total other liabilities $6,386,209 $4,022,392 $4,093,851 $6,314,750 $1,891,024 $4,423,726
Total long-term liabilities $32,446,698 $21,050,216 $5,038,586 $48,458,328 $3,371,318 $45,087,010
25 Financial Report
and carries interest rates from 2 0 percent to 5 0 percent and is secured by general revenues of the University Principal is due annually and interest payments are due semi-annually through 6/01/34
Installment Purchase ObligationsThe University has future obligations under an installment purchase agreement initiated in January 2009 The capitalized value of the asset purchased under this installment purchase agreement is $114,460 and the repayment term is 10 years at aninterestrateof2.087percent.
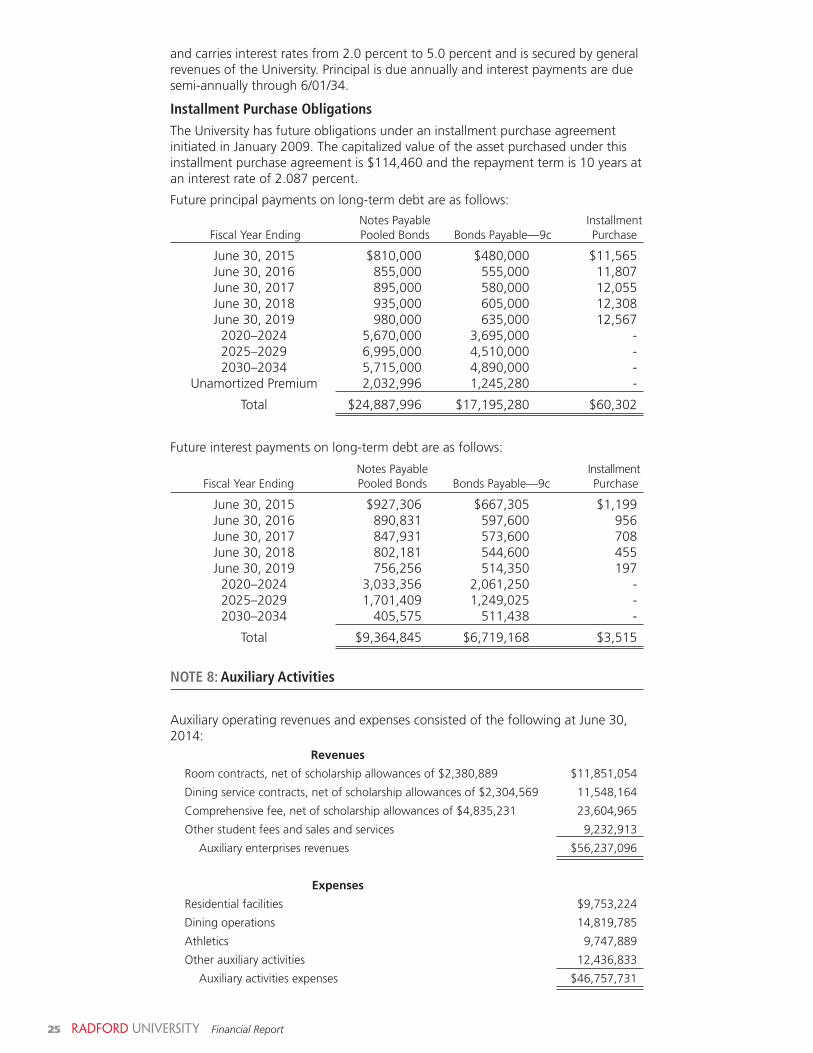
Future principal payments on long-term debt are as follows:
Notes Payable Installment Fiscal Year Ending Pooled Bonds Bonds Payable—9c Purchase
June30,2015 $810,000 $480,000 $11,565 June30,2016 855,000 555,000 11,807 June30,2017 895,000 580,000 12,055 June30,2018 935,000 605,000 12,308 June30,2019 980,000 635,000 12,567 2020–2024 5,670,000 3,695,000 - 2025–2029 6,995,000 4,510,000 - 2030–2034 5,715,000 4,890,000 - UnamortizedPremium 2,032,996 1,245,280 -
Total $24,887,996 $17,195,280 $60,302
Future interest payments on long-term debt are as follows:
Notes Payable Installment Fiscal Year Ending Pooled Bonds Bonds Payable—9c Purchase
June 30, 2015 $927,306 $667,305 $1,199 June30,2016 890,831 597,600 956 June30,2017 847,931 573,600 708 June30,2018 802,181 544,600 455 June 30, 2019 756,256 514,350 197 2020–2024 3,033,356 2,061,250 - 2025–2029 1,701,409 1,249,025 - 2030–2034 405,575 511,438 -
Total $9,364,845 $6,719,168 $3,515
NOTE 8: Auxiliary Activities
Auxiliary operating revenues and expenses consisted of the following at June 30, 2014: Revenues
Roomcontracts,netofscholarshipallowancesof$2,380,889 $11,851,054
Diningservicecontracts,netofscholarshipallowancesof$2,304,569 11,548,164
Comprehensivefee,netofscholarshipallowancesof$4,835,231 23,604,965
Other student fees and sales and services 9,232,913
Auxiliary enterprises revenues $56,237,096
Expenses
Residential facilities $9,753,224
Diningoperations 14,819,785
Athletics 9,747,889
Otherauxiliaryactivities 12,436,833
Auxiliary activities expenses $46,757,731
26 Financial Report
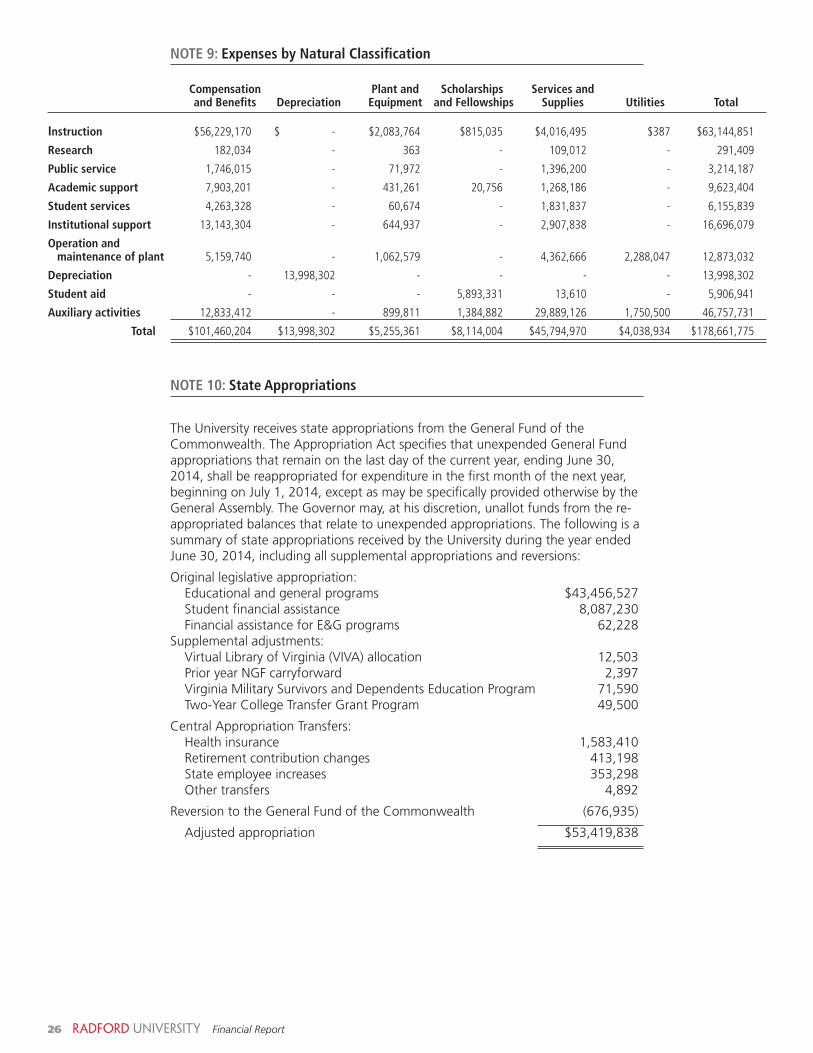
NOTE 10: State Appropriations
The University receives state appropriations from the General Fund of the Commonwealth The Appropriation Act specifies that unexpended General Fund appropriations that remain on the last day of the current year, ending June 30, 2014, shall be reappropriated for expenditure in the first month of the next year, beginning on July 1, 2014, except as may be specifically provided otherwise by the General Assembly The Governor may, at his discretion, unallot funds from the re-appropriated balances that relate to unexpended appropriations The following is a summary of state appropriations received by the University during the year ended June 30, 2014, including all supplemental appropriations and reversions:
Original legislative appropriation:Educational and general programs $43,456,527Studentfinancialassistance 8,087,230FinancialassistanceforE&Gprograms 62,228
Supplemental adjustments:Virtual Library of Virginia (VIVA) allocation 12,503Prior year NGF carryforward 2,397Virginia Military Survivors and Dependents Education Program 71,590Two-Year College Transfer Grant Program 49,500
Central Appropriation Transfers:Healthinsurance 1,583,410Retirementcontributionchanges 413,198Stateemployeeincreases 353,298Othertransfers 4,892
Reversion to the General Fund of the Commonwealth (676,935)
Adjustedappropriation $53,419,838
NOTE 9: Expenses by Natural Classification
Compensation Plant and Scholarships Services and and Benefits Depreciation Equipment and Fellowships Supplies Utilities Total Instruction $56,229,170 $ - $2,083,764 $815,035 $4,016,495 $387 $63,144,851
Research 182,034 - 363 - 109,012 - 291,409
Public service 1,746,015 - 71,972 - 1,396,200 - 3,214,187
Academic support 7,903,201 - 431,261 20,756 1,268,186 - 9,623,404
Student services 4,263,328 - 60,674 - 1,831,837 - 6,155,839
Institutional support 13,143,304 - 644,937 - 2,907,838 - 16,696,079
Operation and maintenance of plant 5,159,740 - 1,062,579 - 4,362,666 2,288,047 12,873,032
Depreciation - 13,998,302 - - - - 13,998,302
Student aid - - - 5,893,331 13,610 - 5,906,941
Auxiliary activities 12,833,412 - 899,811 1,384,882 29,889,126 1,750,500 46,757,731
Total $101,460,204 $13,998,302 $5,255,361 $8,114,004 $45,794,970 $4,038,934 $178,661,775
27 Financial Report
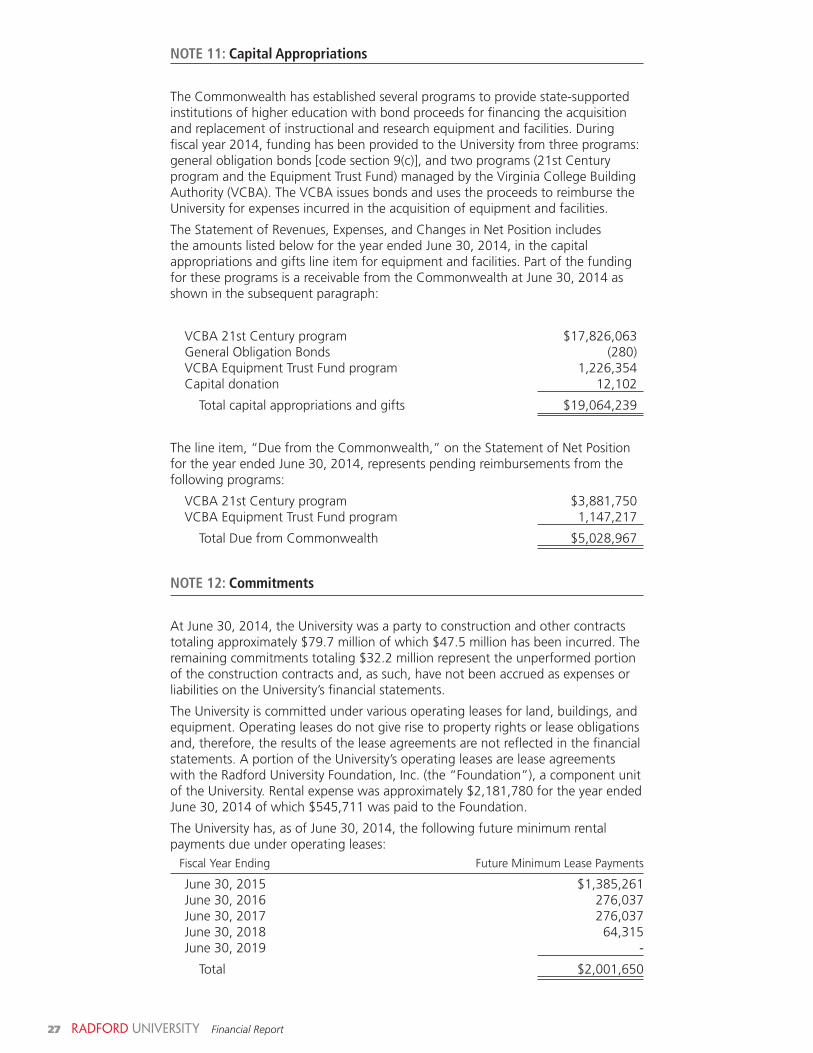
NOTE 11: Capital Appropriations
The Commonwealth has established several programs to provide state-supported institutions of higher education with bond proceeds for financing the acquisition and replacement of instructional and research equipment and facilities During fiscal year 2014, funding has been provided to the University from three programs: general obligation bonds [code section 9(c)], and two programs (21st Century program and the Equipment Trust Fund) managed by the Virginia College Building Authority (VCBA) The VCBA issues bonds and uses the proceeds to reimburse the University for expenses incurred in the acquisition of equipment and facilities
The Statement of Revenues, Expenses, and Changes in Net Position includes the amounts listed below for the year ended June 30, 2014, in the capital appropriations and gifts line item for equipment and facilities Part of the funding for these programs is a receivable from the Commonwealth at June 30, 2014 as shown in the subsequent paragraph:
VCBA21stCenturyprogram $17,826,063GeneralObligationBonds (280)VCBA Equipment Trust Fund program 1,226,354Capital donation 12,102
Total capital appropriations and gifts $19,064,239
The line item, “Due from the Commonwealth,” on the Statement of Net Position for the year ended June 30, 2014, represents pending reimbursements from the following programs:
VCBA21stCenturyprogram $3,881,750VCBA Equipment Trust Fund program 1,147,217
TotalDuefromCommonwealth $5,028,967
NOTE 12: Commitments
At June 30, 2014, the University was a party to construction and other contracts totaling approximately $79 7 million of which $47 5 million has been incurred The remaining commitments totaling $32 2 million represent the unperformed portion of the construction contracts and, as such, have not been accrued as expenses or liabilities on the University’s financial statements
The University is committed under various operating leases for land, buildings, and equipment Operating leases do not give rise to property rights or lease obligations and, therefore, the results of the lease agreements are not reflected in the financial statements A portion of the University’s operating leases are lease agreements with the Radford University Foundation, Inc (the “Foundation”), a component unit oftheUniversity.Rentalexpensewasapproximately$2,181,780fortheyearendedJune 30, 2014 of which $545,711 was paid to the Foundation
The University has, as of June 30, 2014, the following future minimum rental payments due under operating leases: Fiscal Year Ending Future Minimum Lease Payments
June30,2015 $1,385,261June 30, 2016 276,037June 30, 2017 276,037June30,2018 64,315June 30, 2019 -
Total $2,001,650
28 Financial Report
NOTE 13: Retirement Plans
virginia Retirement SystemEmployees of the University are employees of the Commonwealth of Virginia Substantially all full-time classified salaried employees of the University participate in a defined benefit retirement plan administered by the Virginia Retirement System (VRS) The VRS is a multiple-employer public employee retirement system (PERS) that acts as a common investment and administrative agency for the Commonwealth of Virginia and its political subdivisions
The VRS does not measure assets and pension benefit obligations separately for individual state institutions Therefore, all information relating to this plan is available at the statewide level only and can be found in the Commonwealth’s Comprehensive Annual Financial Report (CAFR) The Commonwealth of Virginia, not the University, has the overall responsibility for contributions to this plan The CAFR provides disclosure of the Commonwealth’s unfunded pension benefit obligation at June 30, 2014 The same report contains historical trend information showing VRS’s progress in accumulating sufficient assets to pay benefits when due The University’s expenses include the amount assessed by the Commonwealth for contributions to VRS, which totaled $3,490,795 for the year ended June 30, 2014
Optional Retirement PlansFull-time faculty and certain administrative staff participate in defined contribution plans, TIAA/CREF Insurance Companies and Fidelity Investments Tax-Exempt Services These plans are fixed-contribution programs where the retirement benefits received are based upon employer and employee contributions, plus interest and dividends Employees hired prior to July 1, 2010 (Plan 1) have an employer required contribution rate of 10 4 percent Employees hired on or after July 1, 2010 (Plan 2)haveanemployerrequiredcontributionrateof8.5percentandanemployeerequired contribution rate of 5 percent
Individual contracts issued under the plan provide for full and immediate vesting of both the University’s and the employee’s contributions Total employer pension costsunderthisplanwereapproximately$2,622,866foryearendedJune30,2014 Contributions to the optional retirement plan were calculated using the base salary amount of approximately $26,274,235 for this fiscal year
Deferred Compensation PlanEmployees of the University are employees of the Commonwealth of Virginia State employees may participate in the Commonwealth’s Deferred Compensation Plan Participating employees can contribute to the plan each pay period with the Commonwealth matching up to $20 per pay period The dollar amount match can change depending on the funding available in the Commonwealth’s budget The Deferred Compensation Plan is a qualified defined contribution plan under Section 401(a) of the Internal Revenue Code Employer contributions under the Deferred CompensationPlanwereapproximately$318,637forfiscalyear2014.
NOTE 14: Postemployment Benefits
The Commonwealth sponsors postemployment benefit programs that are administered by VRS These programs, a statewide group life insurance program and the Virginia Sickness and Disability Program’s long-term care plan, provide postemployment benefits to eligible retired and terminated employees Health care credits are also provided to offset the monthly health insurance premiums for retirees who have at least 15 years of service Information related to these plans is available at the statewide level in the Commonwealth’s Comprehensive Annual Financial Report
29 Financial Report
NOTE 15: grants and Contracts Contingencies
The University has received grants for specific purposes that are subject to review and audit by the grantor agencies Claims against these resources are generally conditional upon compliance with the terms and conditions of grant agreements and applicable federal regulations, including the expenditures of resources for allowable purposes Any disallowance resulting from a federal audit may become a liability of the University In addition, the University is required to comply with the various federal regulations issued by the Office of Management and Budget Failure to comply with certain system requirements of these regulations may result in questions concerning the allowance of related direct and indirect charges pursuant to such agreements As of June 30, 2014, the University estimates that no material liabilities will result from such audits or questions
NOTE 16: Federal Direct lending Program
The University participates in the Federal Direct Lending Program Under this program, the University receives funds from the U S Department of Education for Stafford and Parent PLUS Loan Programs and disburses these funds to eligible students The funds can be applied to outstanding student tuition and fee charges or refunded directly to the student These loan proceeds are treated as student payments with the University acting as a fiduciary agent for the student Therefore, the receipt of the funds from the federal government is not reflected in the federal government grants and contracts total on the Statement of Revenues, Expenses, and Changes in Net Position The activity is included in the noncapital financing section of the Statement of Cash Flows For the fiscal year ended June 30, 2014, cashprovidedbytheprogramtotaled$55,410,681andcashusedbytheprogramtotaled $55,351,090
NOTE 17: Risk Management and Employee health Care Plans
The University is exposed to various risks of loss related to torts; theft of, damage to, and destruction of assets; errors and omissions; non-performance of duty; injuries to employees; and natural disasters The University participates in insurance plans maintained by the Commonwealth of Virginia The state employee health care and worker’s compensation plans are administered by the Department of Human Resource Management and the risk management insurance plans are administered by the Department of Treasury, Division of Risk Management Risk management insurance includes property, general liability, medical malpractice, faithful performance of duty bond, automobile, and air and watercraft plans The University pays premiums to each of these departments for its insurance coverage Information relating to the Commonwealth’s insurance plans is available at the statewide level in the Commonwealth’s Comprehensive Annual Financial Report
30 Financial Report
NOTE 18: Component Unit Financial Information
(A) Contributions ReceivableThe following summarizes the unconditional promises to give at June 30, 2014:
Current receivables: Receivableinlessthanoneyear $1,097,908 Lessallowanceforuncollectiblecontributions (20,618) Net current contributions receivable $1,077,290 Noncurrent receivables: Receivableinonetofiveyears $868,164 Receivable in more than five years 20,254 Lessdiscounttonetpresentvalue (85,624) Less allowance for uncollectible contributions (17,379) Netnoncurrentcontributionsreceivable $785,415
Total contributions receivable $1,862,705
The discount rate used in 2014 was 5 66 percent As of June 30, 2014, there were no conditional promises to give
(B) Notes Receivable
Note receivable due in monthly payments of $542 through May 2022 with interest receivable at 5 5 percent and secured by land and building
Notereceivable,current $4,289 Notereceivable,noncurrent 37,508 Total note receivable $41,797
(C) Investments
Investments are comprised of the following as of June 30, 2014:
Short-term: Cash and cash equivalents $339,333 Equities 1,136,590 Investment company 49,100,023 Total short-term $50,575,946
Long-term: Cashandcashequivalents $30,585 Equities 22,004 Mutual and money market funds 619,095 Investmentcompany 5,620,918 Total long-term 6,292,602 Totalinvestments $56,868,548
(D) Capital Assets
A summary of land, buildings, and equipment at cost, less accumulated depreciation, for the year ending June 30, 2014 is presented as follows:
Depreciable capital assets: Buildings $5,587,414 Furniture and equipment 297,414 Vehicles 42,759 Land improvements 171,216 Totaldepreciablecapitalassets,atcost 6,098,803 Lessaccumulateddepreciation (2,105,815) Total depreciable capital assets, net of accumulated depreciation $3,992,988
Nondepreciable capital assets: Land $1,393,693 Construction in progress 1,034,451 Collectionsofart 2,068,982 Total nondepreciable capital assets 4,497,126 Totalcapitalassets,netofaccumulateddepreciation $8,490,114
31 Financial Report
(E) Line of Credit
The following is a summary of the outstanding line of credit at June 30, 2014:
Line of credit agreement renewed May 9, 2014 with a principal amount up to $1,500,000, interest payable monthly at LIBOR plus 1 61 percent (1 761 percent at June 30, 2014) with outstanding principal due upon maturity on May 31, 2015, secured by real estate and substantially all accounts held by Radford University Foundation, Inc with the financial institution $500,000
(F) Long-Term Debt Payable
The following is a summary of the outstanding notes payable at June 30, 2014:
Note payable in semi-annual installments of $40,000 through April 2016, with interest payable quarterly at LIBOR plus 2 25 percent, with a minimum rate of 3 percent (3 percent at June 30, 2014), outstanding principal due upon maturity, collateralized by virtually all accounts held by Radford University Foundation, Inc with the financial institution $560,000
Notepayableinmonthlyinstallmentsof$9,804throughMarch2018withinterestpayableat3.41percentoutstanding principal due upon maturity, collateralized by real property 776,350
Note payable in monthly installments of $17,532 through July2018,withinterestpayableat2.01percent,unsecured 824,369
Total long-term debt $2,160,719
Future principal payments on notes payable for years ending June 30 are as follows:
2015 $368,5462016 775,6002017 303,0552018 695,2162019 18,302
Total notes payable $2,160,719
NOTE 19: Subsequent Events
On August 5, 2014 Radford University entered into a lease agreement with Carilion Medical Center for the joint use of the Anatomy and Physiology Laboratory with Jefferson College of Health Sciences, and Virginia Tech Carilion School of Medicine Leasehold improvements not to exceed $900,000 will be incurred for actual costs of renovations, up-fit, or improvements made to the premises
Radford University is currently in the process of acquiring land from the Radford University Foundation for approximately $750,000 This land will be used for the construction of new intramural fields The new intramural fields will supplement and replace the existing fields, which will allow the University to better meet student demands
32 Financial Report
33 Financial Report
34 Financial Report
35 Financial Report
Radford, Virginia
BOARD OF vISITORSAs of June 30, 2014
Linda K Whitley-TaylorRector
Mary Waugh CampbellVice Rector
Anthony R Bedell Randolph “Randy” J Marcus Stephan Q Cassaday Alethea “A J ” Robinson Matthew B Crisp Steve A Robinson Callie M Dalton Ruby W Rogers Dr Kevin R Dye Georgia Anne Snyder-Falkinham Michael S Hurt Michael A Wray Milton C Johns
Michele N SchumacherSecretary to the Board of Visitors
ADMINISTRATIvE OFFICERS
Penelope W KylePresident
Richard S AlvarezVice President for Finance and Administration