Embed Size (px)
Citation preview

Financial statements
40 41
dna annual Report 2010dna annual Report 2010
Board of directors’ report
dna Ltd is a Finnish telecommunications group offering voice, data and TV services to consumers, communities and corpora-tions. dna also offers network and data communication services to service operators.
Welho business was incorporated into the balance sheet of dna Ltd on 30 June 2010 and into the profit and loss account from 1 July to 31 december 2010. Welho’s personnel transferred to the employ of dna as existing employees.
Unless otherwise stated, the comparison figures in brackets refer to the equivalent period in the previous year.
Market situationThe overall economic situation improved in 2010, however com-petition increased in the telecommunications consumer market towards the year end. Strong demand for mobile communica-tion services continued, particularly for mobile broadband, and fixed-line broadband customers actively switched to higher-speed Internet connections. demand for television services and mobile voice communication, which constitutes the largest individual market, remained steady.
Competition remained intense in the corporate market. In 2010, demand was switching from fixed-network voice services to mobile voice services. demand for mobile broadband and other mobile communication services increased, while that for fixed-network data subscriptions remained steady.
Mobile network termination charges between operators fell from last year. Towards the end of the year, there were signs of tighter regulation of the Finnish telecommunications market. The Council of State opened up the television business to com-petition and granted new operating licences for the terrestrial network.
Financial development of the Groupnet salesdna’s net sales totalled EUR 690.5 million (652.2 million), repre-senting 5.9 per cent growth on last year. The growth was fuelled by increasing sales in the consumer business and, in particular, by the incorporation of the Welho business. The main brake on net sales growth was falling demand for fixed-network services and the reduction in mobile network termination charges.
during the reporting period, 74 per cent (72 per cent) of net sales were generated by consumer business and 26 per cent (28 per cent) by corporate business.
dna’s net sales grew to EUR 690.5 million in 2010. The growth was fuelled by increasing sales in the consumer business and, in particular, by the incorporation of the Welho business. EBITda excluding non-recurring items improved to EUR 187.0 million and operating profit (EBIT) to EUR 70.2 million. Towards the end of the year, the result was burdened by the increase in material costs, the total cost of the extensive renewal of the customer information system, intensifying competition and a non-recurring provision recognised in december due to personnel negotiations.
Key operative indicators
2010 2009
number of mobile communication net-work subscriptions 2,108,000 1,947,000
- Revenue per subscription (ARPU), ¤* 21.7 22.4
- Customer churn rate, %* 18.7 16.2
number of fixed-network subscriptions 1,060,000** 647,000
- number of broadband subscriptions 291,000** 180,000
- number of cable TV subscriptions 598,000** 270,000
- number of telephone subscriptions 171,000 197,000
* includes only postpaid subscriptions** includes Welho subscriptions
Cash flow Cash flow after investments for the financial year increased to EUR 71.8 million (52.5 million). The financial position improved, and gearing at the end of the period was 16.1 per cent (34.0 per cent).
at the end of the period, the Group’s liquid assets amounted to EUR 49.5 million (26.3 million), and interest-bearing liabilities to EUR 151.9 million (170.8 million). Undrawn credit limits came to EUR 185.0 million (90.0 million).
In September, the Group negotiated a loan of EUR 120 mil-lion at a maximum with the European Investment Bank. The loan term is seven years, and the credit was undrawn at the closing date of the financial statements. In addition, the Group has an undrawn commercial paper programme worth EUR 150.0 million (150.0 million).
net debt amounted to EUR 102.4 million (144.5 million). The net debt/EBITda ratio improved significantly to 0.56 (0.86).
The balance sheet remained healthy, with the end-of-period equity ratio totalling 63.6 per cent (55.3 per cent).
Development per business segmentConsumer businessdna’s consumer business net sales for the financial year increased to EUR 513.4 million (471.0 million), mainly due to the Welho acquisition and the positive development in mobile com-munication services.
EBITda amounted to EUR 125.7 million (113.0 million) and EBITda excluding non-recurring items came to EUR 128.6 mil-lion (119.1 million). Operating profit improved to EUR 52.7 mil-lion (21.1 million). Profit for the last year was affected by a non-recurring EUR 13.0 million goodwill write-down on the fixed network that was allocated to consumer business in the last quarter of 2009. Operating profit excluding non-recurring items came to EUR 55.5 million (40.2 million).
Operating profit was improved through growth from the Welho acquisition and the higher volume of mobile communica-tion services. Towards the end of the year, EBITda and operat-ing profit were burdened by the increase in material costs, the total cost of the extensive renewal of the customer informa-tion system, actions necessitated by intensifying competition and a non-recurring provision recognised in december due to the cooperation negotiations.
EBITda and operating profit
dna’s earnings before interest, taxes, depreciation and amortisa-
tion (EBITda) for the financial year increased to EUR 182.1 mil-
lion (167.2 million), or 26.4 per cent of net sales (25.6 per cent).
EBITda excluding non-recurring items improved to EUR 187.0
million (179.5 million). Operating profit grew, coming to EUR 65.2
million (–43.8 million), or 9.4 per cent of net sales (–6.7 per cent).
Operating result for the comparable period was affected by a
non-recurring EUR 94.9 million goodwill write-down on the fixed
network in the last quarter of 2009. Operating profit excluding
non-recurring items increased and came to EUR 70.2 million (63.4
million), accounting for 10.2 per cent of net sales (9.7 per cent).
EBITda and operating profit improved mainly as a result of
increased net sales from consumer business.
dna’s profit before tax in January–december came to EUR
60.6 million (–42.8 million). Earnings per share came to EUR 5.35
(–7.46) and earnings per share excluding non-recurring items to
EUR 5.79 (6.12).
Financial profits and expenses amounted to EUR –4.7 million
(1.0 million). Income tax for the financial year was EUR 14.5 mil-
lion (13.8 million) and profit for the financial period improved to
EUR 46.0 million (–56.5).
The Group’s key figures
EUR million 2010 2009
net sales 690.5 652.2
EBITda 182.1 167.2
EBITda, % 26.4 25.6
EBITda, excluding non-recurring items 187.0 179.5
EBITda, % excluding non-recurring items 27.1 27.5
Operating profit/loss (EBIT) 65.2 –43.8
EBIT, % 9.4 –6.7Operating profit/loss (EBIT), excluding non-recurring items 70.2 63.4
EBIT, % excluding non-recurring items 10.2 9.7
Profit before tax 60.6 –42.8
Profit/loss for the financial period 46.0 –56.5
Earnings per share, EUR 5.35 –7.46Earnings per share, excluding non-recurring items, EUR 5.79 6.12
Return on investment (ROI), %* 9.6 –6.1
Cash flow after investments 71.8 52.5
* 12-month average
Consumer business key indicators
EUR million 2010 2009
net sales 513.4 471.0
EBITda 125.7 113.0
EBITda, % 24.5 24.0
EBITda excluding non-recurring items 128.6 119.1
EBITda, % excluding non-recurring items 25.0 25.3
Operating profit/loss (EBIT) 52.7 21.1
EBIT, % 10.3 4.5Operating profit/loss (EBIT), excluding non-recurring items 55.5 40.2
EBIT, % excluding non-recurring items 10.8 8.5
Corporate business
dna’s corporate business net sales for the financial year
decreased to EUR 177.1 million (181.1 million). net sales waned in
fixed-network voice services and increased in mobile communica-
tion services. Volumes also decreased in operator sales.
EBITda amounted to EUR 56.3 million (54.4 million) and
EBITda excluding non-recurring items came to EUR 58.4 million
(60.6 million). Operating profit came to EUR 12.6 million (-64.6
million). Operating result for the last year was affected by a non-
recurring EUR 81.9 million goodwill write-down on the fixed net-
work, allocated to corporate business in the last quarter of the
year. Operating profit excluding non-recurring items came to EUR
14.7 million (23.5 million).
EBITda and operating profit were burdened by the decrease
in net sales, the total cost of the extensive renewal of the cus-
tomer information system and a non-recurring provision recog-
nised in december due to cooperation negotiations.
Corporate business key indicators
EUR million 2010 2009
net sales 177.1 181.1
EBITda 56.3 54.4
EBITda, % 31.8 30.1
EBITda, excluding non-recurring items 58.4 60.6
EBITda, % excluding non-recurring items 33.0 33.5
Operating profit/loss (EBIT) 12.6 –64.6
EBIT, % 7.1 –35.7Operating profit/loss (EBIT), excluding non-recurring items 14.7 23.5
EBIT, % excluding non-recurring items 8.3 13.0
Investments
Investments in the financial year amounted to EUR 83.4 mil-
lion (87.9 million), or 12.1 per cent of net sales (13.5 per cent).
Consumer-business investment amounted to EUR 60.6 million
(59.9 million) and investment in corporate business to EUR 22.8
million (27.8 million). The lower annual level of investment was due
to an equipment supplier’s delivery and component problems and
competitive bidding among next-generation equipment suppliers.
Investments were increased during the last quarter of the year.

Financial statements
42 43
dna annual Report 2010dna annual Report 2010
Major individual items include investments in the 3G network, fibre and transfer systems, as well as the customer information system.
Research and developmentThe Group invested EUR 1.3 million (2.5 million), or 0.2 per cent (0.4) of net sales, in research and product development in the financial year. Of this, EUR 0.7 million (0.8 million) was entered in the balance sheet.
Personnelat the end of december, dna employed 1,003 (818) people. The year-on-year increase of 22.6 per cent was attributable to the Welho acquisition. In total, 225 people transferred from Welho mainly to dna’s consumer business as existing employees on 30 June 2010.
Personnel were distributed as follows: 697 (511) in the con-sumer business and 306 (307) in the corporate business.
The average number of employees in January–december was 934 (918).
Key personnel indicators
2010 2009
The average number of employees for the period 934 918Salaries and remunerations for the period, EUR million 49.8 50.2
Main events in 2010dna Ltd’s annual General Meeting of 31 March 2010 agreed to pay a dividend of EUR 4.35 per share, a total of EUR 32,965,435.35, to dna’s shareholders. The decision was made in accordance with the Board of directors’ proposal and on the basis of the financial statements for 2009 as adopted by the annual General Meeting.
The Board of directors was confirmed as comprising six mem-bers. Mr Risto Siivola, Mr Esa Haavisto, Mr Hannu Isotalo, Mr Jarmo Leino and Mr anssi Soila continued as members of the Board. Mr Jukka Ottela, 56, M.Sc. (Econ), Master of Laws and CEO of Esan Kirjapaino Oy, was elected a Board member to replace Mr Juha-Pekka Keskiaho who resigned from the Board. Pricewater-houseCoopers Oy continued as the company’s auditor.
In March 2010, dna introduced a long-term incentive scheme for management and other key personnel.
On 31 May 2010, dna agreed to acquire the Welho business from Sanoma Corporation. The agreement was approved by the Finnish Competition authority on 30 June, and the combined business operations were launched on 1 July 2010. after the business transaction, dna had over three million customers, a leading 43 per cent share of the cable TV market in Finland and a strong position in the fixed-network business in the Helsinki metropolitan area.
The Extraordinary General Meeting on 30 June 2010 appointed two new members to the Board of directors: Ms anu nissinen, 47, M.Sc. (Econ) and Mr david nuutinen, 51, MBa. Ms nissinen is the President of Sanoma Entertainment Ltd. and
Corporate governanceGeneral MeetingsThe annual General Meeting was held on 31 March 2010. In addi-tion, an Extraordinary General Meeting was held on 30 June 2010.
Board of directorsduring the period under review, the Board of directors convened 17 times. The participation rate of meetings of the Board of directors was 99 per cent. The Board of directors had the follow-ing members:
- From 1 January 2010 to 31 March 2010: Risto Siivola (Chair-man), Esa Haavisto, Hannu Isotalo, Juha-Pekka Keskiaho, Jarmo Leino and anssi Soila
- From 31 March 2010 to 30 June 2010: Risto Siivola (Chair-man), Esa Haavisto, Hannu Isotalo, Jarmo Leino, anssi Soila and Jukka Ottela
- From 30 June 2010 to 31 december 2010: Jarmo Leino (Chairman), Risto Siivola, Hannu Isotalo, anssi Soila, Jukka Ottela, david nuutinen and anu nissinen
The Board of directors did not have any sub-committees in 2010.
President and CEOdna Ltd’s President and CEO was Riitta Tiuraniemi.
Executive TeamThe company’s executive team consisted of Riitta Tiuraniemi (President and CEO), Johan Flykt (Vice President, Customer Proc-esses) effective 5 august, Jukka Leinonen (Vice President, Cor-porate Business), Petteri niemi (Chief Operating Officer), Tommy Olenius (Vice President, Technology), Ilkka Pitkänen (Chief Finan-cial Officer, deputy CEO), asta Rantanen (Vice President, Legal affairs), Marko Rissanen (Vice President, Human Resources), Erik Sylvestersson (Vice President, Sales & Marketing), Hannu Turunen (Vice President, new Business), Timo Varsila (Vice President, Prod-ucts & Content) and Pekka Väisänen (Vice President, Consumer Business).
auditorsThe company’s auditor was authorised Public accountants Price-waterhouseCoopers with Pekka Loikkanen, authorised Public accountant, acting as the principal auditor.
Shareholders, shares, issues and option rightsat the beginning of the financial year, the number of the com-pany shares totalled 7,580,761 and the company’s share capi-tal registered in the Finnish Trade Register amounted to EUR 72,702,225.65. at the end of the financial year, the company’s shares totalled 9,610,676 and the share capital registered in the Finnish Trade Register amounted to EUR 72,702,225.65. The com-pany held 7,500 treasury shares.
The largest shareholders of dna Ltd on 31 december 2010
Owner no. of
sharesno. of votes
Share, %
Finda Oy 2,495,490 2,495,490 26.0
Sanoma Television Oy * 2,027,167 2,027,167 21.1
Oulu ICT Oy 1,698,997 1,698,997 17.7
PHP Liiketoiminta Oyj 1,513,856 1,513,856 15.8
Kuopion Puhelin Oy ** 993,864 993,864 10.3
Anvia Plc *** 251,471 251,471 2.6Ilmarinen Mutual Pension Insurance Company 227,423 227,423 2.4
Lohjan Puhelin Oy 220,877 220,877 2.3Pietarsaaren Seudun Puhelin Oy 70,460 70,460 0.7
Kokkolan Puhelin Oy *** 42,841 42,841 0.4Ten largest owners in total 9,542,446 9,542,446 99.3Others 68,230 68,230 0.7
Total 9,610,676 9,610,676 100.0 * merged into Sanoma Entertainment Finland Ltd on 1 January 2011** name changed to Osuuskunta KPY*** The merger of Anvia Plc and Kokkolan Puhelin Oy was entered into the Finnish Trade Reg-
ister on 31 december 2010.
Share issues
The Extraordinary General Meeting on 30 June 2010 decided to
issue a total of 2,027,167 new shares as a directed share issue to
Sanoma Television Oy. The right to deviate from the pre-emptive
right of the shareholders was due to the existence of a weighty
financial reason under Section 9(4) of the Limited Liability Com-
panies act, because the shares were issued to acquire the Welho
business. dna Ltd acquired the Welho business from Sanoma Cor-
poration through a directed share issue on 30 June 2010. The fair
value of the issued shares was EUR 200,000,000 (EUR 98.66 per
share). They accounted for 21 per cent of dna Ltd’s share stock.
The share subscription price was EUR 8.70 per share, bring-
ing the total subscription price to EUR 17,626,329.22, which was
paid using property given as a subscription in kind. The price was
registered in full in the company’s invested unrestricted equity
reserve. The share subscription took place during the implemen-
tation of the business acquisition on 30 June 2010. The shares
were registered in the Finnish Trade Register on 31 august 2010.
The difference between the fair value and subscription price is
credited in the consolidated financial statement to the invested
unrestricted equity reserve.
Based on the authorisations by the annual General Meetings
of 27 March 2009 (max. 2,500 shares) and 31 March 2010 (max.
5,000 shares), the Board of directors decided to issue 2,500
shares on 28 January 2010 and 248 shares on 31 March 2010 as
part of the company’s management incentive programme. The
authorisation included the right to deviate from the pre-emp-
tive right of the shareholders. a total of 2,748 new shares were
subscribed at a per-share subscription price of EUR 97. President
and CEO Riitta Tiuraniemi subscribed a total of 180 shares and
other managers 2,568 shares.
at the end of the financial year, the Board of directors had a
remaining authorisation for issuing 4,752 new shares.
a member of the Board of directors of Sanoma Media. Mr nuu-
tinen is the President (Finland) of Leaf Suomi Oy and a member
of the Executive Team of Leaf International. On the same date,
Mr Esa Haavisto retired from the Board and the number of Board
members was confirmed at seven. Mr Jarmo Leino, CEO of dna’s
largest shareholder, Finda Oy, took over as the Chairman of the
Board.
Mr Johan Flykt, Business director at Welho, was appointed
dna Vice President, Customer Processes and member of the
Executive Team on 5 august 2010. He reports to dna Chief
Operating Officer Petter niemi.
The customer information system of dna’s mobile communi-
cation customer service was renewed in October. With the new
system and the related tools, customer service and sales per-
sonnel can serve dna’s customers even better.
dna was the first operator in Finland to launch cooperation
with Google in the B-to-B market on 18 October 2010. dna and
Google agreed on broad-based cooperation whereby dna inte-
grated its services and Google apps into a cost-efficient busi-
ness solution that is easy to acquire and deploy.
dna began the construction of its terrestrial HdTV network
in the third quarter of the year and launched HdTV test broad-
casts in the Uusimaa region on 1 december 2010. By the turn of
the year, broadcasts were available to some 2 million Finns.
On 28 december 2010, dna announced the merger of dna
and the Welho business. due to the business restructuring,
cooperative negotiations involving all dna and Welho staff began
on 3 January 2011. It was estimated that restructuring would
result in staff cuts affecting 40 employees.
To ensure the high quality of customer service, dna estab-
lished new sales service centers, bringing the total number to
10 by the end of the year. The expansion and strengthening of
dna’s 3G network continued throughout the year.
Changes in the Group structure
The Group exercised its call option to purchase 96 shares from
Huuked Labs Oy, which brought its holding to 100 per cent. as
part of the streamlining of the corporate structure, Shelco 2 Oy
and Shelco 3 Oy were merged with dna Ltd on 30 September
2010.
Significant litigation matters
On 25 October 2010, dna received a notification from the Finn-
ish Competition authority (FCa) announcing that the FCa had
closed all investigations into suspected abuse of a dominant
position in the broadband market by Kuopion Puhelin Oy, Päijät-
Hämeen Puhelin Oyj and Oulun Puhelin Oy, as well as dna Ltd’s
broadband business to which their operations had been trans-
ferred. Investigations by the competition authority did not lead
to further action.
Financial statements
44 45
dna annual Report 2010dna annual Report 2010
Option rightsThe annual General Meeting on 27 March 2009 authorised the Board of directors to decide on issuing a maximum of 125,000 option rights. Based on the authorisation, the Board of directors decided on 17 december 2009 to issue a maximum of 100,000 option rights to dna’s management and other key personnel. On 28 January 2010, the Board of directors decided to allocate 36,000 of the option rights classified as 2010a to the Executive Team and 14,000 to other key personnel. at the end of the year, 50,000 option rights from this issue had not been allocated to named option right holders.
at the end of the financial year, the Board of directors held a remaining authorisation, based on the annual General Meeting’s authorisation on 27 March 2009, to issue 25,000 option rights in one or several lots as part of the management and other key personnel incentive scheme. The authorisation included the right to deviate from the pre-emptive right of shareholders.
Treasury sharesduring the financial period, the company purchased 5,000 treas-ury shares pursuant to the decision taken by the annual Gen-eral Meeting on 31 March 2010 The redemption price was EUR 588,402.16. The shares redeemed during the financial period account for 0.05 per cent of shares and votes. The redemption of treasury shares did not have any significant effect on the own-ership and distribution of votes in the company. The acquisition was made with the company’s unrestricted equity, which was subsequently reduced by the redemption price.
The annual General Meeting authorised the Board of direc-tors to resolve to repurchase or accept as a pledge a maximum of 750,000 dna shares in one or several lots by using funds in the unrestricted equity reserve. The shares may be repurchased in order to carry out acquisitions or other arrangements related to the company’s business, to improve the capital structure of the company, to be used as part of the incentive scheme, to be transferred for other purposes or to be cancelled. The Board of directors shall have the right to decide on other matters related to the purchase of the shares. The authorisation will be effec-tive until 30 June 2011. no shares were purchased based on the authorisation during the reporting period.
Corporate responsibilitydna continued the corporate responsibility development project, which is based on the Global Reporting Initiative (GRI) reporting model and was launched in the autumn of 2009. The reporting model will be implemented in stages, selecting those GRI met-rics that are appropriate for dna’s business. The objective was to reach GRI level C at minimum in 2010. The corporate responsibility report for 2010 will be included in the annual report.
Significant risks and uncertaintiesGeneralRisk management is part of dna’s strategy process and cor-porate governance. It is guided by the risk management pol-icy approved by the Board of directors. The policy defines the purpose, process, key practices and responsibilities of risk management.
The purpose of risk management is to help dna’s manage-ment achieve the company vision and strategic objectives and to provide the Board of directors with up-to-date information on company risks and their management. Risk management is also designed to safeguard dna’s critical success factors. Criti-cal success factors rely on dna’s operative efficiency, in-depth understanding of customers and markets as well as skilled and agile workforce.
Risk refers to events or circumstances that, if they materi-alise, could affect dna’s ability to achieve its targets. any risks that undermine dna’s strategically significant competitive strengths must be avoided if possible, and special attention must be paid to managing such risks.
dna’s risk management focuses on preventive action, limi-tation of adverse effects and utilisation of opportunities. The Group systematically identifies and analyses risks and modifies its operations accordingly as required. Within the Group, it is acknowled ged that not every risk relevant to its business can be identified by dna itself. For this reason, the Group regularly com-municates with its main external stakeholders to gain the most comprehensive overview possible of dna’s risk framework and the business environment.
dna considers its risks to be at a manageable level, given the extent of its operations and its ability to manage risks in practice.
dna’s key strategic and operative risks dna operates in the Finnish telecommunications market, which is characterised by tough competition between established opera-tors and a high degree of penetration.
dna believes that the borders between business sectors will become more blurred in the future, enabling increased competi-tion between telecom operators, ICT, media and Internet com-panies and terminal manufacturers. Rapid changes may also occur in different parts of the service production value chain. The Group sees this shift as an important opportunity and actively monitors market developments. dna is also making spe-cial efforts to identify new business opportunities. Starting up new business always involves higher risks than conventional and established business operations.
alongside traditional communications methods offered by telecom operators, technological development can create new ones such as communications through social media or smart-phone applications. Customer behaviour can change rapidly if new communications methods are sufficiently reliable and easy to use. If such services gain widespread popularity, they can have an overall impact on the traditional business of operators. On the other hand, new communications methods can provide new opportunities for operators by increasing the use of mobile data, for example.
Intense market competition places high demands on opera-tors’ systems. They must be able to provide usable and high-quality tools and productise services quickly and cost-efficiently. dna aims to use the most reliable and modern system solutions possible, to avoid issues such as service downtimes and prob-lems related to the reliability and availability of data.
In conclusion, dna’s business environment is highly sensitive
to change and currently the pace of that change is increasing.
dna must deepen its understanding of customers and markets,
and react quickly when changes occur.
Regulatory risks
The Finnish telecommunications market is characterised by strin-
gent regulation. Regulation and particularly the authorities’ ability
to influence the price level of products and services, cost struc-
ture and the criteria on which frequencies are distributed may
also have an impact on dna’s business.
Changes made to the Telecommunications act, such as the
possibility of number porting, could intensify competition further
in 2011.
Financing risk
In order to manage the interest rate risk, some of the loans taken
by the Group have been hedged. The Group’s borrowings have been
spread between fixed- and variable-rate instruments. In order to
manage liquidity risk, the company uses credit limits in addition
to liquid assets. The Group’s foreign interest risk is insignificant as
the majority of its cash flow is euro denominated. For more details
on the management of financing risks, please refer to section 3 in
the notes to the consolidated financial statements.
damage risk
With respect to the relevant areas, dna’s operations have been
insured against loss and business interruption.
Events after the financial year
Test HdTV broadcasting via dna’s terrestrial network continued
on 1 January 2011, under the dVB-T2 standard as required by
dna’s network operating licence. The programme content of the
broadcasts became more varied.
dna’s sales and marketing functions were transferred to the
consumer and corporate business organisations as of 1 Janu-
ary 2011. On the same date, Erik Sylvestersson, Vice President,
Sales & Marketing, retired from dna Ltd’s Executive Team.
On 10 January 2011, dna announced that it is extending
cooperation with long-term partner Ericsson to include the entire
3G/HSPa+ network and the technology needed to build and
launch dna’s 4G network. Based on the three-year contract, dna
will begin to offer 4G services in major cities, launching 4G com-
mercially in 2011. The agreement also covers further expansion
of the 3G network. during the contract period, dna’s 3G/HSPa+
(21/42 Mbps) services will expand to nationwide coverage.
On 11 and 27 January, dna announced the establishment
of new call service centers in Kajaani and Tornio that will begin
operating in February and March, respectively. These new centers
bring the total number of dna’s call service centers to 12.
DNA Ltd and YIT Rakennus Oy agreed on constructing an office
building for dna in Käpylä, Helsinki. The project was announced on
7 February 2011. YIT will construct the building and rent it out
to dna on a long-term lease. It will be completed in late summer
2012. all dna staff in the Helsinki metropolitan area, a total of
around 600 employees, will relocate to the new premises.
Outlook for 2011
Market outlook
It is estimated that the total value of the Finnish telecommuni-
cations market will remain unchanged. areas likely to experience
growth include mobile broadband and TV services. The value of
fixed-line broadband business is anticipated to remain unchanged
and the value of fixed-line voice services to decrease.
In addition to the overall economic situation, the industry’s
net sales and profitability are affected by the development of
the market in general, pricing pressures, increased competition in
the mobile communication market in particular and the reduc-
tion in mobile termination charges in december 2010. While the
overall economic situation is expected to continue improving, in
previous recessions there has been a clear delay in the effect of
economic cycles on the telecommunications sector.
The changes made to the Telecommunications act in accord-
ance with the EU directives on electronic communication will
come into effect in 2011. The most important change will be
the possibility of number porting in fixed-term contracts, which
will further increase competition between telecom operators.
dna’s outlook
Competition in the consumer market is expected to increase fur-
ther due to the change in the Telecommunications act in par-
ticular. Business operations will be launched in the terrestrial TV
networks and pay-TV business. It is anticipated that demand for
dna’s mobile broadband services will increase, with fixed-line broad-
band customers actively switching to higher-speed connections.
Competition in the corporate market is expected to remain
tight. demand for dna’s mobile voice and data services is esti-
mated to grow, whereas demand for fixed-network services is
likely to decrease.
dna intends to invest heavily in the construction and deploy-
ment of the 4G network during 2011.
The change in the Telecommunications act may have an
impact on dna’s amortisation schedule on intangible rights.
The Group’s financial position is expected to remain good in
2011 and net sales to grow mainly due to the integration of the
Welho business. EBITda and operating profit (EBIT) excluding
non-recurring items are estimated to remain at the same level
as in 2010 or to improve slightly.
Board of Directors’ proposal on the distribution of profits
dna Ltd’s distributable funds in the financial statement
amounted to EUR 239,251,755.14, of which profit for the financial
year came to EUR 59,861,733.01. The Board of directors proposes
to the annual General Meeting that a dividend of EUR 5,20 per
share be paid, totalling EUR 49,936,515.20.
dna Ltd
Board of directors

Financial statements
46 47
dna annual Report 2010dna annual Report 2010
Consolidated balance sheet, IFRSEUR 1,000
note 31 Dec 2010 31 dec 2009ASSETSNon-current assetsGoodwill 17 209,767 96,700Other intangible assets 17 134,356 59,056Property, plant and equipment 16 412,623 397,640Investments in associates 18 1,139 1,133available-for-sale financial assets 19 157 243Trade and other receivables 20 7,879 10,919deferred tax assets 21 28,459 31,677Total non-current assets 794,380 597,368 Current assetsInventories 22 12,527 7,856Trade and other receivables 20 158,051 140,115Cash and cash equivalents 23 49,466 26,304Total current assets 220,044 174,275
TOTAL ASSETS 1,014 ,424 771,643
SHAREHOLDERS’ EQUITYEquity attributable to equity holders of the parent Share capital 24, 25 72,702 72,702Hedge fund 24 –634 –1,248Unrestricted equity reserve 24 605,927 406,956Retained earnings –86,345 2,757Profit/loss of the period 46,032 –56,550TOTAL EQUITY 637,682 424,617
LIABILITIESNon-current liabilitiesInterest-bearing non-current liabilities 28 100,292 121,438Retirement benefit obligations 26 236 253Provisions for other liabilities 27 8,049 9,236derivative financial instruments 31 1,053 1,686deferred income tax liabilities 21 71,939 55,246Other non-current liabilities 1,405 1,443Total non-current liabilities 182,973 189,302
Current liabilitiesInterest-bearing current liabilities 28 51,584 49,391Provisions for other liabilities 27 6,497 3,777derivative financial instruments 31 0 453Prepayments received 29 11,554 2,693Trade payables 29 72,600 69,910accrued expenses 29 38,259 27,198Current income tax liabilities 9,173 1,811Other current liabilities 29 4,103 2,491Total current liabilities 193,770 157,724
TOTAL LIABILITIES 376,743 347,026
TOTAL EQUITY AND LIABILITIES 1,014,424 771,643
The notes on pages 50–77 are an integral part of the consolidated financial statements.
Consolidated income statement, IFRSEUR 1,000
note 1 Jan–31 Dec 2010 1 Jan–31 dec 2009
Net sales 6 690,492 652,162
Other operating income 7 3,719 4,963
Materials and services –350,786 –324,109
Employee benefit expenses 10 –63,136 –63,482
depreciation 9 –116,828 –116,051
Goodwill impairment 9, 17 0 –94,900
Other operating expenses 8, 11 –98,235 –102,379
Operating result (EBIT) 65,225 –43,796
Financial income 12 1,424 3,822
Loss/gain on financial assets recognised at fair value against profit or loss 0 2,463
Financial expense 13 –6,105 –5,270
Share of associated companies' results 18 11 9
Net profit/loss before tax 60,555 –42,772
Income tax 14 –14,523 –13,778
Net profit/loss for the period 46,032 –56,550
attributable to:
owners of the parent 46,032 –56,550
Earnings per share attributable to owners of the parent:
earnings per share, basic, EUR 15 5.35 –7.46
Consolidated statement of comprehensive incomeEUR 1,000
net profit/loss for the period 46,032 –56,550
Other comprehensive income, net of tax
Cash flow hedging 13 614 –270
available-for-sale financial assets - change in fair value 13 0 –47
Other comprehensive income, net of tax 614 –317
Total comprehensive income 46,646 –56,867
Attributable to:owners of the parent 46,646 –56,867
The notes on pages 50–77 are an integral part of the consolidated financial statements.

Financial statements
48 49
dna annual Report 2010dna annual Report 2010
Consolidated cash flow statement, IFRSEUR 1,000
2010 2009
Cash flows from operating activitiesProfit/loss for the period 46,032 –56,550
Adjustments *) 136,908 221,587
Change in working capital **) –13,648 –17,187
dividends received 2 0
Interest paid –4,806 –5,932
Interest received 878 753
Other financial items –377 0
Taxes paid –10,126 –16,935
Net cash generated from operating activities (A) 154,862 125,737
Cash flows from investing activitiesInvestments in property, plant and equipment (PPE) and intangible assets –83,373 –88,329
Proceeds from sale of PPE 296 2,284
Proceeds from sale of shares 0 14,371
acquisition of subsidiaries and business transfers –1 –3
Change in other shares 0 –1,875
Proceeds from sale of subsidiary, net of cash disposed 0 312
Change in other investments 30 –13
Net cash used in investing activities (B) –83,049 –73,253
Cash flows from financing activitiesdividends paid –32,955 –10,003
Share premium reduction 0 –41,618
Borrowing and repayment of current interest-bearing liabilities, net 0 –61,543
Borrowing of non-current interest-bearing liabilities 30,019 100,000
Repayment of non-current interest-bearing liabilities –49,042 –33,991
non-current receivables, increase/decrease 3,327 –5,118
Other financial items 0 18,756
Net cash used in financing activities (C) –48,651 –33,518
Change in cash and cash equivalents (a+B+C) 23,162 18,966
Cash and cash equivalents at beginning of period 26,304 7,339
Cash and cash equivalents at end of period 49,466 26,304
*) adjustments
depreciation 116,828 116,051
Impairment 0 94,900
Gains and losses on disposals of non-current assets –113 0
Other non-cash income and expense 989 –6,455
Financial income and expenses 4,681 3,313
Taxes 14,523 13,778
Total adjustments 136,908 221,587
**) Change in working capital
Change in receivables, non-interest bearing –12,339 –2,626
Change in inventories –3,853 2,819
Change in liabilities, non-interest bearing 2,544 –17,381
Total change in working capital –13,648 –17,187
The notes on pages 50–77 are an integral part of the consolidated financial statements.
Consolidated statement of changes in equity, IFRSEUR 1,000
noteShare
capitalShare
premium
Fair value
reserveHedge
fund
Unrest-ricted equity
reserveRetained earnings
non-controlling
interestTotal
Equity
Balance at 1 January 2009 72,375 41,689 48 –978 407,213 32,979 –1 553,324
Comprehensive incomeProfit or loss –56,550 –56,550
Other comprehensive incomeavailable-for-sale financial assets –48 -48
Cash flow hedges, net of tax –270 -270Total other comprehensive income, net of tax 13 –48 –270 –318
Total comprehensive income 0 0 –48 –270 0 –56,550 0 –56,868
Transactions with ownersOther changes –41,618 –41,618
Purchase of treasury shares –287 –287
Proceeds from shares issued 327 –327
Transfers in equity –71 71
dividends for 2008 –29,934 –29,934Total contributions by and distributions to owners 327 –41,689 –256 –30,221 –71,839
Balance at 1 January 2010 72,702 0 0 –1,248 406,957 –53,792 –1 424,617Comprehensive incomeProfit or loss 46,032 46,032Other comprehensive incomeCash flow hedges, net of tax 614 614Total other comprehensive income, net of tax 13 614 614Total comprehensive income for the period 0 0 0 614 0 46,032 0 46,646
Transactions with ownersacquisitions –1 1Employees share option scheme: granted options 25 389 389Other changes –1,029 15 –1,014Issue of ordinary shares related to business combination 5 200,000 200,000dividends for 2009 24 –32,955 –32,955Total contributions by and distributions to owners 198,971 –32,552 1 166,420Balance at 31 December 2010 72,702 0 0 –634 605,927 –40,313 0 637,682
The notes on pages 50–77 are an integral part of the consolidated financial statements.

Financial statements
50 51
dna annual Report 2010dna annual Report 2010
notes to the consolidated financial statements
1 The Group in brief
dna Group is a national supplier of mobile communication serv-ices. The Group parent company is dna Ltd. The parent com-pany’s registered domicile is Vantaa and registered address ansatie 6a B, 01740 Vantaa, Finland.
Copies of the consolidated financial statements are avail-able online at www.dna.fi or at the Group parent company head office at ansatie 6a B, 01740 Vantaa, Finland.
dna Ltd’s Board of directors approved the release of these consolidated financial statements at a meeting on 7 Febru-ary 2011. Under the Finnish Limited Liability Companies act, shareholders can approve or disapprove the consolidated finan-cial statements in the annual General Meeting held after the release. The annual General Meeting is also entitled to amend the consolidated financial statements.
2 Accounting principles
Basis of preparationThe consolidated financial statements have been prepared in accordance with International Financial Reporting Standards (IFRS). The statements are based on the IaS and IFRS stand-ards and the SIC and IFRS interpretations effective on 31 december 2010. International Financial Reporting Standards refer to standards and interpretations that comply with the Finnish accounting act and regulations issued by virtue thereof and the procedure adopted for application in the European Union according to the IaS Regulation (EC) no 1606/2002. The notes to the consolidated financial statements also comply with Finnish accounting legislation and Community legislation that supplement the IFRS.
The consolidated financial statements have mainly been prepared under the historical cost convention, as modified by the revaluation of available-for-sale financial assets, and finan-cial assets and financial liabilities at fair value through profit or loss. The consolidated financial statements are presented in euros.
The Group has adopted the following new and amended IFRS standards and interpretations as of 1 January 2010:
IFRS 3:a (revised) ”Business Combinations” and consequential amendments to IaS 27 ”Consolidated and separate financial statements”, IaS 28 ”Investments in associates”, and IaS 31 ”Interests in joint ventures”, are effective prospectively to busi-ness combinations for which the acquisition date is on or after the beginning of the first annual reporting period beginning on or after 1 July 2009.
The revised standard continues to apply the acquisition method to business combinations but with some signifi-cant changes compared with IFRS 3. For example, all pay-ments to purchase a business are recorded at fair value at
the acquisition date, with contingent payments classified as debt subsequently re-measured through the statement of comprehensive income. There is a choice on an acquisition-by-acquisition basis to measure the non-controlling interest in the acquiree either at fair value or at the non-controlling interest’s proportionate share of the acquiree’s net assets. all acquisi-tion-related costs are expensed.
The revised standard was applied to the acquisition of the Welho business 30 June 2010. acquisition-related costs of EUR 0.5 million have been recognised in the consolidated income statement. Previously, acquisition-related costs would have been included in the consideration for the business combina-tion. See note 5 for further details on the business combination occurring in 2010.
IaS 27 (revised) requires the effects of all transactions with non-controlling interests to be recorded in equity if there is no change in control and these transactions will no longer result in goodwill or gains and losses. The standard also specifies the accounting method when control is lost. any remaining interest in the entity is re-measured to fair value, and a gain or loss is recognised in profit or loss.
The following standards and amendments to existing stand-ards have been published and are mandatory for the group’s accounting periods beginning on or after 1 January 2010 or later periods, but are not currently relevant to the group.
IFRIC 12 Service concession arrangementsIFRIC 15 agreements for the construction of real estatesIFRIC 16 Hedges of a net investment in a foreign operationIFRIC 17 distribution of non-cash assets to ownersIFRIC 18 Transfers of assets from customersIFRIC 9 (amendment) Reassessment of embedded derivatives
and IaS 39 (amendment) Financial instruments: Rec-ognition and measurement
IFRS 2 (amendment) Group cash-settled share-based pay-ment transactions
IFRS 5 (amendment) non-current assets held for sale and discontintued operations
IFRS 8 (amendment) Operating segmentsIaS 1 (amendment) Presentation of financial statementsIaS 7 (amendment) Statements of cash flowsIaS 17 (amendment) LeasesIaS 18 (amendment) RevenueIaS 36 (amendment) Impairment of assetsIaS 38 (amendment) Intangible assetsIFRIC 9 (amendment) Reassessment of embedded derivatives IFRIC 16 (amendment) Hedges of a net investment in a foreign
operation
SubsidiariesThe consolidated financial statements comprise the par-ent company dna Ltd and all its subsidiaries. Subsidiaries are
notes to the consolidated financial statementsentities controlled by the Group. Control is obtained when the Group holds more than half of the voting rights or exer-cises other governing power. The existence of potential voting rights that are currently exercisable is considered when assess-ing the terms of control. Control refers to the right to govern the financial operating policies of a company for the purpose of gaining benefit from the company’s operations. Intra-group shareholdings are eliminated using the acquisition method.
The acquisition method of accounting is applied to business combinations. The consideration transferred for the acquisi-tion of a subsidiary is the fair values of the assets transferred, the liabilities incurred and the equity interests issued by the group. The consideration transferred includes the fair value of any asset or liability resulting from a contingent considera-tion arrangement. acquisition-related costs are expensed as incurred. Identifiable assets acquired and liabilities and contin-gent liabilities assumed in a business combination are meas-ured initially at their fair values at the acquisition date. On an acquisition-by-acquisition basis, the group recognizes any non-controlling interest in the acquiree either at fair value or at the non-controlling interest’s proportionate share of the acqui-rees’s net assets.
The excess of the consideration transferred, the amount of any non-controlling interest in the acquiree and the acqui-sition-date fair value of any previous equity interest in the acquiree over the fair value of the group’s share of the identifi-able net assets acquired is recorded as goodwill. Subsidiaries are consolidated from the date on which control is obtained by the Group and de-consolidated from the date on which control ceases.
all inter-company transactions, receivables, liabilities, unre-alised gains and internal profit distribution are eliminated in the consolidated financial statements. Unrealised losses are not eliminated if they result from impairment. distribution of profit between parent company shareholders and non-con-trolling shareholders as well as the distribution of comprehen-sive income is presented in the comprehensive statement of income, and non-controlling interest in equity is presented in the balance sheet as a separate component of shareholder’s equity.
associated companiesassociated companies are companies in which the Group exer-cises significant influence. Significant influence is realised if the Group holds more than 20 per cent of the voting rights or otherwise has significant influence without exercising full con-trol. associated companies are consolidated using the equity method. If the Group’s share of the associated companies’ losses exceeds the carrying amount of the investment, the investment is recognised in the balance sheet at zero value and the portion of the losses exceeding the carrying amount is not consolidated unless the Group has agreed to meet the associated companies’ obligations. Unrealised profits between the Group and its associated companies are eliminated to the extent of the Group’s share of ownership. The investment in each associated company includes goodwill arising from the acquisition. The Group’s share of the associated companies’
profit or loss for the financial year corresponding the Group’s share of ownership is recognised separately below the operat-ing profit line.
Segment reportingThe reporting on the operating segments is consistent with the internal reporting to the chief operating decision maker. The Board of directors, which is responsible for strategic deci-sions, has nominated the chief operating decision maker to make decisions about resources to be allocated to the seg-ments and to assess their performance.
Foreign currency translationThe consolidated financial statements are presented in euro, which is the functional and presentation currency of the Group parent company.
Foreign currency transactionsForeign currency transactions are translated into functional currency applying the exchange rates valid on the date of the transaction. Monetary items denominated in foreign currency are translated into functional currency applying the exchange rates quoted on the balance sheet date.
Gains and losses on foreign currency transactions and translation of monetary items are recognised in the income statement. Exchange gains and losses related to business operations are included in the corresponding items above the operating profit line.
Property, plant and equipment Items of property, plant and equipment are carried at their his-torical cost less accumulated depreciation and impairment.
If an item consists of several components with varying use-ful lives, each component is treated as a separate asset. In this case, the cost of replacement is capitalised. In other cases, subsequent costs are included in the carrying amount of the asset only when it is probable that the future economic ben-efits that are attributable to the asset will flow to the Group and the cost of the item can be measured reliably. Other repair and maintenance costs are recognised against profit or loss as they are incurred.
depreciation of assets is calculated using the straight-line method over the estimated useful lives. Land is not recognised as a depreciable asset. The depreciation periods are as follows:
Buildings 25 yearsConstructions 10–25 yearsMachinery and equipment 3–15 years
Residual values and depreciation periods are reviewed at each interim reporting and, if appropriate, adjusted to reflect any changes that may have occurred in the expectation of financial benefit. during 2010, the group decided to implement new net-work technology. accordingly, the depreciation period for the current network was adjusted in alignment with the timetable for the future change in technology.

Financial statements
52 53
dna annual Report 2010dna annual Report 2010
notes to the consolidated financial statements
depreciation of property, plant and equipment ceases when the asset is classified as held for sale according to IFRS 5 ”non-current assets Held for Sale and discontinued Operations”.
Capital gain or loss on the decommissioning and disposal of property, plant and equipment are included in other operating income or expenses.
Borrowing costsBorrowing costs are recognised as an expense in the period in which they are incurred.
Intangible assetsGoodwillGoodwill represents the excess of the acquisition cost over the Group’s interest in the net fair value of the identifiable assets, liabilities and contingent liabilities acquired and measured at the acquisition date. Goodwill arising from business com-binations is included in intangible assets. Goodwill is tested annually for impairment and carried at cost less accumulated impairment losses. Impairment losses on goodwill are not reversed. Gains and losses on the disposal of an entity include the carrying amount of goodwill relating to the entity sold. Goodwill is allocated to cash-generating units for the purpose of impairment testing. The allocation is made to those cash-generating units or groups of cash-generating units that are expected to benefit from the business combination in which the goodwill arose, identified according to operating segment.
Research and development expenditureResearch expenditure is recognised as an expense in the income statement. Expenditure for the development of new or improved products is capitalised as intangible assets in the balance sheet from the date on which the product is techni-cally feasible and commercially viable and is expected to bring future financial benefit. Capitalised development expenditure comprises material, work and testing expenses that are the direct result of the process of completing the product for its intended use. development costs previously recognised as an expense cannot be capitalised in a subsequent period. assets are depreciated from the time they are ready for use. assets not ready for use are tested annually for impairment. Subse-quent initial recognition, capitalised development expenditure is carried at cost less accumulated amortisation and impair-ment. The useful life of capitalised development expenditure is three years, over which period capitalised expenses are recog-nised as expenses on a straight-line basis.
Contractual customer relationshipsContractual customer relationships acquired in a business com-bination are recognised at fair value at the acquisition date. The contractual customer relations have a finite useful life and are carried at cost less accumulated amortization. amor-tization is calculated using the straight-line method over the expected life of the customer relationship.
Other intangible assetsIntangible assets are recorded at historical cost in the balance sheet when it is probable that the future economic benefits that are attributable to the asset will flow to the Group and the cost can be measured reliably. Intangible assets with finite useful life are recognised as an expense on a straight-line basis in the income statement over their known or foreseeable use-ful life.
The useful lives of other intangible assets are as follows:Customer contracts and the related customer relationships 1–20 yearsIT software 3–10 yearsBrand 30 yearsOther intangible assets 2–10 years
InventoriesInventories are recognised at the lower of cost or probable net realisable value. net realisable value is the estimated selling price in the ordinary course of business less estimated cost to sell. Inventories are stated at the weighted average price.
Lease agreementsGroup as a lesseeLeases on property, plant and equipment are classified as finance leases if the risks and rewards incidental to ownership are substantially transferred to the Group. assets acquired through finance lease agreements are recognised in the bal-ance sheet at the lower of the fair value of the leased asset or present value of minimum lease payments. assets based on finance leases are depreciated over their useful life or within the shorter lease term. Payable lease amounts are split between finance expenses and loan repayments over the lease term, based on a pattern reflecting a constant periodic inter-est rate for the remaining debt. Rental obligations are included in interest-bearing liabilities. The Group has used finance lease agreements mainly to lease telecommunication network and IT equipment.
Leases are classified as operating leases if the risks and rewards incidental to ownership are retained by the lessor. Lease amounts paid on the basis of operating leases are rec-ognised as an expense in the income statement over the lease term on a straight-line basis.
Group as a lessorIf the lease agreements on items held for lease by the Group transfer risks and rewards incidental to ownership substan-tially to the lessee, the leases are classified as finance lease agreements and recognised in the balance sheet as a receiv-able. Receivables are carried at present value. Finance income from the finance lease agreement is recognised over the lease term based on a pattern reflecting a constant periodic rate of return on the remaining net investment. The Group has leased out customer equipment based on finance lease agreements.
any equipment leased out on the basis of other than finance lease agreements are recognised in property, plant and equipment on the balance sheet. They are depreciated over their useful life, as are the corresponding property, plant and equipment in the Group’s own use. Lease income is recognised in the income statement over the lease term on a straight-line basis.
Impairment of property, plant and equipment and intangible assetsGoodwill and other intangible assets with indefinite useful life and intangible assets in progress are tested for impairment annually and whenever there is any indication of impairment of an asset. Intangible assets with finite useful lives and tangible assets are tested for impairment whenever events or changes in circumstances indicate that the non-trading position of the asset does not correspond to the recoverable amount.
The need for impairment is reviewed at the level of cash generating units (CGUs), i.e. the lowest unit level that is mostly independent of other units and whose cash flows can be iden-tified separately from other cash flows. Recoverable amount is the higher of the asset’s fair value less costs to sell, or the value in use. Value in use refers to the estimated future net cash flows obtainable from the asset or a CGU, which are dis-counted to their present value.
discount rate is the pre-tax rate that reflects current mar-ket assessments of the time value of money and the risks spe-cific to the asset.
Impairment loss is recognised when the carrying amount of an asset exceeds its recoverable amount. an impairment loss is immediately recognised in the income statement. If an impair-ment loss is recognised for CGU, the loss is first allocated to reduce goodwill on the CGU and then to reduce other assets of the unit on a pro-rata basis. When an impairment loss is recognised, the useful life of the amortised asset is reassessed. In respect of assets other than goodwill, an impairment loss is reversed if there is a change in the estimates used to deter-mine the recoverable amount for the asset. However, the reversal will not exceed the carrying amount that the asset would have had if an impairment loss had not been recognised. an impairment loss for goodwill cannot be reversed.
Employee benefitsRetirement benefit obligationsThe Group’s employee pension plans are managed by external insurance companies. The TyEL pension insurances are man-aged as defined contribution plans by the pension insurance companies.
Contributions to the defined contribution plans are charged to the income statement in the period to which they relate. defined benefit plans are other than contribution-based plans, where the employer’s pension liability is based on the present value of the obligation arising from the arrangement and on the fair value of the assets included in the arrangement, which are calculated sufficiently regularly using actuarial calculations determined in IaS 19. The Group’s obligations with regard to
defined benefit plans are calculated using the projected unit credit method. Pension costs are recognised as expenses over the service lives of employees on the basis of calculations made by authorised actuaries. The present value of pension liabilities is determined by using the market yields of high-qual-ity bonds issued by companies or the interest rate of treasury bills as the discount rate. The maturity of bonds and treasury bills correspond in all essential aspects to the maturity of the pension obligation being considered.
actuarial gains and losses will be recognised against profit and loss over the average remaining service lives of employees, to the extent that they exceed the higher of the following: 10 per cent of pension obligations or 10 per cent of the fair value of assets.
The past service cost is recognised as an expense in the income statement on a straight-line basis over the period until the benefits are vested. If the benefits are vested immediately, they are recognised immediately in the income statement.
Share-based paymentsThe group operates equity-settled, share-based compensation plans, under which the entity receives services from employees as consideration for equity instruments (options) of the group. Key employees have been given the opportunity to subscribe to the company shares. The fair value of service given in return for options is recognised as an expense. The total amount of expenses is based on the fair value of the granted options. The amount recognised as an expense is accrued over the period of time during which all vesting conditions are to be met. any effect of the adjustments made to the original estimates is recognised in the income statement and correspondingly in shareholders’ equity. any payments received for exercising the subscription right less the related direct transaction costs are recognised in the unrestricted equity reserve.
Provisions and contingent liabilitiesProvisions are recognised when the Group has a legal or con-structive obligation as a result of past events, payment is probable and a reliable estimate can be made on the amount of the obligation. Provisions are measured at present value of the expenditure required to settle the obligation. The discount rate used to determine present value reflects current mar-ket assessments of the time value of money at the time of review and the risks involved in the obligation. Where the Group expects some of the obligation to be reimbursed by a third party, the reimbursement is recognised as a separate asset but only when it is virtually certain.
a restructuring provision is recognised if the Group has pre-pared a detailed restructuring plan and initiated its implemen-tation or notified thereof.
no provision is recognised for the expenses incurred from the continuing operations of the Group.
The Group recognises a provision for onerous contracts when the expected benefits to be derived from a contract are less than the unavoidable costs of meeting the obligations under the contract.
Financial statements
54 55
dna annual Report 2010dna annual Report 2010
notes to the consolidated financial statements
a provision for decommissioning is recognised when the Group is under contractual obligation regarding decommission-ing of leased equipment and aerial sites, and telephone poles and masts.
Income taxesThe tax expense in the income statement comprises tax based on taxable income for the financial period and deferred tax. With regard to items recognised directly in shareholders’ equity, or comprehensive income, the corresponding tax effect is also recognised as part of shareholders’ equity or comprehen-sive income. Tax based on taxable profit for the financial period is calculated using taxable income and applying the effective tax rate, adjusted by any taxes from previous periods.
deferred tax is calculated on temporary differences between the carrying amount and tax base of assets. However, deferred tax liabilities are not recognised when arising from initially recog-nised assets or liabilities other than in a business combination, which do not affect either the accounting or the taxable profit at the time of the transaction.
The most significant temporary differences arise from the depreciation of property, plant and equipment and fair value measurement on business combinations.
deferred tax is computed using tax rates enacted by the financial statement closing date.
deferred tax assets are recognised to the extent that it is probable that future taxable profit will be available against which the temporary difference can be utilised.
Revenue recognitionThe Group’s net sales mainly comprise revenue from the sale of voice, data, TV and operator services; periodical, activation and maintenance charges; and revenue from the sale of equipment. Sales are recognised at fair value, which largely corresponds to the sale value less discounts and sales taxes.
Revenue is recognised in the period in which the service has been performed, either based on the actual traffic volume or over the contract term. Revenue from rendering of services is recognised when it is probable that the economic benefit will flow to the Group, and the revenue and expenses related to the transaction can be reliably measured. Revenue from voice and data services is recognised in accordance with the actual use of the service. Termination revenue from voice and data traffic from other operators is recognised at the time of tran-sit across dna’s network. When end customers are charged for services provided by external content providers, amounts col-lected on behalf of the service provider are not recognised as revenue.
Subscription fees are recognised as revenue over the sub-scription period. The sales of pre-paid phone cards, mainly for mobile phones, is deferred and recognised as income based on the actual usage of the cards. activation and connection fees are recognised at the time of activation. Equipment sales are recognised as income when the delivery has occurred and the risks and rewards incidental to ownership have been transferred to the customer, normally on delivery and following the cus-tomer’s acceptance.
dna can bundle services and products to create a single offering. Offerings may include the delivery or execution of a product, service or user right (tie-in deals) and the payment can be issued either as a separate payment or a combination of a separate payment and a continuous payment flow. Equip-ment is recognised separately from the service, if both items are also sold separately and the ownership of the equipment is transferred to the end user. In the IFRS financial statements, equipment and service revenue is recognised in proportion to the fair value of the individual items. If fair value cannot be reliably measured for the delivered items but it can be meas-ured for the undelivered items, a residual method is used. Under the residual method, the value allocated to the deliv-ered items equals the total arrangement value less the aggre-gate fair value of the undelivered items. In the IFRS financial statements, dna has recognised tie-in deals using the residual method. Income from tie-in deals is discounted to present value while a part of the received payments from customers is recognised in financial income.
Customers are entitled to certain discounts from services and products provided by dna under the customer loyalty pro-gramme. The benefit granted to the customer on the basis of the sales transaction is measured at fair value and the sales corresponding to the fair value are recognised as income when the campaign obligation has been met.
dna provides corporate customers with comprehensive functionality service agreements in telecommunications, which may include switchboard services, fixed-line network telephony, mobile telephony, data communication and other customised services. Revenue from functionality services is recognised as income over the contract period.
Revenue and expense from construction contracts is recog-nised using the percentage of completion method. The stage of completion is determined for each project by reference to the relationship between the costs incurred for work performed to the date of review and the estimated total cost of the project. When it is probable that the total cost of the project will exceed total project revenue, the expected loss is recog-nised immediately as an expense.
Interest and dividendInterest income is recognised using the effective interest method, and dividend income is recognised when the right to receive dividend is established.
Non-current assets held for sale and discontinued operationsnon-current assets (or the disposal group) and the assets and liabilities included in the discontinued operations are classified as held-for-sale, if their carrying amount is recovered principally through the disposal of the assets rather than through contin-uing use. For this to be the case, the sale must be highly prob-able, the asset (or the disposal group) must be available for immediate sale in its present condition subject to terms that are usual and customary, the management must be commit-ted to selling, and the sale is expected to be completed within one year from the date of classification.
Immediately prior to the classification, the non-current assets held for sale or the assets and liabilities of the disposed items are measured in accordance with the applicable IFRS standards. From the time of classification, the assets held for sale (or the disposal group) are measured at the lower of carry-ing amount or fair value less estimated cost to sell. From the time of classification, the assets are not depreciated.
The disposal group includes assets, which do not fall within the scope of IFRS 5, while liabilities are measured in accordance with the applicable IFRS standards also after the classification.
a discontinued operation is a component of the Group that either has been disposed of or is classified as held for sale and meets the following conditions:
1. It represents a separate major line of business or geographi-cal area of operations
2. It is part of a single coordinated plan to dispose of a sepa-rate major line of business or geographical area of opera-tions; or
3. It is a subsidiary acquired exclusively with a view to resale.
Revenue from discontinued operations is presented as a sepa-rate item in the Group’s income statement. assets held for sale, disposal groups, items related to the assets held for sale and recognised directly in shareholders’ equity, and liabilities related to the disposal group are presented separately from other assets in the balance sheet.
Financial assets and liabilitiesFinancial assetsThe Group’s financial assets are classified as follows: financial assets at fair value recognised against profit or loss, loans and other receivables, and financial assets available-for-sale. The classification depends on the purpose for which the financial assets were acquired and are classified at initial recognition. Financial assets are initially recognised at fair value plus trans-action costs for all financial assets not carried at fair value through profit or loss. Financial assets are derecognised when the right to receive cash flows has expired or has been trans-ferred to another party meeting the derecognition conditions under IaS 39.
Financial assets recognised at fair value against profit or loss represent financial assets that have been acquired to be held for trading or that are designated to this group when initially recognised. Financial assets recognised at fair value through profit or loss are measured at fair value against profit or loss. Changes in fair value are recognised as finance income or finance expense.
Loans and other receivables are non-derivative financial assets with fixed or determinable payments that are not quoted in an active market. They are included in current receiv-ables in the balance sheet if they expire within twelve months. The assets in this group are carried at amortised cost using the effective interest method.
Financial assets held for sale are non-derivative assets, which have been designated specifically to this group or not designated to any other group. Held for sale financial assets
are valued at fair value. They are included in non-current assets, unless they are intended to be held for less than twelve months from the closing date of the financial statement, in which case they are included in current assets. The Group’s investments in shares belong to this group. The investments have been designated to this group as they are not held for active trading and they are non-current. The fair values of finan-cial assets held for sale are quoted prices in an active market for quoted shares, recognised at the purchase rate at the clos-ing date of the financial statement. Changes in fair value are recognised in the statement of comprehensive income and pre-sented in the fair value reserve in equity. Changes in fair value are transferred from shareholders’ equity to the income state-ment when the investment is sold or its value has fallen so that an impairment loss has to be recognised for the invest-ment. Unquoted shares are recognised at cost as their fair value cannot be reliably measured due to inactive market.
Liquid assets comprise cash in hand, bank deposits held at call and other highly liquid short-term investments. Items clas-sified as liquid assets mature within three months or less from the date of acquisition. Credit accounts connected to the Group accounts are included in the short-term interest-bearing liabilities.
The Group reviews at each closing date whether there is any indication of an impaired liquid asset or asset group. If there is objective evidence that the value of an item is impaired, the impairment loss is recognised against profit or loss. If the amount of impairment loss subsequently reduces, the impairment loss recorded for an interest-bearing instru-ment will be reversed against profit or loss. However, impair-ment loss on a share investment cannot be reversed against profit or loss.
Impairment loss is recognised for accounts receivable when there is objective evidence that the outstanding amounts can-not be collected in full. among others, a payment delayed for more than 180 days is considered as such objective evidence. The impairment is determined by the difference between the receivable’s carrying amount and the present value of estimated future cash flows. The carrying value of accounts receivable is decreased by using a separate reduction account and the loss is reported in other operating expenses in the income statement. When the impairment loss is ascertained it is removed from the balance sheet through the reduction account. If, in a subsequent period, the amount of the impair-ment loss decreases, the reversal of the previously recognised impairment loss is recognised by reducing other operating expenses.
Financial statements
56 57
dna annual Report 2010dna annual Report 2010
notes to the consolidated financial statements
BorrowingsFinancial liabilities are initially measured at fair value of consid-eration received. Transaction costs are included in the original carrying amount of financial liabilities. Subsequently all finan-cial liabilities are carried at amortised cost using the effective interest method. Financial liabilities may include both current and non-current liabilities. Fees paid on the establishment of loan facilities are recognised as transaction costs of the loan to the extent that it is probable that some or all of the facil-ity will be drawn down. In this case, the fee is deferred until the draw-down occurs. To the extent there is no evidence that it is probable that some or all of the facility will be drawn down, the fee is capitalised as a pre-payment for liquidity services and amortised over the period of the facility to which it relates.
Derivative instruments and hedge accountingderivatives are initially recognised at cost on the date the derivative contract is entered into and are subsequently re-measured at their fair values. The method of recognising the resulting gain or loss depends on whether the derivative is des-ignated as a hedging instrument, and if so, the nature of the item being hedged. The Group’s derivatives are either cash flow hedges or derivatives not fulfilling the hedge accounting crite-ria. Embedded derivatives are bifurcated from the host con-tract and valued at fair value through profit and loss.
during the financial period the Group has been using inter-est rate swaps to hedge against loan interest rate risk transferring variable rate loans into fixed-rate loans. Hedge accounting under IaS 39 is applied to the interest rate swaps, and at the closing date they met the criteria for being effec-tive. Changes in fair value of effective derivatives qualifying as cash flow hedges are recognised in the statement of com-prehensive income and presented in the hedge fund of share-holders’ equity. accumulated profit or loss from derivatives recognised in shareholders’ equity is carried in the income statement as income or expense in the period in which the hedged item is recognised in the income statement. When a cash flow hedge instrument expires, is sold or fails to qualify for hedge accounting, any profit or loss accumulated from the hedge instrument remains in shareholders’ equity until the forecast cash flow from the transaction occurs. However, if the forecast transaction is not expected to continue, any profit or loss accumulated in shareholders’ equity is immediately rec-ognised in the financial items in the income statement. any possible non-effective share of the hedge relationship is imme-diately recognised in the financial items of the income state-ment. Fair values of interest rate swaps are determined using the discounted cash-flow method.
The Group also has derivatives that fulfil the criteria for hedge instruments set by the Group risk management, but that do not fulfil the criteria for hedge accounting according to IaS 39. These derivatives are classified as assets or liabilities held for trade and presented in non-current assets or liabilities except when maturity is less than 12 months from the balance sheet date. Their realised and non-realised changes in fair value are recognised as finance income or expense in the income statement.
Share capitalOutstanding ordinary shares are presented in share capital.
Operating result (EBIT)IaS Standard 1 ”Presentation of Financial Statements” does not define operating result. The Group has defined the concept as follows: operating result is the net total which is formed when other operating income is added to net sales and the fol-lowing items are detracted: the cost of purchase adjusted by change in the inventory of finished goods and work in progress, the cost of manufacture for own use, the cost of employee benefits, depreciation, impairment loss and other operating expenses. all other items of the income statement are pre-sented below the operating result line. Exchange differences are included in operating result, if they arise from business-related items; otherwise they are recognised in financial items.
EBITDAIaS Standard 1 ”Presentation of Financial Statements” does not define EBITda. The Group has defined the concept as fol-lows: EBITda is the net total which is formed when other oper-ating income is added to net sales and the following items are detracted: the cost of purchase adjusted by change in the inventory of finished goods and work in progress, the cost of manufacture for own use, the cost of employee benefits, and other operating expenses. all other items of the income state-ment are presented below the EBITda line.
Accounting principles requiring management judgement and uncertainty factors related to estimatesThe estimates made during the preparation of the financial statements are based on management’s best judgement at the closing date of the financial statements. Management estimates are based on historical experience and assumptions on future developments, which were considered well-founded at the closing date, including assumptions on expected develop-ment of the Group’s economic environment in terms of sales and cost levels. The Group monitors the realisation of these estimates and assumptions on a regular basis together with the business units and with the help of internal and exter-nal information sources. any changes to the estimates and assumptions are recognised during the period in which the change occurs and in all subsequent periods.
Measuring fair value of assets in business combinationsIn major business combinations, the Group has employed the services of an outside advisor in assessing the fair value of tangible and intangible assets. The value of tangible assets has been compared to the market price of similar assets, and impairment caused by age, wear and other similar factors has been estimated. Measuring the fair value of intangible assets is based on the related estimated cash flows. Management con-siders the assumptions and estimates to be sufficiently accu-rate to provide a basis for estimating fair value. The Group also reviews any indication of impairment loss of tangible and intan-gible assets at each closing day. For further information about measuring the value of intangible assets in business combina-tions, see note 5.
Impairment testingThe Group tests goodwill and intangible assets in progress annually for impairment. any indication of impairment is also reviewed in accordance with the basis of preparation described above. Recoverable amounts of cash-generating units are rec-ognised with the help of calculations based on value in use. Preparing such calculations requires the use of estimates, see note 17 for more information.
ProvisionsRecognizing provisions requires management’s judgment, as the precise euro amount of obligations related to provisions is not known when preparing the financial statements. See note 27 for more information.
Adoption of new and amended IFRS standards and IFRIC interpretationsIaSB has issued the following standards and amendments, which will become effective in 2010 or later. The Group has decided not to adopt them early. Management is currently evaluating the effect of the new standards and amendments on future financial statements.
Revised IaS 24 “Related party disclosures” issued in novem-ber 2009. It supersedes IaS 24, “Related party disclosures” issued in 2003. IaS 24 (revised) is mandatory for periods begin-ning on or after 1 January 2011. The revised standard clarifies and simplifies the definition of a related party and removes the requirement for government-related entities to disclose details of all transactions with the government and other govern-ment-related entities. The group will apply the revised stand-ard from 1 January 2011.
IFRIC 19 “Extinguishing financial liabilities with equity instru-ments” effective 1 July 2010. The interpretation clarifies the accounting by an entity when the terms of a financial liability are renegotiated and result in the entity issuing equity instru-ments to a creditor of the entity to extinguish all or part of the financial liability (debt for equity swap). It requires a gain or loss to be recognized in profit or loss, which is measured as the difference between the carrying amount of the financial liability and the fair value of the equity instruments issued. If the fair value of the equity instruments issued cannot be reli-ably measured, the equity instruments should be measured to reflect the fair value of the financial liability extinguished. The group will apply the interpretation from 1 January 2011. It is not expected to have any impact on the group or the parent entity’s financial statements.
Revised IFRS 7 “Financial instruments: disclosures” requires additional disclosures about fair value measurements of finan-cial instruments and liquidity risk. The standard requires more qualitative disclosures about risks in connection with financial instruments. The amendment may require additionnal disclo-sures in future financial statements. The amendment is effec-tive on or after 1 July 2011. The amendment has not yet been approved by the EU.
IFRS 9 “Financial instruments: Classification and meas-urement” published October 2010. This standard is the first phase to replace IaS 39 ”Financial Instruments: Recognition and Measurement”. according to the new standard, the clas-sification and measurement of financial liabilities is unchanged except for financial liabilities valued at fair value. The standard is not anticipated to affect the group’s accounting treatment of financial liabilities. The standard is effective on or after 1 January 2013, but earlier adoption is permitted but only if the IFRS 9 requirements on accounting for financial assets also are applied. The standard has not yet been approved by the EU.
The Group estimates that the adoption of the following standards and interpretations effective 2011 the earliest, will have no effect on the group’s financial statements:
– IaS 32 (amendment) Classification of rights issues– IFRIC 14 (amendment) Prepayments of a minimum funding
requirement
The following amendments have been published by the IaSB in July 2010, as part of the yearly improvements. These improve-ments have not yet been approved for application within the EU. The group will apply the amendments as soon as they are approved by the EU. Management is currently evaluat-ing the effect the amendments will have on the consolidated financial statements. The amendments concern the following standards:
IFRS 3 (amendment) Transition requirements for contingent consideration, measurement of non-controlling inter-ests, and share based payments.
IFRS 7 (amendment) Financial instrumentsIaS 1 (amendment) Presentation of financial statements –
statement of changes in equityIaS 27 (amendment) Consolidated and separate financial
statementsIaS 34 (amendment) Interim financial reportingIFRIC 13 (amendment) Customer loyalty programmes
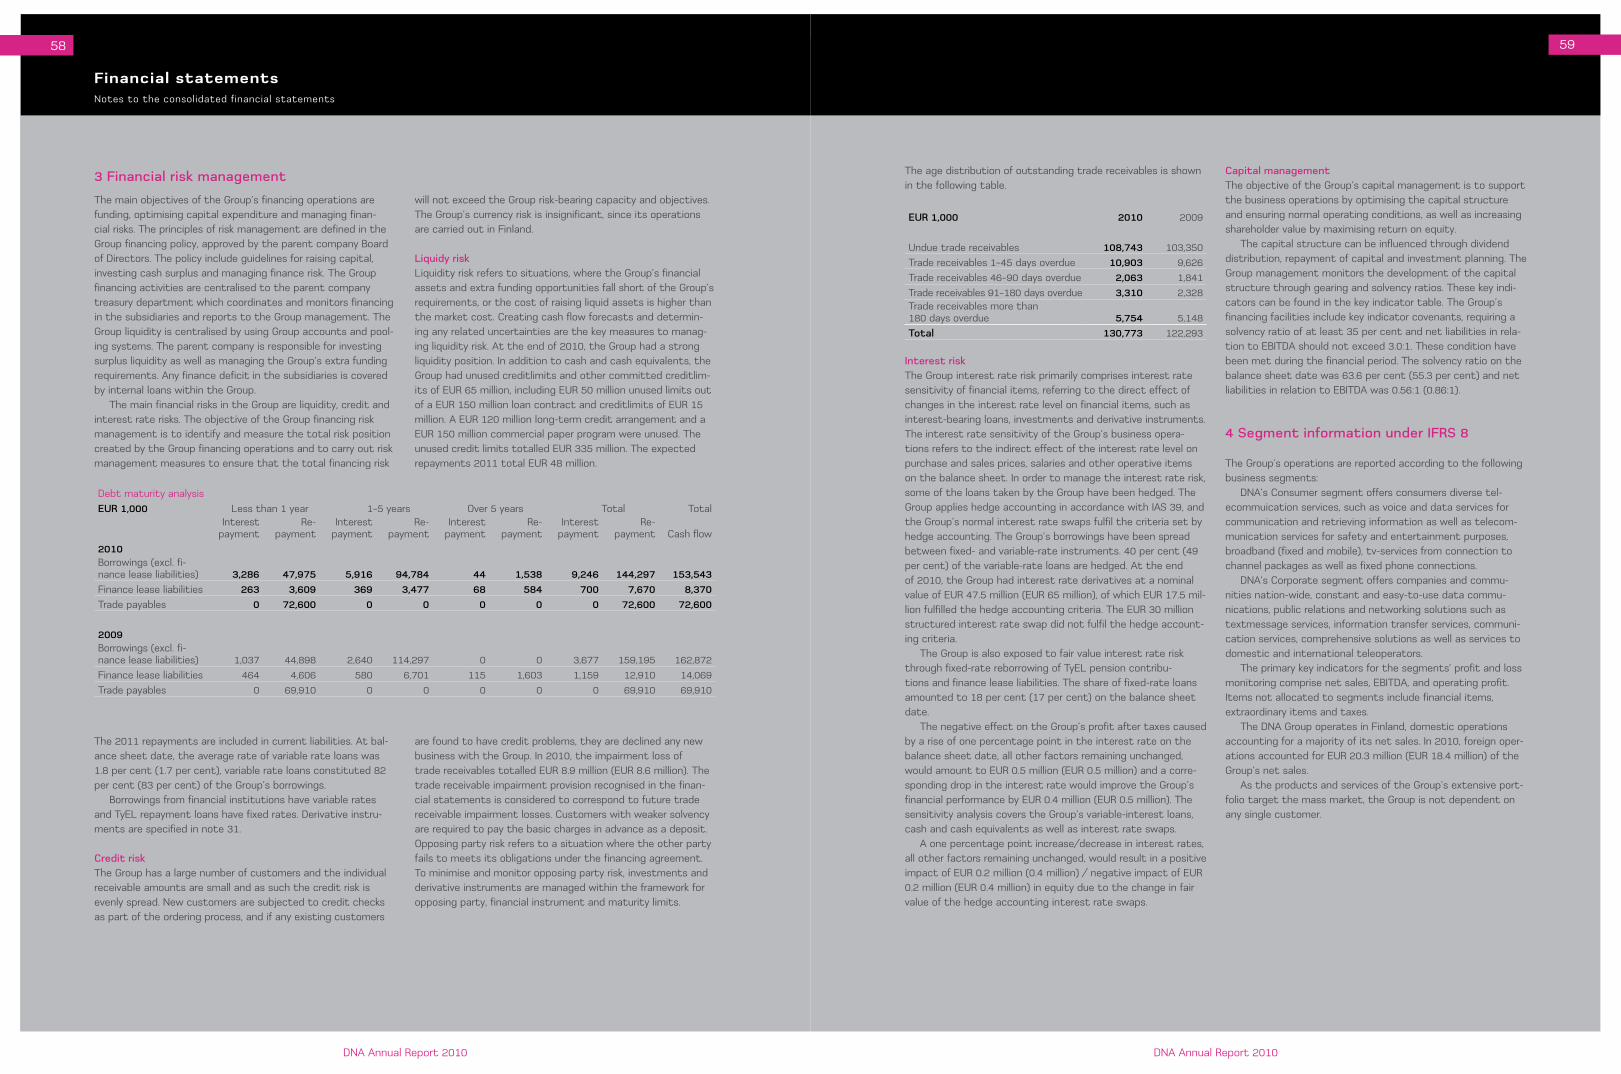
Financial statements
58 59
dna annual Report 2010dna annual Report 2010
notes to the consolidated financial statements
The main objectives of the Group’s financing operations are funding, optimising capital expenditure and managing finan-cial risks. The principles of risk management are defined in the Group financing policy, approved by the parent company Board of directors. The policy include guidelines for raising capital, investing cash surplus and managing finance risk. The Group financing activities are centralised to the parent company treasury department which coordinates and monitors financing in the subsidiaries and reports to the Group management. The Group liquidity is centralised by using Group accounts and pool-ing systems. The parent company is responsible for investing surplus liquidity as well as managing the Group’s extra funding requirements. any finance deficit in the subsidiaries is covered by internal loans within the Group.
The main financial risks in the Group are liquidity, credit and interest rate risks. The objective of the Group financing risk management is to identify and measure the total risk position created by the Group financing operations and to carry out risk management measures to ensure that the total financing risk
will not exceed the Group risk-bearing capacity and objectives. The Group’s currency risk is insignificant, since its operations are carried out in Finland.
Liquidy riskLiquidity risk refers to situations, where the Group’s financial assets and extra funding opportunities fall short of the Group’s requirements, or the cost of raising liquid assets is higher than the market cost. Creating cash flow forecasts and determin-ing any related uncertainties are the key measures to manag-ing liquidity risk. at the end of 2010, the Group had a strong liquidity position. In addition to cash and cash equivalents, the Group had unused creditlimits and other committed creditlim-its of EUR 65 million, including EUR 50 million unused limits out of a EUR 150 million loan contract and creditlimits of EUR 15 million. a EUR 120 million long-term credit arrangement and a EUR 150 million commercial paper program were unused. The unused credit limits totalled EUR 335 million. The expected repayments 2011 total EUR 48 million.
3 Financial risk management
debt maturity analysis
EUR 1,000 Less than 1 year 1–5 years Over 5 years Total TotalInterest
paymentRe-
paymentInterest
paymentRe-
paymentInterest
paymentRe-
paymentInterest
paymentRe-
payment Cash flow
2010Borrowings (excl. fi-nance lease liabilities) 3,286 47,975 5,916 94,784 44 1,538 9,246 144,297 153,543Finance lease liabilities 263 3,609 369 3,477 68 584 700 7,670 8,370Trade payables 0 72,600 0 0 0 0 0 72,600 72,600
2009Borrowings (excl. fi-nance lease liabilities) 1,037 44,898 2,640 114,297 0 0 3,677 159,195 162,872
Finance lease liabilities 464 4,606 580 6,701 115 1,603 1,159 12,910 14,069
Trade payables 0 69,910 0 0 0 0 0 69,910 69,910
The 2011 repayments are included in current liabilities. at bal-ance sheet date, the average rate of variable rate loans was 1.8 per cent (1.7 per cent), variable rate loans constituted 82 per cent (83 per cent) of the Group’s borrowings.
Borrowings from financial institutions have variable rates and TyEL repayment loans have fixed rates. derivative instru-ments are specified in note 31.
Credit riskThe Group has a large number of customers and the individual receivable amounts are small and as such the credit risk is evenly spread. new customers are subjected to credit checks as part of the ordering process, and if any existing customers
are found to have credit problems, they are declined any new business with the Group. In 2010, the impairment loss of trade receivables totalled EUR 8.9 million (EUR 8.6 million). The trade receivable impairment provision recognised in the finan-cial statements is considered to correspond to future trade receivable impairment losses. Customers with weaker solvency are required to pay the basic charges in advance as a deposit. Opposing party risk refers to a situation where the other party fails to meets its obligations under the financing agreement. To minimise and monitor opposing party risk, investments and derivative instruments are managed within the framework for opposing party, financial instrument and maturity limits.
The age distribution of outstanding trade receivables is shown in the following table.
EUR 1,000 2010 2009
Undue trade receivables 108,743 103,350
Trade receivables 1–45 days overdue 10,903 9,626
Trade receivables 46–90 days overdue 2,063 1,841
Trade receivables 91–180 days overdue 3,310 2,328Trade receivables more than 180 days overdue 5,754 5,148
Total 130,773 122,293
Interest riskThe Group interest rate risk primarily comprises interest rate sensitivity of financial items, referring to the direct effect of changes in the interest rate level on financial items, such as interest-bearing loans, investments and derivative instruments. The interest rate sensitivity of the Group’s business opera-tions refers to the indirect effect of the interest rate level on purchase and sales prices, salaries and other operative items on the balance sheet. In order to manage the interest rate risk, some of the loans taken by the Group have been hedged. The Group applies hedge accounting in accordance with IaS 39, and the Group’s normal interest rate swaps fulfil the criteria set by hedge accounting. The Group’s borrowings have been spread between fixed- and variable-rate instruments. 40 per cent (49 per cent) of the variable-rate loans are hedged. at the end of 2010, the Group had interest rate derivatives at a nominal value of EUR 47.5 million (EUR 65 million), of which EUR 17.5 mil-lion fulfilled the hedge accounting criteria. The EUR 30 million structured interest rate swap did not fulfil the hedge account-ing criteria.
The Group is also exposed to fair value interest rate risk through fixed-rate reborrowing of TyEL pension contribu-tions and finance lease liabilities. The share of fixed-rate loans amounted to 18 per cent (17 per cent) on the balance sheet date.
The negative effect on the Group’s profit after taxes caused by a rise of one percentage point in the interest rate on the balance sheet date, all other factors remaining unchanged, would amount to EUR 0.5 million (EUR 0.5 million) and a corre-sponding drop in the interest rate would improve the Group’s financial performance by EUR 0.4 million (EUR 0.5 million). The sensitivity analysis covers the Group’s variable-interest loans, cash and cash equivalents as well as interest rate swaps.
a one percentage point increase/decrease in interest rates, all other factors remaining unchanged, would result in a positive impact of EUR 0.2 million (0.4 million) / negative impact of EUR 0.2 million (EUR 0.4 million) in equity due to the change in fair value of the hedge accounting interest rate swaps.
Capital managementThe objective of the Group’s capital management is to support the business operations by optimising the capital structure and ensuring normal operating conditions, as well as increasing shareholder value by maximising return on equity.
The capital structure can be influenced through dividend distribution, repayment of capital and investment planning. The Group management monitors the development of the capital structure through gearing and solvency ratios. These key indi-cators can be found in the key indicator table. The Group’s financing facilities include key indicator covenants, requiring a solvency ratio of at least 35 per cent and net liabilities in rela-tion to EBITda should not exceed 3.0:1. These condition have been met during the financial period. The solvency ratio on the balance sheet date was 63.6 per cent (55.3 per cent) and net liabilities in relation to EBITda was 0.56:1 (0.86:1).
4 Segment information under IFRS 8
The Group’s operations are reported according to the following business segments:
dna’s Consumer segment offers consumers diverse tel-ecommuication services, such as voice and data services for communication and retrieving information as well as telecom-munication services for safety and entertainment purposes, broadband (fixed and mobile), tv-services from connection to channel packages as well as fixed phone connections.
dna’s Corporate segment offers companies and commu-nities nation-wide, constant and easy-to-use data commu-nications, public relations and networking solutions such as textmessage services, information transfer services, communi-cation services, comprehensive solutions as well as services to domestic and international teleoperators.
The primary key indicators for the segments’ profit and loss monitoring comprise net sales, EBITda, and operating profit. Items not allocated to segments include financial items, extraordinary items and taxes.
The dna Group operates in Finland, domestic operations accounting for a majority of its net sales. In 2010, foreign oper-ations accounted for EUR 20.3 million (EUR 18.4 million) of the Group’s net sales.
as the products and services of the Group’s extensive port-folio target the mass market, the Group is not dependent on any single customer.

Financial statements
60 61
dna annual Report 2010dna annual Report 2010
notes to the consolidated financial statements
Business segments
EUR 1,000Consumer Segment
Corporate Segment Unallocated Group total
1 Jan–31 Dec 2010Net sales 513,440 177,053 690,492EBITDA 125,721 56,333 182,054depreciation 73,063 43,765 116,828Operating result (EBIT) 52,658 12,568 65,225net financial items –4,670Profit/loss before tax 60,555Profit/loss for the period 46,032
31 Dec 2010assets 682,149 247,857 84,418 1,014 424Total assets 682,149 247,857 84,418 1,014 424
Liabilities 85,484 29,478 261,780 376,743Shareholders' equity 637,682 637,682Total equity and liabilities 85,484 29,478 899,462 1,014 424
Investments 60,610 22,764 83,373Personnel at end of year 697 306 1,003
1 Jan–31 Dec 2009Net sales 471,022 181,052 88 652,162
EBITDA 112,992 54,435 –271 167,155
depreciation 91,924 119,048 –21 210,951
Operating result (EBIT) 21,068 –64,614 –250 –43,796
net financial items 1,024
Profit/loss before tax –42,772
Profit/loss for the period –56,550
31 Dec 2009assets 425,783 284,601 61,259 771,643
Total assets 425,783 284,601 61,259 771,643
Liabilities 73,196 28,186 245,644 347,026
Shareholders' equity 424,617 424,617
Total equity and liabilities 73,196 28,186 670,261 771,643
Investments 59,945 27,788 143 87,876
Personnel at end of year 511 307 818
5 Business combinations
Welho acquisition
dna Ltd completed the acquisition of the Welho business from
Sanoma Corporation through a directed share issue on 30 June
2010. dna Ltd issued in total 2,027,167 new shares to Sanoma
Corporation representing 21 per cent of the company’s shares.
according to the acquisition agreement, the shares were
determined to have a value of EUR 200 million in total (EUR
98.66/share).
The assets and liabilities were recorded on 30 June 2010
at their carrying amount and have now been adjusted to their
fair value. The goodwill is mainly based on synergy benefits
expected, the knowledge of the personnel transferred in the
business combination as well as future benefits expected from
new customers acquired through the Welho brand and the
Welho products.
direct costs of EUR 0.5 million relating to the acquisition
were expensed.
The acquired business’s net sales for the period 1 January
2010–31 december 2010 amounted to EUR 69 million. If the
acquisition had occurred on 1 January 2010, the group net
sales would have been EUR 725 million.
net sales for the period 1 July–31 december 2010
amounted to EUR 34 million.
EUR 1,000
Carrying amount at acquisition
Fair value
Intangible assets 1,074 68,956
Property, plant and equipment 36,209 54,814
deferred tax assets 52 258
Inventories 904 818
Trade and other receivables 5,879 5,879
Cash and cash equivalents 8 8
Total assets 44,127 130,733
Provisions 200 904
deferred tax liabilities 2,050 24,533
Trade and other liabilities 18,363 18,363
Total liabilities 20,613 43,800
Net assets 23,514 86,933
Acquisition cost (shares) 200,000
Goodwill 113,067
6 Net sales
EUR 1,000 2010 2009
Sale of goods 20,103 19,412
Revenue from services 669,919 632,204
Revenue from construction contracts 471 546
Total 690,492 652,162
at the end of the period, the aggregate costs incurred and recognised profits from construction contracts (less recog-nised losses) totalled EUR 0.5 million (EUR 0.5 million). Pro-gressed billings in relation to construction contracts were EUR 0.2 million (EUR 0 million).
7 Other operating income
EUR 1,000 2010 2009
Gains on sale of property, plant and equipment 113 77Gains on sale of available-for-sale investments (share investments) 0 2,152
Rental income 1,276 1,066
Other income
other income 2,330 1,630
supplier refunds 0 38
Total 3,719 4,963
8 Other operating expenses
EUR 1,000 2010 2009
Maintenance expenses 26,309 12,452
Rental expenses 31,778 47,357
External services 3,656 2,553
Other expenses 36,492 40,017
Total 98,235 102,379
Auditor fees and servicesPricewaterhouseCoopers Oy
audit fees 243 237
Tax services 38 29
Other services 103 88
Total 384 354

Financial statements
62 63
dna annual Report 2010dna annual Report 2010
notes to the consolidated financial statements
9 Depreciation, amortization and impairments
EUR 1,000 2010 2009
Depreciation and amortisation expenses consist of the following:Intangible assetsCustomer base 5,750 3,711
Brand 474 0
Other intangible assets 21,901 20,018
Total 28,125 23,729
Property, plant and equipmentBuildings and constructions 1,935 2,173
Machinery and equipment 86,768 90,149
Total 88,703 92,322
ImpairmentsGoodwill impairment 0 94,900
Total 0 94,900
10 Employee benefits and number of personnel
EUR 1,000 2010 2009
Wages and salaries 49,792 50,227Pension expenses - defined contribution plan 9,966 8,389Pension expenses - defined benefit plan 26 99
Other personnel expenses 3,352 4,767
Total 63,136 63,482
13 Financial expense
EUR 1,000 2010 2009
derivative fair value change, outside hedge accounting 196 0
Interest expense on financial liabilities 5,909 5,270
Total 6,105 5,270
Other comprehensive incomeFinancial instrument items reported through other comprehensive income as well as amendments relating to the change in classifica-tion is presented below:
2010 2009Transferred
to profit or loss
before taxChange in fair value Tax effect
Other com-prehensive
income, net of tax
Transferred to profit
or loss before tax
Change in fair value Tax effect
Other com-prehensive
income, net of tax
Cash flow hedges 1,118 –288 –216 614 610 –975 95 –270available-for-sale financial assets –65 1 17 –47
Total 1,118 –288 –216 614 545 –974 112 –317
EUR 1,000 2010 2009
Personnel, averageConsumer business 626 569
Corporate business 308 349
Total 934 918
Management employee benefits and loans are presented in the
note 34 Related party transactions.
11 Research and development
EUR 1,000 2010 2009
Research and development costs recognised as expense 541 1,700
Capitalised development costs 743 829
Total 1,284 2,529
12 Financial income
EUR 1,000 2010 2009
Interest income from loans and other receivables 1,422 1,476dividend income on available-for-sale investments 2 574Changes in fair values of financial assets/liabilities through profit and loss 0 1,772
Total 1,424 3,822
14 Income tax
EUR 1,000 2010 2009
Income tax, current year –18,870 –18,089
Income tax, previous years –234 –620
Change in deferred tax 4,582 4,931
Total –14,523 –13,778
Reconciliation of the income statement tax expense and the Group’s taxes calculated at the domestic tax rate of 26 per cent:
EUR 1,000 2010 2009
Profit/loss before tax 60,555 –42,772
Income tax at Finnish tax rate –15,744 11,121
Tax effects of:
Tax exempt profits 1 876
non-deductable expenses –305 –481Goodwill impairment (non-deduct-able) 0 –24,674
Taxes from prior years –234 –620Business combinations, postponed depreciation 1,760 0
Tax charge –14,523 –13,778
15 Earnings per share
2010 2009
Profit/loss attributable to the equity holders of the company, continuing operations, EUR thousand 46,032 –56,550
Weighted average number of shares 8,604 7,580Basic earnings per share (euros/share), continuing operations 5.35 –7.46
Basic earnings per share is calculated by dividing the profit attributable to equity shareholders for the financial period by the weigthed average number of outstanding shares during the financial period.
There are no instruments causing dilution of earnings per share.

Financial statements
64 65
dna annual Report 2010dna annual Report 2010
notes to the consolidated financial statements
16 Property, plant and equipmentEUR 1,000
Land and water
Buildings and constructions
Machinery and
equipment
Other property, plant and
equipment
Prepay- ments and
non-current assets under construction Total
At 1 January 2009Cost 1,373 27,968 588,314 0 36,152 653,806
accumulated depreciation 0 –2,496 –235,579 0 0 –238,075
Net book amount 1,373 25,472 352,735 0 36,152 415,731
Year ended 31 December 2009Opening net book amount 1,373 25,472 352,735 0 36,152 415,731
additions and transfers 408 60,813 873 14,172 76,266
disposals –873 –6,259 –676 –7,808accumulated depreciation relating to disposals 6,058 6,058
Other changes –285 –285
depreciation charge –2,173 –90,149 –92,322
Closing net book amount 500 23,422 323,198 873 49,648 397,640
At 31 December 2009Cost 500 28,376 642,868 873 49,648 722,265
accumulated depreciation 0 –4,954 –319,670 0 0 –324,624
Net book amount 500 23,422 323,198 873 49,648 397,640
Year ended 31 December 2010Opening net book amount 500 23,422 323,198 873 49,648 397,640additions and transfers 10 2,063 71,417 –23,965 49,525Business combinations (note 5) 54,814 54,814disposals –1 –1,014 –133 –1,148accumulated depreciation relating to dis-posals 496 496Other changes 0depreciation charge –1,935 –86,768 –88,703Closing net book amount 509 23,549 362,143 873 25,550 412,623At 31 December 2010Cost 509 30,439 768,085 873 25,550 825,456accumulated depreciation 0 –6,889 –405,942 0 0 –412,831Net book amount 509 23,549 362,143 873 25,550 412,623
Property, plant and equipment includes property acquired through finance lease agreements as follows:
Property, plant and equipment
EUR 1,000 2010 2009
Cost - capitalised finance leases 87,277 87,207
accumulated depreciation 83,450 79,900
net book amount 3,827 7,307
17 Intangible assets EUR 1,000
GoodwillCustomer
base Brand
Other intangible
assets Total
At 1 January 2009Cost 201,179 38,484 128,482 368,144
accumulated amortization and impairment –9,579 –5,725 –99,751 –115,055
Net book amount 191,600 32,759 28,731 253,089
Year ended 31 December 2009Opening net book amount 191,600 32,759 28,731 253,089
additions 21,297 21,297
decreases –1 –1
amortization charge –3,711 –20,018 –23,729
Impairment loss –94,900 –94,900
Closing net book amount 96,700 29,048 30,009 155,756
At 31 December 2009Cost 201,179 38,484 149,778 389,440
accumulated amortization and impairment –104,479 –9,436 –119,769 –233,684
Net book amount 96,700 29,048 30,009 155,756
Year ended 31 December 2010Opening net book amount 96,700 29,048 30,009 155,756additions 33,999 33,999Business combination (note 5) 113,067 39,655 28466 835 182,023amortization charge relating to transfers 469 469amortization charge –5,750 –474 –21,901 –28,125Closing net book amount 209,767 62,953 27,992 43,411 344,122At 31 December 2010Cost 314,246 78,139 28,466 184,612 605,462accumulated amortization and impairment –104,479 –15,186 –474 –141,201 –261,340Net book amount 209,767 62,953 27,992 43,411 344,122
Goodwill allocation
Goodwill is allocated to dna’s cash-generating units as follows:
EUR 1,000 2010 2009
Consumer Business 168,959 57,833
Corporate Business 40,808 38,867
Total 209,767 96,700
Impairment testing
In order to carry out impairment testing, goodwill is allocated
to cash-generating units (CGUs) in accordance with dna’s
business organisation. The balance sheet values of all CGUs are
subjected to annual impairment testing.
apart from goodwill, the Group does not have any other
intangible assets with unlimited useful life. The recoverable
amount (the higher of an asset’s fair value less costs to sell
and its value in use) of CGUs is defined as the value in use
according to the projected discounted cash flows (the dCF
method). Cash flow projections are based on plans approved
by the management, covering a five-year period. The manage-
ment considers the projections to reflect the development to
date and other information available from external sources. The
(before tax) discount rate (weighted average cost of capital
WaCC) used in testing represents 14.2–15.7 per cent depend-
ing on the segment. The growth rate forecasted after five
years was assumed to be 2.0 per cent.
The impairment test indicated that the recoverable
amounts of the CGUs exceeded their balance sheet values and
their goodwill have not been impaired. The management con-
siders the applied assumptions to be reasonable in the light
of information available at the time of producing the financial
statements.

Financial statements
66 67
dna annual Report 2010dna annual Report 2010
notes to the consolidated financial statements
The key assumptions used were growth in net sales, devel-opment of profitability, weighted average cost of capital (WaCC) as well as the cash flow growth rate after the five-year forecast period. The major sensitivities in the result are associ-ated with the forecased revenues and levels of profitability. In comparison to previous years, the following changes were made to the calculation of WaCC:
Change in business perspective: transfer from technol-ogy oriented (mobile/fixed) to a customer oriented model (consumer/corporate);
Beta estimation: transfer to the use of company level beta. a risk premium was added to the WaCC due to uncertain
and changing market conditions. The CGU-specific WaCC risk premiums used in testing were based on the differences in risks in the projected cash flows, e.g. relating to relative differences in growth projections.
Applied parameters and sensitivity analysis
applied parameters in the testing of 2010
2010applied forecast parameters
Consumer Segment
Corporate Segment
amount by which the book value is exceeded, EUR million 339 82average growth in net sales, % 4.9 6.5Average operating margin, % * 31.3 30.9Average investment, % of net sales * 13.9 11.9Growth after the forecast period, % 2.0 2.0WaCC, % 14.2 15.7
* Five-year forecast period average
The table below illustrates the percentage unit change for the key forecast parameters when fair value is equal to book value (other parameters remaining unchanged).
2010Sensitivity analysis of forecast parameters
Consumer Segment
Corporate Segment
average EBITda, % of net sales –6.6 –4.9
WaCC, % 7.1 5.0
applied parameters in the testing of 2009
In 2009, the Group concluded during the annual goodwill impair-ment testing that indications of an impairment loss to good-will in the former Fixed segment were present already in the beginning of the year, and as such the impairment testing should have been performed before the restatement of seg-ments. The impairment testing is therefore performed also on former reported CGUs and as a result a EUR 94.9 million impair-ment loss was recognised in the Fixed segment. The impair-ment test indicated that the recoverable amounts of the
current segments, Consumer and Corporate, exceeded their
balance sheet values and their goodwill would not have been
impaired. The management considers the applied assumptions
to be reasonable in the light of information available at the
time of producing the financial statements.
applied parameters in the testing of current CGUs 2009
2009applied forecast parameters
Consumer Segment
Corporate Segment
amount by which the book value is exceeded, EUR million 384 218average growth in net sales, % 2.5 2.3Average operating margin, % * 26.5 32.3Average investment, % of net sales * 13.6 9.6Growth after the forecast period, % 1.7 1.2WaCC, % 11.6 11.1
* Five-year forecast period average
The table below illustrates the percentage unit change for the
key forecast parameters when fair value is equal to book value
(other parameters remaining unchanged).
2009Sensitivity analysis of forecast parameters
Consumer Segment
Corporate Segment
average EBITda, % of net sales –7.4 –10.5
WaCC, % 10.7 8.5
applied parameters in the testing of former CGUs 2009
The Retail segment was treated as part of the Mobile segment
because of its immaterial impact.
2009applied forecast parameters Mobile Fixed
amount by which the book value is ex-ceeded, EUR million 590 –95
average growth in net sales, % 4.4 –2.7
Average operating margin, % * 28.4 27.4
Average investment, % of net sales * 13.6 9.2
Growth after the forecast period, % 2.0 0.0
WaCC, % 12.1 9.7
* Five-year forecast period average
The table below illustrates the percentage unit change for the key forecast parameters when fair value is equal to book value (other parameters remaining unchanged).
2009Sensitivity analysis of forecast parameters Mobile Fixed
average EBITda, % of net sales –11.1 5.0
WaCC, % 21.6 –2.2
18 Investments in associates
EUR 1,000 2010 2009
at 1 January 1,133 1,191
Share of profit or loss for the financial period 11 9
decreases –4 –68
At 31 December 1,139 1,133There was no goodwill related to associated companies in 2010 and 2009.
Financial information about the Group’s associated companies
EUR 1,000 domicile assets Liabilities net salesShare of
profit/lossGroup
holding
2010Suomen numerot numpac Oy Helsinki 504 242 1,065 11 25%Kiinteistö Oy Otavankatu 3 Pori 2,508 370 259 36%Kiinteistö Oy Siilinjärven Toritie Siilinjärvi 329 3 27 38%
2009Suomen numerot numpac Oy Helsinki 584 351 1,222 9 25%
Kiinteistö Oy Otavankatu 3 Pori 2,501 623 198 0 36%
Kiinteistö Oy Siilinjärven Toritie Siilinjärvi 339 4 33 0 38% dna Group’s real estate companies are not included in the consolidated financial statements, as their exclusion does not have any significant effect on the Group’s financial position.
19 Available-for-sale financial assets
EUR 1,000 2010 2009
Shares in non-listed companies 157 243
Total 157 243
Reconciliation of available-for-sale financial assetsat 1 January 243 12,374
additions 0 8,458
disposals –86 –20,590
Change in fair value 0 1
At 31 December 157 243

Financial statements
68 69
dna annual Report 2010dna annual Report 2010
notes to the consolidated financial statements
20 Receivables
EUR 1,000 2010 2009
Non-current receivablesTrade and other receivables:
Trade receivables 5,770 10,189
Finance lease receivables 1 9
Accruals *) 981 719
Other non-current receivables 1,126 2
Total non-current receivables 7,879 10,919
Current receivablesTrade and other receivables:
Trade receivables 130,773 122,293
Finance lease receivables 13 39
Accruals *) 17,200 7,777
Other current receivables 10,066 10,007
Total current receivables 158,051 140,115
*) accruals consist of: trade payables of EUR 8.5 million (EUR 4.9 million), TyEL prepayment of EUR 5.8 million (EUR 0.8 million), marketing reimbursement of EUR 1.1 million (EUR 0 million) and other of EUR 2.7 million (EUR 2.7 million).
The Group has recognised a trade receivable impairment loss of EUR 8.9 million (EUR 8.6 million) during the period.
Impairment is performed on trade receivables older than 180 days. non-current receivables are measured at fair value. Fair value of current loans and other receivables corresponds to book value as the effect of disounting is not material consider-ing the maturity.
Finance lease receivable maturities:
EUR 1,000 2010 2009
Finance lease receivable maturities - total value of minimum lease payments
Within one year 17 45after one year and for a maximum of five years 2 19
Total 19 64
Finance lease receivables - present value of minimum lease payments
Within one year 13 39after one year and for a maximum of five years 1 9
Total 14 48
Receivables accrued in the future 5 16
Total finance lease receivables 19 64
Movements in the group provision for impairment of trade receivables are as follows:
EUR 1,000 2010 2009
at 1 January 8,462 7,050Provision for impairment of trade receivables 10,593 13,664Trade receivables written off during the year as uncollectible 9,369 11,821
Unused amounts reversed 0 431
At 31 December 9,686 8,462
21 Deferred tax assets and liabilities
EUR 1,000Jan 1 2010
Recognised in the income statement
Other comprehensive
incomeRecognised
in equityBusiness
combinationsdec 31
2010
Deferred tax assets 2010Financial assets 439 –216 223Provisions 2,472 220 235 2,927Finance lease agreements 1,161 –192 969Group eliminations 26,765 –3,154 23,611Other temporary differences 840 –133 23 729Total 31,677 –3,259 –216 0 258 28,459
Deferred tax liabilities 2010Fair value of assets through business combinations 35,024 –6,077 22,391 51,338negative depreciation difference 15,222 –3,918 2,050 13,354Other temporary differences 5,000 2,154 92 7,246Total 55,246 –7,841 0 0 24,533 71,939
Jan 1 2009
Recognised in the income statement
Other comprehensive
incomeRecognised
in equityBusiness
combinationsdec 31
2009
Deferred tax assets 2009Financial assets 344 95 439
Provisions 571 1,901 2,472
Finance lease agreements 322 839 1,161
Group eliminations 29,887 –3,122 26,765
Other temporary differences 1,611 –771 840
Total 32,735 –1,153 95 0 0 31,677
Deferred tax liabilities 2009Fair value of assets through business combinations 40,175 –5,151 35,024
negative depreciation difference 16,693 –1,471 15,222
Other temporary differences 4,478 539 –17 5,000
Total 61,347 –6,083 –17 0 0 55,246
The Group did not have unused confirmed tax losses on 31 december 2010.
22 Inventories
EUR 1,000 2010 2009
Materials and supplies 12,527 7,856
Total 12,527 7,856
23 Cash and cash equivalents
EUR 1,000 2010 2009
Cash and bank deposits 49,466 26,304
Total 49,466 26,304

Financial statements
70 71
dna annual Report 2010dna annual Report 2010
notes to the consolidated financial statements
24 Shareholders’ equity
EUR 1,000number of shares
(thousands) Share capital Share premium Unrestricted
equity reserve
At 31 December 2008 7,581 72,375 41,689 407,213
Share issue 327 –327
Share premium reduction –41,618
Other change –71 71
At 31 December 2009 7,581 72,702 0 406,956
Share issue
directed share issue 3
Welho acquisition (note 5) 2,027 200,000
Other change –1,029
At 31 December 2010 9,611 72,702 0 605,927
The number of shares include 7,500 treasury shares. dna Ltd has one share series. The number of shares is 9,610,676 (7,580,761). The shares do not have a nominal value. dna Ltd’s
share capital amounts to EUR 72,702,226. all issued shares have been paid in full.
Shareholders’ equity reserves are described as follows:
Share premiumWhere options or subscription rights to convertible bonds were decided under the previous Limited Liability Companies act, the proceeds received from options and convertible bonds, less any transaction costs, have been recognised in share capital and the share premium reserve.
Hedge fundChanges in fair value of derivative instruments, used as cash flow hedges, are recognised in the hedge fund.
EUR 1,000 2010 2009
Hedge fund –633 –1,248
Total –633 –1,248
Unrestricted equity reserveThe unrestricted equity reserve includes other equity type investments and the subscription price of shares insofar as it has not been expressly recognised in the share capital.
Dividendsafter the balance sheet date, the Board of directors pro-posed to distribute a dividend of EUR 49,936,515.20 (EUR 32,965,435.35).
Treasury sharesThe company has during the financial year, acquired 5,000 treasury shares following the decision made at the extraordi-nary general meeting 31 March 2010. The cost of acquisition totalled EUR 588,402.16.
The acquisition of treasury shares is deducted from retained earnings.
date number of sharesacquisition cost,
EUR
7.4.2010 5,000 588,402.16
4.8.2009 2,500 287,208.75
Total 7,500 875,610.91
Treasury shares acquired during the financial period repre-sent 0.05 per cent of the votes (treasury shares in total representing 0.01 per cent of the votes). The purchase of treasury shares did not materially affect the structure of own-ership and voting power in the company.
Management rights issuea rights issue was targeted at management as part of their incentive scheme. during the reporting period, a total of 2,748 new shares were subscribed at a per-share subscription price of EUR 97. Riitta Tiuraniemi subscribed to 180 shares and other members of the management subscribed to 2,568 shares. The new shares did not have a nominal value.
25 Share-based payments
Conditions of the share-based incentive schemeduring the financial period, the Group introduced a share-based incentive scheme directed at key personnel. according to the conditions of the incentive scheme, the parent company grants options without monetary compensation. The Group’s incentive scheme is conditional. The central conditions of the scheme are presented in the table below.
Option schemeas proposed by the Board of directors, the annual General Meeting decided to introduce a long-term incentive scheme for management and other key personnel in March 2010. If the option rights holder’s employment with a Group company will end, his or her option rights will immediately transfer to the company or its order. a total of 100,000 option rights will be issued, of which at most 51,000 option rights will be classi-fied as 2010a and 49,000 option rights as 2010B. The share subscription period for option rights 2010a begins on 2 Janu-ary 2013 and ends on 30 april 2015. For option rights 2010B it begins on 2 January 2014 and ends on 30 april 2016. Since one option right entitles the holder to subscribe to one new share or treasury share held by the company, all awarded option rights entitle to the subscription of a maximum of 100,000 shares in the company. The per-share subscription price for option rights 2010a and 2010B is EUR 97.00, which was the estimated fair value of the share on 17 december 2009. Should the company distribute dividends or funds from its unrestricted equity fund, the subscription price applied to the option rights will be decreased in line with the amount of dividends decided or unrestricted equity funds distributed after 17 december 2009 and prior to the share subscription period on the record date of each dividend payment or repayment of capital. The subscription price will be recorded in the company’s unre-stricted equity reserve.
Option scheme
Classification 2010a 2010B
Target group Key personnel Key personnel
Granting date 10 March 2010 not grantednumber of granted instruments 50,000 -
Exercise price EUR 97 EUR 97Share price at granting date EUR 97 EUR 97
Subscription period2 Jan 2013–
30 april 20152 Jan 2014–
30 april 2016
Expected life (years) 5 years
ConditionsEmployed with the
companyEmployed with the
company
Implementation as shares as shares
Share options outstandingChanges in share options outstanding during the financial period and the average exercise prices are as follows:
Options
On 1 January 2010Granted options 50,000
Forfeited options
Exercised options
Expired options
On 31 December 2010 50,000
The weighted average fair value of options granted during the period was EUR 35.47 per option. The fair value of the options was determined by using a valuation model. The significant inputs of the model were the share price as of 30 June 2010, of EUR 98.66, exercise price shown above, volatility of 38 per cent, an expected option life of three years, and an annual risk-free interest rate of 2.49 per cent.
Conditions of the share-based incentive planThe Group did not have any new share-based incentive plans in 2009. during 2010, dna Ltd continued the share-based incen-tive programme for management introduced in 2008. during 2010, the management has been given an opportunity to sub-scribe to a total of 2,500 and 248 shares in the company. The subscription price is EUR 97 per share. The shares of the first emission were to be subscribed to no later than on 5 February 2010 and the subscription price were to be paid by 13 Febru-ary 2010. The shares of the second emission were to be sub-scribed to by 1 april 2010 and subscription price paid no later than on 8 april 2010. The Board of directors agreed on the programme on 27 March 2009. The programme does not have an earning period. The shares are subjected to two prohibi-tion periods with regard to share transfer. The first prohibition period (“Transfer prohibition 1”) will be valid for two years from the time of subscription and the second prohibition period (“Transfer prohibition 2”) will be valid for two years from the end of the Transfer Prohibition 1. The management may not trans-fer shares without an advance written consent by the dna’s Board of directors during the Transfer prohibition 1. during the Transfer Prohibition 2, the management may not transfer more than 30 per cent of their shares without an advance written consent by the dna’s Board of directors.
The Transfer prohibitions will not be valid should all dna’s shares be sold to a third party. The managment may also have to sell part or all of their shares in an intial public offering (IPO). In this case, the Transfer Prohibition does not apply to the shares sold at the time.
arrangementnature of arrangement Shares Shares Shares
date of granting 28 May 2008 28 Jan 2010 31 Mar 2010
number of granted instru-ments 12,500 2,500 248
Subscription price 1,320,500 242,500 24,056
Share price at the time of granting 105.64 97.00 97.00
Valid for 19 Sep 2008 5 Feb 2010 1 april 2010
Implementation In shares In shares In shares
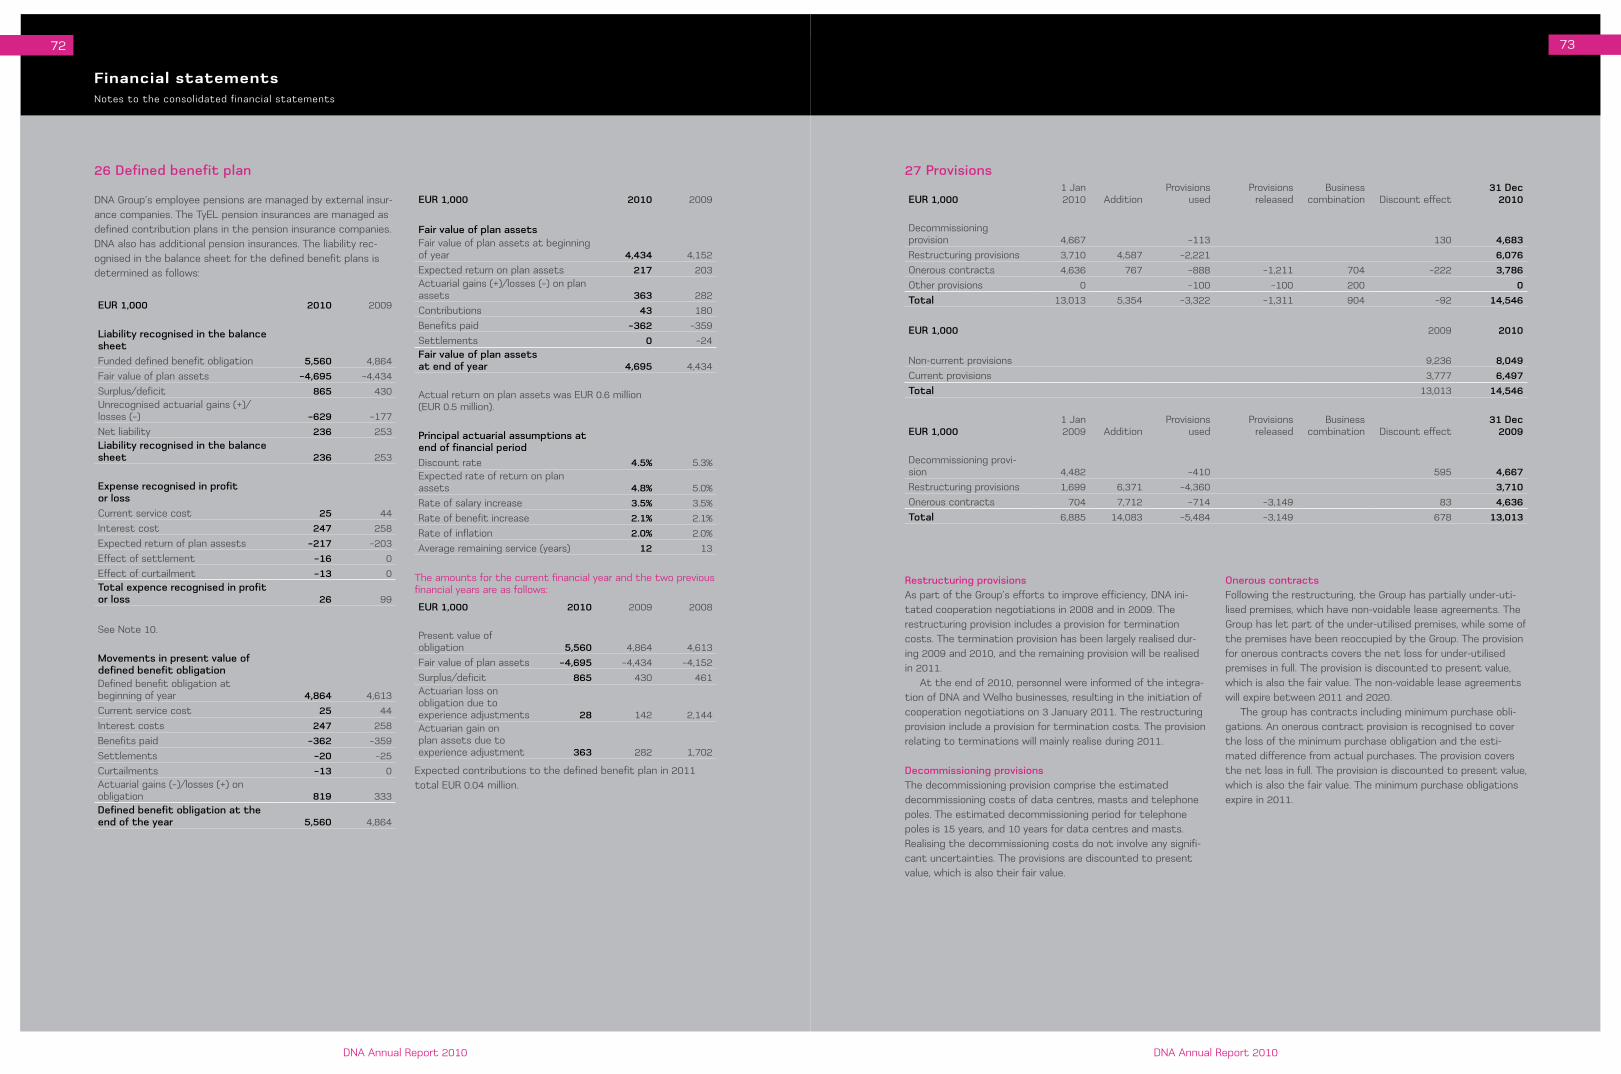
Financial statements
72 73
dna annual Report 2010dna annual Report 2010
notes to the consolidated financial statements
26 Defined benefit plan
dna Group’s employee pensions are managed by external insur-ance companies. The TyEL pension insurances are managed as defined contribution plans in the pension insurance companies. dna also has additional pension insurances. The liability rec-ognised in the balance sheet for the defined benefit plans is determined as follows:
EUR 1,000 2010 2009
Liability recognised in the balance sheetFunded defined benefit obligation 5,560 4,864
Fair value of plan assets –4,695 –4,434
Surplus/deficit 865 430Unrecognised actuarial gains (+)/ losses (–) –629 –177
net liability 236 253Liability recognised in the balance sheet 236 253
Expense recognised in profit or lossCurrent service cost 25 44
Interest cost 247 258
Expected return of plan assests –217 –203
Effect of settlement –16 0
Effect of curtailment –13 0Total expence recognised in profit or loss 26 99
See note 10.
Movements in present value of defined benefit obligationdefined benefit obligation at beginning of year 4,864 4,613
Current service cost 25 44
Interest costs 247 258
Benefits paid –362 –359
Settlements –20 –25
Curtailments –13 0actuarial gains (–)/losses (+) on obligation 819 333Defined benefit obligation at the end of the year 5,560 4,864
EUR 1,000 2010 2009
Fair value of plan assetsFair value of plan assets at beginning of year 4,434 4,152
Expected return on plan assets 217 203actuarial gains (+)/losses (–) on plan assets 363 282
Contributions 43 180
Benefits paid –362 –359
Settlements 0 –24Fair value of plan assets at end of year 4,695 4,434
actual return on plan assets was EUR 0.6 million (EUR 0.5 million).
Principal actuarial assumptions at end of financial perioddiscount rate 4.5% 5.3%Expected rate of return on plan assets 4.8% 5.0%
Rate of salary increase 3.5% 3.5%
Rate of benefit increase 2.1% 2.1%
Rate of inflation 2.0% 2.0%
average remaining service (years) 12 13
The amounts for the current financial year and the two previous financial years are as follows:
EUR 1,000 2010 2009 2008
Present value of obligation 5,560 4,864 4,613
Fair value of plan assets –4,695 –4,434 –4,152
Surplus/deficit 865 430 461actuarian loss on obligation due to experience adjustments 28 142 2,144actuarian gain on plan assets due to experience adjustment 363 282 1,702
Expected contributions to the defined benefit plan in 2011 total EUR 0.04 million.
27 Provisions
EUR 1,0001 Jan 2010 addition
Provisions used
Provisions released
Business combination discount effect
31 Dec 2010
decommissioning provision 4,667 –113 130 4,683Restructuring provisions 3,710 4,587 –2,221 6,076Onerous contracts 4,636 767 –888 –1,211 704 –222 3,786Other provisions 0 –100 –100 200 0Total 13,013 5,354 –3,322 –1,311 904 –92 14,546
EUR 1,000 2009 2010
non-current provisions 9,236 8,049Current provisions 3,777 6,497Total 13,013 14,546
EUR 1,0001 Jan 2009 addition
Provisions used
Provisions released
Business combination discount effect
31 Dec 2009
decommissioning provi-sion 4,482 –410 595 4,667Restructuring provisions 1,699 6,371 –4,360 3,710Onerous contracts 704 7,712 –714 –3,149 83 4,636Total 6,885 14,083 –5,484 –3,149 678 13,013
Restructuring provisionsas part of the Group’s efforts to improve efficiency, dna ini-tated cooperation negotiations in 2008 and in 2009. The restructuring provision includes a provision for termination costs. The termination provision has been largely realised dur-ing 2009 and 2010, and the remaining provision will be realised in 2011.
at the end of 2010, personnel were informed of the integra-tion of dna and Welho businesses, resulting in the initiation of cooperation negotiations on 3 January 2011. The restructuring provision include a provision for termination costs. The provision relating to terminations will mainly realise during 2011.
Decommissioning provisions The decommissioning provision comprise the estimated decommissioning costs of data centres, masts and telephone poles. The estimated decommissioning period for telephone poles is 15 years, and 10 years for data centres and masts. Realising the decommissioning costs do not involve any signifi-cant uncertainties. The provisions are discounted to present value, which is also their fair value.
Onerous contractsFollowing the restructuring, the Group has partially under-uti-lised premises, which have non-voidable lease agreements. The Group has let part of the under-utilised premises, while some of the premises have been reoccupied by the Group. The provision for onerous contracts covers the net loss for under-utilised premises in full. The provision is discounted to present value, which is also the fair value. The non-voidable lease agreements will expire between 2011 and 2020.
The group has contracts including minimum purchase obli-gations. an onerous contract provision is recognised to cover the loss of the minimum purchase obligation and the esti-mated difference from actual purchases. The provision covers the net loss in full. The provision is discounted to present value, which is also the fair value. The minimum purchase obligations expire in 2011.

Financial statements
74 75
dna annual Report 2010dna annual Report 2010
notes to the consolidated financial statements
28 Financial liabilities
EUR 1,000 2010 2009
Non-current interest-bearing liabilitiesLoans from financial institutions 75,203 88,824
Other loan commitments 21,028 25,473
Finance lease liabilities 4,061 7,141
Total 100,292 121,438
Current interest-bearing liabilitiesLoans from financial institutions 43,529 43,529
Other loan commitments 4,445 1,368
Finance lease liabilities 3,609 4,493
Total 51,584 49,391
Finance lease liabilities
Finance lease liabilities - minimum lease paymentsno later than 1 year 3,872 4,606Later than 1 year and no later than 5 years 3,846 6,701
Later than 5 years 652 1,603
Total 8,370 12,910Future finance charges on finance leases –700 –1,276Present value of finance lease liabilities 7,670 11,634
EUR 1,000 2010 2009
Finance lease liabilities - present value of minimum lease paymentsno later than 1 year 3,609 4,493Later than 1 year and no later than 5 years 3,477 5,976
Later than 5 years 584 1,165
Total 7,670 11,634
Total finance lease liabilities 8,370 12,910
29 Trade payables and other liabilities
EUR 1,000 2010 2009
Current financial liabilities carried at amortised acquisition cost
Trade payables 72,600 69,910
Accrued expenses *) 38,259 27,198
advances received 11,554 2,693
Other current liabilities 4,103 2,491
Total current liabilities 126,516 102,292 *) accrued expenses consist of:
Holiday pay and bonuses, including social expenses, totalling EUR 14.3 million (EUR 11.3 million), interest expenses EUR 0.9 million (EUR 1.3 million) and other accrued operative expenses EUR 23.0 million (EUR 14.6 million).
30 Fair value of financial liabilities
2010 2009
EUR 1,000 Carrying amount Fair value Carrying amount Fair value
Non-current financial liabilitiesLoans from financial institutions 75,203 74,971 88,824 88,603
Other loan commitments 21,028 22,003 25,473 26,602
Financial lease agreements 4,061 4,061 7,141 7,141
Total 100,292 101,035 121,438 122,345
Current financial liabilitiesLoans from financial institutions 43,529 43,462 43,529 43,605
Other loan commitments 4,445 4,530 1,368 1,369
Financial lease agreements 3,609 3,609 4,493 4,493
Total 51,584 51,601 49,391 49,467
Fair value of liabilities has been calculated by discounting the expected cash flows of liabilities using the market interest rate at the balance sheet date plus the company’s risk premium. The fair value of financial lease agreements do not materially differ from their carrying amount.
31 Derivative instruments
2010
EUR million < 1 year 1–5 years > 5 years
Derivatives, outside hedge accountingStructured interest rate swaps nominal value - 30.0 -
Positive Fair value - - -
negative Fair value - 0.2 -
Derivatives, hedge accountingInterest rate swaps nominal value - 17.5 -
Positive Fair value - - -
negative Fair value - 0.9 -
In 2010, dna applied cash flow hedge accounting using an interest rate swap at a nominal value of EUR 17.5 million (EUR 30.0 mil-lion). Testing for hedge effectiveness showed the hedge to be effective. Hedge accounting was not applied to the EUR 30 million nominal valued structured interest rate swap. In 2009, it was reported as an interest rate option. This interest rate swap is fixed at a 3 month euribor rate of 2 per cent. The effect of exceeding this rate is that the instrument changes into a interest rate swap with a fixed rate of 3.46 per cent. In 2010, the Group changed electricity providers and the new contract does not include embedded derivative instruments. 2009
EUR million < 1 year 1–5 years > 5 years
Derivatives, outside hedge accountingInterest rate options nominal value - 30.0 -
Positive Fair value - 0.0 -
negative Fair value - - -
Derivatives, hedge accountingInterest rate swaps nominal value - 35.0 -
Positive Fair value - - -
negative Fair value - 1.7 -
Other instrumentsElectricity forward contracts Positive Fair value - - -
negative Fair value 0.5 - -
Derivative fair value measurement hierarchyEffective on 1 January 2009, the Group adopted the amend-ment to IFRS 7 for financial instruments that are measured in the balance sheet at fair value, requiring disclosure of fair value measurements by level of the following fair value measurement hierarchy: Level 1 - Quoted prices (unadjusted) in active markets for iden-
tical assets or liabilitiesLevel 2 - Other inputs observable either directly (that is, as
prices) or indirectly (that is, derived from prices)Level 3 - Unobservable inputs
2010
Fair value measurement Level 1 Level 2 Level 3Structured interest rate swaps - –0.2 -
Interest rate swaps - –0.9 -
2009
Fair value measurement Level 1 Level 2 Level 3Interest rate option - - -Interest rate swaps - –1.7 -Electricity forward contracts –0.5 - -

Financial statements
76 77
dna annual Report 2010dna annual Report 2010
notes to the consolidated financial statements
32 Operating lease agreements
Group as lessee Minimum lease amount paid on the basis of non-voidable oper-ating lease agreements:
EUR 1,000 2010 2009
Within one year 21,918 21,153Longer than one year but not more than five years 8,945 12,225
after five years 4,036 5,525
Total 34,899 38,903 The Group leases premises, telecommunications premises, masts, vehicles etc. The lease periods are 1–6 years and nor-mally include the opportunity to continue the agreement after the original end date. The 2010 income statement includes paid operating lease expenses of EUR 35.1 million (EUR 39.0 mil-lion). Relating to operating leases, the Group has made a provi-sion of EUR 3.2 million (EUR 4.6 million). For more information, see note 27 “Provisions”.
33 Guarantees and contingent liabilities
Lease commitments relating to operating lease agreements are presented in note 32. Purchase commitments at the balance sheet date, the value of the fixed purchase commitments of the Group were EUR 2.8 million (EUR 4.1 mil-lion).
34 Related party transactions
The Group’s related parties include organisations exercising significant influence, associated companies and members of the Board of directors and the management teams, including the CEO and the deputy CEO as well as their immediate family. additionally, any organisation where a member of the related party excercises significant influence is considered a related party.
Group structure in 2010Company Country Share of ownership Share of votesdna Store Ltd Finland 100% 100%Huuked Labs Oy Finland 100% 100%ShelCo2 Oy *) FinlandShelCo3 Oy *) Finland
*) ShelCo2 Oy and ShelCo3 Oy merged with dna Ltd on 30 September 2010.
Listing of associated companies is presented in note 18.
The following related party transactions were carried out:
EUR 1,000 Sales Purchases Receivables Liabilities
2010Organisations exercising significant influence 7,447 5,176 2,224 771associated companies 0 185 0 0Other related parties 0 81 0 0
2009Organisations exercising significant influence 53 3,671 0 0
associated companies 0 290 0 9
Other related parties 0 42 0 0
Management employee benefits
EUR 1,000 2010 2009
Salaries and other short-term employee benefits 2,300 2,058
Termination benefits 507 0
Total 2,807 2,058
The management was granted 36,000 share options during the year. The management option rights include the same condi-tions as options granted to other personnel. The fair value of the options is presented in note 25 “Share based payments”.
1,000 2010 2009
Granted options 36 0
of which exercisable 0 0
Fair value of options 1,277 0Total number of shares that management options entitle to 36 0
EUR 1,000 2010 2009
Salaries and commissions:CEOs 717 999
Members and deputy members of the Board of directors 483 526
Management’s and CEOs’ pension commitments Members of the Group management are entitled to defined benefit pensions at the age of 62 and the CEO and deputy CEO of the parent company at the age of 60.
35 Events after the balance sheet date
The test HdTV broadcasting via dna’s terrestrial network continued on 1 January 2011 under the dVB-T2 standard as required by dna’s network operating license. The programme content of the broadcasts also became more varied.
dna’s sales and marketing functions were transferred to the consumer and corporate business organisations as of 1 January 2011. On the same date, Erik Sylvestersson, Vice Presi-dent, Sales and Marketing, retired from dna Ltd’s Executive Team.
On 10 January 2011, dna announced that it is extending the cooperation with long-term partner Ericsson to include all the technology needed to build and launch dna’s 3G/HSPa+ and 4G network. The contract period is three years. dna will begin to offer 4G services in major cities and will launch 4G commercially in 2011. The agreement also covers further expansion of the 3G network. during the contract period, dna’s
36 Shares and shareholders
Shareholders on 31 december 2010 %
Private companies 60.5%
Public companies 39.5%
Shareholder informationnumber of
shares% of shares and votes
Finda Oy 2,495,490 26.0%
Sanoma Television Oy 2,027,167 21.1%
Oulun ICT Oy 1,698,997 17.7%
PHP Liiketoiminta Oyj 1,513,856 15.8%
Kuopion Puhelin Oy 993,864 10.3%
anvia Oyj 251,471 2.6%Ilmarinen Mutual Pension Insurance Company 227,423 2.4%
Other 402,408 4.2%
3G/HSPa+ (21/42 Mbps) services will expand to nationwide
coverage.
On 11 and 27 January, dna announced the establishment
of new customer call service centers in Kajaani and Tornio that
will launch operations in February and March. The new centers
bring the total number of dna’s call centers to 12.
DNA Ltd and YIT Rakennus Oy agreed on constructing
an office building for dna in Käpylä, Helsinki. The project was
announced on 7 February 2011. YIT will construct the build-
ing and rent it out to dna on a long-term lease. It will be
complet ed in late summer 2012. all dna staff in the Helsinki
metropolitan area, a total of around 600 employees, will relo-
cate to the new premises.
The changes made to the Telecommunications act in
accordance with the EU directives on electronic communica-
tion will come into effect during 2011. The change may affect
the amortisation periods of dna’s intangible rights.

Financial statements
78 79
dna annual Report 2010dna annual Report 2010
Parent company balance sheet, FaSEUR 1,000 note 31 Dec 2010 31 dec 2009
ASSETSNON-CURRENT ASSETSIntangible assets 7
development costs 1,634 1,441
Goodwill 1,336 2,150
Intangible rights 105,164 115,028
Other intangible assets 22,871 131,005 11,575 130,194
Tangible assets 7
Land and water 509 500
Buildings and constructions 9,381 9,529
Machinery and equipment 260,684 220,715
Other tangible assets 873 873
advances paid and construction in progress 25,544 296,991 49,350 280,967
Investments 8
Holdings in Group companies 10,678 11,482
Shares in associated companies 991 991
Other shares and holdings 1,343 13,013 412 12,885
TOTAL NON-CURRENT ASSETS 441,009 424,046
CURRENT ASSETSInventory
Materials and supplies 3,286 3,003
Receivablesnon-current receivables
Loan receivables from Group companies 0 5,400
Trade receivables 5,770 9,097
Other receivables 983 721
deferred tax asset 2,761 9,515 2,621 17,839
Current receivables
Trade receivables 130,804 122,284
Receivables from Group companies 9 8,793 4,914
Other receivables 9,858 8,268
accrued income and deferred expense 10 14,519 163,975 6,612 142,078
Cash and cash equivalents 49,059 18,745
TOTAL CURRENT ASSETS 225,834 181,665
TOTAL ASSETS 666,843 605,710
Parent company income statement, FaS
EUR 1,000 note1 Jan–31 Dec
20101 Jan–31 dec
2009
Net sales 1 676,327 326,226
Other operating income 4,504 22,352
Materials and services
Purchases 17,531 9,751
Change in inventory 617 –90
External services 331,668 349,815 156,955 166,616
Employee expenses
Salaries and commissions 47,867 22,410
Social expenses
Pensions 9,638 3,613
Other social expenses 2,786 60,291 2,000 28,023
depreciation and impairments 2
depreciation according to plan 96,289 52,662
Other operating expenses 3 101,869 60,670
Profit/loss 72,566 40,608
Financial income and expenses
Income from other investments 553 2,007
Other interest and financial income 964 1,358
Reversal of impairment 0 2,463
Interest and other financial expenses 5,256 –3,739 6,260 –432
Profit/loss before extraordinary items 68,827 40,176
Extraordinary income 4 3,119 132,914
Profit/loss before appropriations and tax 71,946 173,089
appropriations 5 7,170 1,733
Income taxes 6 19,254 10,472
Profit/loss for the financial period 59,862 164,350
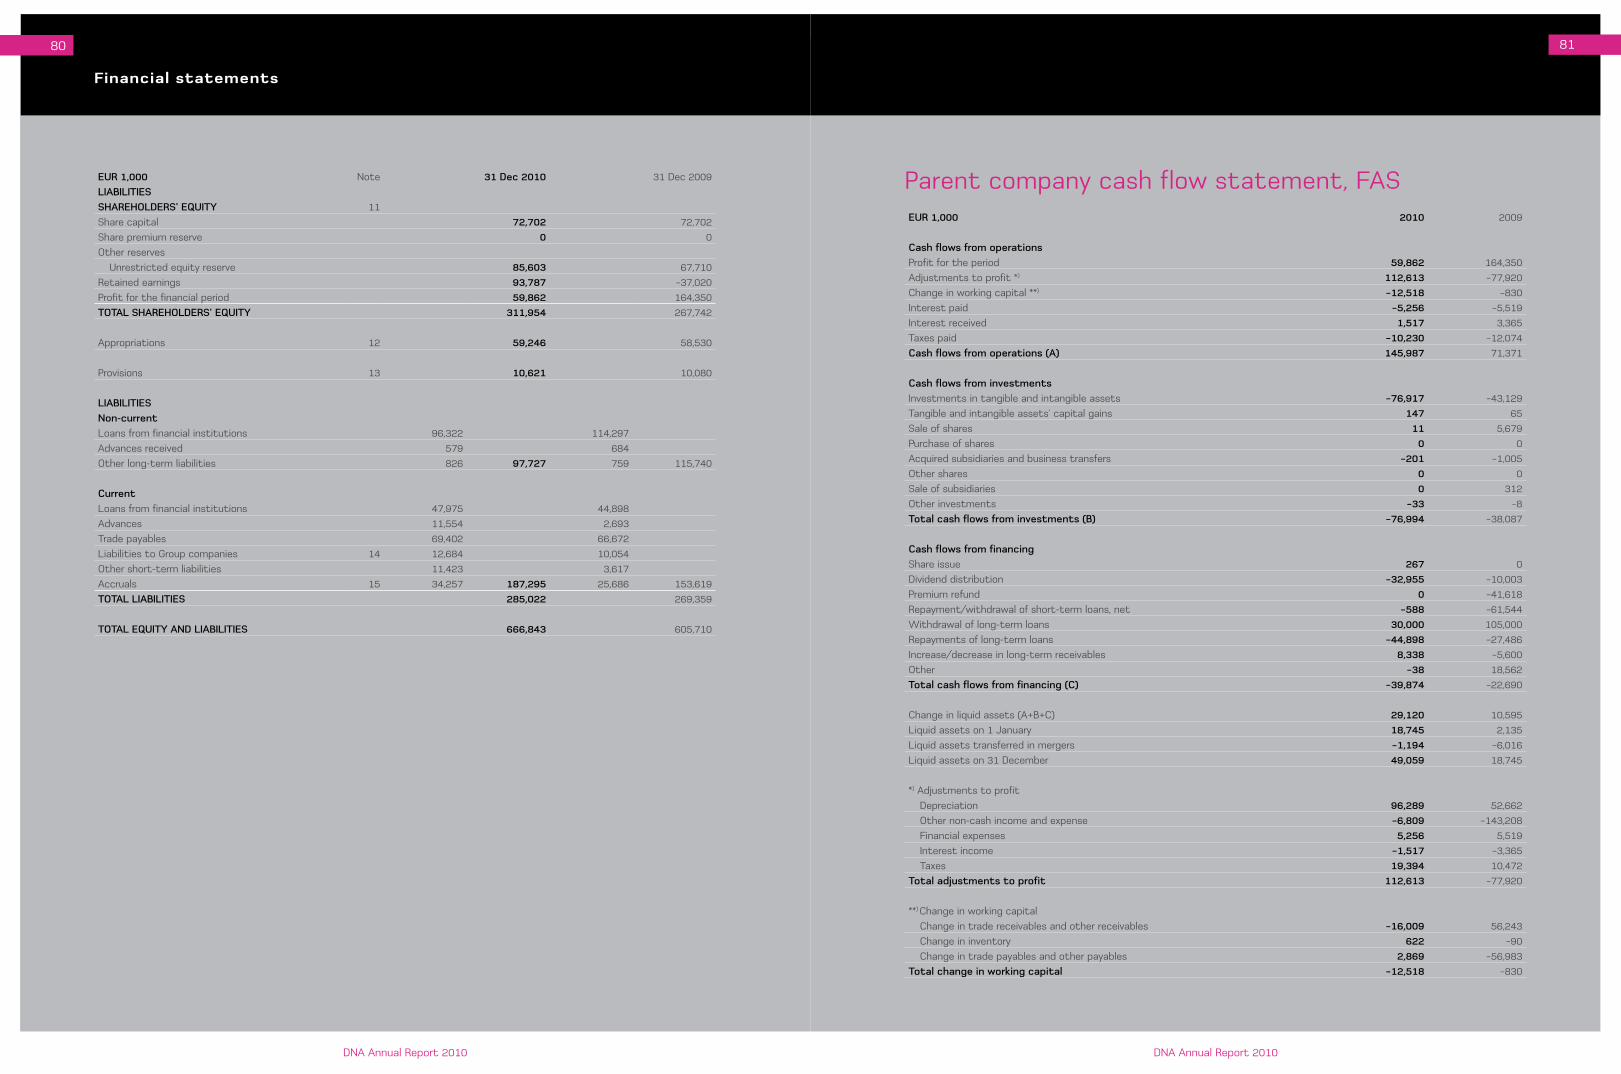
Financial statements
80 81
dna annual Report 2010dna annual Report 2010
Parent company cash flow statement, FaSEUR 1,000 2010 2009
Cash flows from operationsProfit for the period 59,862 164,350
Adjustments to profit *) 112,613 –77,920
Change in working capital **) –12,518 –830
Interest paid –5,256 –5,519
Interest received 1,517 3,365
Taxes paid –10,230 –12,074
Cash flows from operations (A) 145,987 71,371
Cash flows from investmentsInvestments in tangible and intangible assets –76,917 –43,129
Tangible and intangible assets’ capital gains 147 65
Sale of shares 11 5,679
Purchase of shares 0 0
acquired subsidiaries and business transfers –201 –1,005
Other shares 0 0
Sale of subsidiaries 0 312
Other investments –33 –8
Total cash flows from investments (B) –76,994 –38,087
Cash flows from financingShare issue 267 0
dividend distribution –32,955 –10,003
Premium refund 0 –41,618
Repayment/withdrawal of short-term loans, net –588 –61,544
Withdrawal of long-term loans 30,000 105,000
Repayments of long-term loans –44,898 –27,486
Increase/decrease in long-term receivables 8,338 –5,600
Other –38 18,562
Total cash flows from financing (C) –39,874 –22,690
Change in liquid assets (a+B+C) 29,120 10,595
Liquid assets on 1 January 18,745 2,135
Liquid assets transferred in mergers –1,194 –6,016
Liquid assets on 31 december 49,059 18,745
*) adjustments to profit
depreciation 96,289 52,662
Other non-cash income and expense –6,809 –143,208
Financial expenses 5,256 5,519
Interest income –1,517 –3,365
Taxes 19,394 10,472
Total adjustments to profit 112,613 –77,920
**) Change in working capital
Change in trade receivables and other receivables –16,009 56,243
Change in inventory 622 –90
Change in trade payables and other payables 2,869 –56,983
Total change in working capital –12,518 –830
EUR 1,000 note 31 Dec 2010 31 dec 2009
LIABILITIESSHAREHOLDERS' EQUITY 11
Share capital 72,702 72,702
Share premium reserve 0 0
Other reserves
Unrestricted equity reserve 85,603 67,710
Retained earnings 93,787 –37,020
Profit for the financial period 59,862 164,350
TOTAL SHAREHOLDERS' EQUITY 311,954 267,742
appropriations 12 59,246 58,530
Provisions 13 10,621 10,080
LIABILITIESNon-currentLoans from financial institutions 96,322 114,297
advances received 579 684
Other long-term liabilities 826 97,727 759 115,740
CurrentLoans from financial institutions 47,975 44,898
advances 11,554 2,693
Trade payables 69,402 66,672
Liabilities to Group companies 14 12,684 10,054
Other short-term liabilities 11,423 3,617
accruals 15 34,257 187,295 25,686 153,619
TOTAL LIABILITIES 285,022 269,359
TOTAL EQUITY AND LIABILITIES 666,843 605,710
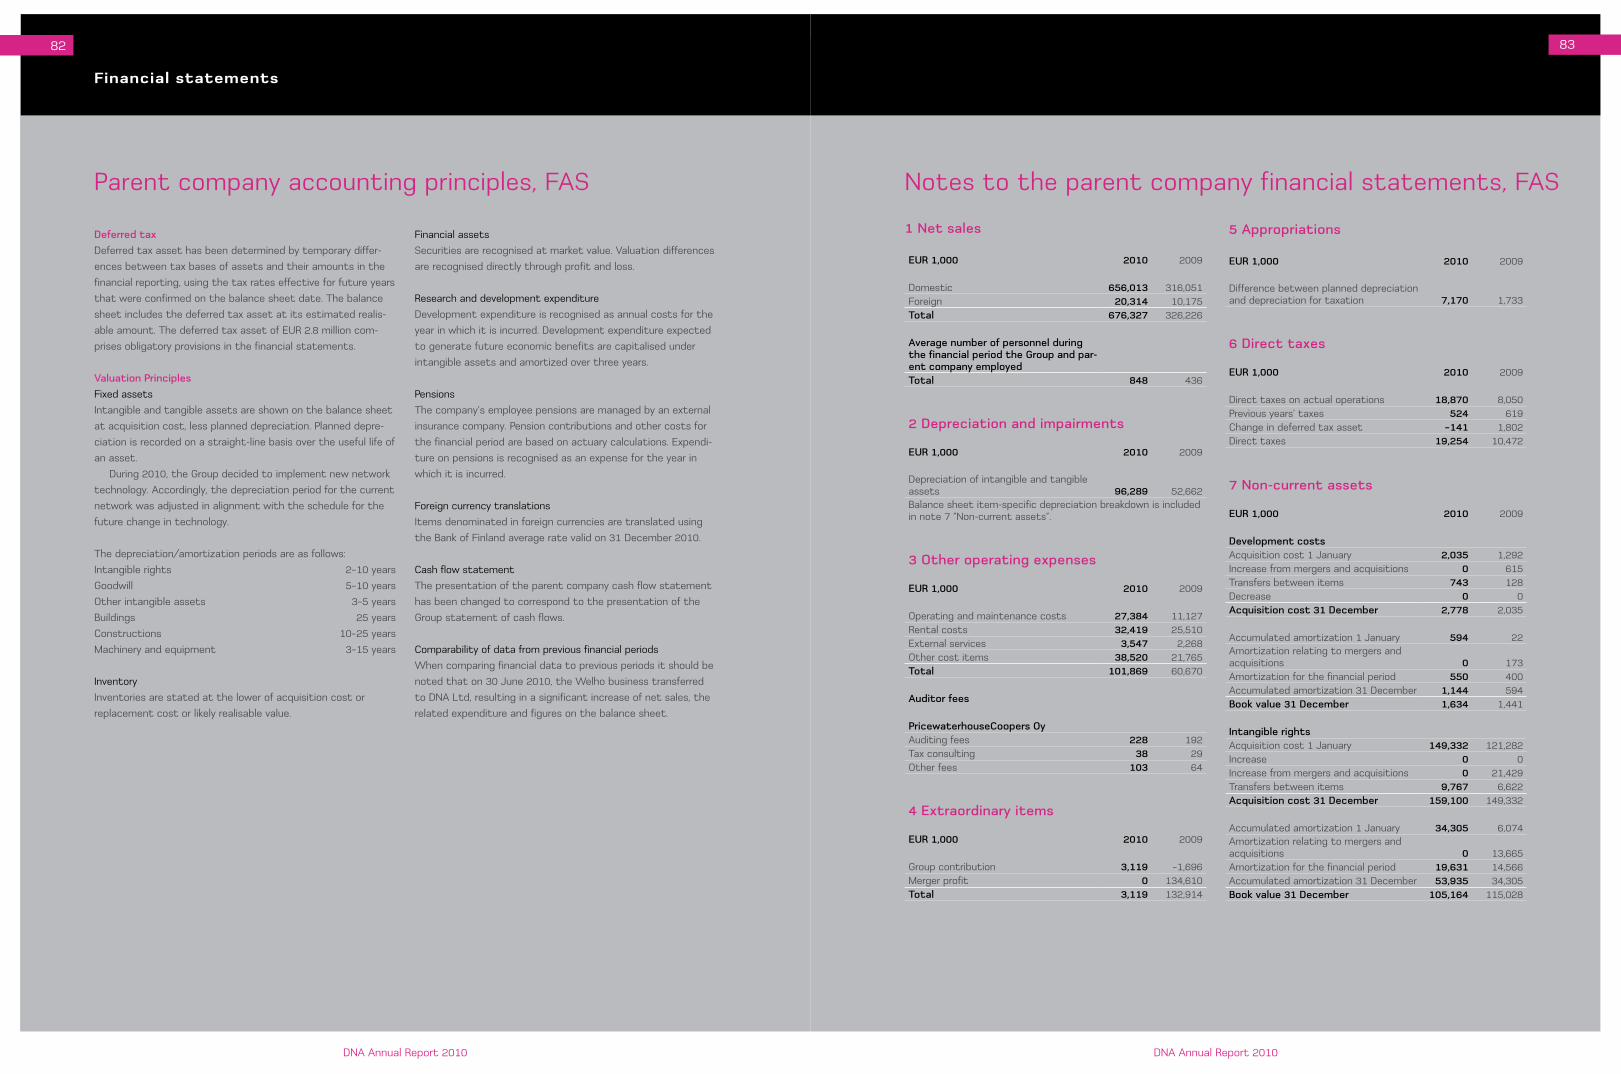
Financial statements
82 83
dna annual Report 2010dna annual Report 2010
Deferred tax
deferred tax asset has been determined by temporary differ-
ences between tax bases of assets and their amounts in the
financial reporting, using the tax rates effective for future years
that were confirmed on the balance sheet date. The balance
sheet includes the deferred tax asset at its estimated realis-
able amount. The deferred tax asset of EUR 2.8 million com-
prises obligatory provisions in the financial statements.
Valuation Principles
Fixed assets
Intangible and tangible assets are shown on the balance sheet
at acquisition cost, less planned depreciation. Planned depre-
ciation is recorded on a straight-line basis over the useful life of
an asset.
during 2010, the Group decided to implement new network
technology. accordingly, the depreciation period for the current
network was adjusted in alignment with the schedule for the
future change in technology.
The depreciation/amortization periods are as follows:
Intangible rights 2–10 years
Goodwill 5–10 years
Other intangible assets 3–5 years
Buildings 25 years
Constructions 10–25 years
Machinery and equipment 3–15 years
Inventory
Inventories are stated at the lower of acquisition cost or
replacement cost or likely realisable value.
Financial assets
Securities are recognised at market value. Valuation differences
are recognised directly through profit and loss.
Research and development expenditure
development expenditure is recognised as annual costs for the
year in which it is incurred. development expenditure expected
to generate future economic benefits are capitalised under
intangible assets and amortized over three years.
Pensions
The company’s employee pensions are managed by an external
insurance company. Pension contributions and other costs for
the financial period are based on actuary calculations. Expendi-
ture on pensions is recognised as an expense for the year in
which it is incurred.
Foreign currency translations
Items denominated in foreign currencies are translated using
the Bank of Finland average rate valid on 31 december 2010.
Cash flow statement
The presentation of the parent company cash flow statement
has been changed to correspond to the presentation of the
Group statement of cash flows.
Comparability of data from previous financial periods
When comparing financial data to previous periods it should be
noted that on 30 June 2010, the Welho business transferred
to dna Ltd, resulting in a significant increase of net sales, the
related expenditure and figures on the balance sheet.
Parent company accounting principles, FaS notes to the parent company financial statements, FaS
1 Net sales
EUR 1,000 2010 2009
domestic 656,013 316,051Foreign 20,314 10,175Total 676,327 326,226
Average number of personnel during the financial period the Group and par-ent company employedTotal 848 436
2 Depreciation and impairments
EUR 1,000 2010 2009
depreciation of intangible and tangible assets 96,289 52,662Balance sheet item-specific depreciation breakdown is included in note 7 ”non-current assets”.
3 Other operating expenses
EUR 1,000 2010 2009
Operating and maintenance costs 27,384 11,127Rental costs 32,419 25,510External services 3,547 2,268Other cost items 38,520 21,765Total 101,869 60,670
Auditor fees
PricewaterhouseCoopers Oyauditing fees 228 192Tax consulting 38 29Other fees 103 64
4 Extraordinary items
EUR 1,000 2010 2009
Group contribution 3,119 –1,696Merger profit 0 134,610Total 3,119 132,914
5 Appropriations
EUR 1,000 2010 2009
difference between planned depreciation and depreciation for taxation 7,170 1,733
6 Direct taxes
EUR 1,000 2010 2009
direct taxes on actual operations 18,870 8,050Previous years’ taxes 524 619Change in deferred tax asset –141 1,802direct taxes 19,254 10,472
7 Non-current assets
EUR 1,000 2010 2009
Development costsacquisition cost 1 January 2,035 1,292Increase from mergers and acquisitions 0 615Transfers between items 743 128decrease 0 0Acquisition cost 31 December 2,778 2,035
accumulated amortization 1 January 594 22amortization relating to mergers and acquisitions 0 173amortization for the financial period 550 400accumulated amortization 31 december 1,144 594Book value 31 December 1,634 1,441
Intangible rightsacquisition cost 1 January 149,332 121,282Increase 0 0Increase from mergers and acquisitions 0 21,429Transfers between items 9,767 6,622Acquisition cost 31 December 159,100 149,332
accumulated amortization 1 January 34,305 6,074amortization relating to mergers and acquisitions 0 13,665amortization for the financial period 19,631 14,566accumulated amortization 31 december 53,935 34,305Book value 31 December 105,164 115,028

Financial statements
84 85
dna annual Report 2010dna annual Report 2010
notes to the parent company financial statements
EUR 1,000 2010 2009
Goodwillacquisition cost 1 January 21,940 0Increase from mergers and acquisitions 0 21,940decrease 0 0Acquisition cost 31 December 21,940 21,940
accumulated amortization 1 January 19,790 0amortization relating to mergers and acquisitions 0 19,374amortization for the financial period 814 415accumulated amortization 31 december 20,604 19,790Book value 31 December 1,336 2,150
Other non-current intangible assetsacquisition cost 1 January 78,733 2,433Increase 0 136Increase from mergers and acquisitions 1,074 74,849Transfers between items 18,060 1,315decrease 0 0Acquisition cost 31 December 97,867 78,733
accumulated amortisation 1 January 67,157 955amortization relating to mergers and acquisitions 0 61,582amortization for the financial period 7,838 4,621accumulated amortization 31 december 74,995 67,157Book value 31 December 22,871 11,576
Land and wateracquisition cost 1 January 500 0Increase from mergers and acquisitions 0 500Transfers between items 10 0decrease –1 0Book value 31 December 509 500
Buildings and constructionsacquisition cost 1 January 11,139 0Increase from mergers and acquisitions 0 11,139Transfers between items 709 0decrease 0 0Acquisition cost 31 December 11,848 11,139
accumulated depreciation 1 January 1,610 0deprecation relating to mergers and acquisitions 0 1,188depreciation for the financial period 857 422accumulated depreciation 31 december 2,467 1,610Book value 31 December 9,381 9,529
Machinery and equipmentacquisition cost 1 January 389,910 1,136Increase 0 25Increase from mergers and acquisitions 34,957 365,275Transfers between items 71,650 27,193decrease –981 –3,718Acquisition cost 31 December 495,536 389,910
EUR 1,000 2010 2009
accumulated depreciation 1 January 169,196 298deprecation relating to mergers and acquisitions 0 140,359depreciation for the financial period 66,600 32,238depreciation related to decreases –943 –3,699accumulated depreciation 31 december 234,852 169,196Book value 31 December 260,684 220,715
Other tangible assetsacquisition cost 1 January 873 0Increase from mergers and acquisitions 0 873Acquisition cost 31 December 873 873
Advances paid and construction in progress acquisition cost 1 January 49,350 22Increase 77,261 43,075Increase from mergers and acquisitions 0 41,618decrease –128 –107Transfers between items –100,939 –35,258Acquisition cost 31 December 25,544 49,350
8 Investments
EUR 1,000 2010 2009
Investments in Group companiesBook value 1 January 11,482 122,115Increase 201 1,656decrease –1,005 –112,290Book value 31 December 10,678 11,482
Shares in associated companiesBook value 1 January 991 180Increase 0 876decrease 0 –65Book value 31 December 991 991
Other shares and holdingsBook value 1 January 412 4,411Increase 33 75Increase from mergers and acquisitions 908 355decrease –11 –4,429Book value 31 December 1,343 412
Subordinated loan receivablesBook value 1 January 0 6,380Increase 0 0decrease 0 –6,380Book value 31 December 0 0
9 Receivables from Group companies
EUR 1,000 2010 2009
Sales receivables 592 329Interest receivables 83 43Loan receivables 0 1,500Group account receivables 5,000 3,042Group contribution receivables 3,119 0Total 8,793 4,914
10 Accrued income and deferred expense
EUR 1,000 2010 2009
Trade payables 7,516 4,198Other receivables 7,003 2,413Total 14,519 6,612
Group and parent company holdings
2010 2009
Group companiesdna Store Ltd 100% 100%Huuked Labs Oy 100% 4%ShelCo2 Oy* 0% 100%ShelCo3 Oy* 0% 100%
all Group companies are included in the parent company con-solidated accounts.
Associated companiesSuomen numerot numpac Oy 25% 25%
The associated company is included in the parent company consolidated accounts.
* ShelCo2 Oy and ShelCo3 Oy merged with DNA Ltd on 30 September 2010.
11 Shareholders’ equity
EUR 1,000 2010 2009
Share capital 1 January 72,702 72,375Transfers 0 328Share capital 31 December 72,702 72,702
Share premium reserve 1 January 0 41,689Share premium refund 0 –41,618Transfers 0 –70Share premium reserve 31 December 0 0
Unrestricted equity reserve 1 January 67,710 67,967Increase 17,893 0Transfers 0 –257Unrestricted equity reserve 31 December 85,603 67,710
Retained earnings 1 January 127,330 –6,799dividends paid –32,955 –29,934Treasury shares –588 –287Retained earnings 31 December 93,787 –37,020
Profit/loss for the financial period 59,862 164,350
Total shareholders' equity 311,954 267,742
Statement of distributable earnings on 31 December
EUR 1,000 2010 2009
Retained earnings 93,787 –37,020Unrestricted equity reserve 85,603 67,710Profit/loss for the financial period 59,862 164,350Total distributable funds 239,252 195,040
12 Appropriations
EUR 1,000 2010 2009
appropriations comprise accrued depreciation difference 59,246 58,530
13 Obligatory provisions
EUR 1,000 2010 2009
Obligatory provisions include provisions for estimated decommissioning costs of masts and datacenters 1,380 1,734Provision for onerous contracts 3,165 4,637Pension provision 715 710Restructuring provision 5,361 3,000Total obligatory provisions 10,621 10,080
14 Liabilities to Group companies
EUR 1,000 2010 2009
Trade payables 451 2,280Group contribution payables 0 1,696Other payables 0 131accruals 12,233 5,948Group account payables 0 0Total 12,684 10,054
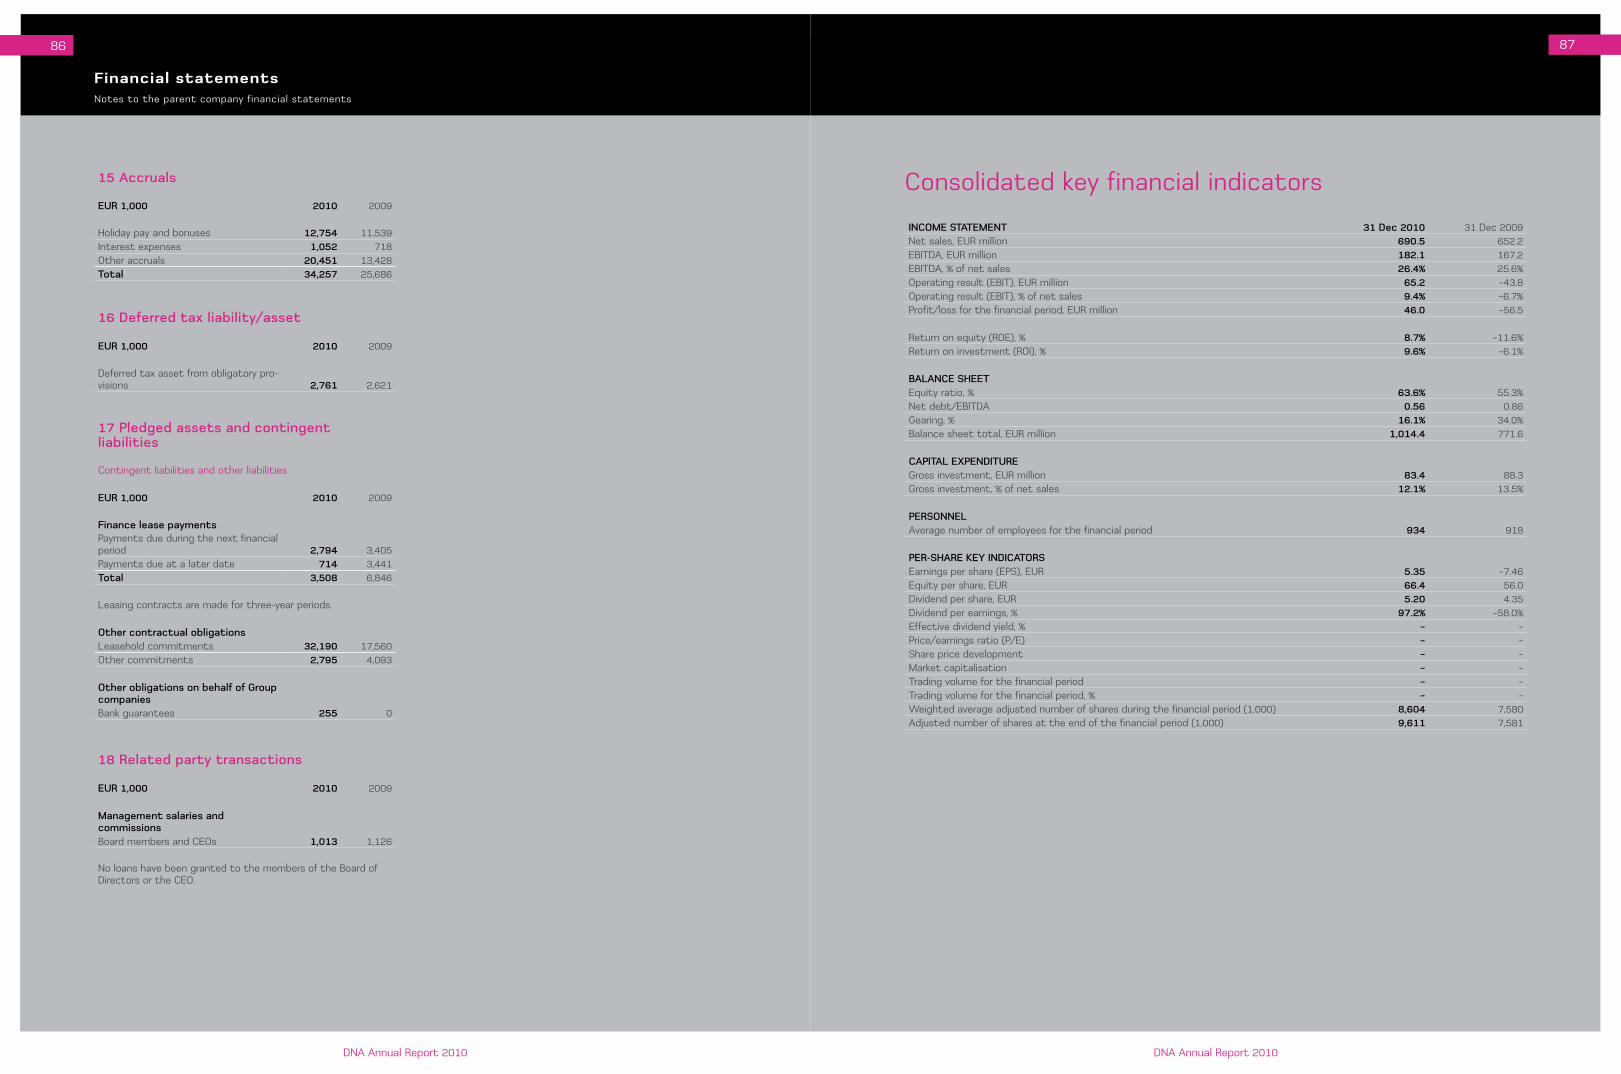
Financial statements
86 87
dna annual Report 2010dna annual Report 2010
notes to the parent company financial statements
15 Accruals
EUR 1,000 2010 2009
Holiday pay and bonuses 12,754 11,539Interest expenses 1,052 718Other accruals 20,451 13,428Total 34,257 25,686
16 Deferred tax liability/asset
EUR 1,000 2010 2009
deferred tax asset from obligatory pro-visions 2,761 2,621
17 Pledged assets and contingent liabilities
Contingent liabilities and other liabilities
EUR 1,000 2010 2009
Finance lease paymentsPayments due during the next financial period 2,794 3,405Payments due at a later date 714 3,441Total 3,508 6,846
Leasing contracts are made for three-year periods.
Other contractual obligationsLeasehold commitments 32,190 17,560Other commitments 2,795 4,093
Other obligations on behalf of Group companiesBank guarantees 255 0
18 Related party transactions
EUR 1,000 2010 2009
Management salaries and commissionsBoard members and CEOs 1,013 1,126
no loans have been granted to the members of the Board of directors or the CEO.
INCOME STATEMENT 31 Dec 2010 31 dec 2009net sales, EUR million 690.5 652.2EBITda, EUR million 182.1 167.2EBITda, % of net sales 26.4% 25.6%Operating result (EBIT), EUR million 65.2 –43.8Operating result (EBIT), % of net sales 9.4% –6.7%Profit/loss for the financial period, EUR million 46.0 –56.5
Return on equity (ROE), % 8.7% –11.6%Return on investment (ROI), % 9.6% –6.1%
BALANCE SHEETEquity ratio, % 63.6% 55.3%net debt/EBITda 0.56 0.86Gearing, % 16.1% 34.0%Balance sheet total, EUR million 1,014.4 771.6
CAPITAL EXPENDITUREGross investment, EUR million 83.4 88.3Gross investment, % of net sales 12.1% 13.5%
PERSONNELaverage number of employees for the financial period 934 918
PER-SHARE KEY INDICATORSEarnings per share (EPS), EUR 5.35 –7.46Equity per share, EUR 66.4 56.0dividend per share, EUR 5.20 4.35dividend per earnings, % 97.2% –58.0%Effective dividend yield, % – –Price/earnings ratio (P/E) – –Share price development – –Market capitalisation – –Trading volume for the financial period – –Trading volume for the financial period, % – –Weighted average adjusted number of shares during the financial period (1,000) 8,604 7,580adjusted number of shares at the end of the financial period (1,000) 9,611 7,581
Consolidated key financial indicators

Financial statements
88 89
dna annual Report 2010dna annual Report 2010
EBITda, EUR = Profit + depreciation, amortisation and impairments
Return on equity (ROE), % =Profit for the financial period
x 100Total shareholders' equity (annual average)
Return on investment (ROI), % =Profit before taxes + interest and other finance expenses
x 100Balance sheet total – non-interest bearing liabilities (annual average)
Equity ratio, % =Shareholders' equity
x 100Balance sheet total – prepayments received
Interest-bearing net liabilities, EUR = Interest-bearing liabilities – liquid assets
Gearing, % =Interest-bearing liabilities – liquid assets
x 100Total shareholders' equity
Calculation of per-share key indicators
Earnings per share, EUR =Profit for the financial period attributable to equity holders of the parent companyWeighted number of shares during the financial period
Equity per share, EUR =Equity attributable to equity holders of the parent companynumber of shares on balance sheet date
dividend per share, EUR =dividend distribution for the financial periodnumber of shares on the balance sheet date
dividend per earnings, % =dividend per share
x 100Earnings per share
Calculation of key indicators Signatures of the Board of directors’ report and financial statements
Vantaa, 7 February 2011
Jarmo Leino Risto SiivolaChairman of the Board of directors Member of the Board of directors
Hannu Isotalo Jukka OttelaMember of the Board of directors Member of the Board of directors
Anssi Soila Anu NissinenMember of the Board of directors Member of the Board of directors
David Nuutinen Riitta TiuraniemiMember of the Board of directors President and CEO
Auditors’ Notean auditors’ report has been issued today on the performed audit.
Vantaa, 9 February 2011
PricewaterhouseCoopers Oyauthorised Public accountants
Pekka Loikkanenauthorised Public accountant