Embed Size (px)
Citation preview
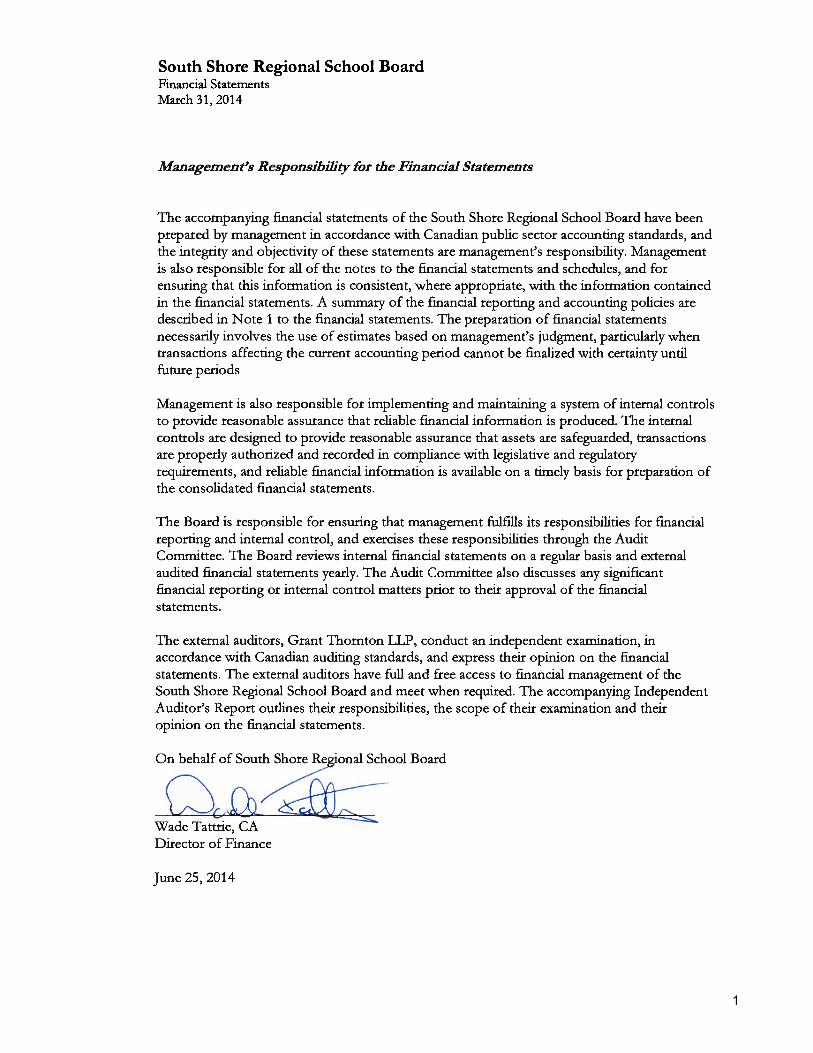
Financial Statements
South Shore Regional School Board
March 31, 2014
Contents
Page Management responsibility for the financial statements 1
Independent Auditor’s Report 2 - 3
Statement of financial position 4
Statement of operations and surplus 5
Statement of changes in net financial assets 6
Statement of cash flows 7
Schedule A – supplementary details of revenues 8
Schedule B – supplementary details of expenditures 9 - 11
Schedule C – supplementary details of tangible capital assets 12
Schedule D – trust funds balance sheet 13
Schedule E – supplementary details of trust funds 14
Notes to the financial statements 15 - 27
1
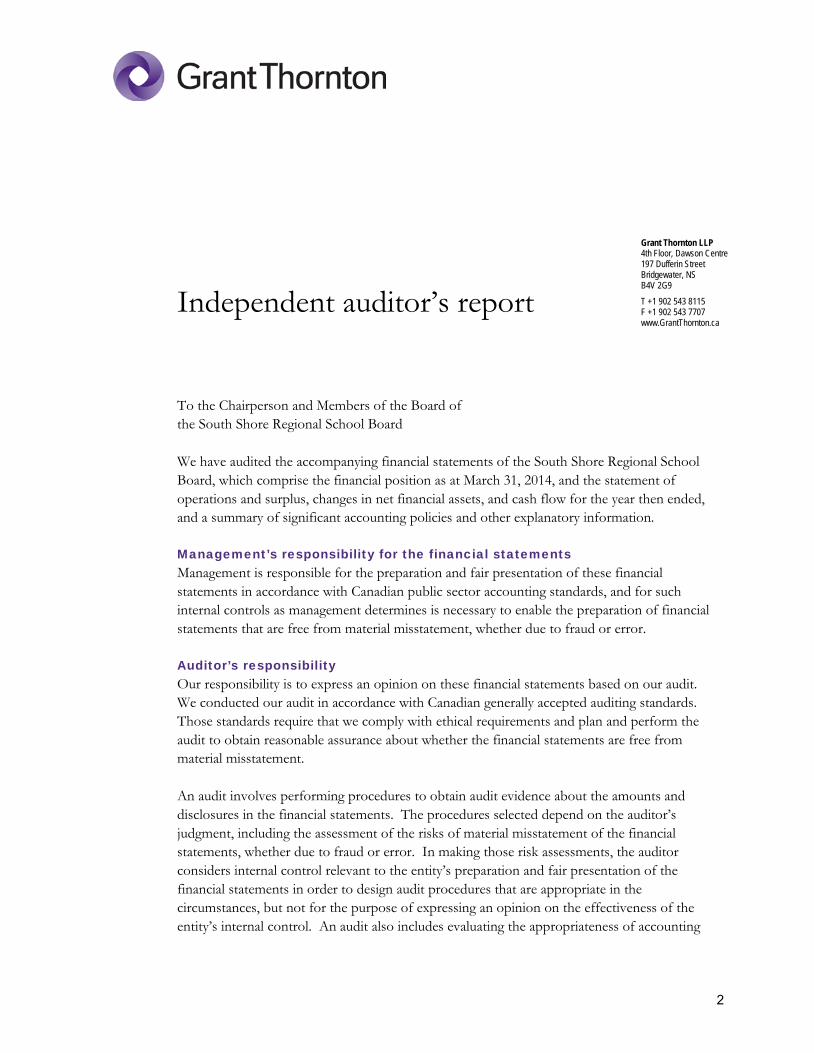
Grant Thornton LLP 4th Floor, Dawson Centre 197 Dufferin Street Bridgewater, NS B4V 2G9 T +1 902 543 8115 F +1 902 543 7707 www.GrantThornton.ca
Independent auditor’s report
To the Chairperson and Members of the Board of the South Shore Regional School Board
We have audited the accompanying financial statements of the South Shore Regional School Board, which comprise the financial position as at March 31, 2014, and the statement of operations and surplus, changes in net financial assets, and cash flow for the year then ended, and a summary of significant accounting policies and other explanatory information.
Management’s responsibility for the financial statements Management is responsible for the preparation and fair presentation of these financial statements in accordance with Canadian public sector accounting standards, and for such internal controls as management determines is necessary to enable the preparation of financial statements that are free from material misstatement, whether due to fraud or error.
Auditor’s responsibility Our responsibility is to express an opinion on these financial statements based on our audit. We conducted our audit in accordance with Canadian generally accepted auditing standards. Those standards require that we comply with ethical requirements and plan and perform the audit to obtain reasonable assurance about whether the financial statements are free from material misstatement.
An audit involves performing procedures to obtain audit evidence about the amounts and disclosures in the financial statements. The procedures selected depend on the auditor’s judgment, including the assessment of the risks of material misstatement of the financial statements, whether due to fraud or error. In making those risk assessments, the auditor considers internal control relevant to the entity’s preparation and fair presentation of the financial statements in order to design audit procedures that are appropriate in the circumstances, but not for the purpose of expressing an opinion on the effectiveness of the entity’s internal control. An audit also includes evaluating the appropriateness of accounting
2
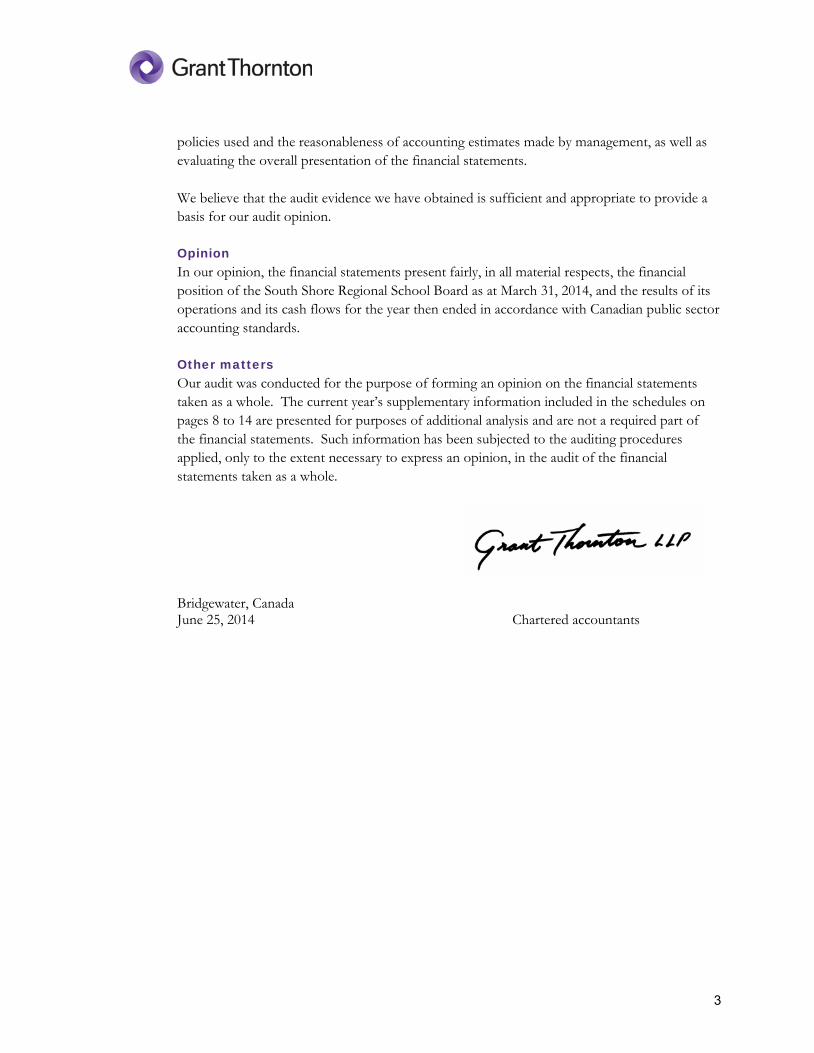
policies used and the reasonableness of accounting estimates made by management, as well as evaluating the overall presentation of the financial statements.
We believe that the audit evidence we have obtained is sufficient and appropriate to provide a basis for our audit opinion.
Opinion In our opinion, the financial statements present fairly, in all material respects, the financial position of the South Shore Regional School Board as at March 31, 2014, and the results of its operations and its cash flows for the year then ended in accordance with Canadian public sector accounting standards.
Other matters Our audit was conducted for the purpose of forming an opinion on the financial statements taken as a whole. The current year’s supplementary information included in the schedules on pages 8 to 14 are presented for purposes of additional analysis and are not a required part of the financial statements. Such information has been subjected to the auditing procedures applied, only to the extent necessary to express an opinion, in the audit of the financial statements taken as a whole.
Bridgewater, Canada June 25, 2014 Chartered accountants
3
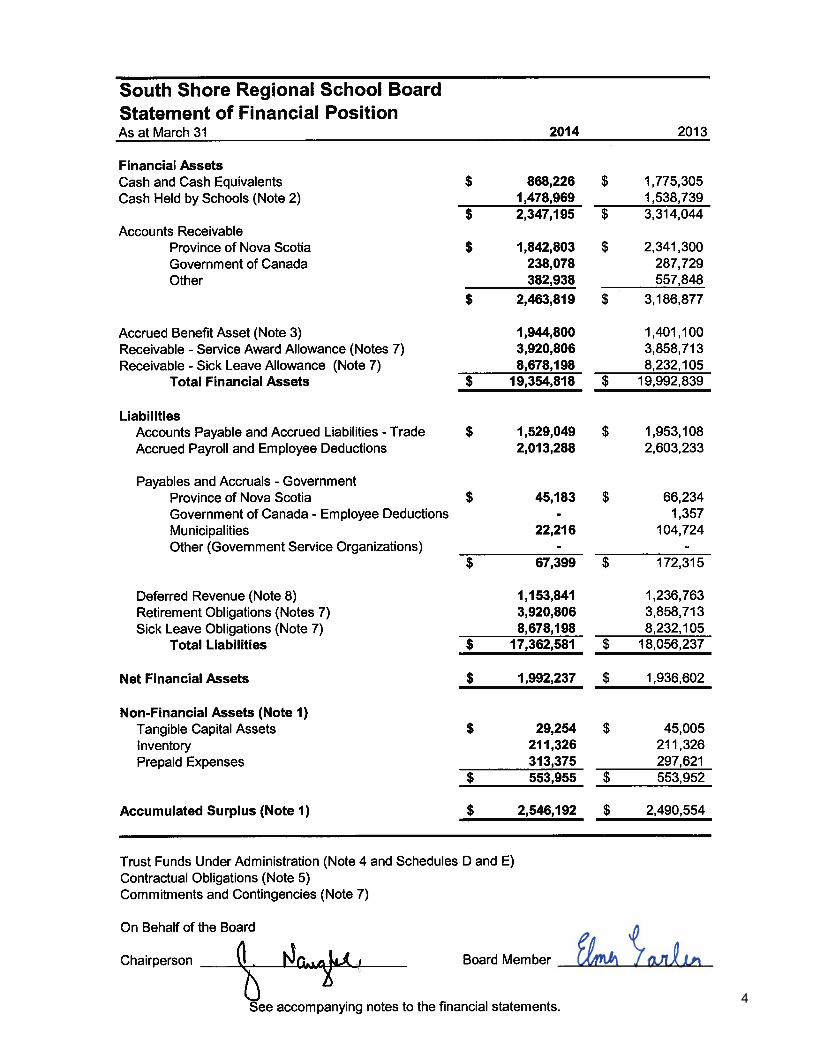
4
See accompanying notes to the financial statements.5
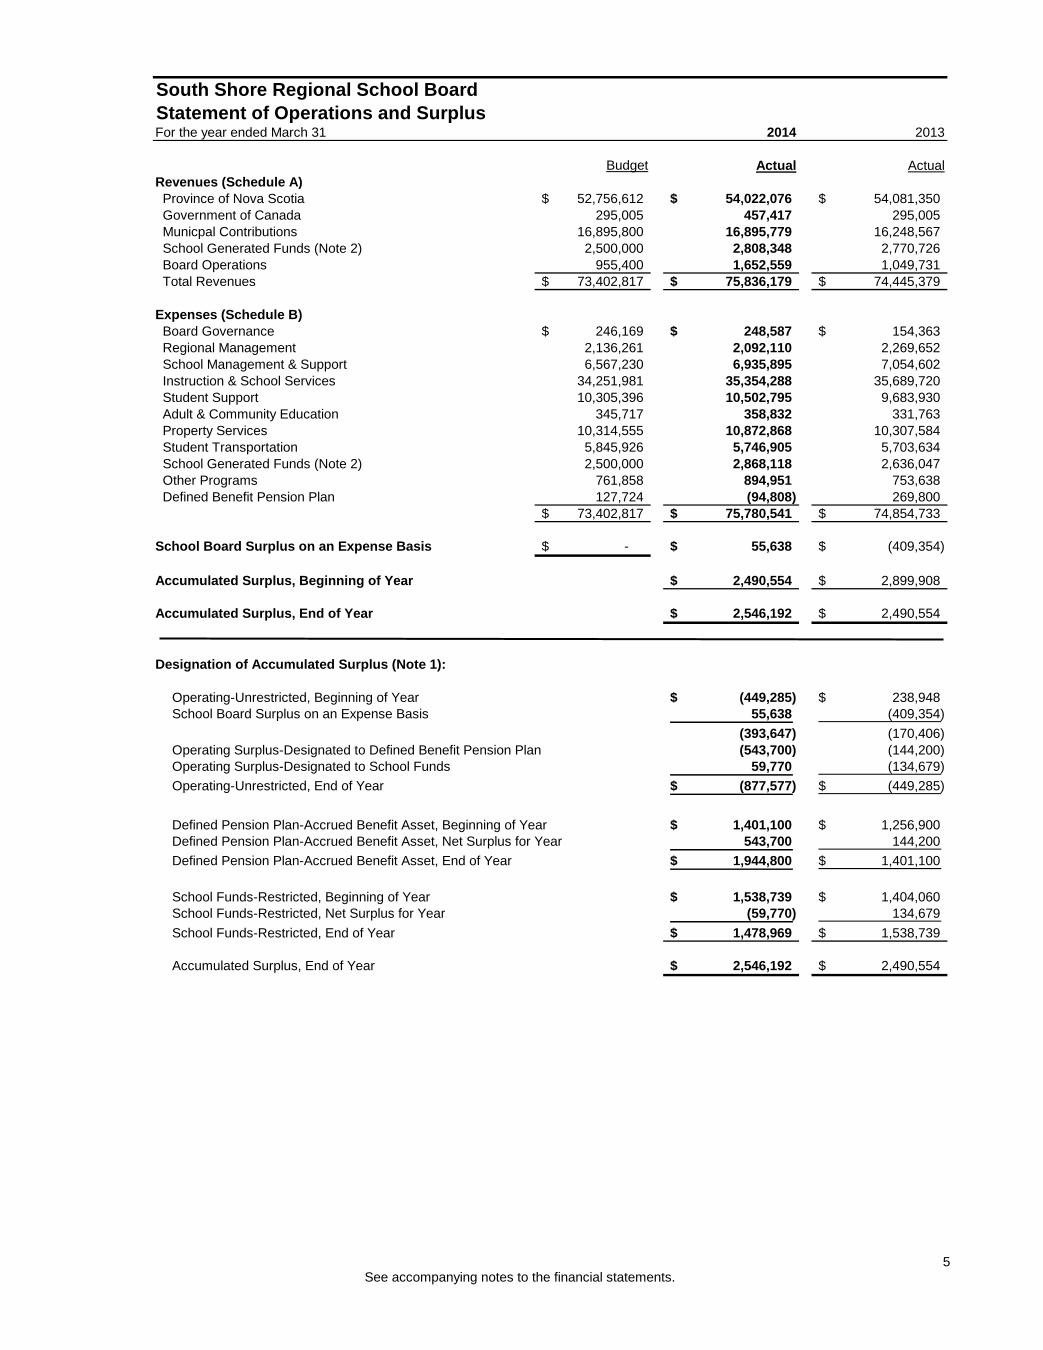
South Shore Regional School BoardStatement of Operations and SurplusFor the year ended March 31 2014 2013
Budget Actual ActualRevenues (Schedule A) Province of Nova Scotia 52,756,612$ 54,022,076$ 54,081,350$ Government of Canada 295,005 457,417 295,005 Municpal Contributions 16,895,800 16,895,779 16,248,567 School Generated Funds (Note 2) 2,500,000 2,808,348 2,770,726 Board Operations 955,400 1,652,559 1,049,731 Total Revenues 73,402,817$ 75,836,179$ 74,445,379$
Expenses (Schedule B) Board Governance 246,169$ 248,587$ 154,363$ Regional Management 2,136,261 2,092,110 2,269,652 School Management & Support 6,567,230 6,935,895 7,054,602 Instruction & School Services 34,251,981 35,354,288 35,689,720 Student Support 10,305,396 10,502,795 9,683,930 Adult & Community Education 345,717 358,832 331,763 Property Services 10,314,555 10,872,868 10,307,584 Student Transportation 5,845,926 5,746,905 5,703,634 School Generated Funds (Note 2) 2,500,000 2,868,118 2,636,047 Other Programs 761,858 894,951 753,638 Defined Benefit Pension Plan 127,724 (94,808) 269,800
73,402,817$ 75,780,541$ 74,854,733$
School Board Surplus on an Expense Basis -$ 55,638$ (409,354)$
Accumulated Surplus, Beginning of Year 2,490,554$ 2,899,908$
Accumulated Surplus, End of Year 2,546,192$ 2,490,554$
Designation of Accumulated Surplus (Note 1):
Operating-Unrestricted, Beginning of Year (449,285)$ 238,948$ School Board Surplus on an Expense Basis 55,638 (409,354)
(393,647) (170,406) Operating Surplus-Designated to Defined Benefit Pension Plan (543,700) (144,200) Operating Surplus-Designated to School Funds 59,770 (134,679) Operating-Unrestricted, End of Year (877,577)$ (449,285)$
Defined Pension Plan-Accrued Benefit Asset, Beginning of Year 1,401,100$ 1,256,900$ Defined Pension Plan-Accrued Benefit Asset, Net Surplus for Year 543,700 144,200 Defined Pension Plan-Accrued Benefit Asset, End of Year 1,944,800$ 1,401,100$
School Funds-Restricted, Beginning of Year 1,538,739$ 1,404,060$ School Funds-Restricted, Net Surplus for Year (59,770) 134,679 School Funds-Restricted, End of Year 1,478,969$ 1,538,739$
Accumulated Surplus, End of Year 2,546,192$ 2,490,554$
See accompanying notes to the financial statements.6
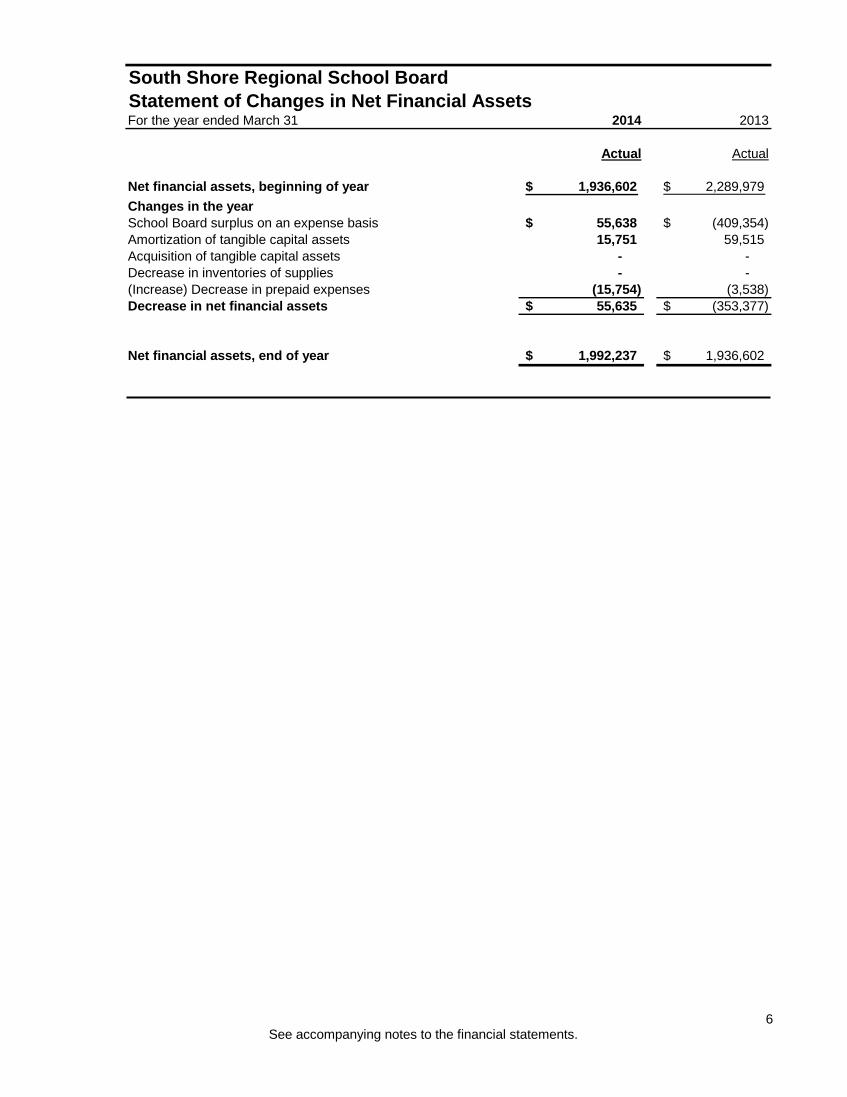
South Shore Regional School BoardStatement of Changes in Net Financial AssetsFor the year ended March 31 2014 2013
Actual Actual
Net financial assets, beginning of year 1,936,602$ 2,289,979$ Changes in the yearSchool Board surplus on an expense basis 55,638$ (409,354)$ Amortization of tangible capital assets 15,751 59,515 Acquisition of tangible capital assets - - Decrease in inventories of supplies - - (Increase) Decrease in prepaid expenses (15,754) (3,538) Decrease in net financial assets 55,635$ (353,377)$
Net financial assets, end of year 1,992,237$ 1,936,602$
See accompanying notes to the financial statements. 7
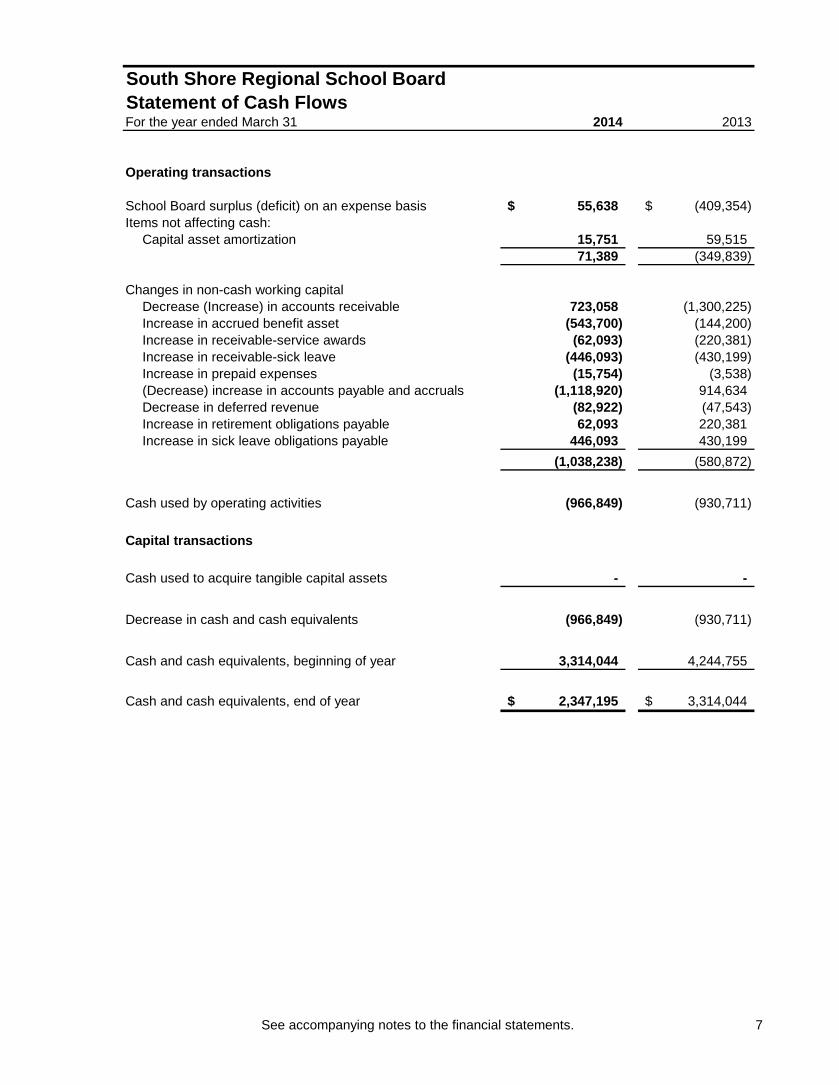
South Shore Regional School BoardStatement of Cash FlowsFor the year ended March 31 2014 2013
Operating transactions
School Board surplus (deficit) on an expense basis 55,638$ (409,354)$ Items not affecting cash:
Capital asset amortization 15,751 59,515 71,389 (349,839)
Changes in non-cash working capitalDecrease (Increase) in accounts receivable 723,058 (1,300,225) Increase in accrued benefit asset (543,700) (144,200) Increase in receivable-service awards (62,093) (220,381) Increase in receivable-sick leave (446,093) (430,199) Increase in prepaid expenses (15,754) (3,538) (Decrease) increase in accounts payable and accruals (1,118,920) 914,634 Decrease in deferred revenue (82,922) (47,543) Increase in retirement obligations payable 62,093 220,381 Increase in sick leave obligations payable 446,093 430,199
(1,038,238) (580,872)
Cash used by operating activities (966,849) (930,711)
Capital transactions
Cash used to acquire tangible capital assets - -
Decrease in cash and cash equivalents (966,849) (930,711)
Cash and cash equivalents, beginning of year 3,314,044 4,244,755
Cash and cash equivalents, end of year 2,347,195$ 3,314,044$
See accompanying notes to the financial statements.8
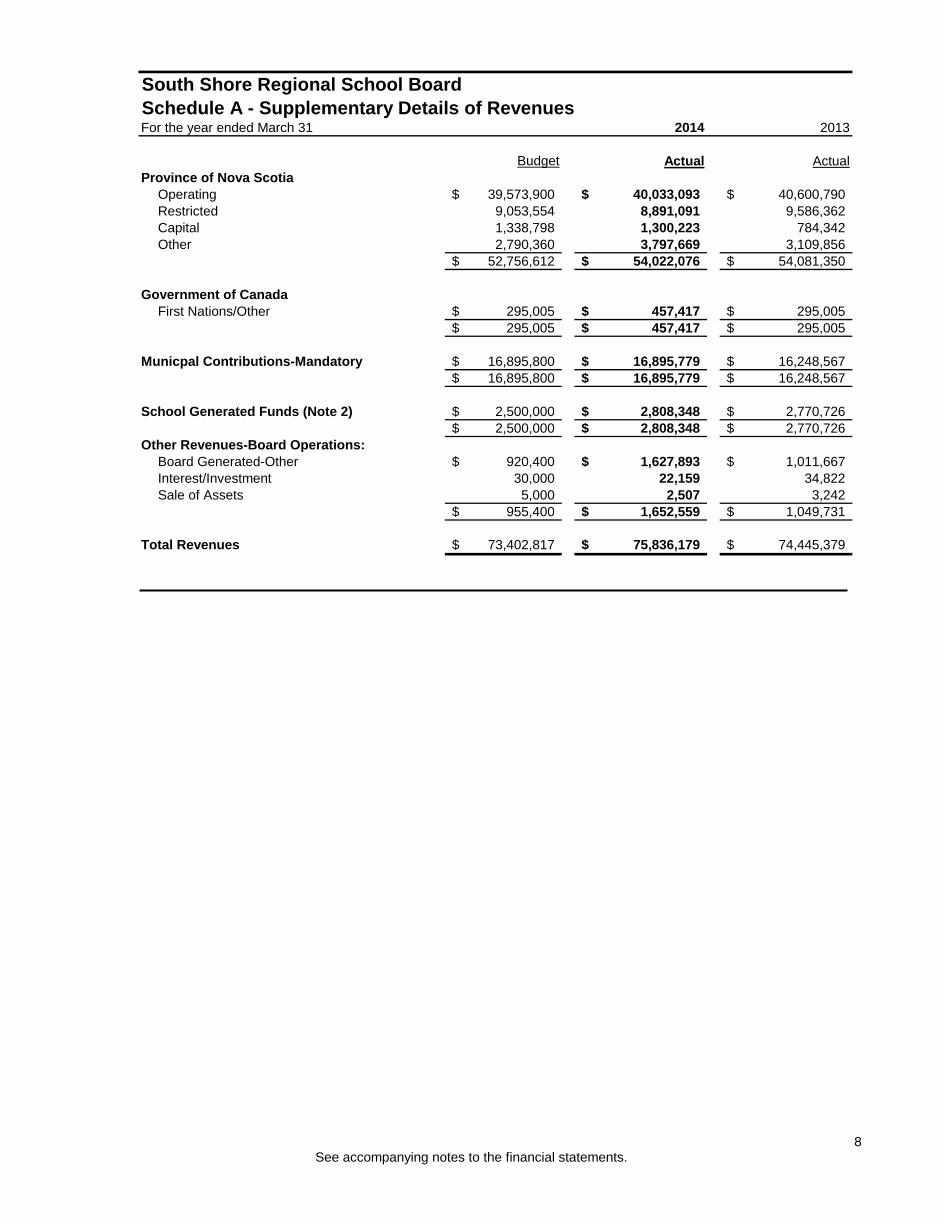
South Shore Regional School BoardSchedule A - Supplementary Details of RevenuesFor the year ended March 31 2014 2013
Budget Actual ActualProvince of Nova Scotia
Operating 39,573,900$ 40,033,093$ 40,600,790$ Restricted 9,053,554 8,891,091 9,586,362 Capital 1,338,798 1,300,223 784,342 Other 2,790,360 3,797,669 3,109,856
52,756,612$ 54,022,076$ 54,081,350$
Government of CanadaFirst Nations/Other 295,005$ 457,417$ 295,005$
295,005$ 457,417$ 295,005$
Municpal Contributions-Mandatory 16,895,800$ 16,895,779$ 16,248,567$ 16,895,800$ 16,895,779$ 16,248,567$
School Generated Funds (Note 2) 2,500,000$ 2,808,348$ 2,770,726$ 2,500,000$ 2,808,348$ 2,770,726$
Other Revenues-Board Operations:Board Generated-Other 920,400$ 1,627,893$ 1,011,667$ Interest/Investment 30,000 22,159 34,822 Sale of Assets 5,000 2,507 3,242
955,400$ 1,652,559$ 1,049,731$
Total Revenues 73,402,817$ 75,836,179$ 74,445,379$
See accompanying notes to the financial statements. 9
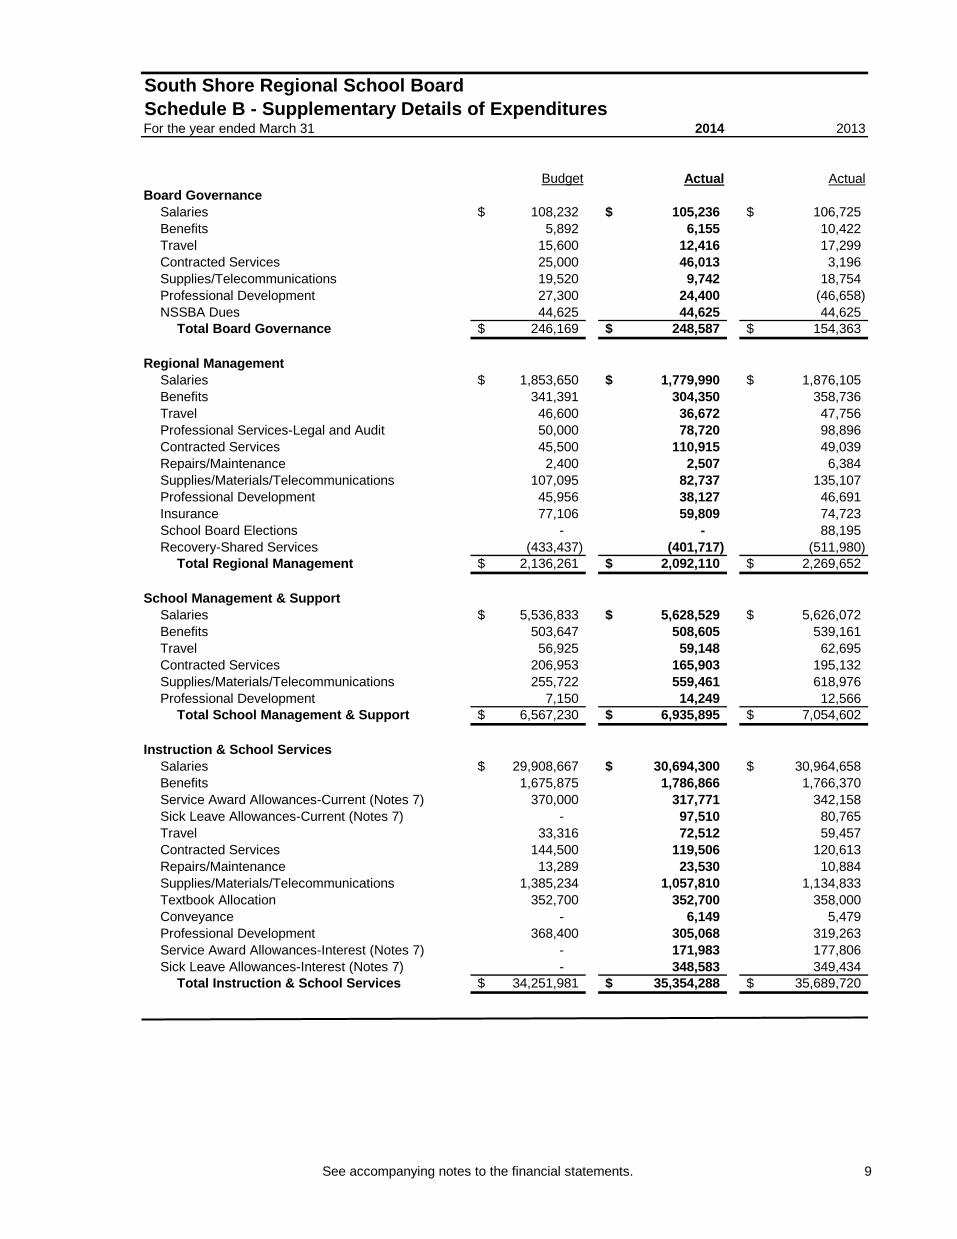
South Shore Regional School BoardSchedule B - Supplementary Details of ExpendituresFor the year ended March 31 2014 2013
Budget Actual ActualBoard Governance
Salaries 108,232$ 105,236$ 106,725$ Benefits 5,892 6,155 10,422 Travel 15,600 12,416 17,299 Contracted Services 25,000 46,013 3,196 Supplies/Telecommunications 19,520 9,742 18,754 Professional Development 27,300 24,400 (46,658) NSSBA Dues 44,625 44,625 44,625
Total Board Governance 246,169$ 248,587$ 154,363$
Regional ManagementSalaries 1,853,650$ 1,779,990$ 1,876,105$ Benefits 341,391 304,350 358,736 Travel 46,600 36,672 47,756 Professional Services-Legal and Audit 50,000 78,720 98,896 Contracted Services 45,500 110,915 49,039 Repairs/Maintenance 2,400 2,507 6,384 Supplies/Materials/Telecommunications 107,095 82,737 135,107 Professional Development 45,956 38,127 46,691 Insurance 77,106 59,809 74,723 School Board Elections - - 88,195 Recovery-Shared Services (433,437) (401,717) (511,980)
Total Regional Management 2,136,261$ 2,092,110$ 2,269,652$
School Management & SupportSalaries 5,536,833$ 5,628,529$ 5,626,072$ Benefits 503,647 508,605 539,161 Travel 56,925 59,148 62,695 Contracted Services 206,953 165,903 195,132 Supplies/Materials/Telecommunications 255,722 559,461 618,976 Professional Development 7,150 14,249 12,566
Total School Management & Support 6,567,230$ 6,935,895$ 7,054,602$
Instruction & School ServicesSalaries 29,908,667$ 30,694,300$ 30,964,658$ Benefits 1,675,875 1,786,866 1,766,370 Service Award Allowances-Current (Notes 7) 370,000 317,771 342,158 Sick Leave Allowances-Current (Notes 7) - 97,510 80,765 Travel 33,316 72,512 59,457 Contracted Services 144,500 119,506 120,613 Repairs/Maintenance 13,289 23,530 10,884 Supplies/Materials/Telecommunications 1,385,234 1,057,810 1,134,833 Textbook Allocation 352,700 352,700 358,000 Conveyance - 6,149 5,479 Professional Development 368,400 305,068 319,263 Service Award Allowances-Interest (Notes 7) - 171,983 177,806 Sick Leave Allowances-Interest (Notes 7) - 348,583 349,434
Total Instruction & School Services 34,251,981$ 35,354,288$ 35,689,720$
See accompanying notes to the financial statements.10
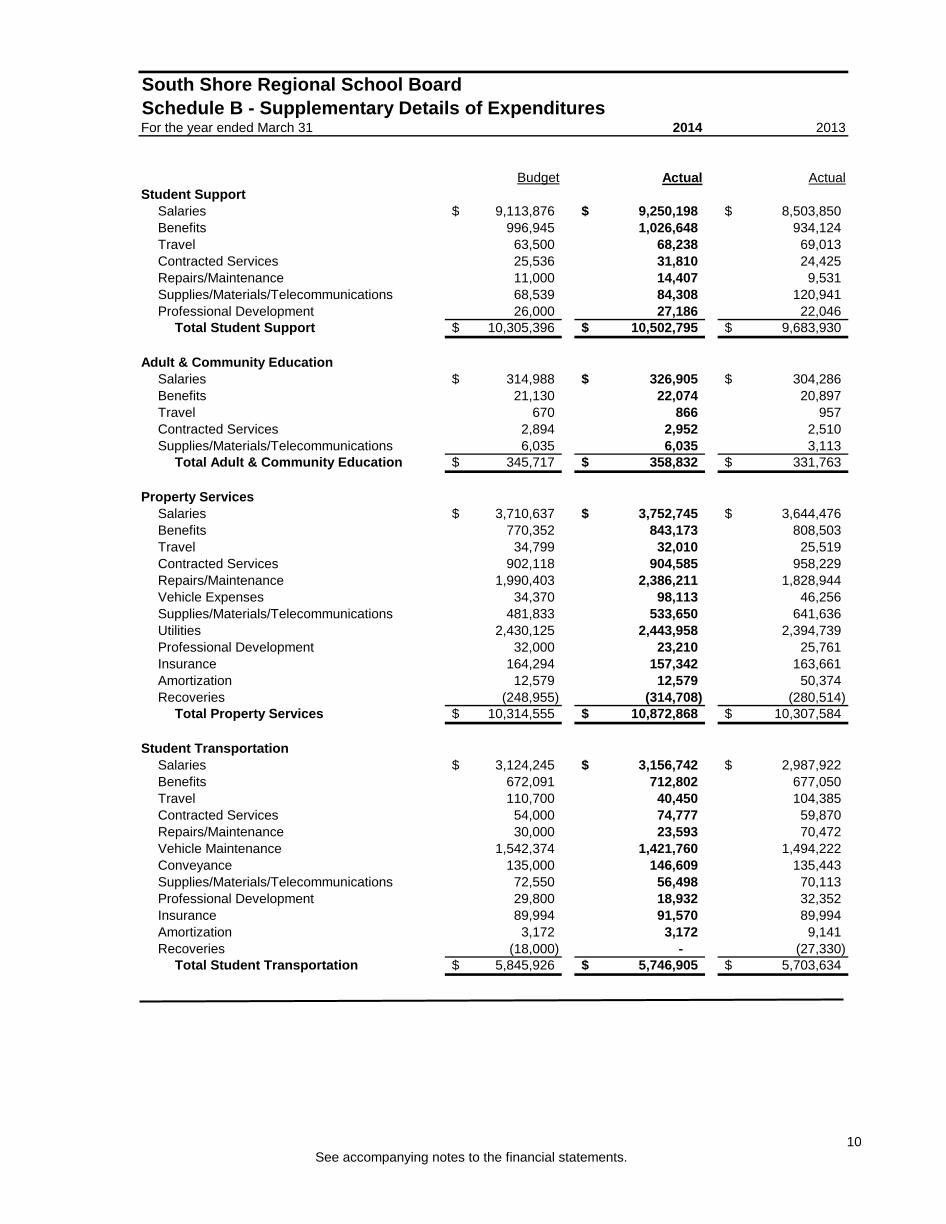
South Shore Regional School BoardSchedule B - Supplementary Details of ExpendituresFor the year ended March 31 2014 2013
Budget Actual ActualStudent Support
Salaries 9,113,876$ 9,250,198$ 8,503,850$ Benefits 996,945 1,026,648 934,124 Travel 63,500 68,238 69,013 Contracted Services 25,536 31,810 24,425 Repairs/Maintenance 11,000 14,407 9,531 Supplies/Materials/Telecommunications 68,539 84,308 120,941 Professional Development 26,000 27,186 22,046
Total Student Support 10,305,396$ 10,502,795$ 9,683,930$
Adult & Community EducationSalaries 314,988$ 326,905$ 304,286$ Benefits 21,130 22,074 20,897 Travel 670 866 957 Contracted Services 2,894 2,952 2,510 Supplies/Materials/Telecommunications 6,035 6,035 3,113
Total Adult & Community Education 345,717$ 358,832$ 331,763$
Property ServicesSalaries 3,710,637$ 3,752,745$ 3,644,476$ Benefits 770,352 843,173 808,503 Travel 34,799 32,010 25,519 Contracted Services 902,118 904,585 958,229 Repairs/Maintenance 1,990,403 2,386,211 1,828,944 Vehicle Expenses 34,370 98,113 46,256 Supplies/Materials/Telecommunications 481,833 533,650 641,636 Utilities 2,430,125 2,443,958 2,394,739 Professional Development 32,000 23,210 25,761 Insurance 164,294 157,342 163,661 Amortization 12,579 12,579 50,374 Recoveries (248,955) (314,708) (280,514)
Total Property Services 10,314,555$ 10,872,868$ 10,307,584$
Student TransportationSalaries 3,124,245$ 3,156,742$ 2,987,922$ Benefits 672,091 712,802 677,050 Travel 110,700 40,450 104,385 Contracted Services 54,000 74,777 59,870 Repairs/Maintenance 30,000 23,593 70,472 Vehicle Maintenance 1,542,374 1,421,760 1,494,222 Conveyance 135,000 146,609 135,443 Supplies/Materials/Telecommunications 72,550 56,498 70,113 Professional Development 29,800 18,932 32,352 Insurance 89,994 91,570 89,994 Amortization 3,172 3,172 9,141 Recoveries (18,000) - (27,330)
Total Student Transportation 5,845,926$ 5,746,905$ 5,703,634$
See accompanying notes to the financial statements. 11
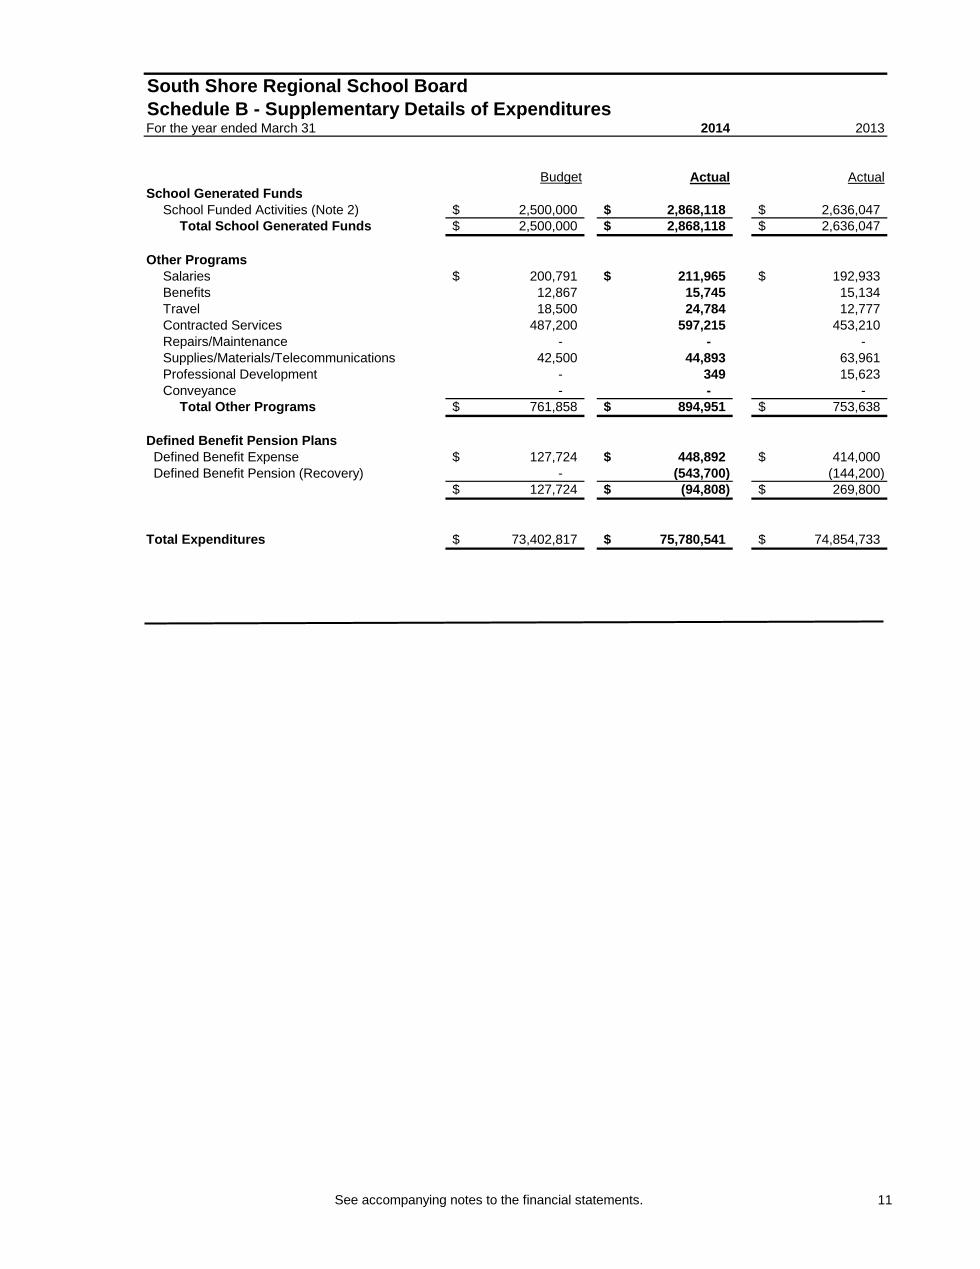
South Shore Regional School BoardSchedule B - Supplementary Details of ExpendituresFor the year ended March 31 2014 2013
Budget Actual ActualSchool Generated Funds
School Funded Activities (Note 2) 2,500,000$ 2,868,118$ 2,636,047$ Total School Generated Funds 2,500,000$ 2,868,118$ 2,636,047$
Other ProgramsSalaries 200,791$ 211,965$ 192,933$ Benefits 12,867 15,745 15,134 Travel 18,500 24,784 12,777 Contracted Services 487,200 597,215 453,210 Repairs/Maintenance - - - Supplies/Materials/Telecommunications 42,500 44,893 63,961 Professional Development - 349 15,623 Conveyance - - -
Total Other Programs 761,858$ 894,951$ 753,638$
Defined Benefit Pension Plans Defined Benefit Expense 127,724$ 448,892$ 414,000$ Defined Benefit Pension (Recovery) - (543,700) (144,200)
127,724$ (94,808)$ 269,800$
Total Expenditures 73,402,817$ 75,780,541$ 74,854,733$
See accompanying notes to the financial statements.12
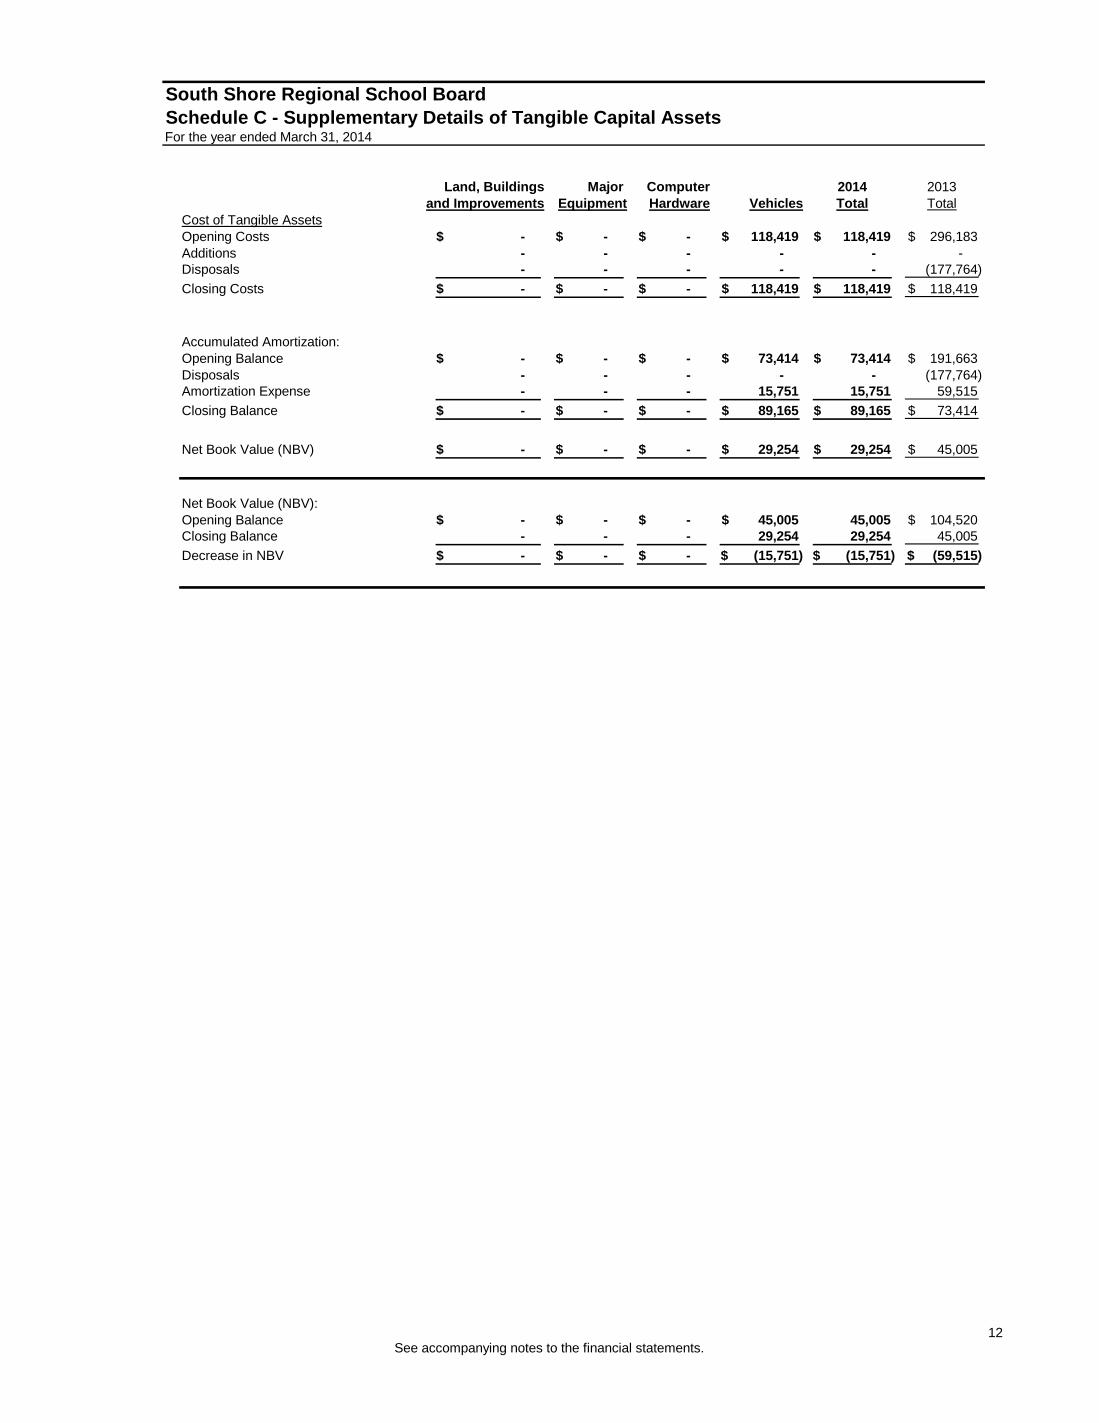
South Shore Regional School BoardSchedule C - Supplementary Details of Tangible Capital AssetsFor the year ended March 31, 2014
Land, Buildings Major Computer 2014 2013and Improvements Equipment Hardware Vehicles Total Total
Cost of Tangible AssetsOpening Costs -$ -$ -$ 118,419$ 118,419$ 296,183$ Additions - - - - - - Disposals - - - - - (177,764) Closing Costs -$ -$ -$ 118,419$ 118,419$ 118,419$
Accumulated Amortization:Opening Balance -$ -$ -$ 73,414$ 73,414$ 191,663$ Disposals - - - - - (177,764) Amortization Expense - - - 15,751 15,751 59,515 Closing Balance -$ -$ -$ 89,165$ 89,165$ 73,414$
Net Book Value (NBV) -$ -$ -$ 29,254$ 29,254$ 45,005$
Net Book Value (NBV):Opening Balance -$ -$ -$ 45,005$ 45,005 104,520$ Closing Balance - - - 29,254 29,254 45,005 Decrease in NBV -$ -$ -$ (15,751)$ (15,751)$ (59,515)$
13
See accompanying notes to the financial statements.14
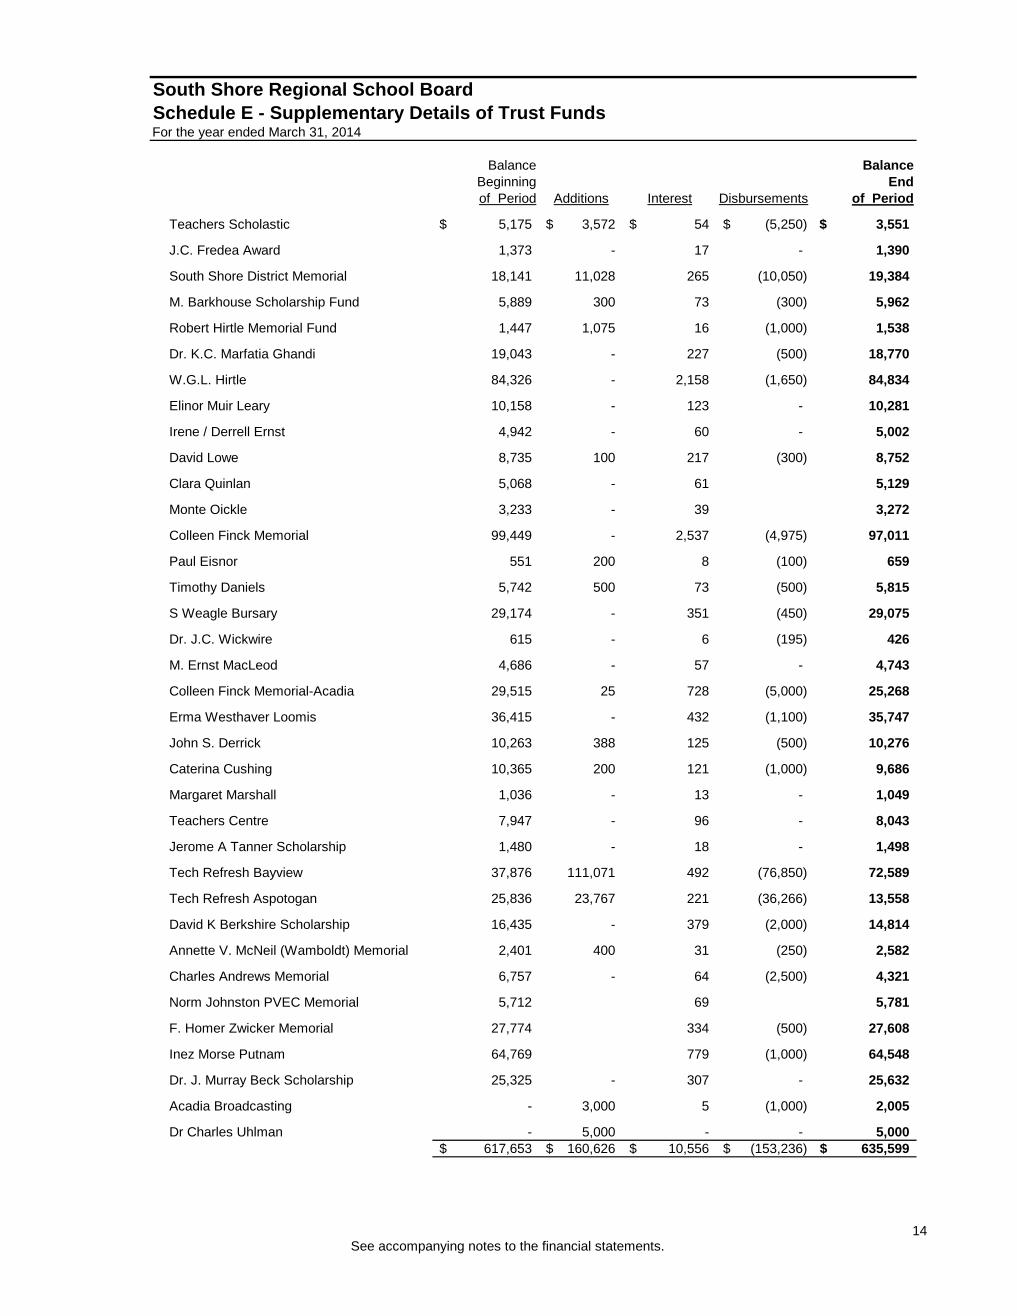
South Shore Regional School BoardSchedule E - Supplementary Details of Trust FundsFor the year ended March 31, 2014
Balance BalanceBeginning Endof Period Additions Interest Disbursements of Period
Teachers Scholastic 5,175$ 3,572$ 54$ (5,250)$ 3,551$
J.C. Fredea Award 1,373 - 17 - 1,390
South Shore District Memorial 18,141 11,028 265 (10,050) 19,384
M. Barkhouse Scholarship Fund 5,889 300 73 (300) 5,962
Robert Hirtle Memorial Fund 1,447 1,075 16 (1,000) 1,538
Dr. K.C. Marfatia Ghandi 19,043 - 227 (500) 18,770
W.G.L. Hirtle 84,326 - 2,158 (1,650) 84,834
Elinor Muir Leary 10,158 - 123 - 10,281
Irene / Derrell Ernst 4,942 - 60 - 5,002
David Lowe 8,735 100 217 (300) 8,752
Clara Quinlan 5,068 - 61 5,129
Monte Oickle 3,233 - 39 3,272
Colleen Finck Memorial 99,449 - 2,537 (4,975) 97,011
Paul Eisnor 551 200 8 (100) 659
Timothy Daniels 5,742 500 73 (500) 5,815
S Weagle Bursary 29,174 - 351 (450) 29,075
Dr. J.C. Wickwire 615 - 6 (195) 426
M. Ernst MacLeod 4,686 - 57 - 4,743
Colleen Finck Memorial-Acadia 29,515 25 728 (5,000) 25,268
Erma Westhaver Loomis 36,415 - 432 (1,100) 35,747
John S. Derrick 10,263 388 125 (500) 10,276
Caterina Cushing 10,365 200 121 (1,000) 9,686
Margaret Marshall 1,036 - 13 - 1,049
Teachers Centre 7,947 - 96 - 8,043
Jerome A Tanner Scholarship 1,480 - 18 - 1,498
Tech Refresh Bayview 37,876 111,071 492 (76,850) 72,589
Tech Refresh Aspotogan 25,836 23,767 221 (36,266) 13,558
David K Berkshire Scholarship 16,435 - 379 (2,000) 14,814
Annette V. McNeil (Wamboldt) Memorial 2,401 400 31 (250) 2,582
Charles Andrews Memorial 6,757 - 64 (2,500) 4,321
Norm Johnston PVEC Memorial 5,712 69 5,781
F. Homer Zwicker Memorial 27,774 334 (500) 27,608
Inez Morse Putnam 64,769 779 (1,000) 64,548
Dr. J. Murray Beck Scholarship 25,325 - 307 - 25,632
Acadia Broadcasting - 3,000 5 (1,000) 2,005
Dr Charles Uhlman - 5,000 - - 5,000617,653$ 160,626$ 10,556$ (153,236)$ 635,599$
South Shore Regional School Board Notes to the Financial StatementsMarch 31, 2014
South Shore Regional School Board is an independent legal entity with an elected governing board as stipulated under the Education Act. The Board provides a full range of educational services for all instructional programs from Grade Primary through Grade 12 at public schools within Lunenburg and Queens Counties. The Board is registered as a charitable organization under the Income Tax Act and therefore, is exempt from income tax and may issue official receipts to donors for income tax purposes in accordance with Board policy.
1. Financial Reporting and Accounting Policies
These financial statements are prepared in accordance with Canadian public sector accounting standards, which for purposes of the School Board’s financial statements are represented by accounting recommendations of the Public Sector Accounting Board (PSAB) of the Canadian Institute of Chartered Accountants (CICA), supplemented where appropriate by other CICA accounting standards or pronouncements.
These financial statements have been prepared using the following significant accounting polices:
Reporting Entity The consolidated statement of financial position is presented using the principles of consolidation prescribed by the Department of Education. Trust funds are not included in the consolidation. For a detailed review the reader should refer to the financial statements of each fund as presented in these financial statements.
Revenues Provincial government transfers for operating and capital purposes are recognized as revenue in the period in which all eligibility criteria and/or stipulations have been met and the amounts are authorized. Any funding received prior to satisfying these conditions is deferred until conditions have been met. When revenue is received without eligibility criteria or stipulations, it is recognized when the transfer(s) from the Province of Nova Scotia and Municipalities are authorized.
All non-government contribution or grant/revenues that are externally restricted such that they must be used for a specified purpose are recognized as revenue in the period in which the resources are used for the purpose or purposes specified. Any externally restricted receipts received before the criteria has been met is reported as a liability until the resources are used for the purpose or purposes specified.
Public Private Partnership and International Student Program revenues are recognized as revenue when the related service is rendered.
Rental income is recognized over the term of the lease.
Investment income is recognized as revenue in the year in which it is earned.
Expenditures Expenditures are the cost of goods and services acquired in the period whether or not payment has been made or invoices recorded. Expenditures are recorded on the accrual basis and include the cost of supply inventories purchased during the year. Provisions are made for probable losses on certain loans, investments, accounts receivable, and contingent liabilities when it is likely that a liability exists and the amount can be reasonably determined. These provisions are updated as estimates are revised, at least annually.
15
South Shore Regional School Board Notes to the Financial StatementsMarch 31, 2014
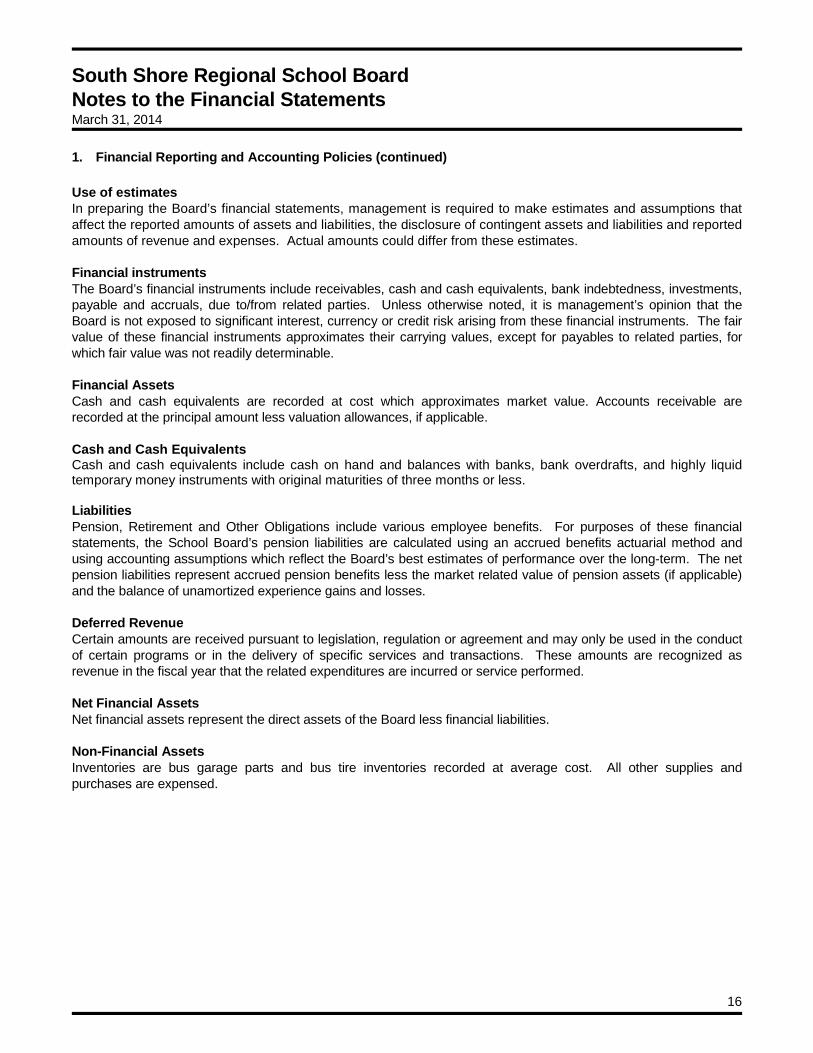
1. Financial Reporting and Accounting Policies (continued)
Use of estimates In preparing the Board’s financial statements, management is required to make estimates and assumptions that affect the reported amounts of assets and liabilities, the disclosure of contingent assets and liabilities and reported amounts of revenue and expenses. Actual amounts could differ from these estimates.
Financial instruments The Board’s financial instruments include receivables, cash and cash equivalents, bank indebtedness, investments, payable and accruals, due to/from related parties. Unless otherwise noted, it is management’s opinion that the Board is not exposed to significant interest, currency or credit risk arising from these financial instruments. The fair value of these financial instruments approximates their carrying values, except for payables to related parties, for which fair value was not readily determinable.
Financial Assets Cash and cash equivalents are recorded at cost which approximates market value. Accounts receivable are recorded at the principal amount less valuation allowances, if applicable.
Cash and Cash Equivalents Cash and cash equivalents include cash on hand and balances with banks, bank overdrafts, and highly liquid temporary money instruments with original maturities of three months or less.
Liabilities Pension, Retirement and Other Obligations include various employee benefits. For purposes of these financial statements, the School Board’s pension liabilities are calculated using an accrued benefits actuarial method and using accounting assumptions which reflect the Board’s best estimates of performance over the long-term. The net pension liabilities represent accrued pension benefits less the market related value of pension assets (if applicable) and the balance of unamortized experience gains and losses.
Deferred Revenue Certain amounts are received pursuant to legislation, regulation or agreement and may only be used in the conduct of certain programs or in the delivery of specific services and transactions. These amounts are recognized as revenue in the fiscal year that the related expenditures are incurred or service performed.
Net Financial Assets Net financial assets represent the direct assets of the Board less financial liabilities.
Non-Financial Assets Inventories are bus garage parts and bus tire inventories recorded at average cost. All other supplies and purchases are expensed.
16

South Shore Regional School Board Notes to the Financial Statements March 31, 2014 1. Financial Reporting and Accounting Policies (continued) Tangible Capital Assets Tangible capital assets have useful lives extending beyond the accounting period, are held for use in the production or supply of goods and services and are not intended for sale in the ordinary course of operations. Tangible capital assets are recorded at net historical cost, when applicable. Tangible capital assets include land, buildings, computer equipment and software, and vehicles. Tangible capital assets do not include intangibles or assets acquired by right. The buildings and school buses financed by the Province of Nova Scotia and transferred to the School Boards are not accounted for in the School Board's financial statements; rather they are included in the Province of Nova Scotia's financial statements. The Board adopted the Province of Nova Scotia's Tangible Capital Assets Accounting Policy thresholds and only those assets meeting the thresholds are recorded as additions. The thresholds and amortization rates (declining balances) as defined in the policy are as follows:
Threshold RatesBuildings $250,000 5%Leasehold Improvements $150,000 5%Computer Hardware $25,000 50%Motor Vehicles $15,000 35%Equipment $50,000 20%Software $250,000 50% Prepaid Expenses and Inventories Prepaid expenses are cash disbursements for goods or services, other than tangible capital assets and inventories of supplies, of which some or all will provide economic benefits in one or more future periods. The prepaid amount is recognized as an expense in the year the good or service is used or consumed. Accumulated Surplus Accumulated Surplus represents the financial assets and non-financial assets of the School Board less liabilities. This represents the accumulated balance of net surplus arising from the operations of the Board and school generated funds. Changes in surplus are as follows:
2014
2013
Operating Surplus, beginning $ 2,490,554
$ 2,899,908 Surplus/(Deficit), current year on an expense basis 55,638
(409,354)
Operating Surplus, end of year $ 2,546,192
$ 2,490,554
Designation of Accumulated Surplus; General Fund - unrestricted $ (877,577)
$ (449,285)
Defined Pension Plan-Accrued Benefit Asset 1,944,800
1,401,100 School General Funds - restricted 1,478,969
1,538,739
Balance, end of year $ 2,546,192
$ 2,490,554
17
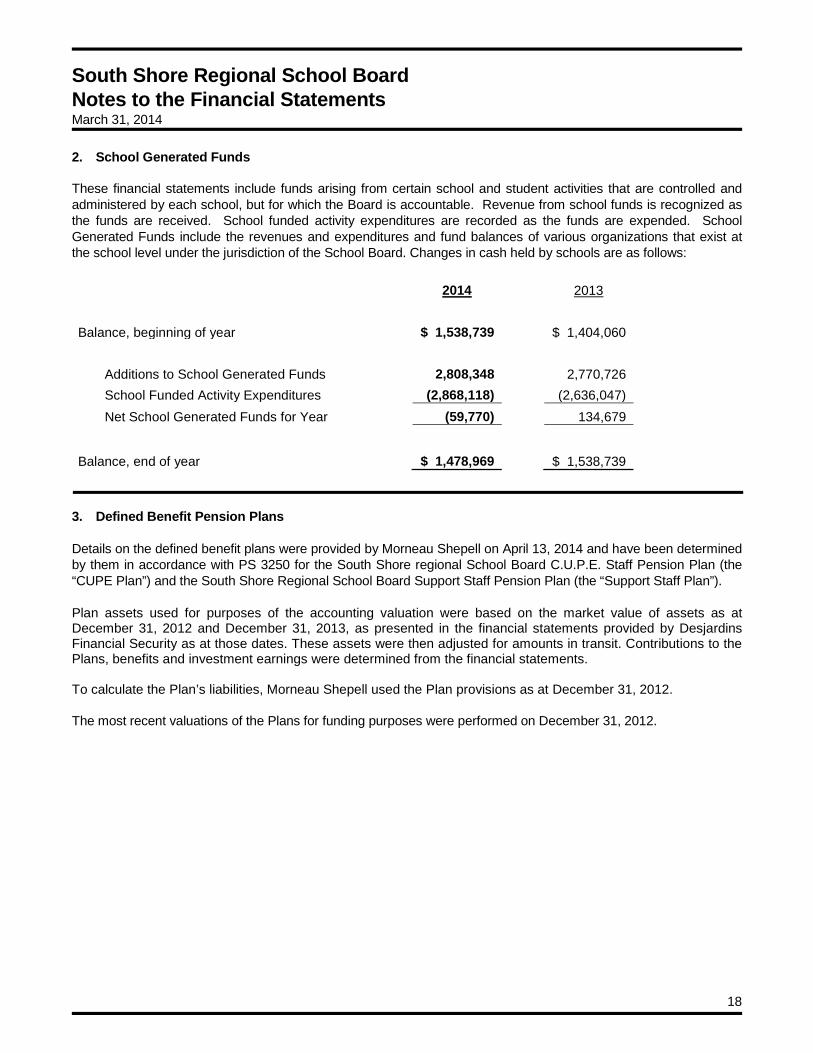
South Shore Regional School Board Notes to the Financial Statements March 31, 2014 2. School Generated Funds These financial statements include funds arising from certain school and student activities that are controlled and administered by each school, but for which the Board is accountable. Revenue from school funds is recognized as the funds are received. School funded activity expenditures are recorded as the funds are expended. School Generated Funds include the revenues and expenditures and fund balances of various organizations that exist at the school level under the jurisdiction of the School Board. Changes in cash held by schools are as follows:
2014
2013
Balance, beginning of year $ 1,538,739
$ 1,404,060 Additions to School Generated Funds 2,808,348
2,770,726
School Funded Activity Expenditures (2,868,118)
(2,636,047) Net School Generated Funds for Year (59,770)
134,679
Balance, end of year $ 1,478,969
$ 1,538,739
3. Defined Benefit Pension Plans Details on the defined benefit plans were provided by Morneau Shepell on April 13, 2014 and have been determined by them in accordance with PS 3250 for the South Shore regional School Board C.U.P.E. Staff Pension Plan (the “CUPE Plan”) and the South Shore Regional School Board Support Staff Pension Plan (the “Support Staff Plan”). Plan assets used for purposes of the accounting valuation were based on the market value of assets as at December 31, 2012 and December 31, 2013, as presented in the financial statements provided by Desjardins Financial Security as at those dates. These assets were then adjusted for amounts in transit. Contributions to the Plans, benefits and investment earnings were determined from the financial statements. To calculate the Plan’s liabilities, Morneau Shepell used the Plan provisions as at December 31, 2012. The most recent valuations of the Plans for funding purposes were performed on December 31, 2012.
18
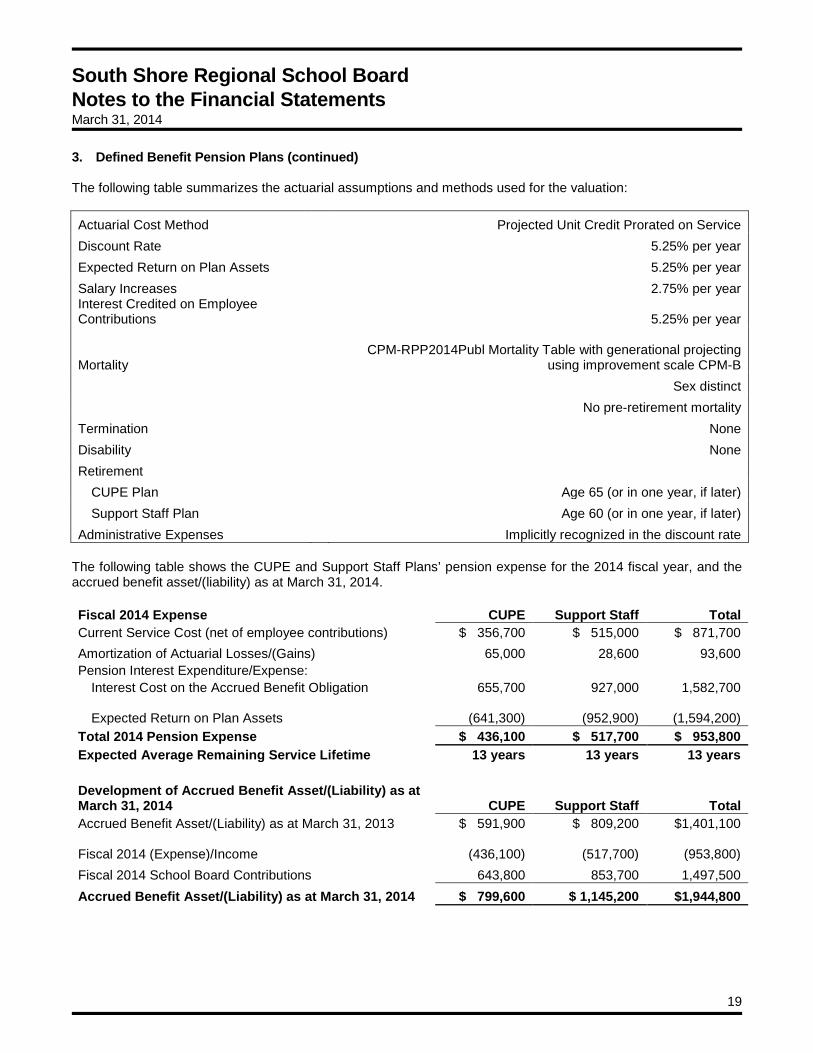
South Shore Regional School Board Notes to the Financial Statements March 31, 2014 3. Defined Benefit Pension Plans (continued) The following table summarizes the actuarial assumptions and methods used for the valuation: Actuarial Cost Method Projected Unit Credit Prorated on Service Discount Rate
5.25% per year
Expected Return on Plan Assets
5.25% per year Salary Increases
2.75% per year
Interest Credited on Employee Contributions
5.25% per year
Mortality
CPM-RPP2014Publ Mortality Table with generational projecting
using improvement scale CPM-B
Sex distinct
No pre-retirement mortality Termination
None
Disability
None Retirement
CUPE Plan
Age 65 (or in one year, if later) Support Staff Plan
Age 60 (or in one year, if later)
Administrative Expenses Implicitly recognized in the discount rate The following table shows the CUPE and Support Staff Plans’ pension expense for the 2014 fiscal year, and the accrued benefit asset/(liability) as at March 31, 2014. Fiscal 2014 Expense CUPE Support Staff Total Current Service Cost (net of employee contributions) $ 356,700 $ 515,000 $ 871,700 Amortization of Actuarial Losses/(Gains) 65,000 28,600 93,600 Pension Interest Expenditure/Expense:
Interest Cost on the Accrued Benefit Obligation 655,700 927,000 1,582,700
Expected Return on Plan Assets
(641,300)
(952,900)
(1,594,200) Total 2014 Pension Expense $ 436,100 $ 517,700 $ 953,800 Expected Average Remaining Service Lifetime 13 years 13 years 13 years
Development of Accrued Benefit Asset/(Liability) as at March 31, 2014 CUPE Support Staff Total Accrued Benefit Asset/(Liability) as at March 31, 2013 $ 591,900 $ 809,200 $1,401,100
Fiscal 2014 (Expense)/Income
(436,100)
(517,700)
(953,800) Fiscal 2014 School Board Contributions 643,800 853,700 1,497,500 Accrued Benefit Asset/(Liability) as at March 31, 2014 $ 799,600 $ 1,145,200 $1,944,800
19
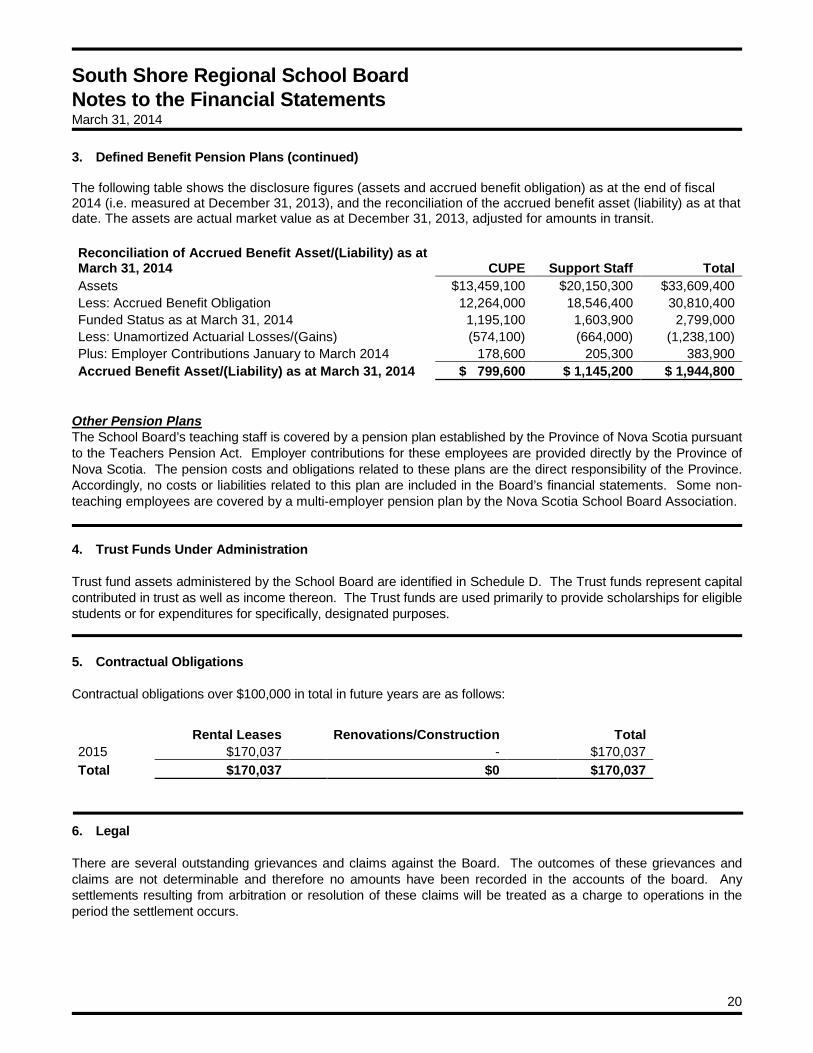
South Shore Regional School Board Notes to the Financial Statements March 31, 2014 3. Defined Benefit Pension Plans (continued) The following table shows the disclosure figures (assets and accrued benefit obligation) as at the end of fiscal 2014 (i.e. measured at December 31, 2013), and the reconciliation of the accrued benefit asset (liability) as at that date. The assets are actual market value as at December 31, 2013, adjusted for amounts in transit. Reconciliation of Accrued Benefit Asset/(Liability) as at March 31, 2014 CUPE Support Staff Total Assets $13,459,100 $20,150,300 $33,609,400 Less: Accrued Benefit Obligation 12,264,000 18,546,400 30,810,400 Funded Status as at March 31, 2014 1,195,100 1,603,900 2,799,000 Less: Unamortized Actuarial Losses/(Gains) (574,100) (664,000) (1,238,100) Plus: Employer Contributions January to March 2014 178,600 205,300 383,900 Accrued Benefit Asset/(Liability) as at March 31, 2014 $ 799,600 $ 1,145,200 $ 1,944,800
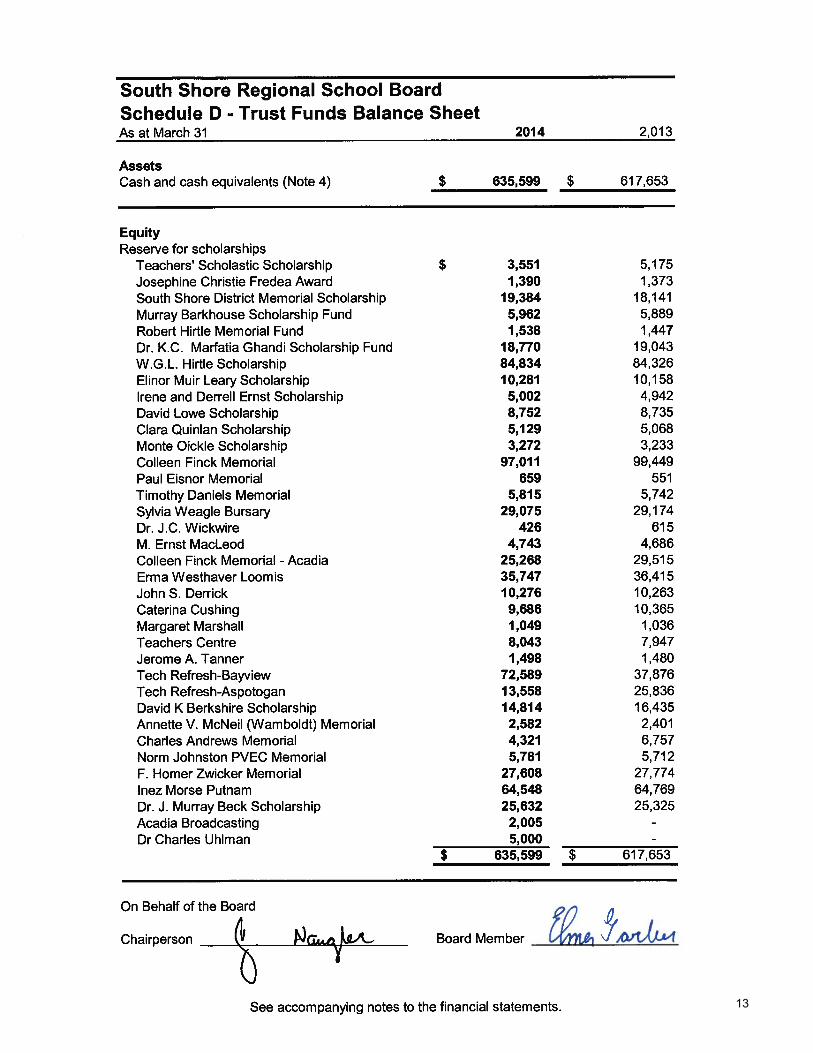
Other Pension Plans The School Board’s teaching staff is covered by a pension plan established by the Province of Nova Scotia pursuant to the Teachers Pension Act. Employer contributions for these employees are provided directly by the Province of Nova Scotia. The pension costs and obligations related to these plans are the direct responsibility of the Province. Accordingly, no costs or liabilities related to this plan are included in the Board’s financial statements. Some non-teaching employees are covered by a multi-employer pension plan by the Nova Scotia School Board Association. 4. Trust Funds Under Administration Trust fund assets administered by the School Board are identified in Schedule D. The Trust funds represent capital contributed in trust as well as income thereon. The Trust funds are used primarily to provide scholarships for eligible students or for expenditures for specifically, designated purposes. 5. Contractual Obligations Contractual obligations over $100,000 in total in future years are as follows:
Rental Leases
Renovations/Construction
Total
2015
$170,037
-
$170,037 Total
$170,037 $0 $170,037
6. Legal There are several outstanding grievances and claims against the Board. The outcomes of these grievances and claims are not determinable and therefore no amounts have been recorded in the accounts of the board. Any settlements resulting from arbitration or resolution of these claims will be treated as a charge to operations in the period the settlement occurs.
20
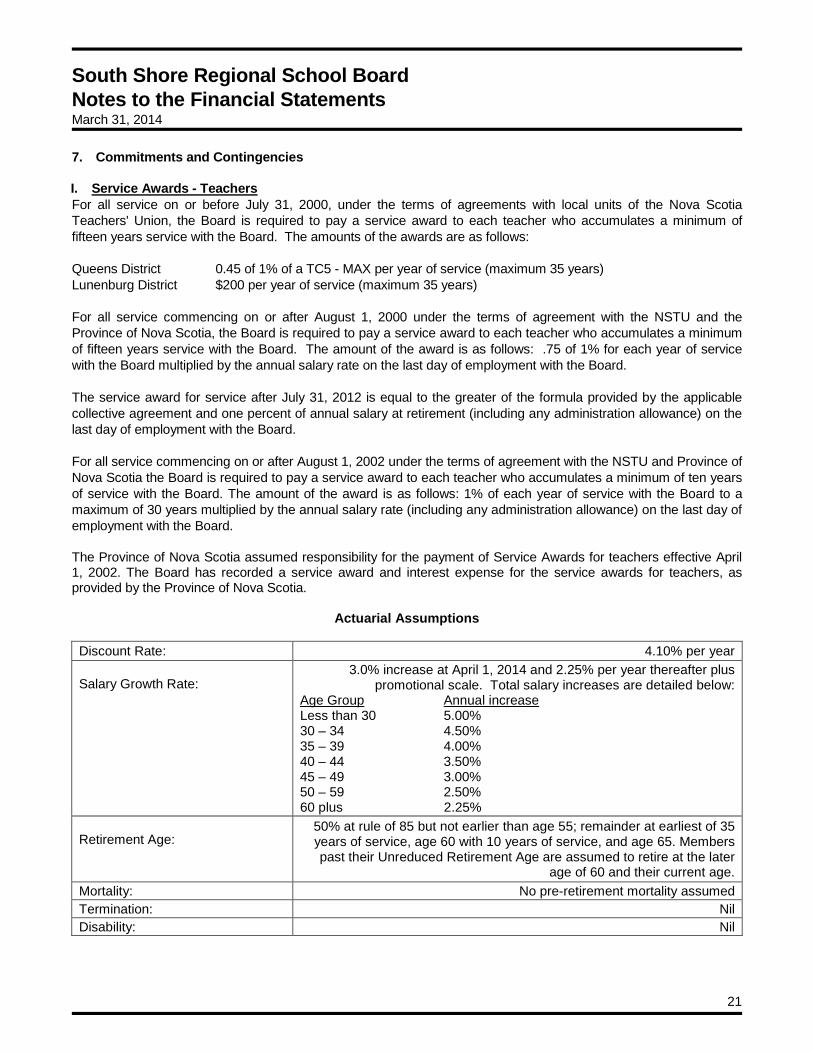
South Shore Regional School Board Notes to the Financial Statements March 31, 2014 7. Commitments and Contingencies I. Service Awards - Teachers For all service on or before July 31, 2000, under the terms of agreements with local units of the Nova Scotia Teachers' Union, the Board is required to pay a service award to each teacher who accumulates a minimum of fifteen years service with the Board. The amounts of the awards are as follows: Queens District 0.45 of 1% of a TC5 - MAX per year of service (maximum 35 years) Lunenburg District $200 per year of service (maximum 35 years) For all service commencing on or after August 1, 2000 under the terms of agreement with the NSTU and the Province of Nova Scotia, the Board is required to pay a service award to each teacher who accumulates a minimum of fifteen years service with the Board. The amount of the award is as follows: .75 of 1% for each year of service with the Board multiplied by the annual salary rate on the last day of employment with the Board. The service award for service after July 31, 2012 is equal to the greater of the formula provided by the applicable collective agreement and one percent of annual salary at retirement (including any administration allowance) on the last day of employment with the Board. For all service commencing on or after August 1, 2002 under the terms of agreement with the NSTU and Province of Nova Scotia the Board is required to pay a service award to each teacher who accumulates a minimum of ten years of service with the Board. The amount of the award is as follows: 1% of each year of service with the Board to a maximum of 30 years multiplied by the annual salary rate (including any administration allowance) on the last day of employment with the Board. The Province of Nova Scotia assumed responsibility for the payment of Service Awards for teachers effective April 1, 2002. The Board has recorded a service award and interest expense for the service awards for teachers, as provided by the Province of Nova Scotia.
Actuarial Assumptions
Discount Rate: 4.10% per year Salary Growth Rate:
3.0% increase at April 1, 2014 and 2.25% per year thereafter plus promotional scale. Total salary increases are detailed below:
Age Group Annual increase Less than 30 5.00% 30 – 34 4.50% 35 – 39 4.00% 40 – 44 3.50% 45 – 49 3.00% 50 – 59 2.50% 60 plus 2.25%
Retirement Age:
50% at rule of 85 but not earlier than age 55; remainder at earliest of 35 years of service, age 60 with 10 years of service, and age 65. Members past their Unreduced Retirement Age are assumed to retire at the later
age of 60 and their current age. Mortality: No pre-retirement mortality assumed Termination: Nil Disability: Nil
21
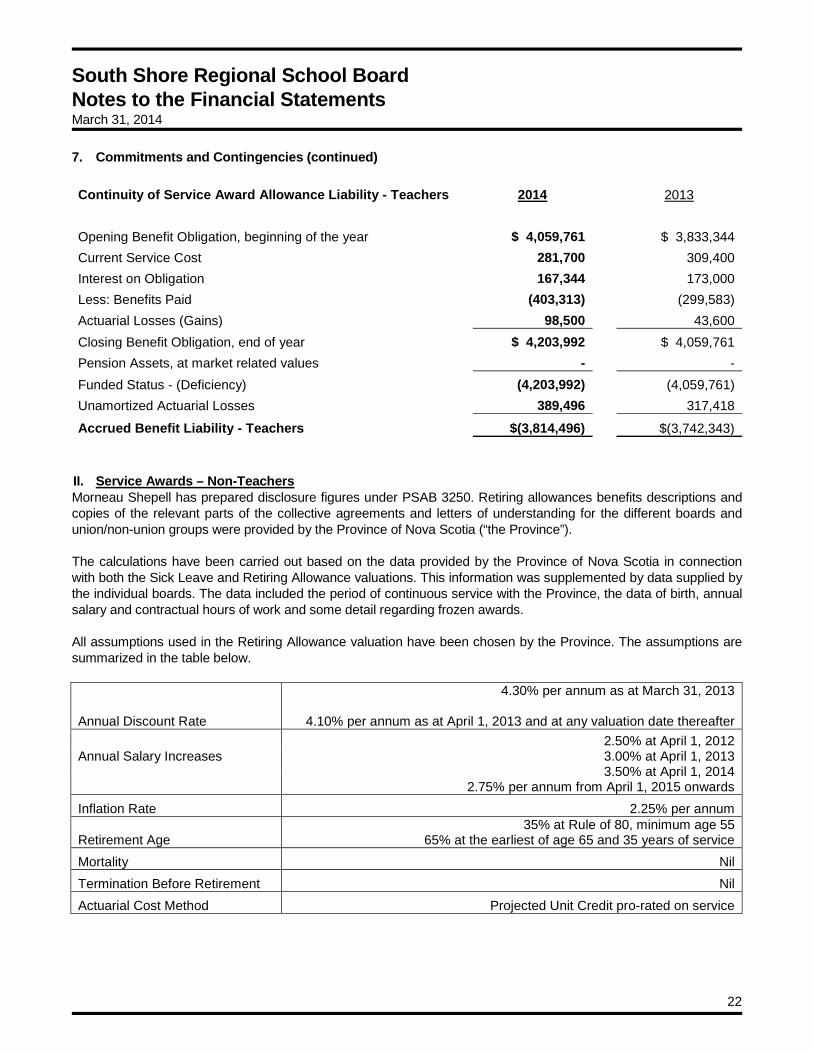
South Shore Regional School Board Notes to the Financial Statements March 31, 2014 7. Commitments and Contingencies (continued) Continuity of Service Award Allowance Liability - Teachers 2014
2013
Opening Benefit Obligation, beginning of the year $ 4,059,761
$ 3,833,344 Current Service Cost 281,700
309,400
Interest on Obligation 167,344
173,000 Less: Benefits Paid (403,313)
(299,583)
Actuarial Losses (Gains) 98,500
43,600 Closing Benefit Obligation, end of year $ 4,203,992
$ 4,059,761
Pension Assets, at market related values -
- Funded Status - (Deficiency) (4,203,992)
(4,059,761)
Unamortized Actuarial Losses 389,496
317,418
Accrued Benefit Liability - Teachers $(3,814,496)
$(3,742,343)
II. Service Awards – Non-Teachers Morneau Shepell has prepared disclosure figures under PSAB 3250. Retiring allowances benefits descriptions and copies of the relevant parts of the collective agreements and letters of understanding for the different boards and union/non-union groups were provided by the Province of Nova Scotia (“the Province”). The calculations have been carried out based on the data provided by the Province of Nova Scotia in connection with both the Sick Leave and Retiring Allowance valuations. This information was supplemented by data supplied by the individual boards. The data included the period of continuous service with the Province, the data of birth, annual salary and contractual hours of work and some detail regarding frozen awards. All assumptions used in the Retiring Allowance valuation have been chosen by the Province. The assumptions are summarized in the table below.
Annual Discount Rate
4.30% per annum as at March 31, 2013
4.10% per annum as at April 1, 2013 and at any valuation date thereafter
Annual Salary Increases
2.50% at April 1, 2012 3.00% at April 1, 2013 3.50% at April 1, 2014
2.75% per annum from April 1, 2015 onwards Inflation Rate 2.25% per annum
Retirement Age 35% at Rule of 80, minimum age 55
65% at the earliest of age 65 and 35 years of service Mortality Nil Termination Before Retirement Nil Actuarial Cost Method Projected Unit Credit pro-rated on service
22

South Shore Regional School Board Notes to the Financial Statements March 31, 2014 7. Commitments and Contingencies (continued) Continuity of Service Award Liability - Non-Teachers
2013-14
2012-13
Opening Benefit Obligation, beginning of the year
$ 118,010
$ 102,322 Current Service Cost
9,467
9,242
Interest on Obligation
4,639
4,806 Other (Past Service, Transfers, etc.)
-
-
Less: Benefits Paid
(23,774)
- Actuarial (Gains) Losses
(574)
1,640
Closing Benefit Obligation, end of year
107,768
118,010 Pension Assets, at market related values
-
-
Funded Status - Surplus (Deficiency)
(107,768)
(118,010) Unamortized Actuarial (Gains) Losses
1,458
1,640
Accrued Benefit Liability - Non-Teachers
$(106,310)
$(116,370)
Summary of Retirement Obligations
2014
2013
Service Awards - Teachers $3,814,496
$3,742,343 Service Awards - Non-Teachers 106,310
116,370
Total Retirement Obligations $3,920,806
$3,858,713
The Board has recognized in these financial statements the liability associated with service awards earned by staff. The Board has recorded a corresponding receivable from the Province of Nova Scotia which has assumed responsibility for the liability up to March 31, 2014. III. Collective Agreements The provincial collective agreement with the NSTU expires July 31, 2015. The local collective agreement with the NSTU expires July 31, 2016. The collective agreement with the NSGEU expires on March 31, 2015. The collective agreement with SEIU expires March 31, 2015. The collective agreement with CUPE expires March 31, 2015.
23
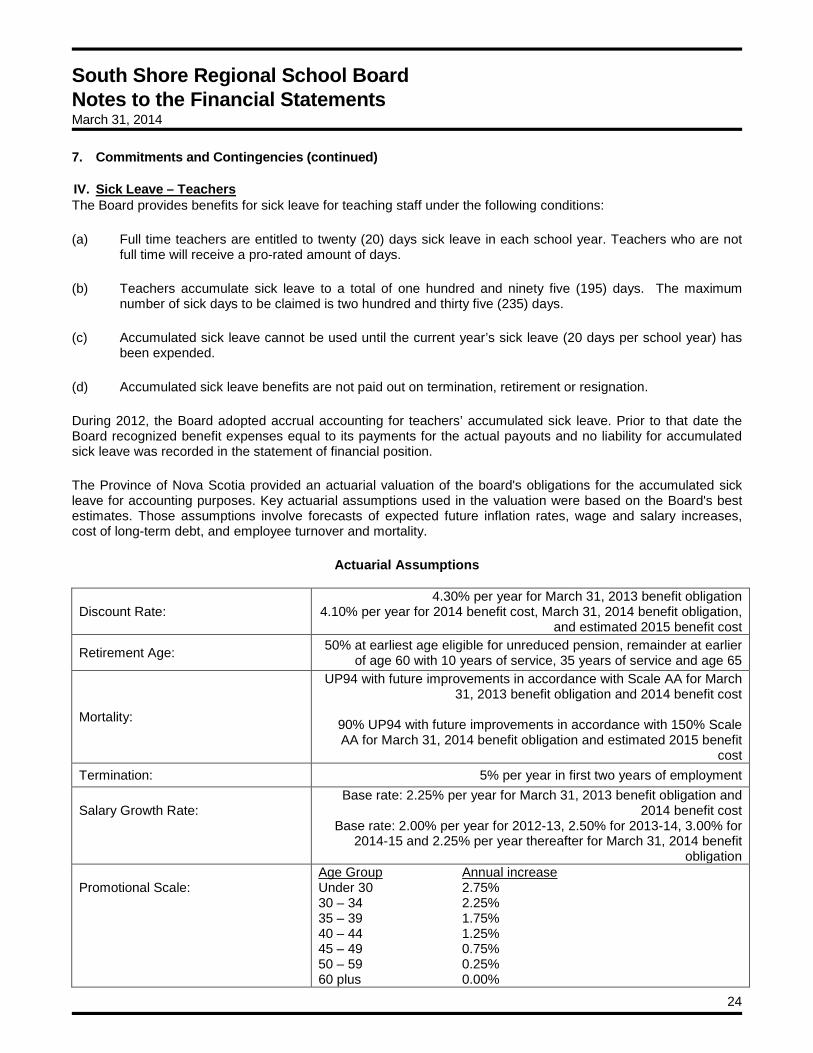
South Shore Regional School Board Notes to the Financial Statements March 31, 2014 7. Commitments and Contingencies (continued) IV. Sick Leave – Teachers The Board provides benefits for sick leave for teaching staff under the following conditions:
(a) Full time teachers are entitled to twenty (20) days sick leave in each school year. Teachers who are not full time will receive a pro-rated amount of days.
(b) Teachers accumulate sick leave to a total of one hundred and ninety five (195) days. The maximum number of sick days to be claimed is two hundred and thirty five (235) days.
(c) Accumulated sick leave cannot be used until the current year’s sick leave (20 days per school year) has been expended.
(d) Accumulated sick leave benefits are not paid out on termination, retirement or resignation.
During 2012, the Board adopted accrual accounting for teachers’ accumulated sick leave. Prior to that date the Board recognized benefit expenses equal to its payments for the actual payouts and no liability for accumulated sick leave was recorded in the statement of financial position.
The Province of Nova Scotia provided an actuarial valuation of the board's obligations for the accumulated sick leave for accounting purposes. Key actuarial assumptions used in the valuation were based on the Board's best estimates. Those assumptions involve forecasts of expected future inflation rates, wage and salary increases, cost of long-term debt, and employee turnover and mortality.
Actuarial Assumptions
Discount Rate: 4.30% per year for March 31, 2013 benefit obligation
4.10% per year for 2014 benefit cost, March 31, 2014 benefit obligation, and estimated 2015 benefit cost
Retirement Age: 50% at earliest age eligible for unreduced pension, remainder at earlier of age 60 with 10 years of service, 35 years of service and age 65
Mortality:
UP94 with future improvements in accordance with Scale AA for March 31, 2013 benefit obligation and 2014 benefit cost
90% UP94 with future improvements in accordance with 150% Scale AA for March 31, 2014 benefit obligation and estimated 2015 benefit
cost Termination: 5% per year in first two years of employment Salary Growth Rate:
Base rate: 2.25% per year for March 31, 2013 benefit obligation and 2014 benefit cost
Base rate: 2.00% per year for 2012-13, 2.50% for 2013-14, 3.00% for 2014-15 and 2.25% per year thereafter for March 31, 2014 benefit
obligation Promotional Scale:
Age Group Annual increase Under 30 2.75% 30 – 34 2.25% 35 – 39 1.75% 40 – 44 1.25% 45 – 49 0.75% 50 – 59 0.25% 60 plus 0.00%
24
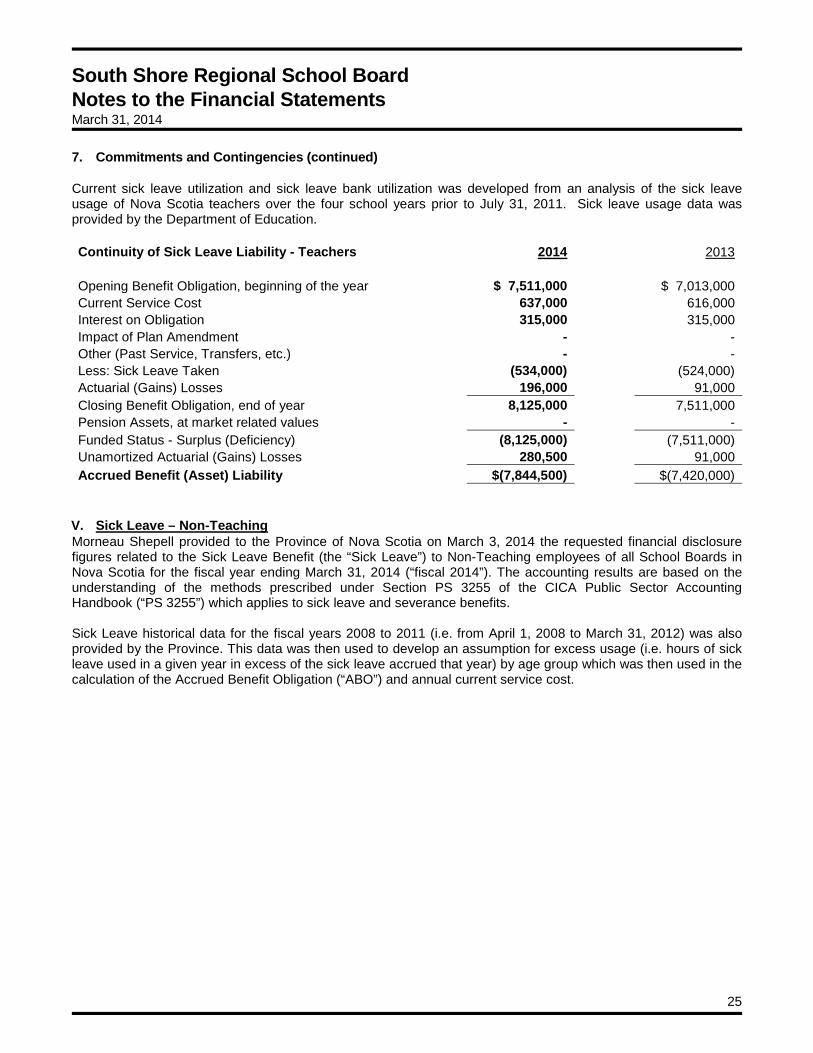
South Shore Regional School Board Notes to the Financial Statements March 31, 2014 7. Commitments and Contingencies (continued) Current sick leave utilization and sick leave bank utilization was developed from an analysis of the sick leave usage of Nova Scotia teachers over the four school years prior to July 31, 2011. Sick leave usage data was provided by the Department of Education. Continuity of Sick Leave Liability - Teachers 2014
2013
Opening Benefit Obligation, beginning of the year $ 7,511,000
$ 7,013,000 Current Service Cost 637,000
616,000
Interest on Obligation 315,000
315,000 Impact of Plan Amendment -
-
Other (Past Service, Transfers, etc.) -
- Less: Sick Leave Taken (534,000)
(524,000)
Actuarial (Gains) Losses 196,000
91,000 Closing Benefit Obligation, end of year 8,125,000
7,511,000
Pension Assets, at market related values -
- Funded Status - Surplus (Deficiency) (8,125,000)
(7,511,000)
Unamortized Actuarial (Gains) Losses 280,500
91,000 Accrued Benefit (Asset) Liability $(7,844,500)
$(7,420,000)
V. Sick Leave – Non-Teaching Morneau Shepell provided to the Province of Nova Scotia on March 3, 2014 the requested financial disclosure figures related to the Sick Leave Benefit (the “Sick Leave”) to Non-Teaching employees of all School Boards in Nova Scotia for the fiscal year ending March 31, 2014 (“fiscal 2014”). The accounting results are based on the understanding of the methods prescribed under Section PS 3255 of the CICA Public Sector Accounting Handbook (“PS 3255”) which applies to sick leave and severance benefits. Sick Leave historical data for the fiscal years 2008 to 2011 (i.e. from April 1, 2008 to March 31, 2012) was also provided by the Province. This data was then used to develop an assumption for excess usage (i.e. hours of sick leave used in a given year in excess of the sick leave accrued that year) by age group which was then used in the calculation of the Accrued Benefit Obligation (“ABO”) and annual current service cost.
25
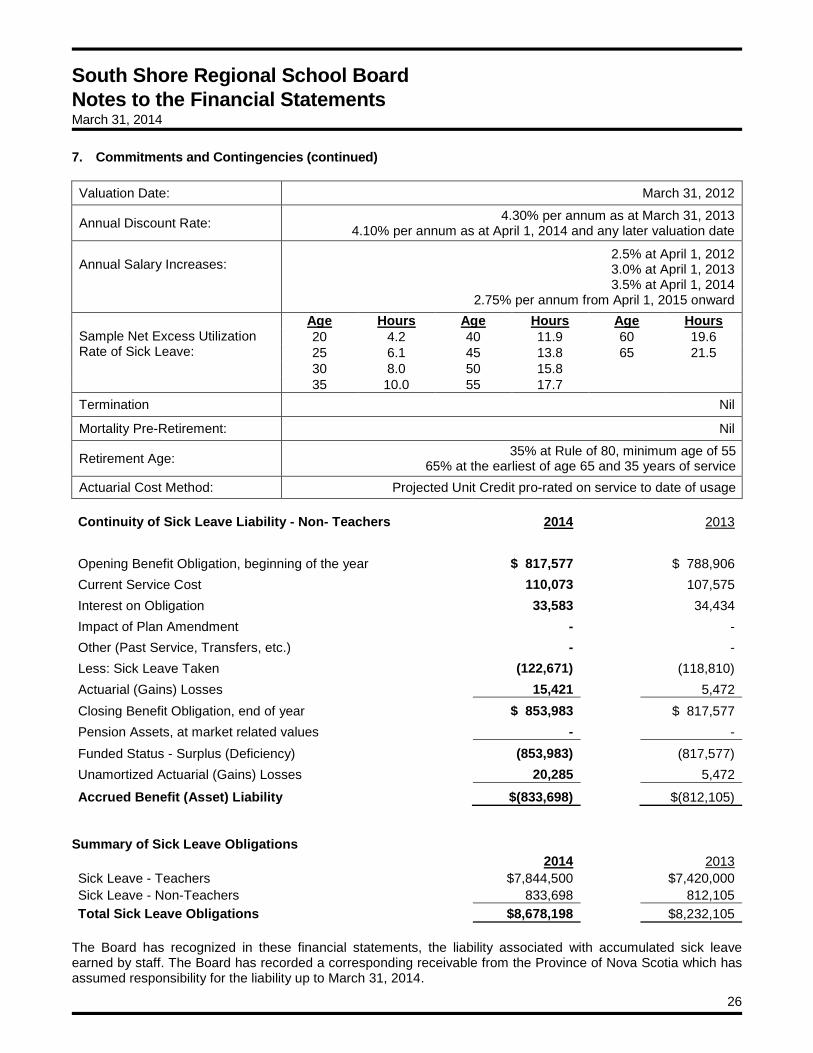
South Shore Regional School Board Notes to the Financial Statements March 31, 2014 7. Commitments and Contingencies (continued) Valuation Date: March 31, 2012
Annual Discount Rate: 4.30% per annum as at March 31, 2013 4.10% per annum as at April 1, 2014 and any later valuation date
Annual Salary Increases:
2.5% at April 1, 2012 3.0% at April 1, 2013 3.5% at April 1, 2014
2.75% per annum from April 1, 2015 onward Sample Net Excess Utilization Rate of Sick Leave:
Age Hours Age Hours Age Hours 20 4.2 40 11.9 60 19.6 25 6.1 45 13.8 65 21.5 30 8.0 50 15.8 35 10.0 55 17.7
Termination Nil
Mortality Pre-Retirement: Nil
Retirement Age: 35% at Rule of 80, minimum age of 55 65% at the earliest of age 65 and 35 years of service
Actuarial Cost Method: Projected Unit Credit pro-rated on service to date of usage Continuity of Sick Leave Liability - Non- Teachers 2014
2013
Opening Benefit Obligation, beginning of the year $ 817,577
$ 788,906 Current Service Cost 110,073
107,575
Interest on Obligation 33,583
34,434 Impact of Plan Amendment -
-
Other (Past Service, Transfers, etc.) -
- Less: Sick Leave Taken (122,671)
(118,810)
Actuarial (Gains) Losses 15,421
5,472 Closing Benefit Obligation, end of year $ 853,983
$ 817,577
Pension Assets, at market related values -
- Funded Status - Surplus (Deficiency) (853,983)
(817,577)
Unamortized Actuarial (Gains) Losses 20,285
5,472
Accrued Benefit (Asset) Liability $(833,698)
$(812,105) Summary of Sick Leave Obligations
2014
2013
Sick Leave - Teachers $7,844,500
$7,420,000 Sick Leave - Non-Teachers 833,698
812,105
Total Sick Leave Obligations $8,678,198
$8,232,105
The Board has recognized in these financial statements, the liability associated with accumulated sick leave earned by staff. The Board has recorded a corresponding receivable from the Province of Nova Scotia which has assumed responsibility for the liability up to March 31, 2014.
26
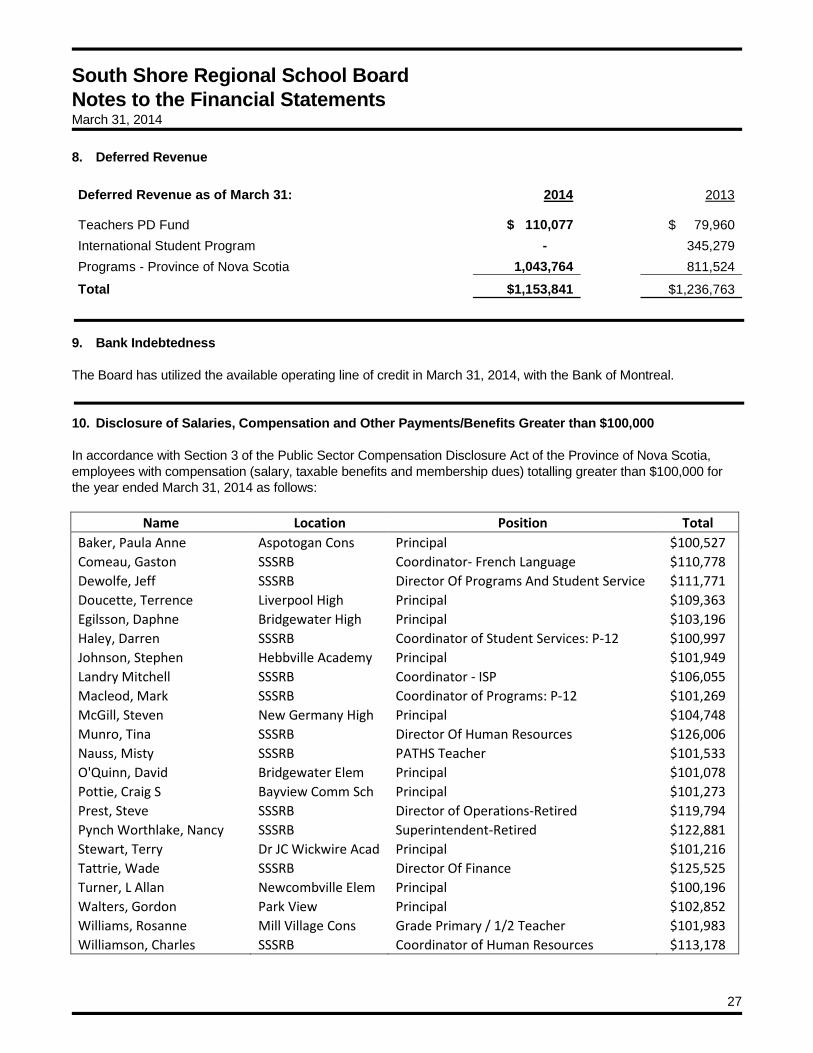
South Shore Regional School Board Notes to the Financial Statements March 31, 2014 8. Deferred Revenue Deferred Revenue as of March 31: 2014
2013
Teachers PD Fund $ 110,077
$ 79,960 International Student Program -
345,279
Programs - Province of Nova Scotia 1,043,764
811,524
Total $1,153,841
$1,236,763
9. Bank Indebtedness The Board has utilized the available operating line of credit in March 31, 2014, with the Bank of Montreal. 10. Disclosure of Salaries, Compensation and Other Payments/Benefits Greater than $100,000 In accordance with Section 3 of the Public Sector Compensation Disclosure Act of the Province of Nova Scotia, employees with compensation (salary, taxable benefits and membership dues) totalling greater than $100,000 for the year ended March 31, 2014 as follows:
Name Location Position Total Baker, Paula Anne Aspotogan Cons Principal $100,527 Comeau, Gaston SSSRB Coordinator- French Language $110,778 Dewolfe, Jeff SSSRB Director Of Programs And Student Service $111,771 Doucette, Terrence Liverpool High Principal $109,363 Egilsson, Daphne Bridgewater High Principal $103,196 Haley, Darren SSSRB Coordinator of Student Services: P-12 $100,997 Johnson, Stephen Hebbville Academy Principal $101,949 Landry Mitchell SSSRB Coordinator - ISP $106,055 Macleod, Mark SSSRB Coordinator of Programs: P-12 $101,269 McGill, Steven New Germany High Principal $104,748 Munro, Tina SSSRB Director Of Human Resources $126,006 Nauss, Misty SSSRB PATHS Teacher $101,533 O'Quinn, David Bridgewater Elem Principal $101,078 Pottie, Craig S Bayview Comm Sch Principal $101,273 Prest, Steve SSSRB Director of Operations-Retired $119,794 Pynch Worthlake, Nancy SSSRB Superintendent-Retired $122,881 Stewart, Terry Dr JC Wickwire Acad Principal $101,216 Tattrie, Wade SSSRB Director Of Finance $125,525 Turner, L Allan Newcombville Elem Principal $100,196 Walters, Gordon Park View Principal $102,852 Williams, Rosanne Mill Village Cons Grade Primary / 1/2 Teacher $101,983 Williamson, Charles SSSRB Coordinator of Human Resources $113,178
27