Embed Size (px)
Citation preview

ContactMerck KGaA, Darmstadt, GermanyInvestor RelationsFrankfurter Strasse 25064293 DarmstadtGermanyPhone: +49 6151 72 3321e-mail: [email protected]
WKN: 659990ISIN: DE0006599905Ticker Symbol: MRK
Financial Statements Q1 2020 – Q2 2021
Content
1 Income statements 1.1 Group, quarterly 1.2 Healthcare, quarterly 1.3 Life Science, quarterly 1.4 Electronics, quarterly 1.5 Corporate/Others, quarterly 1.6 Financial result, quarterly
2 Cash flow statement
3 Balance sheet

EBITDA pre Merck KGaA, Darmstadt, Germany
€ million Q1 Q2 H1 Q3 9M Q4 H2 FY Q1 Q2 H1 Q3 9M Q4 H2 FY Q1 Q2 H1 Q3 9M Q4 H2 FY
Healthcare 472,1 374,0 846,2 896,0 1 742,1 525,1 1 421,1 2 267,3 532,9 581,0 1 113,9 12,9% 55,3% 31,6%in % of net sales 27,8% 24,9% 26,4% 52,7% 35,5% 30,2% 41,3% 34,1% 32,5% 32,5% 32,5%
Life Science 552,7 569,1 1 121,8 630,2 1 752,0 653,1 1 283,3 2 405,0 793,2 829,0 1 622,2 43,5% 45,7% 44,6%in % of net sales 31,2% 31,5% 31,4% 33,0% 31,9% 32,2% 32,6% 32,0% 37,2% 37,3% 37,2%
Electronics 285,5 238,3 523,8 254,2 778,0 246,1 500,4 1 024,2 273,8 258,0 531,9 -4,1% 8,3% 1,5%in % of net sales 31,7% 29,3% 30,6% 30,4% 30,5% 29,6% 29,6% 30,3% 31,8% 30,1% 30,9%
Corporate/Others -129,1 -107,2 -236,2 -79,7 -315,9 -179,1 -258,8 -495,1 -89,3 -91,8 -181,1 -30,8% -14,4% -23,3%Group 1 181,3 1 074,2 2 255,5 1 700,7 3 956,2 1 245,2 2 945,9 5 201,4 1 510,6 1 576,2 3 086,8 27,9% 46,7% 36,9%
in % of net sales 27,0% 26,1% 26,6% 38,2% 30,6% 27,1% 32,6% 29,7% 32,6% 32,4% 32,5%
Sum of items may not foot due to rounding.
2020 2021 Change YoY

Income Statement Merck KGaA, Darmstadt, GermanyGroup€ million Q1 Q2 H1 Q3 9M Q4 H2 FY Q1 Q2 H1 Q3 9M Q4 H2 FY Q1 Q2 H1 Q3 9M Q4 H2 FY
Net sales 4 369,7 4 119,1 8 488,8 4 447,1 12 935,9 4 598,5 9 045,6 17 534,4 4 630,7 4 870,2 9 500,9 6,0% 18,2% 11,9%Cost of sales -1 653,5 -1 610,3 -3 263,9 -1 776,1 -5 040,0 -1 795,2 -3 571,2 -6 835,1 -1 720,6 -1 813,0 -3 533,5 4,1% 12,6% 8,3%
thereof amortization of intangible assets -56,7 -57,2 -113,9 -48,4 -162,3 -47,7 -96,1 -209,9 -53,9 -49,0 -102,9 -4,9% -14,3% -9,6%Gross profit 2 716,2 2 508,7 5 224,9 2 671,0 7 895,9 2 803,4 5 474,4 10 699,3 2 910,1 3 057,2 5 967,3 7,1% 21,9% 14,2%
in % of net sales 62,2% 60,9% 61,6% 60,1% 61,0% 61,0% 60,5% 61,0% 62,8% 62,8% 62,8%SG&A -1 421,0 -1 497,5 -2 918,6 -973,6 -3 892,2 -1 534,3 -2 507,9 -5 426,5 -1 293,0 -1 423,3 -2 716,4 -9,0% -5,0% -6,9%
in % of net sales 32,5% 36,4% 34,4% 21,9% 30,1% 33,4% 27,7% 30,9% 27,9% 29,2% 28,6%Marketing and selling expenses -1 058,7 -1 034,9 -2 093,6 -991,8 -3 085,4 -1 121,8 -2 113,6 -4 207,2 -1 007,3 -1 035,4 -2 042,7 -4,9% 0,1% -2,4%
thereof amortization of intangible assets (M&S) -158,8 -165,2 -323,9 -158,5 -482,5 -153,4 -311,9 -635,8 -145,9 -145,7 -291,6 -8,1% -11,8% -10,0%Administration expenses -288,5 -298,3 -586,8 -279,7 -866,6 -321,6 -601,3 -1 188,2 -272,9 -307,3 -580,2 -5,4% 3,0% -1,1%Impairment losses and reversals (IFRS 9) 6,0 -4,5 1,5 -1,3 0,1 -5,8 -7,1 -5,7 -6,0 -0,1 -6,0 n.m. -98,6% n.m.Other operating expenses/income -79,8 -159,9 -239,6 299,3 59,7 -85,1 214,2 -25,5 -6,9 -80,5 -87,4 -91,4% -49,6% -63,5%
Impairments** -1,9 -111,7 -113,6 -0,7 -114,4 -13,8 -14,6 -128,2 -3,2 -7,8 -11,0 69,8% -93,0% -90,3%Research and development -579,2 -520,0 -1 099,2 -531,0 -1 630,1 -658,0 -1 188,9 -2 288,1 -573,9 -584,5 -1 158,5 -0,9% 12,4% 5,4%
in % of net sales 13,3% 12,6% 12,9% 11,9% 12,6% 14,3% 13,1% 13,0% 12,4% 12,0% 12,2%thereof amortization of intangible assets (R&D) -2,3 -2,8 -5,1 -2,9 -8,0 -3,7 -6,6 -11,8 -3,0 -4,1 -7,1 27,9% 46,5% 38,1%
EBIT 715,9 491,2 1 207,1 1 166,5 2 373,6 611,1 1 777,6 2 984,7 1 043,1 1 049,3 2 092,5 45,7% 113,6% 73,3%in % of net sales 16,4% 11,9% 14,2% 26,2% 18,3% 13,3% 19,7% 17,0% 22,5% 21,5% 22,0%
Depreciation and amortization 431,6 556,4 987,9 452,9 1 440,9 497,3 950,2 1 938,2 423,7 422,3 846,1 -1,8% -24,1% -14,4%EBITDA 1 147,5 1 047,5 2 195,1 1 619,4 3 814,5 1 108,4 2 727,8 4 922,9 1 466,9 1 471,6 2 938,5 27,8% 40,5% 33,9%
in % of net sales 26,3% 25,4% 25,9% 36,4% 29,5% 24,1% 30,2% 28,1% 31,7% 30,2% 30,9%EBITDA pre 1 181,3 1 074,2 2 255,5 1 700,7 3 956,2 1 245,2 2 945,9 5 201,4 1 510,6 1 576,2 3 086,8 27,9% 46,7% 36,9%
in % of net sales 27,0% 26,1% 26,6% 38,2% 30,6% 27,1% 32,6% 29,7% 32,6% 32,4% 32,5%Financial result -98,5 -102,3 -200,7 -101,6 -302,3 -52,0 -153,6 -354,4 -59,1 -94,8 -153,9 -40,0% -7,3% -23,3%Profit before income tax from continuing operations 617,5 388,9 1 006,4 1 064,9 2 071,3 559,0 1 623,9 2 630,3 984,1 954,6 1 938,6 59,4% 145,4% 92,6%Income tax -159,4 -99,9 -259,4 -258,5 -517,8 -118,8 -377,2 -636,6 -236,2 -207,8 -443,9 48,1% 107,9% 71,2%
Income tax rate 25,8% 25,7% 25,8% 24,3% 25,0% 21,2% 23,2% 24,2% 24,0% 21,8% 22,9%Profit after tax from continuing operations 458,0 289,0 747,0 806,4 1 553,5 440,3 1 246,7 1 993,7 747,9 746,8 1 494,7 63,3% 158,4% 100,1%Profit after tax from discontinued operations 0,0 0,0 0,0 0,0 0,0 0,0 0,0 0,0 0,0 0,0 0,0 n.m. n.m. n.m.Profit after tax 458,0 289,0 747,0 806,4 1 553,5 440,3 1 246,7 1 993,7 747,9 746,8 1 494,7 63,3% 158,4% 100,1%
of which: attributable to Merck KGaA shareholders (n 456,1 289,8 746,0 805,5 1 551,4 435,8 1 241,2 1 987,2 746,6 745,2 1 491,8 63,7% 157,1% 100,0%of which: attributable to non-controlling interests 1,9 -0,8 1,1 1,0 2,1 4,5 5,4 6,5 1,3 1,6 2,9 -31,3% n.m. 164,4%
EPS in € 1,05 0,67 1,72 1,85 3,57 1,00 2,85 4,57 1,72 1,71 3,43 63,8% 155,2% 99,4%thereof from continuing operations 1,05 0,67 1,72 1,85 3,57 1,00 2,85 4,57 1,72 1,71 3,43 63,8% 155,2% 99,4%thereof from discontinued operations 0,00 0,00 0,00 0,00 0,00 0,00 0,00 0,00 0,00 0,00 0,00 n.m. n.m. n.m.
EPS pre in €* 1,50 1,30 2,80 2,34 5,14 1,57 3,91 6,70 2,18 2,24 4,42 45,3% 72,3% 57,9%
Number of theoretical shares in million 434,8 434,8 434,8 434,8 434,8 434,8 434,8 434,8 434,8 434,8 434,8
Reconciliation to EBITDA preEBITDA 1 147,5 1 047,5 2 195,1 1 619,4 3 814,5 1 108,4 2 727,8 4 922,9 1 466,9 1 471,6 2 938,5 27,8% 40,5% 33,9%Adjustments
thereof: Cost of Sales 20,2 2,5 22,7 21,1 43,8 9,1 30,2 52,9 4,4 7,48 11,9 -78,2% 197,9% -47,6%thereof: Marketing and selling expenses 2,2 10,3 12,5 5,8 18,3 41,6 47,4 59,9 6,4 2,89 9,2 188,6% -71,9% -26,0%thereof: Administration expenses 16,4 32,8 49,2 18,2 67,4 31,1 49,3 98,4 20,4 20,07 40,5 24,5% -38,7% -17,6%thereof: Other operating expenses/income -3,8 -18,6 -22,3 35,3 13,0 27,8 63,1 40,7 10,8 73,08 83,9 n.m. n.m. n.m.thereof: Research and development -1,2 -0,3 -1,6 0,8 -0,8 27,3 28,1 26,6 1,7 1,02 2,7 n.m. n.m. n.m.
Total 33,8 26,7 60,5 81,3 141,7 136,8 218,1 278,6 43,7 104,6 148,3 29,4% 292,0% 145,2%EBITDA pre 1 181,3 1 074,2 2 255,5 1 700,7 3 956,2 1 245,2 2 945,9 5 201,4 1 510,6 1 576,2 3 086,8 27,9% 46,7% 36,9%
Sum of items may not foot due to rounding.* for continuing operations** only reflects impairments which classified as adjustments
2020 2021 Change YoY
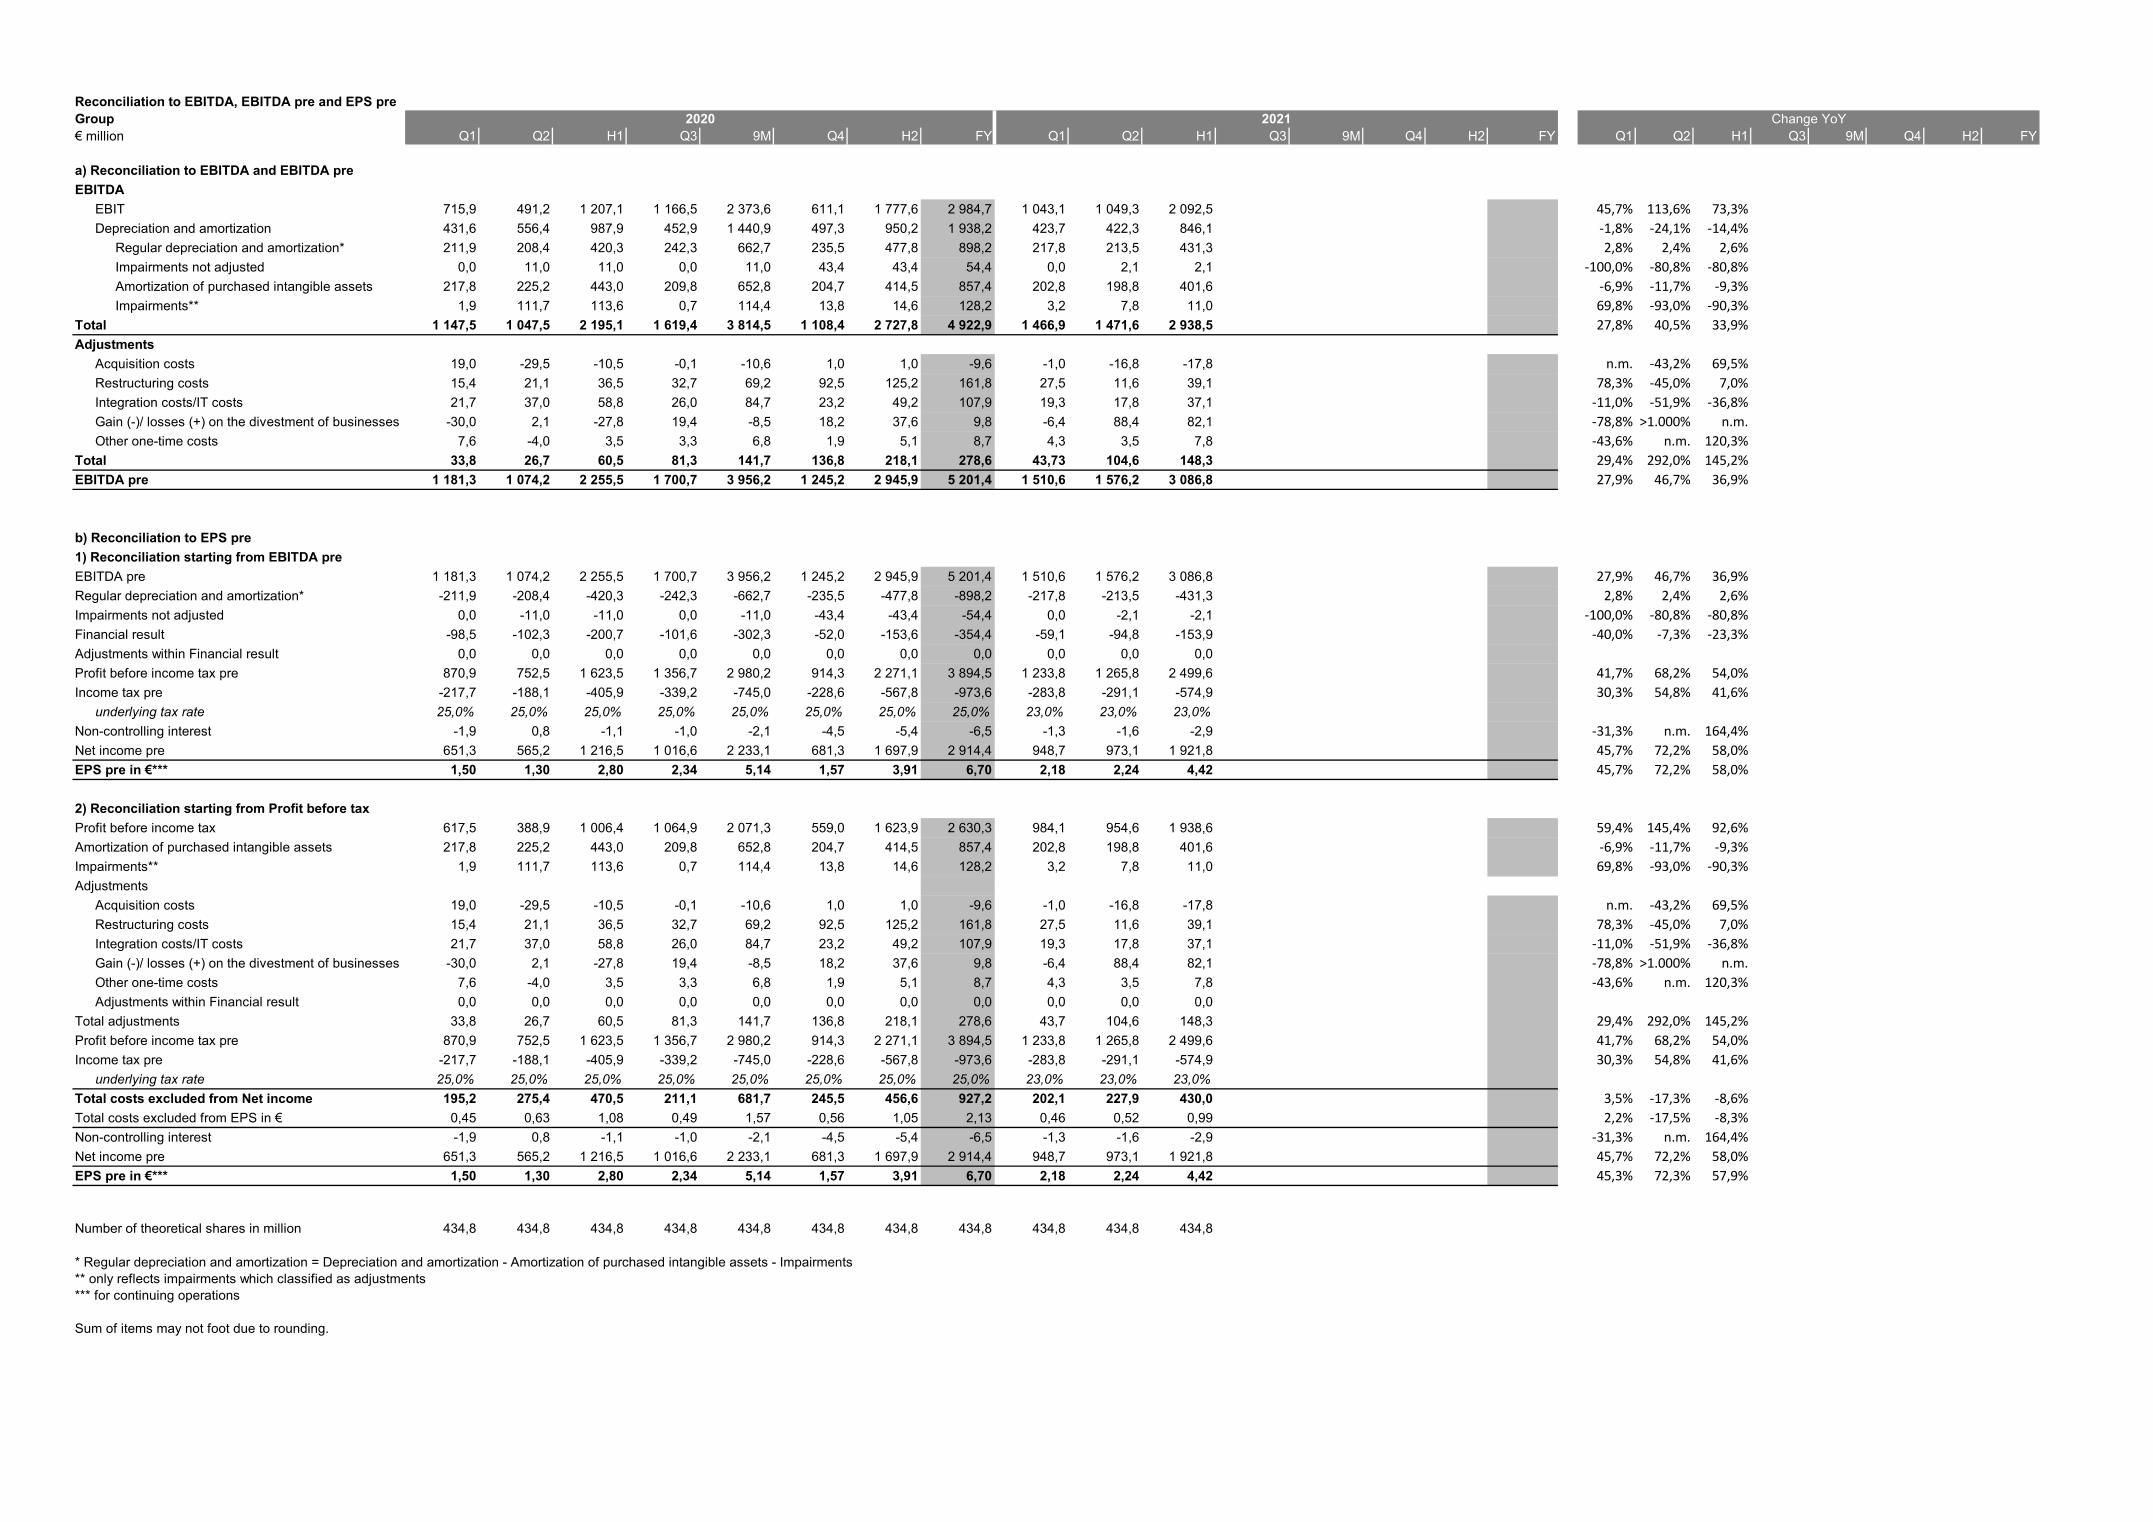
Reconciliation to EBITDA, EBITDA pre and EPS preGroup€ million Q1 Q2 H1 Q3 9M Q4 H2 FY Q1 Q2 H1 Q3 9M Q4 H2 FY Q1 Q2 H1 Q3 9M Q4 H2 FY
a) Reconciliation to EBITDA and EBITDA preEBITDA
EBIT 715,9 491,2 1 207,1 1 166,5 2 373,6 611,1 1 777,6 2 984,7 1 043,1 1 049,3 2 092,5 45,7% 113,6% 73,3%Depreciation and amortization 431,6 556,4 987,9 452,9 1 440,9 497,3 950,2 1 938,2 423,7 422,3 846,1 -1,8% -24,1% -14,4%
Regular depreciation and amortization* 211,9 208,4 420,3 242,3 662,7 235,5 477,8 898,2 217,8 213,5 431,3 2,8% 2,4% 2,6%Impairments not adjusted 0,0 11,0 11,0 0,0 11,0 43,4 43,4 54,4 0,0 2,1 2,1 -100,0% -80,8% -80,8%Amortization of purchased intangible assets 217,8 225,2 443,0 209,8 652,8 204,7 414,5 857,4 202,8 198,8 401,6 -6,9% -11,7% -9,3%Impairments** 1,9 111,7 113,6 0,7 114,4 13,8 14,6 128,2 3,2 7,8 11,0 69,8% -93,0% -90,3%
Total 1 147,5 1 047,5 2 195,1 1 619,4 3 814,5 1 108,4 2 727,8 4 922,9 1 466,9 1 471,6 2 938,5 27,8% 40,5% 33,9%Adjustments
Acquisition costs 19,0 -29,5 -10,5 -0,1 -10,6 1,0 1,0 -9,6 -1,0 -16,8 -17,8 n.m. -43,2% 69,5%Restructuring costs 15,4 21,1 36,5 32,7 69,2 92,5 125,2 161,8 27,5 11,6 39,1 78,3% -45,0% 7,0%Integration costs/IT costs 21,7 37,0 58,8 26,0 84,7 23,2 49,2 107,9 19,3 17,8 37,1 -11,0% -51,9% -36,8%Gain (-)/ losses (+) on the divestment of businesses -30,0 2,1 -27,8 19,4 -8,5 18,2 37,6 9,8 -6,4 88,4 82,1 -78,8% >1.000% n.m.Other one-time costs 7,6 -4,0 3,5 3,3 6,8 1,9 5,1 8,7 4,3 3,5 7,8 -43,6% n.m. 120,3%
Total 33,8 26,7 60,5 81,3 141,7 136,8 218,1 278,6 43,73 104,6 148,3 29,4% 292,0% 145,2%EBITDA pre 1 181,3 1 074,2 2 255,5 1 700,7 3 956,2 1 245,2 2 945,9 5 201,4 1 510,6 1 576,2 3 086,8 27,9% 46,7% 36,9%
b) Reconciliation to EPS pre1) Reconciliation starting from EBITDA preEBITDA pre 1 181,3 1 074,2 2 255,5 1 700,7 3 956,2 1 245,2 2 945,9 5 201,4 1 510,6 1 576,2 3 086,8 27,9% 46,7% 36,9%Regular depreciation and amortization* -211,9 -208,4 -420,3 -242,3 -662,7 -235,5 -477,8 -898,2 -217,8 -213,5 -431,3 2,8% 2,4% 2,6%Impairments not adjusted 0,0 -11,0 -11,0 0,0 -11,0 -43,4 -43,4 -54,4 0,0 -2,1 -2,1 -100,0% -80,8% -80,8%Financial result -98,5 -102,3 -200,7 -101,6 -302,3 -52,0 -153,6 -354,4 -59,1 -94,8 -153,9 -40,0% -7,3% -23,3%Adjustments within Financial result 0,0 0,0 0,0 0,0 0,0 0,0 0,0 0,0 0,0 0,0 0,0Profit before income tax pre 870,9 752,5 1 623,5 1 356,7 2 980,2 914,3 2 271,1 3 894,5 1 233,8 1 265,8 2 499,6 41,7% 68,2% 54,0%Income tax pre -217,7 -188,1 -405,9 -339,2 -745,0 -228,6 -567,8 -973,6 -283,8 -291,1 -574,9 30,3% 54,8% 41,6%
underlying tax rate 25,0% 25,0% 25,0% 25,0% 25,0% 25,0% 25,0% 25,0% 23,0% 23,0% 23,0%Non-controlling interest -1,9 0,8 -1,1 -1,0 -2,1 -4,5 -5,4 -6,5 -1,3 -1,6 -2,9 -31,3% n.m. 164,4%Net income pre 651,3 565,2 1 216,5 1 016,6 2 233,1 681,3 1 697,9 2 914,4 948,7 973,1 1 921,8 45,7% 72,2% 58,0%EPS pre in €*** 1,50 1,30 2,80 2,34 5,14 1,57 3,91 6,70 2,18 2,24 4,42 45,7% 72,2% 58,0%
2) Reconciliation starting from Profit before taxProfit before income tax 617,5 388,9 1 006,4 1 064,9 2 071,3 559,0 1 623,9 2 630,3 984,1 954,6 1 938,6 59,4% 145,4% 92,6%Amortization of purchased intangible assets 217,8 225,2 443,0 209,8 652,8 204,7 414,5 857,4 202,8 198,8 401,6 -6,9% -11,7% -9,3%Impairments** 1,9 111,7 113,6 0,7 114,4 13,8 14,6 128,2 3,2 7,8 11,0 69,8% -93,0% -90,3%Adjustments
Acquisition costs 19,0 -29,5 -10,5 -0,1 -10,6 1,0 1,0 -9,6 -1,0 -16,8 -17,8 n.m. -43,2% 69,5%Restructuring costs 15,4 21,1 36,5 32,7 69,2 92,5 125,2 161,8 27,5 11,6 39,1 78,3% -45,0% 7,0%Integration costs/IT costs 21,7 37,0 58,8 26,0 84,7 23,2 49,2 107,9 19,3 17,8 37,1 -11,0% -51,9% -36,8%Gain (-)/ losses (+) on the divestment of businesses -30,0 2,1 -27,8 19,4 -8,5 18,2 37,6 9,8 -6,4 88,4 82,1 -78,8% >1.000% n.m.Other one-time costs 7,6 -4,0 3,5 3,3 6,8 1,9 5,1 8,7 4,3 3,5 7,8 -43,6% n.m. 120,3%Adjustments within Financial result 0,0 0,0 0,0 0,0 0,0 0,0 0,0 0,0 0,0 0,0 0,0
Total adjustments 33,8 26,7 60,5 81,3 141,7 136,8 218,1 278,6 43,7 104,6 148,3 29,4% 292,0% 145,2%Profit before income tax pre 870,9 752,5 1 623,5 1 356,7 2 980,2 914,3 2 271,1 3 894,5 1 233,8 1 265,8 2 499,6 41,7% 68,2% 54,0%Income tax pre -217,7 -188,1 -405,9 -339,2 -745,0 -228,6 -567,8 -973,6 -283,8 -291,1 -574,9 30,3% 54,8% 41,6%
underlying tax rate 25,0% 25,0% 25,0% 25,0% 25,0% 25,0% 25,0% 25,0% 23,0% 23,0% 23,0%Total costs excluded from Net income 195,2 275,4 470,5 211,1 681,7 245,5 456,6 927,2 202,1 227,9 430,0 3,5% -17,3% -8,6%Total costs excluded from EPS in € 0,45 0,63 1,08 0,49 1,57 0,56 1,05 2,13 0,46 0,52 0,99 2,2% -17,5% -8,3%Non-controlling interest -1,9 0,8 -1,1 -1,0 -2,1 -4,5 -5,4 -6,5 -1,3 -1,6 -2,9 -31,3% n.m. 164,4%Net income pre 651,3 565,2 1 216,5 1 016,6 2 233,1 681,3 1 697,9 2 914,4 948,7 973,1 1 921,8 45,7% 72,2% 58,0%EPS pre in €*** 1,50 1,30 2,80 2,34 5,14 1,57 3,91 6,70 2,18 2,24 4,42 45,3% 72,3% 57,9%
Number of theoretical shares in million 434,8 434,8 434,8 434,8 434,8 434,8 434,8 434,8 434,8 434,8 434,8
* Regular depreciation and amortization = Depreciation and amortization - Amortization of purchased intangible assets - Impairments** only reflects impairments which classified as adjustments*** for continuing operations
Sum of items may not foot due to rounding.
2020 2021 Change YoY

Breakdown of depreciation and amortization and adjustmentsGroup€ million Division Q1 Q2 H1 Q3 9M Q4 H2 FY Q1 Q2 H1 Q3 9M Q4 H2 FY Q1 Q2 H1 Q3 9M Q4 H2 FY
a) Depreciation and amortizationRegular depreciation and amortization* all 211,89 208,4 420,3 242,3 662,7 235,5 477,8 898,2 217,8 213,5 431,3 2,8% 2,4% 2,6%Impairments not adjusted all 0,0 11,0 11,0 0,0 11,0 43,4 43,4 54,4 0,0 2,1 2,1 -100,0% -80,8% -80,8%Amortization of purchased intangible assets
Healthcare HC 10,1 16,0 26,1 12,9 39,0 12,8 25,7 51,8 11,1 7,0 18,2 10,0% -56,0% -30,5%Life Science LS 118,9 119,5 238,4 112,9 351,4 111,5 224,5 462,9 110,3 111,6 221,9 -7,2% -6,6% -6,9%Electronics EL 88,8 89,7 178,4 84,0 262,4 80,3 164,3 342,7 81,4 80,2 161,6 -8,3% -10,6% -9,5%
Total 217,8 225,2 443,0 209,8 652,8 204,7 414,5 857,4 202,8 198,8 401,6 -6,9% -11,7% -9,3%Impairments** all 1,9 111,7 113,6 0,7 114,4 13,8 14,6 128,2 3,2 7,8 11,0 69,8% -93,0% -90,3%Total depreciation and amortization 431,6 556,4 987,9 452,9 1 440,9 497,3 950,2 1 938,2 423,7 422,3 846,1 -1,8% -24,1% -14,4%
b) AdjustmentsAcquisition costs 19,0 -29,5 -10,5 -0,1 -10,6 1,0 1,0 -9,6 -1,0 -16,8 -17,8 n.m. -43,2% 69,5%Restructuring costs
Healthcare HC 2,0 12,4 14,4 4,7 19,1 75,7 80,4 94,8 7,3 2,2 9,5 263,1% -82,0% -33,9%Life Science LS 1,7 1,0 2,8 11,4 14,1 1,7 13,1 15,9 7,5 2,4 9,9 329,6% 127,1% 254,3%Electronics EL 7,4 2,5 9,9 17,1 26,9 3,9 21,0 30,8 8,4 1,5 9,9 13,7% -39,7% 0,2%Corporate/Others CO 4,3 5,2 9,5 -0,5 9,0 11,2 10,7 20,2 4,3 5,5 9,9 0,7% 6,1% 3,7%
Total 15,4 21,1 36,5 32,7 69,2 92,5 125,2 161,8 27,5 11,6 39,1 78,3% -45,0% 7,0%Integration costs/IT costs
Integration Cost LS/PM/CO 8,0 12,1 20,1 8,8 29,0 12,1 20,9 41,1 4,9 5,4 10,3 -39,2% -55,5% -49,0%ERP/HR systems all 13,7 24,9 38,6 17,1 55,7 11,1 28,2 66,8 14,5 12,4 26,9 5,4% -50,2% -30,4%
Total 21,7 37,0 58,8 26,0 84,7 23,2 49,2 107,9 19,3 17,8 37,1 -11,0% -51,9% -36,8%Gain (-)/ losses (+) on the divestment of businesses
Costs related to former business activities CO 1,8 0,7 2,5 19,5 22,0 3,3 22,8 25,3 -6,3 83,1 76,8 n.m. >1.000% >1.000%Costs related to former business activities EL 0,1 0,0 0,1 0,6 0,6 0,0 0,6 0,7 0,1 0,0 0,1 -3,5% -100,0% -3,6%Sale of CH, Allergopharma and others HC -31,8 1,4 -30,4 -0,7 -31,1 14,9 14,2 -16,2 -0,2 5,3 5,1 -99,3% 275,2% n.m.Costs related to former business activities LS 0,0 0,0 0,0 0,0 0,1 0,0 0,0 0,0 0,1 0,0 0,1 n.m. -87,4% >1.000%
Total -30,0 2,1 -27,8 19,4 -8,5 18,2 37,6 9,8 -6,4 88,4 82,1 -78,8% >1.000% n.m.Other one-time costs
HC 0,0 0,0 0,0 0,0 0,0 0,0 0,0 0,0 0,0 0,0 0,0 n.m. n.m. n.m.LS 0,0 0,0 0,0 0,0 0,0 0,0 0,0 0,0 0,0 0,0 0,0 n.m. n.m. n.m.EL 0,0 0,0 0,0 0,0 0,0 0,0 0,0 0,0 0,0 0,0 0,0 n.m. n.m. n.m.CO 7,6 -4,0 3,5 3,3 6,8 1,9 5,1 8,7 4,3 3,5 7,8 -43,6% n.m. 120,3%
Total 7,6 -4,0 3,5 3,3 6,8 1,9 5,1 8,7 4,3 3,5 7,8 -43,6% n.m. 120,3%Total adjustments 33,8 26,7 60,5 81,3 141,7 136,8 218,1 278,6 43,7 104,6 148,3 29,4% 292,0% 145,2%
* Regular depreciation and amortization = Depreciation and amortization - Amortization of purchased intangible assets - Impairments** only reflects impairments which classified as adjustments
Sum of items may not foot due to rounding.
Others
2020 2021 Change YoY

Income Statement Merck KGaA, Darmstadt, GermanyHealthcare€ million Q1 Q2 H1 Q3 9M Q4 H2 FY Q1 Q2 H1 Q3 9M Q4 H2 FY Q1 Q2 H1 Q3 9M Q4 H2 FY
Net sales 1 700,5 1 499,2 3 199,7 1 701,5 4 901,2 1 738,0 3 439,5 6 639,2 1 638,9 1 787,7 3 426,7 -3,6% 19,2% 7,1%Cost of sales -393,4 -364,4 -757,9 -427,4 -1 185,3 -428,0 -855,4 -1 613,2 -388,3 -420,2 -808,5 -1,3% 15,3% 6,7%
thereof amortization of intangible assets -0,8 -0,7 -1,5 -0,7 -2,3 -0,7 -1,5 -3,0 -5,2 -1,1 -6,4 575,5% 54,6% 320,6%Gross profit 1 307,1 1 134,8 2 441,9 1 274,1 3 716,0 1 310,0 2 584,1 5 026,0 1 250,6 1 367,6 2 618,2 -4,3% 20,5% 7,2%
in % of net sales 76,9% 75,7% 76,3% 74,9% 75,8% 75,4% 75,1% 75,7% 76,3% 76,5% 76,4%SG&A -467,4 -499,8 -967,2 -88,5 -1 055,7 -526,6 -615,1 -1 582,3 -389,4 -452,0 -841,5 -16,7% -9,6% -13,0%
in % of net sales 27,5% 33,3% 30,2% 5,2% 21,5% 30,3% 17,9% 23,8% 23,8% 25,3% 24,6%Marketing and selling expenses -423,4 -409,1 -832,5 -382,4 -1 214,9 -449,3 -831,7 -1 664,2 -370,3 -390,7 -761,1 -12,5% -4,5% -8,6%
thereof amortization of intangible assets (M&S) -7,5 -13,7 -21,1 -10,6 -31,7 -10,5 -21,0 -42,2 -4,3 -4,3 -8,6 -42,6% -68,6% -59,4%Administration expenses -79,5 -80,6 -160,0 -75,5 -235,5 -84,3 -159,8 -319,9 -72,7 -77,7 -150,5 -8,5% -3,5% -6,0%Impairment losses and reversals (IFRS 9) 4,9 -3,3 1,6 -0,6 1,0 -5,3 -5,9 -4,3 -1,7 2,6 0,9 n.m. n.m. -46,5%Other operating expenses/income 30,6 -6,9 23,7 370,0 393,7 12,3 382,3 406,0 55,3 13,9 69,2 80,9% n.m. 192,2%
Impairments** -1,9 0,0 -1,9 0,0 -1,9 -0,2 -0,2 -2,0 0,0 -2,8 -2,8 -100,0% n.m. 51,8%Research and development -417,4 -365,7 -783,2 -378,2 -1 161,4 -478,5 -856,8 -1 639,9 -416,4 -414,8 -831,2 -0,2% 13,4% 6,1%
in % of net sales 24,5% 24,4% 24,5% 22,2% 23,7% 27,5% 24,9% 24,7% 25,4% 23,2% 24,3%thereof amortization of intangible assets (R&D) -1,9 -1,6 -3,5 -1,6 -5,1 -1,6 -3,2 -6,7 -1,6 -1,6 -3,2 -14,2% 0,0% -7,6%
EBIT 422,3 269,2 691,5 807,4 1 498,9 304,9 1 112,3 1 803,8 444,7 500,7 945,5 5,3% 86,0% 36,7%in % of net sales 24,8% 18,0% 21,6% 47,5% 30,6% 17,5% 32,3% 27,2% 27,1% 28,0% 27,6%
Depreciation and amortization 78,8 89,7 168,5 84,4 252,9 127,8 212,2 380,7 78,4 71,6 150,0 -0,5% -20,2% -11,0%EBITDA 501,0 359,0 860,0 891,8 1 751,8 432,7 1 324,5 2 184,5 523,1 572,4 1 095,5 4,4% 59,5% 27,4%
in % of net sales 29,5% 23,9% 26,9% 52,4% 35,7% 24,9% 38,5% 32,9% 31,9% 32,0% 32,0%EBITDA pre 472,1 374,0 846,2 896,0 1 742,1 525,1 1 421,1 2 267,3 532,9 581,0 1 113,9 12,9% 55,3% 31,6%
in % of net sales 27,8% 24,9% 26,4% 52,7% 35,5% 30,2% 41,3% 34,1% 32,5% 32,5% 32,5%
Reconciliation to EBITDA preEBITDA 501,0 359,0 860,0 891,8 1 751,8 432,7 1 324,5 2 184,5 523,1 572,4 1 095,5 4,4% 59,5% 27,4%Adjustments
thereof: Cost of Sales 0,2 0,0 0,2 0,0 0,2 7,2 7,2 7,4 0,0 -0,4 -0,4 -100,0% n.m. n.m.thereof: Marketing and selling expenses 0,8 7,7 8,5 3,9 12,3 35,0 38,9 47,4 5,2 1,7 7,0 536,7% -77,2% -18,1%thereof: Administration expenses 1,0 1,7 2,7 0,2 3,0 4,0 4,3 7,0 3,4 1,5 4,9 230,9% -11,2% 80,3%thereof: Other operating expenses/income -30,9 5,7 -25,2 0,1 -25,1 22,0 22,1 -3,1 -0,1 5,2 5,1 -99,5% -9,0% n.m.thereof: Research and development 0,0 0,0 0,0 0,0 0,0 24,1 24,2 24,2 1,3 0,6 1,9 >1.000% n.m. >1.000%
Total -28,9 15,1 -13,8 4,2 -9,6 92,4 96,6 82,8 9,8 8,6 18,4 n.m. -43,0% n.m.EBITDA pre 472,1 374,0 846,2 896,0 1 742,1 525,1 1 421,1 2 267,3 532,9 581,0 1 113,9 12,9% 55,3% 31,6%
Sum of items may not foot due to rounding.
2020 2021 Change YoY
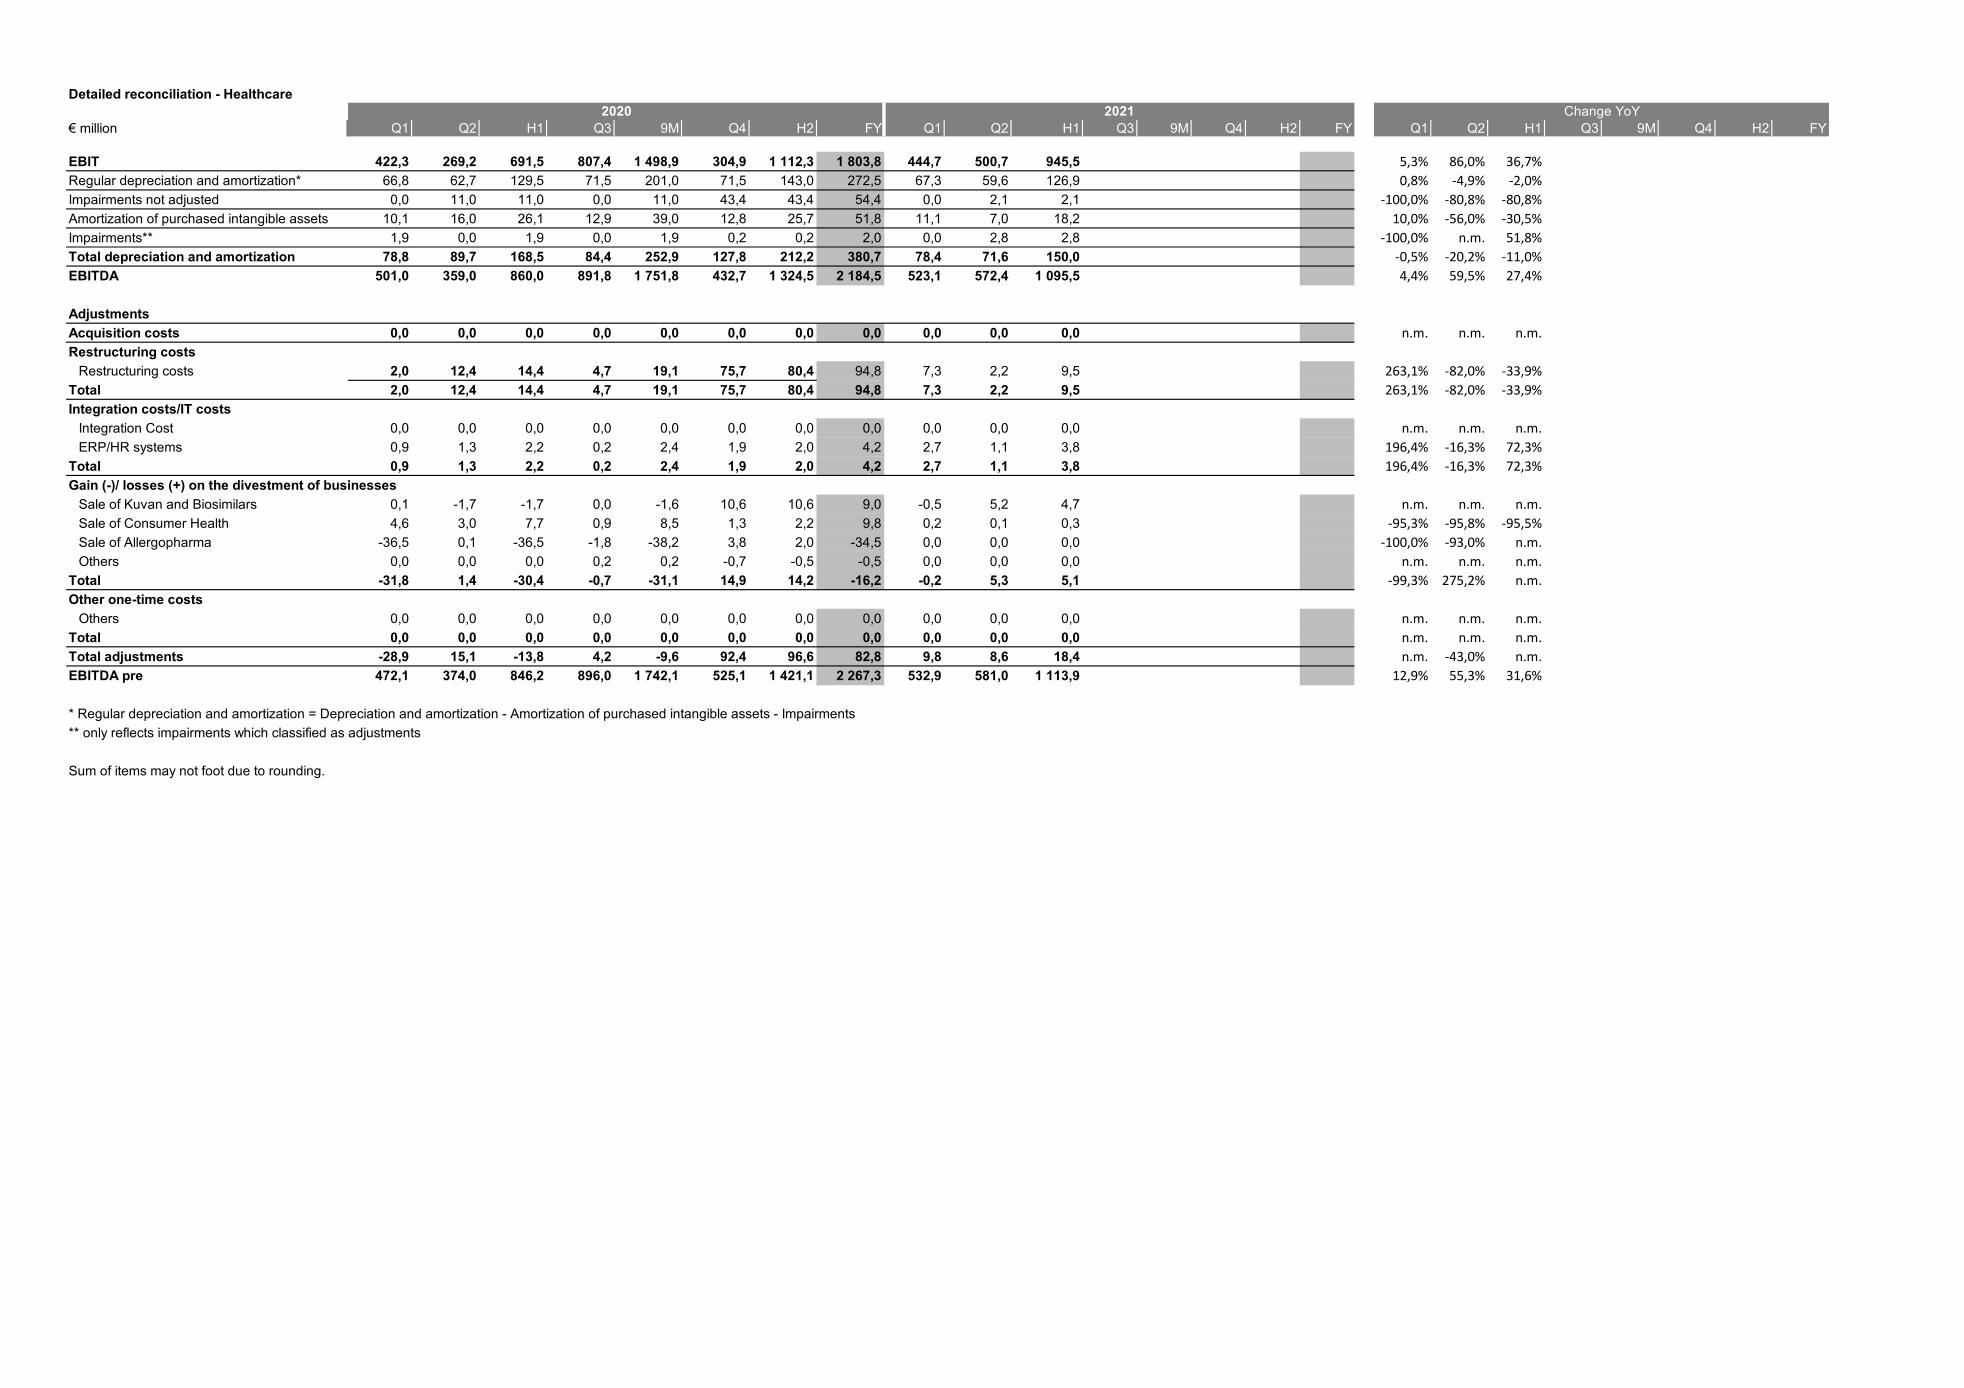
Detailed reconciliation - Healthcare
€ million Q1 Q2 H1 Q3 9M Q4 H2 FY Q1 Q2 H1 Q3 9M Q4 H2 FY Q1 Q2 H1 Q3 9M Q4 H2 FY
EBIT 422,3 269,2 691,5 807,4 1 498,9 304,9 1 112,3 1 803,8 444,7 500,7 945,5 5,3% 86,0% 36,7%Regular depreciation and amortization* 66,8 62,7 129,5 71,5 201,0 71,5 143,0 272,5 67,3 59,6 126,9 0,8% -4,9% -2,0%Impairments not adjusted 0,0 11,0 11,0 0,0 11,0 43,4 43,4 54,4 0,0 2,1 2,1 -100,0% -80,8% -80,8%Amortization of purchased intangible assets 10,1 16,0 26,1 12,9 39,0 12,8 25,7 51,8 11,1 7,0 18,2 10,0% -56,0% -30,5%Impairments** 1,9 0,0 1,9 0,0 1,9 0,2 0,2 2,0 0,0 2,8 2,8 -100,0% n.m. 51,8%Total depreciation and amortization 78,8 89,7 168,5 84,4 252,9 127,8 212,2 380,7 78,4 71,6 150,0 -0,5% -20,2% -11,0%EBITDA 501,0 359,0 860,0 891,8 1 751,8 432,7 1 324,5 2 184,5 523,1 572,4 1 095,5 4,4% 59,5% 27,4%
AdjustmentsAcquisition costs 0,0 0,0 0,0 0,0 0,0 0,0 0,0 0,0 0,0 0,0 0,0 n.m. n.m. n.m.Restructuring costs
Restructuring costs 2,0 12,4 14,4 4,7 19,1 75,7 80,4 94,8 7,3 2,2 9,5 263,1% -82,0% -33,9%Total 2,0 12,4 14,4 4,7 19,1 75,7 80,4 94,8 7,3 2,2 9,5 263,1% -82,0% -33,9%Integration costs/IT costs
Integration Cost 0,0 0,0 0,0 0,0 0,0 0,0 0,0 0,0 0,0 0,0 0,0 n.m. n.m. n.m.ERP/HR systems 0,9 1,3 2,2 0,2 2,4 1,9 2,0 4,2 2,7 1,1 3,8 196,4% -16,3% 72,3%
Total 0,9 1,3 2,2 0,2 2,4 1,9 2,0 4,2 2,7 1,1 3,8 196,4% -16,3% 72,3%Gain (-)/ losses (+) on the divestment of businesses
Sale of Kuvan and Biosimilars 0,1 -1,7 -1,7 0,0 -1,6 10,6 10,6 9,0 -0,5 5,2 4,7 n.m. n.m. n.m.Sale of Consumer Health 4,6 3,0 7,7 0,9 8,5 1,3 2,2 9,8 0,2 0,1 0,3 -95,3% -95,8% -95,5%Sale of Allergopharma -36,5 0,1 -36,5 -1,8 -38,2 3,8 2,0 -34,5 0,0 0,0 0,0 -100,0% -93,0% n.m.Others 0,0 0,0 0,0 0,2 0,2 -0,7 -0,5 -0,5 0,0 0,0 0,0 n.m. n.m. n.m.
Total -31,8 1,4 -30,4 -0,7 -31,1 14,9 14,2 -16,2 -0,2 5,3 5,1 -99,3% 275,2% n.m.Other one-time costs
Others 0,0 0,0 0,0 0,0 0,0 0,0 0,0 0,0 0,0 0,0 0,0 n.m. n.m. n.m.Total 0,0 0,0 0,0 0,0 0,0 0,0 0,0 0,0 0,0 0,0 0,0 n.m. n.m. n.m.Total adjustments -28,9 15,1 -13,8 4,2 -9,6 92,4 96,6 82,8 9,8 8,6 18,4 n.m. -43,0% n.m.EBITDA pre 472,1 374,0 846,2 896,0 1 742,1 525,1 1 421,1 2 267,3 532,9 581,0 1 113,9 12,9% 55,3% 31,6%
* Regular depreciation and amortization = Depreciation and amortization - Amortization of purchased intangible assets - Impairments** only reflects impairments which classified as adjustments
Sum of items may not foot due to rounding.
2020 2021 Change YoY

Income Statement Merck KGaA, Darmstadt, GermanyLife Science€ million Q1 Q2 H1 Q3 9M Q4 H2 FY Q1 Q2 H1 Q3 9M Q4 H2 FY Q1 Q2 H1 Q3 9M Q4 H2 FY
Net sales 1 768,9 1 806,2 3 575,1 1 909,9 5 485,0 2 029,9 3 939,7 7 514,9 2 130,6 2 225,1 4 355,7 20,4% 23,2% 21,8%Cost of sales -744,5 -773,7 -1 518,2 -830,4 -2 348,6 -866,7 -1 697,1 -3 215,3 -849,0 -887,1 -1 736,1 14,0% 14,6% 14,4%
thereof amortization of intangible assets -15,0 -15,4 -30,3 -14,1 -44,4 -13,2 -27,2 -57,6 -13,8 -13,9 -27,7 -7,9% -9,5% -8,7%Gross profit 1 024,4 1 032,5 2 056,9 1 079,5 3 136,4 1 163,1 2 242,6 4 299,6 1 281,6 1 338,0 2 619,6 25,1% 29,6% 27,4%
in % of net sales 57,9% 57,2% 57,5% 56,5% 57,2% 57,3% 56,9% 57,2% 60,2% 60,1% 60,1%SG&A -603,8 -571,6 -1 175,4 -587,6 -1 762,9 -625,1 -1 212,7 -2 388,0 -613,4 -607,3 -1 220,7 1,6% 6,3% 3,9%
in % of net sales 34,1% 31,6% 32,9% 30,8% 32,1% 30,8% 30,8% 31,8% 28,8% 27,3% 28,0%Marketing and selling expenses -497,5 -488,1 -985,6 -478,3 -1 463,9 -531,2 -1 009,5 -1 995,2 -501,0 -505,3 -1 006,3 0,7% 3,5% 2,1%
thereof amortization of intangible assets (M&S) -104,0 -104,1 -208,1 -98,7 -306,8 -97,3 -196,1 -404,1 -96,2 -96,1 -192,4 -7,4% -7,7% -7,6%Administration expenses -89,2 -100,3 -189,5 -88,1 -277,6 -76,3 -164,4 -353,9 -81,6 -92,2 -173,9 -8,5% -8,0% -8,2%Impairment losses and reversals (IFRS 9) 0,4 -0,9 -0,4 -0,6 -1,0 -0,3 -0,9 -1,3 -5,2 -1,3 -6,5 n.m. 53,1% >1.000%Other operating expenses/income -17,6 17,7 0,1 -20,6 -20,4 -17,2 -37,8 -37,7 -25,6 -8,4 -34,0 45,5% n.m. n.m.
Impairments** 0,0 0,0 0,0 0,0 0,0 -2,7 -2,7 -2,7 0,0 -0,1 -0,1 n.m. n.m. n.m.Research and development -75,3 -75,4 -150,7 -75,2 -225,9 -87,0 -162,2 -312,9 -75,0 -87,0 -162,0 -0,4% 15,4% 7,5%
in % of net sales 4,3% 4,2% 4,2% 3,9% 4,1% 4,3% 4,1% 4,2% 3,5% 3,9% 3,7%thereof amortization of intangible assets (R&D) 0,0 0,0 0,0 -0,1 -0,1 -1,0 -1,1 -1,2 -0,3 -1,6 -1,9 >1.000% n.m. >1.000%
EBIT 345,3 385,6 730,9 416,8 1 147,6 451,0 867,8 1 598,6 593,1 643,7 1 236,8 71,8% 66,9% 69,2%in % of net sales 19,5% 21,3% 20,4% 21,8% 20,9% 22,2% 22,0% 21,3% 27,8% 28,9% 28,4%
Depreciation and amortization 196,0 198,8 394,8 195,0 589,8 198,7 393,7 788,5 186,0 191,3 377,3 -5,1% -3,8% -4,4%EBITDA 541,3 584,4 1 125,7 611,7 1 737,4 649,7 1 261,5 2 387,2 779,1 835,0 1 614,2 43,9% 42,9% 43,4%
in % of net sales 30,6% 32,4% 31,5% 32,0% 31,7% 32,0% 32,0% 31,8% 36,6% 37,5% 37,1%EBITDA pre 552,7 569,1 1 121,8 630,2 1 752,0 653,1 1 283,3 2 405,0 793,2 829,0 1 622,2 43,5% 45,7% 44,6%
in % of net sales 31,2% 31,5% 31,4% 33,0% 31,9% 32,2% 32,6% 32,0% 37,2% 37,3% 37,2%
Reconciliation to EBITDA preEBITDA 541,3 584,4 1 125,7 611,7 1 737,4 649,7 1 261,5 2 387,2 779,1 835,0 1 614,2 43,9% 42,9% 43,4%Adjustments
thereof: Cost of Sales 0,2 0,0 0,3 6,8 7,1 -1,7 5,1 5,3 0,6 0,5 1,0 137,7% >1.000% 270,1%thereof: Marketing and selling expenses 0,1 0,0 0,1 1,7 1,8 1,8 3,6 3,6 0,5 0,5 1,0 593,5% n.m. >1.000%thereof: Administration expenses 9,3 12,1 21,5 7,7 29,1 3,1 10,8 32,3 7,5 8,0 15,5 -19,9% -34,1% -27,9%thereof: Other operating expenses/income 1,8 -27,5 -25,8 2,3 -23,5 -0,5 1,8 -23,9 5,5 -15,0 -9,6 211,9% -45,4% -62,9%thereof: Research and development 0,0 0,0 0,0 0,0 0,0 0,6 0,6 0,6 0,0 0,0 0,0 n.m. n.m. n.m.
Total 11,4 -15,4 -4,0 18,5 14,5 3,3 21,8 17,9 14,1 -6,1 8,0 23,2% -60,5% n.m.EBITDA pre 552,7 569,1 1 121,8 630,2 1 752,0 653,1 1 283,3 2 405,0 793,2 829,0 1 622,2 43,5% 45,7% 44,6%
Sum of items may not foot due to rounding.
2020 2021 Change YoY

Detailed reconciliation - Life Science
€ million Q1 Q2 H1 Q3 9M Q4 H2 FY Q1 Q2 H1 Q3 9M Q4 H2 FY Q1 Q2 H1 Q3 9M Q4 H2 FY
EBIT 345,3 385,6 730,9 416,8 1 147,6 451,0 867,8 1 598,6 593,1 643,7 1 236,8 71,8% 66,9% 69,2%Regular depreciation and amortization* 77,1 79,3 156,4 82,0 238,5 84,5 166,6 323,0 75,7 79,6 155,3 -1,8% 0,4% -0,7%Amortization of purchased intangible assets 118,9 119,5 238,4 112,9 351,4 111,5 224,5 462,9 110,3 111,6 221,9 -7,2% -6,6% -6,9%Impairments** 0,0 0,0 0,0 0,0 0,0 2,7 2,7 2,7 0,0 0,1 0,1 n.m. n.m. n.m.Total depreciation and amortization 196,0 198,8 394,8 195,0 589,8 198,7 393,7 788,5 186,0 191,3 377,3 -5,1% -3,8% -4,4%EBITDA 541,3 584,4 1 125,7 611,7 1 737,4 649,7 1 261,5 2 387,2 779,1 835,0 1 614,2 43,9% 42,9% 43,4%
AdjustmentsAcquisition costs 0,0 -30,0 -30,0 -0,1 -30,1 0,0 -0,1 -30,1 -1,1 -16,8 -17,9 n.m. -43,9% -40,1%Restructuring costs
Restructuring costs 1,7 1,0 2,8 11,4 14,1 1,7 13,1 15,9 7,5 2,4 9,9 329,6% 127,1% 254,3%Total 1,7 1,0 2,8 11,4 14,1 1,7 13,1 15,9 7,5 2,4 9,9 329,6% 127,1% 254,3%Integration costs/IT costs
Integration Cost 0,8 1,5 2,3 0,0 2,3 0,9 0,8 3,2 0,3 1,0 1,2 -65,2% -35,5% -46,3%ERP/HR systems 8,8 12,1 20,9 7,2 28,1 0,8 8,0 28,9 7,2 7,4 14,7 -18,0% -38,4% -29,8%
Total 9,7 13,6 23,2 7,2 30,4 1,6 8,8 32,1 7,5 8,4 15,9 -22,1% -38,1% -31,5%Gain (-)/ losses (+) on the divestment of businesses
Costs related to former business activities 0,0 0,0 0,0 0,0 0,1 0,0 0,0 0,0 0,1 0,0 0,1 n.m. -87,4% >1.000%Total 0,0 0,0 0,0 0,0 0,1 0,0 0,0 0,0 0,1 0,0 0,1 n.m. -87,4% >1.000%Other one-time costs
Others 0,0 0,0 0,0 0,0 0,0 0,0 0,0 0,0 0,0 0,0 0,0 n.m. n.m. n.m.Total 0,0 0,0 0,0 0,0 0,0 0,0 0,0 0,0 0,0 0,0 0,0 n.m. n.m. n.m.Total adjustments 11,4 -15,4 -4,0 18,5 14,5 3,3 21,8 17,9 14,1 -6,1 8,0 23,2% -60,5% n.m.EBITDA pre 552,7 569,1 1 121,8 630,2 1 752,0 653,1 1 283,3 2 405,0 793,2 829,0 1 622,2 43,5% 45,7% 44,6%
* Regular depreciation and amortization = Depreciation and amortization - Amortization of purchased intangible assets - Impairments** only reflects impairments which classified as adjustments
Sum of items may not foot due to rounding.
2020 2021 Change YoY

Income Statement Merck KGaA, Darmstadt, GermanyElectronics€ million Q1 Q2 H1 Q3 9M Q4 H2 FY Q1 Q2 H1 Q3 9M Q4 H2 FY Q1 Q2 H1 Q3 9M Q4 H2 FY
Net sales 900,3 813,6 1 713,9 835,7 2 549,6 830,7 1 666,4 3 380,3 861,2 857,4 1 718,5 -4,3% 5,4% 0,3%Cost of sales -515,1 -472,0 -987,1 -518,9 -1 506,0 -500,6 -1 019,5 -2 006,6 -483,4 -505,8 -989,2 -6,1% 7,2% 0,2%
thereof amortization of intangible assets -41,0 -41,0 -82,0 -33,6 -115,6 -33,7 -67,3 -149,4 -34,9 -34,0 -68,9 -14,8% -17,3% -16,0%Gross profit 385,3 341,6 726,8 316,8 1 043,6 330,1 646,9 1 373,7 377,8 351,6 729,3 -1,9% 2,9% 0,3%
in % of net sales 42,8% 42,0% 42,4% 37,9% 40,9% 39,7% 38,8% 40,6% 43,9% 41,0% 42,4%SG&A -197,6 -303,4 -501,0 -175,8 -676,8 -182,9 -358,8 -859,8 -185,3 -166,5 -351,8 -6,2% -45,1% -29,8%
in % of net sales 21,9% 37,3% 29,2% 21,0% 26,5% 22,0% 21,5% 25,4% 21,5% 19,4% 20,5%Marketing and selling expenses -135,6 -133,9 -269,5 -132,7 -402,2 -136,3 -269,0 -538,5 -135,3 -137,1 -272,4 -0,2% 2,3% 1,0%
thereof amortization of intangible assets (M&S) -47,3 -47,4 -94,7 -49,2 -143,9 -45,5 -94,7 -189,4 -45,4 -45,3 -90,6 -4,1% -4,5% -4,3%Administration expenses -38,4 -44,4 -82,7 -38,4 -121,1 -40,5 -78,9 -161,6 -34,4 -29,6 -64,1 -10,2% -33,2% -22,6%Impairment losses and reversals (IFRS 9) 0,6 -0,7 -0,1 -0,1 -0,2 0,4 0,3 0,1 0,2 -0,4 -0,2 -57,3% -39,6% 45,8%Other operating expenses/income -24,2 -124,4 -148,6 -4,7 -153,3 -6,5 -11,2 -159,9 -15,8 0,6 -15,2 -34,8% n.m. -89,8%
Impairments** 0,0 -111,6 -111,6 -0,7 -112,3 -11,0 -11,7 -123,3 -2,9 -4,5 -7,4 n.m. -96,0% -93,4%Research and development -71,3 -68,3 -139,7 -65,5 -205,1 -68,5 -133,9 -273,6 -66,8 -66,7 -133,5 -6,3% -2,4% -4,4%
in % of net sales 7,9% 8,4% 8,1% 7,8% 8,0% 8,2% 8,0% 8,1% 7,8% 7,8% 7,8%thereof amortization of intangible assets (R&D) -0,5 -1,2 -1,7 -1,2 -2,8 -1,1 -2,3 -4,0 -1,1 -1,0 -2,0 136,4% -21,6% 21,0%
EBIT 116,3 -30,2 86,1 75,5 161,6 78,7 154,2 240,3 125,7 118,4 244,0 8,1% n.m. 183,3%in % of net sales 12,9% -3,7% 5,0% 9,0% 6,3% 9,5% 9,3% 7,1% 14,6% 13,8% 14,2%
Depreciation and amortization 134,7 249,2 383,9 151,4 535,2 149,2 300,6 684,4 134,2 133,8 268,0 -0,3% -46,3% -30,2%EBITDA 251,0 219,0 470,0 226,8 696,9 227,9 454,7 924,7 259,9 252,2 512,1 3,6% 15,1% 9,0%
in % of net sales 27,9% 26,9% 27,4% 27,1% 27,3% 27,4% 27,3% 27,4% 30,2% 29,4% 29,8%EBITDA pre 285,5 238,3 523,8 254,2 778,0 246,1 500,4 1 024,2 273,8 258,0 531,9 -4,1% 8,3% 1,5%
in % of net sales 31,7% 29,3% 30,6% 30,4% 30,5% 29,6% 30,0% 30,3% 31,8% 30,1% 30,9%
Reconciliation to EBITDA preEBITDA 251,0 219,0 470,0 226,8 696,9 227,9 454,7 924,7 259,9 252,2 512,1 3,6% 15,1% 9,0%Adjustments
thereof: Cost of Sales 19,8 2,5 22,2 14,4 36,6 3,6 18,0 40,2 3,8 7,4 11,3 -80,6% 200,9% -49,3%thereof: Marketing and selling expenses 1,3 2,6 3,9 0,2 4,2 4,7 4,9 8,9 0,6 0,6 1,3 -53,1% -75,4% -68,0%thereof: Administration expenses 0,3 8,6 8,9 2,4 11,2 6,2 8,5 17,4 1,7 1,2 2,8 437,3% -86,5% -68,3%thereof: Other operating expenses/income 14,4 5,9 20,3 9,6 30,0 1,2 10,8 31,1 7,4 -3,8 3,6 -48,9% n.m. -82,5%thereof: Research and development -1,3 -0,3 -1,6 0,8 -0,8 2,6 3,4 1,8 0,4 0,5 0,9 n.m. n.m. n.m.
Total 34,6 19,2 53,8 27,4 81,2 18,3 45,6 99,4 13,9 5,9 19,8 -59,7% -69,5% -63,2%EBITDA pre 285,5 238,3 523,8 254,2 778,0 246,1 500,4 1 024,2 273,8 258,0 531,9 -4,1% 8,3% 1,5%
Sum of items may not foot due to rounding.
2020 2021 Change YoY
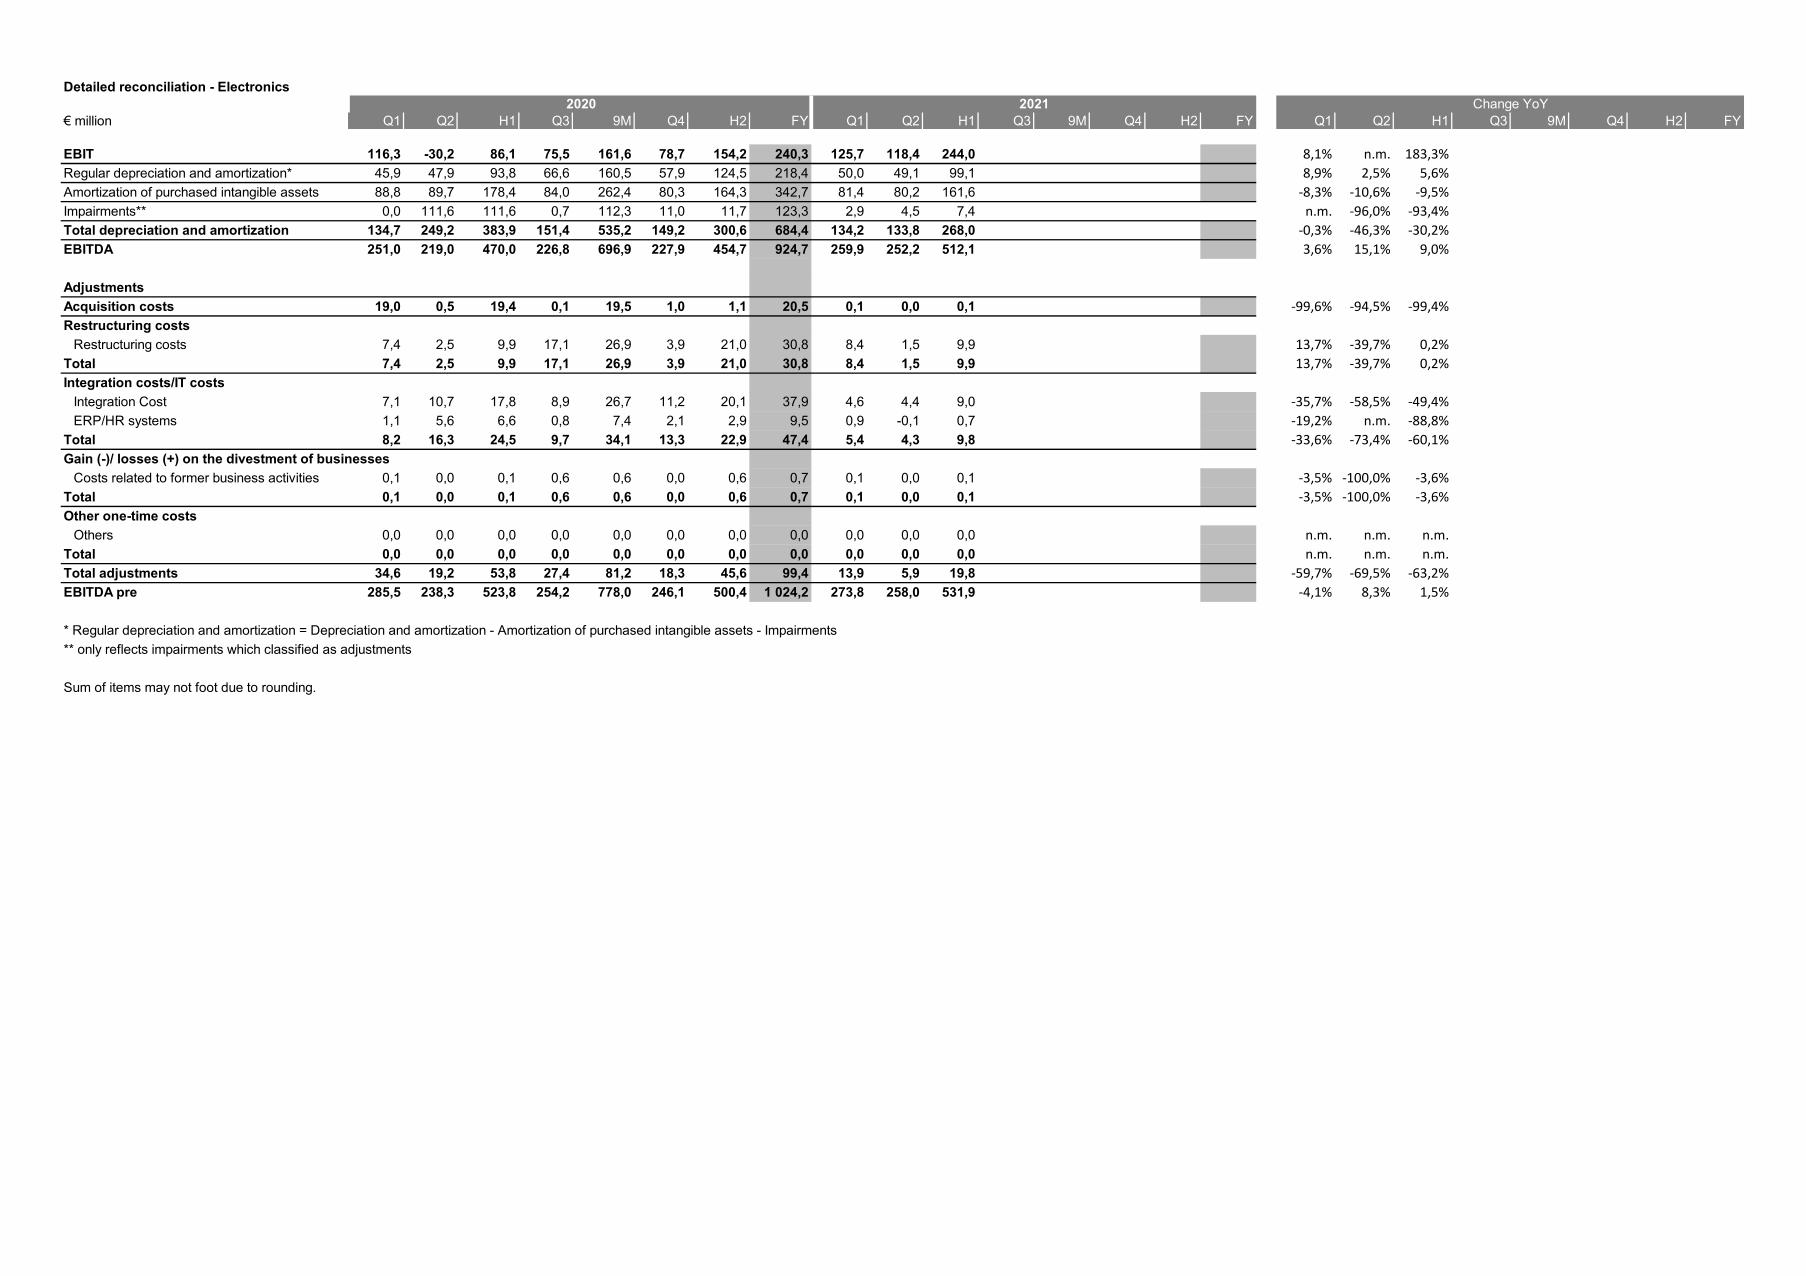
Detailed reconciliation - Electronics
€ million Q1 Q2 H1 Q3 9M Q4 H2 FY Q1 Q2 H1 Q3 9M Q4 H2 FY Q1 Q2 H1 Q3 9M Q4 H2 FY
EBIT 116,3 -30,2 86,1 75,5 161,6 78,7 154,2 240,3 125,7 118,4 244,0 8,1% n.m. 183,3%Regular depreciation and amortization* 45,9 47,9 93,8 66,6 160,5 57,9 124,5 218,4 50,0 49,1 99,1 8,9% 2,5% 5,6%Amortization of purchased intangible assets 88,8 89,7 178,4 84,0 262,4 80,3 164,3 342,7 81,4 80,2 161,6 -8,3% -10,6% -9,5%Impairments** 0,0 111,6 111,6 0,7 112,3 11,0 11,7 123,3 2,9 4,5 7,4 n.m. -96,0% -93,4%Total depreciation and amortization 134,7 249,2 383,9 151,4 535,2 149,2 300,6 684,4 134,2 133,8 268,0 -0,3% -46,3% -30,2%EBITDA 251,0 219,0 470,0 226,8 696,9 227,9 454,7 924,7 259,9 252,2 512,1 3,6% 15,1% 9,0%
AdjustmentsAcquisition costs 19,0 0,5 19,4 0,1 19,5 1,0 1,1 20,5 0,1 0,0 0,1 -99,6% -94,5% -99,4%Restructuring costs
Restructuring costs 7,4 2,5 9,9 17,1 26,9 3,9 21,0 30,8 8,4 1,5 9,9 13,7% -39,7% 0,2%Total 7,4 2,5 9,9 17,1 26,9 3,9 21,0 30,8 8,4 1,5 9,9 13,7% -39,7% 0,2%Integration costs/IT costs
Integration Cost 7,1 10,7 17,8 8,9 26,7 11,2 20,1 37,9 4,6 4,4 9,0 -35,7% -58,5% -49,4%ERP/HR systems 1,1 5,6 6,6 0,8 7,4 2,1 2,9 9,5 0,9 -0,1 0,7 -19,2% n.m. -88,8%
Total 8,2 16,3 24,5 9,7 34,1 13,3 22,9 47,4 5,4 4,3 9,8 -33,6% -73,4% -60,1%Gain (-)/ losses (+) on the divestment of businesses
Costs related to former business activities 0,1 0,0 0,1 0,6 0,6 0,0 0,6 0,7 0,1 0,0 0,1 -3,5% -100,0% -3,6%Total 0,1 0,0 0,1 0,6 0,6 0,0 0,6 0,7 0,1 0,0 0,1 -3,5% -100,0% -3,6%Other one-time costs
Others 0,0 0,0 0,0 0,0 0,0 0,0 0,0 0,0 0,0 0,0 0,0 n.m. n.m. n.m.Total 0,0 0,0 0,0 0,0 0,0 0,0 0,0 0,0 0,0 0,0 0,0 n.m. n.m. n.m.Total adjustments 34,6 19,2 53,8 27,4 81,2 18,3 45,6 99,4 13,9 5,9 19,8 -59,7% -69,5% -63,2%EBITDA pre 285,5 238,3 523,8 254,2 778,0 246,1 500,4 1 024,2 273,8 258,0 531,9 -4,1% 8,3% 1,5%
* Regular depreciation and amortization = Depreciation and amortization - Amortization of purchased intangible assets - Impairments** only reflects impairments which classified as adjustments
Sum of items may not foot due to rounding.
2020 2021 Change YoY

Income Statement Merck KGaA, Darmstadt, GermanyCorporate/Others€ million Q1 Q2 H1 Q3 9M Q4 H2 FY Q1 Q2 H1 Q3 9M Q4 H2 FY Q1 Q2 H1 Q3 9M Q4 H2 FY
Net sales 0,0 0,0 0,0 0,0 0,0 0,0 0,0 0,0 0,0 0,0 0,0 -100,0% -100,0% -100,0%Cost of sales -0,6 -0,2 -0,8 0,7 -0,1 0,1 0,8 0,1 0,1 0,1 0,2 n.m. n.m. n.m.
thereof amortization of intangible assets 0,0 0,0 0,0 0,0 0,0 0,0 0,0 0,0 0,0 0,0 0,0 n.m. n.m. n.m.Gross profit -0,6 -0,2 -0,8 0,7 -0,1 0,1 0,8 0,1 0,1 0,1 0,2 n.m. n.m. n.m.SG&A -152,2 -122,8 -275,0 -121,7 -396,7 -199,7 -321,3 -596,3 -104,9 -197,4 -302,3 -31,1% 60,8% 9,9%
Marketing and selling expenses -2,2 -3,8 -6,0 1,6 -4,4 -5,0 -3,4 -9,4 -0,7 -2,3 -3,0 -68,5% -39,8% -50,4%thereof amortization of intangible assets (M&S) 0,0 0,0 0,0 0,0 0,0 -0,1 -0,1 -0,1 0,0 0,0 0,0 >1.000% 185,6% >1.000%
Administration expenses -81,6 -73,0 -154,6 -77,8 -232,4 -120,4 -198,3 -352,8 -84,1 -107,7 -191,8 3,1% 47,5% 24,1%Impairment losses and reversals (IFRS 9) 0,1 0,3 0,4 0,0 0,4 -0,5 -0,5 -0,2 0,7 -0,9 -0,2 >1.000% n.m. n.m.Other operating expenses/income -68,5 -46,3 -114,8 -45,5 -160,2 -73,7 -119,2 -234,0 -20,8 -86,6 -107,4 -69,6% 87,0% -6,5%
Impairments** 0,0 -0,2 -0,2 0,0 -0,2 0,0 0,0 -0,2 -0,3 -0,4 -0,7 n.m. 148,6% 348,7%Research and development -15,0 -10,6 -25,6 -12,1 -37,7 -24,0 -36,1 -61,7 -15,7 -16,1 -31,8 4,0% 52,3% 24,0%
thereof amortization of intangible assets (R&D) 0,0 0,0 0,0 0,0 0,0 0,0 0,0 0,0 0,0 0,0 0,0 n.m. n.m. n.m.EBIT -167,9 -133,5 -301,4 -133,1 -434,5 -223,5 -356,6 -658,0 -120,4 -213,5 -333,9 -28,3% 59,9% 10,8%Depreciation and amortization 22,1 18,6 40,8 22,2 63,0 21,5 43,7 84,5 25,1 25,6 50,7 13,5% 37,1% 24,3%EBITDA -145,8 -114,8 -260,6 -110,9 -371,5 -202,0 -312,9 -573,5 -95,3 -187,9 -283,2 -34,6% 63,6% 8,7%EBITDA pre -129,1 -107,2 -236,2 -79,7 -315,9 -179,1 -258,8 -495,1 -89,3 -91,8 -181,1 -30,8% -14,4% -23,3%
Reconciliation to EBITDA preEBITDA -145,8 -114,8 -260,6 -110,9 -371,5 -202,0 -312,9 -573,5 -95,3 -187,9 -283,2 -34,6% 63,6% 8,7%Adjustments
thereof: Cost of Sales 0,0 0,0 0,0 0,0 0,0 0,0 0,0 0,0 0,0 0,0 0,0 n.m. n.m. n.m.thereof: Marketing and selling expenses 0,0 0,0 0,0 0,0 0,0 0,0 0,0 0,0 0,0 0,0 0,0 n.m. n.m. n.m.thereof: Administration expenses 5,7 10,4 16,1 7,9 24,0 17,8 25,7 41,8 7,9 9,4 17,3 37,3% -9,3% 7,4%thereof: Other operating expenses/income 11,0 -2,7 8,3 23,3 31,6 5,0 28,3 36,6 -1,9 86,7 84,8 n.m. n.m. >1.000%thereof: Research and development 0,0 0,0 0,0 0,0 0,0 0,0 0,0 0,0 0,0 0,0 0,0 n.m. n.m. n.m.
Total 16,7 7,7 24,4 31,2 55,6 22,8 54,0 78,4 6,0 96,1 102,1 -64,4% >1.000% 318,1%EBITDA pre -129,1 -107,2 -236,2 -79,7 -315,9 -179,1 -258,8 -495,1 -89,3 -91,8 -181,1 -30,8% -14,4% -23,3%
Sum of items may not foot due to rounding.
2020 2021 Change YoY

Detailed reconciliation - Corporate / Others
€ million Q1 Q2 H1 Q3 9M Q4 H2 FY Q1 Q2 H1 Q3 9M Q4 H2 FY Q1 Q2 H1 Q3 9M Q4 H2 FY
EBIT -167,9 -133,5 -301,4 -133,1 -434,5 -223,5 -356,6 -658,0 -120,4 -213,5 -333,9 -28,3% 59,9% 10,8%Regular depreciation and amortization* 22,1 18,5 40,6 22,2 62,8 21,4 43,6 84,2 24,7 25,2 49,9 11,9% 36,1% 22,9%Amortization of purchased intangible assets 0,0 0,0 0,0 0,0 0,0 0,1 0,1 0,1 0,0 0,0 0,0 >1.000% 185,6% >1.000%Impairments** 0,0 0,2 0,2 0,0 0,2 0,0 0,0 0,2 0,3 0,4 0,7 n.m. 148,6% 348,7%Total depreciation and amortization 22,1 18,6 40,8 22,2 63,0 21,5 43,7 84,5 25,1 25,6 50,7 13,5% 37,1% 24,3%EBITDA -145,8 -114,8 -260,6 -110,9 -371,5 -202,0 -312,9 -573,5 -95,3 -187,9 -283,2 -34,6% 63,6% 8,7%
AdjustmentsAcquisition costs 0,0 0,0 0,0 0,0 0,0 0,0 0,0 0,0 0,0 0,0 0,0 n.m. n.m. n.m.Restructuring costs
Restructuring costs 4,3 5,2 9,5 -0,5 9,0 11,2 10,7 20,2 4,3 5,5 9,9 0,7% 6,1% 3,7%Total 4,3 5,2 9,5 -0,5 9,0 11,2 10,7 20,2 4,3 5,5 9,9 0,7% 6,1% 3,7%IT project costs
Integration Cost 0,0 0,0 0,0 0,0 0,0 0,0 0,0 0,0 0,0 0,0 0,0ERP/HR systems 2,9 5,9 8,9 8,9 17,8 6,4 15,4 24,2 3,7 4,0 7,6 24,5% -32,7% -13,7%
Total 3,0 5,9 8,9 8,9 17,8 6,4 15,4 24,2 3,7 4,0 7,6 22,6% -32,2% -13,7%Gain (-)/ losses (+) on the divestment of businesses
Costs related to former business activities 1,8 0,7 2,5 19,5 22,0 3,3 22,8 25,3 -6,3 83,1 76,8 n.m. >1.000% >1.000%Total 1,8 0,7 2,5 19,5 22,0 3,3 22,8 25,3 -6,3 83,1 76,8 n.m. >1.000% >1.000%Other one-time costs
Others 7,6 -4,0 3,5 3,3 6,8 1,9 5,1 8,7 4,3 3,5 7,8 -43,6% n.m. 120,3%Total 7,6 -4,0 3,5 3,3 6,8 1,9 5,1 8,7 4,3 3,5 7,8 -43,6% n.m. 120,3%Total adjustments 16,7 7,7 24,4 31,2 55,6 22,8 54,0 78,4 6,0 96,1 102,1 -64,4% >1.000% 318,1%EBITDA pre -129,1 -107,2 -236,2 -79,7 -315,9 -179,1 -258,8 -495,1 -89,3 -91,8 -181,1 -30,8% -14,4% -23,3%
* Regular depreciation and amortization = Depreciation and amortization - Amortization of purchased intangible assets - Impairments** only reflects impairments which classified as adjustments
Sum of items may not foot due to rounding.
2020 2021 Change YoY

Income Statement Merck KGaA, Darmstadt, GermanyGroup€ million Q1 Q2 H1 Q3 9M Q4 H2 FY Q1 Q2 H1 Q3 9M Q4 H2 FY Q1 Q2 H1 Q3 9M Q4 H2 FY
Financial result -98,5 -102,3 -200,7 -101,6 -302,3 -52,0 -153,6 -354,4 -59,1 -94,8 -153,9 -40,0% -7,3% -23,3%Interest result -80,0 -72,8 -152,8 -74,0 -226,8 -61,8 -135,8 -288,6 -64,8 -56,5 -121,3 -19,0% -22,5% -20,7%
Interest income 5,6 10,9 16,5 5,6 22,2 16,8 22,4 39,0 6,4 8,0 14,4 13,8% -26,7% -12,9%Interest expenses -85,7 -83,7 -169,4 -79,6 -249,0 -78,5 -158,2 -327,6 -71,2 -64,4 -135,7 -16,8% -23,0% -19,9%
Result from financial investments -0,1 -0,8 -0,9 1,0 0,1 1,5 2,5 1,6 1,0 5,3 6,3 n.m. n.m. n.m.Currency difference - financing -6,0 5,2 -0,8 -3,4 -4,2 0,8 -2,6 -3,4 -6,0 -15,4 -21,3 -0,5% n.m. >1.000%Interest quota - pensions and other provisio -12,3 -33,8 -46,2 -25,3 -71,4 7,5 -17,8 -64,0 10,7 -28,3 -17,5 n.m. -16,5% -62,0%Others 0,0 0,0 0,0 0,0 0,0 0,0 0,0 0,0 0,0 0,0 0,0 n.m. n.m. n.m.
2020 2021 Change YoY

Cash Flow Statement Merck KGaA, Darmstadt, GermanyGroup€ million Q1 Q2 H1 Q3 9M Q4 H2 FY Q1 Q2 H1 Q3 9M Q4 H2 FY Q1 Q2 H1 Q3 9M Q4 H2 FYProfit after tax 458,0 289,0 747,1 806,4 1 553,5 440,3 1 246,7 1 993,7 747,9 746,8 1 494,7 63,3% 158,4% 100,1%
Depreciation/amortization/impairment losses/write-ups 431,5 559,3 990,7 451,5 1 442,2 495,8 947,3 1 938,0 424,0 419,1 843,1 -1,7% -25,1% -14,9%of tangible assets 189,3 208,0 397,3 222,1 619,4 219,3 441,3 838,7 198,1 203,6 401,7 4,7% -2,1% 1,1%of intangible assets 242,3 348,3 590,6 230,9 821,5 278,0 508,9 1 099,5 225,6 218,7 444,3 -6,9% -37,2% -24,8%of financial assets -0,1 2,9 2,8 -1,4 1,4 -1,5 -3,0 -0,2 0,3 -3,2 -2,9 n.m. n.m. n.m.
Changes in working capital -355,8 -112,4 -468,3 30,9 -437,3 275,0 305,9 -162,3 -88,4 -168,0 -256,4 -75,2% 49,4% -45,2%Changes in inventories -128,7 -117,9 -246,6 51,4 -195,2 110,1 161,5 -85,1 -108,0 -116,7 -224,7 -16,1% -1,1% -8,9%Changes in trade accounts receivable -254,3 74,7 -179,6 -74,6 -254,2 170,3 95,7 -83,9 -314,2 -65,3 -379,5 23,6% n.m. 111,3%Changes in trade accounts payable 27,1 -69,2 -42,0 54,1 12,1 -5,5 48,7 6,6 333,8 13,9 347,7 >1.000% n.m. n.m.
Changes in provisions 15,8 -53,8 -38,0 -256,2 -294,2 184,7 -71,6 -109,5 -33,7 88,3 54,6 n.m. n.m. n.m.Changes in other assets and liabilities -22,9 -166,5 -189,3 114,0 -75,4 -47,9 66,1 -123,3 160,4 -216,7 -56,3 n.m. 30,2% -70,3%Neutralization of gain/loss on disposal of assets -34,6 -3,9 -38,4 10,7 -27,7 -70,2 -59,5 -97,9 -5,8 -17,5 -23,3 -83,2% 350,6% -39,4%Other non-cash income and expenses 24,4 -9,5 14,9 13,1 28,0 10,6 23,7 38,6 11,6 36,2 47,8 -52,3% n.m. 220,9%
Net cash flows from operating activities 516,5 502,2 1 018,7 1 170,4 2 189,1 1 288,1 2 458,6 3 477,2 1 216,1 888,2 2 104,3 135,4% 76,9% 106,6%thereof: from discontinued operations 0,0 0,0 0,0 0,0 0,0 0,0 0,0 0,0 0,0 0,0 0,0 n.m. n.m. n.m.
Purchase of intangible assets -17,9 -48,4 -66,3 -34,6 -100,9 -49,4 -84,0 -150,3 -47,1 -21,5 -68,5 163,4% -55,7% 3,4%Disposal of intangible assets 6,0 7,1 13,1 3,9 17,0 71,4 75,3 88,4 8,7 21,4 30,2 44,7% 201,9% 129,7%Purchase of property, plant and equipment -340,8 -200,4 -541,2 -235,4 -776,7 -635,8 -871,3 -1 412,5 -315,0 -253,9 -568,9 -7,6% 26,7% 5,1%Disposal of property, plant and equipment 3,5 6,1 9,5 -1,7 7,8 27,3 25,6 35,1 6,4 -1,9 4,5 84,5% n.m. -52,9%Acquisitions -0,8 -5,8 -6,5 0,0 -6,5 -4,8 -4,8 -11,4 0,0 0,0 0,0 -100,0% -99,5% -99,5%Divestments 56,1 -0,3 55,8 -7,3 48,5 -0,8 -8,1 47,8 0,9 0,3 1,1 -98,4% n.m. -98,0%Changes/ Purchase of financial assets -25,6 -12,4 -38,0 -223,9 -261,9 -15,9 -239,8 -277,8 -10,2 -14,2 -24,4 -60,3% 14,3% -35,9%Disposal of financial assets 31,3 38,4 69,7 261,3 331,0 9,3 270,6 340,4 9,9 28,8 38,7 -68,4% -24,9% -44,4%Payments for investments in non-financial assets 0,0 0,0 0,0 -500,2 -500,2 0,0 -500,2 -500,2 0,0 0,0 0,0 n.m. n.m. n.m.Disposal of non-financial non-operative assets 0,0 0,0 0,0 0,0 0,0 500,5 500,5 500,5 0,0 0,0 0,0 n.m. n.m. n.m.
Net cash flows from investing activities -288,1 -215,8 -503,9 -737,9 -1 241,8 -98,2 -836,1 -1 340,0 -346,3 -241,0 -587,3 20,2% 11,7% 16,6%thereof: from discontinued operations 0,0 0,0 0,0 -6,5 -6,5 0,0 -6,5 -6,5 0,0 0,0 0,0 n.m. n.m. n.m.
Dividend payments to Merck KGaA shareholders 0,0 -168,0 -168,0 0,0 -168,0 0,0 0,0 -168,0 0,0 -180,9 -180,9 n.m. 7,7% 7,7%Dividend payments to non-controlling interests -5,1 -0,2 -5,3 -0,4 -5,8 -0,7 -1,2 -6,5 -7,3 -0,2 -7,4 42,2% -27,2% 39,2%Profit transferred to E.Merck -57,6 -454,6 -512,2 0,0 -512,2 0,0 0,0 -512,2 -48,2 -519,1 -567,3 -16,3% 14,2% 10,8%Changes in financial liabilities to E.Merck -34,1 389,6 355,5 -181,5 174,0 -166,6 -348,1 7,5 -25,3 471,0 445,7 -25,7% 20,9% 25,4%Other changes in net equity 0,0 0,0 0,0 0,0 0,0 0,2 0,2 0,2 0,0 0,0 -0,1 n.m. 373,0% >1.000%Changes in current and non-current financial liabilities 638,2 -68,9 569,3 -198,2 371,1 -1 112,7 -1 310,9 -741,6 86,5 -830,1 -743,6 -86,5% >1.000% n.m.Other changes from financing activities 0,1 0,0 0,1 0,0 0,1 -101,5 -101,5 -101,4 0,1 -0,1 -0,1 -38,0% >1.000% n.m.
Net cash flows from financing activities 541,5 -302,1 239,4 -380,1 -140,7 -1 381,3 -1 761,4 -1 522,0 5,7 -1 059,4 -1 053,7 -98,9% 250,6% n.m.thereof: from discontinued operations 0,0 0,0 0,0 0,0 0,0 0,0 0,0 0,0 0,0 0,0 0,0 n.m. n.m. n.m.
Changes in cash and cash equivalents 769,9 -15,7 754,2 52,4 806,6 -191,3 -138,9 615,3 875,4 -412,2 463,3 13,7% >1.000% -38,6%Changes in cash and cash equivalents due to currency translation -20,1 -2,7 -22,8 -16,6 -39,4 -1,1 -17,6 -40,4 6,8 -0,5 6,3 n.m. -81,5% n.m.
Cash and cash equivalents as of January 1st 780,6 0,0 780,6 0,0 780,6 0,0 0,0 780,6 1 355,4 0,0 1 355,4 73,6% -100,0% 73,6%Cash and cash equivalents 1 530,4 -18,4 1 512,0 35,9 1 547,8 -192,4 -156,5 1 355,5 2 237,7 -412,7 1 825,0 46,2% >1.000% 20,7%
Changes in cash and cash equivalents due to change in scope of consolidation 0,0 0,0 0,0 0,0 0,0 0,0 0,0 0,0 0,0 0,0 0,0 n.m. n.m. n.m.
Business Free Cash FlowEBITDA pre 1 181,3 1 074,2 2 255,5 1 700,7 3 956,2 1 245,2 2 945,9 5 201,4 1 510,6 1 576,2 3 086,8 27,9% 46,7% 36,9%
CAPEX on PPE and Software -175,3 -220,9 -396,2 -258,4 -654,5 -784,1 -1 042,5 -1 438,7 -224,9 -267,4 -492,3 28,3% 21,0% 24,3%Changes in inventory -101,3 -94,0 -195,3 109,5 -85,9 133,9 243,4 48,1 -168,6 -101,5 -270,2 66,4% 8,0% 38,3%Changes in trade accounts receivable -161,5 84,8 -76,7 -2,8 -79,5 223,0 220,3 143,6 -400,6 -33,4 -434,0 148,1% n.m. 465,8%Leasing payments -36,4 -31,2 -67,6 -34,6 -102,2 -41,4 -76,0 -143,6 -33,6 -34,3 -67,9 -7,8% 10,1% 0,4%Adjustments Business Free Cash Flow -45,3 0,0 -45,3 0,0 -45,3 0,0 0,0 -45,3 0,0 0,0 0,0 -100,0% n.m. -100,0%
Business Free Cash Flow 661,5 812,9 1 474,4 1 514,4 2 988,8 776,6 2 291,0 3 765,4 682,9 1 139,6 1 822,5 3,2% 40,2% 23,6%Healthcare 377,2 261,2 638,4 790,3 1 428,7 466,5 1 256,8 1 895,2 242,4 427,7 670,1 -35,7% 63,7% 5,0%Life Science 246,1 471,8 717,9 565,8 1 283,7 310,9 876,7 1 594,6 420,7 638,5 1 059,2 70,9% 35,3% 47,5%Electronics 184,4 204,5 388,9 252,5 641,4 205,5 458,1 847,0 157,4 210,0 367,4 -14,7% 2,7% -5,5%Corporate & Others -146,2 -124,6 -270,7 -94,2 -365,0 -206,4 -300,6 -571,4 -137,6 -136,6 -274,2 -5,9% 9,7% 1,3%
2020 2021 Change YoY

Balance Sheet Merck KGaA, Darmstadt, GermanyGroup€ million 31.mar 30.cze 30.wrz 31. Dez 31.mar 30.cze 30.wrz 31.gru 31.mar 30.cze 30.wrz 31. Dez 31.mar 30.cze 30.wrz 31.gruCurrent assets 10 012,8 9 726,2 10 257,6 9 280,3 10 617,5 10 181,8 22,4% 22,2% 23,7% 22,2% 24,2% 23,6%
Cash and cash equivalents 1 530,4 1 512,0 1 547,8 1 355,4 2 237,7 1 825,0 3,4% 3,5% 3,6% 3,2% 5,1% 4,2%Other current financial assets 81,0 32,0 85,1 124,7 60,3 44,8 0,2% 0,1% 0,2% 0,3% 0,1% 0,1%Trade and other current receivables 3 689,8 3 508,9 3 487,3 3 220,6 3 654,1 3 656,6 8,2% 8,0% 8,1% 7,7% 8,3% 8,5%Inventories 3 443,1 3 537,1 3 427,6 3 293,7 3 462,4 3 563,9 7,7% 8,1% 7,9% 7,9% 7,9% 8,3%Contract assets 84,7 92,5 106,2 169,0 162,3 114,2 0,2% 0,2% 0,2% 0,4% 0,4% 0,3%Other current non-financial assets 552,9 585,4 1 098,6 597,2 631,1 624,5 1,2% 1,3% 2,5% 1,4% 1,4% 1,4%Current income tax receivables 630,9 458,2 504,9 519,7 409,6 352,9 1,4% 1,0% 1,2% 1,2% 0,9% 0,8%Assets held for sale 0,0 0,0 0,0 0,0 0,0 0,0 0,0% 0,0% 0,0% 0,0% 0,0% 0,0%
Non-current assets 34 730,4 34 095,5 32 973,3 32 516,1 33 273,0 32 963,4 77,6% 77,8% 76,3% 77,8% 75,8% 76,4%Goodwill 17 375,9 17 118,0 16 511,8 15 958,8 16 540,8 16 346,8 38,8% 39,1% 38,2% 38,2% 37,7% 37,9%Intangible assets other than goodwill 9 089,3 8 664,1 8 172,5 7 653,3 7 764,6 7 612,6 20,3% 19,8% 18,9% 18,3% 17,7% 17,6%Property, plant and equipment 6 110,4 6 067,3 6 027,5 6 420,9 6 551,6 6 601,4 13,7% 13,8% 13,9% 15,4% 14,9% 15,3%Investments at equity 0,0 0,0 2,1 2,0 2,1 2,1 0,0% 0,0% 0,0% 0,0% 0,0% 0,0%Other non-current financial assets 692,0 673,5 655,5 822,2 768,1 742,5 1,5% 1,5% 1,5% 2,0% 1,8% 1,7%Other non-current receivables 21,4 20,6 25,5 25,4 27,8 28,6 0,0% 0,0% 0,1% 0,1% 0,1% 0,1%Other non-current non-financial assets 83,1 84,3 81,4 80,8 84,7 87,4 0,2% 0,2% 0,2% 0,2% 0,2% 0,2%Non-current income tax receivables 10,5 5,8 9,7 9,9 10,0 9,9 0,0% 0,0% 0,0% 0,0% 0,0% 0,0%Deferred tax assets 1 347,6 1 461,9 1 487,3 1 542,7 1 523,3 1 532,2 3,0% 3,3% 3,4% 3,7% 3,5% 3,6%
Total assets 44 743,2 43 821,7 43 230,9 41 796,4 43 890,5 43 145,2 100,0% 100,0% 100,0% 100,0% 100,0% 100,0%
Current liabilities 10 764,3 10 079,8 9 709,2 9 231,4 10 652,5 9 819,6 24,1% 23,0% 22,5% 22,1% 24,3% 22,8%Current financial debt 3 716,7 4 008,9 3 683,3 2 357,1 3 346,5 3 277,7 8,3% 9,1% 8,5% 5,6% 7,6% 7,6%Trade and other current payables 1 807,4 1 763,7 1 683,7 1 767,6 1 936,8 2 106,7 4,0% 4,0% 3,9% 4,2% 4,4% 4,9%Refund liabilities 626,1 596,8 680,2 666,0 774,6 746,5 1,4% 1,4% 1,6% 1,6% 1,8% 1,7%Other current financial liabilities 1 021,4 408,5 381,9 1 007,9 950,1 392,2 2,3% 0,9% 0,9% 2,4% 2,2% 0,9%Other current non-financial liabilities 1 225,5 1 121,8 1 302,8 1 359,6 1 503,3 1 305,2 2,7% 2,6% 3,0% 3,3% 3,4% 3,0%Income tax liabilities 1 463,0 1 319,3 1 447,0 1 460,3 1 603,9 1 464,9 3,3% 3,0% 3,3% 3,5% 3,7% 3,4%Current provisions 822,0 781,0 424,1 460,5 419,3 382,2 1,8% 1,8% 1,0% 1,1% 1,0% 0,9%Current employee benefit provisions 82,1 79,8 106,2 152,3 117,9 144,1 0,2% 0,2% 0,2% 0,4% 0,3% 0,3%Liabilities included in disposal groups classified as he 0,0 0,0 0,0 0,0 0,0 0,0 0,0% 0,0% 0,0% 0,0% 0,0% 0,0%
Non-current liabilities 15 378,6 15 716,0 15 525,9 15 548,4 14 255,4 13 964,4 34,4% 35,9% 35,9% 37,2% 32,5% 32,4%Non-current financial debt 10 136,6 10 080,8 9 977,5 9 785,1 9 000,8 8 720,7 22,7% 23,0% 23,1% 23,4% 20,5% 20,2%Other non-current financial liabilities 44,1 53,8 58,6 62,2 62,1 67,8 0,1% 0,1% 0,1% 0,1% 0,1% 0,2%Other non-current non-financial liabilities 90,1 89,0 110,1 99,9 82,8 73,6 0,2% 0,2% 0,3% 0,2% 0,2% 0,2%Non-current provisions 252,3 254,6 255,8 280,5 274,7 350,9 0,6% 0,6% 0,6% 0,7% 0,6% 0,8%Non-current employee benefit provisions 3 060,5 3 524,6 3 533,8 3 879,6 3 395,3 3 350,1 6,8% 8,0% 8,2% 9,3% 7,7% 7,8%Deferred tax liabilities 1 795,1 1 713,2 1 590,1 1 441,0 1 439,7 1 401,2 4,0% 3,9% 3,7% 3,4% 3,3% 3,2%
Net equity 18 600,2 18 025,9 17 995,8 17 016,6 18 982,6 19 361,3 41,6% 41,1% 41,6% 40,7% 43,2% 44,9%Equity capital 565,2 565,2 565,2 565,2 565,21 565,2 1,3% 1,3% 1,3% 1,4% 1,3% 1,3%Capital reserves 3 813,7 3 813,7 3 813,7 3 813,7 3 813,7 3 813,7 8,5% 8,7% 8,8% 9,1% 8,7% 8,8%Retained earnings 11 977,5 11 753,2 12 581,2 12 377,5 13 511,1 14 134,1 26,8% 26,8% 29,1% 29,6% 30,8% 32,8%Gain/losses recognized immediately in equity 2 199,9 1 850,0 968,2 189,1 1 025,8 780,3 4,9% 4,2% 2,2% 0,5% 2,3% 1,8%Non-controlling interest 43,9 43,8 67,4 71,1 66,7 68,1 0,1% 0,1% 0,2% 0,2% 0,2% 0,2%
Total liabilities and stockholders' equity 44 743,2 43 821,7 43 230,9 41 796,4 43 890,5 43 145,2 100,0% 100,0% 100,0% 100,0% 100,0% 100,0%
31.mar 30.cze 30.wrz 31. Dez 31.mar 30.cze 30.wrz 31.gru 31.mar 30.cze 30.wrz 31. Dez 31.mar 30.cze 30.wrz 31.gruFinancial debt 13 853,3 14 089,7 13 660,8 12 142,2 12 347,4 11 998,4 31,0% 32,2% 31,6% 29,1% 28,1% 27,8%Net financial debt 12 285,2 12 560,2 12 082,1 10 758,2 10 080,6 10 140,7 27,5% 28,7% 27,9% 25,7% 23,0% 23,5%
2020 2021 Shares of Totals Shares of Totals
2020 2021 Shares of Totals Shares of Totals