Embed Size (px)
Citation preview

91Daiwa Securities Group Annual Report 2008 91Daiwa Securities Group Annual Report 2008
Financial Section
9 2 financial strategy for the
daiwa securities group
9 3 management’s discussion
and analysis
1 0 0 consolidated
balance sheets
1 0 2 consolidated statements
of income
1 0 3 consolidated statements
of changes in net assets
1 0 4 consolidated statements
of cash flows
1 0 6 notes to consolidated
f inancial statements
1 2 4 independent auditors’
report

92 Daiwa Securities Group Annual Report 2008
Financial Strategy for the Daiwa Securities Group
In order to maintain a healthy balance between financial stability and effectiveness, the Daiwa Securities Group concentrates on finding ways to use financial resources to enhance corporate value. The Group seeks to main-tain an appropriate level of liquidity through effective yet flexible methods of procuring and utilizing capital that reflect market conditions. Furthermore, the Group strives to maintain a healthy balance between assets and liabilities, to ensure that its financial condition remains constantly stable.
Effective Methods of Procuring CapitalThe Daiwa Securities Group uses a diverse assortment of methods to
raise capital, including the issuance of straight corporate bonds,
medium-term notes, loans from other financial institutions, commer-
cial paper, call money, gensaki trading (repurchase agreements) and
repo operations. The Group considers market conditions and adopts
an appropriate mix of these methods in order to procure capital
effectively. When utilizing medium- and long-term instruments, such
as straight bonds and medium-term notes, the Group maintains a
constant awareness of trends in the financial markets, and seeks to
procure capital at the most advantageous time possible.
Maintaining Financial StabilityThe Daiwa Securities Group exercises great care to ensure that it
always has access to a stable supply of funds, and thus avoid any
situation that might jeopardize the Group’s continued viability in the
case of extreme fluctuations in economic and financial conditions.
Any time there are signs that the financial markets are entering a
period of volatility, the Group acts promptly to increase liquidity and
prepare itself for any unexpected eventualities.
Group-Wide Capital ManagementDaiwa Securities Group Inc. is responsible for monitoring and manag-
ing liquidity conditions for the Group as a whole. Although the
Group’s domestic and overseas securities subsidiaries (including Daiwa
Securities and Daiwa Securities SMBC), as well as other listed subsid-
iaries (NIF SMBC Ventures) conduct their own fund-raising activities
and have their own internal systems for maintaining liquidity, the
holding company nevertheless monitors their activities and conditions
constantly. Daiwa Securities Group Inc. also conducts the basic capital
procurement activities for other subsidiaries, and manages finances
comprehensively with the goal of allocating capital effectively.
Contingency PlanThe Group has established a contingency plan to address any situa-
tion that might arise, in which sudden market fluctuations make it
difficult to procure capital on unsecured short-term credit. The details
of this contingency plan are monitored and reviewed on a regular
basis, and both the capital procurement plan and the contingency
plan are adjusted, when necessary, to account for any new risk sce-
nario which might become apparent. Furthermore, the Group has
concluded several commitment line contracts with other financial
institutions in order to ensure that it will be able to procure capital in
times of emergency.

93Daiwa Securities Group Annual Report 2008
Q1 Q2 Q32005
Q4 Q1 Q2 Q3 Q4 Q1 Q2 Q4Q32006 2007
-4-
–2-
0-
4-
2-
6-
3/05 9/05 3/06 9/06 3/07 9/07 3/0890-
120-
150-
180-
Macroeconomic Conditions
JapanCyclical trends in the Japanese economy During FY 2007,
the Japanese economy was supported by firm export-related demand
and healthy growth in corporate earnings, which stimulated private
consumption as well. As a result, the gradual economic expansion
which began in 2002 persisted throughout the period. However, in
the latter half of the fiscal year, the sub-prime loan crisis coupled with
a general deceleration in the US economy created turmoil in financial
markets and caused credit conditions to tighten worldwide. Mean-
while, the yen began to strengthen while commodities prices, and
particularly crude oil prices, rose sharply. These external factors cre-
ated rising uncertainty, as the year progressed, and domestic trends
also began to drag on economic growth. For example, revisions to
the Building Standards Law, introduced in June, caused a sudden
drop in new housing starts toward the end of the year.
Although the factors mentioned above generated consider-
able instability in domestic private demand, the ongoing eco-
nomic expansion continued to receive support from the corporate
sector. Exports showed no sign of any dramatic decline, leaving
the main engines which have driven the current economic expan-
sion basically undamaged.
GDP figures for the period (based on the second preliminary
GDP report for FY 2007) showed a real GDP growth rate of 1.6%
year-on-year. Though this was substantially less than the 2.5%
growth registered in FY 2006, considering the dramatic volatility in
both domestic and overseas economic factors, it represents a com-
paratively healthy expansion trend. Breaking down the GDP figures
by demand component, individual consumption rose 1.4% year on
year although employee income did not increase. By contrast, pri-
vate capital investment contracted by 0.5%, the first year-on-year
decline since the expansion began, in 2002. Private housing invest-
ment contracted sharply, by 13.3% year on year, and public
investment continued to recede, falling 1.7% compared with FY
2006. On the other hand, net exports grew 9.7%, providing most of
the momentum for overall economic growth. Domestic demand con-
tributed just 0.3 percentage points of the overall increase in real GDP,
while external demand contributed 1.2 percentage points.
Turmoil in global financial markets The sub-prime loan crisis
in the US triggered chaos in global financial markets, which has
severely tested the global economy in several dimensions. The US
housing and real estate markets were already weak, having registered
a contraction in the previous fiscal year, but in 2007 the situation
deteriorated even further. During July, in particular, the credit ratings
of residential mortgage-backed securities (RMBS) were downgraded
precipitously, and this created a credit crunch that sent ripple effects
into the financial markets of countries around the world. Investors
suddenly became highly averse to risk, and the shock waves could be
seen in the fluctuations of interest rates, exchange rates and stock
prices from country to country. The dollar weakened rapidly on the
international foreign exchange markets, with the yen appreciating from
around ¥120/US$ in July to ¥108/US$ in November. Japan’s Nikkei 225
stock average started the fiscal year at 17,028.41 but weakened to
15,307.78 at the end of December. The US Federal Reserve Board (FRB)
began to respond in September, by lowering interest rates steadily, and
other central banks lent support by providing plenty of liquidity in order
to stabilize the international financial system.
Nevertheless, as 2008 began, the credit crunch continued to
worsen, and the FRB responded by easing monetary policy even fur-
ther, cutting interest rates by stages, lowering the federal funds rate a
total of three percentage points by the end of March. The US econ-
omy showed signs of deterioration, and the interest rate spread
between Japan and the US narrowed so suddenly that the yen broke
through the ¥100=US$1.00 level for the first time since 1995. Stock
prices tumbled in response to the strong yen, with the Nikkei 225
stock average hitting its low for the year on March 17, at 11,787.16.
GDP (Annualized Quarter-on-Quarter Changes) Foreign Exchange Rates
(%) (Yen)
— Real GDP — Nominal GDP
Source: Cabinet Office, Government of Japan— USD/JPY — EUR/JPY
Source: Daiwa Institute of Research
Management’s Discussion and Analysis
(Fiscal year)
(Month-end/year)

94 Daiwa Securities Group Annual Report 2008
3/05 9/05 3/06 9/06 3/07 9/07 3/080-
5,000-
15,000-
10,000-
20,000-
25,000-
-800
-0
-1,600
-2,400
-3,200
-4,000
Meanwhile, the fallout from the sub-prime loan crisis was begin-
ning to hit leading financial institutions. In mid-March, losses from
sub-prime loan-related investments pushed Bear Stearns into insol-
vency, and forced the Federal Reserve Bank of New York to extend an
emergency loan, conducted through JP Morgan Chase. This measure
changed the situation and prevented any further loss of faith in the
credit system, and gradually calmed risk-averse investors. Although
the damage caused by the sub-prime loan collapse is still in the pro-
cess of being cleaned up, this seems to have stabilized the markets,
and most observers now believe that the worst has passed. Stock
markets in one country after another began to recover, and by the
end of March 2008 the Nikkei 225 had rebounded to 12,525.54.
Overseas MarketsAlthough the turmoil in financial markets had an impact that reso-
nated around the world, the rapid economic growth generated by
emerging economies such as India, China, Brazil, Russia and the oil-
rich economies of the Middle East provided support to offset the
economic downturns in developed countries and kept the global
economy on an expansionary course. Due to the slowdown in the
US, the burden of supporting economic growth has been passed to
a multitude of different actors, in a trend that reflects the increasing
diversity of economic power. Indeed, FY 2007 can be viewed as the
watershed year for economic globalization.
However, this rapid enlargement of economic growth has also
produced a surge in demand for raw materials. Demand is skyrocket-
ing, not only for oil and other energy resources, but also for nonfer-
rous metals and other commodities, and this has reinvigorated the
search for and development of alternative energy sources. Since one
of these alternatives is biofuel (ethanol), which is produced from
corn, grain prices have been pushed up as well, contributing to infla-
tion and concerns about a possible food crisis in the future.
Consolidated Operating Results
OverviewThe financial market turmoil created by the sub-prime loan crisis
severely eroded the earnings environment for securities companies,
in FY 2007. Even though the Daiwa Securities Group did not have
any direct involvement in sub-prime loan-related investments, the
indirect impact was considerable, causing ordinary income to fall
53.9% year on year, to ¥90.1 billion and reducing net income by
49.9%, to ¥46.4 billion. Consolidated ROE for the period also
declined dramatically, to 5.3% from 10.8% in FY 2006. The dividend
for the period was ¥22 per share (including an interim dividend of
¥12 per share), producing a dividend payout ratio of 65.3%.
Net Operating RevenuesNet operating revenues declined 15.0% year on year in FY 2007, to
¥447.4 billion. Revenues from commissions decreased 4.0% year on
year, to ¥294.4 billion. Equities declined as the stock market weak-
ened, but sales of equity investment trusts remained brisk and the
balance of assets under management continued to expand, sup-
porting an increase in revenues from asset management activities.
On the other hand, the weak market conditions depressed the
underwriting business and greatly reduced revenues from invest-
ment banking. Trading income suffered the greatest impact due to
the market turmoil, with net gain on trading falling 34.3% year on
year, to ¥103.3 billion. Net gain on private equity and other securi-
ties held by Daiwa Securities SMBC Principal Investments and NIF
SMBC Ventures fell 41.6% year on year, to ¥19.1 billion, as the
weak condition of the IPO market caused profit contributions from
NIF SMBC Ventures to decline.
Breakdown of Commissions by Business SectorA breakdown of commissions according to business sector shows
that equity commissions fell 14.5% year on year, to ¥84.5 billion.
Although average daily trading value on the Tokyo Stock Exchange
increased to ¥2,939.3 billion, the share of trading conducted by indi-
vidual investors dropped off, and the average brokerage commission
rate weakened, pushing down equity brokerage commissions at
Daiwa Securities.
Nikkei Average and Trading Value
(Yen) (¥ billion)
— Nikkei Average at month-end (left) — TSE average daily trading value (right)
Source: Tokyo Stock Exchange, Daiwa Institute of Research
95Daiwa Securities Group Annual Report 2008
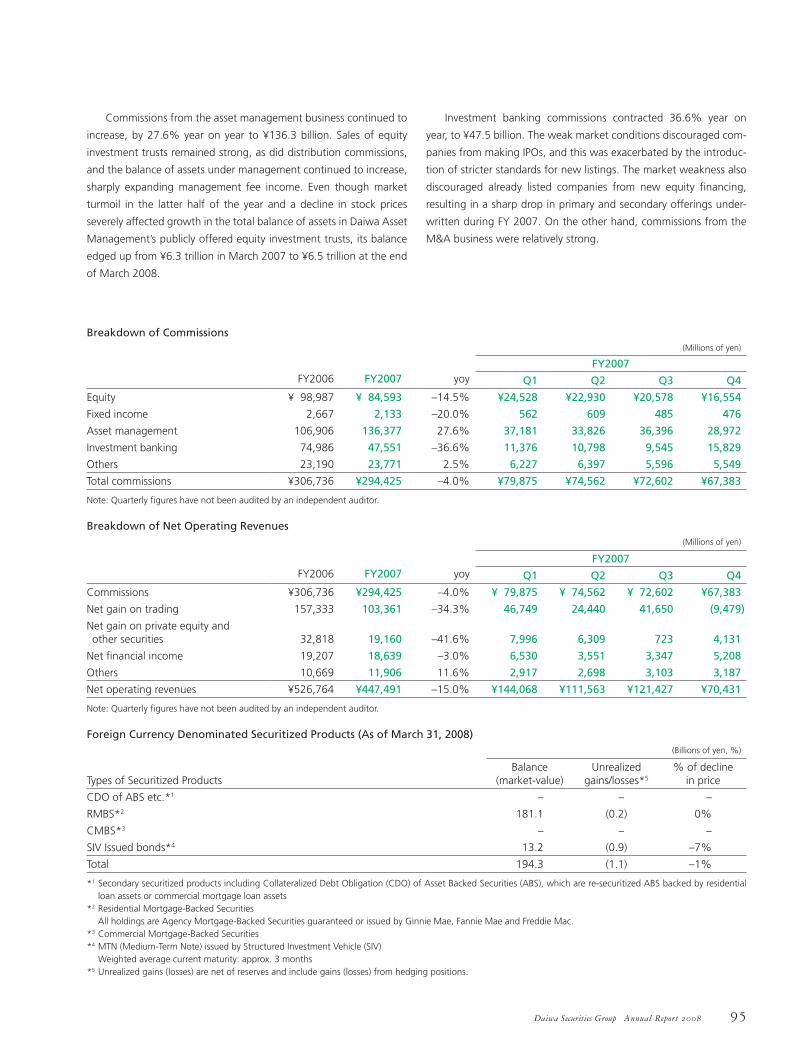
Commissions from the asset management business continued to
increase, by 27.6% year on year to ¥136.3 billion. Sales of equity
investment trusts remained strong, as did distribution commissions,
and the balance of assets under management continued to increase,
sharply expanding management fee income. Even though market
turmoil in the latter half of the year and a decline in stock prices
severely affected growth in the total balance of assets in Daiwa Asset
Management’s publicly offered equity investment trusts, its balance
edged up from ¥6.3 trillion in March 2007 to ¥6.5 trillion at the end
of March 2008.
Investment banking commissions contracted 36.6% year on
year, to ¥47.5 billion. The weak market conditions discouraged com-
panies from making IPOs, and this was exacerbated by the introduc-
tion of stricter standards for new listings. The market weakness also
discouraged already listed companies from new equity financing,
resulting in a sharp drop in primary and secondary offerings under-
written during FY 2007. On the other hand, commissions from the
M&A business were relatively strong.
Breakdown of Commissions(Millions of yen)
FY2006
FY2007
yoy
FY2007
Q1 Q2 Q3 Q4
Equity ¥ 98,987 ¥ 84,593 –14.5% ¥24,528 ¥22,930 ¥20,578 ¥16,554
Fixed income 2,667 2,133 –20.0% 562 609 485 476
Asset management 106,906 136,377 27.6% 37,181 33,826 36,396 28,972
Investment banking 74,986 47,551 –36.6% 11,376 10,798 9,545 15,829
Others 23,190 23,771 2.5% 6,227 6,397 5,596 5,549
Total commissions ¥306,736 ¥294,425 –4.0% ¥79,875 ¥74,562 ¥72,602 ¥67,383
Note: Quarterly figures have not been audited by an independent auditor.
(Millions of yen)
FY2006
FY2007
yoy
FY2007
Q1 Q2 Q3 Q4
Commissions ¥306,736 ¥294,425 –4.0% ¥ 79,875 ¥ 74,562 ¥ 72,602 ¥67,383
Net gain on trading 157,333 103,361 –34.3% 46,749 24,440 41,650 (9,479)
Net gain on private equity and other securities
32,818
19,160
–41.6%
7,996
6,309
723
4,131
Net financial income 19,207 18,639 –3.0% 6,530 3,551 3,347 5,208
Others 10,669 11,906 11.6% 2,917 2,698 3,103 3,187
Net operating revenues ¥526,764 ¥447,491 –15.0% ¥144,068 ¥111,563 ¥121,427 ¥70,431
Note: Quarterly figures have not been audited by an independent auditor.
Breakdown of Net Operating Revenues
(Billions of yen, %)
Types of Securitized Products
Balance (market-value)
Unrealized gains/losses*5
% of decline in price
CDO of ABS etc.*1 – – –
RMBS*2 181.1 (0.2) 0%
CMBS*3 – – –
SIV Issued bonds*4 13.2 (0.9) –7%
Total 194.3 (1.1) –1%
*1 Secondary securitized products including Collateralized Debt Obligation (CDO) of Asset Backed Securities (ABS), which are re-securitized ABS backed by residential loan assets or commercial mortgage loan assets
*2 Residential Mortgage-Backed Securities All holdings are Agency Mortgage-Backed Securities guaranteed or issued by Ginnie Mae, Fannie Mae and Freddie Mac.*3 Commercial Mortgage-Backed Securities*4 MTN (Medium-Term Note) issued by Structured Investment Vehicle (SIV) Weighted average current maturity: approx. 3 months*5 Unrealized gains (losses) are net of reserves and include gains (losses) from hedging positions.
Foreign Currency Denominated Securitized Products (As of March 31, 2008)

96 Daiwa Securities Group Annual Report 2008
Performance of Major Group CompaniesOperating revenues from Daiwa Securities’ retail securities business
dipped 1.9% year on year, to ¥226.2 billion, and ordinary income fell
4.6% to ¥71.0 billion. In addition to a drop in securities trading activ-
ity by individual investors, the company was affected by a drop in the
number of underwriting deals, which sharply reduced equity broker-
age and distribution commissions. On the other hand, the balance of
assets in investment trusts increased, producing a strong rise in
agency commissions. Total commissions for the period were down
7.4% year on year, to ¥172.0 billion. Strong sales of foreign cur-
rency-denominated bonds, on the other hand, produced a 21.3%
advance in net gain on trading, to ¥45.2 billion.
Customer assets under custody as of the end of March 2008
stood at ¥28.8 trillion, a decline of 10.9% year on year, due to the
drop in equity prices. In September, commissions for margin trading
in foreign currencies, using the Daiwa FX online trading system, were
eliminated, thus producing a dramatic jump in the number of
accounts and total trading value. Furthermore, Daiwa Securities’
Wrap Account service for high-net-worth individuals was bolstered
by the launch of Daiwa Fund Wrap services, in October 2007.
Selling, General and Administrative (SG&A) ExpensesSG&A expenses increased 6.9% year on year, to ¥363.8 billion. The
main factors contributing to this increase were a rise in fees and com-
missions paid (up 19.5% year on year), including agency commis-
sions paid for the sale of investment trusts through sales channels
outside the Group, and a rise in office expenses (up 29.8%) due to
increased outsourcing of systems development work. As a percent-
age of net operating revenues, SG&A expenses rose to 81.3% in FY
2007, compared with 64.6% in FY 2006.
Ordinary Income and Net IncomeOrdinary income declined by 53.9% in FY 2007, to ¥90.1 billion. The
net of extraordinary items showed a loss of ¥8.1 billion, including an
¥8.2 billion write-down of investment securities and ¥1.3 billion in
costs for relocation of the headquarters. Net income for the period
declined 49.9% year on year, to ¥46.4 billion.
(Millions of yen)
FY2006
FY2007
yoy
FY2007
Q1 Q2 Q3 Q4
Ordinary income (loss) ¥195,415 ¥90,143 –53.9% ¥54,092 ¥21,204 ¥30,511 ¥(15,664)
Net income (loss) 92,725 46,411 –49.9% 27,335 14,739 17,264 (12,928)
Note: Quarterly figures have not been audited by an independent auditor.
Ordinary Income and Net Income

97Daiwa Securities Group Annual Report 2008
Consolidated earnings from Daiwa Securities SMBC’s wholesale
securities business include contributions from overseas subsidiaries
and those from Daiwa Securities SMBC Principal Investments, a
domestic subsidiary which oversees the Group’s investment business.
Consolidated operating revenues in this division declined 23.6% year
on year, to ¥242.2 billion, while ordinary income dropped 98.5%, to
¥1.4 billion. Earnings were severely affected by the market turmoil
associated with the sub-prime loan crisis. Net gains on trading
plunged 53.2% year on year, to ¥54.6 billion. Total commissions
declined 27.3%, to ¥77.4 billion; although brokerage commissions
remained essentially unchanged from the previous year, commissions
from the investment banking division were adversely affected by the
weak market conditions and an associated decline in equity financ-
ing activity, which caused equity underwriting commissions to fall
sharply. Net gains on private equity and other securities held by
Daiwa Securities SMBC Principal Investments were healthy during
the first half of the fiscal year, but market weakness in the second
half caused equity prices to fall, and prevented the company from
exiting from its investments. Net gains on private equity and other
securities were down 14.4% from the previous year, to ¥23.7 billion,
though the total investment balance increased by ¥83.0 billion, to
¥439.0 billion at the end of March 2008.
Asset management operations, centering on Daiwa Asset
Management, registered brisk sales of equity investment trusts
through Daiwa Securities and major banks, and this produced a
steady increase in the balance of assets under management. As of
March 2008, the balance of assets in equity investment trusts stood
at ¥6.5 trillion. Although this represented only a slight increase com-
pared with the level in March 2007, the balance reached a peak level
of ¥7.5 billion in June 2007, before asset prices began to fall. As a
result, management fees expanded and ordinary income at Daiwa
Asset Management rose 34.4% year on year, to a historical peak of
¥17.4 billion. Ordinary income at Daiwa SB Investments, an equity-
method affiliate, also reached a new record high, rising 30.5% year
on year to ¥5.7 billion.
(Millions of yen)
Daiwa Institute of Research Daiwa SB Investments NIF SMBC Ventures
FY2006 FY2007 FY2006 FY2007 FY2006 FY2007
Ordinary income (loss) ¥9,744 ¥13,379 ¥4,407 ¥5,752 ¥4,233 ¥(5,321)
(Millions of yen)
Daiwa Securities
Daiwa Securities SMBC (consolidated)
Daiwa Asset Management
FY2006 FY2007 FY2006 FY2007 FY2006 FY2007
Operating revenues ¥230,649 ¥226,273 ¥317,118 ¥242,269 ¥58,933 ¥83,079
Ordinary income 74,477 71,026 92,866 1,431 13,015 17,494
Net income (loss) 43,468 41,009 51,945 (5,836) 8,659 10,665
Performance of Major Group Companies

98 Daiwa Securities Group Annual Report 2008
Overseas PerformanceOperating revenues generated in the Asia & Oceania region grew
dramatically in FY 2007, but SG&A expenses also soared, causing
ordinary income to decline marginally. In The Americas, by contrast,
operating revenues decreased slightly but SG&A costs were reduced
as well, producing a slight rise in ordinary income from the region.
Business in Europe was affected by both the decline in Japanese
stock prices and the market impact of the sub-prime loan crisis. Both
commissions and net gains on trading registered substantial year-on-
year declines, and this dragged down overall earnings from overseas
operations. Ordinary income from overseas operations fell 89.8%
year on year, to ¥1.4 billion.
AssetsTotal assets at the end of March 2008 stood at ¥17,307.1 billion, rep-
resenting an increase of ¥2,895.8 billion, year on year. Current assets
increased by ¥2,862.1 billion, to ¥16,753.2 billion, whereas fixed
assets increased by ¥33.6 billion year on year, to ¥553.8 billion. The
main factor behind this sharp increase in current assets was a ¥2,081.6
billion surge in the value of bonds held for trading products.
Liabilities and Net AssetsTotal liabilities amounted to ¥16,224.1 billion at the end of March
2008, an increase of ¥3,036.1 billion year on year. Current liabilities
increased by ¥2,980.9 billion year on year, to ¥14,920.9 billion, and
long-term liabilities increased by ¥55.0 billion, to ¥1,295.2 billion. The
increase in current liabilities included a ¥1,079.5 billion rise in collat-
eralized short-term financing agreements and a ¥754.2 billion increase
in short-term borrowings. The increase in long-term liabilities resulted
from the holding company’s issuance of straight corporate bonds.
Total net assets declined by ¥140.3 billion year on year, to
¥1,082.9 billion at the end of March 2008. The two largest factors in
this decline were a ¥51.1 billion decline in net unrealized gains
(losses) on securities and a ¥50.0 billion decline in the balance of
treasury stock. Following the inflow from net income and the distri-
bution of dividends to shareholders, retained earnings registered a
¥7.1 billion increase, year on year.
(Millions of yen)
FY 2006 FY 2007
The Americas ¥ 1,625 ¥ 1,948
Europe 8,415 (4,190)
Asia & Oceania 3,829 3,661
Total ¥13,870 ¥ 1,419
Breakdown of Operating Income by Geographic Region
(As of July 1, 2008)
Daiwa Securities Group Inc. Daiwa Securities Daiwa Securities SMBC
Long-term Short-term Long-term Short-term Long-term Short-term
Moody’s Baa1 – Baa1 P-2 A1 P-1
Standard & Poor’s BBB+ A-2 BBB+ A-2 A A-1
Rating and Investment Information (R&I)
A
a-1
A
a-1
A+
a-1
Japan Credit Rating Agency (JCR) A+ – A+ – – –
The Daiwa Securities Group’s Credit Ratings

99Daiwa Securities Group Annual Report 2008
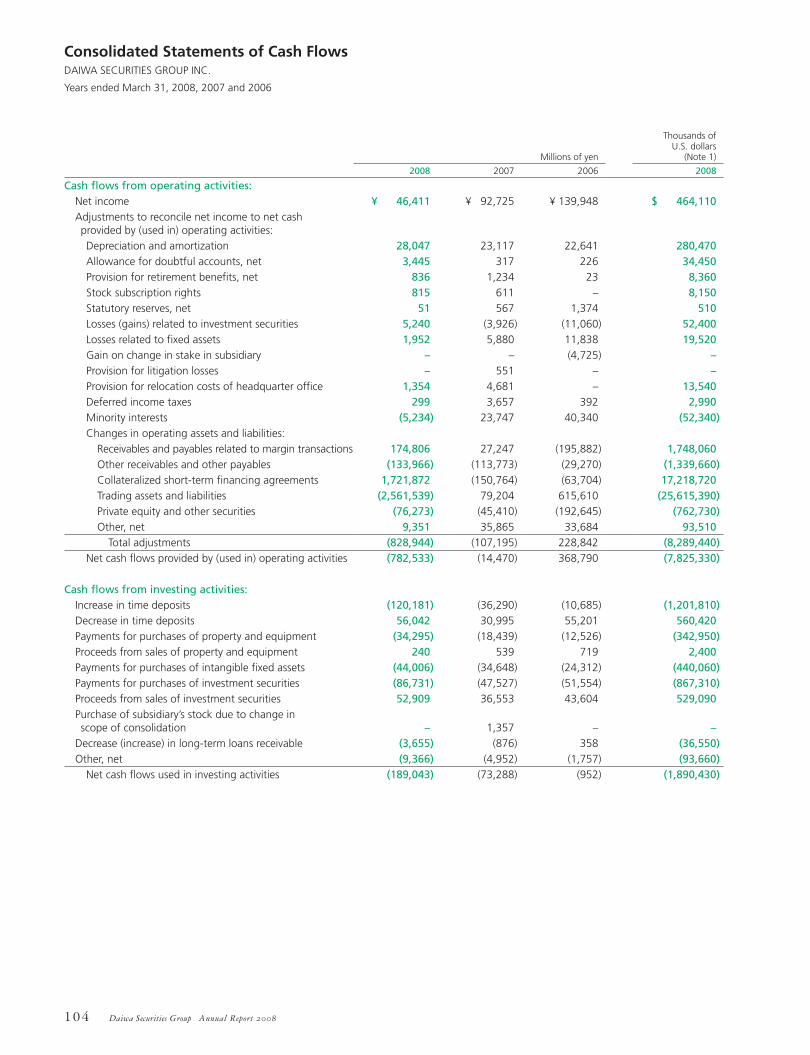
Cash FlowsCash flow from operating activities showed a ¥782.5 billion net out-
flow (compared with a ¥14.4 billion outflow in FY 2006), as cash was
used to increase the balance of trading products. Cash flow from
investment activities also showed a net outflow, due to investment in
IT systems and an increase in time deposits. The net outflow for the
period was ¥189.0 billion, compared with a ¥73.2 billion outflow in
FY 2006. Cash flow from financing activities showed a net inflow of
¥991.0 billion (versus a ¥43.1 billion inflow in FY 2006), generated
primarily by loans and the issuance of straight corporate bonds. After
adding in the impact of exchange rate fluctuations and other factors,
the balance of cash and cash equivalents stood at ¥359.8 billion at
the end of March 2008.
Capital InvestmentsThe goals of Daiwa Securities Group’s capital investment activities
include the establishment of a solid business foundation that will
enhance competitiveness and improve customer convenience. During
FY 2007, the Group invested in improvements to the online trading
systems at Daiwa Securities, as well as an upgrade to the Group’s
core operating system for administrative activities. In addition to
these IT-related investments, the Group continued to invest in the
transfer, refurbishing and expansion of existing branch offices, and in
the relocation of head office functions to the GranTokyo North Tower,
located near the Yaesu exit of Tokyo Station.
(Millions of yen)
FY2006 FY2007
Cash flow from operating activities ¥ (14,470) ¥(782,533)
Cash flow from investing activities (73,288) (189,043)
Cash flow from financing activities 43,163 991,087
Cash and cash equivalents at end of term
¥ 352,779
¥ 359,851
Cash Flows

100 Daiwa Securities Group Annual Report 2008
Consolidated Balance SheetsDAIWA SECURITIES GROUP INC.
March 31, 2008 and 2007
Millions of yen
Thousands of U.S. dollars
(Note 1)
ASSETS 2008 2007 2008
Cash and cash deposits: Cash and cash equivalents (Note 6) ¥ 359,851 ¥ 352,779 $ 3,598,510 Cash segregated as deposits for regulatory purposes 233,545 256,435 2,335,450 Time deposits (Note 8) 85,125 21,031 851,250
678,521 630,245 6,785,210
Receivables: Loans receivable from customers 75,422 1,925 754,220 Loans receivable from other than customers (Note 8) 152,617 143,467 1,526,170 Trading receivables, net 219,314 – 2,193,140 Receivables related to margin transactions (Note 3) 369,312 575,457 3,693,120 Other 614,825 122,029 6,148,250 Less: Allowance for doubtful accounts 1,385 141 13,850
1,430,105 842,737 14,301,050
Collateralized short-term financing agreements (Note 4) 6,206,327 6,814,612 62,063,270
Trading assets (Notes 5 and 8) 7,857,122 5,082,219 78,571,220
Private equity and other securities (Notes 6 and 8) 471,732 440,178 4,717,320
Deferred tax assets (Note 13) 31,348 25,680 313,480
Property and equipment, at cost 260,104 245,590 2,601,040Less: Accumulated depreciation 106,711 111,054 1,067,110
153,393 134,536 1,533,930
Other assets: Intangible fixed assets 101,880 81,315 1,018,800 Lease deposits 30,130 23,729 301,300 Investment securities (Notes 6 and 8) 254,716 269,805 2,547,160 Long-term loans receivable 11,436 11,492 114,360 Other (Note 8) 82,676 56,316 826,760 Less: Allowance for doubtful accounts 2,267 1,599 22,670
478,571 441,058 4,785,710
¥17,307,119 ¥14,411,265 $173,071,190
See accompanying notes.

101Daiwa Securities Group Annual Report 2008
Millions of yen
Thousands of U.S. dollars
(Note 1)
LIABILITIES AND NET ASSETS 2008 2007 2008
Borrowings: Short-term borrowings (Notes 8 and 11) ¥ 2,349,828 ¥ 1,595,585 $ 23,498,280 Commercial paper 488,300 302,392 4,883,000 Long-term debt (Notes 8 and 11) 1,406,400 1,261,513 14,064,000
4,244,528 3,159,490 42,445,280
Payables: Payables to customers and counterparties (Note 10) 711,583 233,164 7,115,830 Trading payables, net – 67,771 – Payables related to margin transactions (Notes 3 and 8) 202,010 233,353 2,020,100 Other 30,039 33,279 300,390
943,632 567,567 9,436,320
Collateralized short-term financing agreements (Note 4) 6,238,684 5,159,100 62,386,840
Trading liabilities (Note 5) 4,643,644 4,105,362 46,436,440
Accrued and other liabilities: Income taxes payable 21,538 12,551 215,380 Deferred tax liabilities (Note 13) 4,556 33,290 45,560 Accrued bonuses 17,326 31,200 173,260 Retirement benefits (Note 12) 24,016 23,181 240,160 Provision for relocation costs of headquarter office 4,130 3,757 41,300 Provision for litigation losses 779 623 7,790 Other 73,345 84,021 733,450
145,690 188,623 1,456,900
Statutory reserves (Note 14) 8,017 7,897 80,170 Total liabilities 16,224,195 13,188,039 162,241,950
Contingent liabilities (Note 15)
Net assets: Owners’ equity (Note 16)
Common stock, no par value;
Authorized—4,000,000 thousand shares
Issued—1,404,665 thousand shares as of March 31, 2008 178,324 178,324 1,783,240 Capital surplus 157,679 157,679 1,576,790 Retained earnings 527,579 520,474 5,275,790 Treasury stock at cost (61,701) (11,628) (617,010) Paid-in money for treasury stock – 5 –
801,881 844,854 8,018,810 Valuation and translation adjustments
Net unrealized gain on securities, net of tax effect 24,470 75,658 244,700 Deferred gain on hedges, net of tax effect 801 468 8,010 Translation adjustments (9,062) 8,546 (90,620)
16,209 84,672 162,090 Stock subscription rights (Note 17) 1,430 611 14,300 Minority interests 263,404 293,089 2,634,040 Total net assets 1,082,924 1,223,226 10,829,240
¥17,307,119 ¥14,411,265 $173,071,190

102 Daiwa Securities Group Annual Report 2008
Consolidated Statements of IncomeDAIWA SECURITIES GROUP INC.
Years ended March 31, 2008, 2007 and 2006
Millions of yen
Thousands of U.S. dollars
(Note 1)
2008 2007 2006 2008
Operating revenues: Commissions (Note 20) ¥294,425 ¥306,736 ¥309,189 $2,944,250 Net gain on trading (Note 21) 103,361 157,333 224,912 1,033,610 Net gain on private equity and other securities 19,160 32,818 21,539 191,600 Interest and dividend income 358,423 373,453 245,211 3,584,230 Service fees and other revenues 50,053 46,968 44,809 500,530
825,422 917,308 845,660 8,254,220
Interest expense 339,784 354,245 231,572 3,397,840Cost of service fees and other revenues 38,147 36,299 34,729 381,470Net operating revenues (Note 19) 447,491 526,764 579,359 4,474,910
Selling, general and administrative expenses (Notes 12, 19 and 22) 363,859 340,373 325,199 3,638,590Operating income (Note 19) 83,632 186,391 254,160 836,320
Other income (expenses): Provision for statutory reserves, net (Note 14) (52) (566) (1,374) (520) Other, net (Note 23) (1,629) 98 5,570 (16,290)
(1,681) (468) 4,196 (16,810)Income before income taxes and minority interests 81,951 185,923 258,356 819,510
Income taxes (Note 13): Current 40,475 65,794 77,676 404,750 Deferred 299 3,657 392 2,990
40,774 69,451 78,068 407,740
Minority interests 5,234 (23,747) (40,340) 52,340Net income ¥ 46,411 ¥ 92,725 ¥139,948 $ 464,110
Yen
U.S. dollars (Note 1)
Per share amounts: Net income ¥33.69 ¥67.90 ¥103.90 $0.34 Diluted net income 33.63 66.07 98.61 0.34 Cash dividends applicable to the year 22.00 28.00 34.00 0.22
See accompanying notes.

103Daiwa Securities Group Annual Report 2008
Consolidated Statements of Changes in Net AssetsDAIWA SECURITIES GROUP INC.
Years ended March 31, 2008, 2007 and 2006
Millions of yenOwners’ equity Valuation and translation adjustments
Number of shares of common
stock (thousands)
Common stock
Capital surplus
Retained earnings
Treasury stock
at cost
Paid-in
money for treasury
stock
Net unrealized
gain (loss) on securities, net
of tax effect
Deferred
gain (loss) on hedges, net of tax effect
Translation adjustments
Stock subscription
rights
Minority interests
Balance at March 31, 2005 1,331,736 ¥ 138,432 ¥ 117,941 ¥ 362,949 ¥ (787) ¥ – ¥ 35,674 ¥ – ¥ (5,877) ¥ – ¥ 189,194
Conversion of convertible bonds 724 396 396
Cash dividends paid (26,612)
Bonuses to directors (677)
Net income 139,948
Change in treasury stock, net 2 (13,873)
Increase in retained earnings due to merger of a consolidated subsidiary
608
Net changes of items other than owners’ equity
37,020
(199)
6,741
47,525
Balance at March 31, 2006 1,332,460 138,828 118,339 476,216 (14,660) – 72,694 (199) 864 – 236,719
Conversion of convertible bonds 72,205 39,496 39,496
Cash dividends paid (45,806)
Bonuses to directors and executive officers
(1,828)
Net income 92,725
Change in treasury stock, net (156) (1,239) 3,032
Increase in retained earnings due to merger of a consolidated subsidiary
406
Other 5
Net changes of items other than owners’ equity
2,964
667
7,682
611
56,370
Balance at March 31, 2007 1,404,665 178,324 157,679 520,474 (11,628) 5 75,658 468 8,546 611 293,089
Cash dividends paid (38,788)
Net income 46,411
Change in treasury stock, net (346) (50,073)
Decrease due to addition of a consolidated subsidiary
(172)
Other (5)
Net changes of items other than owners’ equity
(51,188)
333
(17,608)
819
(29,685)
Balance at March 31, 2008 1,404,665 ¥ 178,324 ¥ 157,679 ¥ 527,579 ¥ (61,701) ¥ – ¥ 24,470 ¥ 801 ¥ (9,062) ¥ 1,430 ¥ 263,404
Thousands of U.S. dollars (Note 1)Owners’ equity Valuation and translation adjustments
Common stock
Capital surplus
Retained earnings
Treasury stock
at cost
Paid-in
money for treasury
stock
Net unrealized
gain (loss) on securities, net
of tax effect
Deferred
gain (loss) on hedges, net of tax effect
Translation adjustments
Stock subscription
rights
Minority interests
Balance at March 31, 2007 $1,783,240 $1,576,790 $5,204,740 $ (116,280) $ 50 $ 756,580 $4,680 $ 85,460 $ 6,110 $2,930,890
Cash dividends paid (387,880)
Net income 464,110
Change in treasury stock, net (3,460) (500,730)
Decrease due to addition of a consolidated subsidiary
(1,720)
Other (50)
Net changes of items other than owners’ equity
(511,880)
3,330
(176,080)
8,190
(296,850)
Balance at March 31, 2008 $1,783,240 $1,576,790 $5,275,790 $(617,010) $ – $ 244,700 $8,010 $ (90,620) $14,300 $2,634,040
See accompanying notes.
104 Daiwa Securities Group Annual Report 2008
Consolidated Statements of Cash FlowsDAIWA SECURITIES GROUP INC.
Years ended March 31, 2008, 2007 and 2006
Millions of yen
Thousands of U.S. dollars
(Note 1)
2008 2007 2006 2008
Cash flows from operating activities: Net income ¥ 46,411 ¥ 92,725 ¥ 139,948 $ 464,110 Adjustments to reconcile net income to net cash provided by (used in) operating activities:
Depreciation and amortization 28,047 23,117 22,641 280,470 Allowance for doubtful accounts, net 3,445 317 226 34,450 Provision for retirement benefits, net 836 1,234 23 8,360 Stock subscription rights 815 611 – 8,150 Statutory reserves, net 51 567 1,374 510 Losses (gains) related to investment securities 5,240 (3,926) (11,060) 52,400 Losses related to fixed assets 1,952 5,880 11,838 19,520 Gain on change in stake in subsidiary – – (4,725) – Provision for litigation losses – 551 – – Provision for relocation costs of headquarter office 1,354 4,681 – 13,540 Deferred income taxes 299 3,657 392 2,990 Minority interests (5,234) 23,747 40,340 (52,340) Changes in operating assets and liabilities:
Receivables and payables related to margin transactions 174,806 27,247 (195,882) 1,748,060 Other receivables and other payables (133,966) (113,773) (29,270) (1,339,660) Collateralized short-term financing agreements 1,721,872 (150,764) (63,704) 17,218,720 Trading assets and liabilities (2,561,539) 79,204 615,610 (25,615,390) Private equity and other securities (76,273) (45,410) (192,645) (762,730) Other, net 9,351 35,865 33,684 93,510 Total adjustments (828,944) (107,195) 228,842 (8,289,440) Net cash flows provided by (used in) operating activities (782,533) (14,470) 368,790 (7,825,330)
Cash flows from investing activities: Increase in time deposits (120,181) (36,290) (10,685) (1,201,810) Decrease in time deposits 56,042 30,995 55,201 560,420 Payments for purchases of property and equipment (34,295) (18,439) (12,526) (342,950) Proceeds from sales of property and equipment 240 539 719 2,400 Payments for purchases of intangible fixed assets (44,006) (34,648) (24,312) (440,060) Payments for purchases of investment securities (86,731) (47,527) (51,554) (867,310) Proceeds from sales of investment securities 52,909 36,553 43,604 529,090 Purchase of subsidiary’s stock due to change in scope of consolidation
–
1,357
–
–
Decrease (increase) in long-term loans receivable (3,655) (876) 358 (36,550) Other, net (9,366) (4,952) (1,757) (93,660) Net cash flows used in investing activities (189,043) (73,288) (952) (1,890,430)

105Daiwa Securities Group Annual Report 2008
Millions of yen
Thousands of U.S. dollars
(Note 1)
2008 2007 2006 2008
Cash flows from financing activities: Increase (decrease) in short-term borrowings and commercial paper
¥ 945,660
¥ (97,430)
¥(446,190)
$ 9,456,600
Proceeds from issuance of notes 442,593 509,087 505,358 4,425,930 Payments for redemption of bonds and notes (294,317) (362,305) (401,374) (2,943,170) Increase (decrease) in other long-term debt (2,682) 10,360 58,496 (26,820) Proceeds from issuance of stocks to minority shareholders – 40,080 10,000 – Payments of cash dividends (38,787) (45,806) (26,612) (387,870) Payments of cash dividends to minority shareholders (10,894) (12,039) (9,177) (108,940) Other, net (50,486) 1,216 (13,446) (504,860) Net cash flows provided by (used in) financing activities 991,087 43,163 (322,945) 9,910,870
Effect of exchange rate changes on cash and cash equivalents
(13,582)
4,788
7,429
(135,820)
Net increase (decrease) in cash and cash equivalents 5,929 (39,807) 52,322 59,290Cash and cash equivalents at beginning of year 352,779 392,350 338,697 3,527,790Increase in cash and cash equivalents due to merger of a consolidated subsidiary
655
236
1,331
6,550
Increase in cash equivalents due to addition of a consolidated subsidiary
488
–
–
4,880
Cash and cash equivalents at end of year ¥ 359,851 ¥ 352,779 ¥ 392,350 $ 3,598,510
Supplemental information on cash flows: Cash paid during the year for:
Interest ¥ 342,670 ¥ 348,266 ¥ 222,153 $ 3,426,700 Income taxes 46,291 111,811 11,405 462,910
See accompanying notes.

106 Daiwa Securities Group Annual Report 2008
The consolidated financial statements include the accounts of
Daiwa Securities Group Inc. (“the Company”), a Japanese corpo-
ration, and its subsidiaries (collectively “Daiwa”). Daiwa’s princi-
pal subsidiaries include:
—Daiwa Securities Co. Ltd. (“Daiwa Securities”)
—Daiwa Securities SMBC Co. Ltd. (“Daiwa Securities SMBC”)
—Daiwa Asset Management Co. Ltd. (“DAM”)
—Daiwa Institute of Research Ltd. (“DIR”)
—NIF SMBC Ventures Co., Ltd. (“NIF SMBC”)
(NIF Ventures Co., Ltd., a consolidated subsidiary of the Company
changed its name to NIF SMBC Ventures Co., Ltd. following the
merger with SMBC Capital Co., Ltd. on October 1, 2005.)
Daiwa Securities is the retail-securities arm of Daiwa. This company
operates through a network of 117 branches as well as non-face-to-
face channels, including the Internet and a full-fledged call center to
provide online and telephone-based securities-related services. Daiwa
Securities SMBC is the wholesale-securities company of Daiwa, a
60%-owned joint venture with Sumitomo Mitsui Financial Group,
Inc. DAM is the asset management company of Daiwa. In addition,
Daiwa has several overseas consolidated subsidiaries, mainly engaged
in the securities business.
Daiwa is primarily engaged in the business of a securities broker-
dealer, pursuant to which Daiwa provides services including broker-
age, trading, underwriting, strategic advice, product development,
and structured finance. In addition, Daiwa provides asset and capital
management, principal investment, venture capital, and research
through a network in major capital markets and other services.
Notes to Consolidated Financial StatementsDAIWA SECURITIES GROUP INC.
Years ended March 31, 2008, 2007 and 2006
The Company and its domestic consolidated subsidiaries maintain
their official accounting records in yen. The accompanying consoli-
dated financial statements have been prepared in accordance with
the provisions set forth in the Financial Instruments and Exchange Act
of Japan and its related accounting regulations, and in conformity
with generally accepted accounting principles in Japan (“Japanese
GAAP”), which are different in certain respects as to application and
disclosure requirements of International Financial Reporting Stan-
dards. The accounts of overseas consolidated subsidiaries are main-
tained in conformity with generally accepted accounting principles
and practices prevailing in the respective countries of domicile.
The accompanying consolidated financial statements have been
restructured and translated into English (with some expanded descrip-
tions) from the consolidated financial statements of the Company
prepared in accordance with Japanese GAAP and filed with the appro-
priate Local Finance Bureau of the Ministry of Finance as required by
the Financial Instruments and Exchange Act. Some supplementary
information included in the statutory Japanese language consolidated
financial statements, but not required for fair presentation, is not pre-
sented in the accompanying consolidated financial statements.
The translations of the yen amounts into U.S. dollars are included
solely for the convenience of the reader, using the prevailing exchange
rate at March 31, 2008, which was ¥100 to U.S.$1. The convenience
translations should not be construed as representations that the yen
amounts have been, could have been, or could be, converted into
U.S. dollars at this or any other rate of exchange.
1. Basis of financial statements
2. Significant accounting policies
Consolidation—The consolidated financial statements include the
accounts of the Company and significant companies which are con-
trolled by the Company through substantial ownership of more than
50% of the voting rights (excluding companies owned for the pur-
pose of operating principal investment and venture capital business,
and not for the purpose of affiliation to the group) or through own-
ership of at least 40% and less than 50% of the voting rights and the
existence of certain conditions evidencing control by the Company of
the decision-making body of such companies.
In addition to investments in companies in excess of 20% (excluding
companies owned for the purpose of operating principal investment
and venture capital business, and not for the purpose of affiliation to
the group through personnel management, financial resources,
technology, transactions, etc.), certain companies for which the
Company has at least 15% and less than 20% of the voting rights
and in cases where the Company has the ability to exercise signifi-
cant influence over operating and financial policies of the investees
are accounted for by using the equity method.
Practical Issues Task Force No. 20, “Practical Solution on Application
of Control Criteria and Influence Criteria to Investment Associa-
tions,” has been applied from the fiscal year ended March 31, 2007.
There was no impact on the financial statements for the years ended
March 31, 2008 and 2007.
Material inter-company balances, transactions and profits have been
eliminated in consolidation.
107Daiwa Securities Group Annual Report 2008
Statements of cash flows—For purposes of the consolidated state-
ments of cash flows, the Company defines cash equivalents as highly
liquid investments with original maturities of three months or less.
Trading assets and trading liabilities—Trading assets and liabilities
including securities and financial derivatives for trading purposes
held by securities companies are recorded on a trade date basis at fair
value in the consolidated balance sheets. Gains and losses including
unrealized gains and losses related to transactions for trading pur-
poses are reported as “Net gain on trading” in the accompanying
consolidated statements of income. Fair value is determined based
on market prices, quoted prices, internal pricing models (utilizing
indicators of general market conditions or other economic measure-
ments), or management’s estimates of amounts to be realized on
settlement, assuming current market conditions and an orderly dis-
position over a reasonable period of time. Securities owned for non-
trading purposes, shown in the accompanying consolidated balance
sheets as “Cash and cash equivalents,” “Private equity and other
securities” and “Investment securities,” are discussed below.
Securities other than trading assets and trading liabilities—Daiwa
examines the intent of holding securities and classifies those securities as
(a) securities intended to be held for trading purposes by non-securities
companies, (b) debt securities intended to be held to maturity (“held-to-
maturity debt securities”), and (c) all other securities not classified in any
of the above categories (“available-for-sale securities”).
Securities intended to be held for trading purposes by non-securities
companies are carried at fair value with recognized unrealized gains
or losses included in the consolidated statements of income.
Held-to-maturity debt securities are stated at amortized cost.
Available-for-sale securities with market value are stated at market
value, based on quoted market prices. Realized gains and losses on
sale of such securities are computed using the moving-average cost.
Unrealized gains and losses on these securities are reported, net of
tax effect, as a separate component of net assets.
Available-for-sale securities, for which a market value is not available,
are stated at the moving-average cost.
If the market value of available-for-sale securities declines signifi-
cantly, such securities are considered to be impaired and the differ-
ence between market value and the carrying amount is recognized
as a loss in the period of the decline. For available-for-sale securities,
which do not have readily available market value, if the net book
value declines significantly and if such decline is considered to be
other than temporary, the difference between the carrying amount
and the net book value is recognized as a loss in the period of the
decline. Impaired losses on these securities are reported in the con-
solidated statements of income.
Based on “Practical Solution on Accounting for the Book Value of
Class Shares at the Balance Sheet Date” (Practical Issues Task Force
No. 10), net unrealized gain on securities, net of tax effect as of
March 31, 2007 included ¥7,974 million derived from the invest-
ments in corporations’ class shares, which were in period convertible
into common shares. As of March 31, 2008, such unrealized gain on
securities was immaterial.
Of those securities with no fair value, investments in limited partner-
ships and similar partnerships which are regarded as equivalent to
securities by Article 2 (2) of the Financial Instruments and Exchange
Act, the share of net income of the partnerships has been reflected
in the consolidated statements of income and the share of net unre-
alized gains and losses held by the partnerships is directly recorded
under net assets.
Derivatives used for non-trading purpose—Daiwa states deriva-
tive financial instruments at fair value and recognizes changes in the
fair value as gains or losses unless the derivative financial instruments
are used for hedging purposes. Valuation gains or losses on hedging
instruments are mainly deferred as assets or liabilities until the gains
or losses on the underlying hedged instruments are realized. Interest
received or paid on interest rate swap agreements for hedging pur-
poses is accrued without being marked-to-market. The premium or
discount on forward exchange contracts for hedging purposes is
allocated to each fiscal term without being marked-to-market.
Collateralized short-term financing agreements—Collateralized
short-term financing agreements consist of securities purchased
under agreements to resell (“resell transactions”) or securities sold
under agreements to repurchase (“repurchase transactions”), and
securities borrowed or loaned. Repurchase transactions and resell
transactions are carried at their contractual amounts. Securities bor-
rowed or loaned are recorded at the amount of cash collateral
advanced or received.
Allowance for doubtful accounts—Allowance for doubtful accounts
is provided based on the actual historical default rate for normal
loans, and based on individually assessed amounts for doubtful and
default loans.
Property and equipment—Property and equipment are stated at
the acquisition cost. Impairment losses recognized have been
deducted from the acquisition costs. Daiwa computes depreciation
principally by the straight-line method over estimated useful lives.

108 Daiwa Securities Group Annual Report 2008
(Change in the accounting standard)
In connection with the current Japanese corporate tax law reform,
the Company and its domestic consolidated subsidiaries have
changed the depreciation method to that which complies with the
new corporate tax law for property and equipment purchased on or
after April 1, 2007. However, after such assets have been depreci-
ated to the depreciable limit, the remaining value is amortized over
five years in pro rata from the following fiscal year until its book value
is reduced to ¥1. The effect on the consolidated financial statements
as of March 31, 2008 was immaterial.
(Additional information)
The relocation of the headquarter office of the Company and some
consolidated subsidiaries has been almost completed. The useful
lives of the building and equipment for the former headquarters
were shortened up to the planned removal date. Extraordinary depre-
ciation expenses of ¥4,439 million were recorded as other expense,
due to the application of shortened useful lives for the year ended
March 31, 2006. Also “Income before income taxes and minority
interests” decreased by that amount, as a result.
Intangible fixed assets—Intangible fixed assets are generally amor-
tized under the straight-line method. The Company and its domestic
consolidated subsidiaries compute depreciation over estimated useful
lives, and over internally estimated useful lives (5 years) for software
for in-house use.
Bonuses—Accrued bonuses of employees and directors represent
liabilities estimated as of the balance sheet date.
(Change in the accounting standard)
The Company adopted “Accounting Standard for Directors’ Bonus”
(ASBJ Statement No. 4) from the fiscal year ended March 31, 2007.
According to ASBJ Statement No. 4, Directors’ bonus is expensed
when it is incurred, instead of the appropriation of its retained earn-
ings upon approval of each consolidated subsidiary’s annual share-
holders’ meeting. “Operating income” and “Income before income
taxes and minority interests” decreased by ¥1,553 million, respec-
tively, in the consolidated statements of income in the year ended
March 31, 2007, due to this accounting change.
Share-based payment
(Change in the accounting standard)
The Company adopted “Accounting Standard for Share-based Pay-
ment” (ASBJ Statement No. 8) and “Implementation Guidance on
Accounting Standard for share-based payment” (ASBJ Guidance No.
11) from the fiscal year ended March 31, 2007. “Operating income”
and “Income before income taxes and minority interests” decreased
by ¥611 million, respectively, in the consolidated statements of income
in the year ended March 31, 2007, due to this accounting change.
Retirement benefits—Daiwa has various benefit plans for eligible
employees and directors such as the unfunded plan and closed
funded plan.
Provision for relocation costs of headquarter office—Provision for
relocation costs of headquarter office of the Company and some con-
solidated subsidiaries was booked based on reasonable estimation.
Provision for litigation losses—The estimated amount of restitu-
tion is accrued to provide for future monetary damages of litigation
regarding financial services based on the status of progress.
Income taxes—Income taxes consist of corporation, enterprise and
inhabitants’ taxes. The provision for income taxes is computed based
on the pre-tax income of the Company and each of its consolidated
subsidiaries with certain adjustments, if necessary.
Income tax consequences of amounts that will become taxable or
deductible in future years are recorded as deferred tax assets and
liabilities, which are generally raised from the difference in value of
assets and liabilities for statutory accounting and tax accounting.
Daiwa recognizes deferred tax assets to the extent of amounts rea-
sonably expected to be realized in future.
The consolidated tax payments system has been applied designating
the Company, Daiwa Securities SMBC and NIF SMBC as parent com-
panies of the consolidated tax payments.
Translation of foreign currencies—The Company and its domestic
consolidated subsidiaries translate assets and liabilities in foreign cur-
rencies into yen at the year-end exchange rate.
Translation of foreign currency financial statements—Financial
statements of overseas consolidated subsidiaries are translated into
yen on the basis of the year-end exchange rates for assets and liabili-
ties except that “Retained earnings” are translated at historical rates.
Income and expenses are translated at the average exchange rates of
the applicable year. The resulting differences are reported as “Trans-
lation adjustments” in net assets in the accompanying consolidated
balance sheets.
Net income per share—Net income per share of common stock is
based on the average number of common shares outstanding.
Diluted net income per share is computed based on the average
number of common shares outstanding for the year with an adjust-
ment for dilutive convertible bonds and stock subscription rights based
on the number of shares of common stock that would have been
issued provided that the outstanding dilutive convertible bonds and
stock subscription rights were converted at the beginning of the year.

109Daiwa Securities Group Annual Report 2008
Reclassification—Certain reclassifications have been made in the 2007 and 2006 consolidated financial statements to conform to the pre-
sentation for 2008.
3. Margin transactionsMargin transactions at March 31, 2008 and 2007 consisted of the following:
Millions of yen
Thousands of U.S. dollars
2008 2007 2008
Assets:
Customers’ margin loans ¥192,001 ¥339,104 $1,920,010
Cash deposits as collateral for securities borrowed 177,311 236,353 1,773,110
¥369,312 ¥575,457 $3,693,120
Liabilities:
Payable to securities finance companies ¥ 8,617 ¥ 14,447 $ 86,170
Proceeds of securities sold for customers’ accounts 193,393 218,906 1,933,930
¥202,010 ¥233,353 $2,020,100
Customers’ margin loans are stated at amounts equal to the purchase amounts of the relevant securities, which are collateralized by custom-
ers’ securities and customers’ deposits. Proceeds of securities sold for customers’ accounts are stated at the sales amounts.
4. Collateralized short-term financing agreementsCollateralized short-term financing agreements at March 31, 2008 and 2007 consisted of the following:
Millions of yen
Thousands of U.S. dollars
2008 2007 2008
Assets:
Securities purchased under agreements to resell ¥1,334,581 ¥1,595,729 $13,345,810
Securities borrowed 4,871,746 5,218,883 48,717,460
¥6,206,327 ¥6,814,612 $62,063,270
Liabilities:
Securities sold under agreements to repurchase ¥2,987,701 ¥3,219,353 $29,877,010
Securities loaned 3,250,983 1,939,747 32,509,830
¥6,238,684 ¥5,159,100 $62,386,840

110 Daiwa Securities Group Annual Report 2008
5. Trading assets and trading liabilitiesTrading assets and trading liabilities at March 31, 2008 and 2007 consisted of the following:
Millions of yen
Thousands of U.S. dollars
2008 2007 2008
Trading assets:
Equities ¥ 133,153 ¥ 377,531 $ 1,331,530
Government, corporate and other bonds 5,801,937 3,720,283 58,019,370
Investment trusts 90,184 111,367 901,840
Commercial paper, certificates of deposits and others 245,979 19,714 2,459,790
Option transactions 208,844 166,603 2,088,440
Futures and forward transactions 133,858 177,068 1,338,580
Swap agreements 1,225,291 509,663 12,252,910
Other derivatives 19,499 1,927 194,990
Credit reserves (1,623) (1,937) (16,230)
¥7,857,122 ¥5,082,219 $78,571,220
Millions of yen
Thousands of U.S. dollars
2008 2007 2008
Trading liabilities:
Equities ¥ 110,997 ¥ 88,620 $ 1,109,970
Government, corporate and other bonds 3,332,362 3,314,739 33,323,620
Investment trusts 16 14,475 160
Option transactions 182,575 256,023 1,825,750
Futures and forward transactions 121,178 46,293 1,211,780
Swap agreements 875,700 383,702 8,757,000
Other derivatives 20,816 1,510 208,160
¥4,643,644 ¥4,105,362 $46,436,440
6. Securities other than trading assets and trading liabilitiesSecurities other than trading assets and trading liabilities are composed of “Cash and cash equivalents,” “Private equity and other securities”
and “Investment securities” in the accompanying consolidated balance sheets.
Cost and market value of securities intended to be held for trading purposes by non-securities companies as of March 31, 2008 and 2007
consisted of the following:
Millions of yen
Cost Market value Difference
March 31, 2008 ¥ 4,662 ¥ 4,011 ¥ (651)
March 31, 2007 ¥ 4,345 ¥ 4,589 ¥ 244
Thousands of U.S. dollars
Cost Market value Difference
March 31, 2008 $46,620 $40,110 $(6,510)

111Daiwa Securities Group Annual Report 2008
Cost/amortized cost and market value of held-to-maturity debt securities as of March 31, 2008 and 2007 consisted of the following:
Millions of yen
Cost/amortized cost Market value Difference
Government bonds, local government bonds at March 31, 2008 ¥ 1,300 ¥ 1,300 ¥ –
Government bonds, local government bonds at March 31, 2007 ¥ 1,769 ¥ 1,769 ¥0
Thousands of U.S. dollars
Cost/amortized cost Market value Difference
Government bonds, local government bonds at March 31, 2008 $13,000 $13,000 $ –
Cost and market value of available-for-sale securities as of March 31, 2008 and 2007 consisted of the following:
Millions of yen
Cost Market value Difference
March 31, 2008:
Equities ¥ 121,618 ¥ 155,707 ¥ 34,089
Government, corporate and other bonds 13,720 11,937 (1,783)
Other 17,550 17,058 (492)
¥ 152,888 ¥ 184,702 ¥ 31,814
March 31, 2007:
Equities ¥ 96,500 ¥ 220,484 ¥123,984
Government, corporate and other bonds 150 156 6
Other 8,832 10,228 1,396
¥ 105,482 ¥ 230,868 ¥125,386
Thousands of U.S. dollars
Cost Market value Difference
March 31, 2008:
Equities $1,216,180 $1,557,070 $340,890
Government, corporate and other bonds 137,200 119,370 (17,830)
Other 175,500 170,580 (4,920)
$1,528,880 $1,847,020 $318,140

112 Daiwa Securities Group Annual Report 2008
Securities for which a market value was not readily available as of March 31, 2008 and 2007 consisted of the following:
Millions of yen
Thousands of U.S. dollars
2008 2007 2008
Equities ¥240,309 ¥257,288 $2,403,090
Government, corporate and other bonds 3,268 802 32,680
Investments in limited partnerships 199,997 150,435 1,999,970
Other 56,408 45,110 564,080
¥499,982 ¥453,635 $4,999,820
In addition to the above, equity securities of non-consolidated and affiliated companies amounting to ¥36,453 million ($364,530 thousand)
at March 31, 2008 and ¥27,623 million at March 31, 2007, respectively, were included in “Investment securities” in the accompanying con-
solidated balance sheets.
7. Derivatives used for non-trading purposesNet unrealized gains of derivatives used for non-trading purposes at March 31, 2008 and 2007 (excluding hedging transactions) consisted of
the following:
Millions of yen
Contract amount Market value Unrealized gains
March 31, 2008:
Currency swap agreements ¥ 14,181 ¥ 31 ¥ 31
Forward exchange contracts 4,810 83 83
March 31, 2007:
Currency swap agreements ¥ 11,922 ¥ 10 ¥ 10
Forward exchange contracts 3,612 100 100
Thousands of U.S. dollars
Contract amount Market value Unrealized gains
March 31, 2008:
Currency swap agreements $141,810 $310 $310
Forward exchange contracts 48,100 830 830

113Daiwa Securities Group Annual Report 2008
8. Pledged assetsSecured obligations at March 31, 2008 and 2007 consisted of the following:
Millions of yen
Thousands of U.S. dollars
2008 2007 2008
Short-term borrowings ¥1,144,917 ¥754,888 $11,449,170
Long-term debt 20 20 200
Payables related to margin transactions 8,618 14,439 86,180
¥1,153,555 ¥769,347 $11,535,550
Daiwa also has secured obligations for borrowings of non-consolidated subsidiaries amounting to ¥4,800 million ($48,000 thousand) at
March 31, 2008.
All above obligations at March 31, 2008 and 2007 were secured by the following assets:
Millions of yen
Thousands of U.S. dollars
2008 2007 2008
Time deposits ¥ – ¥ 125 $ –
Loans receivable from other than customers 34,721 18,517 347,210
Trading assets 1,165,097 1,072,264 11,650,970
Private equity and other securities 314 614 3,140
Investment securities 62,247 98,496 622,470
Other assets—Other 10,522 7,973 105,220
¥1,272,901 ¥1,197,989 $12,729,010
In addition to the above, securities borrowed amounting to ¥609,273 million ($6,092,730 thousand) and ¥535,044 million were pledged as
guarantees at March 31, 2008 and 2007, respectively.
Total fair value of the securities pledged as collateral at March 31, 2008 and 2007 consisted of the following:
Millions of yen
Thousands of U.S. dollars
2008 2007 2008
Securities loaned ¥6,782,109 ¥6,133,988 $67,821,090
Other 1,287,930 739,061 12,879,300
¥8,070,039 ¥6,873,049 $80,700,390
Total fair value of the securities received as collateral at March 31, 2008 and 2007 consisted of the following:
Millions of yen
Thousands of U.S. dollars
2008 2007 2008
Securities borrowed ¥7,542,741 ¥8,440,583 $75,427,410
Other 466,116 659,903 4,661,160
¥8,008,857 ¥9,100,486 $80,088,570

114 Daiwa Securities Group Annual Report 2008
As is customary in Japan, in the case of unsecured bank borrowings,
security must be given under certain conditions if requested by a
lending bank. The bank has the right to offset cash deposited by the
borrower against any debt or obligation that becomes due, and in
the case of default and certain other specified events, against all
debts payable to the bank. No such request has been made and no
such right has been exercised.
The weighted average interest rate on total outstanding short-term
borrowings principally from banks at March 31, 2008 and 2007 was
0.78% and 0.79%, respectively.
9. Lease transactionsFinancial leases, whose ownership does not transfer to the lessee at the end of the lease term are not capitalized and are accounted for in the
same manner as operating leases. Certain information concerning such non-capitalized finance leases and operating leases at March 31, 2008
and 2007 is summarized as follows:
Lessee:
Millions of yenThousands of
U.S. dollars
2008 2007 2008
Non-capitalized finance leases:
Total assets under non-capitalized finance leases ¥ 4,052 ¥ 6,161 $ 40,520
Accumulated depreciation 2,723 4,338 27,230
Future lease payments in respect of non-capitalized leases 1,371 1,878 13,710
Due within one year 651 1,100 6,510
Operating leases:
Future lease payments in respect of operating leases 80,492 11,767 804,920
Due within one year 11,201 2,239 112,010
Lessor:
Millions of yenThousands of
U.S. dollars
2008 2007 2008
Operating leases:
Future lease receipts in respect of operating leases ¥ 632 ¥ 1,056 $ 6,320
Due within one year 237 289 2,370
10. Payables to customers and counterpartiesPayables to customers and counterparties at March 31, 2008 and 2007 consisted of the following:
Millions of yen
Thousands of U.S. dollars
2008 2007 2008
Cash received for customers’ accounts ¥112,127 ¥124,851 $1,121,270
Cash deposits received from customers 101,149 100,494 1,011,490
Other 498,307 7,819 4,983,070
¥711,583 ¥233,164 $7,115,830
11. Bank borrowings and long-term debt

115Daiwa Securities Group Annual Report 2008
Retirement benefits for employees
Retirement benefit plans for eligible employees are discussed below.
Unfunded plan
The Company and most domestic consolidated subsidiaries provide
an unfunded retirement benefit plan to their employees in return for
services rendered each year, where the amount to be contributed to
the individual employee’s account is defined by the plan. Benefits of
the plan are accumulated on an annual basis and earn a guaranteed
hypothetical return at a rate predetermined by the Company and
most domestic consolidated subsidiaries each year. Accumulated
contribution plus interest to this unfunded plan are included in
“Retirement benefits” in the consolidated balance sheets as of March
31, 2008 and 2007, in the amount of ¥21,351 million ($213,510
thousand) and ¥19,903 million, respectively. Benefit expenses
recorded in the consolidated statements of income for the years
ended March 31, 2008, 2007 and 2006 were ¥3,157 million ($31,570
thousand), ¥3,305 million and ¥2,864 million, respectively.
Closed funded plan
The Company and its domestic consolidated subsidiaries closed their
defined benefit plan as of April 1, 1999 and accordingly, no new
employees have been added to the plan and no service cost has been
charged for the plan. The effect on the consolidated financial state-
ments was immaterial.
Long-term debt at March 31, 2008 and 2007 consisted of the following:
Millions of yen
Thousands of U.S. dollars
2008 2007 2008
Bond payable in yen: 0.95% due CY2008 ¥ 120,000 ¥ 120,000 $ 1,200,000
Bond payable in yen: 1.30% due CY2011 70,000 70,000 700,000
Bond payable in yen: 1.80% due CY2011 50,000 50,000 500,000
Bond payable in yen: 1.50% due CY2012 50,000 – 500,000
Bond payable in yen: 1.43% due CY2013 60,000 – 600,000
Bond payable in yen: 2.08% due CY2016 30,000 30,000 300,000
Euro medium-term notes issued by the Company and a domestic consolidated subsidiary, maturing through CY2038
814,355
776,785
8,143,550
Subordinated borrowings from banks in yen, maturing through CY2012 70,000 102,000 700,000
Long-term borrowings principally from banks in yen, maturing through CY2038 142,045 112,728 1,420,450
¥1,406,400 ¥1,261,513 $14,064,000
Interest rates of euro medium-term notes range from 0.50% to 5.07% at March 31, 2008 and from 0.03% to 5.30% at March 31, 2007.
The weighted average interest rate on total outstanding yen subordinated borrowings and borrowings principally from banks at March 31,
2008 and 2007 was 1.49% and 1.28%, respectively.
The aggregate annual maturities of long-term debt as of March 31, 2008 were as follows:
Year ending March 31
Millions of yen
Thousands of U.S. dollars
2009 ¥ 143,588 $ 1,435,880
2010 24,961 249,610
2011 129,556 1,295,560
2012 118,824 1,188,240
2013 175,341 1,753,410
2014 and thereafter 814,130 8,141,300
¥1,406,400 $14,064,000
Daiwa had an unused commitment line amounting to ¥87,017 million ($870,170 thousand) under agreements with several banks at March
31, 2008.
12. Retirement benefits

116 Daiwa Securities Group Annual Report 2008
Retirement benefits for directors
Directors’ retirement benefits in consolidated subsidiaries of ¥439
million ($4,390 thousand) and ¥590 million are included in “Retire-
ment benefits” in the accompanying consolidated balance sheets as
of March 31, 2008 and 2007, respectively. Benefit expenses recorded
in the consolidated statements of income for the years ended March
31, 2008, 2007 and 2006 were ¥205 million ($2,050 thousand),
¥199 million and ¥174 million, respectively.
The board of the Company resolved to abolish the retirement gratu-
ities system for retiring directors in May 2004. In June 2004, the
shareholders’ meeting of the Company approved the payments of
retirement allowance to directors who were nominated for re-
election. The payments will be made in accordance with standards
prescribed by the Company and service rendered to the Company
during their respective terms of office up to the end of the sharehold-
ers’ meeting. The payments will be made at the time of their respec-
tive retirements from the Board of Directors.
The boards of certain consolidated subsidiaries resolved to abolish
the retirement gratuities system for retiring directors in March 2005.
In June 2005, the shareholders’ meetings of such consolidated sub-
sidiaries approved the payments of retirement allowance to directors
who were nominated for re-election. The payments will be made in
accordance with standards prescribed by certain consolidated subsid-
iaries and service rendered to certain consolidated subsidiaries during
their respective terms of office up to the end of the shareholders’
meetings. The payments will be made at the time of their respective
retirements from the Board of Directors.
13. Income taxesThe Company and its domestic consolidated subsidiaries are subject to a number of taxes levied on income. The compounded statutory tax
rate in Japan was approximately 40.7% for the years ended March 31, 2008, 2007 and 2006.
Overseas consolidated subsidiaries are subject to income taxes of the countries in which they operate.
A reconciliation of the difference between the Japanese statutory income tax rate and the effective income tax rate reflected in the consoli-
dated statements of income for the years ended March 31, 2008, 2007 and 2006 were as follows:
2008 2007 2006
Japanese statutory income tax rate 40.7% 40.7% 40.7%
Valuation allowance 12.4 (9.0) (9.0)
Permanent difference (Non-deductible) 2.2 0.9 0.3
Permanent difference (Non-taxable) (1.3) (0.3) (0.3)
Lower tax rate applicable to income of overseas consolidated subsidiaries (0.5) (1.0) (0.6)
Adjustment of unrealized inter-company profit (0.2) 5.2 0.6
Other, net (3.6) 0.9 (1.5)
Effective income tax rate 49.7% 37.4% 30.2%
117Daiwa Securities Group Annual Report 2008
In principle, the Companies Act of Japan (“the Act”) requires a com-
pany to credit the entire amount of issued shares to common stock
(and preferred stock, if any); however, a company may classify an
amount not exceeding one-half of the entire issued amount of shares
as additional paid-in capital, which is included in capital surplus, with
a resolution of the Board of Directors.
According to the Act, a company should save 10% of cash dividends
and other cash appropriated as “Additional paid-in capital” or
“Earned surplus” until the total becomes one quarter of the common
stock (and preferred stock, if any). “Additional paid-in capital” and
“Earned surplus” are allowed to eliminate or reduce a deficit with a
resolution of the shareholders’ meeting or may be capitalized with a
resolution of the Board of Directors, and also may be transferred to
other capital surplus and retained earnings, respectively, which are
potentially available for dividends. “Additional paid-in capital” and
“Earned surplus” are included in “Capital surplus” and “Retained
earnings” in the accompanying consolidated balance sheets.
The maximum amount that the Company can distribute as dividends
is calculated based on the non-consolidated financial statements of
the Company in accordance with the Act. The total amount of
retained earnings available for dividends in the Company’s statutory
book of account as of March 31, 2008 amounted to ¥234,782 million
($2,347,820 thousand).
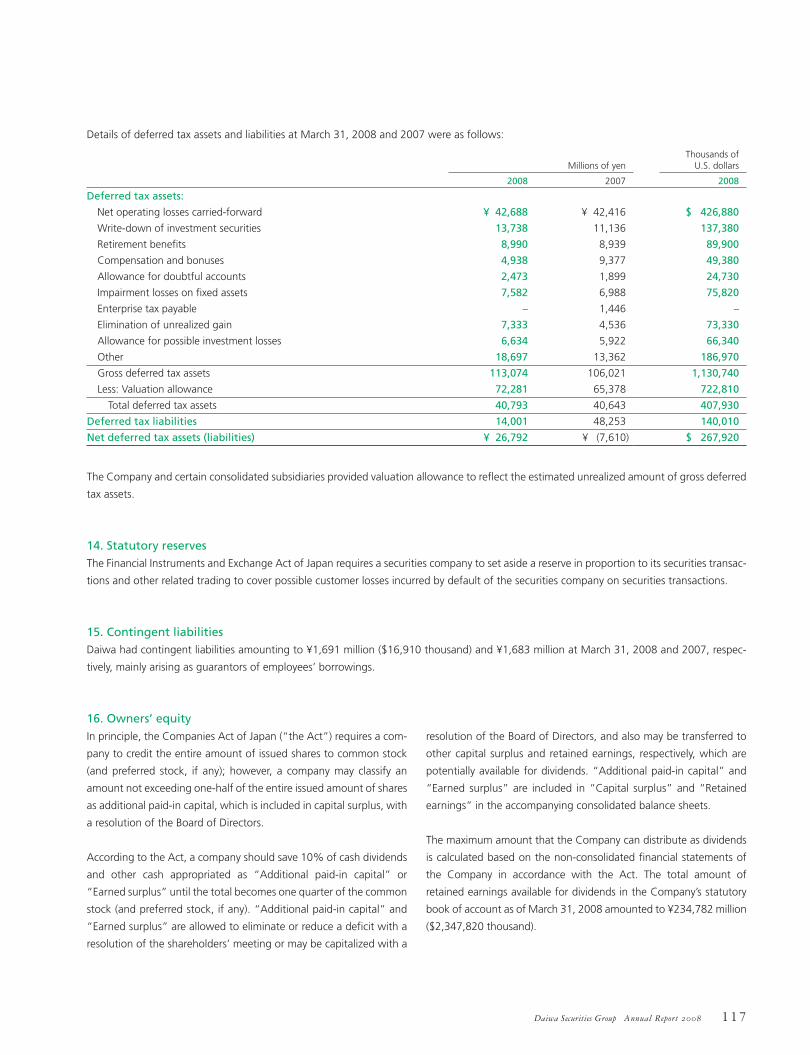
Details of deferred tax assets and liabilities at March 31, 2008 and 2007 were as follows:
Millions of yen
Thousands of U.S. dollars
2008 2007 2008
Deferred tax assets:
Net operating losses carried-forward ¥ 42,688 ¥ 42,416 $ 426,880
Write-down of investment securities 13,738 11,136 137,380
Retirement benefits 8,990 8,939 89,900
Compensation and bonuses 4,938 9,377 49,380
Allowance for doubtful accounts 2,473 1,899 24,730
Impairment losses on fixed assets 7,582 6,988 75,820
Enterprise tax payable – 1,446 –
Elimination of unrealized gain 7,333 4,536 73,330
Allowance for possible investment losses 6,634 5,922 66,340
Other 18,697 13,362 186,970
Gross deferred tax assets 113,074 106,021 1,130,740
Less: Valuation allowance 72,281 65,378 722,810
Total deferred tax assets 40,793 40,643 407,930
Deferred tax liabilities 14,001 48,253 140,010
Net deferred tax assets (liabilities) ¥ 26,792 ¥ (7,610) $ 267,920
The Company and certain consolidated subsidiaries provided valuation allowance to reflect the estimated unrealized amount of gross deferred
tax assets.
14. Statutory reservesThe Financial Instruments and Exchange Act of Japan requires a securities company to set aside a reserve in proportion to its securities transac-
tions and other related trading to cover possible customer losses incurred by default of the securities company on securities transactions.
15. Contingent liabilitiesDaiwa had contingent liabilities amounting to ¥1,691 million ($16,910 thousand) and ¥1,683 million at March 31, 2008 and 2007, respec-
tively, mainly arising as guarantors of employees’ borrowings.
16. Owners’ equity
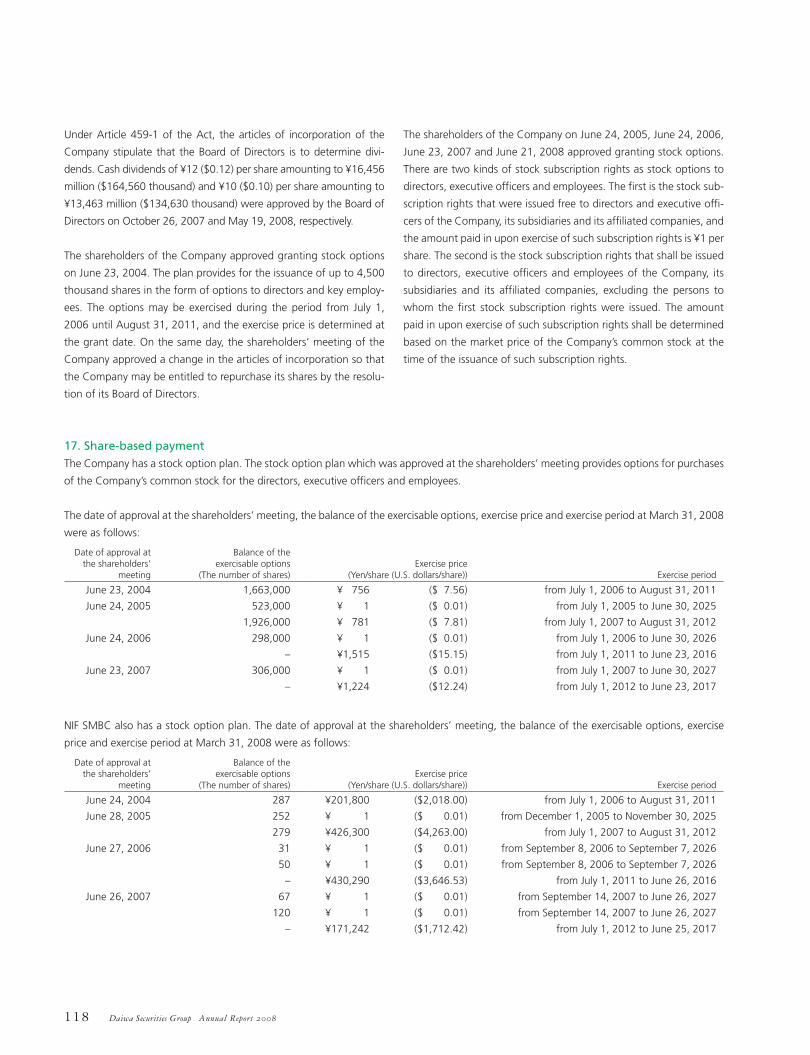
118 Daiwa Securities Group Annual Report 2008
Under Article 459-1 of the Act, the articles of incorporation of the
Company stipulate that the Board of Directors is to determine divi-
dends. Cash dividends of ¥12 ($0.12) per share amounting to ¥16,456
million ($164,560 thousand) and ¥10 ($0.10) per share amounting to
¥13,463 million ($134,630 thousand) were approved by the Board of
Directors on October 26, 2007 and May 19, 2008, respectively.
The shareholders of the Company approved granting stock options
on June 23, 2004. The plan provides for the issuance of up to 4,500
thousand shares in the form of options to directors and key employ-
ees. The options may be exercised during the period from July 1,
2006 until August 31, 2011, and the exercise price is determined at
the grant date. On the same day, the shareholders’ meeting of the
Company approved a change in the articles of incorporation so that
the Company may be entitled to repurchase its shares by the resolu-
tion of its Board of Directors.
The shareholders of the Company on June 24, 2005, June 24, 2006,
June 23, 2007 and June 21, 2008 approved granting stock options.
There are two kinds of stock subscription rights as stock options to
directors, executive officers and employees. The first is the stock sub-
scription rights that were issued free to directors and executive offi-
cers of the Company, its subsidiaries and its affiliated companies, and
the amount paid in upon exercise of such subscription rights is ¥1 per
share. The second is the stock subscription rights that shall be issued
to directors, executive officers and employees of the Company, its
subsidiaries and its affiliated companies, excluding the persons to
whom the first stock subscription rights were issued. The amount
paid in upon exercise of such subscription rights shall be determined
based on the market price of the Company’s common stock at the
time of the issuance of such subscription rights.
17. Share-based paymentThe Company has a stock option plan. The stock option plan which was approved at the shareholders’ meeting provides options for purchases
of the Company’s common stock for the directors, executive officers and employees.
The date of approval at the shareholders’ meeting, the balance of the exercisable options, exercise price and exercise period at March 31, 2008
were as follows:
Date of approval at the shareholders’
meeting
Balance of the exercisable options
(The number of shares)
Exercise price
(Yen/share (U.S. dollars/share))
Exercise period
June 23, 2004 1,663,000 ¥ 756 ($ 7.56) from July 1, 2006 to August 31, 2011
June 24, 2005 523,000 ¥ 1 ($ 0.01) from July 1, 2005 to June 30, 2025
1,926,000 ¥ 781 ($ 7.81) from July 1, 2007 to August 31, 2012
June 24, 2006 298,000 ¥ 1 ($ 0.01) from July 1, 2006 to June 30, 2026
– ¥1,515 ($15.15) from July 1, 2011 to June 23, 2016
June 23, 2007 306,000 ¥ 1 ($ 0.01) from July 1, 2007 to June 30, 2027
– ¥1,224 ($12.24) from July 1, 2012 to June 23, 2017
NIF SMBC also has a stock option plan. The date of approval at the shareholders’ meeting, the balance of the exercisable options, exercise
price and exercise period at March 31, 2008 were as follows:
Date of approval at the shareholders’
meeting
Balance of the exercisable options
(The number of shares)
Exercise price
(Yen/share (U.S. dollars/share))
Exercise period
June 24, 2004 287 ¥201,800 ($2,018.00) from July 1, 2006 to August 31, 2011
June 28, 2005 252 ¥ 1 ($ 0.01) from December 1, 2005 to November 30, 2025
279 ¥426,300 ($4,263.00) from July 1, 2007 to August 31, 2012
June 27, 2006 31 ¥ 1 ($ 0.01) from September 8, 2006 to September 7, 2026
50 ¥ 1 ($ 0.01) from September 8, 2006 to September 7, 2026
– ¥430,290 ($3,646.53) from July 1, 2011 to June 26, 2016
June 26, 2007 67 ¥ 1 ($ 0.01) from September 14, 2007 to June 26, 2027
120 ¥ 1 ($ 0.01) from September 14, 2007 to June 26, 2027
– ¥171,242 ($1,712.42) from July 1, 2012 to June 25, 2017

119Daiwa Securities Group Annual Report 2008
18. Capital adequacy requirementsIn Japan, a securities company is subject to risk-based capital adequacy rules established and administered by the Financial Services Agency.
Securities subsidiaries report their capital adequacy ratio as defined pursuant to these rules. The authorities will take certain administrative
measures if such ratio declines below 140%. Capital adequacy ratios of Daiwa Securities were 319.7% (unaudited) and 319.3% (unaudited)
for March 31, 2008 and 2007, respectively, and those of Daiwa Securities SMBC were 307.6% (unaudited) and 465.3% (unaudited) for March
31, 2008 and 2007, respectively.
19. Segment informationDaiwa operates predominantly in a single industry segment. Daiwa’s primary business activities include (1) trading in securities and derivatives,
(2) brokerage of securities and derivatives, (3) underwriting and distribution of securities, (4) other business related to securities transactions
and (5) private offering of securities.
A summary of revenues by geographic area for the years ended March 31, 2008, 2007 and 2006 and a summary of total assets by geographic
area at March 31, 2008 and 2007 are as follows:
Millions of yen
Japan
America
Europe
Asia & Oceania
Elimination or unallocated
Consolidated
Year ended March 31, 2008:
Net operating revenues:
Outside customer ¥ 406,520 ¥ 10,195 ¥ 13,448 ¥ 17,328 ¥ – ¥ 447,491
Inter-segment (5,997) 4,398 8,464 986 (7,851) –
Total 400,523 14,593 21,912 18,314 (7,851) 447,491
Selling, general and administrative expenses
316,998
13,043
26,947
14,717
(7,846)
363,859
Operating income (loss) ¥ 83,525 ¥ 1,550 ¥ (5,035) ¥ 3,597 ¥ (5) ¥ 83,632
At March 31, 2008:
Total assets by geographic area ¥ 14,307,375 ¥ 2,990,598 ¥ 1,260,014 ¥ 80,659 ¥ (1,331,527) ¥ 17,307,119
Year ended March 31, 2007:
Net operating revenues:
Outside customer ¥ 483,875 ¥ 9,588 ¥ 19,870 ¥ 13,431 ¥ – ¥ 526,764
Inter-segment (8,701) 5,096 16,034 1,298 (13,727) –
Total 475,174 14,684 35,904 14,729 (13,727) 526,764
Selling, general and administrative expenses
302,606
13,079
27,563
10,851
(13,726)
340,373
Operating income ¥ 172,568 ¥ 1,605 ¥ 8,341 ¥ 3,878 ¥ (1) ¥ 186,391
At March 31, 2007:
Total assets by geographic area ¥ 10,808,697 ¥ 3,372,712 ¥ 1,238,352 ¥ 81,732 ¥ (1,090,228) ¥ 14,411,265
Year ended March 31, 2006:
Net operating revenues:
Outside customer ¥ 541,666 ¥ 5,528 ¥ 21,673 ¥ 10,492 ¥ – ¥ 579,359
Inter-segment 1,530 8,758 12,085 1,606 (23,979) –
Total 543,196 14,286 33,758 12,098 (23,979) 579,359
Selling, general and administrative expenses
294,984
11,920
23,679
8,472
(13,856)
325,199
Operating income ¥ 248,212 ¥ 2,366 ¥ 10,079 ¥ 3,626 ¥ (10,123) ¥ 254,160

120 Daiwa Securities Group Annual Report 2008
Thousands of U.S. dollars
Japan
America
Europe
Asia & Oceania
Elimination or unallocated
Consolidated
Year ended March 31, 2008:
Net operating revenues:
Outside customer $ 4,065,200 $ 101,950 $ 134,480 $173,280 $ – $ 4,474,910
Inter-segment (59,970) 43,980 84,640 9,860 (78,510) –
Total 4,005,230 145,930 219,120 183,140 (78,510) 4,474,910
Selling, general and administrative expenses
3,169,980
130,430
269,470
147,170
(78,460)
3,638,590
Operating income (loss) $ 835,250 $ 15,500 $ (50,350) $ 35,970 $ (50) $ 836,320
At March 31, 2008:
Total assets by geographic area $143,073,750 $29,905,980 $12,600,140 $806,590 $(13,315,270) $173,071,190
Geographic overseas revenues for the years ended March 31, 2008, 2007 and 2006 were as follows:
Millions of yen
America Europe Asia & Oceania Total
Year ended March 31, 2008:
Overseas revenues ¥ 19,169 ¥ 10,048 ¥ 15,281 ¥ 44,498
Net operating revenues 447,491
% of Net operating revenues 4.3% 2.2% 3.4% 9.9%
Year ended March 31, 2007:
Overseas revenues ¥ 19,325 ¥ 13,101 ¥ 11,902 ¥ 44,328
Net operating revenues 526,764
% of Net operating revenues 3.7% 2.5% 2.3% 8.4%
Year ended March 31, 2006:
Overseas revenues ¥ 10,313 ¥ 19,370 ¥ 11,016 ¥ 40,699
Net operating revenues 579,359
% of Net operating revenues 1.8% 3.3% 1.9% 7.0%
Thousands of U.S. dollars
America Europe Asia & Oceania Total
Year ended March 31, 2008:
Overseas revenues $191,690 $100,480 $152,810 $ 444,980
Net operating revenues 4,474,910
% of Net operating revenues 4.3% 2.2% 3.4% 9.9%
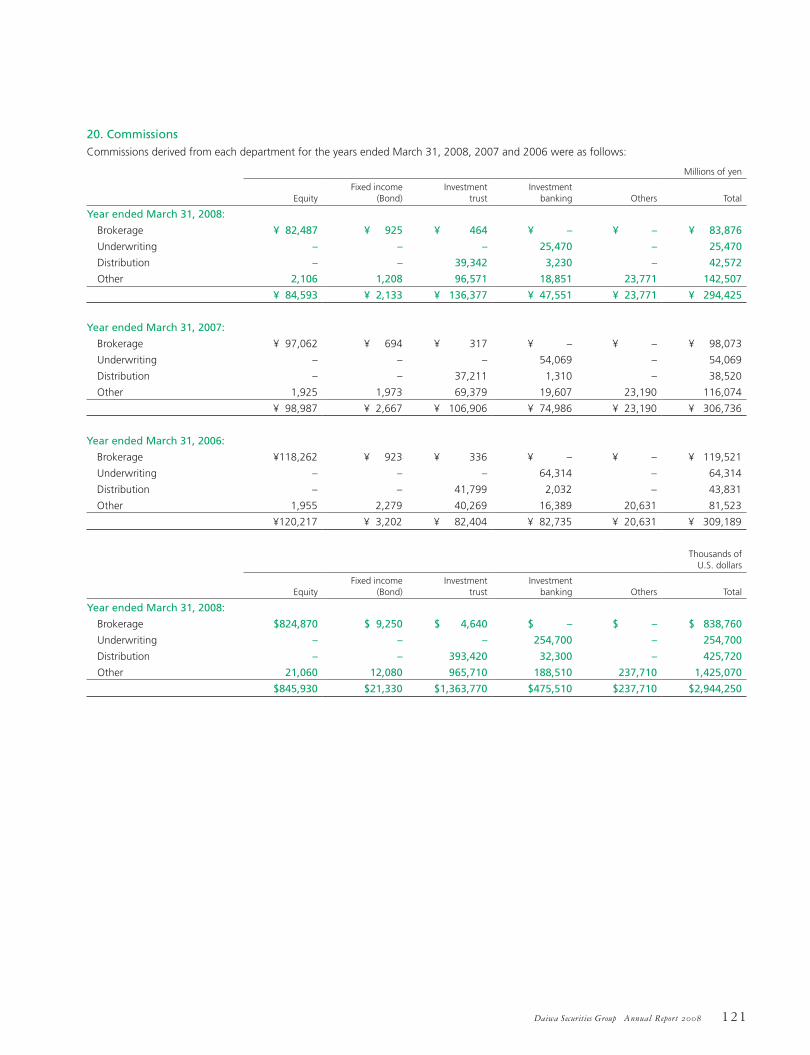
121Daiwa Securities Group Annual Report 2008
20. CommissionsCommissions derived from each department for the years ended March 31, 2008, 2007 and 2006 were as follows:
Millions of yen
Equity
Fixed income (Bond)
Investment trust
Investment banking
Others
Total
Year ended March 31, 2008:
Brokerage ¥ 82,487 ¥ 925 ¥ 464 ¥ – ¥ – ¥ 83,876
Underwriting – – – 25,470 – 25,470
Distribution – – 39,342 3,230 – 42,572
Other 2,106 1,208 96,571 18,851 23,771 142,507
¥ 84,593 ¥ 2,133 ¥ 136,377 ¥ 47,551 ¥ 23,771 ¥ 294,425
Year ended March 31, 2007:
Brokerage ¥ 97,062 ¥ 694 ¥ 317 ¥ – ¥ – ¥ 98,073
Underwriting – – – 54,069 – 54,069
Distribution – – 37,211 1,310 – 38,520
Other 1,925 1,973 69,379 19,607 23,190 116,074
¥ 98,987 ¥ 2,667 ¥ 106,906 ¥ 74,986 ¥ 23,190 ¥ 306,736
Year ended March 31, 2006:
Brokerage ¥118,262 ¥ 923 ¥ 336 ¥ – ¥ – ¥ 119,521
Underwriting – – – 64,314 – 64,314
Distribution – – 41,799 2,032 – 43,831
Other 1,955 2,279 40,269 16,389 20,631 81,523
¥120,217 ¥ 3,202 ¥ 82,404 ¥ 82,735 ¥ 20,631 ¥ 309,189
Thousands of U.S. dollars
Equity
Fixed income (Bond)
Investment trust
Investment banking
Others
Total
Year ended March 31, 2008:
Brokerage $824,870 $ 9,250 $ 4,640 $ – $ – $ 838,760
Underwriting – – – 254,700 – 254,700
Distribution – – 393,420 32,300 – 425,720
Other 21,060 12,080 965,710 188,510 237,710 1,425,070
$845,930 $21,330 $1,363,770 $475,510 $237,710 $2,944,250
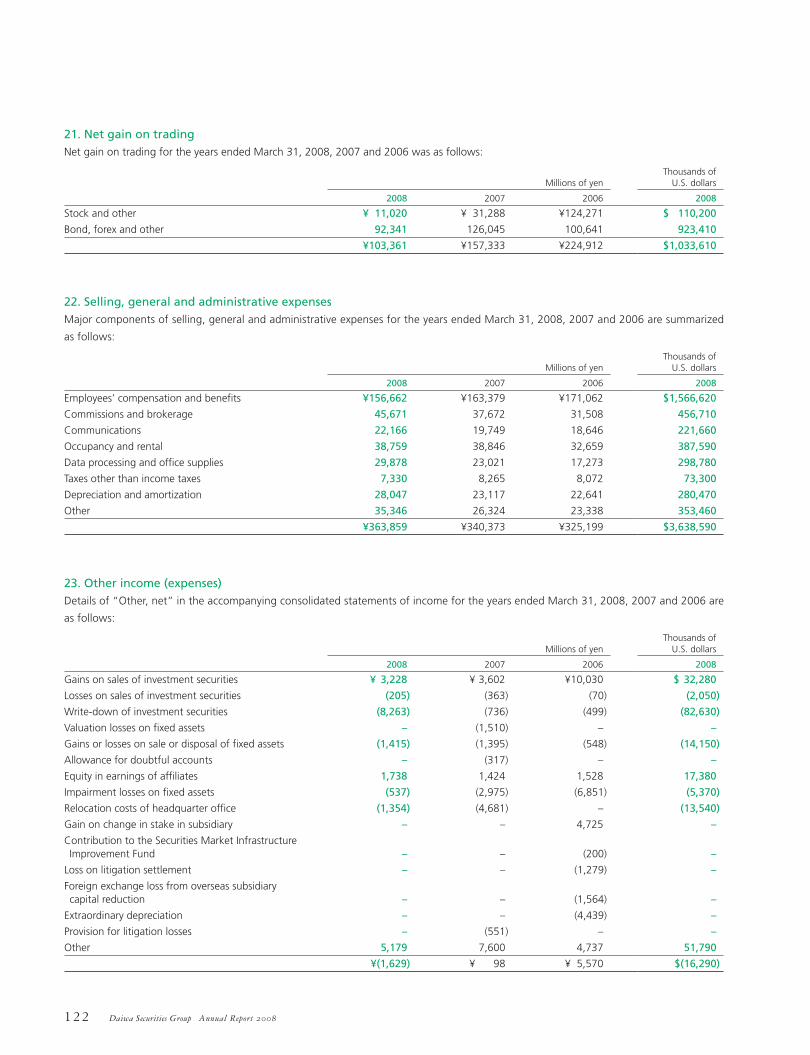
122 Daiwa Securities Group Annual Report 2008
21. Net gain on tradingNet gain on trading for the years ended March 31, 2008, 2007 and 2006 was as follows:
Millions of yen
Thousands of U.S. dollars
2008 2007 2006 2008
Stock and other ¥ 11,020 ¥ 31,288 ¥124,271 $ 110,200
Bond, forex and other 92,341 126,045 100,641 923,410
¥103,361 ¥157,333 ¥224,912 $1,033,610
22. Selling, general and administrative expensesMajor components of selling, general and administrative expenses for the years ended March 31, 2008, 2007 and 2006 are summarized
as follows:
Millions of yen
Thousands of U.S. dollars
2008 2007 2006 2008
Employees’ compensation and benefits ¥156,662 ¥163,379 ¥171,062 $1,566,620
Commissions and brokerage 45,671 37,672 31,508 456,710
Communications 22,166 19,749 18,646 221,660
Occupancy and rental 38,759 38,846 32,659 387,590
Data processing and office supplies 29,878 23,021 17,273 298,780
Taxes other than income taxes 7,330 8,265 8,072 73,300
Depreciation and amortization 28,047 23,117 22,641 280,470
Other 35,346 26,324 23,338 353,460
¥363,859 ¥340,373 ¥325,199 $3,638,590
23. Other income (expenses)Details of “Other, net” in the accompanying consolidated statements of income for the years ended March 31, 2008, 2007 and 2006 are
as follows:
Millions of yen
Thousands of U.S. dollars
2008 2007 2006 2008
Gains on sales of investment securities ¥ 3,228 ¥ 3,602 ¥10,030 $ 32,280
Losses on sales of investment securities (205) (363) (70) (2,050)
Write-down of investment securities (8,263) (736) (499) (82,630)
Valuation losses on fixed assets – (1,510) – –
Gains or losses on sale or disposal of fixed assets (1,415) (1,395) (548) (14,150)
Allowance for doubtful accounts – (317) – –
Equity in earnings of affiliates 1,738 1,424 1,528 17,380
Impairment losses on fixed assets (537) (2,975) (6,851) (5,370)
Relocation costs of headquarter office (1,354) (4,681) – (13,540)
Gain on change in stake in subsidiary – – 4,725 –
Contribution to the Securities Market Infrastructure Improvement Fund
–
–
(200)
–
Loss on litigation settlement – – (1,279) –
Foreign exchange loss from overseas subsidiary capital reduction
–
–
(1,564)
–
Extraordinary depreciation – – (4,439) –
Provision for litigation losses – (551) – –
Other 5,179 7,600 4,737 51,790
¥(1,629) ¥ 98 ¥ 5,570 $(16,290)

123Daiwa Securities Group Annual Report 2008
Granting stock options—The shareholders of the Company approved
the issuance of the stock subscription rights as stock options on June
21, 2008. In accordance with Articles 236, 238 and 239 of the Com-
panies Act of Japan, the stock subscription rights were issued free to
directors, executive officers and employees of the Company and its
affiliated companies, and the amount paid in upon exercise of such
subscription rights is ¥1 ($0.01) per share.
For the purpose of identifying impairment of fixed assets, the Company and its domestic consolidated subsidiaries grouped their fixed assets
principally according to the unit on which decisions for investment are made. The recoverability of book values of the fixed assets was evalu-
ated for each asset group. As a result, fixed assets listed below were identified as being impaired and their book values were reduced to their
estimated recoverable amounts.
The breakdown of impairment losses recognized in the years ended March 31, 2008, 2007 and 2006 was as follows:
Millions of yen
Thousands of U.S. dollars
2008 2007 2006 2008
Fixed assets to be held and used ¥537 ¥2,975 ¥6,201 $5,370
Fixed assets to be disposed of by sale – – 650 –
¥537 ¥2,975 ¥6,851 $5,370
The book values of fixed assets to be held and used were reduced to their estimated recoverable amounts based on mainly the present values
of expected cash flows using the discount rate of 5%.
The book values of fixed assets to be disposed of by sale were reduced to net realizable values based mainly on publicly-assessed values.
24. Subsequent events
124 Daiwa Securities Group Annual Report 2008
To the Shareholders and the Board of Directors of Daiwa Securities Group Inc.:
We have audited the accompanying consolidated balance sheets of Daiwa Securities Group Inc. and consolidated subsidiaries as of March 31,
2008 and 2007, and the related consolidated statements of income, changes in net assets and cash flows for each of the three years in the period
ended March 31, 2008, expressed in yen. These consolidated financial statements are the responsibility of the Company’s management. Our
responsibility is to independently express an opinion on these consolidated financial statements based on our audits.
We conducted our audits in accordance with auditing standards generally accepted in Japan. Those standards require that we plan and perform
the audit to obtain reasonable assurance about whether the financial statements are free of material misstatement. An audit includes examining,
on a test basis, evidence supporting the amounts and disclosures in the financial statements. An audit also includes assessing the accounting
principles used and significant estimates made by management, as well as evaluating the overall financial statement presentation. We believe
that our audits provide a reasonable basis for our opinion.
In our opinion, the consolidated financial statements referred to above present fairly, in all material respects, the consolidated financial position
of Daiwa Securities Group Inc. and subsidiaries as of March 31, 2008 and 2007, and the consolidated results of their operations and their cash
flows for each of the three years in the period ended March 31, 2008, in conformity with accounting principles generally accepted in Japan.
The U.S. dollar amounts in the accompanying consolidated financial statements with respect to the year ended March 31, 2008 are presented
solely for convenience. Our audit also included the translation of yen amounts into U.S. dollar amounts and, in our opinion, such translation has
been made on the basis described in Note 1 to the consolidated financial statements.
Tokyo, Japan
June 23, 2008
Independent Auditors’ Report

125Daiwa Securities Group Annual Report 2008 125Daiwa Securities Group Annual Report 2008
Other Information
1 2 6 organization and officers
1 3 2 domestic group companies
1 3 3 overseas group companies
1 3 5 daiwa securities group inc. corporate data

126 Daiwa Securities Group Annual Report 2008
Shareholders’ Meeting
Board of Directors Nominating Committee
Audit Committee Office of the Audit Committee
Secretariat Office
General Affairs Department
CSR Promotion Department
Internal Audit Department
Mental Health Support Department
Headquarters Relocation Department
Investor Relations Department
Compensation Committee
Internal Control Committee
Disclosure Committee
Group IT Strategy Committee
Executive Committee
Representative Executive Officer
Personnel Department
Corporate Planning Department
Legal Department
Information Technology Department
Corporate Communications Department
Finance Department
Organization and Officers
Daiwa Securities Group Inc.1) Organization (As of July 1, 2008)

127Daiwa Securities Group Annual Report 2008
2) Officers (As of July 1, 2008)
Directors
Chairman of the Board
Akira Kiyota
Director
Shigeharu Suzuki
Director
Shin Yoshidome
Director
Toshiro Ishibashi
Director
Takashi Hibino
Director
Ikuo Mori
Director
Akira Nakamura
Director
Nobuyuki Iwamoto
Director
Saburo Jifuku
Outside Director
Tetsuro Kawakami
Outside Director
Ryuji Yasuda
Outside Director
Koichi Uno
Outside Director
Nobuko Matsubara
Committee Members
Nominating Committee
Akira Kiyota (Chairman)
Shigeharu SuzukiTetsuro KawakamiRyuji YasudaNobuko Matsubara
Audit Committee
Saburo Jifuku (Chairman)
Koichi UnoNobuko Matsubara
Compensation Committee
Akira Kiyota (Chairman)
Shigeharu SuzukiTetsuro KawakamiRyuji YasudaKoichi Uno
Executive Officers
President and CEO
Shigeharu SuzukiDirector, Daiwa Securities Group Inc. President, Daiwa Securities Co. Ltd.
Deputy President and COO(Representative)
Shin YoshidomeDirector, Daiwa Securities Group Inc. President, Daiwa Securities SMBC Co. Ltd.
Deputy President
Toshiro IshibashiDirector, Daiwa Securities Group Inc. Deputy President, Daiwa Securities Co. Ltd.
Deputy President
Shuntaro HigashiDeputy President, Daiwa Securities SMBC Co. Ltd.
Deputy President
Michihito HiguchiPresident, Daiwa Asset Management Co. Ltd.
Deputy President
Hiroshi OtaPresident, Daiwa Institute of Research Ltd.
Corporate Executive Vice President
Takashi HibinoDirector, Daiwa Securities Group Inc. Senior Managing Executive Officer, Daiwa Securities SMBC Co. Ltd.
Corporate Executive Vice President
Ikuo MoriDirector, Daiwa Securities Group Inc. Representative Senior Managing Director, Daiwa Securities SMBC Co. Ltd.
Corporate Senior Executive Officer and CIO
Akira NakamuraDirector, Daiwa Securities Group Inc. Director, Daiwa Institute of Research Ltd.
Corporate Senior Executive Officer and CFO
Nobuyuki IwamotoDirector, Daiwa Securities Group Inc. Director, Daiwa Asset Management Co. Ltd.
Corporate Senior Executive Officer
Masamichi YokoiChairman, Daiwa America Corporation
Corporate Executive Officer
Seiji Nakata
Corporate Executive Officer
Masaaki Goto
Corporate Executive Officer
Akira KiyotaChairman of the Board, Daiwa Securities Group Inc.

128 Daiwa Securities Group Annual Report 2008
Daiwa Securities Co. Ltd.1) Organization (As of July 1, 2008)
Board of Corporate AuditorsCorporate Auditors Corporate Auditors’ Office
Management Committee Legal Affairs & Compliance Committee Risk Management CommitteeExecutive Committee
Internal Audit Officer Internal Audit Dept.
Risk Management Dept.
Accounting & Finance Dept.
Overseas Subsidiary
Private Banking Dept.
Head Sales OfficeAreasGroups
Private Banking Officer
Sales Officer
Loan Business Dept.Loan Business Officer
Investment Program Dept.
Corporate Planning Dept.Personnel Dept.
Planning & Personnel Officer
Operations Dept.System Planning Dept.
Operations & System Planning Officer
Administration Division[Head of Administration Division][Deputy Head of Administration Division]
Products Division[Head of Products Division]
Investment Trust Dept.Pension & Annuity Dept.
Asset Management Officer
Compliance Dept.Transaction Assessment Dept.Information Security Dept.
Compliance Division[Head of Compliance Division]
Corporate Client Services Dept.Corporate Pension Dept.Securities Intermediary Business Dept.
Corporate Client Services Officer
Daiwa Direct Planning Dept.Call Center Management Dept.Daiwa Direct Administration Dept.
Overseas Business Officer
Investment Banking Dept. IInvestment Banking Dept. IIFinancial & Public Institutions Dept.
Investment Banking Officer
Products Planning Dept.Investment Strategy & Research Dept.Equity Dept.Fixed Income Dept.Products Operations Dept.
Products Officer
Data Processing Dept.Sales Planning Dept.Sales Support Dept.Public Service Consulting Dept.Wealth Management Dept.Education and Training Dept.
Sales Planning Division[Head of Sales Planning Division]
SMA Consulting Dept.SMA Investment Management Dept.SMA Operation & Examination Dept.Fund Wrap Dept.
Sales Division[Head of Sales Division][Deputy Head of Sales Division]
Daiwa Direct Division[Head of Daiwa Direct Division]
Daiwa SMA Division[Head of Daiwa SMA Division]
Shareholders’ Meeting
Board of Directors
PTS Management Dept.
Business Strategy Dept.
Investment Program Officer
PTS Officer
SMA Officer

129Daiwa Securities Group Annual Report 2008
2) Officers (As of July 1, 2008)
Directors
President
Shigeharu Suzuki
Deputy President
Toshiro Ishibashi
Senior Managing Director
Takashi Fukai
Representative Senior Managing Director
Masaki Shimazu
Senior Managing Director
Makoto Shirakawa
Managing Director
Yoshimi Murakami
Managing Director
Teruaki Ueda
Managing Director
Koichi Suzuki
Corporate Auditors
Shohei Takashima
Zenichiro Onishi
Saburo Jifuku
Executive Officers
Senior Executive Officers
Takuya Ikeda
Osamu Abiru
Hiroshi Nakamura
Executive Officers
Yasuharu Okanoya
Shinya Kusaba
Keiji Komagata
Keiichi Sakai
Naofumi Idei
Ikuo Shoda
Hideto Sakao
Masahiko Kooku
Yosuke Sakai
Keiichi Takezaki
Koichi Matsushita

130 Daiwa Securities Group Annual Report 2008
Shareholders’ Meeting
Board of Directors Board of Corporate Auditors
Corporate Auditors
Executive CommitteeManagement Committee
Corporate Auditors’ Office
Daiwa Securities SMBC Principal Investments Co. Ltd
Planning Officer
Internal Audit Officer
Legal Affairs & Compliance CommitteeRisk Management Committee
Global Equity Products Officer
Global Product Planning Officer
Syndicate Officer
Corporate Finance Officer
Structured Finance Officer
Investment Banking Strategic Planning Officer
Corporate Division Planning Officer
Public Institutions Officer
Corporate Sales Officer
Corporate Institutions Officer
Initial Public Offering Officer
Investment Programs Officer
Financial Institutions Officer
Global Equity Sales Officer
Capital Markets Officer
Fixed Income, Currency and Commodities (FICC) Officer
M&A Officer
International Planning & Administration Officer
Compliance Officer
IT & Administration Officer
Osaka Branch Officer
Nagoya Branch Officer
Finance & Risk Management Officer
Asia & Oceania Region Officer
Europe & Middle East Region Officer
Product Administration Officer
Daiwa Securities SMBC Co. Ltd.1) Organization (As of August 1, 2008)

131Daiwa Securities Group Annual Report 2008
2) Officers (As of July 1, 2008)
Directors
President
Shin Yoshidome
Deputy President
Shuntaro Higashi
Representative Senior Managing Director
Ikuo MoriPresident, Daiwa Securities SMBC Asia Holding B.V.
Senior Managing Director
Kazuhiko Akamatsu
Representative Senior Managing Director
Masaki Yamane
Managing Director
Mitsuharu Tanaka
Managing Director
Akio Takahashi
Director
Shigeo Koike
Director
Toshinao Matsushima
Director
Tetsufumi Fujisawa
Corporate Auditors
Shigeharu Tominaga
Satoshi Otsu
Fuminori Yoshitake
Yoshio Nagamoto
Executive Officers
Senior Managing Executive Officer
Takashi Hibino
Senior Executive Officers
Yoriyuki Kusaki
Kenichi Miki
Motoi Takahashi
Takatoshi Wakabayashi
Shigeru IshidaChairman, Daiwa Securities SMBC Hong Kong Limited Chairman, Daiwa Securities SMBC- Cathay Co., Ltd.
Executive Officers
Eishu KosugeChairman, Daiwa Securities SMBC Europe Limited
Shinya Nishio
Yoshimasa Tsunei
Yoshimasa Nagase
Hiroaki Saito
Kazuo Takahashi
Akira InouePresident, Daiwa Securities SMBC Principal Investments Co. Ltd.
Yoshio Urata
Akihiko KanamuraChairman, Daiwa Securities SMBC Singapore Limited Chairman, Daiwa Securities SMBC Futures Pte Ltd. Deputy Chairman, Daiwa Securities SMBC Hong Kong Limited
Kunio Sato
Hisanobu Sonoda
Hisato Oiwa
Yuichi Akai
Toshihiko OnishiDeputy President, Daiwa Securities SMBC Principal Investments Co. Ltd.

132 Daiwa Securities Group Annual Report 2008
Domestic Group Companies(As of July 1, 2008)
Daiwa Securities Co. Ltd.GranTokyo North Tower
9-1, Marunouchi 1-chome, Chiyoda-ku, Tokyo 100-6752, Japan
Tel: (81) 3-5555-2111
Daiwa Securities SMBC Co. Ltd.GranTokyo North Tower
9-1, Marunouchi 1-chome, Chiyoda-ku, Tokyo 100-6753, Japan
Tel: (81) 3-5555-3111
Daiwa Asset Management Co. Ltd.10-5, Nihonbashi-Kayabacho 2-chome, Chuo-ku, Tokyo
103-0025, Japan
Tel: (81) 3-5695-2111
Daiwa Institute of Research Ltd.15-6, Fuyuki, Koto-ku, Tokyo 135-8460, Japan
Tel: (81) 3-5620-5100
Daiwa SB Investments Ltd.2-1, Kasumigaseki 3-chome, Chiyoda-ku, Tokyo 100-0013, Japan
Tel: (81) 3-6205-0200
Daiwa Securities Business Center Co. Ltd.3-2, Toyo 2-chome, Koto-ku, Tokyo 135-0016, Japan
Tel: (81) 3-5633-6100
Daiwa Property Co., Ltd.2-1, Kyobashi 1-chome, Chuo-ku, Tokyo 104-0031, Japan
Tel: (81) 3-5555-4700
NIF SMBC Ventures Co., Ltd.8-10, Kudankita 1-chome, Chiyoda-ku, Tokyo 102-0073, Japan
Tel: (81) 3-6910-2600
Daiwa Securities SMBC Principal Investments Co. Ltd.GranTokyo North Tower
9-1, Marunouchi 1-chome, Chiyoda-ku, Tokyo 100-6754, Japan
Tel: (81) 3-5555-6111
Daiwa Securities Loan Co., Ltd.3-2, Toyo 2-chome, Koto-ku, Tokyo 135-0016, Japan
Tel: (81) 3-5683-9589
Daiwa Fund Consulting Co. Ltd.6-1, Otemachi 2-chome, Chiyoda-ku, Tokyo 100-0004, Japan
Tel: (81) 3-6225-3200
Daiwa Pension Consulting Co., Ltd.3-2, Toyo 2-chome, Koto-ku, Tokyo 135-0016, Japan
Tel: (81) 3-3615-7771
Daiwa Investor Relations Co. Ltd.2-1, Kyobashi 1-chome, Chuo-ku, Tokyo 104-0031, Japan
Tel: (81) 3-5555-4111
Daiwa Securities Media Networks Co. Ltd.GranTokyo North Tower
9-1, Marunouchi 1-chome, Chiyoda-ku, Tokyo 100-6751, Japan
Tel: (81) 3-5555-1175
Daiwa Office Management Co., Ltd.GranTokyo North Tower
9-1, Marunouchi 1-chome, Chiyoda-ku, Tokyo 100-6756, Japan
Tel: (81) 3-5555-1400
DAIWA SANKO Co., LTD5-9, Sotokanda 2-chome, Chiyoda-ku, Tokyo 101-0021, Japan
Tel: (81) 3-5256-4111
HINODE SECURITIES CO., LTD.2-14, Awajicho 2-chome, Chuo-ku, Osaka-shi, Osaka 541-0047, Japan
Tel: (81) 6-6205-7711
DIR System Management Co., Ltd.14-6, Eitai 1-chome, Koto-ku, Tokyo 135-8461, Japan
Tel: (81) 3-3820-3295
DIR System Technology Co., Ltd.11-6, Tomioka 2-chome, Koto-ku, Tokyo 135-0047, Japan
Tel: (81) 3-5620-4180

133Daiwa Securities Group Annual Report 2008
Overseas Group Companies(As of July 1, 2008)
Daiwa Securities Group Inc.
Daiwa Securities America Inc.Financial Square, 32 Old Slip, New York, NY 10005, U.S.A.
Tel: (1) 212-612-7000
Daiwa Securities Trust and Banking (Europe) PLC5 King William Street, London EC4N 7JB, United Kingdom
Tel: (44) 20-7320-8000
Daiwa Securities Trust CompanyOne Evertrust Plaza, Jersey City, NJ 07302, U.S.A.
Tel: (1) 201-333-7300
Daiwa Europe Fund Managers (Ireland) Ltd.Level 3, Block 5, Harcourt Centre, Harcourt Road, Dublin 2, Ireland
Tel: (353) 1-603-9900
Daiwa Europe Trustees (Ireland) Ltd.Level 3, Block 5, Harcourt Centre, Harcourt Road, Dublin 2, Ireland
Tel: (353) 1-603-9900
Daiwa Securities Co. Ltd.
Daiwa Wealth Management Singapore Pte. Ltd.6 Shenton Way #26-08, DBS Building Tower Two, Singapore
068809, Republic of Singapore
Tel: (65) 6222-7281
Daiwa Securities SMBC Co. Ltd.
Daiwa Securities SMBC Europe Limited
Head Office5 King William Street, London EC4N 7AX, United Kingdom
Tel: (44) 20-7597-8000
Frankfurt BranchTrianon Bldg., Mainzer Landstrasse 16, 60325 Frankfurt am Main,
Federal Republic of Germany
Tel: (49) 69-717080
Paris Branch112, Avenue Kléber, 75116 Paris, France
Tel: (33) 1-56-26-22-00
Geneva Branch50, rue du Rhône, P.O. Box 3198, 1211 Geneva 3, Switzerland
Tel: (41) 22-818-74-00
Milan BranchVia Senato 14/16, 20121 Milan, Italy
Tel: (39) 02-763271
Spain BranchJose Ortega y Gasset 20, 7th floor, Madrid 28006, Spain
Tel: (34) 91-529-9800
Bahrain Branch7th Floor, The Tower, Bahrain Commercial Complex, P.O. Box
30069, Manama, Bahrain
Tel: (973) 1753-4452
Dubai BranchThe Gate Village Building 1, 1st Floor, Unit 6, Dubai International
Financial Centre, P.O. Box 506657, Dubai, UAE
Tel: (971) 4-7090401
Moscow Representative Office25/9, build. 1, Per. Sivtsev Vrazhek, Moscow 119002, Russian
Federation
Tel: (7) 495-617-1960

134 Daiwa Securities Group Annual Report 2008
Daiwa Securities SMBC Hong Kong Limited26th Floor, One Pacific Place, 88 Queensway, Hong Kong
Tel: (852) 2525-0121
Daiwa Securities SMBC Singapore Limited6 Shenton Way #26-08, DBS Building Tower Two, Singapore
068809, Republic of Singapore
Tel: (65) 6220-3666
Daiwa Securities SMBC Australia Limited34th Floor, Rialto North Tower, 525 Collins Street, Melbourne,
Victoria 3000, Australia
Tel: (61) 3-9916-1300
Daiwa Securities SMBC India Private Limited10th Floor, 3 North Avenue, Maker Maxity, Bandra Kurla Complex,
Bandra East, Mumbai 400051, India
Tel: (91) 22-6622-1000
DBP-Daiwa Securities SMBC Philippines, Inc.18th Floor, Citibank Tower, 8741 Paseo de Roxas, Salcedo Village,
Makati City, Republic of the Philippines
Tel: (632) 813-7344
Daiwa Securities SMBC-Cathay Co., Ltd.14th Floor, 200, Keelung Road, Sec.1, Taipei, Taiwan, R.O.C.
Tel: (886) 2-2723-9698
Daiwa SMBC-SSC Securities Co., Ltd.15th Floor, Aurora Plaza, 99 Fucheng Road, Pudong, Shanghai,
200120, People’s Republic of China
Tel: (86) 21-6859-8000
Seoul Branch6th Floor, DITC Building, #27-3, Youido-dong, Yongdungpo-gu,
Seoul, Republic of Korea
Tel: (82) 2-787-9100
Beijing Representative OfficeRoom 3503/3504, Capital Tower Beijing, No. 6 Jia Jianguomen
Wai Avenue, Chaoyang District, Beijing, 100022,
People’s Republic of China
Tel: (86) 10-6500-6688
Bangkok Representative Office18th Floor, M. Thai Tower, All Seasons Place, 87 Wireless Road,
Lumpini, Pathumwan, Bangkok 10330 Thailand
Tel: (66) 2-252-5650
Hanoi Representative OfficeSuite 405, Pacific Place Building, 83B Ly Thuong Kiet Street,
Hanoi, Vietnam
Tel: (84) 4-946-0460

Daiwa Securities Group Annual Report 2008 135
Daiwa Securities Group Inc. Corporate Data
Head OfficeGranTokyo North Tower
9-1, Marunouchi 1-chome, Chiyoda-ku, Tokyo 100-6751, Japan
Tel: (81) 3-5555-1111
Websitehttp://www.daiwa-grp.jp/ir/english/
Commencement of OperationsMay 1, 1902
Date of FoundingDecember 27, 1943
Common StockAuthorized
4,000,000 thousand shares
Issued and Outstanding
1,404,664 thousand shares
(as of March 31, 2008)
Number of Shareholders98,809 (as of March 31, 2008)
Independent Public AccountantKPMG AZSA & Co.
Stock Exchange ListingsTokyo, Osaka, Nagoya
Transfer Agent and RegistrarThe Sumitomo Trust and Banking Company, Limited
Stock Transfer Agency Department
4-4, Marunouchi 1-chome, Chiyoda-ku,
Tokyo 100-8233, Japan
(From October 1, 2008)
The Sumitomo Trust and Banking Company, Limited
Stock Transfer Agency Department
3-1, Yaesu 2-chome, Chuo-ku,
Tokyo 104-8476, Japan
For further information, please contact: Daiwa Securities Group Inc. Tel: (81) 3-5555-1300 Investor Relations Fax: (81) 3-5555-0661
Email: [email protected]
URL: http://www.daiwa-grp.jp/ir/english/

Daiwa Securities Group
www.daiwa-grp.jp
Printed in Japan