Embed Size (px)
Citation preview

Audited Consolidated Financial Statements of
Route1 Inc.
For the years ended December 31, 2017 and 2016

TABLE OF CONTENTS Route1 Inc.
Page
Independent Auditor’s Report 1
Consolidated Statements of Financial Position 2
Consolidated Statements of Comprehensive Income 3
Consolidated Statements of Changes in Equity 4
Consolidated Statements of Cash Flows 5
Notes to the Consolidated Financial Statements 6-29

1

CONSOLIDATED STATEMENTS OF FINANCIAL POSITION Route1 Inc.
As at December 31, 2017 and December 31, 2016
(stated in Canadian dollars)
2017 | Route1 Annual Consolidated Financial Statements 2
December 31
December 31
Note 2017 2016
Assets
Current assets
Cash and cash equivalents $1,037,424 $1,945,549
Accounts receivable 15 333,023 181,848
Other receivables 177,180 170,741
Devices and appliances held for sale 4 248,408 312,995
Prepaid expenses 238,670 299,205
Total current assets 2,034,705 2,910,338
Non-current assets
Deferred tax asset 17 742,067 742,067
Property, furniture and equipment 5 168,449 305,592
Intangible assets 5 225,415 231,685
Total non-current assets 1,135,931 1,279,344
Total assets $3,170,636 $4,189,682
Liabilities
Current liabilities
Accounts payable and other liabilities $333,451 $345,048
Deferred revenue 16 1,495,409 2,154,721
Total current liabilities 1,828,860 2,499,769
Non-current liabilities
Other liabilities 75,140 62,288
Deferred revenue 16 30,726 27,947
Total non-current liabilities 105,866 90,235
Total liabilities 1,934,726 2,590,004
Shareholders’ equity
Capital and reserve
Common shares 7, 8 22,150,751 22,169,410
Contributed surplus – stock compensation
reserve
8
14,408,256
14,143,368
Deficit (35,323,097) (34,713,100)
Total shareholders’ equity 1,235,910 1,599,678
Total shareholders’ equity and liabilities $3,170,636 $4,189,682
Subsequent event (note 18)
Approved by the Board of Directors:
Director: Director:
● “signed” ● “signed”
Michael F. Doolan Tony Busseri
The accompanying notes are an integral part of these audited consolidated financial statements

CONSOLIDATED STATEMENTS OF COMPREHENSIVE INCOME Route1 Inc.
For the years ended December 31, 2017 and 2016
(stated in Canadian dollars)
2017 | Route1 Annual Consolidated Financial Statements 3
Note 2017 2016
Revenue
Subscription revenue and services 16 $5,698,449 $7,080,462
Devices and appliances 16 321,074 363,031
Other 16 50,803 3,995
Total revenue 6,070,326 7,447,488
Cost of revenue 4 1,325,038 1,474,951
Gross profit 4,745,288 5,972,537
Operating expenses
General administration 2,901,745 3,105,935
Research and development 970,044 1,184,926
Selling and marketing 864,304 939,676
Total operating expense 4,736,093 5,230,537
Operating profit before stock-based compensation and
patent litigation
9,195 742,000
Patent litigation 6 (270,374) (56,292)
Stock-based compensation 8 (264,888) (368,197)
Operating (loss) profit including stock-based compensation
and patent litigation
(526,067) 317,511
Other (expense) income
Interest income
Foreign exchange (loss) gain
-
(83,930)
251
11,980
Total other (expense) income (83,930) 12,231
(Loss) income before taxes (609,997) 329,742
Income tax recovery 17 - -
Total comprehensive (loss) income $(609,997) $329,742
Basic and diluted (loss) income per share 10 $(0.00) $0.00
Weighted average number of common shares outstanding 347,511,222 355,100,654
The accompanying notes are an integral part of these audited consolidated financial statements

CONSOLIDATED STATEMENTS OF CHANGES IN EQUITY Route1 Inc.
For the years ended December 31, 2017 and 2016
(stated in Canadian dollars)
2017 | Route1 Annual Consolidated Financial Statements 4
Note Common
Shares Warrants
Contributed
Surplus Deficit
Total
shareholder’s
equity
Balance at January 1, 2016 $22,864,205 $ - $13,775,171 $(35,042,842) $1,596,534
Repurchase of capital stock for
cancellation 7 (694,795) - - - (694,795)
Stock-based compensation 8 - - 368,197 - 368,197
Comprehensive income - - - 329,742 329,742
Balance at December 31, 2016 $22,169,410 $ - $14,143,368 $(34,713,100) $1,599,678
Note Common
Shares Warrants
Contributed
Surplus Deficit
Total
shareholder’s
equity
Balance at January 1, 2017 $22,169,410 $ - $14,143,368 $(34,713,100) $1,599,678
Repurchase of capital stock
for cancellation 7 (18,659) - - - (18,659)
Stock-based compensation 8 - - 264,888 - 264,888
Comprehensive loss - - - (609,997) (609,997)
Balance at December 31, 2017 $22,150,751 $ - $14,408,256 $(35,323,097) $1,235,910
The accompanying notes are an integral part of these audited consolidated financial statements

CONSOLIDATED STATEMENTS OF CASH FLOWS Route1 Inc.
For the years ended December 31, 2017 and 2016
(stated in Canadian dollars)
2017 | Route1 Annual Consolidated Financial Statements 5
Note 2017 2016
Net cash (outflow) inflow related to the following activities
Operating activities
(Loss)/profit from operations $(609,997) $329,742
Items not affecting cash and cash equivalents
Depreciation and amortization 5 391,801 461,401
Devices and appliances write down 4 10,313 7,716
Stock-based compensation 8 264,888 368,197
57,005 1,167,056
Net changes in working capital balances
(Increase) in accounts receivable (151,175) (39,327)
(Increase)/decrease in other receivables (6,439) 77,460
Decrease/(increase) in inventories 54,274 (27,088)
Decrease/(increase) in prepaid expenses 60,535 (122,341)
(Decrease)/increase in payables and other liabilities (11,597) 53,806
Increase/(decrease) in deferred rent 12,852 (5,073)
(Decrease)/increase in deferred revenue (656,533) 482,248
(698,083) 419,685
Net cash (used) generated by operating activities (641,078) 1,586,741
Investing activities
Property, furniture and equipment 5 (71,659) (84,421)
Intangible assets 5 (176,729) (113,218)
Net cash used by investing activities (248,388) (197,639)
Financing activities
Repurchase of capital stock for cancellation 7 (18,659) (694,795)
Net cash used by financing activities (18,659) (694,795)
Net (decrease)/increase in cash and cash equivalents for the
year
(908,125) 694,307
Cash and cash equivalents, beginning of year 1,945,549 1,251,242
Cash and cash equivalents, end of year $1,037,424 $1,945,549
The accompanying notes are an integral part of these audited consolidated financial statements

NOTES TO THE CONSOLIDATED FINANCIAL STATEMENTS Route1 Inc.
December 31, 2017 and 2016 (stated in Canadian dollars)
2017 | Route1 Annual Consolidated Financial Statements 6
1. NATURE AND DESCRIPTION OF THE COMPANY
Route1 Inc. (“Route1” or “the Company”) is a publicly traded company on the TSX Venture Exchange
and the OTCQB Venture Market. The Company is incorporated under the laws of the Province of
Ontario by articles of amendment dated October 14, 2004 followed by articles of continuance dated
November 10, 2004. The registered office of the company is 8 King Street East, Suite 600, Toronto,
Ontario, M5C 1B5.
Route1 delivers industry-leading security and identity management solutions to enterprises worldwide –
businesses, government and military which need universal, secure access to all digital resources and
sensitive data. For more information, visit the Company’s website at: www.route1.com.
© Route1 Inc., 2018. All rights reserved. Route1, Route 1, the Route1 and shield design Logo,
MobiDESK, Mobi, Route1 MobiVDI, Route1 MobiDESK, Route1 MobiBOOK, Route1 MobiKEY,
Route1 MobiNET, IBAD, MobiVDI, MobiNET, DEFIMNET, Powered by MobiNET, Route1 Mobi,
Route1 MobiLINK, TruOFFICE, MobiLINK, EnterpriseLIVE, PurLINK, TruCOMMAND,
MobiMICRO, DerivID, MobiENCRYPT and MobiKEY are either registered trademarks or trademarks of
Route1 Inc. in the United States and/or Canada. All other trademarks and trade names are the property of
their respective owners.
The DEFIMNET and MobiNET platforms, the MobiKEY, MobiKEY Classic, MobiKEY Classic 2,
MobiKEY Classic 3, MobiKEY Fusion, MobiKEY Fusion2, and MobiKEY Fusion3 devices, and
MobiLINK are protected by U.S. Patents 7,814,216, 7,739,726, 9,059,962, 9,059,997 and 9,319,385,
Canadian Patent 2,578,053, and other patents pending. The MobiKEY Classic 2 and MobiKEY Classic 3
devices are also protected by U.S. Patents 6,748,541 and 6,763,399, and European Patent 1001329 of
Aladdin Knowledge Systems Ltd. and used under license. Other patents are registered or pending in
various countries around the world.
2. SIGNIFICANT ACCOUNTING POLICIES AND BASIS OF PREPARATION
2.1 Statement of compliance
The consolidated financial statements have been prepared in accordance with International Financial
Reporting Standards (“IFRS”) as issued by the International Accounting Standards Board (“IASB”).
The audited year-end consolidated financial statements were authorized for issuance by the Company’s
Board of Directors on April 17, 2018.
2.2 Basis of consolidation
Subsidiaries are entities controlled by the Company. Control exists when the Company is exposed or has
rights to variable returns from an investee and has the ability to affect those returns through its power over
the investee. The results of subsidiaries acquired or disposed of during the period are included in the
consolidated statement of comprehensive income from the effective date of acquisition and up to the
effective date of disposal, as appropriate. Where necessary, adjustments are made to the financial records
of the subsidiary to bring their accounting policies in line with those used by the Company. All
intercompany transactions, balances, income and expenses are eliminated upon consolidation. Where the
Company’s interest in a subsidiary is less than 100%, the Company recognizes a non-controlling interest.

NOTES TO THE CONSOLIDATED FINANCIAL STATEMENTS Route1 Inc.
December 31, 2017 and 2016 (stated in Canadian dollars)
2017 | Route1 Annual Consolidated Financial Statements 7
These consolidated financial statements include the accounts of the Company and its wholly-owned
subsidiary Route 1 Security Corporation.
2.3 Basis of preparation
The consolidated financial statements have been prepared on the historical cost basis. Historical cost is
generally based on the fair value of the consideration given in exchange for assets.
The accounting policies set out in these consolidated financial statements have been applied consistently
to all periods presented in these consolidated financial statements.
(a) Functional and presentation currency and foreign currency translation
These consolidated financial statements are presented in Canadian dollars, which is the Company’s
and its wholly-owned subsidiary company’s functional currency. Monetary assets and liabilities
denominated in foreign currencies are translated into Canadian dollars at the exchange rate in effect
at the balance sheet date; non-monetary assets and liabilities denominated in foreign currencies are
translated into Canadian dollars at historical exchange rates; revenues and expenses denominated in
foreign currencies are translated into Canadian dollars for any month at the average monthly
exchange rate for the prior month. Foreign exchange gains and losses on translation are included in
the consolidated statements of comprehensive income in the period in which they occur.
(b) Cash and cash equivalents
Cash and cash equivalents consist of cash deposits with chartered banks both in Canada and the
United States that are available on demand.
(c) Financial instruments
Financial assets and financial liabilities are initially recognized at fair value and their subsequent
measurement is dependent on their classification as described below. Their classification depends
on the purpose for which the financial instruments were acquired or issued, their characteristics and
the Company's designation of such instruments. Settlement date accounting is used.
Financial assets Classification Measurement
Cash and cash equivalents Loans and receivables Amortized cost
Accounts receivable Loans and receivables Amortized cost
Financial liabilities
Accounts payable and other liabilities Other financial liabilities Amortized cost
(c)(i) Loans and receivables
Loans and receivables are accounted for at amortized cost using the effective interest method.
NOTES TO THE CONSOLIDATED FINANCIAL STATEMENTS Route1 Inc.
December 31, 2017 and 2016 (stated in Canadian dollars)
2017 | Route1 Annual Consolidated Financial Statements 8
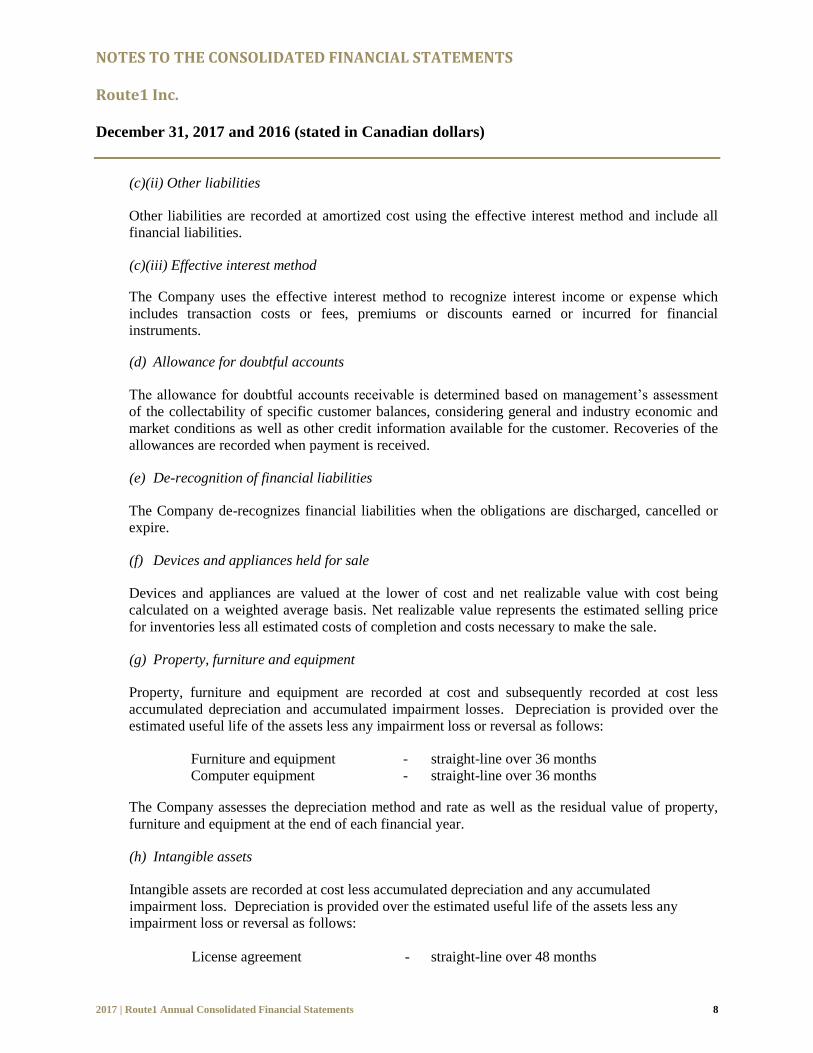
(c)(ii) Other liabilities
Other liabilities are recorded at amortized cost using the effective interest method and include all
financial liabilities.
(c)(iii) Effective interest method
The Company uses the effective interest method to recognize interest income or expense which
includes transaction costs or fees, premiums or discounts earned or incurred for financial
instruments.
(d) Allowance for doubtful accounts
The allowance for doubtful accounts receivable is determined based on management’s assessment
of the collectability of specific customer balances, considering general and industry economic and
market conditions as well as other credit information available for the customer. Recoveries of the
allowances are recorded when payment is received.
(e) De-recognition of financial liabilities
The Company de-recognizes financial liabilities when the obligations are discharged, cancelled or
expire.
(f) Devices and appliances held for sale
Devices and appliances are valued at the lower of cost and net realizable value with cost being
calculated on a weighted average basis. Net realizable value represents the estimated selling price
for inventories less all estimated costs of completion and costs necessary to make the sale.
(g) Property, furniture and equipment
Property, furniture and equipment are recorded at cost and subsequently recorded at cost less
accumulated depreciation and accumulated impairment losses. Depreciation is provided over the
estimated useful life of the assets less any impairment loss or reversal as follows:
Furniture and equipment - straight-line over 36 months
Computer equipment - straight-line over 36 months
The Company assesses the depreciation method and rate as well as the residual value of property,
furniture and equipment at the end of each financial year.
(h) Intangible assets
Intangible assets are recorded at cost less accumulated depreciation and any accumulated
impairment loss. Depreciation is provided over the estimated useful life of the assets less any
impairment loss or reversal as follows:
License agreement - straight-line over 48 months

NOTES TO THE CONSOLIDATED FINANCIAL STATEMENTS Route1 Inc.
December 31, 2017 and 2016 (stated in Canadian dollars)
2017 | Route1 Annual Consolidated Financial Statements 9
Computer software - straight-line over 12 months
Computer software (applications) - straight-line over 60 months
Internally generated applications - straight-line over 36 months
Patents - straight-line over the life of the patent
Other - straight-line over 24 months
The Company assesses the depreciation method and rate as well as the residual value of intangible
assets at the end of each financial year.
(i) Impairment of property, furniture and equipment and intangible assets
At the end of each reporting period, the Company reviews the carrying amounts of its tangible and
intangible assets to determine whether there is any indication that those assets have suffered an
impairment loss. If any such indication exists, the recoverable amount of the asset is estimated in
order to determine the extent of the impairment loss (if any). When it is not possible to estimate the
recoverable amount of an individual asset, the Company estimates the recoverable amount of the
cash-generating unit to which the asset belongs. When a reasonable and consistent basis of
allocation can be identified, corporate assets are also allocated to individual cash-generating units,
or otherwise they are allocated to the smallest group of cash-generating units for which a
reasonable and consistent allocation basis can be identified. Recoverable amount is the higher of
fair value less costs to sell and value in use. In assessing value in use, the estimated future cash
flows are discounted to their present value using a pre-tax discount rate that reflects current market
assessments of the time value of money and the risks specific to the asset for which the estimates of
future cash flows have not been adjusted. If the recoverable amount of an asset (or cash-generating
unit) is estimated to be less than its carrying amount, the carrying amount of the asset (or cash-
generating unit) is reduced to its recoverable amount. An impairment loss is recognized
immediately in profit or loss, unless the relevant asset is carried at a revalued amount, in which case
the impairment loss is treated as a revaluation decrease.
(j) Leases
Leases are classified as finance leases whenever the terms of the lease transfer substantially all the
risks and rewards of ownership to the lessee. All other leases are classified as operating leases.
Payments of operating leases are recognized straight line over the term of the lease.
(k) Revenue recognition
The Company recognizes revenue when it is realized and earned. The Company considers revenue
realized and earned when the Company has transferred to the buyer the significant risks and rewards
of ownership of the goods (or service has been performed), the Company does not retain any
managerial involvement, it is probable that the economic benefits associated with the transaction
will flow to the Company, and the amount of revenue can be measured reliably. The following
paragraphs describe the specific revenue recognition policies for each major component of revenue.

NOTES TO THE CONSOLIDATED FINANCIAL STATEMENTS Route1 Inc.
December 31, 2017 and 2016 (stated in Canadian dollars)
2017 | Route1 Annual Consolidated Financial Statements 10
(i) Devices
Revenues from the sale of MobiKEY devices are recognized when title is transferred to the
customer and all significant contractual obligations that affect the customer’s final acceptance
have been fulfilled.
(ii) Appliances
Revenues from the sale of a DEFIMNET platform and a MobiNET Aggregation Gateway
appliance are recognized when title is transferred to the customer and all significant
contractual obligations that affect the customer’s final acceptance have been fulfilled.
(iii) Service
Revenue from MobiKEY application software subscription-based services, and DEFIMNET
platform and other appliance licensing or maintenance is recognized rateably over the term of
the contract on a daily basis when the service is provided. In instances where the Company
bills the customer prior to performing the service, the prepayment amount is recorded as
deferred revenue.
(l) Multiple-element arrangements
The Company enters into transactions that represent multiple-element arrangements which may
include any combination of devices and service. These multiple-element arrangements are assessed
to determine whether they can be separated into more than one unit of accounting or element for the
purpose of revenue recognition. When one or more of the components may be purchased
independently of the other components, and there is evidence of fair value for all units of accounting
or elements in an arrangement, the arrangement consideration is allocated to the separate units of
accounting or elements based on the relative fair value method. This evidence of fair value is
established through prices charged for each revenue element when that element is sold separately.
The revenue recognition policies described above are then applied to each unit of accounting.
(m) Research and development
Research expenditures are charged as an operating expense of the Company as incurred. Expenditures for development of software and equipment are capitalized and amortized only when the criteria for capitalization are met.
Scientific research and economic development (“SR&ED”) credits and government grants
SR&ED credits are estimated and recognized rateably throughout the year based on management’s
expectation of projects undertaken for the current year that will comply with the conditions
attaching to them. SR&ED credits reduce research and development expenses. Similarly,
government grants, recorded as other revenue, are recognized when all conditions have been met,
the grant has been earned and the grant is non-refundable. For the 2017 fiscal year, the Company
accrued $138,534 for SR & ED credits (December 31, 2016 - $150,000).

NOTES TO THE CONSOLIDATED FINANCIAL STATEMENTS Route1 Inc.
December 31, 2017 and 2016 (stated in Canadian dollars)
2017 | Route1 Annual Consolidated Financial Statements 11
(n) Stock-based compensation
Equity-settled share-based payments to employees and others providing similar services are
measured at the fair value of the equity instruments at the grant date. The Company calculates
stock-based compensation using the Black-Scholes option pricing model to value the options at the
grant date, and subsequently expenses such value ratably over the vesting term.
Equity-settled share-based payment transactions related to services provided by non-employees are
measured at the fair value of the services received. If the services cannot be measured reliably, the
transaction is measured at the fair value of the equity instrument issued.
(o) Legal claims
In the normal course of operations, the Company may be subject to litigation claims from
customers, suppliers, patent holders, resellers and former employees. A provision is recognized
when the probability that payment will occur is more likely than not. The Company regularly
reviews any outstanding claims to see if they meet the criteria. A provision is calculated based on
management’s best estimate of probable outflow of economic resources.
(p) Income taxes
The tax currently payable (if any) is based on taxable profit for the year. Taxable profit differs from
profit as reported in the consolidated statement of comprehensive income because of items of
income or expense that are taxable or deductible in other years and items that are never taxable or
deductible. The Company's liability for current tax is calculated using tax rates that have been
enacted or substantively enacted by the end of the reporting period.
(q) Recognition of deferred tax assets and liabilities
Deferred tax is recognized on temporary differences between the carrying amounts of assets and
liabilities in the consolidated financial statements and the corresponding tax bases used in the
computation of taxable profit. Deferred tax liabilities are generally recognized for all taxable
temporary differences. Deferred tax assets are generally recognized for all deductible temporary
differences to the extent that it is probable that taxable profits will be available against which those
deductible temporary differences can be utilized. The Company's asset/liability for deferred tax is
calculated using tax rates that have been enacted or substantively enacted by the end of the
reporting period and rates expected to apply the deferred tax asset or deferred tax liability is settled.
(r) Loss/Earnings per share
Basic earnings per share are computed by dividing the loss/income by the weighted average shares outstanding during the reporting period.
The Company calculates the dilutive effect of options and warrants on earnings per share. Diluted
earnings per share is computed similarly to basic earnings per share, except the weighted average
shares outstanding are increased to include additional shares from the assumed exercise of stock
options and warrants, if dilutive. The number of additional shares is calculated by assuming that
outstanding stock options and warrants were exercised and that the proceeds from such exercises

NOTES TO THE CONSOLIDATED FINANCIAL STATEMENTS Route1 Inc.
December 31, 2017 and 2016 (stated in Canadian dollars)
2017 | Route1 Annual Consolidated Financial Statements 12
were used to acquire shares of common stock at the average market price during the reporting
period.
2.4 Use of estimates
In preparation of the Company’s consolidated financial statements in accordance with IFRS, management
is required to make estimates and assumptions that affect the reported amount of assets, liabilities, and the
disclosure of contingent liabilities at the date of the financial statements and the reported amounts of
revenues and expenses during the reporting period. Actual results could differ from those estimates used
in the Company’s consolidated financial statements and such differences could be material.
2.5 Critical judgments
The following are the critical judgments, apart from those involving estimations (see below), that the
directors have made in the process of applying the Company's accounting policies and that have the most
significant effect on the amounts recognized in the consolidated financial statements.
Revenue recognition: In making their judgment, management considers
the detailed criteria for the recognition of revenue
from the sale of goods and services set out in IAS
18 Revenue and, in particular, whether the
Company has transferred to the buyer the
significant risks and rewards of ownership of the
goods and services. As well, management applies
judgment when determining the fair value of the
separate units of accounting for its products and
services sold in multiple element arrangements.
This evidence of fair value is established through
prices charged for each revenue element when
that element is sold separately.
Functional currency: In making their judgment that the Canadian dollar
is the functional currency of the Company,
management considers the currency that
influences the cost of providing the goods and
services in each jurisdiction in which the
Company operates.
Capitalization of development costs: Management exercises judgment when
establishing whether the criteria under IAS 38,
Intangible Assets, for development costs have
been met, specifically the technical feasibility of
the products in development and the ability to
generate probable future economic benefits.
2.6 Significant estimates

NOTES TO THE CONSOLIDATED FINANCIAL STATEMENTS Route1 Inc.
December 31, 2017 and 2016 (stated in Canadian dollars)
2017 | Route1 Annual Consolidated Financial Statements 13
The following are the key assumptions concerning the future, and other key sources of estimation
uncertainty at the end of the reporting period, that have a significant risk of causing a material adjustment
to the carrying amounts of assets and liabilities within the next financial year.
Allowance for doubtful accounts: The Company reviews its credit sales and
determines the balance for the allowance for
doubtful accounts. The Company has determined
that no allowance for doubtful accounts is
required as of December 31, 2017.
Allowance for inventory obsolescence: The Company reviewed the recoverable amount
of its inventory for the year ended December 31,
2017; the Company incurred a write-down of
$10,313 which was included in the cost of
revenue. For additional information regarding the
devices and appliances write-down see Note 4,
“COST OF DEVICES SOLD” of these
financial statements.
Valuation of deferred tax asset: The Company estimates the probability that
taxable profits will be available to be offset
against deductible temporary differences and thus
give rise to a deferred tax asset. The Company
has reviewed the expected profitability and
determined that a deferred tax asset should be
recognized at December 31, 2017, as it is
probable that the asset will be utilized. See Note
17 to these financial statements, “INCOME
TAXES”.
Valuation of warrants and stock-based compensation: The Company estimates the fair value of stock-
based compensation issued for goods or services
based on the Black-Scholes Option Pricing
Model for warrants and share options with a
service condition. The Company has judged that
the fair value of the services could not be
determined; therefore the fair value of the shares,
share options and warrants was used in the
measurement of the transactions. These methods
of valuation were applied to the equity
transactions during the period (Note 8, “SHARE
CAPITAL, OPTIONS AND CONTRIBUTED
SURPLUS”).

NOTES TO THE CONSOLIDATED FINANCIAL STATEMENTS Route1 Inc.
December 31, 2017 and 2016 (stated in Canadian dollars)
2017 | Route1 Annual Consolidated Financial Statements 14
Recognition of SR&ED tax credits/Government grants: The Company estimates SR&ED credits based on
historical and forward looking analysis. SR&ED
credits are estimated and recognized rateably
throughout the year based on management’s
expectation of projects undertaken for the current
year that will comply with the conditions
attaching to them. Similarly, government grants,
recorded as other revenue, are recognized when
all conditions have been met, the grant has been
earned and the grant is non-refundable.
3. FUTURE ACCOUNTING POLICY CHANGES
Revenue from Contracts with Customers
IFRS 15, “Revenue from Contracts with Customers” (IFRS 15), was issued by the IASB in May 2014 and
will supersede current revenue recognition guidance, which is currently found across several standards
and interpretations including IAS 11, Construction Contracts and IAS 18, Revenue. IFRS 15 provides a
framework for determining the nature, amount, timing and uncertainty of revenue and cash flows arising
from a contract with a customer. The standard is effective for annual periods beginning on or after
January 1, 2018, with early adoption permitted. The Company has completed the process of assessing the
impact of this standard on its consolidated financial statements and has determined that as of January 1,
2018, device revenue and the associated cost of goods sold will be recognized ratably over the life of the
nearest term subscription contract. The Company expects that the impact on its financial statements will
not be material.
Financial Instruments
IFRS 9, “Financial Instruments” (IFRS 9), was issued by the IASB in July 2014 and will replace IAS 39
Financial Instruments: Recognition and Measurement. IFRS 9 uses a single approach to determine
whether a financial asset is measured at amortized cost or fair value, replacing the multiple rules in IAS
39. The approach in IFRS 9 is based on how an entity manages its financial instruments in the context of
its business model and the contractual cash flow characteristics of the financial assets. Most of the
requirements in IAS 39 for classification and measurement of financial liabilities were carried forward
unchanged to IFRS 9. The new standard also requires a single impairment method to be used, replacing
the multiple impairment methods in IAS 39. Requirements relating to Hedge Accounting, representing a
new hedge accounting model, have been added to IFRS 9 in November 2013. The new model represents a
substantial overhaul of hedge accounting which will allow entities to better reflect their risk management
activities in the financial statements. The most significant improvements apply to those that hedge non-
financial risk, and so these improvements are expected to be of particular interest to non-financial
institutions. The standard is effective for annual periods beginning on or after January 1, 2018, with early
adoption permitted. Management is assessing the impact of adopting IFRS 9 on the consolidated financial
statements.
NOTES TO THE CONSOLIDATED FINANCIAL STATEMENTS Route1 Inc.
December 31, 2017 and 2016 (stated in Canadian dollars)
2017 | Route1 Annual Consolidated Financial Statements 15
Leases
IFRS 16, “Leases” (IFRS 16), is effective for years commencing on or after January 1, 2019, and replaces
IAS 17, Leases. The standard provides a single lease accounting model, requiring leases to recognize
assets and liabilities for almost all leases. The standard is effective for annual periods beginning on or
after January 1, 2019, with early adoption permitted. Management is assessing the impact of adopting
IFRS 16 on the consolidated financial statements.

NOTES TO THE CONSOLIDATED FINANCIAL STATEMENTS Route1 Inc.
December 31, 2017 and 2016 (stated in Canadian dollars)
2017 | Route1 Annual Consolidated Financial Statements 16
4. COST OF DEVICES SOLD
Cost of revenue includes the cost of devices, salaries of select staff, hosting of our MobiNET and royalty
related fees. For the year ended December 31, 2017, the cost of devices recognized as an expense was
$218,213 (December 31, 2016 - $212,462).
For the year ended December 31, 2017, the Company incurred a devices and appliances write-down of
$10,313 (December 31, 2016 - $7,716) which was included in the cost of revenue.
5. PROPERTY, PLANT AND EQUIPMENT AND INTANGIBLE ASSETS
Cost Computer
Equipment
Furniture and
Equipment
Total Property,
Furniture and
Equipment
Intangible
Assets
Balance January 1, 2017 $1,610,210 $217,033 $1,827,243 $589,295
Additions 36,933 34,726 71,659 176,729
Disposals - - - -
Balance December 31, 2017 $1,647,143 $251,759 $1,898,902 $766,024
Accumulated depreciation
and impairment
Computer
Equipment
Furniture and
Equipment
Total Property,
Furniture and
Equipment
Intangible
Assets
Balance January 1, 2017 $(1,341,457) $(180,194) $(1,521,651) $(357,610)
Depreciation expense (181,406) (27,396) (208,802) (182,999)
Disposals - - - -
Balance December 31, 2017 $(1,522,863) $(207,590) $(1,730,453) $(540,609)
Net book value Computer
Equipment
Furniture and
Equipment
Total Property,
Furniture and
Equipment
Intangible
Assets
Balance January 1, 2017 $268,753 $36,839 $305,592 $231,685
Balance December 31, 2017 $124,280 $44,169 $168,449 $225,415

NOTES TO THE CONSOLIDATED FINANCIAL STATEMENTS Route1 Inc.
December 31, 2017 and 2016 (stated in Canadian dollars)
2017 | Route1 Annual Consolidated Financial Statements 17
Cost Computer
Equipment
Furniture and
Equipment
Total Property,
Furniture and
Equipment
Intangible
Assets
Balance January 1, 2016 $1,531,547 $211,275 $1,742,822 $476,077
Additions 78,663 5,758 84,421 113,218
Disposals - - - -
Balance December 31, 2016 $1,610,210 $217,033 $1,827,243 $589,295
Accumulated depreciation
and impairment
Computer
Equipment
Furniture and
Equipment
Total Property,
Furniture and
Equipment
Intangible
Assets
Balance January 1, 2016 $(1,030,062) $(156,278) $(1,186,340) $(231,520)
Depreciation expense (311,395) (23,916) (335,311) (126,090)
Disposals - - - -
Balance December 31, 2016 $(1,341,457) $(180,194) $(1,521,651) $(357,610)
Net book value Computer
Equipment
Furniture and
Equipment
Total Property,
Furniture and
Equipment
Intangible
Assets
Balance January 1, 2016 $501,485 $54,997 $556,482 $244,557
Balance December 31, 2016 $268,753 $36,839 $305,592 $231,685
As of December 31, 2017, non-current assets (excluding the deferred tax asset) were $393,864 (December
31, 2016 - $537,277). At December 31, 2017, computer, furniture, equipment and intangible assets
located in Canada were $326,939 (December 31, 2016 - $368,033) and $66,925 were located in the U.S.
(December 31, 2016 - $169,244).
For the year ended December 31, 2017, depreciation expense of $391,801 (December 31, 2016 -
$461,401) was recognized in general administration expense.

NOTES TO THE CONSOLIDATED FINANCIAL STATEMENTS Route1 Inc.
December 31, 2017 and 2016 (stated in Canadian dollars)
2017 | Route1 Annual Consolidated Financial Statements 18
6. PATENT LITIGATION
Patent litigation expenses consist of legal fees and other third party costs incurred to prosecute cases of
alleged patent infringement. Legal costs to prosecute the alleged patent infringement complaint are
expensed as incurred with any potential gain on settlement to be recognized on realization.
Patent litigation expenses for the year ended December 31, 2017 were $270,374 compared to $56,292 for
the year ended December 31, 2016.
On March 27, 2017, the Company filed a complaint against AirWatch LLC (AirWatch) in the US District
Court for the District of Delaware for infringement of Route1’s U.S. Patent No. 7,814,216 (the “216
Patent”), seeking damages and an injunction. On June 1, 2017, the Company served AirWatch with the
complaint.
Route1 alleges that AirWatch infringes on the 216 Patent through at least the operation of a cloud-based
controller of what AirWatch refers to as “The AirWatch Enterprise Mobility Management System”
(AirWatch EMM System) in order to facilitate secure communications between remote computing
devices such as cell phones, remote computing devices and resources residing on corporate networks such
as email and corporate intranets and application programs such as spreadsheets and word processors.
On July 24, 2017, AirWatch filed its answer, defenses and counterclaims to the Company’s complaint. In
summary, AirWatch denies that it infringes on the 216 Patent; denies that the 216 Patent is valid; and
denies the Company is entitled to the relief sought. AirWatch counterclaimed against the Company
seeking declaratory judgments of non-infringement and invalidity as well as costs, disbursements and
reasonable legal fees incurred in connection with the complaint.
On September 22, 2017, AirWatch and VMWare, Inc. (parent company of AirWatch) filed a petition for
Inter Partes Review (IPR) with the United States Patent and Trademark Office (USPTO). Route1 filed its
preliminary response to the petition on December 22, 2017. On March 20, 2018, the USPTO upheld
Route1’s position and denied the institution of the IPR.
In the interim, the litigation continues according to the court ordered schedule. Further details can be
found on: https://www.route1.com/investors/patent-litigation/.
7. SHARE REPURCHASE PROGRAM
On September 16, 2016, the Company announced with approval from the TSX Venture Exchange its
intention to make another NCIB. The NCIB permits the Company to purchase for cancellation up to 5%
of the common shares in the public float. The maximum number of shares allowed for repurchase is
17,563,870. Purchases under the NCIB may occur during the 12 month period commencing September
27, 2016 and ending September 26, 2017, or the date upon which the maximum number of common
shares have been purchased by the Company. Purchases for cancellation under the NCIB during the
period from September 27, 2016 to December 31, 2016 were 2,884,000 common shares.
On September 15, 2017, the Company announced with approval from the TSX Venture Exchange its
intention to make another NCIB. The NCIB permits the Company to purchase for cancellation up to 5%
of the common shares in the public float. The maximum number of shares allowed for repurchase is

NOTES TO THE CONSOLIDATED FINANCIAL STATEMENTS Route1 Inc.
December 31, 2017 and 2016 (stated in Canadian dollars)
2017 | Route1 Annual Consolidated Financial Statements 19
17,359,671. Purchases under the NCIB may occur during the 12 month period commencing September
27, 2017 and ending September 26, 2018, or the date upon which the maximum number of common
shares have been purchased by the Company. There have been no common shares purchased for
cancellation under the NCIB during the period from September 27, 2017 to December 31, 2017.
For the year ended December 31, 2017, the Company repurchased for cancellation 1,000,000 of its
common shares for consideration of $15,000, at an approximate average price of $0.015 per share under
the NCIB. The Company also incurred an expense of $3,659 for regulatory cost to set up the new NCIB
and to complete the share repurchases during the year. For the year ended December 31, 2016, the
Company repurchased for cancellation 14,466,000 of its common shares for consideration of $688,785, at
an approximate average price of $0.048 per share under the NCIB. The Company also incurred an
expense of $6,010 for regulatory cost to set up the new NCIB and to complete the share repurchases
during the year.
8. SHARE CAPITAL, WARRANTS AND CONTRIBUTED SURPLUS The Company’s authorized share capital consists of the following:
Unlimited number of common shares with voting rights and no par value.
Unlimited number of non-cumulative, non-voting first preferred shares with no fixed dividend rate,
issuable in series.
Unlimited number of non-cumulative, non-voting second preferred shares with no fixed dividend rate,
issuable in series.
Unlimited number of non-cumulative, non-voting Series A first preferred shares with no fixed
dividend rate, issuable in series and convertible into common shares at the option of the holder on a
one-for-one basis at any time after October 31, 2000.
As at December 31, 2017, the following was outstanding:
Number of Common
Shares
Common Shares
$
Balance, January 1, 2017 348,193,414 $22,169,410
Shares issued/repurchased for cancellation (1,000,000) (18,659)
Balance, December 31, 2017 347,193,414 $22,150,751
At December 31, 2017, 27,689,000 common share purchase options (“Options”) exercisable into
27,689,000 common shares were outstanding.
Stock-based compensation
The Company has a Stock Option Plan (the “Plan”) that was created in 1997 to attract, retain and
motivate officers, salaried employees and directors who are in a position to make important contributions
toward the success of the Company. Under the Plan, options may be granted to directors, officers,
employees, and consultants of the Company at an exercise price determined by the Board provided that
such exercise price should not be less than that permitted under the rules of any stock exchange where the
shares are listed. The period during which an option may be exercised (the “Option Period”) is
determined by the Board at the time the option is granted, subject to any vesting limitations which may be
imposed by the Board in its sole unfettered discretion at the time such option is granted. Options are

NOTES TO THE CONSOLIDATED FINANCIAL STATEMENTS Route1 Inc.
December 31, 2017 and 2016 (stated in Canadian dollars)
2017 | Route1 Annual Consolidated Financial Statements 20
exercisable as determined by the Board at the date of the grant. Shares covered by options granted
pursuant to the Plan may not exceed 10% of the issued and outstanding shares of the Company at the time
of the grant, calculated on a non-diluted basis.
The following tables reflect the movement and status of the stock options:
December 31, 2017 December 31, 2016
Options Outstanding
Number of
Options
Weighted
Average
Exercise
Price
Number of
Options
Weighted
Average
Exercise
Price
Balance, beginning of the period 32,689,000 $0.07 33,114,000 $0.09
Options granted during the period 1,000,000 0.05 4,875,000 0.05
Options expired during the period (6,000,000) 0.13 (3,150,000) 0.23
Options exercised during the period - - - -
Options forfeited during the period - - (2,150,000) 0.09
Balance, end of the period 27,689,000 $0.05 32,689,000 $0.07
Options Outstanding
December 31, 2017
Options Exercisable
December 31, 2017
Exercise Price
Number of
Options
Weighted
Average
Life
(Years)
Number of
Options
Weighted
Average
Life
(Years)
$0.05 12,439,000 2.7 6,686,500 2.2
$0.055 15,250,000 2.3 9,150,000 2.3
27,689,000 2.5 15,836,500 2.2
Options Outstanding
December 31, 2016
Options Exercisable
December 31, 2016
Exercise Price
Number of
Options
Weighted
Average
Life
(Years)
Number of
Options
Weighted
Average
Life
(Years)
$0.05 11,439,000 3.6 2,933,400 2.8
$0.055 15,250,000 3.3 4,575,000 3.3
$0.13 6,000,000 0.4 6,000,000 0.4
32,689,000 2.9 13,508,400 1.9
During the year ended December 31, 2017, the Company recorded stock-based compensation expense of
$264,888 (December 31, 2016 - $368,197). During the year ended December 31, 2017, the Company issued 1,000,000 (2016 – 4,875,000) stock
options. The table below shows the assumptions used in determining stock-based compensation expense,
as derived under the Black-Scholes option pricing model for stock options issued during the current year:

NOTES TO THE CONSOLIDATED FINANCIAL STATEMENTS Route1 Inc.
December 31, 2017 and 2016 (stated in Canadian dollars)
2017 | Route1 Annual Consolidated Financial Statements 21
2017 2016
Share price on issue date $0.05 $0.05
Risk free interest rate 0.93% 0.61%
Expected life (years) 5 5
Expected volatility 148% 145%-147%
Dividend yield Nil Nil
Estimated forfeitures Nil Nil
Weighted average fair value of options granted $0.045 $0.04
The Black-Scholes option pricing model used by the Company to determine fair values was developed for
use in estimating the fair value of freely traded options, which are fully transferable and have no vesting
restrictions. The Company’s stock options are not transferable and cannot be traded and are subject to
vesting restrictions and exercise restrictions under the Company’s black-out policy which would tend to
reduce the fair value of the Company’s stock options. Changes to subjective input assumptions used in
the model can cause a significant variation in the estimate of the fair value of the options.
All outstanding vested share options were measured in accordance with IFRS 2, “Share-based Payment”
at their market-based measure at the acquisition date. Options were priced using the Black-Scholes option
pricing model. Where relevant, the expected life used in the model has been adjusted based on
management's best estimate for the effects of non-transferability, exercise restrictions, and behavioral
considerations. Expected volatility is based on the historical share price volatility.
Contributed surplus
Contributed surplus represents expired warrants and the fair value of stock options granted under the
stock option plan, determined using the Black-Scholes option pricing model. The fair value is amortized
to income on a graded, vested basis over the vesting period with a corresponding increase to contributed
surplus. Any consideration paid by the employees or non-employees on the exercise of stock options is
reflected as an increase to share capital, with a transfer from contributed surplus.
Year ended
December 31, 2017
Year ended
December 31, 2016
Balance, beginning of year $14,143,368 $13,775,171
Stock-based compensation in the period 264,888 368,197
Balance, end of year $14,408,256 $14,143,368
9. RELATED PARTY TRANSACTIONS
The Company has directors and officers who are considered related parties. The Company had the
following transactions and/or outstanding amounts with related parties for the years ended December 31,
2017 and 2016 comparatives. All transactions are recorded at their exchange amounts.
The Company made payments (including HST) to 1220764 Ontario Inc. for management
services provided by Mr. Tony P. Busseri, a director and the CEO of the Company in the
amount of $378,550 for the year ended December 31, 2017 (December 31, 2016 - $425,633).

NOTES TO THE CONSOLIDATED FINANCIAL STATEMENTS Route1 Inc.
December 31, 2017 and 2016 (stated in Canadian dollars)
2017 | Route1 Annual Consolidated Financial Statements 22
For the year ended December 31, 2017 the Company also incurred stock-based compensation
expense in the amount of $51,848 (December 31, 2016 - $109,690).
The Company incurred expenses (including CPP and EHT) payable to and on behalf of the
independent members of the Board of Directors of $314,611 for the year ended December 31,
2017 (December 31, 2016 - $308,109). These transactions are in the normal course of
operations and are paid or payable for directorship services. As at December 31, 2017, accounts
payable included $78,799 owing to directors (December 31, 2016 - $70,049). For the year
ended December 31, 2017, the Company also incurred stock-based compensation expense
related to stock options granted to directors in the amount of $73,250 (December 31, 2016 -
$122,219).
The Company made payments to or incurred expenses for key management (President, Chief
Technology Officer and the Chief Financial Officer) in the year ended December 31, 2017 as
follows, with 2016 comparatives:
Year Ended
December 31, 2017
Year Ended
December 31, 2016
Short-term employee benefit $836,112 $800,424
Stock-based compensation expense 137,815 138,331
$973,927 $938,755
10. EARNINGS (LOSS) PER SHARE
The Company uses the treasury stock method to calculate basic and diluted earnings per share. Basic
earnings per share have been calculated based on the weighted average number of common shares
without the inclusion of dilutive effects. Diluted earnings per share are calculated based on the weighted
average number of common shares plus dilutive common share equivalents outstanding which consist of
options and warrants to purchase common shares.
Year Ended
December 31, 2017
Year Ended
December 31, 2016
Net (loss) income $(609,997) $329,742
Weighted average number of common shares outstanding 347,511,222 355,100,654
Basic and diluted (loss) earnings per share $(0.00) $0.00
The diluted earnings per share are equal to the basic earnings per share as the stock options are not in the
money and the effect of their exercise would be anti-dilutive.
11. COMMITMENTS AND CONTINGENCIES
(i) Operating leases
The Company is committed under operating lease agreements for the rental of real property. Minimum
annual future lease payments are approximately as follows:
Not later than one year $178,919
Later than one year and not later than five years 593,278
$772,197

NOTES TO THE CONSOLIDATED FINANCIAL STATEMENTS Route1 Inc.
December 31, 2017 and 2016 (stated in Canadian dollars)
2017 | Route1 Annual Consolidated Financial Statements 23
Minimum future lease payments are subject to additional rent. Additional rent payment amounts are not
known as this time.
For the year ended December 31, 2017, rent expense of $347,495 (December 31, 2016 - $308,932) was
recognized in general administration expense.
(ii) Legal matters
In the normal course of operations, the Company may be subject to litigation and claims from customers,
suppliers and former employees. Although it is not possible to estimate the extent of potential costs, if
any, management believes that the ultimate resolution of such contingencies would not have a material
adverse effect on the results of operations, financial position or liquidity of the Company. The Company
is unaware of any outstanding litigation of claims to which it may be subject.
Reference is made to Note 6 for information on the Company’s patent litigation.
(iii) Foreign exchange
From time to time the Company may enter into U.S. dollar forward contracts to mitigate possible foreign exchange risk. The timing and amount of foreign exchange contracts are estimated based on existing or anticipated sales, current conditions in the Company’s markets, the estimated timing of payments denominated in Canadian dollars and the Company’s past experience. The Company’s policy is not to utilize financial instruments for trading or speculative purposes.
12. INDEMNIFICATIONS
Under certain agreements and the bylaws of the Company, the Company is obligated to indemnify
persons who serve as directors or officers (or both) of the Company, against certain costs, charges and
expenses suffered or incurred by such person as a result of their service. Claims for indemnity pursuant to
such agreements or the bylaws of the Company are subject to certain statutory and other legal limitations.
Having regard to the nature of the indemnification obligations and the broad range of circumstances under
which the Company may become obligated to make indemnification payments, the Company is unable to
make a reasonable estimate of the maximum potential amount that it could be required to pay to persons
entitled to indemnification from the Company. The Company has purchased insurance coverage to reduce
the risks associated with its indemnification obligation.
13. FINANCIAL INSTRUMENTS
Establishing fair value
The carrying amount of financial instruments including cash and cash equivalents, accounts receivable
and accounts payable and other liabilities approximates fair value because of the short-term nature of
these instruments.
The following table sets out the carrying amount and fair value of the Company’s financial assets and
liabilities as at December 31, 2017 and December 31, 2016:

NOTES TO THE CONSOLIDATED FINANCIAL STATEMENTS Route1 Inc.
December 31, 2017 and 2016 (stated in Canadian dollars)
2017 | Route1 Annual Consolidated Financial Statements 24
December 31, 2017 December 31, 2016
Carrying
Amount Fair Value
Carrying
Amount Fair Value
FINANCIAL ASSETS
Cash and cash equivalents $1,037,424 $1,037,424 $1,945,549 $1,945,549
Accounts receivable $333,023 $333,023 $181,848 $181,848
FINANCIAL LIABILITIES
Accounts payable and other liabilities $333,451 $333,451 $345,048 $345,048
14. CAPITAL MANAGEMENT
The Company's objectives when managing capital is to maintain a flexible capital structure which
optimizes the cost of capital at acceptable risk.
The Company manages its capital structure and makes adjustments due to changes in economic
conditions and the risk characteristics of the underlying assets. In order to maintain or adjust the capital
structure, the Company may issue new shares, issue new debt, and/or issue new debt to replace existing
debt with different characteristics.
Capital management objectives, policies and procedures have not changed over the preceding year.
On August 14, 2017, the Company’s credit facility consisting of a $500,000 revolving demand operating
facility and a $75,000 credit card facility was renewed. The operating facility carries an interest rate equal
to the lender’s prime rate of interest plus 1%. The credit facility is secured by the assets of the Company.
The Company had not drawn on the facility as of December 31, 2017 or December 31, 2016.
15. FINANCIAL INSTRUMENTS - RISK MANAGEMENT
The Company has exposure to credit risk, liquidity risk and market risk associated with its financial assets
and liabilities. The Board has overall responsibility for the establishment and oversight of the Company’s
risk management framework. The Board has established the Audit Committee which is responsible for
monitoring the Company’s compliance with risk management policies. The Audit Committee regularly
reports to the Board on its activities.
The Company’s risk management program seeks to minimize potential adverse effects on the Company’s
financial performance and ultimately shareholder value. The Company manages its risks and risk
exposures through a system of internal controls and sound business practices.
The Company’s financial instruments and the nature of the risks to which they may be subject are set out
in the following table:
NOTES TO THE CONSOLIDATED FINANCIAL STATEMENTS Route1 Inc.
December 31, 2017 and 2016 (stated in Canadian dollars)
2017 | Route1 Annual Consolidated Financial Statements 25
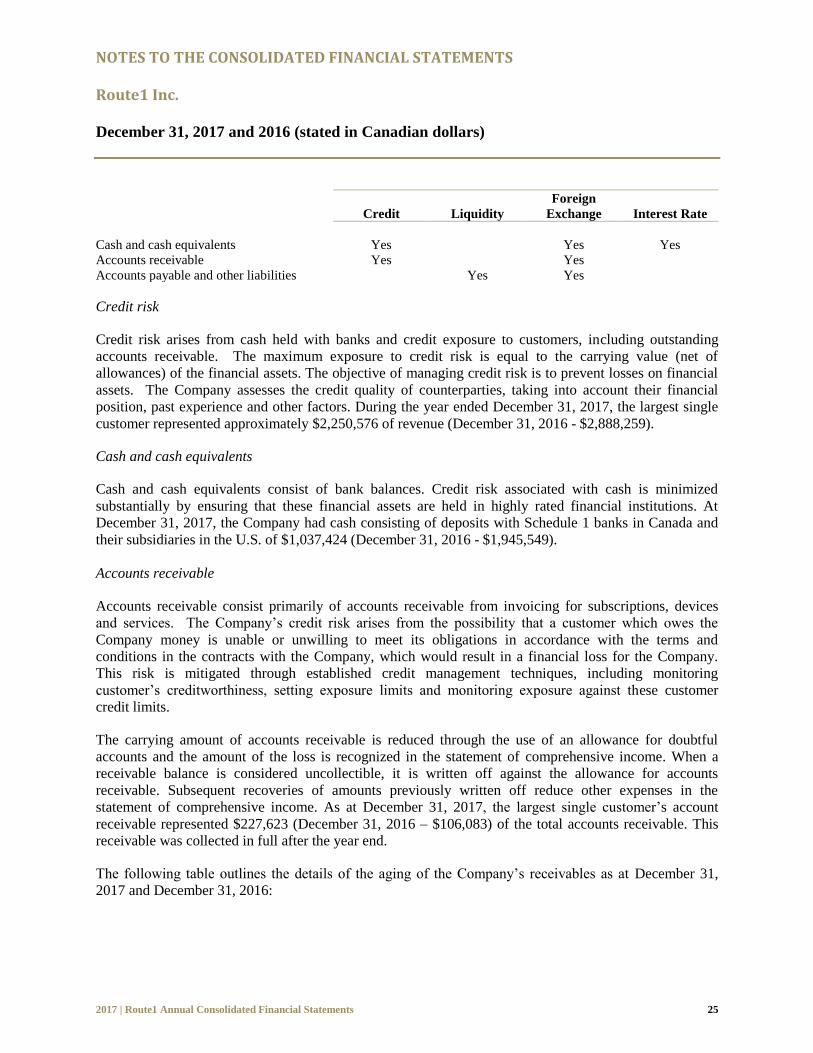
Credit Liquidity
Foreign
Exchange Interest Rate
Cash and cash equivalents Yes Yes Yes
Accounts receivable Yes Yes
Accounts payable and other liabilities Yes Yes
Credit risk
Credit risk arises from cash held with banks and credit exposure to customers, including outstanding
accounts receivable. The maximum exposure to credit risk is equal to the carrying value (net of
allowances) of the financial assets. The objective of managing credit risk is to prevent losses on financial
assets. The Company assesses the credit quality of counterparties, taking into account their financial
position, past experience and other factors. During the year ended December 31, 2017, the largest single
customer represented approximately $2,250,576 of revenue (December 31, 2016 - $2,888,259).
Cash and cash equivalents
Cash and cash equivalents consist of bank balances. Credit risk associated with cash is minimized
substantially by ensuring that these financial assets are held in highly rated financial institutions. At
December 31, 2017, the Company had cash consisting of deposits with Schedule 1 banks in Canada and
their subsidiaries in the U.S. of $1,037,424 (December 31, 2016 - $1,945,549).
Accounts receivable
Accounts receivable consist primarily of accounts receivable from invoicing for subscriptions, devices
and services. The Company’s credit risk arises from the possibility that a customer which owes the
Company money is unable or unwilling to meet its obligations in accordance with the terms and
conditions in the contracts with the Company, which would result in a financial loss for the Company.
This risk is mitigated through established credit management techniques, including monitoring
customer’s creditworthiness, setting exposure limits and monitoring exposure against these customer
credit limits.
The carrying amount of accounts receivable is reduced through the use of an allowance for doubtful
accounts and the amount of the loss is recognized in the statement of comprehensive income. When a
receivable balance is considered uncollectible, it is written off against the allowance for accounts
receivable. Subsequent recoveries of amounts previously written off reduce other expenses in the
statement of comprehensive income. As at December 31, 2017, the largest single customer’s account
receivable represented $227,623 (December 31, 2016 – $106,083) of the total accounts receivable. This
receivable was collected in full after the year end.
The following table outlines the details of the aging of the Company’s receivables as at December 31,
2017 and December 31, 2016:

NOTES TO THE CONSOLIDATED FINANCIAL STATEMENTS Route1 Inc.
December 31, 2017 and 2016 (stated in Canadian dollars)
2017 | Route1 Annual Consolidated Financial Statements 26
December 31, 2017 December 31, 2016
Current $333,023 $181,848
Past due
1 – 60 days - -
Greater than 60 days - -
Less: Allowance for doubtful accounts - -
Total accounts receivable, net $333,023 $181,848
For the year ended December 31, 2017 and year ended December 31, 2016, there was a $nil balance for
the allowance for doubtful accounts.
Liquidity risk
Liquidity risk is the risk that the Company will not be able to meet its financial obligations as they fall due. The Company’s objective in managing liquidity risk is to maintain sufficient readily available reserves in order to meet its liquidity requirements at any point in time. In order to meet its financial liabilities, the Company has relied on collecting its accounts receivable, which by nature, are due predominately from government agencies with a high level of certainty of collection.
The Company’s ability to manage its liquidity risk going forward will require some or all of the following: the ability to generate positive cash flows from operations and secure capital and/or credit facilities on reasonable terms in the current market place. The following table details the Company’s contractual maturities for its financial liabilities, including interest payments and operating lease commitments, as at December 31, 2017:
2018 2019
2020 and
Beyond Total
Accounts payable and other liabilities $333,451 $- $- $333,451
Operating lease commitments 178,919 181,034 412,244 772,197
$512,370 $181,034 $412,244 $1,105,648
Market risk
Market risk is the risk that changes in market prices, such as foreign exchange rates and interest rates will affect the fair value of recognized assets and liabilities or future cash flows or the Company’s results of operation.
Foreign exchange
The functional currency of the parent company is Canadian dollars and the reporting currency is Canadian dollars. As at December 31, 2017, the Company had non-Canadian dollar net monetary assets of approximately US$961,824 (December 31, 2016 - approximately US$1,048,037). An increase or decrease in the U.S. to Canadian dollar exchange rate by 5% as at December 31, 2017 would have resulted in a gain in the amount of CAD$60,330 or a loss of CAD$60,330 (December 31, 2016 – gain or loss of CAD$70,360). Any gain or loss would have been included in the determination of net income.

NOTES TO THE CONSOLIDATED FINANCIAL STATEMENTS Route1 Inc.
December 31, 2017 and 2016 (stated in Canadian dollars)
2017 | Route1 Annual Consolidated Financial Statements 27
Interest rate
The Company has cash balances which may be exposed to interest rate fluctuations. At December 31,
2017, cash balances were $1,037,424 (December 31, 2016 - $1,945,549) and the interest rate sensitivity
was not material.
16. REVENUE INFORMATION
Revenue for the subscription revenue and services component is reported as deferred revenue on the statement of financial position and is recognized as earned revenue for the period in which the subscription and/or service is provided. For the sale of devices, revenue is recognized at the time of shipment of the device which constitutes transfer of ownership of the device. At December 31, 2017, the Company had $1,526,135 (December 31, 2016 - $2,182,668) in deferred revenue.
The following table provides a component presentation of the Company’s revenue streams for year ended December 31, 2017 and 2016:
2017 2016
Revenue % of Total Revenue % of Total
Subscription revenue and services $5,698,449 93.9 $7,080,462 95.0
Devices and appliances 321,074 5.3 363,031 4.9
Other 50,803 0.8 3,995 0.1
$6,070,326 100.0 $7,447,488 100.0
The following table provides a geographical presentation of the Company’s revenue streams for the year
ended December 31, 2017 and 2016:
2017 2016
Revenue % of Total
Revenue
% of Total
USA $5,842,570 96.2 $7,263,308 97.5
Canada 227,756 3.8 184,180 2.5
$6,070,326 100.0 $7,447,488 100.0
17. INCOME TAXES
The Company has recognized the benefit of previously unrecognized tax losses in the amount of $742,067
relating to unused tax losses that are considered to be offset against the Company’s taxable profits
expected to arise in the current and coming year. Management has based their assessment on the budget
previously approved, the Company’s ability to meet this budget and its forecast moving forward.

NOTES TO THE CONSOLIDATED FINANCIAL STATEMENTS Route1 Inc.
December 31, 2017 and 2016 (stated in Canadian dollars)
2017 | Route1 Annual Consolidated Financial Statements 28
The analysis of deferred tax assets and deferred tax liabilities is as follows:
As at Dec 31, 2017 As at Dec 31, 2016
Deferred tax assets
Property, furniture and equipment and intangible assets $1,212,927 $1,102,983
Tax losses carry-forwards 4,432,655 4,789,875
Unamortized Scientific Research and Development Pools 2,574,393 2,302,577
Investment Tax Credit 2,601,276 2,389,284
Other 33,537 30,766
Deferred tax asset 10,853,488 10,615,485
Deferred tax asset not recognized (10,111,421) (9,873,418)
$742,067 $742,067
As at
December 31, 2017
As at
December 31, 2016
Benefit of previously unrecognized tax losses that have been
recognized $1,186,693 $1,424,635
Tax losses applied to reduce current tax (444,626) (682,568)
Deferred tax asset recognized, net $742,067 $742,067
Reconciliation between the Company’s statutory and effective tax rates is as follows:
As at Dec. 31, 2017 As at Dec. 31, 2016
Tax expense at statutory rate 26.5% 26.5%
Permanent difference (63.7)% 31.4%
Recognition of previously unrecognized tax losses carry
forwards 37.2%
(57.9)%
Effective tax rate - % - %
The Company has non-capital losses for tax purposes of approximately $16,727,000 that may be used to
reduce Canadian taxable income in the future. Some of the potential tax benefits pertaining to these tax
losses have been recognized in the financial statements. If not fully utilized, these losses will expire as
follows:
2026 $3,243,000
2027 7,309,000
2028 4,078,000
2029 2,097,000
$16,727,000
18. SUBSEQUENT EVENT
On March 7, 2018, the Company entered into an agreement to acquire Group Mobile Int’l, LLC (“Group
Mobile”) from XpresSpa Group, Inc. Group Mobile, with offices in Chattanooga, Tennessee and
Chandler, Arizona, supplies rugged mobile technology solutions to manufacturing companies and
suppliers as well to state and local governments in the southeastern and southwestern United States.

NOTES TO THE CONSOLIDATED FINANCIAL STATEMENTS Route1 Inc.
December 31, 2017 and 2016 (stated in Canadian dollars)
2017 | Route1 Annual Consolidated Financial Statements 29
The acquisition was completed on March 22, 2018 and the Company issued to XpresSpa 25 million
common shares and 30 million, three year common share purchase warrants with an exercise price of
CAD 5 cents per share. Post closing, XpresSpa will own approximately 6.7% (undiluted) of the
Company’s common shares.
There may also be one or more payments made to XpresSpa based on the gross profit of Group Mobile
meeting a minimum threshold in each 12-month period during the first three years post-closing or for the
three years in aggregate post-closing. Specifically, if the gross profit of Group Mobile is in excess of USD
$3,750,000 per 12-month period, then XpresSpa will receive 27.5% of the actual gross profit amount
greater than USD $3,750,000. If the gross profit target is missed in the first or second year, no subsequent
annual earn-out payment(s) will be made. There is also a cumulative earn-out that is equal to 27.5% of the
Group Mobile gross profit for the first 36 months post-closing that is in excess of $11,250,000 less any
annual earn-out amounts previously made.
The Company is assessing the purchase price allocation of the net assets acquired.