Embed Size (px)
Citation preview
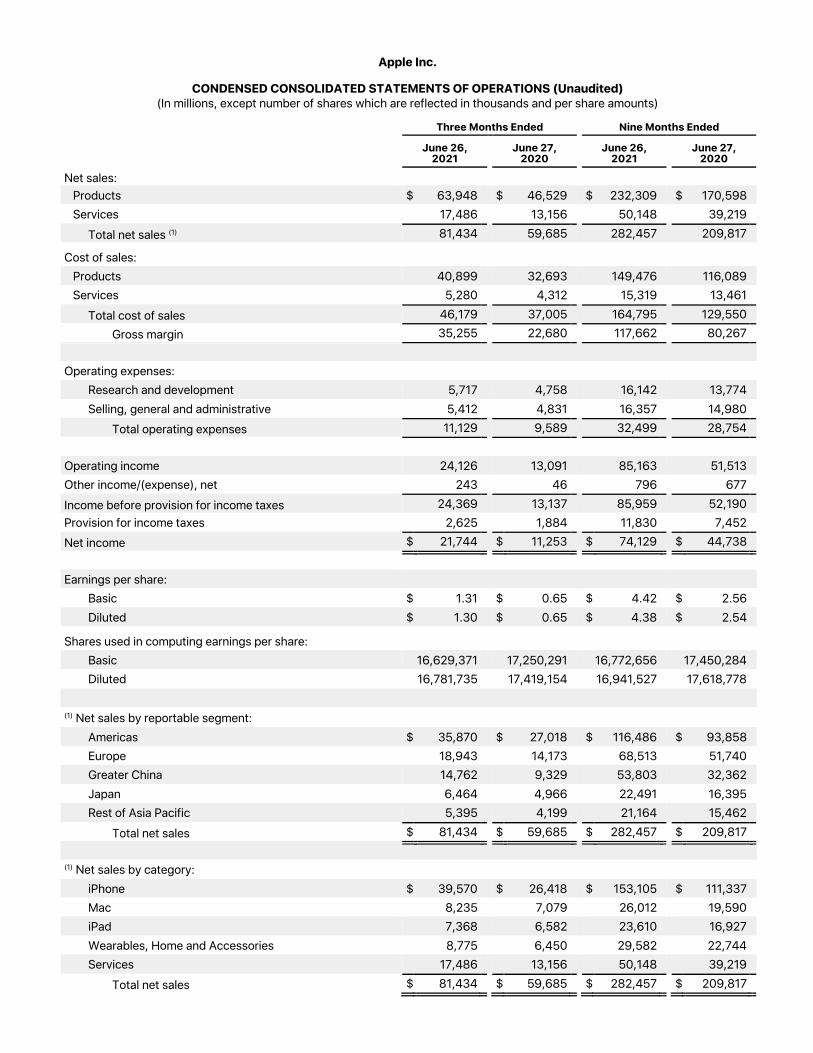
Apple Inc.
CONDENSED CONSOLIDATED STATEMENTS OF OPERATIONS (Unaudited) (In millions, except number of shares which are reflected in thousands and per share amounts)
Three Months Ended Nine Months Ended
June 26, 2021 June 27,
2020 June 26, 2021 June 27,
2020 Net sales: Products $ 63,948 $ 46,529 $ 232,309 $ 170,598 Services 17,486 13,156 50,148 39,219
Total net sales (1) 81,434 59,685 282,457 209,817 Cost of sales: Products 40,899 32,693 149,476 116,089 Services 5,280 4,312 15,319 13,461
Total cost of sales 46,179 37,005 164,795 129,550 Gross margin 35,255 22,680 117,662 80,267
Operating expenses:
Research and development 5,717 4,758 16,142 13,774 Selling, general and administrative 5,412 4,831 16,357 14,980
Total operating expenses 11,129 9,589 32,499 28,754 Operating income 24,126 13,091 85,163 51,513 Other income/(expense), net 243 46 796 677 Income before provision for income taxes 24,369 13,137 85,959 52,190 Provision for income taxes 2,625 1,884 11,830 7,452 Net income $ 21,744 $ 11,253 $ 74,129 $ 44,738 Earnings per share:
Basic $ 1.31 $ 0.65 $ 4.42 $ 2.56 Diluted $ 1.30 $ 0.65 $ 4.38 $ 2.54
Shares used in computing earnings per share: Basic 16,629,371 17,250,291 16,772,656 17,450,284 Diluted 16,781,735 17,419,154 16,941,527 17,618,778
(1) Net sales by reportable segment:
Americas $ 35,870 $ 27,018 $ 116,486 $ 93,858 Europe 18,943 14,173 68,513 51,740 Greater China 14,762 9,329 53,803 32,362 Japan 6,464 4,966 22,491 16,395 Rest of Asia Pacific 5,395 4,199 21,164 15,462
Total net sales $ 81,434 $ 59,685 $ 282,457 $ 209,817 (1) Net sales by category:
iPhone $ 39,570 $ 26,418 $ 153,105 $ 111,337 Mac 8,235 7,079 26,012 19,590 iPad 7,368 6,582 23,610 16,927 Wearables, Home and Accessories 8,775 6,450 29,582 22,744 Services 17,486 13,156 50,148 39,219
Total net sales $ 81,434 $ 59,685 $ 282,457 $ 209,817
Apple Inc.
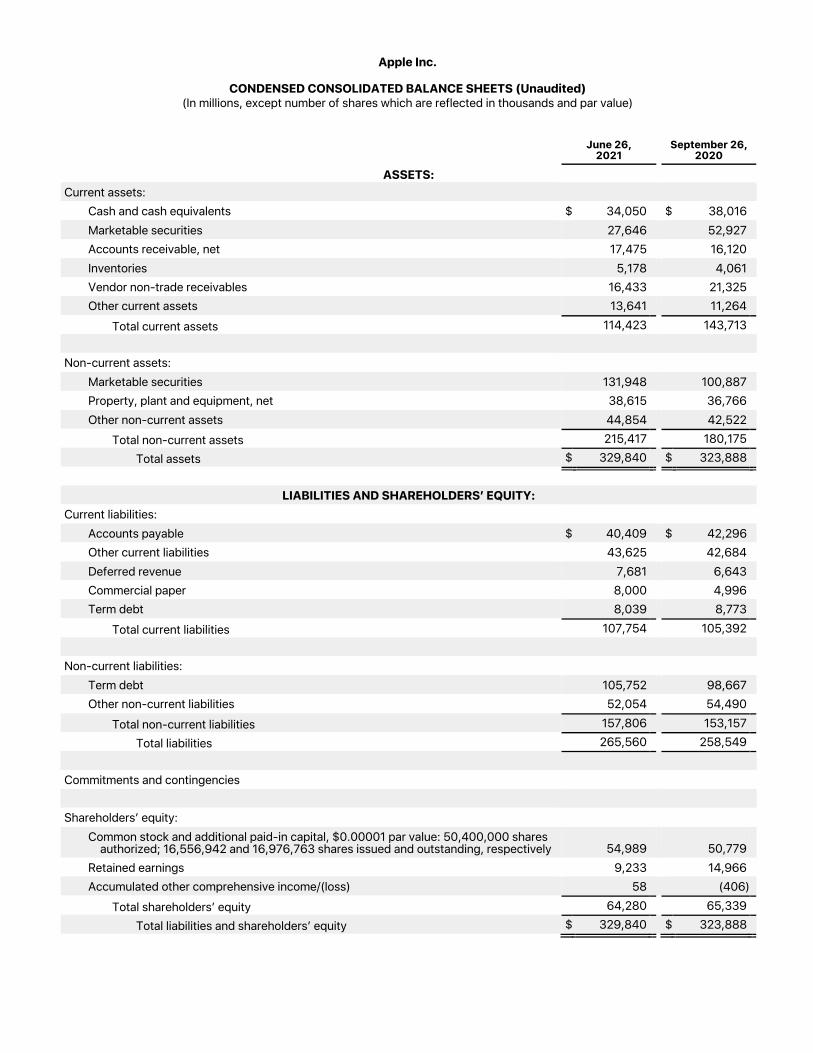
CONDENSED CONSOLIDATED BALANCE SHEETS (Unaudited) (In millions, except number of shares which are reflected in thousands and par value)
June 26,
2021 September 26,
2020 ASSETS:
Current assets: Cash and cash equivalents $ 34,050 $ 38,016 Marketable securities 27,646 52,927 Accounts receivable, net 17,475 16,120 Inventories 5,178 4,061 Vendor non-trade receivables 16,433 21,325 Other current assets 13,641 11,264
Total current assets 114,423 143,713 Non-current assets:
Marketable securities 131,948 100,887 Property, plant and equipment, net 38,615 36,766 Other non-current assets 44,854 42,522
Total non-current assets 215,417 180,175 Total assets $ 329,840 $ 323,888
LIABILITIES AND SHAREHOLDERS’ EQUITY:
Current liabilities: Accounts payable $ 40,409 $ 42,296 Other current liabilities 43,625 42,684 Deferred revenue 7,681 6,643 Commercial paper 8,000 4,996 Term debt 8,039 8,773
Total current liabilities 107,754 105,392 Non-current liabilities:
Term debt 105,752 98,667 Other non-current liabilities 52,054 54,490
Total non-current liabilities 157,806 153,157 Total liabilities 265,560 258,549
Commitments and contingencies Shareholders’ equity:
Common stock and additional paid-in capital, $0.00001 par value: 50,400,000 shares authorized; 16,556,942 and 16,976,763 shares issued and outstanding, respectively 54,989 50,779
Retained earnings 9,233 14,966 Accumulated other comprehensive income/(loss) 58 (406)
Total shareholders’ equity 64,280 65,339 Total liabilities and shareholders’ equity $ 329,840 $ 323,888
Apple Inc.
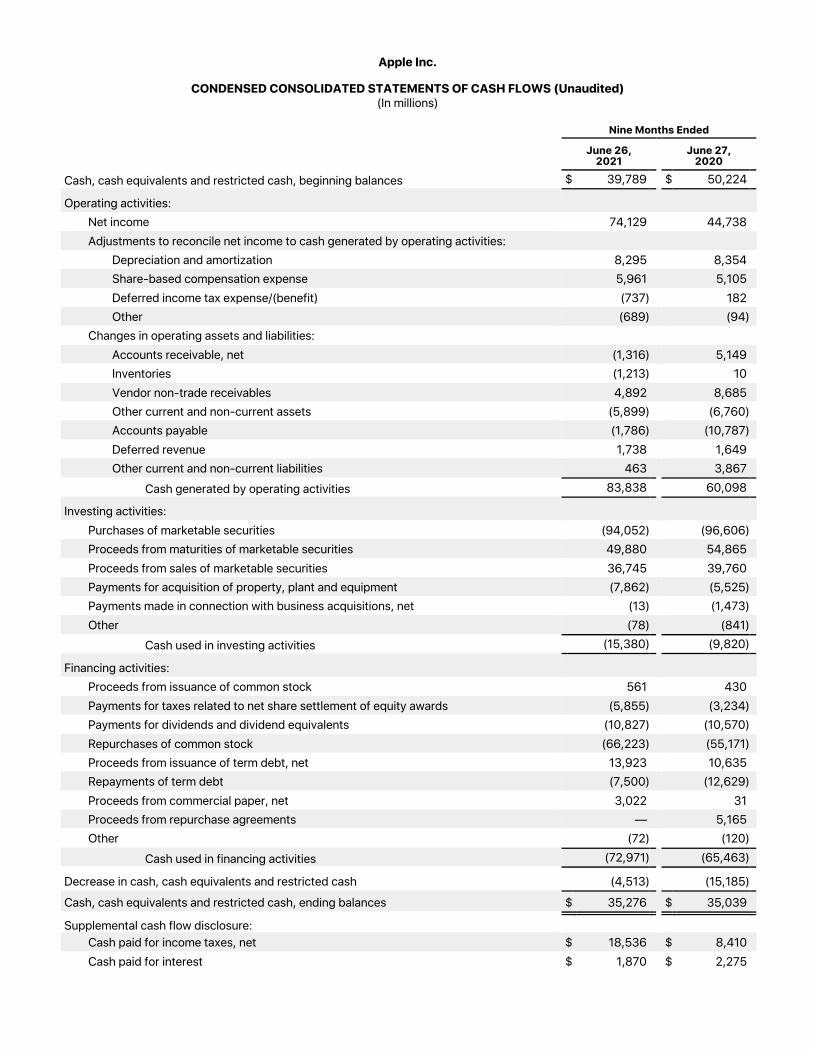
CONDENSED CONSOLIDATED STATEMENTS OF CASH FLOWS (Unaudited) (In millions)
Nine Months Ended
June 26,
2021 June 27,
2020 Cash, cash equivalents and restricted cash, beginning balances $ 39,789 $ 50,224 Operating activities:
Net income 74,129 44,738 Adjustments to reconcile net income to cash generated by operating activities:
Depreciation and amortization 8,295 8,354 Share-based compensation expense 5,961 5,105 Deferred income tax expense/(benefit) (737) 182 Other (689) (94)
Changes in operating assets and liabilities: Accounts receivable, net (1,316) 5,149 Inventories (1,213) 10 Vendor non-trade receivables 4,892 8,685 Other current and non-current assets (5,899) (6,760) Accounts payable (1,786) (10,787) Deferred revenue 1,738 1,649 Other current and non-current liabilities 463 3,867
Cash generated by operating activities 83,838 60,098 Investing activities:
Purchases of marketable securities (94,052) (96,606) Proceeds from maturities of marketable securities 49,880 54,865 Proceeds from sales of marketable securities 36,745 39,760 Payments for acquisition of property, plant and equipment (7,862) (5,525) Payments made in connection with business acquisitions, net (13) (1,473) Other (78) (841)
Cash used in investing activities (15,380) (9,820) Financing activities:
Proceeds from issuance of common stock 561 430 Payments for taxes related to net share settlement of equity awards (5,855) (3,234) Payments for dividends and dividend equivalents (10,827) (10,570) Repurchases of common stock (66,223) (55,171) Proceeds from issuance of term debt, net 13,923 10,635 Repayments of term debt (7,500) (12,629) Proceeds from commercial paper, net 3,022 31 Proceeds from repurchase agreements — 5,165 Other (72) (120)
Cash used in financing activities (72,971) (65,463) Decrease in cash, cash equivalents and restricted cash (4,513) (15,185) Cash, cash equivalents and restricted cash, ending balances $ 35,276 $ 35,039 Supplemental cash flow disclosure:
Cash paid for income taxes, net $ 18,536 $ 8,410 Cash paid for interest $ 1,870 $ 2,275