Embed Size (px)
Citation preview
Financialstatements
90 Statement of directors’ responsibilities
91 Consolidated financial statements of the BP groupIndependent auditor’s reports 91
Group income statement 96
Group statement ofcomprehensive income 97
Group statement of changes inequity 97
Group balance sheet 98
Group cash flow statement 99
100 Notes on financial statements1. Significant accounting
policies 100
2. Significant event – Gulf ofMexico oil spill 111
3. Disposals and impairment 117
4. Segmental analysis 119
5. Income statement analysis 123
6. Exploration expenditure 124
7. Taxation 124
8. Dividends 126
9. Earnings per ordinaryshare 126
10. Property, plant andequipment 128
11. Capital commitments 128
12. Goodwill 129
13. Intangible assets 130
14. Investments in jointventures 131
15. Investments in associates 131
16. Other investments 134
17. Inventories 134
18. Trade and otherreceivables 134
19. Valuation and qualifyingaccounts 135
20. Trade and other payables 135
21. Provisions 135
22. Pensions and other post-retirement benefits 135
23. Cash and cash equivalents 142
24. Finance debt 142
25. Capital disclosures andanalysis of changes in netdebt 143
26. Operating leases 143
27. Financial instruments andfinancial risk factors 144
28. Derivative financialinstruments 147
29. Called-up share capital 152
30. Capital and reserves 154
31. Contingent liabilities 157
32. Remuneration of seniormanagement and non-executive directors 158
33. Employee costs andnumbers 159
34. Auditor’s remuneration 159
35. Subsidiaries, jointarrangements andassociates 160
36. Condensed consolidatinginformation on certain USsubsidiaries 161
167 Supplementary information on oil and natural gas(unaudited)Oil and natural gas explorationand production activities 168
Movements in estimated netproved reserves 174
Standardized measure ofdiscounted future net cashflows and changes thereinrelating to proved oil and gasreserves 192
Operational and statisticalinformation 195
197 Parent company financial statements of BP p.l.c.Company balance sheet 197
Company cash flow statement 198
Company statement of totalrecognized gains and losses 198
Notes on financial statements 199
1. Accounting policies 199
2. Taxation 200
3. Fixed assets – investments 200
4. Debtors 201
5. Creditors 201
6. Pensions 201
7. Called-up share capital 204
8. Capital and reserves 204
9. Cash flow 205
10. Contingent liabilities 205
11. Share-based payments 205
12. Auditor’s remuneration 205
13. Directors’ remuneration 205
Financial statements
BP Annual Report and Form 20-F 2014 89

Statement of directors’ responsibilities
The directors are responsible for preparing the Annual Report and the financial statements in accordance with applicable law and regulations.
The directors are required by the UK Companies Act 2006 to prepare financial statements for each financial year that give a true and fair view of thefinancial position of the group and the parent company and the financial performance and cash flows of the group and parent company for that period.Under that law they are required to prepare the consolidated financial statements in accordance with International Financial Reporting Standards (IFRS)as adopted by the European Union (EU) and applicable law and have elected to prepare the parent company financial statements in accordance withapplicable United Kingdom law and United Kingdom accounting standards (United Kingdom generally accepted accounting practice). In preparing theconsolidated financial statements the directors have also elected to comply with IFRSs as issued by the International Accounting Standards Board(IASB). In preparing those financial statements, the directors are required to:
• select suitable accounting policies and then apply them consistently.• make judgements and estimates that are reasonable and prudent.• present information, including accounting policies, in a manner that provides relevant, reliable, comparable and understandable information.• provide additional disclosure when compliance with the specific requirements of IFRS is insufficient to enable users to understand the impact of
particular transactions, other events and conditions on the group’s financial position and financial performance.• state that applicable accounting standards have been followed, subject to any material departures disclosed and explained in the parent company
financial statements.• prepare the financial statements on the going concern basis unless it is inappropriate to presume that the company will continue in business.
The directors are responsible for keeping proper accounting records that disclose with reasonable accuracy at any time the financial position of thegroup and company and enable them to ensure that the consolidated financial statements comply with the Companies Act 2006 and Article 4 of theIAS Regulation and the parent company financial statements comply with the Companies Act 2006. They are also responsible for safeguarding theassets of the group and company and hence for taking reasonable steps for the prevention and detection of fraud and other irregularities.
The directors draw attention to Note 2 on the consolidated financial statements which describes the uncertainties surrounding the amounts andtimings of liabilities arising from the Gulf of Mexico oil spill.
The group’s business activities, performance, position and risks are set out in this report. The financial position of the group, its cash flows, liquidityposition and borrowing facilities are detailed in the appropriate sections on pages 211 to 212 and elsewhere in the notes on the consolidated financialstatements. The report also includes details of the group’s risk mitigation and management. Information on the Gulf of Mexico oil spill and BP’sresponse is included on pages 36 to 38 and elsewhere in this report, including Safety on pages 39 to 41. The group has considerable financialresources, and the directors believe that the group is well placed to manage its business risks successfully. After making enquiries, the directors havea reasonable expectation that the company and the group have adequate resources to continue in operational existence for the foreseeable future.Accordingly, they continue to adopt the going concern basis in preparing the annual report and accounts.
Having made the requisite enquiries, so far as the directors are aware, there is no relevant audit information (as defined by Section 418(3) of theCompanies Act 2006) of which the company’s auditors are unaware, and the directors have taken all the steps they ought to have taken to makethemselves aware of any relevant audit information and to establish that the company’s auditors are aware of that information.
The directors confirm that to the best of their knowledge:
• the consolidated financial statements, prepared in accordance with IFRS as issued by the IASB, IFRS as adopted by the EU and in accordance withthe provisions of the Companies Act 2006, give a true and fair view of the assets, liabilities, financial position and profit or loss of the group;
• the parent company financial statements, prepared in accordance with United Kingdom generally accepted accounting practice, give a true and fairview of the assets, liabilities, financial position, performance and cash flows of the company; and
• the management report, which is incorporated in the strategic report and directors’ report, includes a fair review of the development andperformance of the business and the position of the group, together with a description of the principal risks and uncertainties that they face.
Fair, balanced and understandable
The board considers the Annual Report and financial statements, taken as a whole, is fair, balanced and understandable and provides the informationnecessary for shareholders to assess the company’s performance, business model and strategy.
C-H SvanbergChairman3 March 2015
This page does not form part of BP’s Annual Report on Form 20-F as filed with the SEC.
90 BP Annual Report and Form 20-F 2014
Consolidated financial statements of the BP groupIndependent auditor’s report on the Annual Report and Accounts to the members of BP p.l.c.Opinion on financial statements
In our opinion:• the financial statements give a true and fair view of the state of the group’s and of the parent company’s affairs as at 31 December 2014 and of the
group’s profit for the year then ended;• the group financial statements have been properly prepared in accordance with IFRS as adopted by the European Union;• the parent company financial statements have been properly prepared in accordance with United Kingdom Generally Accepted Accounting Practice;
and• the financial statements have been prepared in accordance with the requirements of the Companies Act 2006 and, as regards the group financial
statements, Article 4 of the IAS Regulation.Emphasis of matter – significant uncertainty over provisions and contingencies related to the Gulf of Mexico oil spill
In forming our opinion on the group financial statements we have considered the adequacy of the disclosure in Note 2 to the financial statementsconcerning the provisions, future expenditures which cannot be reliably estimated and other contingent liabilities related to the claims, penalties andlitigation arising from the Gulf of Mexico oil spill. The total amount that will ultimately be paid by BP in relation to all obligations arising from thissignificant event is subject to significant uncertainty and the ultimate exposure and cost to BP is dependent on many factors, including but not limitedto, the determinations of the Courts and Regulatory authorities in the US. Significant uncertainty exists in relation to the amount of claims that willbecome payable by BP and the amount of fines that will be levied on BP (including any ultimate determination of BP’s culpability based on negligence,gross negligence or wilful misconduct). The outcome of litigation and the cost of the longer term environmental consequences of the oil spill are alsosubject to significant uncertainty. For these reasons it is not possible to estimate reliably the ultimate cost to BP. Our opinion is not qualified in respectof these matters.Separate opinion in relation to IFRS as issued by the International Accounting Standards Board
As explained in Note 1 to the consolidated financial statements, the group in addition to applying IFRS as adopted by the European Union, has alsoapplied IFRS as issued by the International Accounting Standards Board (IASB). In our opinion the consolidated financial statements comply with IFRSas issued by the IASB.What we have audited
We have audited the financial statements of BP p.l.c. for the year ended 31 December 2014 which comprise the Group income statement, the Groupstatement of comprehensive income, the Group statement of changes in equity, the Group and Parent Company balance sheets, the Group and ParentCompany cash flow statements, the Parent Company statement of total recognized gains and losses and the related notes. The financial reportingframework that has been applied in the preparation of the group financial statements is applicable law and International Financial Reporting Standards(IFRS) as adopted by the European Union. The financial reporting framework that has been applied in the preparation of the parent company financialstatements is applicable law and United Kingdom Accounting Standards (United Kingdom Generally Accepted Accounting Practice).This report is made solely to the company’s members, as a body, in accordance with Chapter 3 of Part 16 of the Companies Act 2006. Our audit workhas been undertaken so that we might state to the company’s members those matters we are required to state to them in an auditor’s report and forno other purpose. To the fullest extent permitted by law, we do not accept or assume responsibility to anyone other than the company and thecompany’s members as a body, for our audit work, for this report, or for the opinions we have formed.Respective responsibilities of directors and auditor
As explained more fully in the Statement of directors’ responsibilities set out on page 90, the directors are responsible for the preparation of thefinancial statements and for being satisfied that they give a true and fair view. Our responsibility is to audit and express an opinion on the financialstatements in accordance with applicable law and International Standards on Auditing (UK and Ireland). Those standards require us to comply with theAuditing Practices Board’s Ethical Standards for Auditors.Scope of the audit of the financial statements
An audit involves obtaining evidence about the amounts and disclosures in the financial statements sufficient to give reasonable assurance that thefinancial statements are free from material misstatement, whether caused by fraud or error. This includes an assessment of: whether the accountingpolicies are appropriate to the group’s and parent company’s circumstances and have been consistently applied and adequately disclosed; thereasonableness of significant accounting estimates made by the directors; and the overall presentation of the financial statements. In addition, we readall the financial and non-financial information in the Annual Report to identify material inconsistencies with the audited financial statements and toidentify any information that is apparently materially incorrect based on, or materially inconsistent with, the knowledge acquired by us in the course ofperforming the audit. If we become aware of any apparent material misstatements or inconsistencies we consider the implications for our report.Our assessment of risks of material misstatement
We identified the following risks that have the greatest effect on the overall audit strategy; the allocation of audit resource; and in directing the effortsof the audit engagement team:• the determination of the liabilities, contingent liabilities and disclosures arising from the significant uncertainties related to the Gulf of Mexico oil spill
(See AC and AP)*;• the significant decline in oil and gas prices since late 2014 has the potential for a material impact on the carrying value of the group’s assets. We
reconsidered our risk assessment at the year end to recognise this significant development (See AC and AP)*;• the estimate of oil and gas reserves and resources which has a significant impact on impairment tests, depreciation, depletion & amortisation and
decommissioning provisions (See AC and AP)*;• unauthorized trading activity within the Integrated Supply and Trading function and the potential impact on revenue (See AC)*;• BP’s ability to exercise significant influence over Rosneft and the consequent accounting for the interest in Rosneft using the equity method
(See AC and AP)*;1. The maintenance and integrity of the BP p.l.c website is the responsibility of BP p.l.c.; the work carried out by the auditors does not involve consideration of these
matters and, accordingly, the auditors accept no responsibility for any changes that may have occurred to the financial statements since they were initially presentedon the website.
2. Legislation in the United Kingdom governing the preparation and dissemination of financial statements may differ from legislation in other jurisdictions.* These risks are discussed in other areas of this report as noted by the following key:AC – see Audit Committee Report on pages 64 to 67.AP – see Financial statements—Note 1 Significant accounting policies, judgements, estimates and assumptions on pages 100 to 110.
This page does not form part of BP’s Annual Report on Form 20-F as filed with the SEC.
Financial statements
BP Annual Report and Form 20-F 2014 91
With the exception of the risk related to the recent significant decrease in the oil price the other risks are consistent with the prior year. The risk weidentified in the prior year related to the determination of the fair value of the assets and liabilities of the Rosneft business on acquisition of the equityinterest is not relevant to the current period as the acquisition was completed and accounted for in the prior year.
Our application of materiality
We quantify materiality in planning and executing the audit and in evaluating the materiality of misstatements on the financial statements and theeffect they have on our audit. In determining if the financial statements are free from material error, we define materiality as the magnitude of anomission or misstatement that, individually or in the aggregate, in light of the surrounding circumstances, could reasonably be expected to influencethe economic decisions of the users of the financial statements. The evaluation of materiality requires professional judgement and the consideration ofboth qualitative and quantitative factors.
We determined materiality for the group to be $1 billion (2013 $1 billion), which represents 5% of underlying replacement cost profit (as defined onpage 255) before tax having added back charges related to the Gulf of Mexico oil spill response. We used this measure to calculate our materiality toexclude the impact of both changes in crude oil and product prices and items disclosed as non-operating items that can significantly distort the results.This provides a basis for assessing the importance of misstatements and in determining the scope of our audit procedures.
We determined, based on our risk assessment and consideration of the group’s control environment, that performance materiality be set at 75% of ourmateriality for the group, namely at $750 million (2013 $750 million). Performance materiality is the application of materiality at an individual account orbalance level and is set to reduce to an appropriately low level the probability that the aggregate of uncorrected and undetected misstatementsexceeds materiality. Audit work on individual locations is undertaken using a percentage of our total performance materiality. We allocate performancemateriality to the components of the group we audit based on their relative risk and size. The range of performance materiality allocated to componentsin 2014 was $150 million to $640 million (2013 $150 million to $640 million).
We agreed with the Audit Committee to report all audit differences in excess of $50 million (2013 $50 million).
We evaluate any uncorrected misstatements against both the quantitative measures of materiality discussed above and in the light of other relevantqualitative considerations.
An overview of the scope of our audit
Our audit scope is risk based and is designed to focus our efforts on the areas at greatest risk of material misstatement, aspects subject to significantmanagement judgement and on the locations of greatest complexity, risk and size. We design and execute our audit based primarily on ourassessment of the risks particular to this company and the industry in which it operates.
In scoping the audit we view the group as 42 Regional Performance Units (‘RPUs’) plus the group functions. The group audit scope focused on 19RPUs in the US, Azerbaijan, Angola, UK, Germany, Russia, Singapore and the group functions. We designed specific procedures for these locationsand functions to provide an appropriate basis for executing audit work to address the risk of material misstatement. This included the audit of allaccounts that were impacted by our assessment of the risks of material misstatement (identified above). We note that for these RPUs we do notinclude all balances at these entities in our specific audit scope, based on our assessment of risk we exclude certain low risk, lower value balances.The specific in scope locations represent audit coverage of 71% (2013 68%) of revenue and 63% (2013 72%) of property, plant and equipment. Ourprocedures at the locations in group scope included assessment and testing of management’s financial controls and other substantive and analyticalverification procedures. For those locations and balances that are not subject to specific group scoping (there are many small, low risk locations andbalances in the 23 RPUs not included in our specific scope) we assess and test management’s group wide controls and undertake analytical andenquiry procedures to address the residual risk of material misstatement.
One of the key locations is Russia which includes Rosneft, a material associate not controlled by BP. We were provided with appropriate access toRosneft’s auditors in order to ensure they had completed the procedures required by ISA 600 on the financial statements of Rosneft used as the basisfor BP’s equity accounting.
The Group audit team continued to undertake a programme of planned visits to significant locations to ensure the audit is executed and delivered inaccordance with the planned approach and to confirm the quality of the audit work undertaken.
Our response to the risks of material misstatement identified above included the following procedures:
The determination of the liabilities, contingent liabilities and disclosures arising from the significant uncertainties related to the Gulf of
Mexico oil spill
We continued to assess developments in legal cases related to claims and penalties through reading the determinations and judgments made by thecourts, discussions with the BP legal team and correspondence with external lawyers. The determination of liabilities related to the oil spill takesmonths and years to evolve and during 2014 there were some significant developments in loss claims and potential penalties, specifically related to theEconomic and Property Damages Settlement Agreement and Clean Water Act penalties (see Note 2), that we considered in assessing therequirements of IFRS in relation to liabilities, contingent liabilities and disclosure. Where appropriate we deployed valuation and modelling experts toinform our assessment. There is significant uncertainty related to the ultimate liabilities and we considered the disclosures related to theseuncertainties and concluded that it was appropriate to include an emphasis of matter related to these uncertainties in this report.
The significant decline in oil and gas prices since late 2014 has the potential for a material impact on the carrying value of the group’s
assets.
Movements in commodity prices can have a significant effect on the carrying value of the group’s assets. A significant and rapid drop in prices will alsoquickly impact the group’s operations and cash flows. We assessed the principal risk arising in relation to the financial statements to be associatedwith the carrying value of tangible and intangible assets, many of which are supported by an assessment of future cash flows. The assessment of theasset carrying values is further complicated as external market evidence, such as market transactions, become less reliable in a period of significantchange to the price of oil. We extended the scope of our procedures to address the change in risk profile of the group’s assets and to scrutinizeimpairment considerations. We extended the use of our own valuation experts and external data in critically assessing and corroborating the revisedassumptions used in impairment testing, the most significant being future market oil prices, reserves and resources volumes and discount rates. Wealso performed audit procedures on the mathematical integrity of the impairment models and sensitivity analysis and procedures to ensure thecompleteness of the impairment charge and exploration write offs.
This page does not form part of BP’s Annual Report on Form 20-F as filed with the SEC.
92 BP Annual Report and Form 20-F 2014
The estimate of oil and gas reserves and resources which has a significant impact on impairment tests, depreciation, depletion &
amortisation and decommissioning provisions
We carried out testing of controls over BP’s internal certification process for technical and commercial experts who are responsible for reservesestimation. We assessed whether the significant changes in proved reserves have been made in compliance with relevant regulations. We ensuredthat the updated reserves and resources estimates were included appropriately in consideration of impairment, depreciation, depletion andamortization and decommissioning provisions.
Unauthorized trading activity and the potential impact on revenue
We performed testing relating to controls over unauthorized trading activity. Analytical tools were used to assist us in identifying trades which have thehighest risk of unauthorized activity so as to focus our testing on these trades. We obtained confirmations directly from third parties for a sample oftrades. We verified the fair value of a sample of derivatives using contract and external market prices. We tested the completeness of the amountsrecorded in the financial statements through performing procedures to detect unrecorded liabilities as well as detailed cut off procedures around sales,purchases, trade receivables, and trade payables.
BP’s ability to exercise significant influence over Rosneft and the consequent accounting for the interest in Rosneft using the equity
method
We challenged the evidence available to support BP’s continuing conclusion that Rosneft should be accounted using the equity method. We assessedthe impact of sanctions imposed by the US and European Union through discussion with the BP legal team, consideration of EY internal guidance andobservation of the interaction between BP and Rosneft. We also considered the adequacy of the financial and other information provided to BP toallow compliance with its reporting obligations. We ensured appropriate review was completed by BP on the information reported. We providedinstruction to Rosneft’s auditors who reported in accordance with our timetable and instructions.
Opinion on other matter prescribed by the Companies Act 2006
In our opinion:
• the part of the Directors’ Remuneration Report to be audited has been properly prepared in accordance with the Companies Act 2006; and• the information given in the Strategic Report and the Directors’ Report for the financial year for which the financial statements are prepared is
consistent with the financial statements.
Matters on which we are required to report by exception
We have nothing to report in respect of the following:Under the ISAs (UK and Ireland), we are required to report to you if, in our opinion, information in the annual report is:
• materially inconsistent with the information in the audited financial statements; or• apparently materially incorrect based on, or materially inconsistent with, our knowledge of the group acquired in the course of performing our audit;
or• is otherwise misleading.
In particular, we are required to consider whether we have identified any inconsistencies between our knowledge acquired during the audit and thedirectors’ statement that they consider the annual report is fair, balanced and understandable and whether the annual report appropriately disclosesthose matters that we communicated to the audit committee which we consider should have been disclosed.Under the Companies Act 2006 we are required to report to you if, in our opinion:
• adequate accounting records have not been kept by the parent company, or returns adequate for our audit have not been received from branchesnot visited by us; or
• the parent company financial statements and the part of the Directors’ Remuneration Report to be audited are not in agreement with the accountingrecords and returns; or
• certain disclosures of directors’ remuneration specified by law are not made; or• we have not received all the information and explanations we require for our audit.
Under the Listing Rules we are required to review:• the directors’ statement, set out on page 90, in relation to going concern; and• the part of the Governance and Risk section of the Annual Report relating to the company’s compliance with the nine provisions of the UK Corporate
Governance Code specified for our review.
John C. Flaherty (Senior Statutory Auditor)for and on behalf of Ernst & Young LLP, Statutory AuditorLondon3 March 2015
This page does not form part of BP’s Annual Report on Form 20-F as filed with the SEC.
Financial statements
BP Annual Report and Form 20-F 2014 93
Consolidated financial statements of the BP group
Report of Independent Registered Public Accounting Firm on the Annual Report on Form 20-F
The Board of Directors and Shareholders of BP p.l.c.
We have audited the accompanying group balance sheets of BP p.l.c. as of 31 December 2014, 31 December 2013 and 1 January 2013, and therelated group income statement, group statement of comprehensive income, group statement of changes in equity and group cash flow statement foreach of the three years in the period ended 31 December 2014. These financial statements are the responsibility of the Company’s management. Ourresponsibility is to express an opinion on these financial statements based on our audits.
We conducted our audits in accordance with the standards of the Public Company Accounting Oversight Board (United States). Those standardsrequire that we plan and perform the audit to obtain reasonable assurance about whether the financial statements are free of material misstatement.An audit includes examining, on a test basis, evidence supporting the amounts and disclosures in the financial statements. An audit also includesassessing the accounting principles used and significant estimates made by management, as well as evaluating the overall financial statementpresentation. We believe that our audits provide a reasonable basis for our opinion.
In our opinion, the financial statements referred to above present fairly, in all material respects, the group financial position of BP p.l.c. at 31 December2014, 31 December 2013 and 1 January 2013, and the group results of its operations and its cash flows for each of the three years in the period ended31 December 2014, in accordance with International Financial Reporting Standards as adopted by the European Union and International FinancialReporting Standards as issued by the International Accounting Standards Board.
In forming our opinion on the group financial statements we have considered the adequacy of the disclosure in Note 2 to the financial statementsconcerning the provisions, future expenditures which cannot be reliably estimated and other contingent liabilities related to the claims, penalties andlitigation arising from the Gulf of Mexico oil spill. The total amount that will ultimately be paid by BP in relation to all obligations arising from thissignificant event is subject to significant uncertainty and the ultimate exposure and cost to BP is dependent on many factors, including but not limitedto, the determinations of the Courts and Regulatory authorities in the US. Significant uncertainty exists in relation to the amount of claims that willbecome payable by BP and the amount of fines that will be levied on BP (including any ultimate determination of BP’s culpability based on negligence,gross negligence or wilful misconduct). The outcome of litigation and the cost of the longer term environmental consequences of the oil spill are alsosubject to significant uncertainty. For these reasons it is not possible to estimate reliably the ultimate cost to BP. Our opinion is not qualified in respectof these matters.
We also have audited, in accordance with the standards of the Public Company Accounting Oversight Board (United States), BP p.l.c.’s internal controlover financial reporting as of 31 December 2014, based on criteria established in Internal Control: Revised Guidance for Directors on the CombinedCode as issued by the Institute of Chartered Accountants in England and Wales (the Turnbull guidance) and our report dated 3 March 2015 expressedan unqualified opinion.
/s/ Ernst & Young LLP
London, England3 March 2015
1. The maintenance and integrity of the BP p.l.c. website are the responsibility of BP p.l.c.; the work carried out by the auditors does not involve consideration of thesematters and, accordingly, the auditors accept no responsibility for any changes that may have occurred to the financial statements since they were initially presentedon the website.
2. Legislation in the United Kingdom governing the preparation and dissemination of financial statements may differ from legislation in other jurisdictions.
94 BP Annual Report and Form 20-F 2014
Consolidated financial statements of the BP group
Report of Independent Registered Public Accounting Firm on the Annual Report on Form 20-F
The Board of Directors and Shareholders of BP p.l.c.
We have audited BP p.l.c.’s internal control over financial reporting as of 31 December 2014, based on criteria established in Internal Control: RevisedGuidance for Directors on the Combined Code as issued by the Institute of Chartered Accountants in England and Wales (the Turnbull guidance).BP p.l.c.’s management is responsible for maintaining effective internal control over financial reporting, and for its assessment of the effectiveness ofinternal control over financial reporting included in the accompanying Management’s report on internal control on page 240. Our responsibility is toexpress an opinion on the company’s internal control over financial reporting based on our audit.
We conducted our audit in accordance with the standards of the Public Company Accounting Oversight Board (United States). Those standards requirethat we plan and perform the audit to obtain reasonable assurance about whether effective internal control over financial reporting was maintained in allmaterial respects. Our audit included obtaining an understanding of internal control over financial reporting, assessing the risk that a material weaknessexists, testing and evaluating the design and operating effectiveness of internal control based on the assessed risk, and performing such otherprocedures as we considered necessary in the circumstances. We believe that our audit provides a reasonable basis for our opinion.
A company’s internal control over financial reporting is a process designed to provide reasonable assurance regarding the reliability of financial reportingand the preparation of financial statements for external purposes in accordance with generally accepted accounting principles. A company’s internalcontrol over financial reporting includes those policies and procedures that (1) pertain to the maintenance of records that, in reasonable detail,accurately and fairly reflect the transactions and dispositions of the assets of the company; (2) provide reasonable assurance that transactions arerecorded as necessary to permit preparation of financial statements in accordance with generally accepted accounting principles, and that receipts andexpenditures of the company are being made only in accordance with authorizations of management and directors of the company; and (3) providereasonable assurance regarding prevention or timely detection of unauthorized acquisition, use or disposition of the company’s assets that could havea material effect on the financial statements.
Because of its inherent limitations, internal control over financial reporting may not prevent or detect misstatements. Also, projections of any evaluationof effectiveness to future periods are subject to the risk that controls may become inadequate because of changes in conditions, or that the degree ofcompliance with the policies or procedures may deteriorate.
In our opinion, BP p.l.c. maintained, in all material respects, effective internal control over financial reporting as of 31 December 2014, based on theTurnbull guidance.
We also have audited, in accordance with the standards of the Public Company Accounting Oversight Board (United States), the group balance sheetsof BP p.l.c. as of 31 December 2014 and 2013, and the related group income statement, group statement of comprehensive income, group statementof changes in equity and group cash flow statement for each of the three years in the period ended 31 December 2014, and our report dated 3 March2015 expressed an unqualified opinion thereon.
/s/ Ernst & Young LLP
London, United Kingdom3 March 2015
Consent of independent registered public accounting firm
We consent to the incorporation by reference of our reports dated 3 March 2015, with respect to the group financial statements of BP p.l.c., and theeffectiveness of internal control over financial reporting of BP p.l.c., included in this Annual Report and Form 20-F for the year ended 31 December2014 in the following Registration Statements:
Registration Statement on Form F-3 (File No. 333-201894-01) of BP Capital Markets p.l.c. and BP p.l.c.; andRegistration Statements on Form S-8 (File Nos.333-67206, 333-103924, 333-123482, 333-123483, 333-131583, 333-146868, 333-146870, 333-146873, 333-131584, 333-132619, 333-173136, 333-177423, 333-179406, 333-186463, 333-186462, 333-199015, 333-200794, 333-200795 and333-200796) of BP p.l.c.
/s/ Ernst & Young LLP
London, England3 March 2015
1. The maintenance and integrity of the BP p.l.c. website are the responsibility of BP p.l.c.; the work carried out by the auditors does not involve consideration of thesematters and, accordingly, the auditors accept no responsibility for any changes that may have occurred to the financial statements since they were initially presentedon the website.
2. Legislation in the United Kingdom governing the preparation and dissemination of financial statements may differ from legislation in other jurisdictions.
Financial statements
BP Annual Report and Form 20-F 2014 95
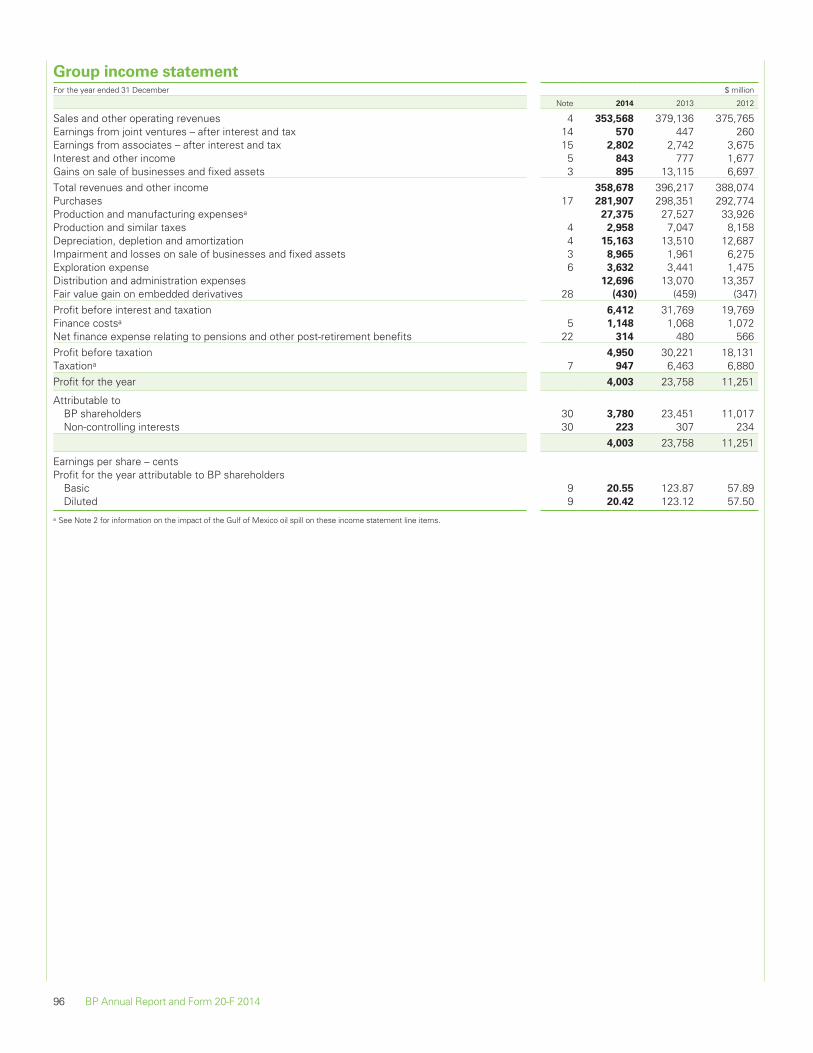
Group income statementFor the year ended 31 December $ million
Note 2014 2013 2012
Sales and other operating revenues 4 353,568 379,136 375,765Earnings from joint ventures – after interest and tax 14 570 447 260Earnings from associates – after interest and tax 15 2,802 2,742 3,675Interest and other income 5 843 777 1,677Gains on sale of businesses and fixed assets 3 895 13,115 6,697Total revenues and other income 358,678 396,217 388,074Purchases 17 281,907 298,351 292,774Production and manufacturing expensesa 27,375 27,527 33,926Production and similar taxes 4 2,958 7,047 8,158Depreciation, depletion and amortization 4 15,163 13,510 12,687Impairment and losses on sale of businesses and fixed assets 3 8,965 1,961 6,275Exploration expense 6 3,632 3,441 1,475Distribution and administration expenses 12,696 13,070 13,357Fair value gain on embedded derivatives 28 (430) (459) (347)Profit before interest and taxation 6,412 31,769 19,769Finance costsa 5 1,148 1,068 1,072Net finance expense relating to pensions and other post-retirement benefits 22 314 480 566Profit before taxation 4,950 30,221 18,131Taxationa 7 947 6,463 6,880Profit for the year 4,003 23,758 11,251
Attributable toBP shareholders 30 3,780 23,451 11,017Non-controlling interests 30 223 307 234
4,003 23,758 11,251
Earnings per share – centsProfit for the year attributable to BP shareholders
Basic 9 20.55 123.87 57.89Diluted 9 20.42 123.12 57.50
a See Note 2 for information on the impact of the Gulf of Mexico oil spill on these income statement line items.
96 BP Annual Report and Form 20-F 2014
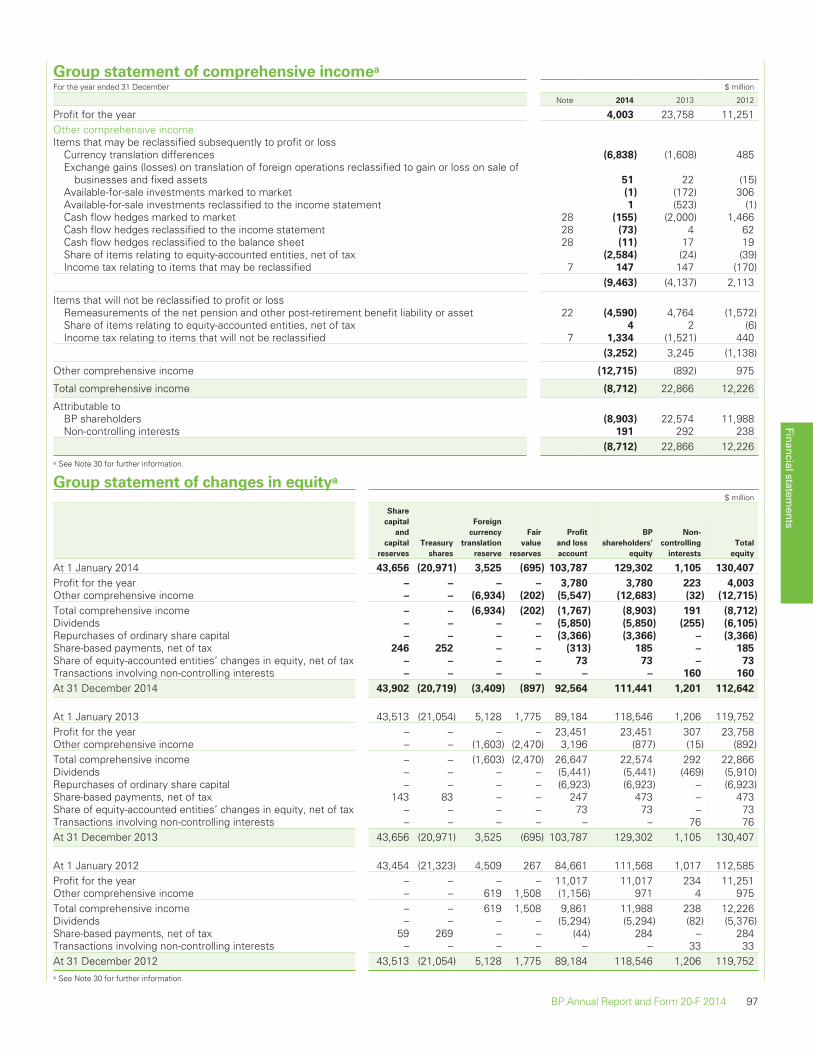
Group statement of comprehensive incomea
For the year ended 31 December $ million
Note 2014 2013 2012
Profit for the year 4,003 23,758 11,251Other comprehensive incomeItems that may be reclassified subsequently to profit or loss
Currency translation differences (6,838) (1,608) 485Exchange gains (losses) on translation of foreign operations reclassified to gain or loss on sale of
businesses and fixed assets 51 22 (15)Available-for-sale investments marked to market (1) (172) 306Available-for-sale investments reclassified to the income statement 1 (523) (1)Cash flow hedges marked to market 28 (155) (2,000) 1,466Cash flow hedges reclassified to the income statement 28 (73) 4 62Cash flow hedges reclassified to the balance sheet 28 (11) 17 19Share of items relating to equity-accounted entities, net of tax (2,584) (24) (39)Income tax relating to items that may be reclassified 7 147 147 (170)
(9,463) (4,137) 2,113
Items that will not be reclassified to profit or lossRemeasurements of the net pension and other post-retirement benefit liability or asset 22 (4,590) 4,764 (1,572)Share of items relating to equity-accounted entities, net of tax 4 2 (6)Income tax relating to items that will not be reclassified 7 1,334 (1,521) 440
(3,252) 3,245 (1,138)
Other comprehensive income (12,715) (892) 975
Total comprehensive income (8,712) 22,866 12,226
Attributable toBP shareholders (8,903) 22,574 11,988Non-controlling interests 191 292 238
(8,712) 22,866 12,226a See Note 30 for further information.
Group statement of changes in equitya
$ million
Share
capital
and
capital
reserves
Treasury
shares
Foreign
currency
translation
reserve
Fair
value
reserves
Profit
and loss
account
BP
shareholders’
equity
Non-
controlling
interests
Total
equity
At 1 January 2014 43,656 (20,971) 3,525 (695) 103,787 129,302 1,105 130,407
Profit for the year – – – – 3,780 3,780 223 4,003
Other comprehensive income – – (6,934) (202) (5,547) (12,683) (32) (12,715)
Total comprehensive income – – (6,934) (202) (1,767) (8,903) 191 (8,712)
Dividends – – – – (5,850) (5,850) (255) (6,105)
Repurchases of ordinary share capital – – – – (3,366) (3,366) – (3,366)
Share-based payments, net of tax 246 252 – – (313) 185 – 185
Share of equity-accounted entities’ changes in equity, net of tax – – – – 73 73 – 73
Transactions involving non-controlling interests – – – – – – 160 160
At 31 December 2014 43,902 (20,719) (3,409) (897) 92,564 111,441 1,201 112,642
At 1 January 2013 43,513 (21,054) 5,128 1,775 89,184 118,546 1,206 119,752Profit for the year – – – – 23,451 23,451 307 23,758Other comprehensive income – – (1,603) (2,470) 3,196 (877) (15) (892)Total comprehensive income – – (1,603) (2,470) 26,647 22,574 292 22,866Dividends – – – – (5,441) (5,441) (469) (5,910)Repurchases of ordinary share capital – – – – (6,923) (6,923) – (6,923)Share-based payments, net of tax 143 83 – – 247 473 – 473Share of equity-accounted entities’ changes in equity, net of tax – – – – 73 73 – 73Transactions involving non-controlling interests – – – – – – 76 76At 31 December 2013 43,656 (20,971) 3,525 (695) 103,787 129,302 1,105 130,407
At 1 January 2012 43,454 (21,323) 4,509 267 84,661 111,568 1,017 112,585Profit for the year – – – – 11,017 11,017 234 11,251Other comprehensive income – – 619 1,508 (1,156) 971 4 975Total comprehensive income – – 619 1,508 9,861 11,988 238 12,226Dividends – – – – (5,294) (5,294) (82) (5,376)Share-based payments, net of tax 59 269 – – (44) 284 – 284Transactions involving non-controlling interests – – – – – – 33 33At 31 December 2012 43,513 (21,054) 5,128 1,775 89,184 118,546 1,206 119,752a See Note 30 for further information.
Financial statements
BP Annual Report and Form 20-F 2014 97
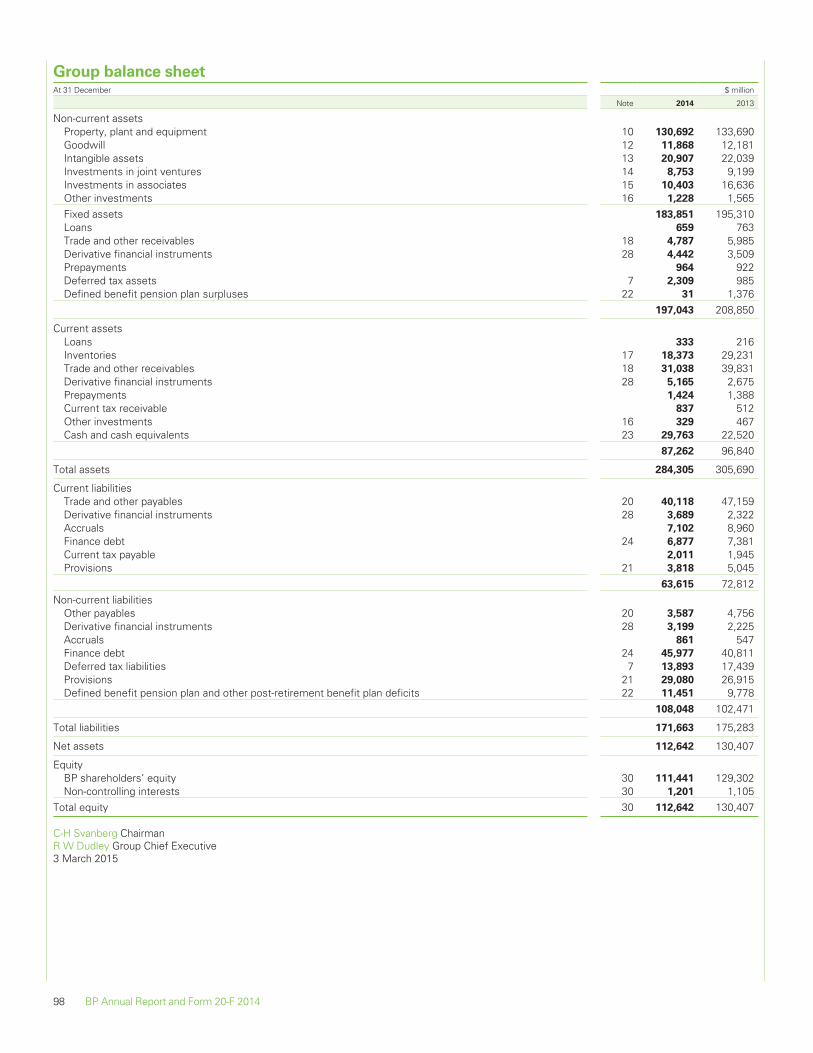
Group balance sheetAt 31 December $ million
Note 2014 2013
Non-current assetsProperty, plant and equipment 10 130,692 133,690Goodwill 12 11,868 12,181Intangible assets 13 20,907 22,039Investments in joint ventures 14 8,753 9,199Investments in associates 15 10,403 16,636Other investments 16 1,228 1,565Fixed assets 183,851 195,310Loans 659 763Trade and other receivables 18 4,787 5,985Derivative financial instruments 28 4,442 3,509Prepayments 964 922Deferred tax assets 7 2,309 985Defined benefit pension plan surpluses 22 31 1,376
197,043 208,850
Current assetsLoans 333 216Inventories 17 18,373 29,231Trade and other receivables 18 31,038 39,831Derivative financial instruments 28 5,165 2,675Prepayments 1,424 1,388Current tax receivable 837 512Other investments 16 329 467Cash and cash equivalents 23 29,763 22,520
87,262 96,840
Total assets 284,305 305,690
Current liabilitiesTrade and other payables 20 40,118 47,159Derivative financial instruments 28 3,689 2,322Accruals 7,102 8,960Finance debt 24 6,877 7,381Current tax payable 2,011 1,945Provisions 21 3,818 5,045
63,615 72,812Non-current liabilities
Other payables 20 3,587 4,756Derivative financial instruments 28 3,199 2,225Accruals 861 547Finance debt 24 45,977 40,811Deferred tax liabilities 7 13,893 17,439Provisions 21 29,080 26,915Defined benefit pension plan and other post-retirement benefit plan deficits 22 11,451 9,778
108,048 102,471
Total liabilities 171,663 175,283
Net assets 112,642 130,407
EquityBP shareholders’ equity 30 111,441 129,302Non-controlling interests 30 1,201 1,105
Total equity 30 112,642 130,407
C-H Svanberg ChairmanR W Dudley Group Chief Executive3 March 2015
98 BP Annual Report and Form 20-F 2014
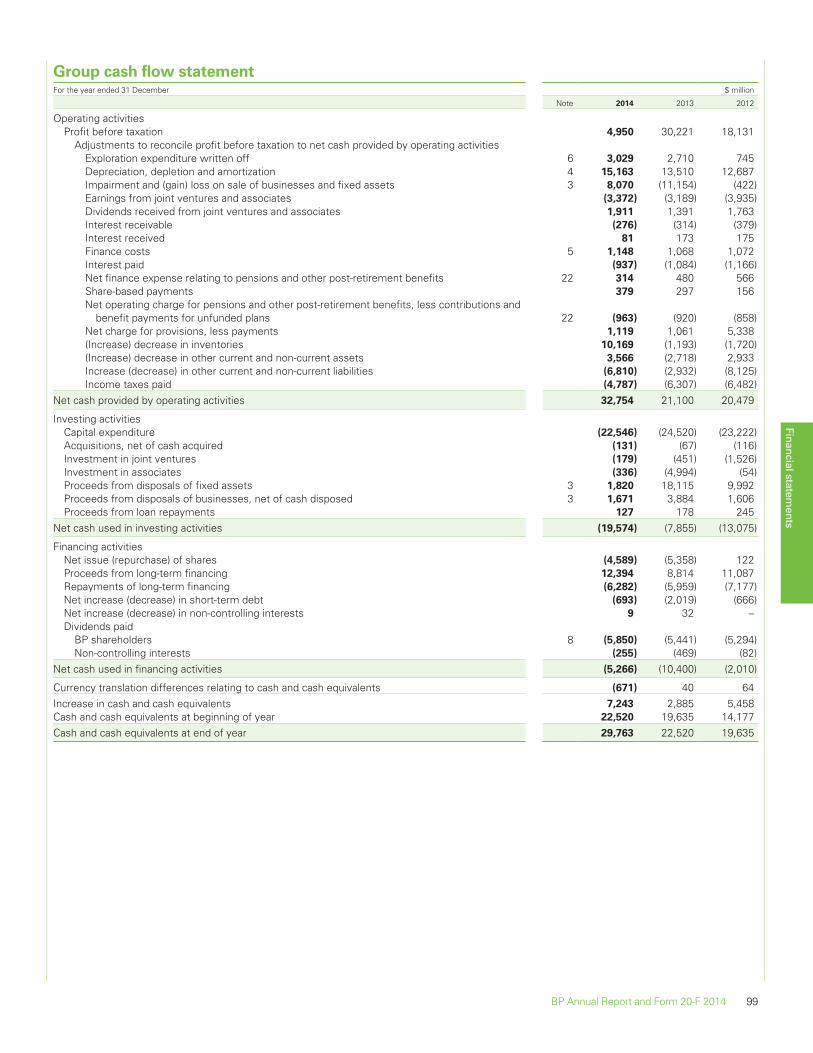
Group cash flow statementFor the year ended 31 December $ million
Note 2014 2013 2012
Operating activitiesProfit before taxation 4,950 30,221 18,131
Adjustments to reconcile profit before taxation to net cash provided by operating activitiesExploration expenditure written off 6 3,029 2,710 745Depreciation, depletion and amortization 4 15,163 13,510 12,687Impairment and (gain) loss on sale of businesses and fixed assets 3 8,070 (11,154) (422)Earnings from joint ventures and associates (3,372) (3,189) (3,935)Dividends received from joint ventures and associates 1,911 1,391 1,763Interest receivable (276) (314) (379)Interest received 81 173 175Finance costs 5 1,148 1,068 1,072Interest paid (937) (1,084) (1,166)Net finance expense relating to pensions and other post-retirement benefits 22 314 480 566Share-based payments 379 297 156Net operating charge for pensions and other post-retirement benefits, less contributions and
benefit payments for unfunded plans 22 (963) (920) (858)Net charge for provisions, less payments 1,119 1,061 5,338(Increase) decrease in inventories 10,169 (1,193) (1,720)(Increase) decrease in other current and non-current assets 3,566 (2,718) 2,933Increase (decrease) in other current and non-current liabilities (6,810) (2,932) (8,125)Income taxes paid (4,787) (6,307) (6,482)
Net cash provided by operating activities 32,754 21,100 20,479
Investing activitiesCapital expenditure (22,546) (24,520) (23,222)Acquisitions, net of cash acquired (131) (67) (116)Investment in joint ventures (179) (451) (1,526)Investment in associates (336) (4,994) (54)Proceeds from disposals of fixed assets 3 1,820 18,115 9,992Proceeds from disposals of businesses, net of cash disposed 3 1,671 3,884 1,606Proceeds from loan repayments 127 178 245
Net cash used in investing activities (19,574) (7,855) (13,075)
Financing activitiesNet issue (repurchase) of shares (4,589) (5,358) 122Proceeds from long-term financing 12,394 8,814 11,087Repayments of long-term financing (6,282) (5,959) (7,177)Net increase (decrease) in short-term debt (693) (2,019) (666)Net increase (decrease) in non-controlling interests 9 32 –Dividends paid
BP shareholders 8 (5,850) (5,441) (5,294)Non-controlling interests (255) (469) (82)
Net cash used in financing activities (5,266) (10,400) (2,010)
Currency translation differences relating to cash and cash equivalents (671) 40 64Increase in cash and cash equivalents 7,243 2,885 5,458Cash and cash equivalents at beginning of year 22,520 19,635 14,177Cash and cash equivalents at end of year 29,763 22,520 19,635
Financial statements
BP Annual Report and Form 20-F 2014 99
Notes on financial statements
1. Significant accounting policies, judgements, estimates and assumptionsAuthorization of financial statements and statement of compliance with International Financial Reporting Standards
The consolidated financial statements of the BP group for the year ended 31 December 2014 were approved and signed by the group chief executiveand chairman on 3 March 2015 having been duly authorized to do so by the board of directors. BP p.l.c. is a public limited company incorporated anddomiciled in England and Wales. The consolidated financial statements have been prepared in accordance with International Financial ReportingStandards (IFRS) as issued by the International Accounting Standards Board (IASB), IFRS as adopted by the European Union (EU) and in accordancewith the provisions of the UK Companies Act 2006. IFRS as adopted by the EU differs in certain respects from IFRS as issued by the IASB, however,the differences have no impact on the group’s consolidated financial statements for the years presented. The significant accounting policies andaccounting judgements, estimates and assumptions of the group are set out below.
Basis of preparation
The consolidated financial statements have been prepared in accordance with IFRS and IFRS Interpretations Committee (IFRIC) interpretations issuedand effective for the year ended 31 December 2014. The accounting policies that follow have been consistently applied to all years presented.
The consolidated financial statements are presented in US dollars and all values are rounded to the nearest million dollars ($ million), except whereotherwise indicated.
Significant accounting policies: use of judgements, estimates and assumptions
Inherent in the application of many of the accounting policies used in preparing the financial statements is the need for BP management to makejudgements, estimates and assumptions that affect the reported amounts of assets and liabilities and the disclosure of contingent assets and liabilitiesat the date of the financial statements and the reported amounts of revenues and expenses during the period. Actual outcomes could differ from theestimates and assumptions used. The accounting judgements and estimates that could have a significant impact on the results of the group are set outin boxed text below, and should be read in conjunction with the information provided in the Notes on financial statements. The areas requiring themost significant judgement and estimation in the preparation of the consolidated financial statements are: accounting for interests in other entities; oiland natural gas accounting, including the estimation of reserves; the recoverability of asset carrying values; derivative financial instruments, includingthe application of hedge accounting; provisions and contingencies, in particular provisions and contingencies related to the Gulf of Mexico oil spill;pensions and other post-retirement benefits and taxation.
Basis of consolidation
The group financial statements consolidate the financial statements of BP p.l.c. and the entities it controls (its subsidiaries) drawn up to 31 Decembereach year. Subsidiaries are consolidated from the date of their acquisition, being the date on which the group obtains control, and continue to beconsolidated until the date that such control ceases. The financial statements of subsidiaries are prepared for the same reporting year as the parentcompany, using consistent accounting policies. Intra-group balances and transactions, including unrealized profits arising from intra-group transactions,have been eliminated. Unrealized losses are eliminated unless the transaction provides evidence of an impairment of the asset transferred. Non-controlling interests represent the equity in subsidiaries that is not attributable, directly or indirectly, to BP shareholders.
Interests in other entities
Business combinations and goodwillBusiness combinations are accounted for using the acquisition method. The identifiable assets acquired and liabilities assumed are measured at theirfair values at the acquisition date. The cost of an acquisition is measured as the aggregate of the consideration transferred, measured at acquisition-date fair value, and the amount of any non-controlling interest in the acquiree. Acquisition costs incurred are expensed and included in distribution andadministration expenses.
Goodwill is initially measured as the excess of the aggregate of the consideration transferred, the amount recognized for any non-controlling interestand the acquisition-date fair values of any previously held interest in the acquiree over the fair value of the identifiable assets acquired and liabilitiesassumed at the acquisition date.
At the acquisition date, any goodwill acquired is allocated to each of the cash-generating units, or groups of cash-generating units, expected to benefitfrom the combination’s synergies.
Following initial recognition, goodwill is measured at cost less any accumulated impairment losses.
Goodwill arising on business combinations prior to 1 January 2003 is stated at the previous carrying amount under UK generally accepted accountingpractice, less subsequent impairments.
Goodwill may also arise upon investments in joint ventures and associates, being the surplus of the cost of investment over the group’s share of thenet fair value of the identifiable assets and liabilities. Such goodwill is recorded within the corresponding investment in joint ventures and associates.
Interests in joint arrangementsThe results, assets and liabilities of joint ventures are incorporated in these financial statements using the equity method of accounting as describedbelow.
Certain of the group’s activities, particularly in the Upstream segment, are conducted through joint operations. BP recognizes, on a line-by-line basis inthe consolidated financial statements, its share of the assets, liabilities and expenses of these joint operations incurred jointly with the other partners,along with the group’s income from the sale of its share of the output and any liabilities and expenses that the group has incurred in relation to the jointoperation.
Interests in associatesThe results, assets and liabilities of associates are incorporated in these financial statements using the equity method of accounting as described below.
Significant estimate or judgement: accounting for interests in other entitiesJudgement is required in assessing the level of control obtained in a transaction to acquire an interest in another entity; depending upon the factsand circumstances in each case, BP may obtain control, joint control or significant influence over the entity or arrangement. Transactions which giveBP control of a business are business combinations. If BP obtains joint control of an arrangement, judgement is also required to assess whether thearrangement is a joint operation or a joint venture. If BP has neither control nor joint control, it may be in a position to exercise significant influenceover the entity, which is then accounted for as an associate.
100 BP Annual Report and Form 20-F 2014
1. Significant accounting policies, judgements, estimates and assumptions – continued
Accounting for business combinations and acquisitions of investments in equity-accounted joint ventures and associates requires judgements andestimates to be made in order to determine the fair value of the consideration transferred, together with the fair values of the assets acquired andthe liabilities assumed in a business combination, or the identifiable assets and liabilities of the equity-accounted entity at the acquisition date. Thegroup uses all available information, including external valuations and appraisals where appropriate, to determine these fair values. If necessary, thegroup has up to one year from the acquisition date to finalize the determinations of fair value for business combinations.
Since 21 March 2013, BP has owned 19.75% of the voting shares of OJSC Oil Company Rosneft (Rosneft), a Russian oil and gas company. TheRussian federal government, through its investment company OJSC Rosneftegaz, owned 69.5% of the voting shares of Rosneft at 31 December2014. BP uses the equity method of accounting for its investment in Rosneft because under IFRS it is considered to have significant influence.Significant influence is defined as the power to participate in the financial and operating policy decisions of the investee but is not control or jointcontrol. IFRS identifies several indicators that may provide evidence of significant influence, including representation on the board of directors of theinvestee and participation in policy-making processes. BP’s group chief executive, Bob Dudley, has been elected to the board of directors of Rosneftand he is a member of the Rosneft board’s Strategic Planning Committee. Furthermore, under the Rosneft Charter, BP has the right to nominate asecond director to Rosneft’s nine-person board of directors for election at a general meeting of shareholders should it choose to do so in the future.In addition, BP holds the voting rights at general meetings of shareholders conferred by its 19.75% stake in Rosneft. In management’s judgement,the group has significant influence over Rosneft, as defined by the relevant accounting standard, and the investment is, therefore, accounted for asan associate. BP’s share of Rosneft’s oil and natural gas reserves is included in the estimated net proved reserves of equity-accounted entities.
The equity method of accounting
Under the equity method, the investment is carried on the balance sheet at cost plus post-acquisition changes in the group’s share of net assets of theentity, less distributions received and less any impairment in value of the investment. Loans advanced to equity-accounted entities that have thecharacteristics of equity financing are also included in the investment on the group balance sheet. The group income statement reflects the group’sshare of the results after tax of the equity-accounted entity, adjusted to account for depreciation, amortization and any impairment of the equity-accounted entity’s assets based on their fair values at the date of acquisition. The group statement of comprehensive income includes the group’sshare of the equity-accounted entity’s other comprehensive income. The group’s share of amounts recognized directly in equity by an equity-accountedentity is recognized directly in the group’s statement of changes in equity.
Financial statements of equity-accounted entities are prepared for the same reporting year as the group. Where material differences arise, adjustmentsare made to those financial statements to bring the accounting policies used into line with those of the group.
Unrealized gains on transactions between the group and its equity-accounted entities are eliminated to the extent of the group’s interest in the equity-accounted entity. Unrealized losses are also eliminated unless the transaction provides evidence of an impairment of the asset transferred.
The group assesses investments in equity-accounted entities for impairment whenever events or changes in circumstances indicate that the carryingvalue may not be recoverable. If any such indication of impairment exists, the carrying amount of the investment is compared with its recoverableamount, being the higher of its fair value less costs of disposal and value in use. If the carrying amount exceeds the recoverable amount, theinvestment is written down to its recoverable amount.
The group ceases to use the equity method of accounting from the date on which it no longer has joint control over the joint venture or significantinfluence over the associate, or when the interest becomes classified as an asset held for sale.
Segmental reporting
The group’s operating segments are established on the basis of those components of the group that are evaluated regularly by the chief operatingdecision maker in deciding how to allocate resources and in assessing performance.
The accounting policies of the operating segments are the same as the group’s accounting policies described in this note, except that IFRS requiresthat the measure of profit or loss disclosed for each operating segment is the measure that is provided regularly to the chief operating decision maker.For BP, this measure of profit or loss is replacement cost profit before interest and tax which reflects the replacement cost of inventories sold in theperiod and is arrived at by excluding inventory holding gains and losses from profit. Replacement cost profit for the group is not a recognized measureunder IFRS. For further information see Note 4.
Foreign currency translation
In individual subsidiaries, joint ventures and associates, transactions in foreign currencies are initially recorded in the functional currency of thoseentities by applying the rate of exchange ruling at the date of the transaction. Monetary assets and liabilities denominated in foreign currencies areretranslated into the functional currency at the rate of exchange ruling at the balance sheet date. Any resulting exchange differences are included in theincome statement, unless hedge accounting is applied. Non-monetary assets and liabilities, other than those measured at fair value, are notretranslated subsequent to initial recognition.
In the consolidated financial statements, the assets and liabilities of non-US dollar functional currency subsidiaries, joint ventures and associates,including related goodwill, are translated into US dollars at the rate of exchange ruling at the balance sheet date. The results and cash flows of non-USdollar functional currency subsidiaries, joint ventures and associates are translated into US dollars using average rates of exchange. In the consolidatedfinancial statements, exchange adjustments arising when the opening net assets and the profits for the year retained by non-US dollar functionalcurrency subsidiaries, joint ventures and associates are translated into US dollars are taken to a separate component of equity and reported in thestatement of comprehensive income. Exchange gains and losses arising on long-term intra-group foreign currency borrowings used to finance thegroup’s non-US dollar investments are also taken to other comprehensive income. On disposal or partial disposal of a non-US dollar functional currencysubsidiary, joint venture or associate, the related cumulative exchange gains and losses recognized in equity are reclassified to the income statement.
Non-current assets held for sale
Non-current assets and disposal groups classified as held for sale are measured at the lower of carrying amount and fair value less costs to sell.
Non-current assets and disposal groups are classified as held for sale if their carrying amounts will be recovered through a sale transaction rather thanthrough continuing use. This condition is regarded as met only when the sale is highly probable and the asset or disposal group is available forimmediate sale in its present condition subject only to terms that are usual and customary for sales of such assets. Management must be committedto the sale, which should be expected to qualify for recognition as a completed sale within one year from the date of classification as held for sale.
Property, plant and equipment and intangible assets are not depreciated or amortized once classified as held for sale.
Financial statements
BP Annual Report and Form 20-F 2014 101
1. Significant accounting policies, judgements, estimates and assumptions – continued
Intangible assets
Intangible assets, other than goodwill, include expenditure on the exploration for and evaluation of oil and natural gas resources, computer software,patents, licences and trade marks and are stated at the amount initially recognized, less accumulated amortization and accumulated impairment losses.
Intangible assets acquired separately from a business are carried initially at cost. The initial cost is the aggregate amount paid and the fair value of anyother consideration given to acquire the asset. An intangible asset acquired as part of a business combination is measured at fair value at the date ofacquisition and is recognized separately from goodwill if the asset is separable or arises from contractual or other legal rights.
Intangible assets with a finite life are amortized on a straight-line basis over their expected useful lives. For patents, licences and trade marks, expecteduseful life is the shorter of the duration of the legal agreement and economic useful life, and can range from three to 15 years. Computer softwarecosts generally have a useful life of three to five years.
The expected useful lives of assets are reviewed on an annual basis and, if necessary, changes in useful lives are accounted for prospectively.
Oil and natural gas exploration, appraisal and development expenditureOil and natural gas exploration, appraisal and development expenditure is accounted for using the principles of the successful efforts method ofaccounting.
Licence and property acquisition costsExploration licence and leasehold property acquisition costs are capitalized within intangible assets and are reviewed at each reporting date to confirmthat there is no indication that the carrying amount exceeds the recoverable amount. This review includes confirming that exploration drilling is stillunder way or firmly planned or that it has been determined, or work is under way to determine, that the discovery is economically viable based on arange of technical and commercial considerations and sufficient progress is being made on establishing development plans and timing. If no futureactivity is planned, the remaining balance of the licence and property acquisition costs is written off. Lower value licences are pooled and amortized ona straight-line basis over the estimated period of exploration. Upon recognition of proved reserves and internal approval for development, the relevantexpenditure is transferred to property, plant and equipment.
Exploration and appraisal expenditureGeological and geophysical exploration costs are charged against income as incurred. Costs directly associated with an exploration well are initiallycapitalized as an intangible asset until the drilling of the well is complete and the results have been evaluated. These costs include employeeremuneration, materials and fuel used, rig costs and payments made to contractors. If potentially commercial quantities of hydrocarbons are not found,the exploration well is written off as a dry hole. If hydrocarbons are found and, subject to further appraisal activity, are likely to be capable ofcommercial development, the costs continue to be carried as an asset.
Costs directly associated with appraisal activity, undertaken to determine the size, characteristics and commercial potential of a reservoir following theinitial discovery of hydrocarbons, including the costs of appraisal wells where hydrocarbons were not found, are initially capitalized as an intangibleasset. When proved reserves of oil and natural gas are determined and development is approved by management, the relevant expenditure istransferred to property, plant and equipment.
Development expenditureExpenditure on the construction, installation and completion of infrastructure facilities such as platforms, pipelines and the drilling of developmentwells, including service and unsuccessful development or delineation wells, is capitalized within property, plant and equipment and is depreciated fromthe commencement of production as described below in the accounting policy for property, plant and equipment.
Significant estimate or judgement: oil and natural gas accountingThe determination of whether potentially economic oil and natural gas reserves have been discovered by an exploration well is usually made withinone year after well completion, but can take longer, depending on the complexity of the geological structure. Exploration wells that discoverpotentially economic quantities of oil and natural gas and are in areas where major capital expenditure (e.g. an offshore platform or a pipeline) wouldbe required before production could begin, and where the economic viability of that major capital expenditure depends on the successful completionof further exploration work in the area, remain capitalized on the balance sheet as long as additional exploration or appraisal work is under way orfirmly planned.
It is not unusual to have exploration wells and exploratory-type stratigraphic test wells remaining suspended on the balance sheet for several yearswhile additional appraisal drilling and seismic work on the potential oil and natural gas field is performed or while the optimum development plansand timing are established. All such carried costs are subject to regular technical, commercial and management review on at least an annual basis toconfirm the continued intent to develop, or otherwise extract value from, the discovery. Where this is no longer the case, the costs are immediatelyexpensed.
One of the facts and circumstances which indicate that an entity should test such assets for impairment is that the period for which the entity has aright to explore in the specific area has expired or will expire in the near future, and is not expected to be renewed.
BP has leases in the Gulf of Mexico making up a prospect, some with terms which were scheduled to expire at the end of 2013 and some withterms which were scheduled to expire at the end of 2014. A significant proportion of our capitalized exploration and appraisal costs in the Gulf ofMexico relate to this prospect. This prospect requires the development of subsea technology to ensure that the hydrocarbons can be extractedsafely. BP is in negotiation with the US Bureau of Safety and Environmental Enforcement in relation to seeking extension of these leases so that thediscovered hydrocarbons can be developed. BP remains committed to developing this prospect and expects that the leases will be renewed and,therefore, continues to carry the capitalized costs on its balance sheet.
Property, plant and equipment
Property, plant and equipment is stated at cost, less accumulated depreciation and accumulated impairment losses. The initial cost of an assetcomprises its purchase price or construction cost, any costs directly attributable to bringing the asset into the location and condition necessary for it tobe capable of operating in the manner intended by management, the initial estimate of any decommissioning obligation, if any, and, for assets thatnecessarily take a substantial period of time to get ready for their intended use, finance costs. The purchase price or construction cost is the aggregateamount paid and the fair value of any other consideration given to acquire the asset. The capitalized value of a finance lease is also included withinproperty, plant and equipment.
Expenditure on major maintenance refits or repairs comprises the cost of replacement assets or parts of assets, inspection costs and overhaul costs.Where an asset or part of an asset that was separately depreciated is replaced and it is probable that future economic benefits associated with the
102 BP Annual Report and Form 20-F 2014
1. Significant accounting policies, judgements, estimates and assumptions – continued
item will flow to the group, the expenditure is capitalized and the carrying amount of the replaced asset is derecognized. Inspection costs associatedwith major maintenance programmes are capitalized and amortized over the period to the next inspection. Overhaul costs for major maintenanceprogrammes, and all other maintenance costs are expensed as incurred.
Oil and natural gas properties, including related pipelines, are depreciated using a unit-of-production method. The cost of producing wells is amortizedover proved developed reserves. Licence acquisition, common facilities and future decommissioning costs are amortized over total proved reserves.The unit-of-production rate for the depreciation of common facilities takes into account expenditures incurred to date, together with estimated futurecapital expenditure expected to be incurred relating to as yet undeveloped reserves expected to be processed through these common facilities.
Other property, plant and equipment is depreciated on a straight-line basis over its expected useful life. The typical useful lives of the group’s otherproperty, plant and equipment are as follows:
Land improvements 15 to 25 yearsBuildings 20 to 50 yearsRefineries 20 to 30 yearsPetrochemicals plants 20 to 30 yearsPipelines 10 to 50 yearsService stations 15 yearsOffice equipment 3 to 7 yearsFixtures and fittings 5 to 15 years
The expected useful lives of property, plant and equipment are reviewed on an annual basis and, if necessary, changes in useful lives are accounted forprospectively.
An item of property, plant and equipment is derecognized upon disposal or when no future economic benefits are expected to arise from the continueduse of the asset. Any gain or loss arising on derecognition of the asset (calculated as the difference between the net disposal proceeds and thecarrying amount of the item) is included in the income statement in the period in which the item is derecognized.
Significant estimate or judgement: estimation of oil and natural gas reservesThe determination of the group’s estimated oil and natural gas reserves requires significant judgements and estimates to be applied and these areregularly reviewed and updated. Factors such as the availability of geological and engineering data, reservoir performance data, acquisition anddivestment activity, drilling of new wells and commodity prices all impact on the determination of the group’s estimates of its oil and natural gasreserves. BP bases its proved reserves estimates on the requirement of reasonable certainty with rigorous technical and commercial assessmentsbased on conventional industry practice and regulatory requirements.
The estimation of oil and natural gas reserves and BP’s process to manage reserves bookings is described in Supplementary information on oil andnatural gas on page 167, which is unaudited. Details on BP’s proved reserves and production compliance and governance processes are provided onpage 219.
Estimates of oil and natural gas reserves are used to calculate depreciation, depletion and amortization charges for the group’s oil and gas properties.The impact of changes in estimated proved reserves is dealt with prospectively by amortizing the remaining carrying value of the asset over theexpected future production. Oil and natural gas reserves also have a direct impact on the assessment of the recoverability of asset carrying valuesreported in the financial statements. If proved reserves estimates are revised downwards, earnings could be affected by higher depreciationexpense or an immediate write-down of the property’s carrying value.
The 2014 movements in proved reserves are reflected in the tables showing movements in oil and natural gas reserves by region in Supplementaryinformation on oil and natural gas (unaudited) on page 167. Information on the carrying amounts of the group’s oil and natural gas properties,together with the amounts recognized in the income statement as depreciation, depletion and amortization is contained in Note 10 and Note 4respectively.
Impairment of property, plant and equipment, intangible assets, and goodwill
The group assesses assets or groups of assets for impairment whenever events or changes in circumstances indicate that the carrying amount of anasset may not be recoverable, for example, changes in the group’s business plans, changes in commodity prices leading to sustained unprofitableperformance, low plant utilization, evidence of physical damage or, for oil and gas assets, significant downward revisions of estimated reserves orincreases in estimated future development expenditure or decommissioning costs. If any such indication of impairment exists, the group makes anestimate of the asset’s recoverable amount. Individual assets are grouped for impairment assessment purposes at the lowest level at which there areidentifiable cash flows that are largely independent of the cash flows of other groups of assets. An asset group’s recoverable amount is the higher ofits fair value less costs of disposal and its value in use. Where the carrying amount of an asset group exceeds its recoverable amount, the asset groupis considered impaired and is written down to its recoverable amount.
The business segment plans, which are approved on an annual basis by senior management, are the primary source of information for thedetermination of value in use. They contain forecasts for oil and natural gas production, refinery throughputs, sales volumes for various types of refinedproducts (e.g. gasoline and lubricants), revenues, costs and capital expenditure. As an initial step in the preparation of these plans, various marketassumptions, such as oil prices, natural gas prices, refining margins, refined product margins and cost inflation rates, are set by senior management.These market assumptions take account of existing prices, global supply-demand equilibrium for oil and natural gas, other macroeconomic factors andhistorical trends and variability. In assessing value in use, the estimated future cash flows are adjusted for the risks specific to the asset group and arediscounted to their present value using a pre-tax discount rate that reflects current market assessments of the time value of money.
Fair value less costs of disposal is the price that would be received to sell the asset in an orderly transaction between market participants and does notreflect the effects of factors that may be specific to the entity and not applicable to entities in general.
An assessment is made at each reporting date as to whether there is any indication that previously recognized impairment losses may no longer existor may have decreased. If such an indication exists, the recoverable amount is estimated. A previously recognized impairment loss is reversed only ifthere has been a change in the estimates used to determine the asset’s recoverable amount since the last impairment loss was recognized. If that isthe case, the carrying amount of the asset is increased to its recoverable amount. That increased amount cannot exceed the carrying amount thatwould have been determined, net of depreciation, had no impairment loss been recognized for the asset in prior years. Such reversal is recognized inprofit or loss. After such a reversal, the depreciation charge is adjusted in future periods to allocate the asset’s revised carrying amount, less anyresidual value, on a systematic basis over its remaining useful life.
Financial statements
BP Annual Report and Form 20-F 2014 103
1. Significant accounting policies, judgements, estimates and assumptions – continued
Goodwill is reviewed for impairment annually or more frequently if events or changes in circumstances indicate the recoverable amount of the group ofcash-generating units to which the goodwill relates should be assessed. In assessing whether goodwill has been impaired, the carrying amount of thegroup of CGUs (including goodwill) is compared with their recoverable amount. The recoverable amount of a group of CGUs to which goodwill isallocated is the higher of value in use and fair value less costs of disposal. Where the recoverable amount of the group of CGUs to which goodwill hasbeen allocated is less than the carrying amount, an impairment loss is recognized. An impairment loss recognized for goodwill is not reversed in asubsequent period.
Significant estimate or judgement: recoverability of asset carrying valuesDetermination as to whether, and by how much, an asset or group of CGUs containing goodwill is impaired involves management estimates onhighly uncertain matters such as future commodity prices, the effects of inflation on operating expenses, discount rates, production profiles and theoutlook for global or regional market supply-and-demand conditions for crude oil, natural gas and refined products. For oil and natural gas properties,the expected future cash flows are estimated using management’s best estimate of future oil and natural gas prices and reserves volumes.
The estimated future level of production in all impairment tests is based on assumptions about future commodity prices, production anddevelopment costs, field decline rates, current fiscal regimes and other factors.
Fair value less costs of disposal may be determined based on similar recent market transaction data or, where recent market transactions for theasset are not available for reference, using discounted cash flow techniques. Where discounted cash flow analyses are used to calculate fair valueless costs of disposal, accounting judgements are made about the assumptions market participants would use when pricing an asset, a CGU or agroup of CGUs containing goodwill and the test is performed on a post-tax basis. The discount rate used is the group’s post-tax weighted averagecost of capital (2014 8%), with a 2% premium added in higher-risk countries. Reserves assumptions for fair value less costs of disposal discountedcash flow tests consider all reserves that a market participant would consider when valuing the asset, which are usually broader in scope than thereserves used in a value-in-use test. Discounted cash flow analyses used to calculate fair value less costs of disposal use market prices for the firstfive years and long-term price assumptions that are consistent with the assumptions used by the group for investment appraisal purposesthereafter. The long-term oil price assumption used in such tests is $97 per barrel in 2020 and is inflated at a rate of 2.5% per annum for theremaining life of the asset. This long-term assumption is derived from the $80 per barrel real oil price assumption used for investment appraisal. Inthe current price environment, the market prices used for the first five years of both value-in-use and fair value less costs of disposal impairmenttests are particularly volatile. Market prices used for the first five years of both value-in-use and fair value less costs of disposal impairment tests areshown in the table below:
2014
2015 2016 2017 2018 2019
Brent oil price ($/bbl) 61 69 73 76 77
Henry Hub natural gas price ($/mmBtu) 3.11 3.53 3.82 4.00 4.15
2013
2014 2015 2016 2017 2018
Brent oil price ($/bbl) 108 102 97 93 90Henry Hub natural gas price ($/mmBtu) 3.86 4.02 4.10 4.17 4.27
For value-in-use calculations, future cash flows are adjusted for risks specific to the cash-generating unit and are discounted using a pre-tax discountrate. The discount rate is derived from the group’s post-tax weighted average cost of capital and is adjusted where applicable to take into accountany specific risks relating to the country where the cash-generating unit is located. In 2014 the discount rate used for value-in-use calculations was12% nominal (2013 12% nominal), with a 2% premium added in higher-risk countries. The discount rates applied in assessments of impairment arereassessed each year. Reserves assumptions for value-in-use tests are confined to proved and sanctioned probable reserves. For value-in-usecalculations, prices for oil and natural gas used for future cash flow calculations are based on market prices for the first five years (consistent withthose shown in the table above) and the group’s flat nominal long-term price assumptions thereafter. As at 31 December 2014, the group’s long-term flat nominal price assumptions were $90 per barrel for Brent and $6.50/mmBtu for Henry Hub (2013 $90 per barrel and $6.50/mmBtu). Theselong-term price assumptions are subject to periodic review and revision.
Irrespective of whether there is any indication of impairment, BP is required to test annually for impairment of goodwill acquired in a businesscombination. The group carries goodwill of approximately $11.9 billion on its balance sheet (2013 $12.2 billion), principally relating to the AtlanticRichfield, Burmah Castrol, Devon Energy and Reliance transactions. In testing goodwill for impairment, the group uses the approach describedabove to determine recoverable amount. If there are low oil or natural gas prices or refining margins or marketing margins for an extended period,the group may need to recognize goodwill impairment charges.
The recoverability of intangible exploration and appraisal expenditure is covered under Oil and natural gas exploration, appraisal and developmentexpenditure above.
Details of impairment charges recognized in the income statement are provided in Note 3 and details on the carrying amounts of assets are shownin Note 10, Note 12 and Note 13.
Inventories
Inventories, other than inventories held for trading purposes, are stated at the lower of cost and net realizable value. Cost is determined by the first-infirst-out method and comprises direct purchase costs, cost of production, transportation and manufacturing expenses. Net realizable value isdetermined by reference to prices existing at the balance sheet date, adjusted where the sale of inventories after the reporting period gives evidenceabout their net realizable value at the end of the period.
Inventories held for trading purposes are stated at fair value less costs to sell and any changes in fair value are recognized in the income statement.
Supplies are valued at cost to the group mainly using the average method or net realizable value, whichever is the lower.
104 BP Annual Report and Form 20-F 2014

1. Significant accounting policies, judgements, estimates and assumptions – continued
Leases
Finance leases are capitalized at the commencement of the lease term at the fair value of the leased item or, if lower, at the present value of theminimum lease payments. Finance charges are allocated to each period so as to achieve a constant rate of interest on the remaining balance of theliability and are charged directly against income. Capitalized leased assets are depreciated over the shorter of the estimated useful life of the asset orthe lease term.
Operating lease payments are recognized as an expense in the income statement on a straight-line basis over the lease term.
Financial assets
Financial assets are classified as loans and receivables; financial assets at fair value through profit or loss; derivatives designated as hedginginstruments in an effective hedge; held-to-maturity financial assets; or as available-for-sale financial assets, as appropriate. Financial assets include cashand cash equivalents, trade receivables, other receivables, loans, other investments, and derivative financial instruments. The group determines theclassification of its financial assets at initial recognition. Financial assets are recognized initially at fair value, normally being the transaction price plus, inthe case of financial assets not at fair value through profit or loss, directly attributable transaction costs.
The subsequent measurement of financial assets depends on their classification, as follows:
Loans and receivablesLoans and receivables are carried at amortized cost using the effective interest method if the time value of money is significant. Gains and losses arerecognized in income when the loans and receivables are derecognized or impaired, as well as through the amortization process. This category offinancial assets includes trade and other receivables. Cash and cash equivalents are short-term highly liquid investments that are readily convertible toknown amounts of cash, are subject to insignificant risk of changes in value and have a maturity of three months or less from the date of acquisition.
Financial assets at fair value through profit or lossFinancial assets at fair value through profit or loss are carried on the balance sheet at fair value with gains or losses recognized in the incomestatement. Derivatives, other than those designated as effective hedging instruments, are classified as held for trading and are included in thiscategory.
Derivatives designated as hedging instruments in an effective hedgeThese derivatives are carried on the balance sheet at fair value. The treatment of gains and losses arising from revaluation is described below in theaccounting policy for derivative financial instruments and hedging activities.
Held-to-maturity financial assetsHeld-to-maturity financial assets are measured at amortized cost using the effective interest method, less any impairment.
Available-for-sale financial assetsAfter initial recognition, available-for-sale financial assets are measured at fair value, with gains or losses recognized within other comprehensiveincome, except for impairment losses, and, for available-for-sale debt instruments, foreign exchange gains or losses and any changes in fair valuearising from revised estimates of future cash flows, which are recognized in profit or loss.
Impairment of loans and receivables
The group assesses at each balance sheet date whether a financial asset or group of financial assets is impaired. If there is objective evidence that animpairment loss on loans and receivables carried at amortized cost has been incurred, the amount of the loss is measured as the difference betweenthe asset’s carrying amount and the present value of estimated future cash flows discounted at the financial asset’s original effective interest rate. Thecarrying amount of the asset is reduced, with the amount of the loss recognized in the income statement.
Significant estimate or judgement: recoverability of trade receivablesJudgements are required in assessing the recoverability of overdue trade receivables and determining whether a provision against the futurerecoverability of those receivables is required. Factors considered include the credit rating of the counterparty, the amount and timing of anticipatedfuture payments and any possible actions that can be taken to mitigate the risk of non-payment. See Note 27 for information on overdue receivables.
Financial liabilities
Financial liabilities are classified as financial liabilities at fair value through profit or loss; derivatives designated as hedging instruments in an effectivehedge; or as financial liabilities measured at amortized cost, as appropriate. Financial liabilities include trade and other payables, accruals, most items offinance debt and derivative financial instruments. The group determines the classification of its financial liabilities at initial recognition. Themeasurement of financial liabilities depends on their classification, as follows:
Financial liabilities at fair value through profit or lossFinancial liabilities at fair value through profit or loss are carried on the balance sheet at fair value with gains or losses recognized in the incomestatement. Derivatives, other than those designated as effective hedging instruments, are classified as held for trading and are included in thiscategory.
Derivatives designated as hedging instruments in an effective hedgeThese derivatives are carried on the balance sheet at fair value. The treatment of gains and losses arising from revaluation is described below in theaccounting policy for derivative financial instruments and hedging activities.
Financial liabilities measured at amortized costAll other financial liabilities are initially recognized at fair value. For interest-bearing loans and borrowings this is the fair value of the proceeds receivednet of issue costs associated with the borrowing.
After initial recognition, other financial liabilities are subsequently measured at amortized cost using the effective interest method. Amortized cost iscalculated by taking into account any issue costs, and any discount or premium on settlement. Gains and losses arising on the repurchase, settlementor cancellation of liabilities are recognized respectively in interest and other income and finance costs.
This category of financial liabilities includes trade and other payables and finance debt.
Financial statements
BP Annual Report and Form 20-F 2014 105
1. Significant accounting policies, judgements, estimates and assumptions – continued
Derivative financial instruments and hedging activities
The group uses derivative financial instruments to manage certain exposures to fluctuations in foreign currency exchange rates, interest rates andcommodity prices as well as for trading purposes. These derivative financial instruments are initially recognized at fair value on the date on which aderivative contract is entered into and are subsequently remeasured at fair value. Derivatives are carried as assets when the fair value is positive and asliabilities when the fair value is negative.
Contracts to buy or sell a non-financial item that can be settled net in cash or another financial instrument, or by exchanging financial instruments as ifthe contracts were financial instruments, with the exception of contracts that were entered into and continue to be held for the purpose of the receiptor delivery of a non-financial item in accordance with the group’s expected purchase, sale or usage requirements, are accounted for as financialinstruments. Gains or losses arising from changes in the fair value of derivatives that are not designated as effective hedging instruments arerecognized in the income statement.
If, at inception of a contract, the valuation cannot be supported by observable market data, any gain or loss determined by the valuation methodology isnot recognized in the income statement but is deferred on the balance sheet and is commonly known as ‘day-one profit or loss’. This deferred gain orloss is recognized in the income statement over the life of the contract until substantially all the remaining contract term can be valued usingobservable market data at which point any remaining deferred gain or loss is recognized in the income statement. Changes in valuation from the initialvaluation are recognized immediately through the income statement.
For the purpose of hedge accounting, hedges are classified as:
• Fair value hedges when hedging exposure to changes in the fair value of a recognized asset or liability.• Cash flow hedges when hedging exposure to variability in cash flows that is attributable to either a particular risk associated with a recognized asset
or liability or a highly probable forecast transaction.
Hedge relationships are formally designated and documented at inception, together with the risk management objective and strategy for undertakingthe hedge. The documentation includes identification of the hedging instrument, the hedged item or transaction, the nature of the risk being hedged,and how the entity will assess the hedging instrument effectiveness in offsetting the exposure to changes in the hedged item’s fair value or cash flowsattributable to the hedged risk. Such hedges are expected at inception to be highly effective in achieving offsetting changes in fair value or cash flows.Hedges meeting the criteria for hedge accounting are accounted for as follows:
Fair value hedgesThe change in fair value of a hedging derivative is recognized in profit or loss. The change in the fair value of the hedged item attributable to the riskbeing hedged is recorded as part of the carrying value of the hedged item and is also recognized in profit or loss. The group applies fair value hedgeaccounting when hedging interest rate risk on fixed rate borrowings.
If the criteria for hedge accounting are no longer met, or if the group revokes the designation, the accumulated adjustment to the carrying amount of ahedged item at such time is then amortized to profit or loss over the remaining period to maturity.
Cash flow hedgesThe effective portion of the gain or loss on a cash flow hedging instrument is recognized within other comprehensive income, while the ineffectiveportion is recognized in profit or loss. Amounts taken to other comprehensive income are reclassified to the income statement when the hedgedtransaction affects profit or loss.
Where the hedged item is a non-financial asset or liability, such as a forecast foreign currency transaction for the purchase of property, plant andequipment, the amounts recognized within other comprehensive income are reclassified to the initial carrying amount of the non-financial asset orliability. Where the hedged item is an equity investment, the amounts recognized in other comprehensive income remain in the separate component ofequity until the hedged cash flows affect profit or loss. Where the hedged item is recognized directly in profit or loss, the amounts recognized in othercomprehensive income are reclassified to production and manufacturing expenses, except for cash flow hedges of variable interest rate risk which arereclassified to finance costs.
If the hedging instrument expires or is sold, terminated or exercised without replacement or rollover, or if its designation as a hedge is revoked,amounts previously recognized within other comprehensive income remain in equity until the forecast transaction occurs and are reclassified to theincome statement or to the initial carrying amount of a non-financial asset or liability as above.
Significant estimate or judgement: application of hedge accountingThe decision as to whether to apply hedge accounting within subsidiaries, and by equity-accounted entities, can have a significant impact on the group’sfinancial statements. Cash flow and fair value hedge accounting is applied to certain finance debt-related instruments in the normal course of businessand cash flow hedge accounting is applied to certain highly probable foreign currency transactions as part of the management of currency risk. Inaddition, the financial statements reflect the application of cash flow hedge accounting to certain of the contracts signed in October 2012 for BP to sellits investment in TNK-BP and obtain an additional shareholding in Rosneft, which were accounted for as derivatives under IFRS. The group applied ‘all-in-one’ cash flow hedge accounting to the contracts to acquire shares in Rosneft, resulting in a pre-tax loss of $2,061 million being recognized in othercomprehensive income in 2013 and a pre-tax gain of $1,410 million in 2012. See Note 15, Note 27, and Note 28 for further details.
Embedded derivatives
Derivatives embedded in other financial instruments or other host contracts are treated as separate derivatives when their risks and characteristics arenot closely related to those of the host contract. Contracts are assessed for embedded derivatives when the group becomes a party to them, includingat the date of a business combination. Embedded derivatives are measured at fair value at each balance sheet date. Any gains or losses arising fromchanges in fair value are taken directly to the income statement.
Fair value measurement
Fair value is the price that would be received to sell an asset or paid to transfer a liability in an orderly transaction between market participants. Thegroup categorizes assets and liabilities measured at fair value into one of three levels depending on the ability to observe inputs employed in theirmeasurement. Level 1 inputs are quoted prices in active markets for identical assets or liabilities. Level 2 inputs are inputs that are observable, eitherdirectly or indirectly, other than quoted prices included within level 1 for the asset or liability. Level 3 inputs are unobservable inputs for the asset orliability reflecting significant modifications to observable related market data or BP’s assumptions about pricing by market participants.
106 BP Annual Report and Form 20-F 2014
1. Significant accounting policies, judgements, estimates and assumptions – continued
Significant estimate or judgement: valuation of derivativesIn some cases the fair values of derivatives are estimated using internal models due to the absence of quoted prices or other observable, market-corroborated data. This applies to the group’s longer-term derivative contracts and certain options, as well as to the majority of the group’sembedded derivatives. These embedded derivatives arise primarily from long-term UK natural gas contracts that use pricing formulae not related togas prices, for example, oil product and power prices. The majority of these contracts are valued using models with inputs that include price curvesfor each of the different products that are built up from active market pricing data and extrapolated to the expiry of the contracts using the maximumavailable external pricing information. Additionally, where limited data exists for certain products, prices are interpolated using historic and long-termpricing relationships. Price volatility is also an input for the models.
Changes in the key assumptions could have a material impact on the fair value gains and losses on derivatives and embedded derivatives recognizedin the income statement. For more information see Note 28.
Offsetting of financial assets and liabilities
Financial assets and liabilities are presented gross in the balance sheet unless both of the following criteria are met: the group currently has a legallyenforceable right to set off the recognized amounts; and the group intends to either settle on a net basis or realize the asset and settle the liabilitysimultaneously. A right of set off is the group’s legal right to settle an amount payable to a creditor by applying against it an amount receivable from thesame counterparty. The relevant legal jurisdiction and laws applicable to the relationships between the parties are considered when assessing whethera current legally enforceable right to set off exists.
Provisions, contingencies and reimbursement assets
Provisions are recognized when the group has a present legal or constructive obligation as a result of a past event, it is probable that an outflow ofresources embodying economic benefits will be required to settle the obligation and a reliable estimate can be made of the amount of the obligation.Where appropriate, the future cash flow estimates are adjusted to reflect risks specific to the liability.
If the effect of the time value of money is material, provisions are determined by discounting the expected future cash flows at a pre-tax risk-free ratethat reflects current market assessments of the time value of money. Where discounting is used, the increase in the provision due to the passage oftime is recognized within finance costs. A provision is discounted using either a nominal discount rate of 2.75% (2013 3.25%) or a real discount rate of0.75% (2013 1%), as appropriate. Provisions are split between amounts expected to be settled within 12 months of the balance sheet date (current)and amounts expected to be settled later (non-current). Contingent liabilities are possible obligations whose existence will only be confirmed by futureevents not wholly within the control of the group, or present obligations where it is not probable that an outflow of resources will be required or theamount of the obligation cannot be measured with sufficient reliability.
Contingent liabilities are not recognized in the financial statements but are disclosed unless the possibility of an outflow of economic resources isconsidered remote.
Where the group makes contributions into a separately administered fund for restoration, environmental or other obligations, which it does not control,and the group’s right to the assets in the fund is restricted, the obligation to contribute to the fund is recognized as a liability where it is probable thatsuch additional contributions will be made. The group recognizes a reimbursement asset separately, being the lower of the amount of the associatedrestoration, environmental or other provision and the group’s share of the fair value of the net assets of the fund available to contributors.
Significant estimate or judgement: provision relating to the Gulf of Mexico oil spillDetailed information on the Gulf of Mexico oil spill, including the financial impacts, is provided in Note 2.
The provision recognized is the reliable estimate of expenditures required to settle certain present obligations at the end of the reporting period.There are future expenditures, however, for which it is not possible to measure the obligation reliably. These are not provided for and are disclosedas contingent liabilities. Accounting judgement is required to identify when a provision can be measured reliably, which can be especially challengingwhen complex litigation activities are ongoing.
In addition, for those provisions which are recognized, there is significant estimation uncertainty about the amounts that will ultimately be paid,especially with regard to amounts payable under the Deepwater Horizon Court Supervised Settlement Program (DHCSSP). A provision is made forthese costs when the amount can be measured reliably; this requires an analysis of claims received and processed and consideration of the statusof ongoing legal activity.
The provision for penalties under the US Clean Water Act is based on the estimated civil penalty for strict liability. This provision is calculated basedon the assumption that BP did not act with gross negligence or engage in wilful misconduct. However, in September 2014 the district court ruledthat the discharge of oil was the result of BP’s gross negligence and wilful misconduct and it is not now possible to determine a reliable estimate ofthe liability. The existing provision has been maintained as explained in Note 2 and a contingent liability has been disclosed in relation to the potentialfor a higher penalty due to this ruling. The amount that will become payable by BP is subject to a very high level of uncertainty since it will dependon the outcome of BP’s appeal of the September 2014 gross negligence ruling as well as what is determined by the court in the federal multi-districtlitigation proceedings in New Orleans (MDL 2179) with respect to the application of statutory penalty factors. See Note 2 for additional information.
DecommissioningLiabilities for decommissioning costs are recognized when the group has an obligation to plug and abandon a well, dismantle and remove a facility oran item of plant and to restore the site on which it is located, and when a reliable estimate of that liability can be made. Where an obligation exists for anew facility or item of plant, such as oil and natural gas production or transportation facilities, this liability will be recognized on construction orinstallation. Similarly, where an obligation exists for a well, this liability is recognized when it is drilled. An obligation for decommissioning may alsocrystallize during the period of operation of a well, facility or item of plant through a change in legislation or through a decision to terminate operations;an obligation may also arise in cases where an asset has been sold but the subsequent owner is no longer able to fulfil its decommissioningobligations, for example due to bankruptcy. The amount recognized is the present value of the estimated future expenditure determined in accordancewith local conditions and requirements. The provision for the costs of decommissioning wells, production facilities and pipelines at the end of theireconomic lives is estimated using existing technology, at current prices or future assumptions, depending on the expected timing of the activity, anddiscounted using the real discount rate. The weighted average period over which these costs are generally expected to be incurred is estimated to beapproximately 20 years.
An amount equivalent to the decommissioning provision is recognized as part of the corresponding intangible asset (in the case of an exploration orappraisal well) or property, plant and equipment. The decommissioning portion of the property, plant and equipment is subsequently depreciated at thesame rate as the rest of the asset.
Financial statements
BP Annual Report and Form 20-F 2014 107
1. Significant accounting policies, judgements, estimates and assumptions – continued
Other than the unwinding of discount on the provision, any change in the present value of the estimated expenditure is reflected as an adjustment tothe provision and the corresponding asset.
Environmental expenditures and liabilitiesEnvironmental expenditures that are required in order for the group to obtain future economic benefits from its assets are capitalized as part of thoseassets. Expenditures that relate to an existing condition caused by past operations that do not contribute to future earnings are expensed.
Liabilities for environmental costs are recognized when a clean-up is probable and the associated costs can be reliably estimated. Generally, the timingof recognition of these provisions coincides with the commitment to a formal plan of action or, if earlier, on divestment or on closure of inactive sites.
The amount recognized is the best estimate of the expenditure required to settle the obligation. Provisions for environmental liabilities have beenestimated using existing technology, at current prices and discounted using a real discount rate. The weighted average period over which these costsare generally expected to be incurred is estimated to be approximately five years.
Significant estimate or judgement: provisionsThe group holds provisions for the future decommissioning of oil and natural gas production facilities and pipelines at the end of their economic lives.The largest decommissioning obligations facing BP relate to the plugging and abandonment of wells and the removal and disposal of oil and naturalgas platforms and pipelines around the world. Most of these decommissioning events are many years in the future and the precise requirementsthat will have to be met when the removal event occurs are uncertain. Decommissioning technologies and costs are constantly changing, as well aspolitical, environmental, safety and public expectations. BP believes that the impact of any reasonably foreseeable change to these provisions on thegroup’s results of operations, financial position or liquidity will not be material. If oil and natural gas production facilities and pipelines are sold to thirdparties and the subsequent owner is unable to meet their decommissioning obligations, judgement must be used to determine whether BP is thenresponsible for decommissioning, and if so the extent of that responsibility. Consequently, the timing and amounts of future cash flows are subjectto significant uncertainty. Any changes in the expected future costs are reflected in both the provision and the asset.
Decommissioning provisions associated with downstream and petrochemicals facilities are generally not recognized, as the potential obligationscannot be measured, given their indeterminate settlement dates. The group performs periodic reviews of its downstream and petrochemicals long-lived assets for any changes in facts and circumstances that might require the recognition of a decommissioning provision.
The provision for environmental liabilities is estimated based on current legal and constructive requirements, technology, price levels and expectedplans for remediation. Actual costs and cash outflows can differ from estimates because of changes in laws and regulations, public expectations,prices, discovery and analysis of site conditions and changes in clean-up technology.
Other provisions and liabilities are recognized in the period when it becomes probable that there will be a future outflow of funds resulting from pastoperations or events and the amount of cash outflow can be reliably estimated. The timing of recognition and quantification of the liability require theapplication of judgement to existing facts and circumstances, which can be subject to change. Since the cash outflows can take place many years inthe future, the carrying amounts of provisions and liabilities are reviewed regularly and adjusted to take account of changing facts andcircumstances.
The timing and amount of future expenditures are reviewed annually, together with the interest rate used in discounting the cash flows. The interestrate used to determine the balance sheet obligation at the end of 2014 was a real rate of 0.75% (2013 1.0%), which was based on long-dated USgovernment bonds.
Provisions and contingent liabilities relating to the Gulf of Mexico oil spill are discussed in Note 2. Information about the group’s other provisions isprovided in Note 21. As further described in Note 21, the group is subject to claims and actions. The facts and circumstances relating to particularcases are evaluated regularly in determining whether it is probable that there will be a future outflow of funds and, once established, whether aprovision relating to a specific litigation should be established or revised. Accordingly, significant management judgement relating to provisions andcontingent liabilities is required, since the outcome of litigation is difficult to predict.
Employee benefits
Wages, salaries, bonuses, social security contributions, paid annual leave and sick leave are accrued in the period in which the associated services arerendered by employees of the group. Deferred bonus arrangements that have a vesting date more than 12 months after the balance sheet date arevalued on an actuarial basis using the projected unit credit method and amortized on a straight-line basis over the service period until the award vests.The accounting policies for share-based payments and for pensions and other post-retirement benefits are described below.
Share-based payments
Equity-settled transactionsThe cost of equity-settled transactions with employees is measured by reference to the fair value at the date at which equity instruments are grantedand is recognized as an expense over the vesting period, which ends on the date on which the employees become fully entitled to the award. Acorresponding credit is recognized within equity. Fair value is determined by using an appropriate, widely used, valuation model. In valuing equity-settled transactions, no account is taken of any vesting conditions, other than conditions linked to the price of the shares of the company (marketconditions). Non-vesting conditions, such as the condition that employees contribute to a savings-related plan, are taken into account in the grant-datefair value, and failure to meet a non-vesting condition, where this is within the control of the employee is treated as a cancellation and any remainingunrecognized cost is expensed.
Cash-settled transactionsThe cost of cash-settled transactions is recognized as an expense over the vesting period, measured by reference to the fair value of the correspondingliability which is recognized on the balance sheet. The liability is remeasured at fair value at each balance sheet date until settlement, with changes infair value recognized in the income statement.
Pensions and other post-retirement benefits
The cost of providing benefits under the group’s defined benefit plans is determined separately for each plan using the projected unit credit method, whichattributes entitlement to benefits to the current period to determine current service cost and to the current and prior periods to determine the present valueof the defined benefit obligation. Past service costs, resulting from either a plan amendment or a curtailment (a reduction in future obligations as a result ofa material reduction in the plan membership), are recognized immediately when the company becomes committed to a change.
Net interest expense relating to pensions and other post-retirement benefits, which is recognized in the income statement, represents the net changein present value of plan obligations and the value of plan assets resulting from the passage of time, and is determined by applying the discount rate tothe present value of the benefit obligation at the start of the year, and to the fair value of plan assets at the start of the year, taking into accountexpected changes in the obligation or plan assets during the year.
108 BP Annual Report and Form 20-F 2014
1. Significant accounting policies, judgements, estimates and assumptions – continued
Remeasurements of the defined benefit liability and asset, comprising actuarial gains and losses, and the return on plan assets (excluding amountsincluded in net interest described above) are recognized within other comprehensive income in the period in which they occur and are notsubsequently reclassified to profit and loss.
The defined benefit pension plan surplus or deficit in the balance sheet comprises the total for each plan of the present value of the defined benefitobligation (using a discount rate based on high quality corporate bonds), less the fair value of plan assets out of which the obligations are to be settleddirectly. Fair value is based on market price information and, in the case of quoted securities, is the published bid price. Defined benefit pension plansurpluses are only recognized to the extent they are recoverable.
Contributions to defined contribution plans are recognized in the income statement in the period in which they become payable.
Significant estimate or judgement: pensions and other post-retirement benefitsAccounting for pensions and other post-retirement benefits involves judgement about uncertain events, including estimated retirement dates, salarylevels at retirement, mortality rates, determination of discount rates for measuring plan obligations and net interest expense and assumptions forinflation rates.
These assumptions are based on the environment in each country. The assumptions used may vary from year to year, which would affect future netincome and net assets. Any differences between these assumptions and the actual outcome also affect future net income and net assets.
Pension and other post-retirement benefit assumptions are reviewed by management at the end of each year. These assumptions are used todetermine the projected benefit obligation at the year end and hence the surpluses and deficits recorded on the group’s balance sheet, and pensionand other post-retirement benefit expense for the following year.
The assumptions used are provided in Note 22.
The discount rate and inflation rate have a significant effect on the amounts reported. A sensitivity analysis of the impact of changes in theseassumptions on the benefit expense and obligation is provided in Note 22.
In addition to the financial assumptions, we regularly review the demographic and mortality assumptions. Mortality assumptions reflect best practicein the countries in which we provide pensions and have been chosen with regard to the latest available published tables adjusted where appropriateto reflect the experience of the group and an extrapolation of past longevity improvements into the future. A sensitivity analysis of the impact ofchanges in the mortality assumptions on the benefit expense and obligation is provided in Note 22.
Income taxes
Income tax expense represents the sum of current tax and deferred tax. Interest and penalties relating to income tax are also included in the incometax expense.
Income tax is recognized in the income statement, except to the extent that it relates to items recognized in other comprehensive income or directly inequity, in which case the related tax is recognized in other comprehensive income or directly in equity.
Current tax is based on the taxable profit for the period. Taxable profit differs from net profit as reported in the income statement because it isdetermined in accordance with the rules established by the applicable taxation authorities. It therefore excludes items of income or expense that aretaxable or deductible in other periods as well as items that are never taxable or deductible. The group’s liability for current tax is calculated using taxrates and laws that have been enacted or substantively enacted by the balance sheet date.
Deferred tax is provided, using the liability method, on all temporary differences at the balance sheet date between the tax bases of assets andliabilities and their carrying amounts for financial reporting purposes.
Deferred tax liabilities are recognized for all taxable temporary differences except:
• where the deferred tax liability arises on the initial recognition of goodwill; or• where the deferred tax liability arises on the initial recognition of an asset or liability in a transaction that is not a business combination and, at the
time of the transaction, affects neither accounting profit nor taxable profit or loss; or• in respect of taxable temporary differences associated with investments in subsidiaries and associates and interests in joint arrangements, where
the group is able to control the timing of the reversal of the temporary differences and it is probable that the temporary differences will not reverse inthe foreseeable future.
Deferred tax assets are recognized for all deductible temporary differences, carry-forward of unused tax credits and unused tax losses, to the extentthat it is probable that taxable profit will be available against which the deductible temporary differences and the carry-forward of unused tax creditsand unused tax losses can be utilized except where the deferred tax asset relating to the deductible temporary difference arises from the initialrecognition of an asset or liability in a transaction that is not a business combination and, at the time of the transaction, affects neither accounting profitnor taxable profit or loss. In respect of deductible temporary differences associated with investments in subsidiaries and associates and interests injoint arrangements, deferred tax assets are recognized only to the extent that it is probable that the temporary differences will reverse in theforeseeable future and taxable profit will be available against which the temporary differences can be utilized.
The carrying amount of deferred tax assets is reviewed at each balance sheet date and reduced to the extent that it is no longer probable that sufficienttaxable profit will be available to allow all or part of the deferred tax asset to be utilized.
Deferred tax assets and liabilities are measured at the tax rates that are expected to apply in the period when the asset is realized or the liability issettled, based on tax rates (and tax laws) that have been enacted or substantively enacted at the balance sheet date. Deferred tax assets and liabilitiesare not discounted.
Deferred tax assets and liabilities are offset only when there is a legally enforceable right to set off current tax assets against current tax liabilities andwhen the deferred tax assets and liabilities relate to income taxes levied by the same taxation authority on either the same taxable entity or differenttaxable entities where there is an intention to settle the current tax assets and liabilities on a net basis or to realize the assets and settle the liabilitiessimultaneously.
Financial statements
BP Annual Report and Form 20-F 2014 109
1. Significant accounting policies, judgements, estimates and assumptions – continued
Significant estimate or judgement: income taxesThe computation of the group’s income tax expense and liability involves the interpretation of applicable tax laws and regulations in manyjurisdictions throughout the world. The resolution of tax positions taken by the group, through negotiations with relevant tax authorities or throughlitigation, can take several years to complete and in some cases it is difficult to predict the ultimate outcome. Therefore, judgement is required todetermine provisions for income taxes.
In addition, the group has carry-forward tax losses and tax credits in certain taxing jurisdictions that are available to offset against future taxableprofit. However, deferred tax assets are recognized only to the extent that it is probable that taxable profit will be available against which the unusedtax losses or tax credits can be utilized. Management judgement is exercised in assessing whether this is the case.
To the extent that actual outcomes differ from management’s estimates, income tax charges or credits, and changes in current and deferred taxassets or liabilities, may arise in future periods. For more information see Note 7.
Judgement is also required when determining whether a particular tax is an income tax or another type of tax (for example a production tax).Accounting for deferred tax is applied to income taxes as described above, but is not applied to other types of taxes; rather such taxes arerecognized in the income statement on an appropriate basis.
Customs duties and sales taxes
Customs duties and sales taxes which are passed on to customers are excluded from revenues and expenses. Assets and liabilities are recognized netof the amount of customs duties or sales tax except:
• Where the customs duty or sales taxes incurred on a purchase of goods and services is not recoverable from the taxation authority, in which casethe customs duty or sales tax is recognized as part of the cost of acquisition of the asset.
• Receivables and payables are stated with the amount of customs duty or sales tax included.
The net amount of sales tax recoverable from, or payable to, the taxation authority is included within receivables or payables in the balance sheet.
Own equity instruments
The group’s holdings in its own equity instruments are shown as deductions from shareholders’ equity at cost. For accounting purposes, own equityinstruments include both treasury shares and shares purchased from the open market. Some of these own equity instruments are held by EmployeeShare Ownership Plans (ESOPs), including certain shares transferred out of treasury. Consideration, if any, received for the sale of such shares is alsorecognized in equity, with any difference between the proceeds from sale and the original cost being taken to the profit and loss account reserve. Nogain or loss is recognized in the income statement on the purchase, sale, issue or cancellation of equity shares. Shares repurchased under the sharebuy-back programme which are immediately cancelled are not shown as treasury shares, but are shown as a deduction from the profit and lossaccount reserve in the group statement of changes in equity.
Revenue
Revenue arising from the sale of goods is recognized when the significant risks and rewards of ownership have passed to the buyer, which is typicallyat the point that title passes, and the revenue can be reliably measured.
Revenue is measured at the fair value of the consideration received or receivable and represents amounts receivable for goods provided in the normalcourse of business, net of discounts, customs duties and sales taxes.
Physical exchanges are reported net, as are sales and purchases made with a common counterparty, as part of an arrangement similar to a physicalexchange. Similarly, where the group acts as agent on behalf of a third party to procure or market energy commodities, any associated fee income isrecognized but no purchase or sale is recorded. Additionally, where forward sale and purchase contracts for oil, natural gas or power have beendetermined to be for trading purposes, the associated sales and purchases are reported net within sales and other operating revenues whether or notphysical delivery has occurred.
Generally, revenues from the production of oil and natural gas properties in which the group has an interest with joint operation partners are recognizedon the basis of the group’s working interest in those properties (the entitlement method). Differences between the production sold and the group’sshare of production are not significant.
Interest income is recognized as the interest accrues (using the effective interest rate that is the rate that exactly discounts estimated future cashreceipts through the expected life of the financial instrument to the net carrying amount of the financial asset).
Dividend income from investments is recognized when the shareholders’ right to receive the payment is established.
Finance costs
Finance costs directly attributable to the acquisition, construction or production of qualifying assets, which are assets that necessarily take a substantialperiod of time to get ready for their intended use, are added to the cost of those assets until such time as the assets are substantially ready for theirintended use. All other finance costs are recognized in the income statement in the period in which they are incurred.
Impact of new International Financial Reporting Standards
There are no new or amended standards or interpretations adopted during the year that have a significant impact on the financial statements.
Not yet adoptedThe following pronouncements from the IASB will become effective for future financial reporting periods and have not yet been adopted by the group.
The IASB issued IFRS 15 ‘Revenue from Contracts with Customers’, which provides a single model for accounting for revenue arising from contractswith customers and is effective for annual periods beginning on or after 1 January 2017. IFRS 15 will supersede IAS 18 ‘Revenue’.
The IASB has also issued IFRS 9 ‘Financial Instruments’, which will supersede IAS 39 ‘Financial Instruments: Recognition and Measurement’ and iseffective for annual periods beginning on or after 1 January 2018. IFRS 9 covers classification and measurement of financial assets and financialliabilities, impairment methodology and hedge accounting.
BP has not yet decided the date of adoption for the group for IFRS 15 and IFRS 9 and has not yet completed its evaluation of the effect of adoption.The EU has not yet adopted IFRS 15 or IFRS 9.
There are no other standards and interpretations in issue but not yet adopted that the directors anticipate will have a material effect on the reportedincome or net assets of the group.
110 BP Annual Report and Form 20-F 2014
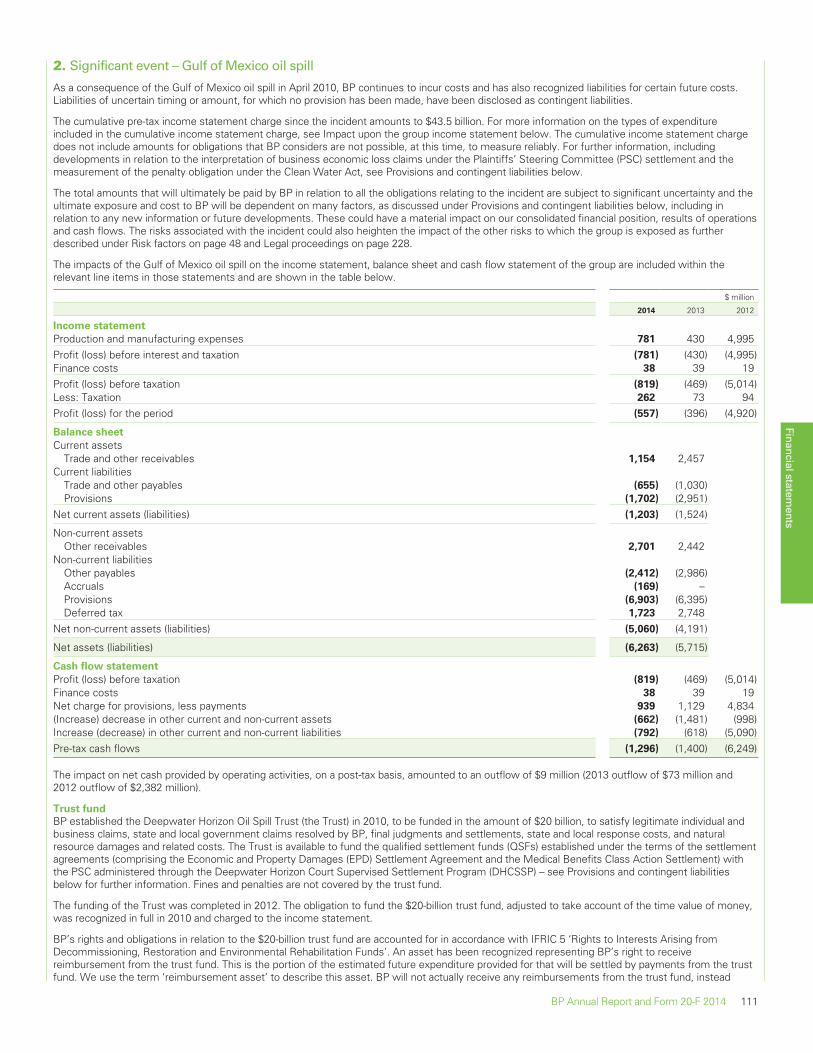
2. Significant event – Gulf of Mexico oil spill
As a consequence of the Gulf of Mexico oil spill in April 2010, BP continues to incur costs and has also recognized liabilities for certain future costs.Liabilities of uncertain timing or amount, for which no provision has been made, have been disclosed as contingent liabilities.
The cumulative pre-tax income statement charge since the incident amounts to $43.5 billion. For more information on the types of expenditureincluded in the cumulative income statement charge, see Impact upon the group income statement below. The cumulative income statement chargedoes not include amounts for obligations that BP considers are not possible, at this time, to measure reliably. For further information, includingdevelopments in relation to the interpretation of business economic loss claims under the Plaintiffs’ Steering Committee (PSC) settlement and themeasurement of the penalty obligation under the Clean Water Act, see Provisions and contingent liabilities below.
The total amounts that will ultimately be paid by BP in relation to all the obligations relating to the incident are subject to significant uncertainty and theultimate exposure and cost to BP will be dependent on many factors, as discussed under Provisions and contingent liabilities below, including inrelation to any new information or future developments. These could have a material impact on our consolidated financial position, results of operationsand cash flows. The risks associated with the incident could also heighten the impact of the other risks to which the group is exposed as furtherdescribed under Risk factors on page 48 and Legal proceedings on page 228.
The impacts of the Gulf of Mexico oil spill on the income statement, balance sheet and cash flow statement of the group are included within therelevant line items in those statements and are shown in the table below.
$ million
2014 2013 2012
Income statement
Production and manufacturing expenses 781 430 4,995Profit (loss) before interest and taxation (781) (430) (4,995)Finance costs 38 39 19Profit (loss) before taxation (819) (469) (5,014)Less: Taxation 262 73 94Profit (loss) for the period (557) (396) (4,920)
Balance sheet
Current assetsTrade and other receivables 1,154 2,457
Current liabilitiesTrade and other payables (655) (1,030)Provisions (1,702) (2,951)
Net current assets (liabilities) (1,203) (1,524)
Non-current assetsOther receivables 2,701 2,442
Non-current liabilitiesOther payables (2,412) (2,986)Accruals (169) –Provisions (6,903) (6,395)Deferred tax 1,723 2,748
Net non-current assets (liabilities) (5,060) (4,191)
Net assets (liabilities) (6,263) (5,715)
Cash flow statement
Profit (loss) before taxation (819) (469) (5,014)Finance costs 38 39 19Net charge for provisions, less payments 939 1,129 4,834(Increase) decrease in other current and non-current assets (662) (1,481) (998)Increase (decrease) in other current and non-current liabilities (792) (618) (5,090)Pre-tax cash flows (1,296) (1,400) (6,249)
The impact on net cash provided by operating activities, on a post-tax basis, amounted to an outflow of $9 million (2013 outflow of $73 million and2012 outflow of $2,382 million).
Trust fund
BP established the Deepwater Horizon Oil Spill Trust (the Trust) in 2010, to be funded in the amount of $20 billion, to satisfy legitimate individual andbusiness claims, state and local government claims resolved by BP, final judgments and settlements, state and local response costs, and naturalresource damages and related costs. The Trust is available to fund the qualified settlement funds (QSFs) established under the terms of the settlementagreements (comprising the Economic and Property Damages (EPD) Settlement Agreement and the Medical Benefits Class Action Settlement) withthe PSC administered through the Deepwater Horizon Court Supervised Settlement Program (DHCSSP) – see Provisions and contingent liabilitiesbelow for further information. Fines and penalties are not covered by the trust fund.
The funding of the Trust was completed in 2012. The obligation to fund the $20-billion trust fund, adjusted to take account of the time value of money,was recognized in full in 2010 and charged to the income statement.
BP’s rights and obligations in relation to the $20-billion trust fund are accounted for in accordance with IFRIC 5 ‘Rights to Interests Arising fromDecommissioning, Restoration and Environmental Rehabilitation Funds’. An asset has been recognized representing BP’s right to receivereimbursement from the trust fund. This is the portion of the estimated future expenditure provided for that will be settled by payments from the trustfund. We use the term ‘reimbursement asset’ to describe this asset. BP will not actually receive any reimbursements from the trust fund, instead
Financial statements
BP Annual Report and Form 20-F 2014 111
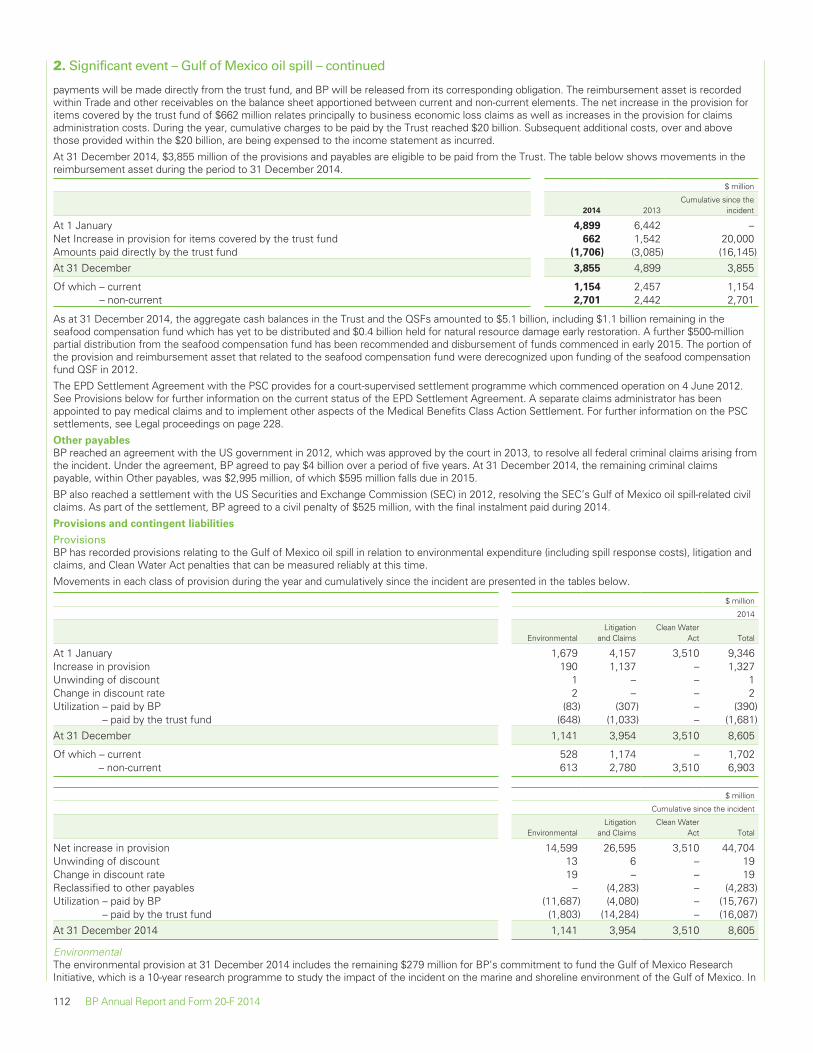
2. Significant event – Gulf of Mexico oil spill – continued
payments will be made directly from the trust fund, and BP will be released from its corresponding obligation. The reimbursement asset is recordedwithin Trade and other receivables on the balance sheet apportioned between current and non-current elements. The net increase in the provision foritems covered by the trust fund of $662 million relates principally to business economic loss claims as well as increases in the provision for claimsadministration costs. During the year, cumulative charges to be paid by the Trust reached $20 billion. Subsequent additional costs, over and abovethose provided within the $20 billion, are being expensed to the income statement as incurred.
At 31 December 2014, $3,855 million of the provisions and payables are eligible to be paid from the Trust. The table below shows movements in thereimbursement asset during the period to 31 December 2014.
$ million
2014 2013Cumulative since the
incident
At 1 January 4,899 6,442 –Net Increase in provision for items covered by the trust fund 662 1,542 20,000Amounts paid directly by the trust fund (1,706) (3,085) (16,145)At 31 December 3,855 4,899 3,855
Of which – current 1,154 2,457 1,154– non-current 2,701 2,442 2,701
As at 31 December 2014, the aggregate cash balances in the Trust and the QSFs amounted to $5.1 billion, including $1.1 billion remaining in theseafood compensation fund which has yet to be distributed and $0.4 billion held for natural resource damage early restoration. A further $500-millionpartial distribution from the seafood compensation fund has been recommended and disbursement of funds commenced in early 2015. The portion ofthe provision and reimbursement asset that related to the seafood compensation fund were derecognized upon funding of the seafood compensationfund QSF in 2012.
The EPD Settlement Agreement with the PSC provides for a court-supervised settlement programme which commenced operation on 4 June 2012.See Provisions below for further information on the current status of the EPD Settlement Agreement. A separate claims administrator has beenappointed to pay medical claims and to implement other aspects of the Medical Benefits Class Action Settlement. For further information on the PSCsettlements, see Legal proceedings on page 228.
Other payables
BP reached an agreement with the US government in 2012, which was approved by the court in 2013, to resolve all federal criminal claims arising fromthe incident. Under the agreement, BP agreed to pay $4 billion over a period of five years. At 31 December 2014, the remaining criminal claimspayable, within Other payables, was $2,995 million, of which $595 million falls due in 2015.
BP also reached a settlement with the US Securities and Exchange Commission (SEC) in 2012, resolving the SEC’s Gulf of Mexico oil spill-related civilclaims. As part of the settlement, BP agreed to a civil penalty of $525 million, with the final instalment paid during 2014.
Provisions and contingent liabilities
ProvisionsBP has recorded provisions relating to the Gulf of Mexico oil spill in relation to environmental expenditure (including spill response costs), litigation andclaims, and Clean Water Act penalties that can be measured reliably at this time.
Movements in each class of provision during the year and cumulatively since the incident are presented in the tables below.
$ million
2014
EnvironmentalLitigation
and ClaimsClean Water
Act Total
At 1 January 1,679 4,157 3,510 9,346Increase in provision 190 1,137 – 1,327Unwinding of discount 1 – – 1Change in discount rate 2 – – 2Utilization – paid by BP (83) (307) – (390)
– paid by the trust fund (648) (1,033) – (1,681)At 31 December 1,141 3,954 3,510 8,605
Of which – current 528 1,174 – 1,702– non-current 613 2,780 3,510 6,903
$ million
Cumulative since the incident
EnvironmentalLitigation
and ClaimsClean Water
Act Total
Net increase in provision 14,599 26,595 3,510 44,704Unwinding of discount 13 6 – 19Change in discount rate 19 – – 19Reclassified to other payables – (4,283) – (4,283)Utilization – paid by BP (11,687) (4,080) – (15,767)
– paid by the trust fund (1,803) (14,284) – (16,087)At 31 December 2014 1,141 3,954 3,510 8,605
EnvironmentalThe environmental provision at 31 December 2014 includes the remaining $279 million for BP’s commitment to fund the Gulf of Mexico ResearchInitiative, which is a 10-year research programme to study the impact of the incident on the marine and shoreline environment of the Gulf of Mexico. In
112 BP Annual Report and Form 20-F 2014
2. Significant event – Gulf of Mexico oil spill – continued
addition, BP faces claims under the Oil Pollution Act of 1990 (OPA 90) for natural resource damages. These damages include, among other things, thereasonable costs of assessing the injury to natural resources. During 2011, BP entered into a framework agreement with natural resource trustees forthe United States and five Gulf-coast states, providing for up to $1 billion to be spent on early restoration projects to address natural resource injuriesresulting from the oil spill, to be funded from the $20-billion trust fund. In 2012, work began on the initial set of early restoration projects identifiedunder this framework and during 2014, Phase 3 of the early restoration projects was formally agreed, comprising $627 million of approved projectspend (of which $563 million has been paid). At 31 December 2014, the remaining amount provided for natural resource damage assessment costsand early restoration projects was $798 million. Until the size, location and duration of the impact is assessed, it is not possible to estimate reliablyeither the amounts or timing of the remaining natural resource damages claims other than the assessment and early restoration costs noted above,therefore no additional amounts have been provided for these items and they are disclosed as a contingent liability.
Litigation and claimsThe litigation and claims provision includes amounts that can be estimated reliably for the future cost of settling claims by individuals and businessesfor damage to real or personal property, lost profits or impairment of earning capacity and loss of subsistence use of natural resources (‘Individual andBusiness Claims’), and claims by state and local government entities for removal costs, damage to real or personal property, loss of governmentrevenue and increased public services costs, under OPA 90 and other legislation (‘State and Local Claims’), except as described under Contingentliabilities below. Claims administration costs and legal costs, including legal costs under indemnification agreements, have also been provided for.The timing of payment of litigation and claims provisions classified as non-current is dependent upon ongoing legal activity and is therefore uncertain.
BP has provided for its best estimate of the cost associated with the PSC settlement agreements with the exception of the cost of business economicloss claims, which are provided for where an eligibility notice had been issued before the end of the month following the balance sheet date and is notsubject to appeal by BP within the claims facility. As disclosed in BP Annual Report and Form 20-F 2013, as part of its monitoring of payments made bythe DHCSSP, BP identified multiple business economic loss claim determinations that appeared to result from an interpretation of the Economic andProperty Damages Settlement Agreement (EPD Settlement Agreement) by the claims administrator that BP believes was incorrect.
During 2014, there were various rulings on matters relating to the interpretation of the EPD Settlement Agreement, in particular on the issue ofmatching revenue and expenses as well as causation requirements of the EPD Settlement Agreement.
In March 2014, the US Court of Appeals for the Fifth Circuit (the Fifth Circuit) affirmed the district court’s ruling that the EPD Settlement Agreementcontained no causation requirement beyond the revenue and related tests set out in an exhibit to that agreement. In March 2014, BP filed a petitionthat all the active judges of the Fifth Circuit review the decision; in May 2014 this was denied. The district court dissolved the injunction that had haltedthe processing and payment of business economic loss claims and instructed the claims administrator to resume the processing and payment ofclaims. BP sought review by the US Supreme Court (Supreme Court) of the Fifth Circuit’s decisions relating to compensation of claims for losses withno apparent connection to the Deepwater Horizon spill. In December 2014, the Supreme Court declined to review BP’s petition. As a result, the finaldeadline for filing claims in the Economic and Property Damages Settlement is 8 June 2015.
Management believes that no reliable estimate can currently be made of any business economic loss claims (i) not yet received; (ii) received, but not yetprocessed; or (iii) processed, but not yet paid, except where an eligibility notice had been issued before the end of the month following the balance sheetdate and is not subject to appeal by BP within the claims facility. The inability to estimate reliably such claims is due to uncertainty regarding both thevolume of such claims and the average value per claim.
In respect of uncertainty regarding the volume of claims, in December 2014, the Supreme Court declined to hear BP’s appeal of the district court rulingthat the EPD Settlement Agreement contained no causation requirement beyond the revenue and related tests set forth in that agreement. Thisresolution, however, does not reduce uncertainty in the short term regarding the volume of claims, since it is possible that additional claims will bemade. In addition, a claims submission deadline of 8 June 2015 has now been set, which may lead to an increase in the rate of claims received untilthe deadline, compounding management’s inability to estimate the total volume of claims that will be made.
In respect of uncertainty regarding the average value per claim, a small proportion of the filed claims have been determined under the revised policy forthe matching of revenue and expenses for business economic loss claims (introduced in May 2014) and disputes, disagreements, and uncertaintiesregarding the proper application of the revised policy to particular claims and categories of claims continue to arise as the claims administrator hasbegun applying the revised policy. Furthermore, there have been no, or only a small number of, claim determinations made under some of thespecialized frameworks that have been put in place for particular industries and so determinations to date may not be representative of the totalpopulation of claims. In addition, due to a data secrecy order, detailed data about claims that have not yet been determined is not currently available toBP and so it is not possible to review claim demographics or identify potential populations for each category of claim.
There is therefore very little data to build up a track record of claims determinations under the policies and protocols that are now being appliedfollowing resolution of the matching and causation issues. We therefore cannot estimate future trends of the number and proportion of claims that willbe determined to be eligible, nor can we estimate the value of such claims. A provision for such business economic loss claims will be establishedwhen these uncertainties are resolved and a reliable estimate can be made of the liability.
The current estimate for the total cost of those elements of the PSC settlement that BP considers can be reliably estimated is $9.9 billion. TheDHCSSP has issued eligibility notices, most of which are disputed by BP, in respect of business economic loss claims of approximately $400 millionwhich have not been provided for. The majority of these claims are being re-assessed using the new matching policy. Furthermore, a significantnumber of business economic loss claims have been received but have not yet been processed, and further claims are likely to be received. The totalcost of the PSC settlement is likely to be significantly higher than the amount recognized to date of $9.9 billion because the current estimate does notreflect business economic loss claims not yet received, or received but not yet processed, or processed but not yet paid, except where an eligibilitynotice had been issued before the end of the month following the balance sheet date and is not subject to appeal by BP within the claims facility.
The provision recognized for litigation and claims includes an estimate for State and Local Claims. Although the provision recognized is BP’s currentreliable best estimate of the amount required to settle these obligations, significant uncertainty exists in relation to the outcome of any litigationproceedings and the amount of claims that will become payable by BP.
Significant uncertainties exist in relation to the amount of claims that are to be paid and will become payable, including claims payable under theDHCSSP and State and Local Claims. There is significant uncertainty in relation to the amounts that ultimately will be paid in relation to current claims,and the number, type and amounts payable for claims not yet reported as described above and in Legal proceedings on page 228 and the outcomes ofany further litigation including in relation to potential opt-outs from the PSC settlement or otherwise. There is also uncertainty as to the cost ofadministering the claims process under the DHCSSP and in relation to future legal costs.
See Legal proceedings on page 228 and Contingent liabilities below for further details.
Financial statements
BP Annual Report and Form 20-F 2014 113
2. Significant event – Gulf of Mexico oil spill – continued
Clean Water Act penaltiesA provision of $3,510 million was recognized in 2010 for estimated civil penalties under Section 311 of the Clean Water Act. At the time the provisionfor the Clean Water Act penalty was made, the number of barrels of oil spilled was determined by using the mid-point (47,500 barrels per day) of therange of estimates (35,000 to 60,000 barrels per day) from the intra-agency Flow Rate Technical Group created by the National Incident Commander incharge of the spill response. The initial estimate of 3.2 million barrels was calculated using a total flow of 47,500 barrels per day multiplied by the85 days from 22 April 2010 to 15 July 2010 less an estimate of the amount captured on the surface (approximately 850,000 barrels). This estimateddischarge volume was then multiplied by $1,100 per barrel – the maximum amount the statute allows in the absence of gross negligence or wilfulmisconduct – for the purposes of estimating a potential penalty. This resulted in a provision of $3,510 million for potential penalties under Section 311.
The estimates of cumulative discharge presented by experts testifying in the Phase 2 trial varied significantly. In January 2015, the district court issuedits decision in the Phase 2 trial that 3.19 million barrels of oil were discharged into the Gulf of Mexico and therefore subject to a Clean Water Actpenalty. This amount is consistent with the number of barrels BP has used to calculate the provision. In addition, the district court found that BP wasnot grossly negligent in its source control efforts. BP and other parties to the proceedings have filed notices of appeal of the Phase 2 ruling andtherefore the findings from the Phase 2 trial remain subject to uncertainty.
In September 2014, the district court issued its decision in the Phase 1 trial that the discharge of oil was the result of the gross negligence and wilfulmisconduct of BP Exploration & Production Inc. (BPXP) and that BPXP is therefore subject to enhanced civil penalties. The statutory maximum penaltyis up to $4,300 per barrel of oil discharged where gross negligence or wilful misconduct is proven. BP does not believe that the evidence at trialsupports a finding of gross negligence and wilful misconduct and in December 2014 filed notice of appeal of the Phase 1 ruling.
As a result of the September 2014 district court ruling that the discharge of oil was the result of BP’s gross negligence and wilful misconduct, theClean Water Act penalty obligation is not considered to be reliably measurable and it is therefore no longer possible to determine a best estimate of theClean Water Act penalty provision. Under IFRS, a provision is reversed when it is no longer probable that an outflow of resources will be required tosettle the obligation. With regard to the Clean Water Act penalty obligation, it continues to be probable that there will be an outflow of resources andtherefore, in the absence of the ability to identify the best estimate of the liability, the previously recognized provision of $3,510 million has beenmaintained. Note 1 – Provisions, contingencies and reimbursement assets identifies the significant accounting estimates and judgements made inrelation to the Clean Water Act provision.
BP continues to believe that a provision of $3,510 million represents a reliable estimate of the amount of the liability if the appeal is successful. If BP isunsuccessful in its appeal, and the ruling of gross negligence and wilful misconduct is upheld, the maximum penalty that could be imposed is up to$4,300 per barrel. Based upon this penalty rate and the district court’s ruling on the number of barrels spilled, which, as noted above is also subject toappeal, the maximum penalty could be up to $13.7 billion.
However, in assessing the amount of the penalty, the court is directed to consider the following statutory penalty factors: ‘the seriousness of theviolation or violations, the economic benefit to the violator, if any, resulting from the violation, the degree of culpability involved, any other penalty forthe same incident, any history of prior violations, the nature, extent, and degree of success of any efforts of the violator to minimize or mitigate theeffects of the discharge, the economic impact of the penalty on the violator, and any other matters as justice may require’. The court has widediscretion in deciding how to apply these factors to determine the penalty and what weighting to ascribe to different factors. BP is therefore unable toascribe probabilities to possible outcomes within the range of potential penalties and cannot determine a reliable estimate for any additional penaltywhich might apply should the gross negligence finding be upheld. The trial phase to determine the amount of the Clean Water Act penalty commencedon 20 January 2015.
The amount that may become payable by BP is subject to a very high level of uncertainty since it will depend on the outcome of BP’s appeals as wellas what is determined by the district court with respect to the application of statutory penalty factors as noted above. The court has wide discretion inthe application of statutory penalty factors. The timing of any payment is also uncertain.
Given the significant uncertainty, the very wide range of possible outcomes if BP is unsuccessful in this appeal of the September ruling, and theinability to ascribe probabilities to possible outcomes within the range, management is not able to estimate reliably any further liability for the CleanWater Act penalty arising in the event that BP is not successful in its appeal. A contingent liability is therefore disclosed. See Contingent liabilitiesbelow for further information.
Provision movementsThe total amount recognized as an increase in provisions during the year was $1,327 million. After deducting amounts utilized during the year totalling$2,071 million, including payments from the trust fund of $1,681 million and payments made directly by BP of $390 million (2013 $3,777 million,including payments from the trust fund of $3,051 million and payments made directly by BP of $726 million), and after adjustments for discounting, theremaining provision as at 31 December 2014 was $8,605 million (2013 $9,346 million).
The total amounts that will ultimately be paid by BP for all obligations relating to the incident are subject to significant uncertainty and the ultimateexposure and cost to BP will be dependent on many factors. Furthermore, significant uncertainty exists in relation to the amount of claims that willbecome payable by BP, the amount of fines that will ultimately be levied on BP, the outcome of litigation and arbitration proceedings, and any costsarising from any longer-term environmental consequences of the oil spill, which will also impact upon the ultimate cost for BP. The amount and timingof any amounts payable could also be impacted by any further settlements which may or may not occur. Although the provision recognized is thecurrent best reliable estimate of expenditures required to settle certain present obligations at the end of the reporting period, there are futureexpenditures for which it is not possible to measure the obligation reliably.
Contingent liabilities
BP has provided for its best estimate of amounts expected to be paid that can be measured reliably. It is not possible, at this time, to measure reliablyother obligations arising from the incident, nor is it practicable to estimate their magnitude or possible timing of payment. Therefore, no amounts havebeen provided for these obligations as at 31 December 2014.
114 BP Annual Report and Form 20-F 2014
2. Significant event – Gulf of Mexico oil spill – continued
Natural resource damage claimsAs described above in Provisions, a provision has been made for natural resource damage assessment and early restoration projects under the$1-billion framework agreement. Natural resource damages resulting from the oil spill are currently being assessed. BP and the federal and statetrustees are collecting extensive data in order to assess the extent of damage to wildlife, shoreline, near shore and deepwater habitats, andrecreational uses, among other things. The study data will inform an assessment of injury to the Gulf Coast natural resources and the development of arestoration plan to address the identified injuries.
Detailed analysis and interpretation continue on the data that have been collected. Any early restoration projects undertaken pursuant to the $1-billionframework agreement could mitigate the total damages resulting from the incident. Accordingly, until the size, location and duration of the impact isassessed, it is not possible to estimate reliably either the amounts or timing of the remaining natural resource damage claims and associated legalcosts, therefore no such amounts have been provided as at 31 December 2014.
Business economic loss claims under the PSC settlementBP identified multiple business economic loss claim determinations under the PSC settlement that appeared to result from an interpretation of the EPDSettlement Agreement by the claims administrator that BP believes was incorrect. The potential cost of business economic loss claims not yetreceived, processed and paid (except where an eligibility notice had been issued before the end of the month following the balance sheet date and isnot subject to appeal by BP within the claims facility) is not provided for and is disclosed as a contingent liability. A significant number of businesseconomic loss claims have been received but have not yet been processed and paid and further claims are likely to be received. See Provisions abovefor further information.
State and Local claimsAs described above in Provisions, a provision has been made for State and Local claims that can be measured reliably. The States of Alabama,Mississippi, Florida, Louisiana and Texas submitted or asserted claims to BP under OPA 90 for alleged losses including economic losses and propertydamage as a result of the Gulf of Mexico oil spill. The amounts claimed, certain of which include punitive damages or other multipliers, are verysubstantial. However, BP considers these claims unsubstantiated and the methodologies used to calculate these claims to be seriously flawed, notsupported by OPA 90, not supported by documentation, and to substantially overstate the claims. Similar claims have also been submitted by variouslocal government entities and a foreign government under OPA 90. The amounts alleged in the submissions for these State and Local Claims totalapproximately $35 billion. BP will defend vigorously against these claims if adjudicated at trial; the timing of any outflow of resources in relation to Stateand Local claims is dependent on the timing of the court process in relation to these claims.
Clean Water Act penaltiesA provision has been maintained for BP’s obligation under the Clean Water Act, as described above in Provisions. Any obligation in relation to anyfurther liability for the Clean Water Act penalty arising in the event that BP is not successful in its appeal of the Phase 1 ruling is disclosed as acontingent liability. The trial phase to determine the amount of the Clean Water Act penalty commenced in January 2015 and post-trial briefing isscheduled to complete in April 2015. BP does not know when the district court will rule on the Penalty Phase of the trial and so the timing of anypayment continues to be uncertain.
Securities-related litigationProceedings relating to securities class actions (MDL 2185) pending in federal court in Texas, including a purported class action on behalf of purchasersof American Depositary Shares under US federal securities law, are continuing. A jury trial is scheduled to begin in January 2016 and the timing of anyoutflow of resources, if any, is dependent on the duration of the court process. No reliable estimate can be made of the amounts that may be payablein relation to these proceedings, if any, so no provision has been recognized at 31 December 2014. In addition, no reliable estimate can be made of theamounts that may be payable in relation to any other securities litigation, if any, so no provision has been recognized at 31 December 2014.
Other litigationIn addition to the State and Local claims and securities class actions described above, BP is named as a defendant in approximately 3,000 other civillawsuits brought by individuals, corporations and government entities in US federal and state courts, as well as certain non-US jurisdictions, resultingfrom the Deepwater Horizon accident, the Gulf of Mexico oil spill, and the spill response efforts. Further actions are likely to be brought. Among otherclaims, these lawsuits assert claims for personal injury or wrongful death in connection with the accident and the spill response, commercial andeconomic injury, damage to real and personal property, breach of contract and violations of statutes, including, but not limited to, alleged violations ofUS securities and environmental statutes. In addition, claims have been received, primarily from business claimants, under OPA 90 in relation to the2010 federal deepwater drilling moratoria. Until further fact and expert disclosures occur, court rulings clarify the issues in dispute, liability and damagetrial activity nears or progresses, or other actions such as further possible settlements occur, it is not possible given these uncertainties to arrive at arange of outcomes or a reliable estimate of the liabilities that may accrue to BP in connection with or as a result of these lawsuits, nor it is possible todetermine the timing of any payment that may arise. Therefore no amounts have been provided for these items as at 31 December 2014.
It is not possible to measure reliably any obligation in relation to other litigation or potential fines and penalties. There are a number of federal and stateenvironmental and other provisions of law, other than the Clean Water Act, under which one or more governmental agencies could seek civil fines andpenalties from BP. For example, a complaint filed by the United States sought to reserve the ability to seek penalties and other relief under a number ofother laws. Given the unsubstantiated nature of certain claims that may be asserted, it is not possible at this time to determine whether and to whatextent any such claims would be successful or what penalties or fines would be assessed. Therefore no amounts have been provided for these items.
Settlement and other agreementsUnder the settlement agreements with Anadarko and MOEX, and with Cameron International, the designer and manufacturer of the DeepwaterHorizon blowout preventer, BP has agreed to indemnify Anadarko, MOEX and Cameron for certain claims arising from the accident. It is thereforepossible that BP may face claims under these indemnities, but it is not currently possible to reliably measure, nor identify the timing of, any obligationin relation to such claims and therefore no amount has been provided as at 31 December 2014. There are also agreements indemnifying certain third-party contractors in relation to litigation costs and certain other claims. A contingent liability is also disclosed in relation to other obligations under theseagreements.
The magnitude and timing of all possible obligations in relation to the Gulf of Mexico oil spill continue to be subject to a very high degree of uncertaintyas described further in Risk factors on page 48. Any such possible obligations are therefore contingent liabilities and, at present, it is not practicable toestimate their magnitude or possible timing of payment. Furthermore, other material unanticipated obligations may arise in future in relation to theincident.
Financial statements
BP Annual Report and Form 20-F 2014 115
2. Significant event – Gulf of Mexico oil spill – continued
Impact upon the group income statement
The amount of the provision recognized during the year can be reconciled to the charge to the income statement as follows:$ million
2014 2013 2012Cumulative since
the incident
Net increase in provision 1,327 1,860 6,074 44,705Change in discount rate relating to provisions 2 (5) – 19Costs charged directly to the income statement 114 136 257 4,358Trust fund liability – discounted – – – 19,580Change in discounting relating to trust fund liability – – – 283Recognition of reimbursement asset, net (662) (1,542) (1,191) (20,000)Settlements credited to the income statement – (19) (145) (5,681)(Profit) loss before interest and taxation 781 430 4,995 43,264Finance costs 38 39 19 231(Profit) loss before taxation 819 469 5,014 43,495
The group income statement for 2014 includes a pre-tax charge of $819 million (2013 pre-tax charge of $469 million) in relation to the Gulf of Mexico oilspill. The costs charged in 2014 relate primarily to the ongoing costs of operating the Gulf Coast Restoration Organization (GCRO) and increases in theprovisions for natural resource damage assessment, business economic loss claims, claims administration costs, legal and litigation costs. Financecosts of $38 million (2013 $39 million) reflect the unwinding of the discount on payables and provisions. The cumulative amount charged to the incomestatement to date comprises spill response costs arising in the aftermath of the incident, GCRO operating costs, amounts charged upon initialrecognition of the trust obligation, litigation, claims, environmental and legal costs not paid through the Trust and estimated obligations for future coststhat can be estimated reliably at this time, net of settlements agreed with the co-owners of the Macondo well and other third parties.
The total amount recognized in the income statement is analysed in the table below.
$ million
2014 2013 2012Cumulative since
the incident
Trust fund liability – discounted – – – 19,580Change in discounting relating to trust fund liability – – – 283Recognition of reimbursement asset, net (662) (1,542) (1,191) (20,000)Other – – – 8Total (credit) charge relating to the trust fund (662) (1,542) (1,191) (129)
Environmental – amount provided 190 47 801 3,134– change in discount rate relating to provisions 2 (5) – 19– costs charged directly to the income statement – – – 70
Total (credit) charge relating to environmental 192 42 801 3,223
Spill response – amount provided – (113) 109 11,465– costs charged directly to the income statement – – 9 2,839
Total (credit) charge relating to spill response – (113) 118 14,304
Litigation and claims – amount provided, net of provision derecognized 1,137 1,926 5,164 26,596– costs charged directly to the income statement – – – 184
Total charge relating to litigation and claims 1,137 1,926 5,164 26,780
Clean Water Act penalties – amount provided – – – 3,510Other costs charged directly to the income statement 114 136 248 1,257Settlements credited to the income statement – (19) (145) (5,681)(Profit) loss before interest and taxation 781 430 4,995 43,264Finance costs 38 39 19 231(Profit) loss before taxation 819 469 5,014 43,495
The total amounts that will ultimately be paid by BP in relation to all obligations relating to the incident are subject to significant uncertainty asdescribed under Provisions and contingent liabilities above.
116 BP Annual Report and Form 20-F 2014
3. Disposals and impairment
The following amounts were recognized in the income statement in respect of disposals and impairments.
$ million
2014 2013 2012
Gains on sale of businesses and fixed assetsUpstream 405 371 6,504Downstream 474 214 152TNK-BP – 12,500 –Other businesses and corporate 16 30 41
895 13,115 6,697
$ million
2014 2013 2012
Losses on sale of businesses and fixed assetsUpstream 345 144 109Downstream 401 78 195Other businesses and corporate 3 8 6
749 230 310
Impairment lossesUpstream 6,737 1,255 3,046Downstream 1,264 484 2,892Other businesses and corporate 317 218 320
8,318 1,957 6,258
Impairment reversalsUpstream (102) (226) (289)Downstream – – (1)Other businesses and corporate – – (3)
(102) (226) (293)
Impairment and losses on sale of businesses and fixed assets 8,965 1,961 6,275
Disposals
As part of the response to the consequences of the Gulf of Mexico oil spill in 2010, the group announced plans to deliver up to $38 billion of disposalproceeds by the end of 2013. By 31 December 2012, the group had announced disposals of $38 billion, and in addition, announced the sale of our 50%investment in TNK-BP. During 2013, the group announced that it expected to divest a further $10 billion of assets before the end of 2015. BP hadagreed around $4.7 billion of such further divestments and received proceeds of $3.6 billion as at 31 December 2014.
$ million
2014 2013 2012
Proceeds from disposals of fixed assets 1,820 18,115 9,992Proceeds from disposals of businesses, net of cash disposed 1,671 3,884 1,606
3,491 21,999 11,598By business
Upstream 2,533 1,288 10,667Downstream 864 3,991 637TNK-BP – 16,646 –Other businesses and corporate 94 74 294
3,491 21,999 11,598
At 31 December 2014, deferred consideration relating to disposals amounted to $1,137 million receivable within one year (2013 $23 million and 2012$24 million) and $333 million receivable after one year (2013 $1,374 million and 2012 $1,433 million). In addition, contingent consideration relating tothe disposals of the Devenick field and the Texas City refinery amounted to $454 million at 31 December 2014 (2013 $953 million) – see Notes 16 and28 for further information.
UpstreamIn 2014, gains principally resulted from the sale of certain onshore assets in the US, and the sale of certain interests in the Gulf of Mexico and theNorth Sea. Losses principally arose from adjustments to prior year disposals in Canada and the North Sea.
In 2013, gains principally resulted from the sale of certain of our interests in the central North Sea, and the Yacheng field in China.
In 2012, gains principally resulted from the sale of certain interests in the Gulf of Mexico and certain onshore assets in the US, the sale of our interestsin our Canadian natural gas liquids business, and the sale of a number of interests in the North Sea.
DownstreamIn 2014, gains principally resulted from the disposal of our global aviation turbine oils business. Losses principally arose from costs associated with thedecision to cease refining operations at Bulwer Island in Australia.
Financial statements
BP Annual Report and Form 20-F 2014 117
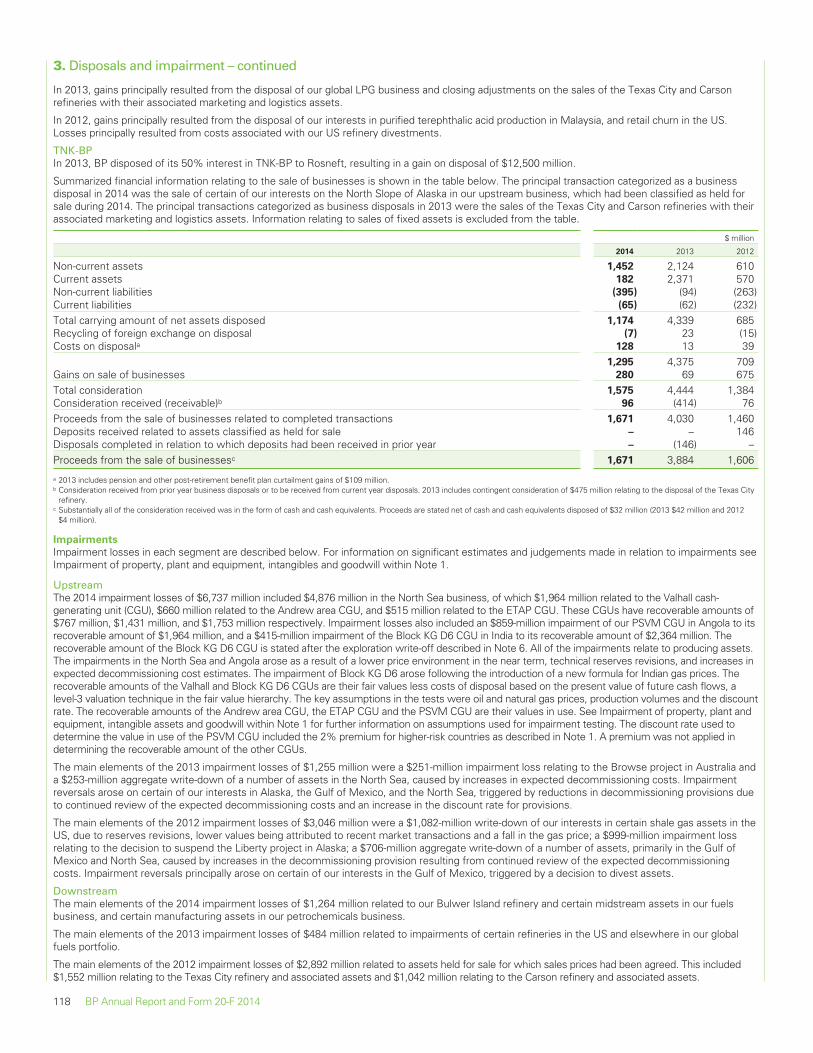
3. Disposals and impairment – continued
In 2013, gains principally resulted from the disposal of our global LPG business and closing adjustments on the sales of the Texas City and Carsonrefineries with their associated marketing and logistics assets.
In 2012, gains principally resulted from the disposal of our interests in purified terephthalic acid production in Malaysia, and retail churn in the US.Losses principally resulted from costs associated with our US refinery divestments.
TNK-BPIn 2013, BP disposed of its 50% interest in TNK-BP to Rosneft, resulting in a gain on disposal of $12,500 million.
Summarized financial information relating to the sale of businesses is shown in the table below. The principal transaction categorized as a businessdisposal in 2014 was the sale of certain of our interests on the North Slope of Alaska in our upstream business, which had been classified as held forsale during 2014. The principal transactions categorized as business disposals in 2013 were the sales of the Texas City and Carson refineries with theirassociated marketing and logistics assets. Information relating to sales of fixed assets is excluded from the table.
$ million
2014 2013 2012
Non-current assets 1,452 2,124 610Current assets 182 2,371 570Non-current liabilities (395) (94) (263)Current liabilities (65) (62) (232)Total carrying amount of net assets disposed 1,174 4,339 685Recycling of foreign exchange on disposal (7) 23 (15)Costs on disposala 128 13 39
1,295 4,375 709Gains on sale of businesses 280 69 675Total consideration 1,575 4,444 1,384Consideration received (receivable)b 96 (414) 76Proceeds from the sale of businesses related to completed transactions 1,671 4,030 1,460Deposits received related to assets classified as held for sale – – 146Disposals completed in relation to which deposits had been received in prior year – (146) –Proceeds from the sale of businessesc 1,671 3,884 1,606
a 2013 includes pension and other post-retirement benefit plan curtailment gains of $109 million.b Consideration received from prior year business disposals or to be received from current year disposals. 2013 includes contingent consideration of $475 million relating to the disposal of the Texas City
refinery.c Substantially all of the consideration received was in the form of cash and cash equivalents. Proceeds are stated net of cash and cash equivalents disposed of $32 million (2013 $42 million and 2012
$4 million).
Impairments
Impairment losses in each segment are described below. For information on significant estimates and judgements made in relation to impairments seeImpairment of property, plant and equipment, intangibles and goodwill within Note 1.
UpstreamThe 2014 impairment losses of $6,737 million included $4,876 million in the North Sea business, of which $1,964 million related to the Valhall cash-generating unit (CGU), $660 million related to the Andrew area CGU, and $515 million related to the ETAP CGU. These CGUs have recoverable amounts of$767 million, $1,431 million, and $1,753 million respectively. Impairment losses also included an $859-million impairment of our PSVM CGU in Angola to itsrecoverable amount of $1,964 million, and a $415-million impairment of the Block KG D6 CGU in India to its recoverable amount of $2,364 million. Therecoverable amount of the Block KG D6 CGU is stated after the exploration write-off described in Note 6. All of the impairments relate to producing assets.The impairments in the North Sea and Angola arose as a result of a lower price environment in the near term, technical reserves revisions, and increases inexpected decommissioning cost estimates. The impairment of Block KG D6 arose following the introduction of a new formula for Indian gas prices. Therecoverable amounts of the Valhall and Block KG D6 CGUs are their fair values less costs of disposal based on the present value of future cash flows, alevel-3 valuation technique in the fair value hierarchy. The key assumptions in the tests were oil and natural gas prices, production volumes and the discountrate. The recoverable amounts of the Andrew area CGU, the ETAP CGU and the PSVM CGU are their values in use. See Impairment of property, plant andequipment, intangible assets and goodwill within Note 1 for further information on assumptions used for impairment testing. The discount rate used todetermine the value in use of the PSVM CGU included the 2% premium for higher-risk countries as described in Note 1. A premium was not applied indetermining the recoverable amount of the other CGUs.
The main elements of the 2013 impairment losses of $1,255 million were a $251-million impairment loss relating to the Browse project in Australia anda $253-million aggregate write-down of a number of assets in the North Sea, caused by increases in expected decommissioning costs. Impairmentreversals arose on certain of our interests in Alaska, the Gulf of Mexico, and the North Sea, triggered by reductions in decommissioning provisions dueto continued review of the expected decommissioning costs and an increase in the discount rate for provisions.
The main elements of the 2012 impairment losses of $3,046 million were a $1,082-million write-down of our interests in certain shale gas assets in theUS, due to reserves revisions, lower values being attributed to recent market transactions and a fall in the gas price; a $999-million impairment lossrelating to the decision to suspend the Liberty project in Alaska; a $706-million aggregate write-down of a number of assets, primarily in the Gulf ofMexico and North Sea, caused by increases in the decommissioning provision resulting from continued review of the expected decommissioningcosts. Impairment reversals principally arose on certain of our interests in the Gulf of Mexico, triggered by a decision to divest assets.
DownstreamThe main elements of the 2014 impairment losses of $1,264 million related to our Bulwer Island refinery and certain midstream assets in our fuelsbusiness, and certain manufacturing assets in our petrochemicals business.
The main elements of the 2013 impairment losses of $484 million related to impairments of certain refineries in the US and elsewhere in our globalfuels portfolio.
The main elements of the 2012 impairment losses of $2,892 million related to assets held for sale for which sales prices had been agreed. This included$1,552 million relating to the Texas City refinery and associated assets and $1,042 million relating to the Carson refinery and associated assets.
118 BP Annual Report and Form 20-F 2014
3. Disposals and impairment – continued
Other businesses and corporateImpairment losses totalling $317 million, $218 million, and $320 million were recognized in 2014, 2013 and 2012 respectively. The amount for 2014 isprincipally in respect of our biofuels businesses in the UK and US. The amount for 2013 is principally in respect of our US wind business. The amountfor 2012 is principally in respect of the decision not to proceed with an investment in a biofuels production facility under development in the US.
4. Segmental analysis
The group’s organizational structure reflects the various activities in which BP is engaged. At 31 December 2014, BP had three reportable segments:Upstream, Downstream and Rosneft.
Upstream’s activities include oil and natural gas exploration, field development and production; midstream transportation, storage and processing; andthe marketing and trading of natural gas, including liquefied natural gas (LNG), together with power and natural gas liquids (NGLs).
Downstream’s activities include the refining, manufacturing, marketing, transportation, and supply and trading of crude oil, petroleum, petrochemicalsproducts and related services to wholesale and retail customers.
During 2013, BP completed transactions for the sale of BP’s interest in TNK-BP to Rosneft, and for BP’s further investment in Rosneft. BP’s interest inRosneft is accounted for using the equity method and is reported as a separate operating segment, reflecting the way in which the investment ismanaged.
Other businesses and corporate comprises the biofuels and wind businesses, the group’s shipping and treasury functions, and corporate activitiesworldwide.
The Gulf Coast Restoration Organization (GCRO), which manages all aspects of our response to the 2010 Gulf of Mexico incident, reports directly tothe group chief executive and is overseen by a board committee, however it is not an operating segment. Its costs are presented as a reconciling itembetween the sum of the results of the reportable segments and the group results.
The accounting policies of the operating segments are the same as the group’s accounting policies described in Note 1. However, IFRS requires thatthe measure of profit or loss disclosed for each operating segment is the measure that is provided regularly to the chief operating decision maker forthe purposes of performance assessment and resource allocation. For BP, this measure of profit or loss is replacement cost profit or loss beforeinterest and tax which reflects the replacement cost of supplies by excluding from profit or loss inventory holding gains and lossesa. Replacement costprofit or loss for the group is not a recognized measure under IFRS.
Sales between segments are made at prices that approximate market prices, taking into account the volumes involved. Segment revenues andsegment results include transactions between business segments. These transactions and any unrealized profits and losses are eliminated onconsolidation, unless unrealized losses provide evidence of an impairment of the asset transferred. Sales to external customers by region are based onthe location of the group subsidiary which made the sale. The UK region includes the UK-based international activities of Downstream.
All surpluses and deficits recognized on the group balance sheet in respect of pension and other post-retirement benefit plans are allocated to Otherbusinesses and corporate. However, the periodic expense relating to these plans is allocated to the operating segments based upon the business inwhich the employees work.
Certain financial information is provided separately for the US as this is an individually material country for BP, and for the UK as this is BP’s country ofdomicile.
a Inventory holding gains and losses represent the difference between the cost of sales calculated using the replacement cost of inventory and the cost of sales calculated on the first-in first-out (FIFO)method after adjusting for any changes in provisions where the net realizable value of the inventory is lower than its cost. Under the FIFO method, which we use for IFRS reporting, the cost ofinventory charged to the income statement is based on its historical cost of purchase or manufacture, rather than its replacement cost. In volatile energy markets, this can have a significant distortingeffect on reported income. The amounts disclosed represent the difference between the charge to the income statement for inventory on a FIFO basis (after adjusting for any related movements in netrealizable value provisions) and the charge that would have arisen based on the replacement cost of inventory. For this purpose, the replacement cost of inventory is calculated using data from eachoperation’s production and manufacturing system, either on a monthly basis, or separately for each transaction where the system allows this approach. The amounts disclosed are not separatelyreflected in the financial statements as a gain or loss. No adjustment is made in respect of the cost of inventories held as part of a trading position and certain other temporary inventory positions.
Financial statements
BP Annual Report and Form 20-F 2014 119
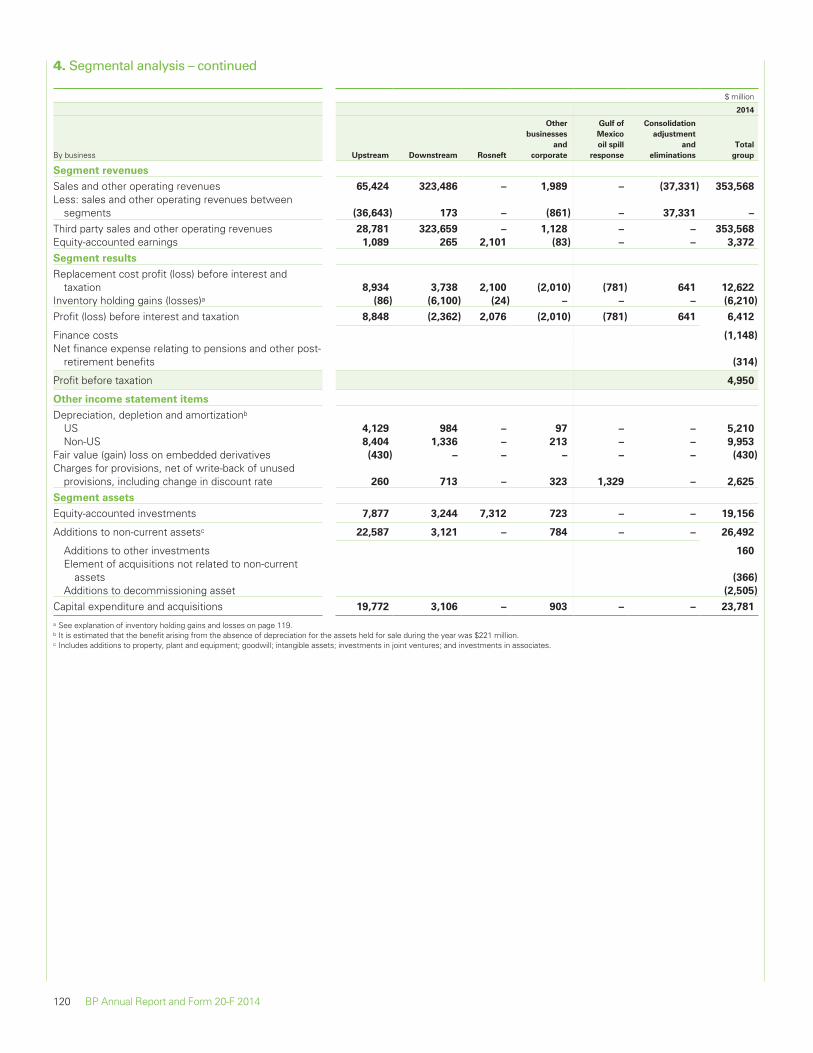
4. Segmental analysis – continued
$ million
2014
By business Upstream Downstream Rosneft
Other
businesses
and
corporate
Gulf of
Mexico
oil spill
response
Consolidation
adjustment
and
eliminations
Total
group
Segment revenues
Sales and other operating revenues 65,424 323,486 – 1,989 – (37,331) 353,568
Less: sales and other operating revenues betweensegments (36,643) 173 – (861) – 37,331 –
Third party sales and other operating revenues 28,781 323,659 – 1,128 – – 353,568
Equity-accounted earnings 1,089 265 2,101 (83) – – 3,372
Segment results
Replacement cost profit (loss) before interest andtaxation 8,934 3,738 2,100 (2,010) (781) 641 12,622
Inventory holding gains (losses)a (86) (6,100) (24) – – – (6,210)
Profit (loss) before interest and taxation 8,848 (2,362) 2,076 (2,010) (781) 641 6,412
Finance costs (1,148)
Net finance expense relating to pensions and other post-retirement benefits (314)
Profit before taxation 4,950
Other income statement items
Depreciation, depletion and amortizationb
US 4,129 984 – 97 – – 5,210
Non-US 8,404 1,336 – 213 – – 9,953
Fair value (gain) loss on embedded derivatives (430) – – – – – (430)
Charges for provisions, net of write-back of unusedprovisions, including change in discount rate 260 713 – 323 1,329 – 2,625
Segment assets
Equity-accounted investments 7,877 3,244 7,312 723 – – 19,156
Additions to non-current assetsc 22,587 3,121 – 784 – – 26,492
Additions to other investments 160
Element of acquisitions not related to non-currentassets (366)
Additions to decommissioning asset (2,505)
Capital expenditure and acquisitions 19,772 3,106 – 903 – – 23,781
a See explanation of inventory holding gains and losses on page 119.b It is estimated that the benefit arising from the absence of depreciation for the assets held for sale during the year was $221 million.c Includes additions to property, plant and equipment; goodwill; intangible assets; investments in joint ventures; and investments in associates.
120 BP Annual Report and Form 20-F 2014
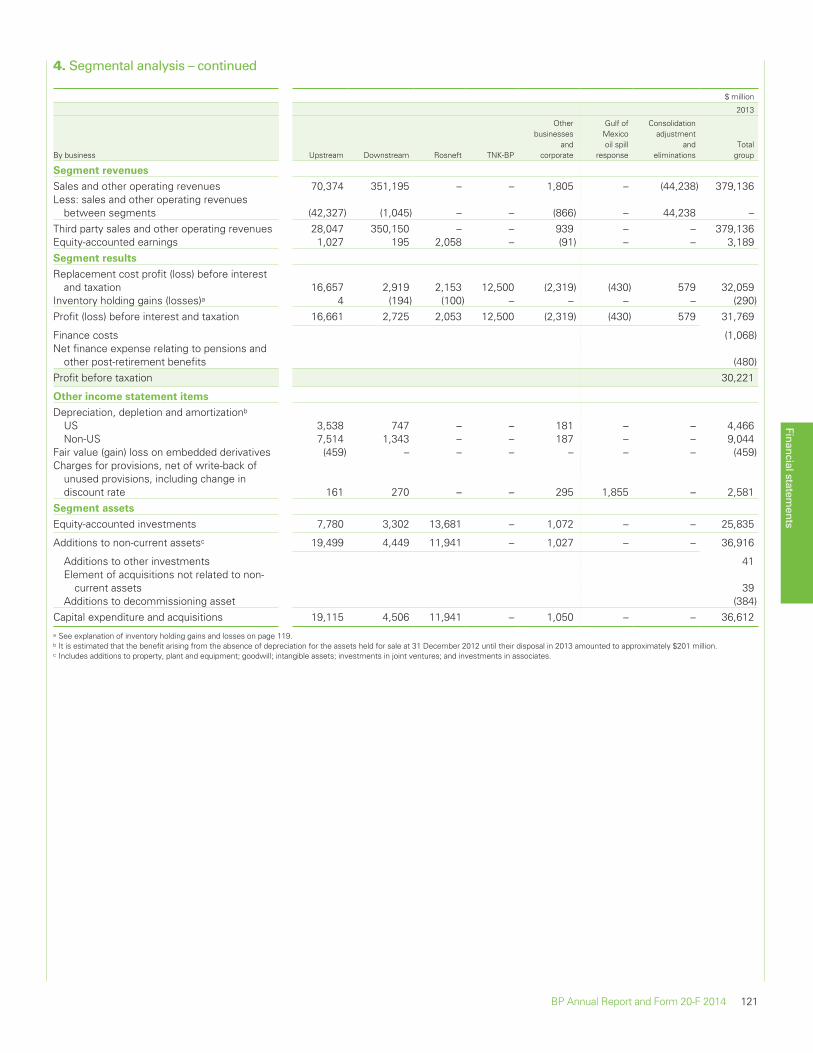
4. Segmental analysis – continued
$ million
2013
By business Upstream Downstream Rosneft TNK-BP
Otherbusinesses
andcorporate
Gulf ofMexicooil spill
response
Consolidationadjustment
andeliminations
Totalgroup
Segment revenues
Sales and other operating revenues 70,374 351,195 – – 1,805 – (44,238) 379,136Less: sales and other operating revenues
between segments (42,327) (1,045) – – (866) – 44,238 –Third party sales and other operating revenues 28,047 350,150 – – 939 – – 379,136Equity-accounted earnings 1,027 195 2,058 – (91) – – 3,189Segment results
Replacement cost profit (loss) before interestand taxation 16,657 2,919 2,153 12,500 (2,319) (430) 579 32,059
Inventory holding gains (losses)a 4 (194) (100) – – – – (290)Profit (loss) before interest and taxation 16,661 2,725 2,053 12,500 (2,319) (430) 579 31,769
Finance costs (1,068)Net finance expense relating to pensions and
other post-retirement benefits (480)Profit before taxation 30,221
Other income statement items
Depreciation, depletion and amortizationb
US 3,538 747 – – 181 – – 4,466Non-US 7,514 1,343 – – 187 – – 9,044
Fair value (gain) loss on embedded derivatives (459) – – – – – – (459)Charges for provisions, net of write-back of
unused provisions, including change indiscount rate 161 270 – – 295 1,855 – 2,581
Segment assets
Equity-accounted investments 7,780 3,302 13,681 – 1,072 – – 25,835
Additions to non-current assetsc 19,499 4,449 11,941 – 1,027 – – 36,916
Additions to other investments 41Element of acquisitions not related to non-
current assets 39Additions to decommissioning asset (384)
Capital expenditure and acquisitions 19,115 4,506 11,941 – 1,050 – – 36,612a See explanation of inventory holding gains and losses on page 119.b It is estimated that the benefit arising from the absence of depreciation for the assets held for sale at 31 December 2012 until their disposal in 2013 amounted to approximately $201 million.c Includes additions to property, plant and equipment; goodwill; intangible assets; investments in joint ventures; and investments in associates.
Financial statements
BP Annual Report and Form 20-F 2014 121
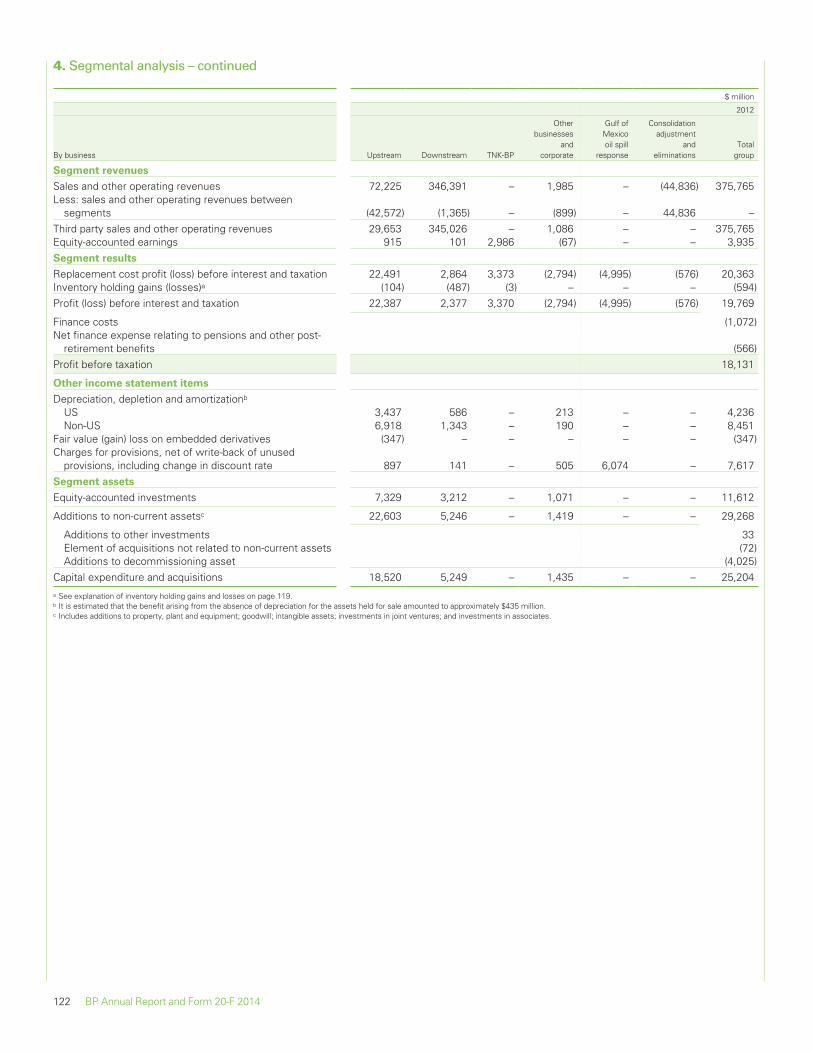
4. Segmental analysis – continued
$ million
2012
By business Upstream Downstream TNK-BP
Otherbusinesses
andcorporate
Gulf ofMexicooil spill
response
Consolidationadjustment
andeliminations
Totalgroup
Segment revenues
Sales and other operating revenues 72,225 346,391 – 1,985 – (44,836) 375,765Less: sales and other operating revenues between
segments (42,572) (1,365) – (899) – 44,836 –Third party sales and other operating revenues 29,653 345,026 – 1,086 – – 375,765Equity-accounted earnings 915 101 2,986 (67) – – 3,935Segment results
Replacement cost profit (loss) before interest and taxation 22,491 2,864 3,373 (2,794) (4,995) (576) 20,363Inventory holding gains (losses)a (104) (487) (3) – – – (594)Profit (loss) before interest and taxation 22,387 2,377 3,370 (2,794) (4,995) (576) 19,769
Finance costs (1,072)Net finance expense relating to pensions and other post-
retirement benefits (566)Profit before taxation 18,131
Other income statement items
Depreciation, depletion and amortizationb
US 3,437 586 – 213 – – 4,236Non-US 6,918 1,343 – 190 – – 8,451
Fair value (gain) loss on embedded derivatives (347) – – – – – (347)Charges for provisions, net of write-back of unused
provisions, including change in discount rate 897 141 – 505 6,074 – 7,617Segment assets
Equity-accounted investments 7,329 3,212 – 1,071 – – 11,612
Additions to non-current assetsc 22,603 5,246 – 1,419 – – 29,268
Additions to other investments 33Element of acquisitions not related to non-current assets (72)Additions to decommissioning asset (4,025)
Capital expenditure and acquisitions 18,520 5,249 – 1,435 – – 25,204a See explanation of inventory holding gains and losses on page 119.b It is estimated that the benefit arising from the absence of depreciation for the assets held for sale amounted to approximately $435 million.c Includes additions to property, plant and equipment; goodwill; intangible assets; investments in joint ventures; and investments in associates.
122 BP Annual Report and Form 20-F 2014
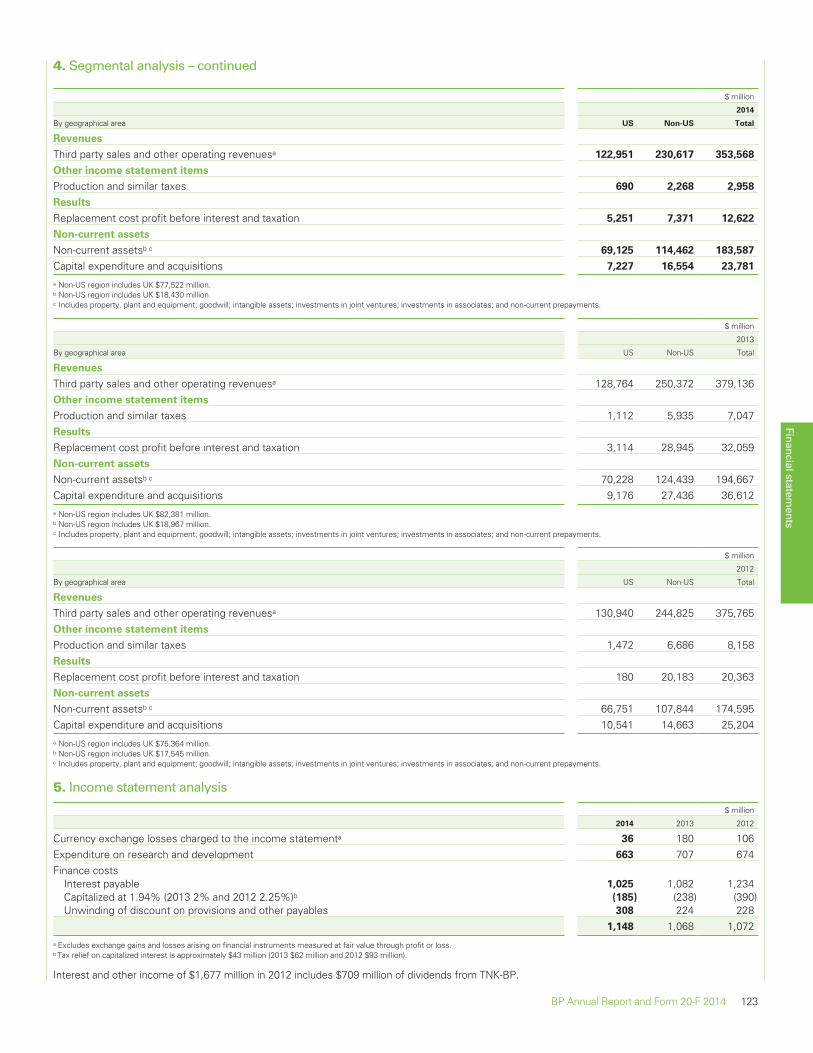
4. Segmental analysis – continued
$ million
2014
By geographical area US Non-US Total
Revenues
Third party sales and other operating revenuesa 122,951 230,617 353,568
Other income statement items
Production and similar taxes 690 2,268 2,958
Results
Replacement cost profit before interest and taxation 5,251 7,371 12,622
Non-current assets
Non-current assetsb c 69,125 114,462 183,587
Capital expenditure and acquisitions 7,227 16,554 23,781
a Non-US region includes UK $77,522 million.b Non-US region includes UK $18,430 million.c Includes property, plant and equipment; goodwill; intangible assets; investments in joint ventures; investments in associates; and non-current prepayments.
$ million
2013
By geographical area US Non-US Total
Revenues
Third party sales and other operating revenuesa 128,764 250,372 379,136Other income statement items
Production and similar taxes 1,112 5,935 7,047Results
Replacement cost profit before interest and taxation 3,114 28,945 32,059Non-current assets
Non-current assetsb c 70,228 124,439 194,667Capital expenditure and acquisitions 9,176 27,436 36,612a Non-US region includes UK $82,381 million.b Non-US region includes UK $18,967 million.c Includes property, plant and equipment; goodwill; intangible assets; investments in joint ventures; investments in associates; and non-current prepayments.
$ million
2012
By geographical area US Non-US Total
Revenues
Third party sales and other operating revenuesa 130,940 244,825 375,765Other income statement items
Production and similar taxes 1,472 6,686 8,158Results
Replacement cost profit before interest and taxation 180 20,183 20,363Non-current assets
Non-current assetsb c 66,751 107,844 174,595Capital expenditure and acquisitions 10,541 14,663 25,204a Non-US region includes UK $75,364 million.b Non-US region includes UK $17,545 million.c Includes property, plant and equipment; goodwill; intangible assets; investments in joint ventures; investments in associates; and non-current prepayments.
5. Income statement analysis
$ million
2014 2013 2012
Currency exchange losses charged to the income statementa 36 180 106Expenditure on research and development 663 707 674Finance costs
Interest payable 1,025 1,082 1,234Capitalized at 1.94% (2013 2% and 2012 2.25%)b (185) (238) (390)Unwinding of discount on provisions and other payables 308 224 228
1,148 1,068 1,072a Excludes exchange gains and losses arising on financial instruments measured at fair value through profit or loss.b Tax relief on capitalized interest is approximately $43 million (2013 $62 million and 2012 $93 million).
Interest and other income of $1,677 million in 2012 includes $709 million of dividends from TNK-BP.
Financial statements
BP Annual Report and Form 20-F 2014 123
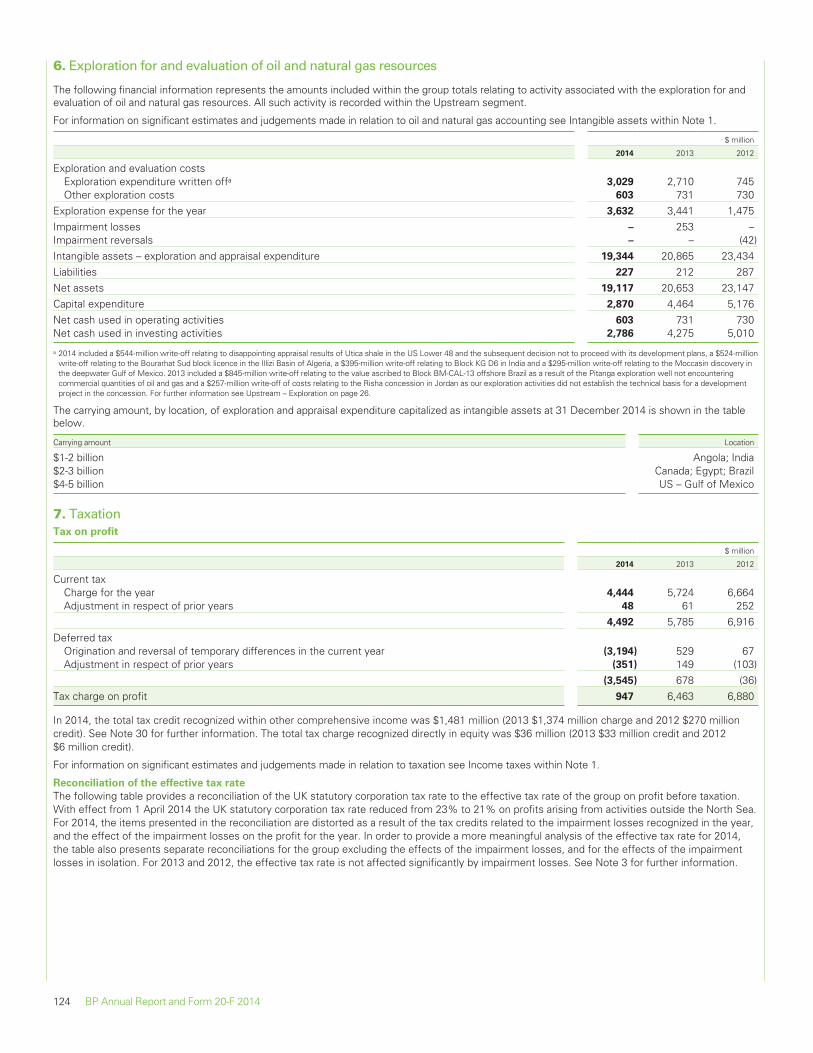
6. Exploration for and evaluation of oil and natural gas resources
The following financial information represents the amounts included within the group totals relating to activity associated with the exploration for andevaluation of oil and natural gas resources. All such activity is recorded within the Upstream segment.
For information on significant estimates and judgements made in relation to oil and natural gas accounting see Intangible assets within Note 1.
$ million
2014 2013 2012
Exploration and evaluation costsExploration expenditure written offa 3,029 2,710 745Other exploration costs 603 731 730
Exploration expense for the year 3,632 3,441 1,475Impairment losses – 253 –Impairment reversals – – (42)Intangible assets – exploration and appraisal expenditure 19,344 20,865 23,434Liabilities 227 212 287Net assets 19,117 20,653 23,147Capital expenditure 2,870 4,464 5,176Net cash used in operating activities 603 731 730Net cash used in investing activities 2,786 4,275 5,010
a 2014 included a $544-million write-off relating to disappointing appraisal results of Utica shale in the US Lower 48 and the subsequent decision not to proceed with its development plans, a $524-millionwrite-off relating to the Bourarhat Sud block licence in the Illizi Basin of Algeria, a $395-million write-off relating to Block KG D6 in India and a $295-million write-off relating to the Moccasin discovery inthe deepwater Gulf of Mexico. 2013 included a $845-million write-off relating to the value ascribed to Block BM-CAL-13 offshore Brazil as a result of the Pitanga exploration well not encounteringcommercial quantities of oil and gas and a $257-million write-off of costs relating to the Risha concession in Jordan as our exploration activities did not establish the technical basis for a developmentproject in the concession. For further information see Upstream – Exploration on page 26.
The carrying amount, by location, of exploration and appraisal expenditure capitalized as intangible assets at 31 December 2014 is shown in the tablebelow.
Carrying amount Location
$1-2 billion Angola; India$2-3 billion Canada; Egypt; Brazil$4-5 billion US – Gulf of Mexico
7. TaxationTax on profit
$ million
2014 2013 2012
Current taxCharge for the year 4,444 5,724 6,664Adjustment in respect of prior years 48 61 252
4,492 5,785 6,916Deferred tax
Origination and reversal of temporary differences in the current year (3,194) 529 67Adjustment in respect of prior years (351) 149 (103)
(3,545) 678 (36)Tax charge on profit 947 6,463 6,880
In 2014, the total tax credit recognized within other comprehensive income was $1,481 million (2013 $1,374 million charge and 2012 $270 millioncredit). See Note 30 for further information. The total tax charge recognized directly in equity was $36 million (2013 $33 million credit and 2012$6 million credit).
For information on significant estimates and judgements made in relation to taxation see Income taxes within Note 1.
Reconciliation of the effective tax rate
The following table provides a reconciliation of the UK statutory corporation tax rate to the effective tax rate of the group on profit before taxation.With effect from 1 April 2014 the UK statutory corporation tax rate reduced from 23% to 21% on profits arising from activities outside the North Sea.For 2014, the items presented in the reconciliation are distorted as a result of the tax credits related to the impairment losses recognized in the year,and the effect of the impairment losses on the profit for the year. In order to provide a more meaningful analysis of the effective tax rate for 2014,the table also presents separate reconciliations for the group excluding the effects of the impairment losses, and for the effects of the impairmentlosses in isolation. For 2013 and 2012, the effective tax rate is not affected significantly by impairment losses. See Note 3 for further information.
124 BP Annual Report and Form 20-F 2014
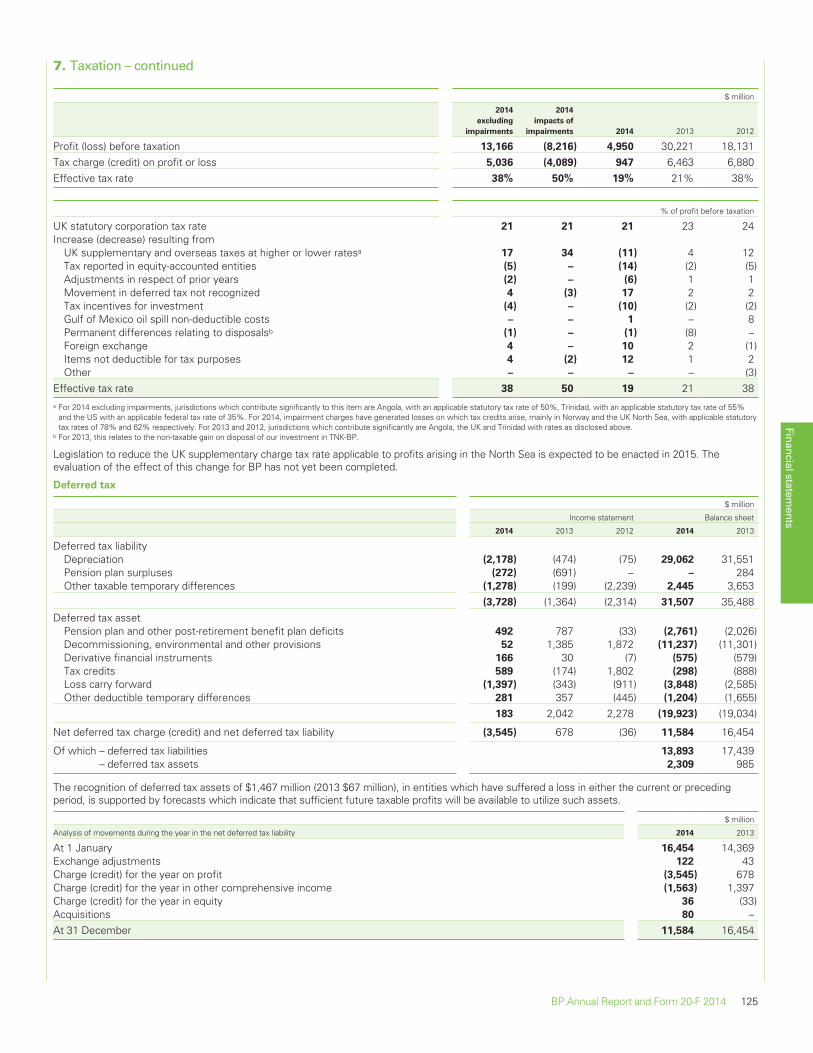
7. Taxation – continued
$ million
2014
excluding
impairments
2014
impacts of
impairments 2014 2013 2012
Profit (loss) before taxation 13,166 (8,216) 4,950 30,221 18,131Tax charge (credit) on profit or loss 5,036 (4,089) 947 6,463 6,880Effective tax rate 38% 50% 19% 21% 38%
% of profit before taxation
UK statutory corporation tax rate 21 21 21 23 24Increase (decrease) resulting from
UK supplementary and overseas taxes at higher or lower ratesa 17 34 (11) 4 12Tax reported in equity-accounted entities (5) – (14) (2) (5)Adjustments in respect of prior years (2) – (6) 1 1Movement in deferred tax not recognized 4 (3) 17 2 2Tax incentives for investment (4) – (10) (2) (2)Gulf of Mexico oil spill non-deductible costs – – 1 – 8Permanent differences relating to disposalsb (1) – (1) (8) –Foreign exchange 4 – 10 2 (1)Items not deductible for tax purposes 4 (2) 12 1 2Other – – – – (3)
Effective tax rate 38 50 19 21 38a For 2014 excluding impairments, jurisdictions which contribute significantly to this item are Angola, with an applicable statutory tax rate of 50%, Trinidad, with an applicable statutory tax rate of 55%
and the US with an applicable federal tax rate of 35%. For 2014, impairment charges have generated losses on which tax credits arise, mainly in Norway and the UK North Sea, with applicable statutorytax rates of 78% and 62% respectively. For 2013 and 2012, jurisdictions which contribute significantly are Angola, the UK and Trinidad with rates as disclosed above.
b For 2013, this relates to the non-taxable gain on disposal of our investment in TNK-BP.
Legislation to reduce the UK supplementary charge tax rate applicable to profits arising in the North Sea is expected to be enacted in 2015. Theevaluation of the effect of this change for BP has not yet been completed.
Deferred tax
$ million
Income statement Balance sheet
2014 2013 2012 2014 2013
Deferred tax liabilityDepreciation (2,178) (474) (75) 29,062 31,551Pension plan surpluses (272) (691) – – 284Other taxable temporary differences (1,278) (199) (2,239) 2,445 3,653
(3,728) (1,364) (2,314) 31,507 35,488Deferred tax asset
Pension plan and other post-retirement benefit plan deficits 492 787 (33) (2,761) (2,026)Decommissioning, environmental and other provisions 52 1,385 1,872 (11,237) (11,301)Derivative financial instruments 166 30 (7) (575) (579)Tax credits 589 (174) 1,802 (298) (888)Loss carry forward (1,397) (343) (911) (3,848) (2,585)Other deductible temporary differences 281 357 (445) (1,204) (1,655)
183 2,042 2,278 (19,923) (19,034)
Net deferred tax charge (credit) and net deferred tax liability (3,545) 678 (36) 11,584 16,454
Of which – deferred tax liabilities 13,893 17,439– deferred tax assets 2,309 985
The recognition of deferred tax assets of $1,467 million (2013 $67 million), in entities which have suffered a loss in either the current or precedingperiod, is supported by forecasts which indicate that sufficient future taxable profits will be available to utilize such assets.
$ million
Analysis of movements during the year in the net deferred tax liability 2014 2013
At 1 January 16,454 14,369Exchange adjustments 122 43Charge (credit) for the year on profit (3,545) 678Charge (credit) for the year in other comprehensive income (1,563) 1,397Charge (credit) for the year in equity 36 (33)Acquisitions 80 –At 31 December 11,584 16,454
Financial statements
BP Annual Report and Form 20-F 2014 125
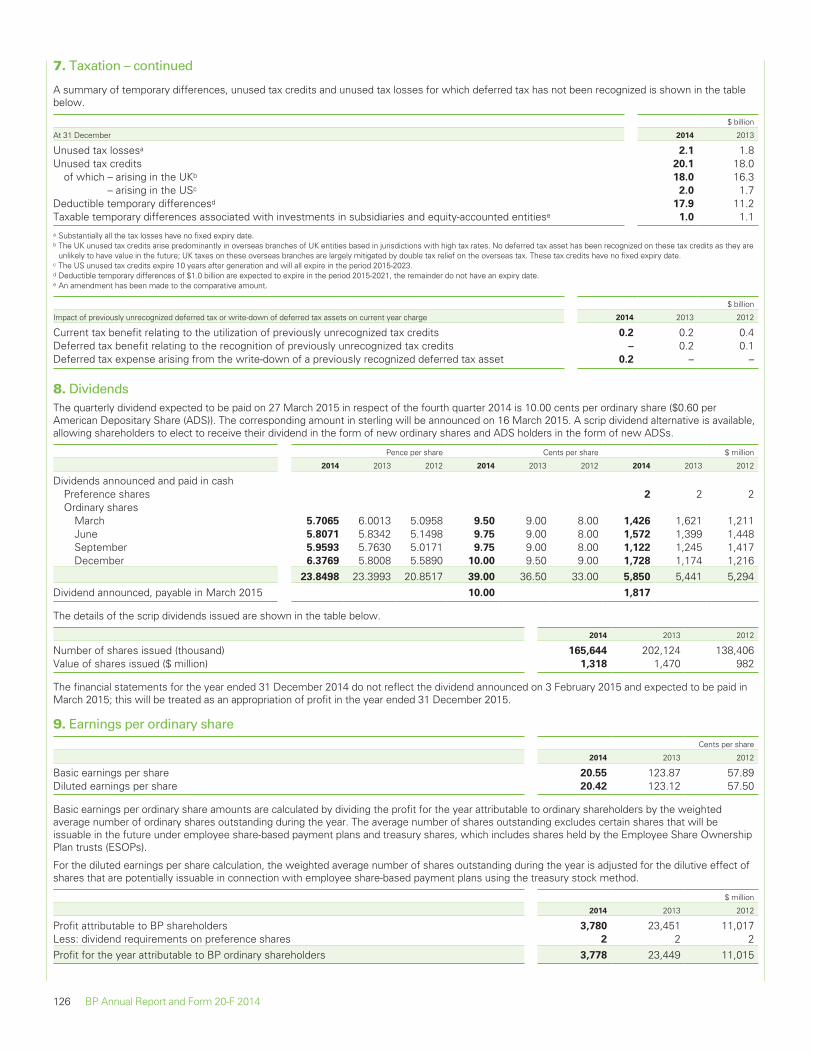
7. Taxation – continued
A summary of temporary differences, unused tax credits and unused tax losses for which deferred tax has not been recognized is shown in the tablebelow.
$ billion
At 31 December 2014 2013
Unused tax lossesa 2.1 1.8Unused tax credits 20.1 18.0
of which – arising in the UKb 18.0 16.3– arising in the USc 2.0 1.7
Deductible temporary differencesd 17.9 11.2Taxable temporary differences associated with investments in subsidiaries and equity-accounted entitiese 1.0 1.1a Substantially all the tax losses have no fixed expiry date.b The UK unused tax credits arise predominantly in overseas branches of UK entities based in jurisdictions with high tax rates. No deferred tax asset has been recognized on these tax credits as they are
unlikely to have value in the future; UK taxes on these overseas branches are largely mitigated by double tax relief on the overseas tax. These tax credits have no fixed expiry date.c The US unused tax credits expire 10 years after generation and will all expire in the period 2015-2023.d Deductible temporary differences of $1.0 billion are expected to expire in the period 2015-2021, the remainder do not have an expiry date.e An amendment has been made to the comparative amount.
$ billion
Impact of previously unrecognized deferred tax or write-down of deferred tax assets on current year charge 2014 2013 2012
Current tax benefit relating to the utilization of previously unrecognized tax credits 0.2 0.2 0.4Deferred tax benefit relating to the recognition of previously unrecognized tax credits – 0.2 0.1Deferred tax expense arising from the write-down of a previously recognized deferred tax asset 0.2 – –
8. DividendsThe quarterly dividend expected to be paid on 27 March 2015 in respect of the fourth quarter 2014 is 10.00 cents per ordinary share ($0.60 perAmerican Depositary Share (ADS)). The corresponding amount in sterling will be announced on 16 March 2015. A scrip dividend alternative is available,allowing shareholders to elect to receive their dividend in the form of new ordinary shares and ADS holders in the form of new ADSs.
Pence per share Cents per share $ million
2014 2013 2012 2014 2013 2012 2014 2013 2012
Dividends announced and paid in cashPreference shares 2 2 2Ordinary shares
March 5.7065 6.0013 5.0958 9.50 9.00 8.00 1,426 1,621 1,211June 5.8071 5.8342 5.1498 9.75 9.00 8.00 1,572 1,399 1,448September 5.9593 5.7630 5.0171 9.75 9.00 8.00 1,122 1,245 1,417December 6.3769 5.8008 5.5890 10.00 9.50 9.00 1,728 1,174 1,216
23.8498 23.3993 20.8517 39.00 36.50 33.00 5,850 5,441 5,294Dividend announced, payable in March 2015 10.00 1,817
The details of the scrip dividends issued are shown in the table below.
2014 2013 2012
Number of shares issued (thousand) 165,644 202,124 138,406Value of shares issued ($ million) 1,318 1,470 982
The financial statements for the year ended 31 December 2014 do not reflect the dividend announced on 3 February 2015 and expected to be paid inMarch 2015; this will be treated as an appropriation of profit in the year ended 31 December 2015.
9. Earnings per ordinary shareCents per share
2014 2013 2012
Basic earnings per share 20.55 123.87 57.89Diluted earnings per share 20.42 123.12 57.50
Basic earnings per ordinary share amounts are calculated by dividing the profit for the year attributable to ordinary shareholders by the weightedaverage number of ordinary shares outstanding during the year. The average number of shares outstanding excludes certain shares that will beissuable in the future under employee share-based payment plans and treasury shares, which includes shares held by the Employee Share OwnershipPlan trusts (ESOPs).
For the diluted earnings per share calculation, the weighted average number of shares outstanding during the year is adjusted for the dilutive effect ofshares that are potentially issuable in connection with employee share-based payment plans using the treasury stock method.
$ million
2014 2013 2012
Profit attributable to BP shareholders 3,780 23,451 11,017Less: dividend requirements on preference shares 2 2 2Profit for the year attributable to BP ordinary shareholders 3,778 23,449 11,015
126 BP Annual Report and Form 20-F 2014
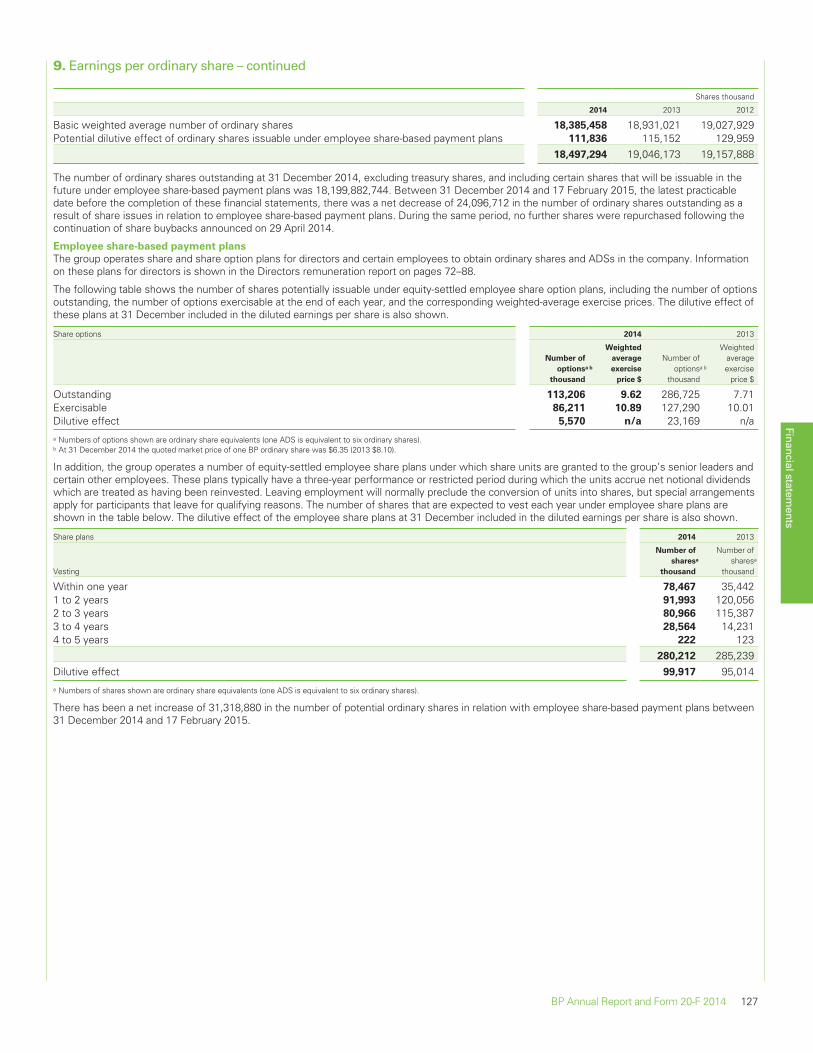
9. Earnings per ordinary share – continued
Shares thousand
2014 2013 2012
Basic weighted average number of ordinary shares 18,385,458 18,931,021 19,027,929Potential dilutive effect of ordinary shares issuable under employee share-based payment plans 111,836 115,152 129,959
18,497,294 19,046,173 19,157,888
The number of ordinary shares outstanding at 31 December 2014, excluding treasury shares, and including certain shares that will be issuable in thefuture under employee share-based payment plans was 18,199,882,744. Between 31 December 2014 and 17 February 2015, the latest practicabledate before the completion of these financial statements, there was a net decrease of 24,096,712 in the number of ordinary shares outstanding as aresult of share issues in relation to employee share-based payment plans. During the same period, no further shares were repurchased following thecontinuation of share buybacks announced on 29 April 2014.
Employee share-based payment plans
The group operates share and share option plans for directors and certain employees to obtain ordinary shares and ADSs in the company. Informationon these plans for directors is shown in the Directors remuneration report on pages 72–88.
The following table shows the number of shares potentially issuable under equity-settled employee share option plans, including the number of optionsoutstanding, the number of options exercisable at the end of each year, and the corresponding weighted-average exercise prices. The dilutive effect ofthese plans at 31 December included in the diluted earnings per share is also shown.
Share options 2014 2013
Number of
optionsa b
thousand
Weighted
average
exercise
price $
Number ofoptionsa b
thousand
Weightedaverageexercise
price $
Outstanding 113,206 9.62 286,725 7.71Exercisable 86,211 10.89 127,290 10.01Dilutive effect 5,570 n/a 23,169 n/aa Numbers of options shown are ordinary share equivalents (one ADS is equivalent to six ordinary shares).b At 31 December 2014 the quoted market price of one BP ordinary share was $6.35 (2013 $8.10).
In addition, the group operates a number of equity-settled employee share plans under which share units are granted to the group’s senior leaders andcertain other employees. These plans typically have a three-year performance or restricted period during which the units accrue net notional dividendswhich are treated as having been reinvested. Leaving employment will normally preclude the conversion of units into shares, but special arrangementsapply for participants that leave for qualifying reasons. The number of shares that are expected to vest each year under employee share plans areshown in the table below. The dilutive effect of the employee share plans at 31 December included in the diluted earnings per share is also shown.
Share plans 2014 2013
Vesting
Number of
sharesa
thousand
Number ofsharesa
thousand
Within one year 78,467 35,4421 to 2 years 91,993 120,0562 to 3 years 80,966 115,3873 to 4 years 28,564 14,2314 to 5 years 222 123
280,212 285,239Dilutive effect 99,917 95,014a Numbers of shares shown are ordinary share equivalents (one ADS is equivalent to six ordinary shares).
There has been a net increase of 31,318,880 in the number of potential ordinary shares in relation with employee share-based payment plans between31 December 2014 and 17 February 2015.
Financial statements
BP Annual Report and Form 20-F 2014 127
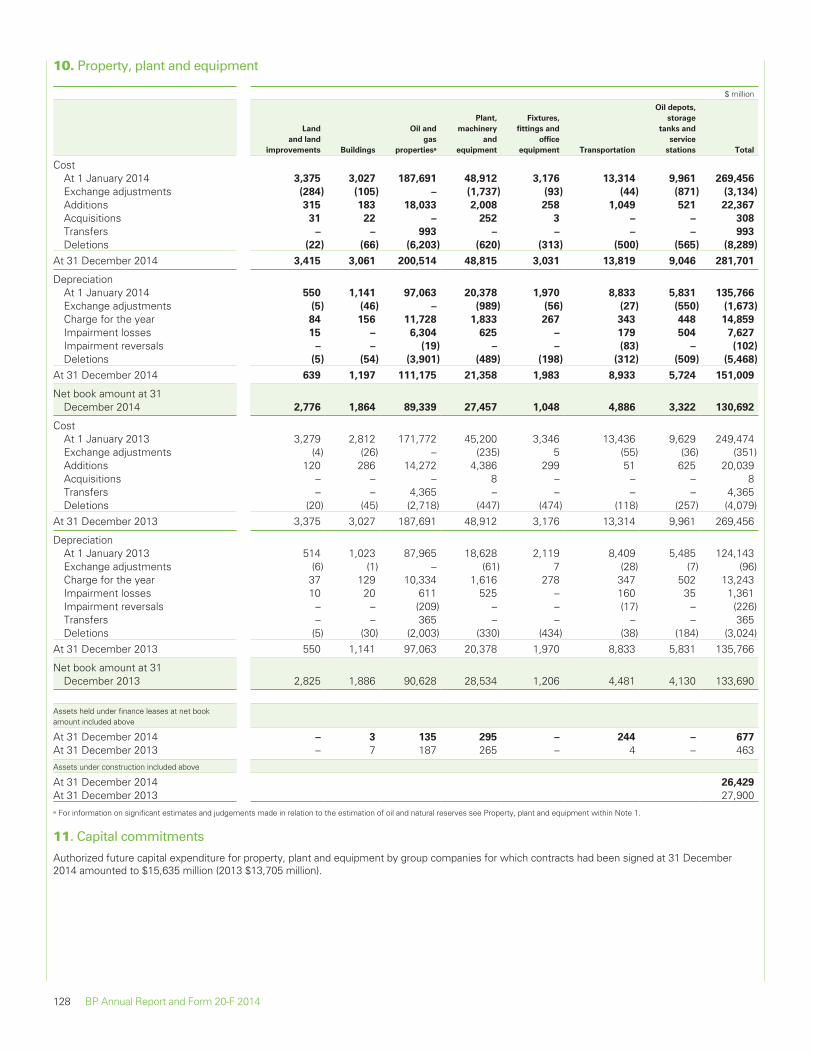
10. Property, plant and equipment
$ million
Land
and land
improvements Buildings
Oil and
gas
propertiesa
Plant,
machinery
and
equipment
Fixtures,
fittings and
office
equipment Transportation
Oil depots,
storage
tanks and
service
stations Total
CostAt 1 January 2014 3,375 3,027 187,691 48,912 3,176 13,314 9,961 269,456
Exchange adjustments (284) (105) – (1,737) (93) (44) (871) (3,134)
Additions 315 183 18,033 2,008 258 1,049 521 22,367
Acquisitions 31 22 – 252 3 – – 308
Transfers – – 993 – – – – 993
Deletions (22) (66) (6,203) (620) (313) (500) (565) (8,289)
At 31 December 2014 3,415 3,061 200,514 48,815 3,031 13,819 9,046 281,701
DepreciationAt 1 January 2014 550 1,141 97,063 20,378 1,970 8,833 5,831 135,766
Exchange adjustments (5) (46) – (989) (56) (27) (550) (1,673)
Charge for the year 84 156 11,728 1,833 267 343 448 14,859
Impairment losses 15 – 6,304 625 – 179 504 7,627
Impairment reversals – – (19) – – (83) – (102)
Deletions (5) (54) (3,901) (489) (198) (312) (509) (5,468)
At 31 December 2014 639 1,197 111,175 21,358 1,983 8,933 5,724 151,009
Net book amount at 31December 2014 2,776 1,864 89,339 27,457 1,048 4,886 3,322 130,692
CostAt 1 January 2013 3,279 2,812 171,772 45,200 3,346 13,436 9,629 249,474Exchange adjustments (4) (26) – (235) 5 (55) (36) (351)Additions 120 286 14,272 4,386 299 51 625 20,039Acquisitions – – – 8 – – – 8Transfers – – 4,365 – – – – 4,365Deletions (20) (45) (2,718) (447) (474) (118) (257) (4,079)
At 31 December 2013 3,375 3,027 187,691 48,912 3,176 13,314 9,961 269,456
DepreciationAt 1 January 2013 514 1,023 87,965 18,628 2,119 8,409 5,485 124,143Exchange adjustments (6) (1) – (61) 7 (28) (7) (96)Charge for the year 37 129 10,334 1,616 278 347 502 13,243Impairment losses 10 20 611 525 – 160 35 1,361Impairment reversals – – (209) – – (17) – (226)Transfers – – 365 – – – – 365Deletions (5) (30) (2,003) (330) (434) (38) (184) (3,024)
At 31 December 2013 550 1,141 97,063 20,378 1,970 8,833 5,831 135,766
Net book amount at 31December 2013 2,825 1,886 90,628 28,534 1,206 4,481 4,130 133,690
Assets held under finance leases at net bookamount included above
At 31 December 2014 – 3 135 295 – 244 – 677
At 31 December 2013 – 7 187 265 – 4 – 463Assets under construction included above
At 31 December 2014 26,429
At 31 December 2013 27,900a For information on significant estimates and judgements made in relation to the estimation of oil and natural reserves see Property, plant and equipment within Note 1.
11. Capital commitments
Authorized future capital expenditure for property, plant and equipment by group companies for which contracts had been signed at 31 December2014 amounted to $15,635 million (2013 $13,705 million).
128 BP Annual Report and Form 20-F 2014
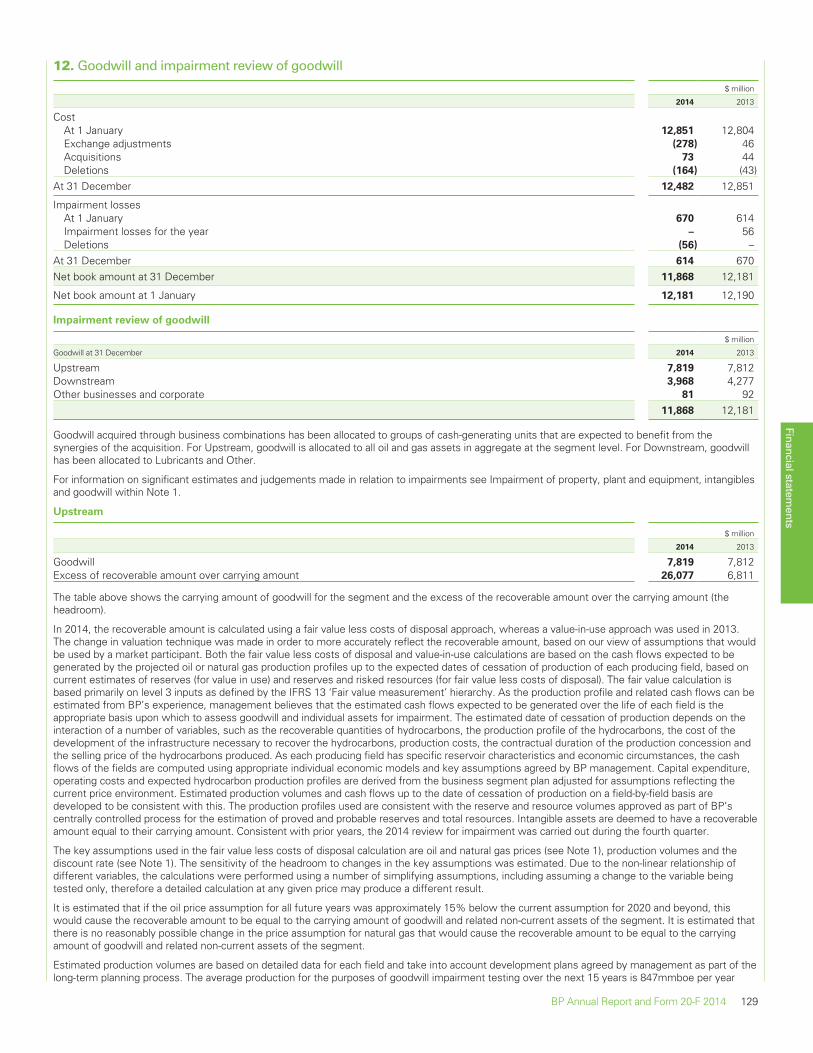
12. Goodwill and impairment review of goodwill
$ million
2014 2013
CostAt 1 January 12,851 12,804Exchange adjustments (278) 46Acquisitions 73 44Deletions (164) (43)
At 31 December 12,482 12,851
Impairment lossesAt 1 January 670 614Impairment losses for the year – 56Deletions (56) –
At 31 December 614 670Net book amount at 31 December 11,868 12,181
Net book amount at 1 January 12,181 12,190
Impairment review of goodwill
$ million
Goodwill at 31 December 2014 2013
Upstream 7,819 7,812Downstream 3,968 4,277Other businesses and corporate 81 92
11,868 12,181
Goodwill acquired through business combinations has been allocated to groups of cash-generating units that are expected to benefit from thesynergies of the acquisition. For Upstream, goodwill is allocated to all oil and gas assets in aggregate at the segment level. For Downstream, goodwillhas been allocated to Lubricants and Other.
For information on significant estimates and judgements made in relation to impairments see Impairment of property, plant and equipment, intangiblesand goodwill within Note 1.
Upstream
$ million
2014 2013
Goodwill 7,819 7,812Excess of recoverable amount over carrying amount 26,077 6,811
The table above shows the carrying amount of goodwill for the segment and the excess of the recoverable amount over the carrying amount (theheadroom).
In 2014, the recoverable amount is calculated using a fair value less costs of disposal approach, whereas a value-in-use approach was used in 2013.The change in valuation technique was made in order to more accurately reflect the recoverable amount, based on our view of assumptions that wouldbe used by a market participant. Both the fair value less costs of disposal and value-in-use calculations are based on the cash flows expected to begenerated by the projected oil or natural gas production profiles up to the expected dates of cessation of production of each producing field, based oncurrent estimates of reserves (for value in use) and reserves and risked resources (for fair value less costs of disposal). The fair value calculation isbased primarily on level 3 inputs as defined by the IFRS 13 ‘Fair value measurement’ hierarchy. As the production profile and related cash flows can beestimated from BP’s experience, management believes that the estimated cash flows expected to be generated over the life of each field is theappropriate basis upon which to assess goodwill and individual assets for impairment. The estimated date of cessation of production depends on theinteraction of a number of variables, such as the recoverable quantities of hydrocarbons, the production profile of the hydrocarbons, the cost of thedevelopment of the infrastructure necessary to recover the hydrocarbons, production costs, the contractual duration of the production concession andthe selling price of the hydrocarbons produced. As each producing field has specific reservoir characteristics and economic circumstances, the cashflows of the fields are computed using appropriate individual economic models and key assumptions agreed by BP management. Capital expenditure,operating costs and expected hydrocarbon production profiles are derived from the business segment plan adjusted for assumptions reflecting thecurrent price environment. Estimated production volumes and cash flows up to the date of cessation of production on a field-by-field basis aredeveloped to be consistent with this. The production profiles used are consistent with the reserve and resource volumes approved as part of BP’scentrally controlled process for the estimation of proved and probable reserves and total resources. Intangible assets are deemed to have a recoverableamount equal to their carrying amount. Consistent with prior years, the 2014 review for impairment was carried out during the fourth quarter.
The key assumptions used in the fair value less costs of disposal calculation are oil and natural gas prices (see Note 1), production volumes and thediscount rate (see Note 1). The sensitivity of the headroom to changes in the key assumptions was estimated. Due to the non-linear relationship ofdifferent variables, the calculations were performed using a number of simplifying assumptions, including assuming a change to the variable beingtested only, therefore a detailed calculation at any given price may produce a different result.
It is estimated that if the oil price assumption for all future years was approximately 15% below the current assumption for 2020 and beyond, thiswould cause the recoverable amount to be equal to the carrying amount of goodwill and related non-current assets of the segment. It is estimated thatthere is no reasonably possible change in the price assumption for natural gas that would cause the recoverable amount to be equal to the carryingamount of goodwill and related non-current assets of the segment.
Estimated production volumes are based on detailed data for each field and take into account development plans agreed by management as part of thelong-term planning process. The average production for the purposes of goodwill impairment testing over the next 15 years is 847mmboe per year
Financial statements
BP Annual Report and Form 20-F 2014 129
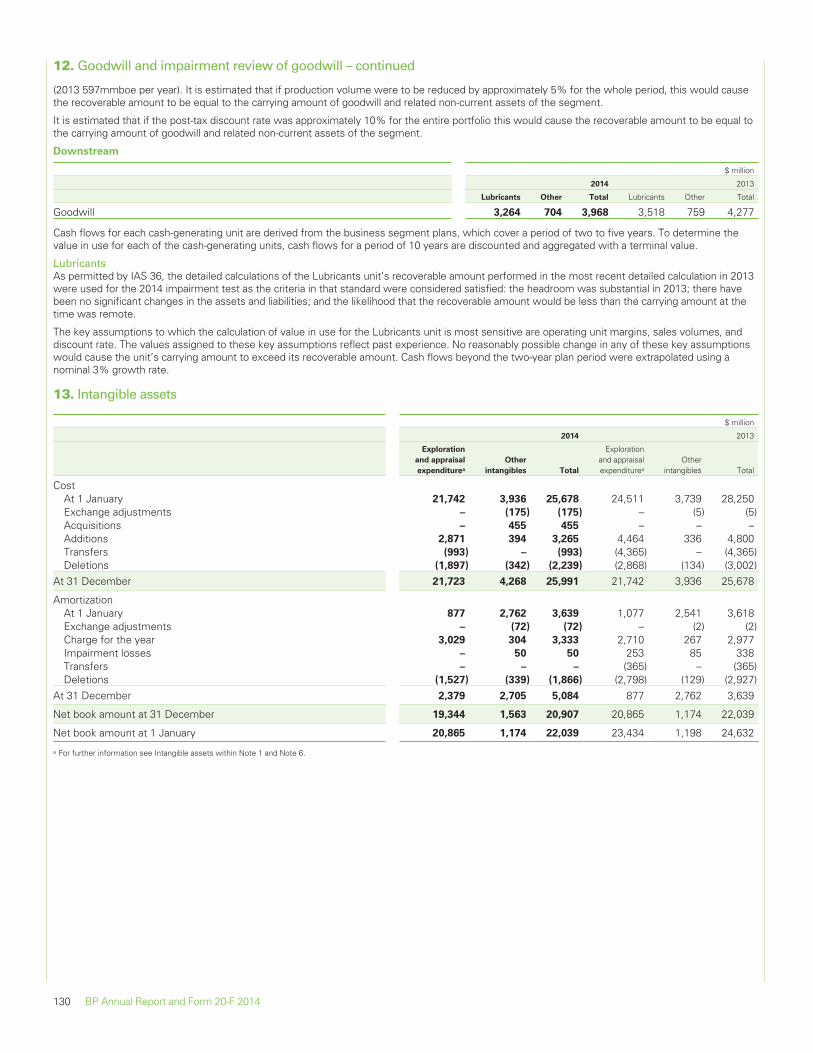
12. Goodwill and impairment review of goodwill – continued
(2013 597mmboe per year). It is estimated that if production volume were to be reduced by approximately 5% for the whole period, this would causethe recoverable amount to be equal to the carrying amount of goodwill and related non-current assets of the segment.
It is estimated that if the post-tax discount rate was approximately 10% for the entire portfolio this would cause the recoverable amount to be equal tothe carrying amount of goodwill and related non-current assets of the segment.
Downstream
$ million
2014 2013
Lubricants Other Total Lubricants Other Total
Goodwill 3,264 704 3,968 3,518 759 4,277
Cash flows for each cash-generating unit are derived from the business segment plans, which cover a period of two to five years. To determine thevalue in use for each of the cash-generating units, cash flows for a period of 10 years are discounted and aggregated with a terminal value.
LubricantsAs permitted by IAS 36, the detailed calculations of the Lubricants unit’s recoverable amount performed in the most recent detailed calculation in 2013were used for the 2014 impairment test as the criteria in that standard were considered satisfied: the headroom was substantial in 2013; there havebeen no significant changes in the assets and liabilities; and the likelihood that the recoverable amount would be less than the carrying amount at thetime was remote.
The key assumptions to which the calculation of value in use for the Lubricants unit is most sensitive are operating unit margins, sales volumes, anddiscount rate. The values assigned to these key assumptions reflect past experience. No reasonably possible change in any of these key assumptionswould cause the unit’s carrying amount to exceed its recoverable amount. Cash flows beyond the two-year plan period were extrapolated using anominal 3% growth rate.
13. Intangible assets
$ million
2014 2013
Exploration
and appraisal
expenditurea
Other
intangibles Total
Explorationand appraisalexpenditurea
Otherintangibles Total
CostAt 1 January 21,742 3,936 25,678 24,511 3,739 28,250Exchange adjustments – (175) (175) – (5) (5)Acquisitions – 455 455 – – –Additions 2,871 394 3,265 4,464 336 4,800Transfers (993) – (993) (4,365) – (4,365)Deletions (1,897) (342) (2,239) (2,868) (134) (3,002)
At 31 December 21,723 4,268 25,991 21,742 3,936 25,678
AmortizationAt 1 January 877 2,762 3,639 1,077 2,541 3,618Exchange adjustments – (72) (72) – (2) (2)Charge for the year 3,029 304 3,333 2,710 267 2,977Impairment losses – 50 50 253 85 338Transfers – – – (365) – (365)Deletions (1,527) (339) (1,866) (2,798) (129) (2,927)
At 31 December 2,379 2,705 5,084 877 2,762 3,639
Net book amount at 31 December 19,344 1,563 20,907 20,865 1,174 22,039
Net book amount at 1 January 20,865 1,174 22,039 23,434 1,198 24,632
a For further information see Intangible assets within Note 1 and Note 6.
130 BP Annual Report and Form 20-F 2014
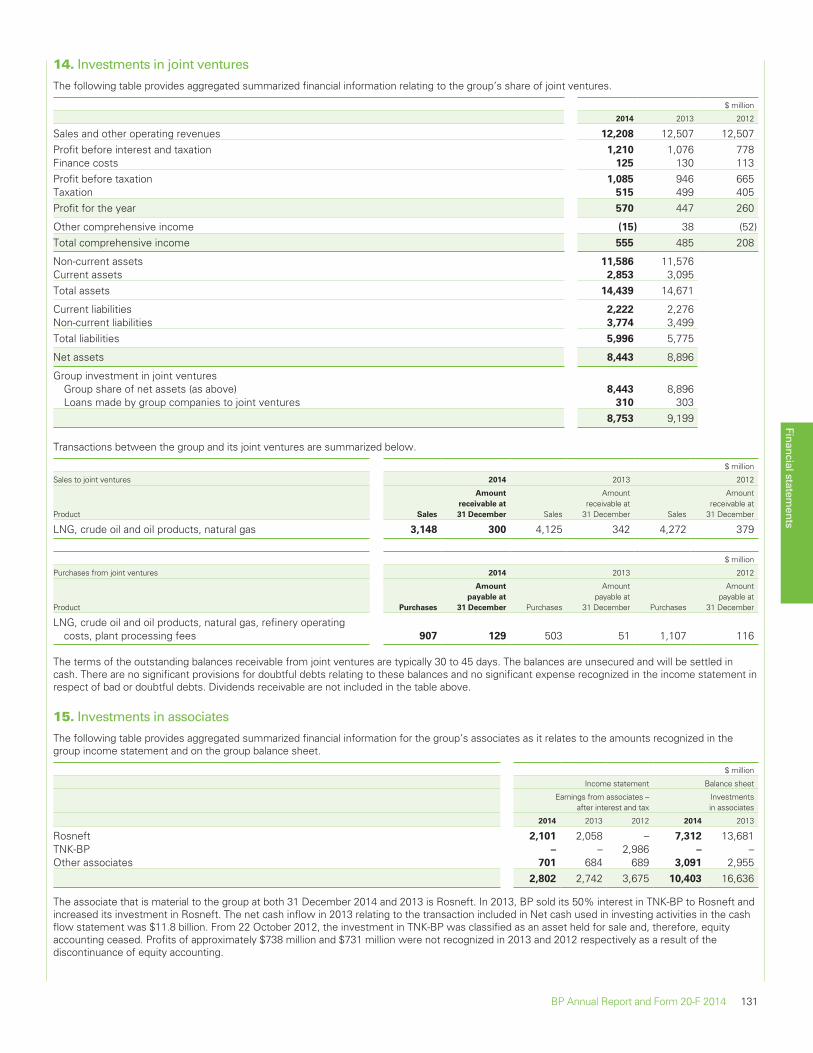
14. Investments in joint ventures
The following table provides aggregated summarized financial information relating to the group’s share of joint ventures.
$ million
2014 2013 2012
Sales and other operating revenues 12,208 12,507 12,507Profit before interest and taxation 1,210 1,076 778Finance costs 125 130 113Profit before taxation 1,085 946 665Taxation 515 499 405Profit for the year 570 447 260
Other comprehensive income (15) 38 (52)Total comprehensive income 555 485 208
Non-current assets 11,586 11,576Current assets 2,853 3,095Total assets 14,439 14,671
Current liabilities 2,222 2,276Non-current liabilities 3,774 3,499Total liabilities 5,996 5,775
Net assets 8,443 8,896
Group investment in joint venturesGroup share of net assets (as above) 8,443 8,896Loans made by group companies to joint ventures 310 303
8,753 9,199
Transactions between the group and its joint ventures are summarized below.
$ million
Sales to joint ventures 2014 2013 2012
Product Sales
Amount
receivable at
31 December Sales
Amountreceivable at
31 December Sales
Amountreceivable at
31 December
LNG, crude oil and oil products, natural gas 3,148 300 4,125 342 4,272 379
$ million
Purchases from joint ventures 2014 2013 2012
Product Purchases
Amount
payable at
31 December Purchases
Amountpayable at
31 December Purchases
Amountpayable at
31 December
LNG, crude oil and oil products, natural gas, refinery operatingcosts, plant processing fees 907 129 503 51 1,107 116
The terms of the outstanding balances receivable from joint ventures are typically 30 to 45 days. The balances are unsecured and will be settled incash. There are no significant provisions for doubtful debts relating to these balances and no significant expense recognized in the income statement inrespect of bad or doubtful debts. Dividends receivable are not included in the table above.
15. Investments in associates
The following table provides aggregated summarized financial information for the group’s associates as it relates to the amounts recognized in thegroup income statement and on the group balance sheet.
$ million
Income statement Balance sheet
Earnings from associates –after interest and tax
Investmentsin associates
2014 2013 2012 2014 2013
Rosneft 2,101 2,058 – 7,312 13,681TNK-BP – – 2,986 – –Other associates 701 684 689 3,091 2,955
2,802 2,742 3,675 10,403 16,636
The associate that is material to the group at both 31 December 2014 and 2013 is Rosneft. In 2013, BP sold its 50% interest in TNK-BP to Rosneft andincreased its investment in Rosneft. The net cash inflow in 2013 relating to the transaction included in Net cash used in investing activities in the cashflow statement was $11.8 billion. From 22 October 2012, the investment in TNK-BP was classified as an asset held for sale and, therefore, equityaccounting ceased. Profits of approximately $738 million and $731 million were not recognized in 2013 and 2012 respectively as a result of thediscontinuance of equity accounting.
Financial statements
BP Annual Report and Form 20-F 2014 131
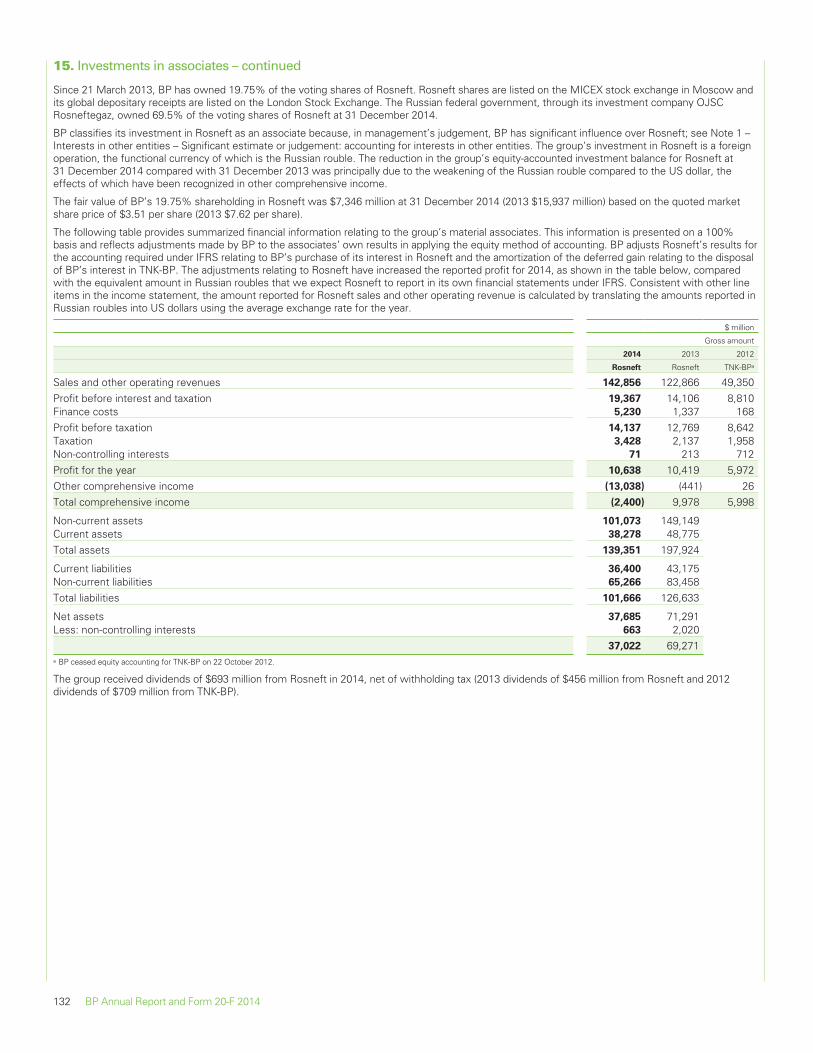
15. Investments in associates – continued
Since 21 March 2013, BP has owned 19.75% of the voting shares of Rosneft. Rosneft shares are listed on the MICEX stock exchange in Moscow andits global depositary receipts are listed on the London Stock Exchange. The Russian federal government, through its investment company OJSCRosneftegaz, owned 69.5% of the voting shares of Rosneft at 31 December 2014.
BP classifies its investment in Rosneft as an associate because, in management’s judgement, BP has significant influence over Rosneft; see Note 1 –Interests in other entities – Significant estimate or judgement: accounting for interests in other entities. The group’s investment in Rosneft is a foreignoperation, the functional currency of which is the Russian rouble. The reduction in the group’s equity-accounted investment balance for Rosneft at31 December 2014 compared with 31 December 2013 was principally due to the weakening of the Russian rouble compared to the US dollar, theeffects of which have been recognized in other comprehensive income.
The fair value of BP’s 19.75% shareholding in Rosneft was $7,346 million at 31 December 2014 (2013 $15,937 million) based on the quoted marketshare price of $3.51 per share (2013 $7.62 per share).
The following table provides summarized financial information relating to the group’s material associates. This information is presented on a 100%basis and reflects adjustments made by BP to the associates’ own results in applying the equity method of accounting. BP adjusts Rosneft’s results forthe accounting required under IFRS relating to BP’s purchase of its interest in Rosneft and the amortization of the deferred gain relating to the disposalof BP’s interest in TNK-BP. The adjustments relating to Rosneft have increased the reported profit for 2014, as shown in the table below, comparedwith the equivalent amount in Russian roubles that we expect Rosneft to report in its own financial statements under IFRS. Consistent with other lineitems in the income statement, the amount reported for Rosneft sales and other operating revenue is calculated by translating the amounts reported inRussian roubles into US dollars using the average exchange rate for the year.
$ million
Gross amount
2014 2013 2012
Rosneft Rosneft TNK-BPa
Sales and other operating revenues 142,856 122,866 49,350Profit before interest and taxation 19,367 14,106 8,810Finance costs 5,230 1,337 168Profit before taxation 14,137 12,769 8,642Taxation 3,428 2,137 1,958Non-controlling interests 71 213 712Profit for the year 10,638 10,419 5,972Other comprehensive income (13,038) (441) 26Total comprehensive income (2,400) 9,978 5,998
Non-current assets 101,073 149,149Current assets 38,278 48,775Total assets 139,351 197,924
Current liabilities 36,400 43,175Non-current liabilities 65,266 83,458Total liabilities 101,666 126,633
Net assets 37,685 71,291Less: non-controlling interests 663 2,020
37,022 69,271a BP ceased equity accounting for TNK-BP on 22 October 2012.
The group received dividends of $693 million from Rosneft in 2014, net of withholding tax (2013 dividends of $456 million from Rosneft and 2012dividends of $709 million from TNK-BP).
132 BP Annual Report and Form 20-F 2014
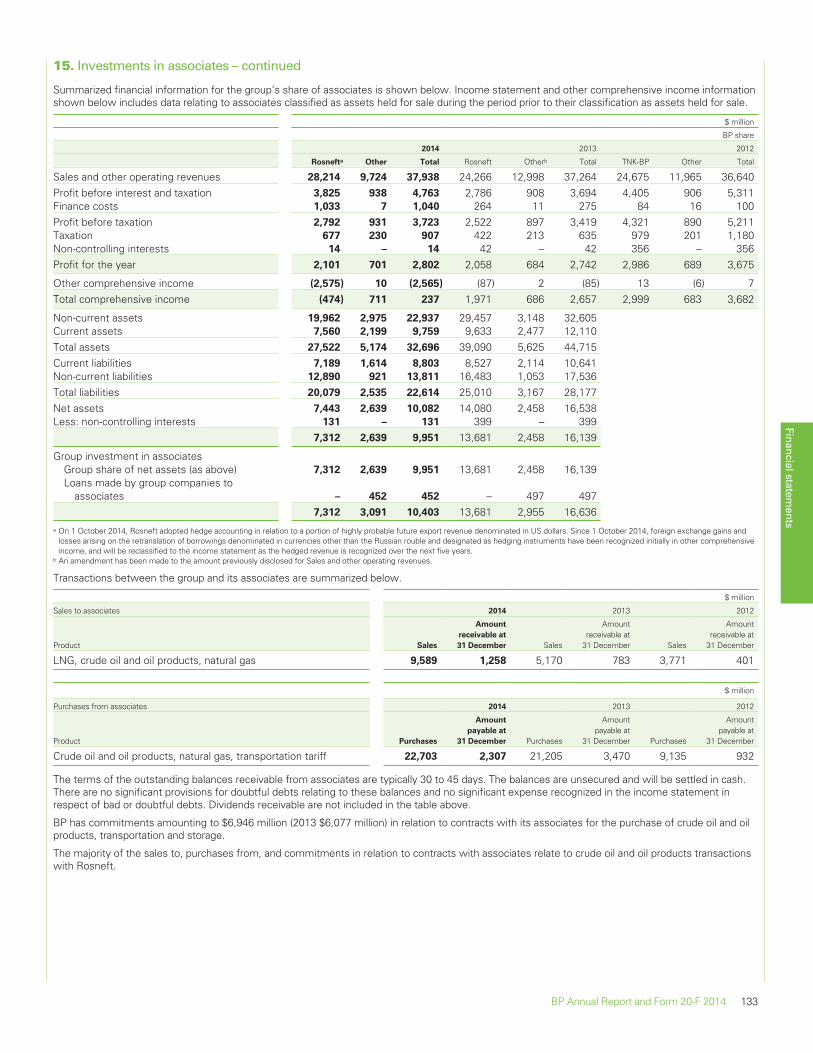
15. Investments in associates – continued
Summarized financial information for the group’s share of associates is shown below. Income statement and other comprehensive income informationshown below includes data relating to associates classified as assets held for sale during the period prior to their classification as assets held for sale.
$ million
BP share
2014 2013 2012
Rosnefta Other Total Rosneft Otherb Total TNK-BP Other Total
Sales and other operating revenues 28,214 9,724 37,938 24,266 12,998 37,264 24,675 11,965 36,640Profit before interest and taxation 3,825 938 4,763 2,786 908 3,694 4,405 906 5,311Finance costs 1,033 7 1,040 264 11 275 84 16 100Profit before taxation 2,792 931 3,723 2,522 897 3,419 4,321 890 5,211Taxation 677 230 907 422 213 635 979 201 1,180Non-controlling interests 14 – 14 42 – 42 356 – 356Profit for the year 2,101 701 2,802 2,058 684 2,742 2,986 689 3,675
Other comprehensive income (2,575) 10 (2,565) (87) 2 (85) 13 (6) 7Total comprehensive income (474) 711 237 1,971 686 2,657 2,999 683 3,682
Non-current assets 19,962 2,975 22,937 29,457 3,148 32,605Current assets 7,560 2,199 9,759 9,633 2,477 12,110Total assets 27,522 5,174 32,696 39,090 5,625 44,715Current liabilities 7,189 1,614 8,803 8,527 2,114 10,641Non-current liabilities 12,890 921 13,811 16,483 1,053 17,536Total liabilities 20,079 2,535 22,614 25,010 3,167 28,177Net assets 7,443 2,639 10,082 14,080 2,458 16,538Less: non-controlling interests 131 – 131 399 – 399
7,312 2,639 9,951 13,681 2,458 16,139
Group investment in associatesGroup share of net assets (as above) 7,312 2,639 9,951 13,681 2,458 16,139Loans made by group companies to
associates – 452 452 – 497 4977,312 3,091 10,403 13,681 2,955 16,636
a On 1 October 2014, Rosneft adopted hedge accounting in relation to a portion of highly probable future export revenue denominated in US dollars. Since 1 October 2014, foreign exchange gains andlosses arising on the retranslation of borrowings denominated in currencies other than the Russian rouble and designated as hedging instruments have been recognized initially in other comprehensiveincome, and will be reclassified to the income statement as the hedged revenue is recognized over the next five years.
b An amendment has been made to the amount previously disclosed for Sales and other operating revenues.
Transactions between the group and its associates are summarized below.
$ million
Sales to associates 2014 2013 2012
Product Sales
Amount
receivable at
31 December Sales
Amountreceivable at
31 December Sales
Amountreceivable at
31 December
LNG, crude oil and oil products, natural gas 9,589 1,258 5,170 783 3,771 401
$ million
Purchases from associates 2014 2013 2012
Product Purchases
Amount
payable at
31 December Purchases
Amountpayable at
31 December Purchases
Amountpayable at
31 December
Crude oil and oil products, natural gas, transportation tariff 22,703 2,307 21,205 3,470 9,135 932
The terms of the outstanding balances receivable from associates are typically 30 to 45 days. The balances are unsecured and will be settled in cash.There are no significant provisions for doubtful debts relating to these balances and no significant expense recognized in the income statement inrespect of bad or doubtful debts. Dividends receivable are not included in the table above.
BP has commitments amounting to $6,946 million (2013 $6,077 million) in relation to contracts with its associates for the purchase of crude oil and oilproducts, transportation and storage.
The majority of the sales to, purchases from, and commitments in relation to contracts with associates relate to crude oil and oil products transactionswith Rosneft.
Financial statements
BP Annual Report and Form 20-F 2014 133
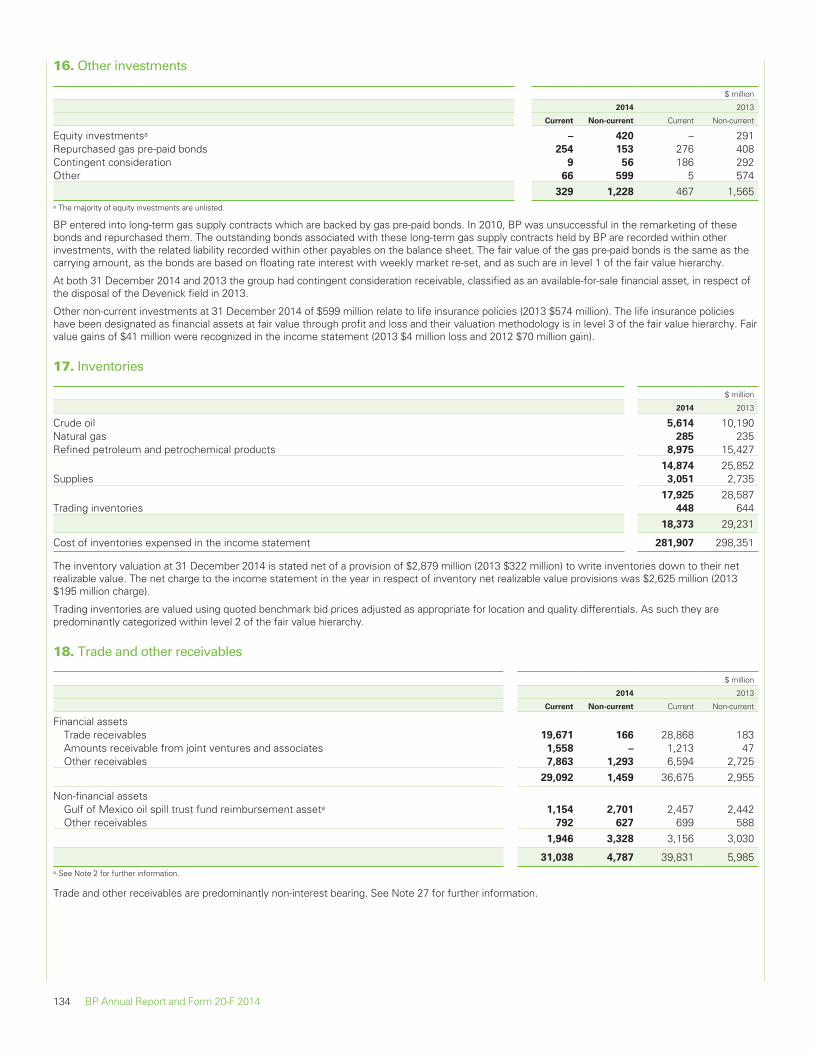
16. Other investments
$ million
2014 2013
Current Non-current Current Non-current
Equity investmentsa – 420 – 291Repurchased gas pre-paid bonds 254 153 276 408Contingent consideration 9 56 186 292Other 66 599 5 574
329 1,228 467 1,565a The majority of equity investments are unlisted.
BP entered into long-term gas supply contracts which are backed by gas pre-paid bonds. In 2010, BP was unsuccessful in the remarketing of thesebonds and repurchased them. The outstanding bonds associated with these long-term gas supply contracts held by BP are recorded within otherinvestments, with the related liability recorded within other payables on the balance sheet. The fair value of the gas pre-paid bonds is the same as thecarrying amount, as the bonds are based on floating rate interest with weekly market re-set, and as such are in level 1 of the fair value hierarchy.
At both 31 December 2014 and 2013 the group had contingent consideration receivable, classified as an available-for-sale financial asset, in respect ofthe disposal of the Devenick field in 2013.
Other non-current investments at 31 December 2014 of $599 million relate to life insurance policies (2013 $574 million). The life insurance policieshave been designated as financial assets at fair value through profit and loss and their valuation methodology is in level 3 of the fair value hierarchy. Fairvalue gains of $41 million were recognized in the income statement (2013 $4 million loss and 2012 $70 million gain).
17. Inventories
$ million
2014 2013
Crude oil 5,614 10,190Natural gas 285 235Refined petroleum and petrochemical products 8,975 15,427
14,874 25,852Supplies 3,051 2,735
17,925 28,587Trading inventories 448 644
18,373 29,231
Cost of inventories expensed in the income statement 281,907 298,351
The inventory valuation at 31 December 2014 is stated net of a provision of $2,879 million (2013 $322 million) to write inventories down to their netrealizable value. The net charge to the income statement in the year in respect of inventory net realizable value provisions was $2,625 million (2013$195 million charge).
Trading inventories are valued using quoted benchmark bid prices adjusted as appropriate for location and quality differentials. As such they arepredominantly categorized within level 2 of the fair value hierarchy.
18. Trade and other receivables
$ million
2014 2013
Current Non-current Current Non-current
Financial assetsTrade receivables 19,671 166 28,868 183Amounts receivable from joint ventures and associates 1,558 – 1,213 47Other receivables 7,863 1,293 6,594 2,725
29,092 1,459 36,675 2,955
Non-financial assetsGulf of Mexico oil spill trust fund reimbursement asseta 1,154 2,701 2,457 2,442Other receivables 792 627 699 588
1,946 3,328 3,156 3,030
31,038 4,787 39,831 5,985a See Note 2 for further information.
Trade and other receivables are predominantly non-interest bearing. See Note 27 for further information.
134 BP Annual Report and Form 20-F 2014
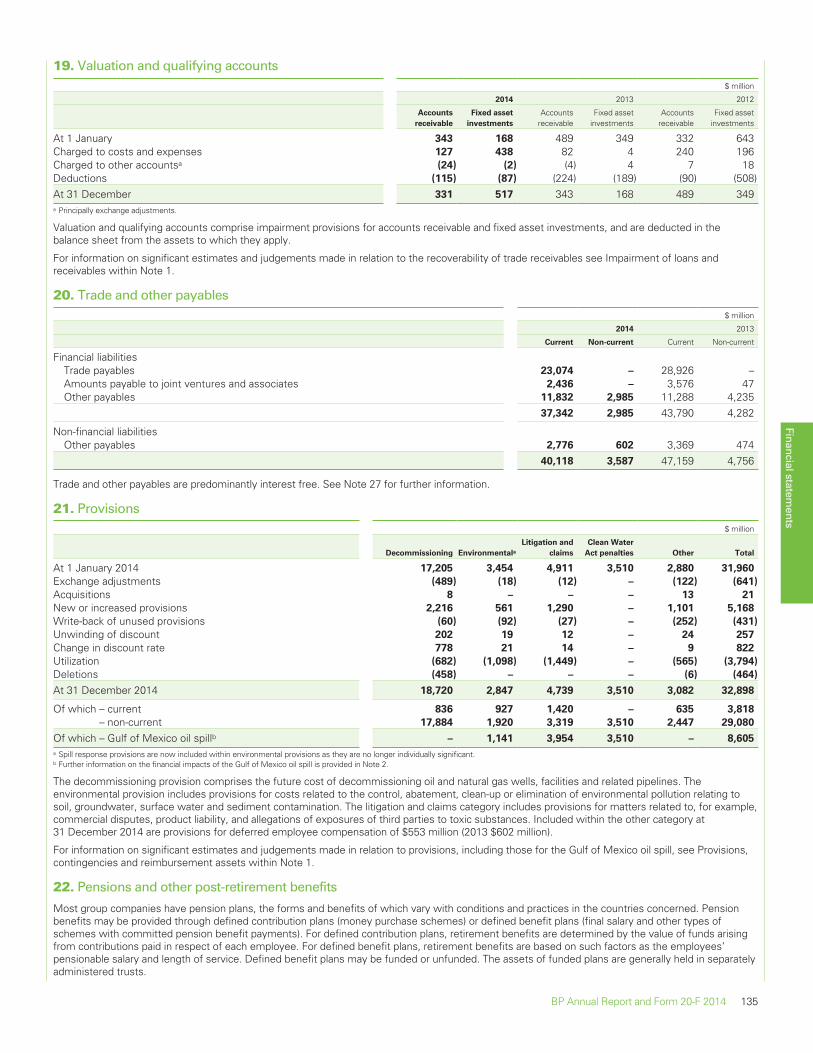
19. Valuation and qualifying accounts$ million
2014 2013 2012
Accounts
receivable
Fixed asset
investments
Accountsreceivable
Fixed assetinvestments
Accountsreceivable
Fixed assetinvestments
At 1 January 343 168 489 349 332 643Charged to costs and expenses 127 438 82 4 240 196Charged to other accountsa (24) (2) (4) 4 7 18Deductions (115) (87) (224) (189) (90) (508)At 31 December 331 517 343 168 489 349a Principally exchange adjustments.
Valuation and qualifying accounts comprise impairment provisions for accounts receivable and fixed asset investments, and are deducted in thebalance sheet from the assets to which they apply.
For information on significant estimates and judgements made in relation to the recoverability of trade receivables see Impairment of loans andreceivables within Note 1.
20. Trade and other payables$ million
2014 2013
Current Non-current Current Non-current
Financial liabilitiesTrade payables 23,074 – 28,926 –Amounts payable to joint ventures and associates 2,436 – 3,576 47Other payables 11,832 2,985 11,288 4,235
37,342 2,985 43,790 4,282
Non-financial liabilitiesOther payables 2,776 602 3,369 474
40,118 3,587 47,159 4,756
Trade and other payables are predominantly interest free. See Note 27 for further information.
21. Provisions$ million
Decommissioning EnvironmentalaLitigation and
claims
Clean Water
Act penalties Other Total
At 1 January 2014 17,205 3,454 4,911 3,510 2,880 31,960
Exchange adjustments (489) (18) (12) – (122) (641)
Acquisitions 8 – – – 13 21
New or increased provisions 2,216 561 1,290 – 1,101 5,168
Write-back of unused provisions (60) (92) (27) – (252) (431)
Unwinding of discount 202 19 12 – 24 257
Change in discount rate 778 21 14 – 9 822
Utilization (682) (1,098) (1,449) – (565) (3,794)
Deletions (458) – – – (6) (464)
At 31 December 2014 18,720 2,847 4,739 3,510 3,082 32,898
Of which – current 836 927 1,420 – 635 3,818
– non-current 17,884 1,920 3,319 3,510 2,447 29,080
Of which – Gulf of Mexico oil spillb – 1,141 3,954 3,510 – 8,605
a Spill response provisions are now included within environmental provisions as they are no longer individually significant.b Further information on the financial impacts of the Gulf of Mexico oil spill is provided in Note 2.
The decommissioning provision comprises the future cost of decommissioning oil and natural gas wells, facilities and related pipelines. Theenvironmental provision includes provisions for costs related to the control, abatement, clean-up or elimination of environmental pollution relating tosoil, groundwater, surface water and sediment contamination. The litigation and claims category includes provisions for matters related to, for example,commercial disputes, product liability, and allegations of exposures of third parties to toxic substances. Included within the other category at31 December 2014 are provisions for deferred employee compensation of $553 million (2013 $602 million).
For information on significant estimates and judgements made in relation to provisions, including those for the Gulf of Mexico oil spill, see Provisions,contingencies and reimbursement assets within Note 1.
22. Pensions and other post-retirement benefits
Most group companies have pension plans, the forms and benefits of which vary with conditions and practices in the countries concerned. Pensionbenefits may be provided through defined contribution plans (money purchase schemes) or defined benefit plans (final salary and other types ofschemes with committed pension benefit payments). For defined contribution plans, retirement benefits are determined by the value of funds arisingfrom contributions paid in respect of each employee. For defined benefit plans, retirement benefits are based on such factors as the employees’pensionable salary and length of service. Defined benefit plans may be funded or unfunded. The assets of funded plans are generally held in separatelyadministered trusts.
Financial statements
BP Annual Report and Form 20-F 2014 135
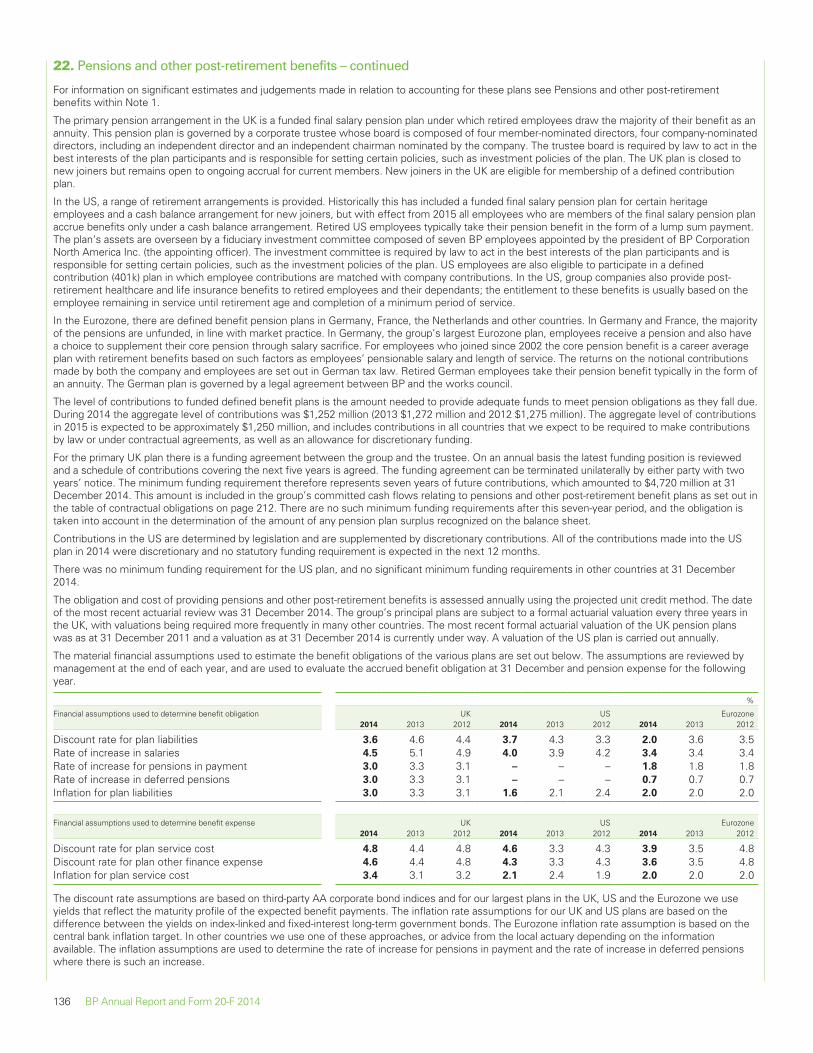
22. Pensions and other post-retirement benefits – continued
For information on significant estimates and judgements made in relation to accounting for these plans see Pensions and other post-retirementbenefits within Note 1.
The primary pension arrangement in the UK is a funded final salary pension plan under which retired employees draw the majority of their benefit as anannuity. This pension plan is governed by a corporate trustee whose board is composed of four member-nominated directors, four company-nominateddirectors, including an independent director and an independent chairman nominated by the company. The trustee board is required by law to act in thebest interests of the plan participants and is responsible for setting certain policies, such as investment policies of the plan. The UK plan is closed tonew joiners but remains open to ongoing accrual for current members. New joiners in the UK are eligible for membership of a defined contributionplan.
In the US, a range of retirement arrangements is provided. Historically this has included a funded final salary pension plan for certain heritageemployees and a cash balance arrangement for new joiners, but with effect from 2015 all employees who are members of the final salary pension planaccrue benefits only under a cash balance arrangement. Retired US employees typically take their pension benefit in the form of a lump sum payment.The plan’s assets are overseen by a fiduciary investment committee composed of seven BP employees appointed by the president of BP CorporationNorth America Inc. (the appointing officer). The investment committee is required by law to act in the best interests of the plan participants and isresponsible for setting certain policies, such as the investment policies of the plan. US employees are also eligible to participate in a definedcontribution (401k) plan in which employee contributions are matched with company contributions. In the US, group companies also provide post-retirement healthcare and life insurance benefits to retired employees and their dependants; the entitlement to these benefits is usually based on theemployee remaining in service until retirement age and completion of a minimum period of service.
In the Eurozone, there are defined benefit pension plans in Germany, France, the Netherlands and other countries. In Germany and France, the majorityof the pensions are unfunded, in line with market practice. In Germany, the group’s largest Eurozone plan, employees receive a pension and also havea choice to supplement their core pension through salary sacrifice. For employees who joined since 2002 the core pension benefit is a career averageplan with retirement benefits based on such factors as employees’ pensionable salary and length of service. The returns on the notional contributionsmade by both the company and employees are set out in German tax law. Retired German employees take their pension benefit typically in the form ofan annuity. The German plan is governed by a legal agreement between BP and the works council.
The level of contributions to funded defined benefit plans is the amount needed to provide adequate funds to meet pension obligations as they fall due.During 2014 the aggregate level of contributions was $1,252 million (2013 $1,272 million and 2012 $1,275 million). The aggregate level of contributionsin 2015 is expected to be approximately $1,250 million, and includes contributions in all countries that we expect to be required to make contributionsby law or under contractual agreements, as well as an allowance for discretionary funding.
For the primary UK plan there is a funding agreement between the group and the trustee. On an annual basis the latest funding position is reviewedand a schedule of contributions covering the next five years is agreed. The funding agreement can be terminated unilaterally by either party with twoyears’ notice. The minimum funding requirement therefore represents seven years of future contributions, which amounted to $4,720 million at 31December 2014. This amount is included in the group’s committed cash flows relating to pensions and other post-retirement benefit plans as set out inthe table of contractual obligations on page 212. There are no such minimum funding requirements after this seven-year period, and the obligation istaken into account in the determination of the amount of any pension plan surplus recognized on the balance sheet.
Contributions in the US are determined by legislation and are supplemented by discretionary contributions. All of the contributions made into the USplan in 2014 were discretionary and no statutory funding requirement is expected in the next 12 months.
There was no minimum funding requirement for the US plan, and no significant minimum funding requirements in other countries at 31 December2014.
The obligation and cost of providing pensions and other post-retirement benefits is assessed annually using the projected unit credit method. The dateof the most recent actuarial review was 31 December 2014. The group’s principal plans are subject to a formal actuarial valuation every three years inthe UK, with valuations being required more frequently in many other countries. The most recent formal actuarial valuation of the UK pension planswas as at 31 December 2011 and a valuation as at 31 December 2014 is currently under way. A valuation of the US plan is carried out annually.
The material financial assumptions used to estimate the benefit obligations of the various plans are set out below. The assumptions are reviewed bymanagement at the end of each year, and are used to evaluate the accrued benefit obligation at 31 December and pension expense for the followingyear.
%
Financial assumptions used to determine benefit obligation2014 2013
UK2012 2014 2013
US2012 2014 2013
Eurozone2012
Discount rate for plan liabilities 3.6 4.6 4.4 3.7 4.3 3.3 2.0 3.6 3.5Rate of increase in salaries 4.5 5.1 4.9 4.0 3.9 4.2 3.4 3.4 3.4Rate of increase for pensions in payment 3.0 3.3 3.1 – – – 1.8 1.8 1.8Rate of increase in deferred pensions 3.0 3.3 3.1 – – – 0.7 0.7 0.7Inflation for plan liabilities 3.0 3.3 3.1 1.6 2.1 2.4 2.0 2.0 2.0
Financial assumptions used to determine benefit expense2014 2013
UK2012 2014 2013
US2012 2014 2013
Eurozone2012
Discount rate for plan service cost 4.8 4.4 4.8 4.6 3.3 4.3 3.9 3.5 4.8Discount rate for plan other finance expense 4.6 4.4 4.8 4.3 3.3 4.3 3.6 3.5 4.8Inflation for plan service cost 3.4 3.1 3.2 2.1 2.4 1.9 2.0 2.0 2.0
The discount rate assumptions are based on third-party AA corporate bond indices and for our largest plans in the UK, US and the Eurozone we useyields that reflect the maturity profile of the expected benefit payments. The inflation rate assumptions for our UK and US plans are based on thedifference between the yields on index-linked and fixed-interest long-term government bonds. The Eurozone inflation rate assumption is based on thecentral bank inflation target. In other countries we use one of these approaches, or advice from the local actuary depending on the informationavailable. The inflation assumptions are used to determine the rate of increase for pensions in payment and the rate of increase in deferred pensionswhere there is such an increase.
136 BP Annual Report and Form 20-F 2014
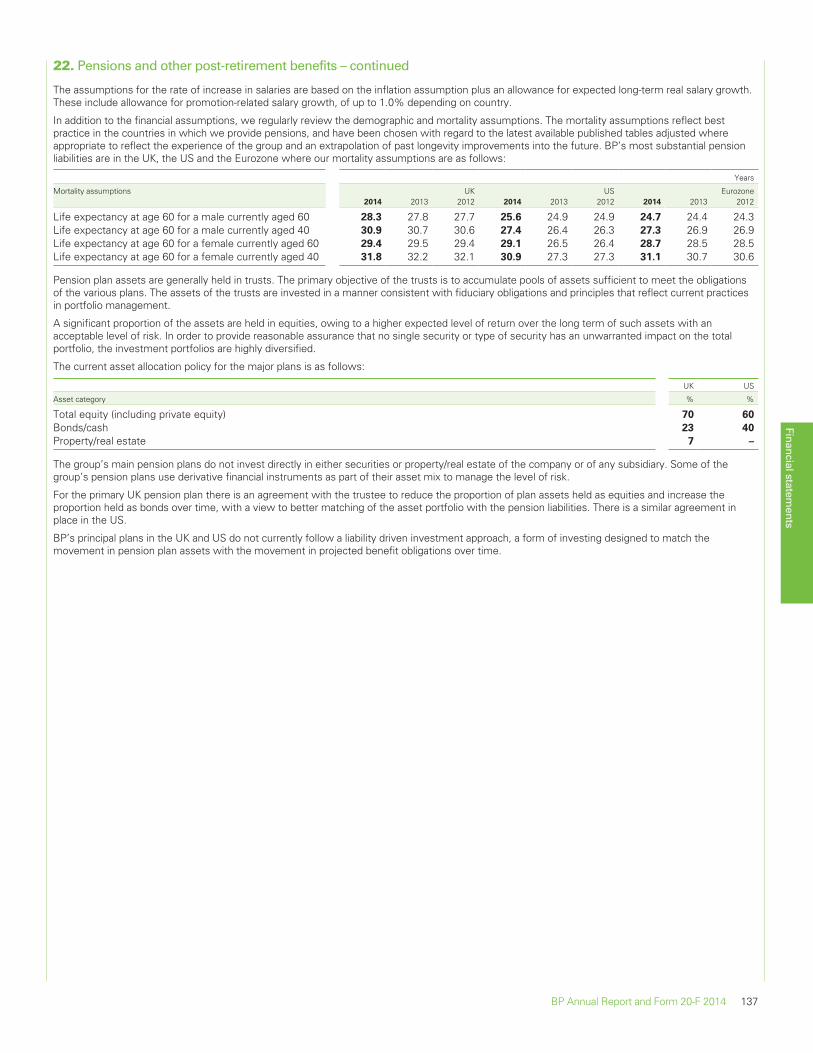
22. Pensions and other post-retirement benefits – continued
The assumptions for the rate of increase in salaries are based on the inflation assumption plus an allowance for expected long-term real salary growth.These include allowance for promotion-related salary growth, of up to 1.0% depending on country.
In addition to the financial assumptions, we regularly review the demographic and mortality assumptions. The mortality assumptions reflect bestpractice in the countries in which we provide pensions, and have been chosen with regard to the latest available published tables adjusted whereappropriate to reflect the experience of the group and an extrapolation of past longevity improvements into the future. BP’s most substantial pensionliabilities are in the UK, the US and the Eurozone where our mortality assumptions are as follows:
Years
Mortality assumptions2014 2013
UK2012 2014 2013
US2012 2014 2013
Eurozone2012
Life expectancy at age 60 for a male currently aged 60 28.3 27.8 27.7 25.6 24.9 24.9 24.7 24.4 24.3Life expectancy at age 60 for a male currently aged 40 30.9 30.7 30.6 27.4 26.4 26.3 27.3 26.9 26.9Life expectancy at age 60 for a female currently aged 60 29.4 29.5 29.4 29.1 26.5 26.4 28.7 28.5 28.5Life expectancy at age 60 for a female currently aged 40 31.8 32.2 32.1 30.9 27.3 27.3 31.1 30.7 30.6
Pension plan assets are generally held in trusts. The primary objective of the trusts is to accumulate pools of assets sufficient to meet the obligationsof the various plans. The assets of the trusts are invested in a manner consistent with fiduciary obligations and principles that reflect current practicesin portfolio management.
A significant proportion of the assets are held in equities, owing to a higher expected level of return over the long term of such assets with anacceptable level of risk. In order to provide reasonable assurance that no single security or type of security has an unwarranted impact on the totalportfolio, the investment portfolios are highly diversified.
The current asset allocation policy for the major plans is as follows:
UK US
Asset category % %
Total equity (including private equity) 70 60
Bonds/cash 23 40
Property/real estate 7 –
The group’s main pension plans do not invest directly in either securities or property/real estate of the company or of any subsidiary. Some of thegroup’s pension plans use derivative financial instruments as part of their asset mix to manage the level of risk.
For the primary UK pension plan there is an agreement with the trustee to reduce the proportion of plan assets held as equities and increase theproportion held as bonds over time, with a view to better matching of the asset portfolio with the pension liabilities. There is a similar agreement inplace in the US.
BP’s principal plans in the UK and US do not currently follow a liability driven investment approach, a form of investing designed to match themovement in pension plan assets with the movement in projected benefit obligations over time.
Financial statements
BP Annual Report and Form 20-F 2014 137
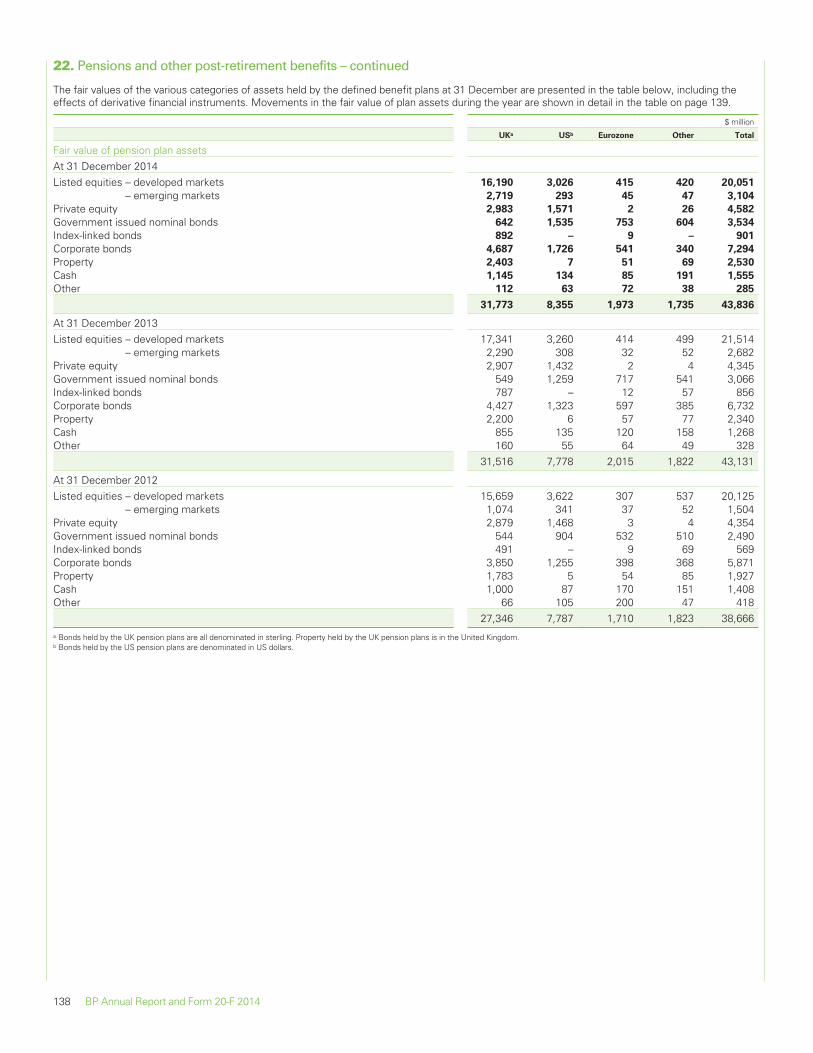
22. Pensions and other post-retirement benefits – continued
The fair values of the various categories of assets held by the defined benefit plans at 31 December are presented in the table below, including theeffects of derivative financial instruments. Movements in the fair value of plan assets during the year are shown in detail in the table on page 139.
$ million
UKa USb Eurozone Other Total
Fair value of pension plan assetsAt 31 December 2014Listed equities – developed markets 16,190 3,026 415 420 20,051
– emerging markets 2,719 293 45 47 3,104
Private equity 2,983 1,571 2 26 4,582
Government issued nominal bonds 642 1,535 753 604 3,534
Index-linked bonds 892 – 9 – 901
Corporate bonds 4,687 1,726 541 340 7,294
Property 2,403 7 51 69 2,530
Cash 1,145 134 85 191 1,555
Other 112 63 72 38 285
31,773 8,355 1,973 1,735 43,836
At 31 December 2013Listed equities – developed markets 17,341 3,260 414 499 21,514
– emerging markets 2,290 308 32 52 2,682Private equity 2,907 1,432 2 4 4,345Government issued nominal bonds 549 1,259 717 541 3,066Index-linked bonds 787 – 12 57 856Corporate bonds 4,427 1,323 597 385 6,732Property 2,200 6 57 77 2,340Cash 855 135 120 158 1,268Other 160 55 64 49 328
31,516 7,778 2,015 1,822 43,131
At 31 December 2012Listed equities – developed markets 15,659 3,622 307 537 20,125
– emerging markets 1,074 341 37 52 1,504Private equity 2,879 1,468 3 4 4,354Government issued nominal bonds 544 904 532 510 2,490Index-linked bonds 491 – 9 69 569Corporate bonds 3,850 1,255 398 368 5,871Property 1,783 5 54 85 1,927Cash 1,000 87 170 151 1,408Other 66 105 200 47 418
27,346 7,787 1,710 1,823 38,666a Bonds held by the UK pension plans are all denominated in sterling. Property held by the UK pension plans is in the United Kingdom.b Bonds held by the US pension plans are denominated in US dollars.
138 BP Annual Report and Form 20-F 2014
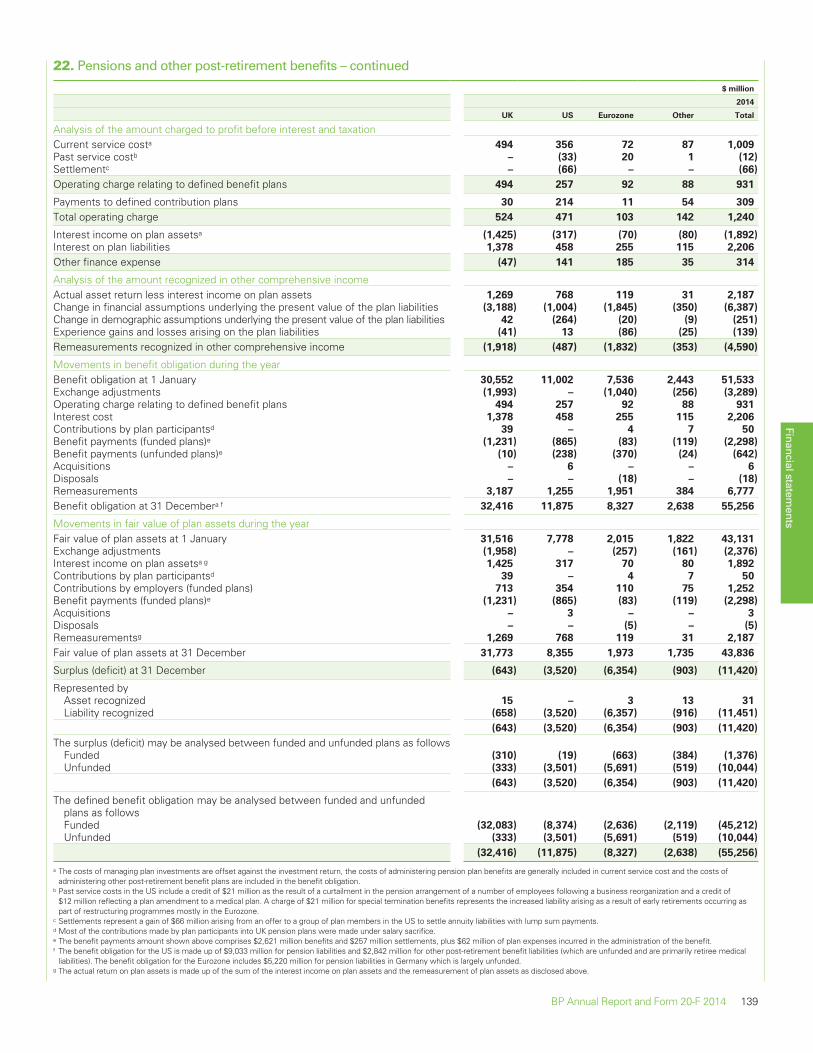
22. Pensions and other post-retirement benefits – continued
$ million
2014
UK US Eurozone Other Total
Analysis of the amount charged to profit before interest and taxationCurrent service costa 494 356 72 87 1,009
Past service costb – (33) 20 1 (12)
Settlementc – (66) – – (66)
Operating charge relating to defined benefit plans 494 257 92 88 931
Payments to defined contribution plans 30 214 11 54 309
Total operating charge 524 471 103 142 1,240
Interest income on plan assetsa (1,425) (317) (70) (80) (1,892)
Interest on plan liabilities 1,378 458 255 115 2,206
Other finance expense (47) 141 185 35 314
Analysis of the amount recognized in other comprehensive incomeActual asset return less interest income on plan assets 1,269 768 119 31 2,187
Change in financial assumptions underlying the present value of the plan liabilities (3,188) (1,004) (1,845) (350) (6,387)
Change in demographic assumptions underlying the present value of the plan liabilities 42 (264) (20) (9) (251)
Experience gains and losses arising on the plan liabilities (41) 13 (86) (25) (139)
Remeasurements recognized in other comprehensive income (1,918) (487) (1,832) (353) (4,590)
Movements in benefit obligation during the yearBenefit obligation at 1 January 30,552 11,002 7,536 2,443 51,533
Exchange adjustments (1,993) – (1,040) (256) (3,289)
Operating charge relating to defined benefit plans 494 257 92 88 931
Interest cost 1,378 458 255 115 2,206
Contributions by plan participantsd 39 – 4 7 50
Benefit payments (funded plans)e (1,231) (865) (83) (119) (2,298)
Benefit payments (unfunded plans)e (10) (238) (370) (24) (642)
Acquisitions – 6 – – 6
Disposals – – (18) – (18)
Remeasurements 3,187 1,255 1,951 384 6,777
Benefit obligation at 31 Decembera f 32,416 11,875 8,327 2,638 55,256
Movements in fair value of plan assets during the yearFair value of plan assets at 1 January 31,516 7,778 2,015 1,822 43,131
Exchange adjustments (1,958) – (257) (161) (2,376)
Interest income on plan assetsa g 1,425 317 70 80 1,892
Contributions by plan participantsd 39 – 4 7 50
Contributions by employers (funded plans) 713 354 110 75 1,252
Benefit payments (funded plans)e (1,231) (865) (83) (119) (2,298)
Acquisitions – 3 – – 3
Disposals – – (5) – (5)
Remeasurementsg 1,269 768 119 31 2,187
Fair value of plan assets at 31 December 31,773 8,355 1,973 1,735 43,836
Surplus (deficit) at 31 December (643) (3,520) (6,354) (903) (11,420)
Represented byAsset recognized 15 – 3 13 31
Liability recognized (658) (3,520) (6,357) (916) (11,451)
(643) (3,520) (6,354) (903) (11,420)
The surplus (deficit) may be analysed between funded and unfunded plans as followsFunded (310) (19) (663) (384) (1,376)
Unfunded (333) (3,501) (5,691) (519) (10,044)
(643) (3,520) (6,354) (903) (11,420)
The defined benefit obligation may be analysed between funded and unfundedplans as followsFunded (32,083) (8,374) (2,636) (2,119) (45,212)
Unfunded (333) (3,501) (5,691) (519) (10,044)
(32,416) (11,875) (8,327) (2,638) (55,256)
a The costs of managing plan investments are offset against the investment return, the costs of administering pension plan benefits are generally included in current service cost and the costs ofadministering other post-retirement benefit plans are included in the benefit obligation.
b Past service costs in the US include a credit of $21 million as the result of a curtailment in the pension arrangement of a number of employees following a business reorganization and a credit of$12 million reflecting a plan amendment to a medical plan. A charge of $21 million for special termination benefits represents the increased liability arising as a result of early retirements occurring aspart of restructuring programmes mostly in the Eurozone.
c Settlements represent a gain of $66 million arising from an offer to a group of plan members in the US to settle annuity liabilities with lump sum payments.d Most of the contributions made by plan participants into UK pension plans were made under salary sacrifice.e The benefit payments amount shown above comprises $2,621 million benefits and $257 million settlements, plus $62 million of plan expenses incurred in the administration of the benefit.f The benefit obligation for the US is made up of $9,033 million for pension liabilities and $2,842 million for other post-retirement benefit liabilities (which are unfunded and are primarily retiree medical
liabilities). The benefit obligation for the Eurozone includes $5,220 million for pension liabilities in Germany which is largely unfunded.g The actual return on plan assets is made up of the sum of the interest income on plan assets and the remeasurement of plan assets as disclosed above.
Financial statements
BP Annual Report and Form 20-F 2014 139
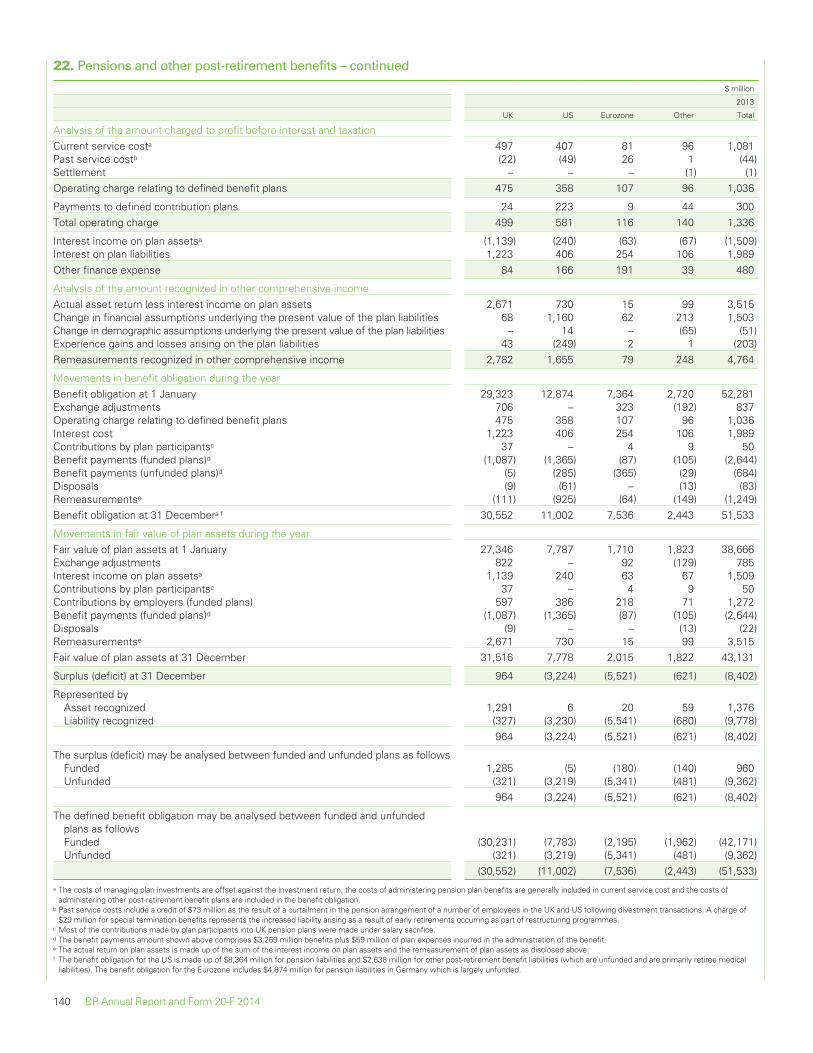
22. Pensions and other post-retirement benefits – continued
$ million
2013
UK US Eurozone Other Total
Analysis of the amount charged to profit before interest and taxationCurrent service costa 497 407 81 96 1,081Past service costb (22) (49) 26 1 (44)Settlement – – – (1) (1)Operating charge relating to defined benefit plans 475 358 107 96 1,036
Payments to defined contribution plans 24 223 9 44 300Total operating charge 499 581 116 140 1,336
Interest income on plan assetsa (1,139) (240) (63) (67) (1,509)Interest on plan liabilities 1,223 406 254 106 1,989Other finance expense 84 166 191 39 480
Analysis of the amount recognized in other comprehensive incomeActual asset return less interest income on plan assets 2,671 730 15 99 3,515Change in financial assumptions underlying the present value of the plan liabilities 68 1,160 62 213 1,503Change in demographic assumptions underlying the present value of the plan liabilities – 14 – (65) (51)Experience gains and losses arising on the plan liabilities 43 (249) 2 1 (203)Remeasurements recognized in other comprehensive income 2,782 1,655 79 248 4,764
Movements in benefit obligation during the yearBenefit obligation at 1 January 29,323 12,874 7,364 2,720 52,281Exchange adjustments 706 – 323 (192) 837Operating charge relating to defined benefit plans 475 358 107 96 1,036Interest cost 1,223 406 254 106 1,989Contributions by plan participantsc 37 – 4 9 50Benefit payments (funded plans)d (1,087) (1,365) (87) (105) (2,644)Benefit payments (unfunded plans)d (5) (285) (365) (29) (684)Disposals (9) (61) – (13) (83)Remeasurementse (111) (925) (64) (149) (1,249)Benefit obligation at 31 Decembera f 30,552 11,002 7,536 2,443 51,533
Movements in fair value of plan assets during the yearFair value of plan assets at 1 January 27,346 7,787 1,710 1,823 38,666Exchange adjustments 822 – 92 (129) 785Interest income on plan assetsa 1,139 240 63 67 1,509Contributions by plan participantsc 37 – 4 9 50Contributions by employers (funded plans) 597 386 218 71 1,272Benefit payments (funded plans)d (1,087) (1,365) (87) (105) (2,644)Disposals (9) – – (13) (22)Remeasurementse 2,671 730 15 99 3,515Fair value of plan assets at 31 December 31,516 7,778 2,015 1,822 43,131
Surplus (deficit) at 31 December 964 (3,224) (5,521) (621) (8,402)
Represented byAsset recognized 1,291 6 20 59 1,376Liability recognized (327) (3,230) (5,541) (680) (9,778)
964 (3,224) (5,521) (621) (8,402)
The surplus (deficit) may be analysed between funded and unfunded plans as followsFunded 1,285 (5) (180) (140) 960Unfunded (321) (3,219) (5,341) (481) (9,362)
964 (3,224) (5,521) (621) (8,402)
The defined benefit obligation may be analysed between funded and unfundedplans as followsFunded (30,231) (7,783) (2,195) (1,962) (42,171)Unfunded (321) (3,219) (5,341) (481) (9,362)
(30,552) (11,002) (7,536) (2,443) (51,533)a The costs of managing plan investments are offset against the investment return, the costs of administering pension plan benefits are generally included in current service cost and the costs of
administering other post-retirement benefit plans are included in the benefit obligation.b Past service costs include a credit of $73 million as the result of a curtailment in the pension arrangement of a number of employees in the UK and US following divestment transactions. A charge of
$29 million for special termination benefits represents the increased liability arising as a result of early retirements occurring as part of restructuring programmes.c Most of the contributions made by plan participants into UK pension plans were made under salary sacrifice.d The benefit payments amount shown above comprises $3,269 million benefits plus $59 million of plan expenses incurred in the administration of the benefit.e The actual return on plan assets is made up of the sum of the interest income on plan assets and the remeasurement of plan assets as disclosed above.f The benefit obligation for the US is made up of $8,364 million for pension liabilities and $2,638 million for other post-retirement benefit liabilities (which are unfunded and are primarily retiree medical
liabilities). The benefit obligation for the Eurozone includes $4,874 million for pension liabilities in Germany which is largely unfunded.
140 BP Annual Report and Form 20-F 2014
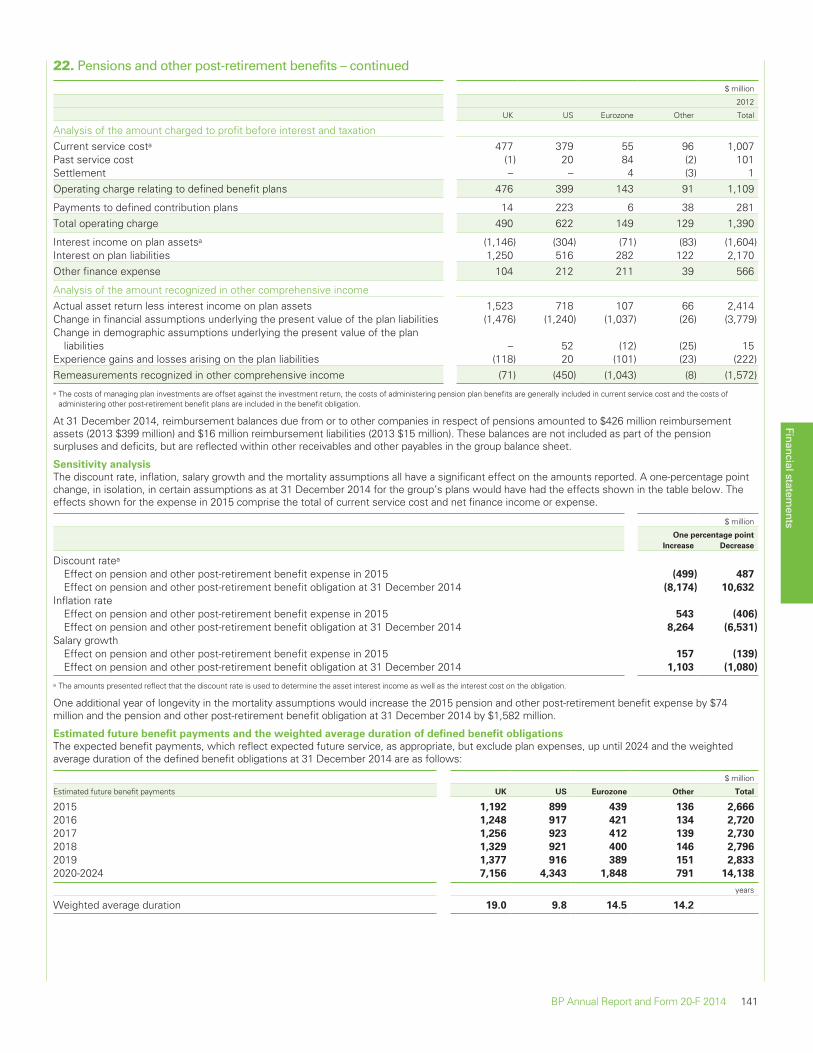
22. Pensions and other post-retirement benefits – continued
$ million
2012
UK US Eurozone Other Total
Analysis of the amount charged to profit before interest and taxationCurrent service costa 477 379 55 96 1,007Past service cost (1) 20 84 (2) 101Settlement – – 4 (3) 1Operating charge relating to defined benefit plans 476 399 143 91 1,109
Payments to defined contribution plans 14 223 6 38 281Total operating charge 490 622 149 129 1,390
Interest income on plan assetsa (1,146) (304) (71) (83) (1,604)Interest on plan liabilities 1,250 516 282 122 2,170Other finance expense 104 212 211 39 566
Analysis of the amount recognized in other comprehensive incomeActual asset return less interest income on plan assets 1,523 718 107 66 2,414Change in financial assumptions underlying the present value of the plan liabilities (1,476) (1,240) (1,037) (26) (3,779)Change in demographic assumptions underlying the present value of the plan
liabilities – 52 (12) (25) 15Experience gains and losses arising on the plan liabilities (118) 20 (101) (23) (222)Remeasurements recognized in other comprehensive income (71) (450) (1,043) (8) (1,572)a The costs of managing plan investments are offset against the investment return, the costs of administering pension plan benefits are generally included in current service cost and the costs of
administering other post-retirement benefit plans are included in the benefit obligation.
At 31 December 2014, reimbursement balances due from or to other companies in respect of pensions amounted to $426 million reimbursementassets (2013 $399 million) and $16 million reimbursement liabilities (2013 $15 million). These balances are not included as part of the pensionsurpluses and deficits, but are reflected within other receivables and other payables in the group balance sheet.
Sensitivity analysis
The discount rate, inflation, salary growth and the mortality assumptions all have a significant effect on the amounts reported. A one-percentage pointchange, in isolation, in certain assumptions as at 31 December 2014 for the group’s plans would have had the effects shown in the table below. Theeffects shown for the expense in 2015 comprise the total of current service cost and net finance income or expense.
$ million
One percentage point
Increase Decrease
Discount ratea
Effect on pension and other post-retirement benefit expense in 2015 (499) 487
Effect on pension and other post-retirement benefit obligation at 31 December 2014 (8,174) 10,632
Inflation rateEffect on pension and other post-retirement benefit expense in 2015 543 (406)
Effect on pension and other post-retirement benefit obligation at 31 December 2014 8,264 (6,531)
Salary growthEffect on pension and other post-retirement benefit expense in 2015 157 (139)
Effect on pension and other post-retirement benefit obligation at 31 December 2014 1,103 (1,080)
a The amounts presented reflect that the discount rate is used to determine the asset interest income as well as the interest cost on the obligation.
One additional year of longevity in the mortality assumptions would increase the 2015 pension and other post-retirement benefit expense by $74million and the pension and other post-retirement benefit obligation at 31 December 2014 by $1,582 million.
Estimated future benefit payments and the weighted average duration of defined benefit obligations
The expected benefit payments, which reflect expected future service, as appropriate, but exclude plan expenses, up until 2024 and the weightedaverage duration of the defined benefit obligations at 31 December 2014 are as follows:
$ million
Estimated future benefit payments UK US Eurozone Other Total
2015 1,192 899 439 136 2,666
2016 1,248 917 421 134 2,720
2017 1,256 923 412 139 2,730
2018 1,329 921 400 146 2,796
2019 1,377 916 389 151 2,833
2020-2024 7,156 4,343 1,848 791 14,138
years
Weighted average duration 19.0 9.8 14.5 14.2
Financial statements
BP Annual Report and Form 20-F 2014 141
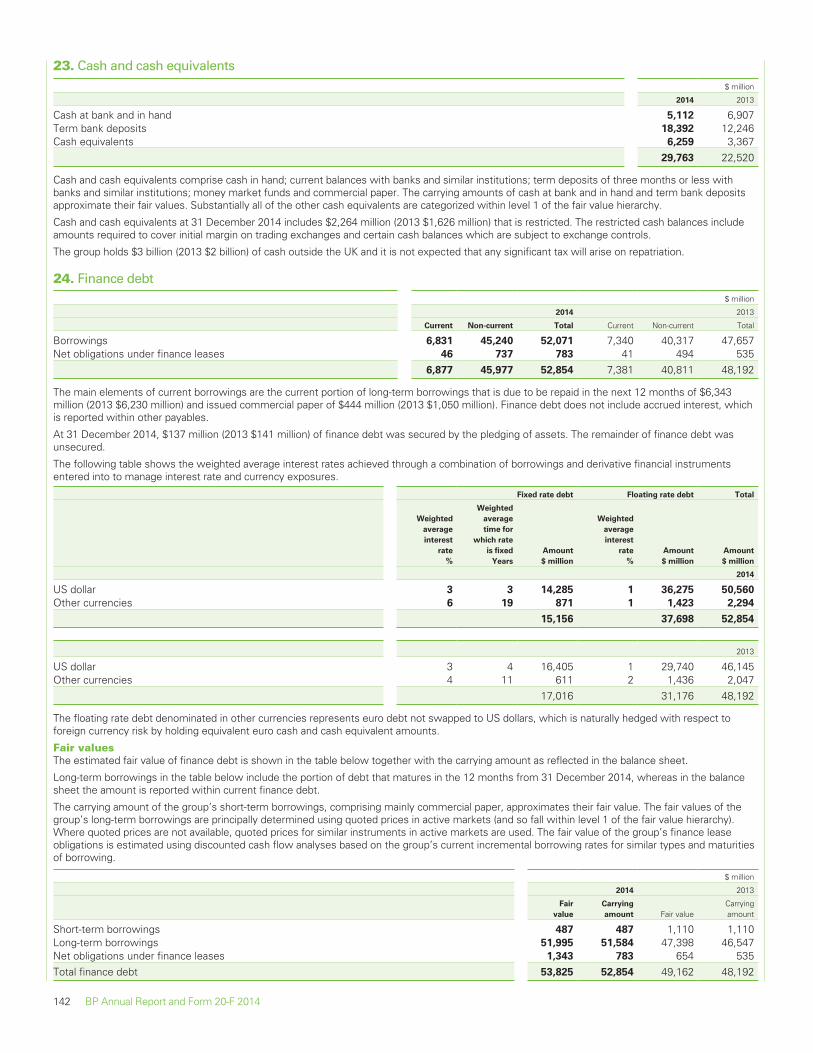
23. Cash and cash equivalents$ million
2014 2013
Cash at bank and in hand 5,112 6,907Term bank deposits 18,392 12,246Cash equivalents 6,259 3,367
29,763 22,520
Cash and cash equivalents comprise cash in hand; current balances with banks and similar institutions; term deposits of three months or less withbanks and similar institutions; money market funds and commercial paper. The carrying amounts of cash at bank and in hand and term bank depositsapproximate their fair values. Substantially all of the other cash equivalents are categorized within level 1 of the fair value hierarchy.
Cash and cash equivalents at 31 December 2014 includes $2,264 million (2013 $1,626 million) that is restricted. The restricted cash balances includeamounts required to cover initial margin on trading exchanges and certain cash balances which are subject to exchange controls.
The group holds $3 billion (2013 $2 billion) of cash outside the UK and it is not expected that any significant tax will arise on repatriation.
24. Finance debt$ million
2014 2013
Current Non-current Total Current Non-current Total
Borrowings 6,831 45,240 52,071 7,340 40,317 47,657Net obligations under finance leases 46 737 783 41 494 535
6,877 45,977 52,854 7,381 40,811 48,192
The main elements of current borrowings are the current portion of long-term borrowings that is due to be repaid in the next 12 months of $6,343million (2013 $6,230 million) and issued commercial paper of $444 million (2013 $1,050 million). Finance debt does not include accrued interest, whichis reported within other payables.
At 31 December 2014, $137 million (2013 $141 million) of finance debt was secured by the pledging of assets. The remainder of finance debt wasunsecured.
The following table shows the weighted average interest rates achieved through a combination of borrowings and derivative financial instrumentsentered into to manage interest rate and currency exposures.
Fixed rate debt Floating rate debt Total
Weighted
average
interest
rate
%
Weighted
average
time for
which rate
is fixed
Years
Amount
$ million
Weighted
average
interest
rate
%
Amount
$ million
Amount
$ million
2014
US dollar 3 3 14,285 1 36,275 50,560
Other currencies 6 19 871 1 1,423 2,294
15,156 37,698 52,854
2013
US dollar 3 4 16,405 1 29,740 46,145Other currencies 4 11 611 2 1,436 2,047
17,016 31,176 48,192
The floating rate debt denominated in other currencies represents euro debt not swapped to US dollars, which is naturally hedged with respect toforeign currency risk by holding equivalent euro cash and cash equivalent amounts.
Fair valuesThe estimated fair value of finance debt is shown in the table below together with the carrying amount as reflected in the balance sheet.
Long-term borrowings in the table below include the portion of debt that matures in the 12 months from 31 December 2014, whereas in the balancesheet the amount is reported within current finance debt.
The carrying amount of the group’s short-term borrowings, comprising mainly commercial paper, approximates their fair value. The fair values of thegroup’s long-term borrowings are principally determined using quoted prices in active markets (and so fall within level 1 of the fair value hierarchy).Where quoted prices are not available, quoted prices for similar instruments in active markets are used. The fair value of the group’s finance leaseobligations is estimated using discounted cash flow analyses based on the group’s current incremental borrowing rates for similar types and maturitiesof borrowing.
$ million
2014 2013
Fair
value
Carrying
amount Fair valueCarryingamount
Short-term borrowings 487 487 1,110 1,110Long-term borrowings 51,995 51,584 47,398 46,547Net obligations under finance leases 1,343 783 654 535Total finance debt 53,825 52,854 49,162 48,192
142 BP Annual Report and Form 20-F 2014
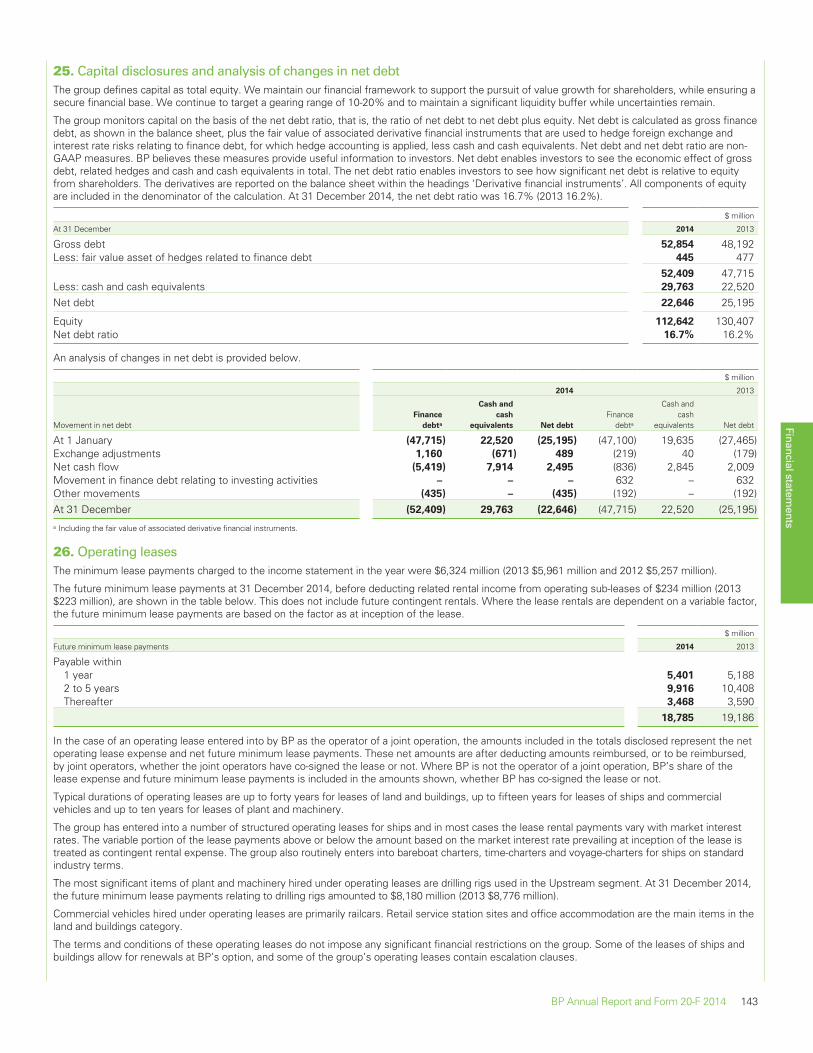
25. Capital disclosures and analysis of changes in net debtThe group defines capital as total equity. We maintain our financial framework to support the pursuit of value growth for shareholders, while ensuring asecure financial base. We continue to target a gearing range of 10-20% and to maintain a significant liquidity buffer while uncertainties remain.
The group monitors capital on the basis of the net debt ratio, that is, the ratio of net debt to net debt plus equity. Net debt is calculated as gross financedebt, as shown in the balance sheet, plus the fair value of associated derivative financial instruments that are used to hedge foreign exchange andinterest rate risks relating to finance debt, for which hedge accounting is applied, less cash and cash equivalents. Net debt and net debt ratio are non-GAAP measures. BP believes these measures provide useful information to investors. Net debt enables investors to see the economic effect of grossdebt, related hedges and cash and cash equivalents in total. The net debt ratio enables investors to see how significant net debt is relative to equityfrom shareholders. The derivatives are reported on the balance sheet within the headings ‘Derivative financial instruments’. All components of equityare included in the denominator of the calculation. At 31 December 2014, the net debt ratio was 16.7% (2013 16.2%).
$ million
At 31 December 2014 2013
Gross debt 52,854 48,192Less: fair value asset of hedges related to finance debt 445 477
52,409 47,715Less: cash and cash equivalents 29,763 22,520Net debt 22,646 25,195
Equity 112,642 130,407Net debt ratio 16.7% 16.2%
An analysis of changes in net debt is provided below.
$ million
2014 2013
Movement in net debtFinance
debta
Cash and
cash
equivalents Net debt
Financedebta
Cash andcash
equivalents Net debt
At 1 January (47,715) 22,520 (25,195) (47,100) 19,635 (27,465)Exchange adjustments 1,160 (671) 489 (219) 40 (179)Net cash flow (5,419) 7,914 2,495 (836) 2,845 2,009Movement in finance debt relating to investing activities – – – 632 – 632Other movements (435) – (435) (192) – (192)At 31 December (52,409) 29,763 (22,646) (47,715) 22,520 (25,195)a Including the fair value of associated derivative financial instruments.
26. Operating leasesThe minimum lease payments charged to the income statement in the year were $6,324 million (2013 $5,961 million and 2012 $5,257 million).
The future minimum lease payments at 31 December 2014, before deducting related rental income from operating sub-leases of $234 million (2013$223 million), are shown in the table below. This does not include future contingent rentals. Where the lease rentals are dependent on a variable factor,the future minimum lease payments are based on the factor as at inception of the lease.
$ million
Future minimum lease payments 2014 2013
Payable within1 year 5,401 5,1882 to 5 years 9,916 10,408Thereafter 3,468 3,590
18,785 19,186
In the case of an operating lease entered into by BP as the operator of a joint operation, the amounts included in the totals disclosed represent the netoperating lease expense and net future minimum lease payments. These net amounts are after deducting amounts reimbursed, or to be reimbursed,by joint operators, whether the joint operators have co-signed the lease or not. Where BP is not the operator of a joint operation, BP’s share of thelease expense and future minimum lease payments is included in the amounts shown, whether BP has co-signed the lease or not.
Typical durations of operating leases are up to forty years for leases of land and buildings, up to fifteen years for leases of ships and commercialvehicles and up to ten years for leases of plant and machinery.
The group has entered into a number of structured operating leases for ships and in most cases the lease rental payments vary with market interestrates. The variable portion of the lease payments above or below the amount based on the market interest rate prevailing at inception of the lease istreated as contingent rental expense. The group also routinely enters into bareboat charters, time-charters and voyage-charters for ships on standardindustry terms.
The most significant items of plant and machinery hired under operating leases are drilling rigs used in the Upstream segment. At 31 December 2014,the future minimum lease payments relating to drilling rigs amounted to $8,180 million (2013 $8,776 million).
Commercial vehicles hired under operating leases are primarily railcars. Retail service station sites and office accommodation are the main items in theland and buildings category.
The terms and conditions of these operating leases do not impose any significant financial restrictions on the group. Some of the leases of ships andbuildings allow for renewals at BP’s option, and some of the group’s operating leases contain escalation clauses.
Financial statements
BP Annual Report and Form 20-F 2014 143
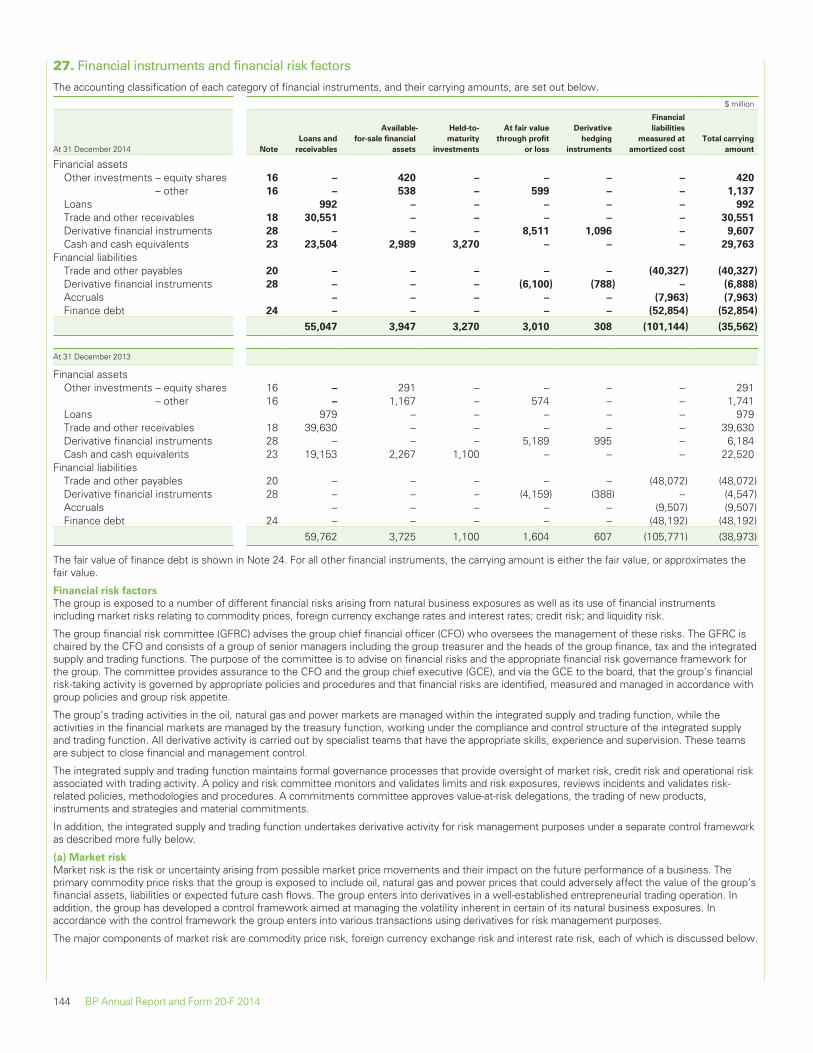
27. Financial instruments and financial risk factors
The accounting classification of each category of financial instruments, and their carrying amounts, are set out below.$ million
At 31 December 2014 Note
Loans and
receivables
Available-
for-sale financial
assets
Held-to-
maturity
investments
At fair value
through profit
or loss
Derivative
hedging
instruments
Financial
liabilities
measured at
amortized cost
Total carrying
amount
Financial assetsOther investments – equity shares 16 – 420 – – – – 420
– other 16 – 538 – 599 – – 1,137
Loans 992 – – – – – 992
Trade and other receivables 18 30,551 – – – – – 30,551
Derivative financial instruments 28 – – – 8,511 1,096 – 9,607
Cash and cash equivalents 23 23,504 2,989 3,270 – – – 29,763
Financial liabilitiesTrade and other payables 20 – – – – – (40,327) (40,327)
Derivative financial instruments 28 – – – (6,100) (788) – (6,888)
Accruals – – – – – (7,963) (7,963)
Finance debt 24 – – – – – (52,854) (52,854)
55,047 3,947 3,270 3,010 308 (101,144) (35,562)
At 31 December 2013
Financial assetsOther investments – equity shares 16 – 291 – – – – 291
– other 16 – 1,167 – 574 – – 1,741Loans 979 – – – – – 979Trade and other receivables 18 39,630 – – – – – 39,630Derivative financial instruments 28 – – – 5,189 995 – 6,184Cash and cash equivalents 23 19,153 2,267 1,100 – – – 22,520
Financial liabilitiesTrade and other payables 20 – – – – – (48,072) (48,072)Derivative financial instruments 28 – – – (4,159) (388) – (4,547)Accruals – – – – – (9,507) (9,507)Finance debt 24 – – – – – (48,192) (48,192)
59,762 3,725 1,100 1,604 607 (105,771) (38,973)
The fair value of finance debt is shown in Note 24. For all other financial instruments, the carrying amount is either the fair value, or approximates thefair value.
Financial risk factors
The group is exposed to a number of different financial risks arising from natural business exposures as well as its use of financial instrumentsincluding market risks relating to commodity prices, foreign currency exchange rates and interest rates; credit risk; and liquidity risk.
The group financial risk committee (GFRC) advises the group chief financial officer (CFO) who oversees the management of these risks. The GFRC ischaired by the CFO and consists of a group of senior managers including the group treasurer and the heads of the group finance, tax and the integratedsupply and trading functions. The purpose of the committee is to advise on financial risks and the appropriate financial risk governance framework forthe group. The committee provides assurance to the CFO and the group chief executive (GCE), and via the GCE to the board, that the group’s financialrisk-taking activity is governed by appropriate policies and procedures and that financial risks are identified, measured and managed in accordance withgroup policies and group risk appetite.
The group’s trading activities in the oil, natural gas and power markets are managed within the integrated supply and trading function, while theactivities in the financial markets are managed by the treasury function, working under the compliance and control structure of the integrated supplyand trading function. All derivative activity is carried out by specialist teams that have the appropriate skills, experience and supervision. These teamsare subject to close financial and management control.
The integrated supply and trading function maintains formal governance processes that provide oversight of market risk, credit risk and operational riskassociated with trading activity. A policy and risk committee monitors and validates limits and risk exposures, reviews incidents and validates risk-related policies, methodologies and procedures. A commitments committee approves value-at-risk delegations, the trading of new products,instruments and strategies and material commitments.
In addition, the integrated supply and trading function undertakes derivative activity for risk management purposes under a separate control frameworkas described more fully below.
(a) Market risk
Market risk is the risk or uncertainty arising from possible market price movements and their impact on the future performance of a business. Theprimary commodity price risks that the group is exposed to include oil, natural gas and power prices that could adversely affect the value of the group’sfinancial assets, liabilities or expected future cash flows. The group enters into derivatives in a well-established entrepreneurial trading operation. Inaddition, the group has developed a control framework aimed at managing the volatility inherent in certain of its natural business exposures. Inaccordance with the control framework the group enters into various transactions using derivatives for risk management purposes.
The major components of market risk are commodity price risk, foreign currency exchange risk and interest rate risk, each of which is discussed below.
144 BP Annual Report and Form 20-F 2014
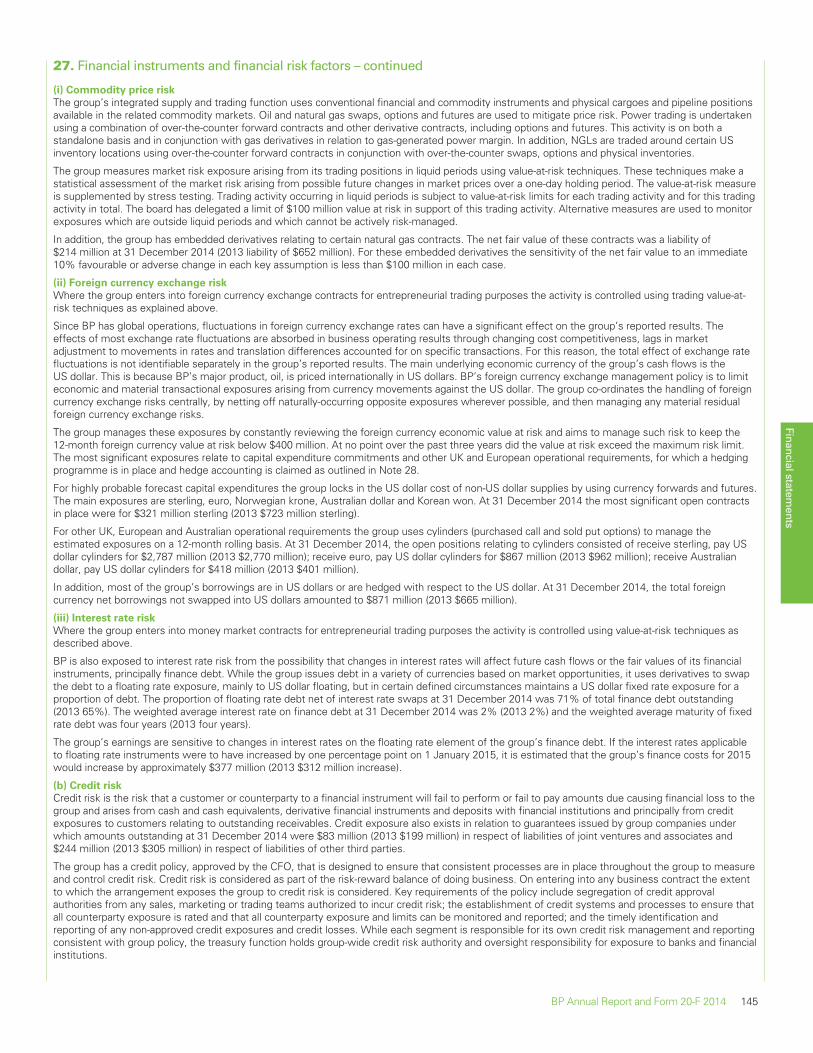
27. Financial instruments and financial risk factors – continued
(i) Commodity price risk
The group’s integrated supply and trading function uses conventional financial and commodity instruments and physical cargoes and pipeline positionsavailable in the related commodity markets. Oil and natural gas swaps, options and futures are used to mitigate price risk. Power trading is undertakenusing a combination of over-the-counter forward contracts and other derivative contracts, including options and futures. This activity is on both astandalone basis and in conjunction with gas derivatives in relation to gas-generated power margin. In addition, NGLs are traded around certain USinventory locations using over-the-counter forward contracts in conjunction with over-the-counter swaps, options and physical inventories.
The group measures market risk exposure arising from its trading positions in liquid periods using value-at-risk techniques. These techniques make astatistical assessment of the market risk arising from possible future changes in market prices over a one-day holding period. The value-at-risk measureis supplemented by stress testing. Trading activity occurring in liquid periods is subject to value-at-risk limits for each trading activity and for this tradingactivity in total. The board has delegated a limit of $100 million value at risk in support of this trading activity. Alternative measures are used to monitorexposures which are outside liquid periods and which cannot be actively risk-managed.
In addition, the group has embedded derivatives relating to certain natural gas contracts. The net fair value of these contracts was a liability of$214 million at 31 December 2014 (2013 liability of $652 million). For these embedded derivatives the sensitivity of the net fair value to an immediate10% favourable or adverse change in each key assumption is less than $100 million in each case.
(ii) Foreign currency exchange risk
Where the group enters into foreign currency exchange contracts for entrepreneurial trading purposes the activity is controlled using trading value-at-risk techniques as explained above.
Since BP has global operations, fluctuations in foreign currency exchange rates can have a significant effect on the group’s reported results. Theeffects of most exchange rate fluctuations are absorbed in business operating results through changing cost competitiveness, lags in marketadjustment to movements in rates and translation differences accounted for on specific transactions. For this reason, the total effect of exchange ratefluctuations is not identifiable separately in the group’s reported results. The main underlying economic currency of the group’s cash flows is theUS dollar. This is because BP’s major product, oil, is priced internationally in US dollars. BP’s foreign currency exchange management policy is to limiteconomic and material transactional exposures arising from currency movements against the US dollar. The group co-ordinates the handling of foreigncurrency exchange risks centrally, by netting off naturally-occurring opposite exposures wherever possible, and then managing any material residualforeign currency exchange risks.
The group manages these exposures by constantly reviewing the foreign currency economic value at risk and aims to manage such risk to keep the12-month foreign currency value at risk below $400 million. At no point over the past three years did the value at risk exceed the maximum risk limit.The most significant exposures relate to capital expenditure commitments and other UK and European operational requirements, for which a hedgingprogramme is in place and hedge accounting is claimed as outlined in Note 28.
For highly probable forecast capital expenditures the group locks in the US dollar cost of non-US dollar supplies by using currency forwards and futures.The main exposures are sterling, euro, Norwegian krone, Australian dollar and Korean won. At 31 December 2014 the most significant open contractsin place were for $321 million sterling (2013 $723 million sterling).
For other UK, European and Australian operational requirements the group uses cylinders (purchased call and sold put options) to manage theestimated exposures on a 12-month rolling basis. At 31 December 2014, the open positions relating to cylinders consisted of receive sterling, pay USdollar cylinders for $2,787 million (2013 $2,770 million); receive euro, pay US dollar cylinders for $867 million (2013 $962 million); receive Australiandollar, pay US dollar cylinders for $418 million (2013 $401 million).
In addition, most of the group’s borrowings are in US dollars or are hedged with respect to the US dollar. At 31 December 2014, the total foreigncurrency net borrowings not swapped into US dollars amounted to $871 million (2013 $665 million).
(iii) Interest rate risk
Where the group enters into money market contracts for entrepreneurial trading purposes the activity is controlled using value-at-risk techniques asdescribed above.
BP is also exposed to interest rate risk from the possibility that changes in interest rates will affect future cash flows or the fair values of its financialinstruments, principally finance debt. While the group issues debt in a variety of currencies based on market opportunities, it uses derivatives to swapthe debt to a floating rate exposure, mainly to US dollar floating, but in certain defined circumstances maintains a US dollar fixed rate exposure for aproportion of debt. The proportion of floating rate debt net of interest rate swaps at 31 December 2014 was 71% of total finance debt outstanding(2013 65%). The weighted average interest rate on finance debt at 31 December 2014 was 2% (2013 2%) and the weighted average maturity of fixedrate debt was four years (2013 four years).
The group’s earnings are sensitive to changes in interest rates on the floating rate element of the group’s finance debt. If the interest rates applicableto floating rate instruments were to have increased by one percentage point on 1 January 2015, it is estimated that the group’s finance costs for 2015would increase by approximately $377 million (2013 $312 million increase).
(b) Credit risk
Credit risk is the risk that a customer or counterparty to a financial instrument will fail to perform or fail to pay amounts due causing financial loss to thegroup and arises from cash and cash equivalents, derivative financial instruments and deposits with financial institutions and principally from creditexposures to customers relating to outstanding receivables. Credit exposure also exists in relation to guarantees issued by group companies underwhich amounts outstanding at 31 December 2014 were $83 million (2013 $199 million) in respect of liabilities of joint ventures and associates and$244 million (2013 $305 million) in respect of liabilities of other third parties.
The group has a credit policy, approved by the CFO, that is designed to ensure that consistent processes are in place throughout the group to measureand control credit risk. Credit risk is considered as part of the risk-reward balance of doing business. On entering into any business contract the extentto which the arrangement exposes the group to credit risk is considered. Key requirements of the policy include segregation of credit approvalauthorities from any sales, marketing or trading teams authorized to incur credit risk; the establishment of credit systems and processes to ensure thatall counterparty exposure is rated and that all counterparty exposure and limits can be monitored and reported; and the timely identification andreporting of any non-approved credit exposures and credit losses. While each segment is responsible for its own credit risk management and reportingconsistent with group policy, the treasury function holds group-wide credit risk authority and oversight responsibility for exposure to banks and financialinstitutions.
Financial statements
BP Annual Report and Form 20-F 2014 145
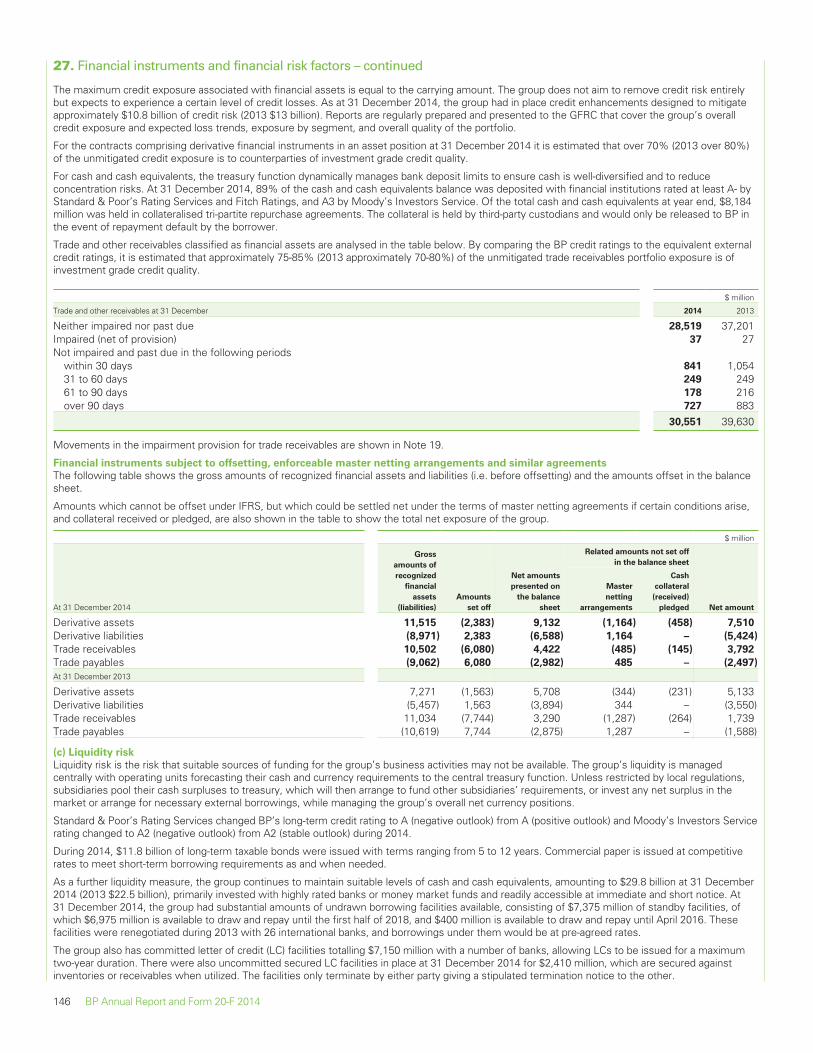
27. Financial instruments and financial risk factors – continued
The maximum credit exposure associated with financial assets is equal to the carrying amount. The group does not aim to remove credit risk entirelybut expects to experience a certain level of credit losses. As at 31 December 2014, the group had in place credit enhancements designed to mitigateapproximately $10.8 billion of credit risk (2013 $13 billion). Reports are regularly prepared and presented to the GFRC that cover the group’s overallcredit exposure and expected loss trends, exposure by segment, and overall quality of the portfolio.
For the contracts comprising derivative financial instruments in an asset position at 31 December 2014 it is estimated that over 70% (2013 over 80%)of the unmitigated credit exposure is to counterparties of investment grade credit quality.
For cash and cash equivalents, the treasury function dynamically manages bank deposit limits to ensure cash is well-diversified and to reduceconcentration risks. At 31 December 2014, 89% of the cash and cash equivalents balance was deposited with financial institutions rated at least A- byStandard & Poor’s Rating Services and Fitch Ratings, and A3 by Moody’s Investors Service. Of the total cash and cash equivalents at year end, $8,184million was held in collateralised tri-partite repurchase agreements. The collateral is held by third-party custodians and would only be released to BP inthe event of repayment default by the borrower.
Trade and other receivables classified as financial assets are analysed in the table below. By comparing the BP credit ratings to the equivalent externalcredit ratings, it is estimated that approximately 75-85% (2013 approximately 70-80%) of the unmitigated trade receivables portfolio exposure is ofinvestment grade credit quality.
$ million
Trade and other receivables at 31 December 2014 2013
Neither impaired nor past due 28,519 37,201Impaired (net of provision) 37 27Not impaired and past due in the following periods
within 30 days 841 1,05431 to 60 days 249 24961 to 90 days 178 216over 90 days 727 883
30,551 39,630
Movements in the impairment provision for trade receivables are shown in Note 19.
Financial instruments subject to offsetting, enforceable master netting arrangements and similar agreements
The following table shows the gross amounts of recognized financial assets and liabilities (i.e. before offsetting) and the amounts offset in the balancesheet.
Amounts which cannot be offset under IFRS, but which could be settled net under the terms of master netting agreements if certain conditions arise,and collateral received or pledged, are also shown in the table to show the total net exposure of the group.
$ million
At 31 December 2014
Gross
amounts of
recognized
financial
assets
(liabilities)
Amounts
set off
Net amounts
presented on
the balance
sheet
Related amounts not set off
in the balance sheet
Net amount
Master
netting
arrangements
Cash
collateral
(received)
pledged
Derivative assets 11,515 (2,383) 9,132 (1,164) (458) 7,510
Derivative liabilities (8,971) 2,383 (6,588) 1,164 – (5,424)
Trade receivables 10,502 (6,080) 4,422 (485) (145) 3,792
Trade payables (9,062) 6,080 (2,982) 485 – (2,497)
At 31 December 2013
Derivative assets 7,271 (1,563) 5,708 (344) (231) 5,133Derivative liabilities (5,457) 1,563 (3,894) 344 – (3,550)Trade receivables 11,034 (7,744) 3,290 (1,287) (264) 1,739Trade payables (10,619) 7,744 (2,875) 1,287 – (1,588)
(c) Liquidity risk
Liquidity risk is the risk that suitable sources of funding for the group’s business activities may not be available. The group’s liquidity is managedcentrally with operating units forecasting their cash and currency requirements to the central treasury function. Unless restricted by local regulations,subsidiaries pool their cash surpluses to treasury, which will then arrange to fund other subsidiaries’ requirements, or invest any net surplus in themarket or arrange for necessary external borrowings, while managing the group’s overall net currency positions.
Standard & Poor’s Rating Services changed BP’s long-term credit rating to A (negative outlook) from A (positive outlook) and Moody’s Investors Servicerating changed to A2 (negative outlook) from A2 (stable outlook) during 2014.
During 2014, $11.8 billion of long-term taxable bonds were issued with terms ranging from 5 to 12 years. Commercial paper is issued at competitiverates to meet short-term borrowing requirements as and when needed.
As a further liquidity measure, the group continues to maintain suitable levels of cash and cash equivalents, amounting to $29.8 billion at 31 December2014 (2013 $22.5 billion), primarily invested with highly rated banks or money market funds and readily accessible at immediate and short notice. At31 December 2014, the group had substantial amounts of undrawn borrowing facilities available, consisting of $7,375 million of standby facilities, ofwhich $6,975 million is available to draw and repay until the first half of 2018, and $400 million is available to draw and repay until April 2016. Thesefacilities were renegotiated during 2013 with 26 international banks, and borrowings under them would be at pre-agreed rates.
The group also has committed letter of credit (LC) facilities totalling $7,150 million with a number of banks, allowing LCs to be issued for a maximumtwo-year duration. There were also uncommitted secured LC facilities in place at 31 December 2014 for $2,410 million, which are secured againstinventories or receivables when utilized. The facilities only terminate by either party giving a stipulated termination notice to the other.
146 BP Annual Report and Form 20-F 2014
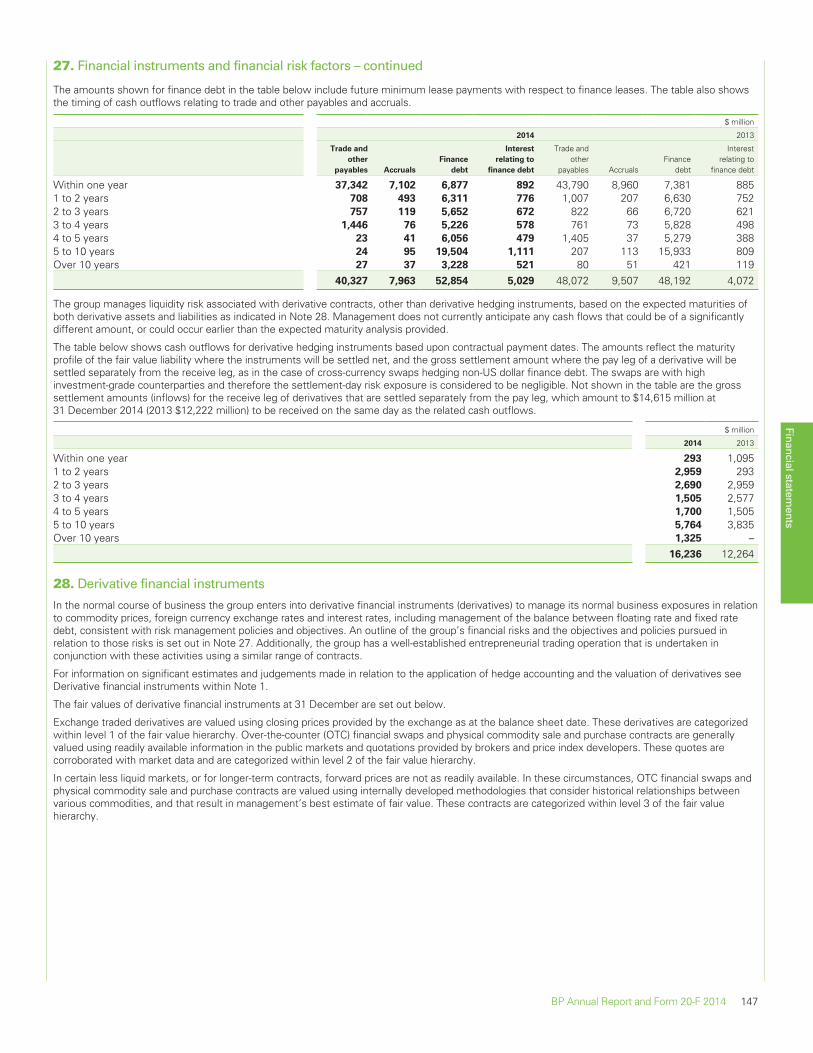
27. Financial instruments and financial risk factors – continued
The amounts shown for finance debt in the table below include future minimum lease payments with respect to finance leases. The table also showsthe timing of cash outflows relating to trade and other payables and accruals.
$ million
2014 2013
Trade and
other
payables Accruals
Finance
debt
Interest
relating to
finance debt
Trade andother
payables AccrualsFinance
debt
Interestrelating to
finance debt
Within one year 37,342 7,102 6,877 892 43,790 8,960 7,381 8851 to 2 years 708 493 6,311 776 1,007 207 6,630 7522 to 3 years 757 119 5,652 672 822 66 6,720 6213 to 4 years 1,446 76 5,226 578 761 73 5,828 4984 to 5 years 23 41 6,056 479 1,405 37 5,279 3885 to 10 years 24 95 19,504 1,111 207 113 15,933 809Over 10 years 27 37 3,228 521 80 51 421 119
40,327 7,963 52,854 5,029 48,072 9,507 48,192 4,072
The group manages liquidity risk associated with derivative contracts, other than derivative hedging instruments, based on the expected maturities ofboth derivative assets and liabilities as indicated in Note 28. Management does not currently anticipate any cash flows that could be of a significantlydifferent amount, or could occur earlier than the expected maturity analysis provided.
The table below shows cash outflows for derivative hedging instruments based upon contractual payment dates. The amounts reflect the maturityprofile of the fair value liability where the instruments will be settled net, and the gross settlement amount where the pay leg of a derivative will besettled separately from the receive leg, as in the case of cross-currency swaps hedging non-US dollar finance debt. The swaps are with highinvestment-grade counterparties and therefore the settlement-day risk exposure is considered to be negligible. Not shown in the table are the grosssettlement amounts (inflows) for the receive leg of derivatives that are settled separately from the pay leg, which amount to $14,615 million at31 December 2014 (2013 $12,222 million) to be received on the same day as the related cash outflows.
$ million
2014 2013
Within one year 293 1,0951 to 2 years 2,959 2932 to 3 years 2,690 2,9593 to 4 years 1,505 2,5774 to 5 years 1,700 1,5055 to 10 years 5,764 3,835Over 10 years 1,325 –
16,236 12,264
28. Derivative financial instruments
In the normal course of business the group enters into derivative financial instruments (derivatives) to manage its normal business exposures in relationto commodity prices, foreign currency exchange rates and interest rates, including management of the balance between floating rate and fixed ratedebt, consistent with risk management policies and objectives. An outline of the group’s financial risks and the objectives and policies pursued inrelation to those risks is set out in Note 27. Additionally, the group has a well-established entrepreneurial trading operation that is undertaken inconjunction with these activities using a similar range of contracts.
For information on significant estimates and judgements made in relation to the application of hedge accounting and the valuation of derivatives seeDerivative financial instruments within Note 1.
The fair values of derivative financial instruments at 31 December are set out below.
Exchange traded derivatives are valued using closing prices provided by the exchange as at the balance sheet date. These derivatives are categorizedwithin level 1 of the fair value hierarchy. Over-the-counter (OTC) financial swaps and physical commodity sale and purchase contracts are generallyvalued using readily available information in the public markets and quotations provided by brokers and price index developers. These quotes arecorroborated with market data and are categorized within level 2 of the fair value hierarchy.
In certain less liquid markets, or for longer-term contracts, forward prices are not as readily available. In these circumstances, OTC financial swaps andphysical commodity sale and purchase contracts are valued using internally developed methodologies that consider historical relationships betweenvarious commodities, and that result in management’s best estimate of fair value. These contracts are categorized within level 3 of the fair valuehierarchy.
Financial statements
BP Annual Report and Form 20-F 2014 147
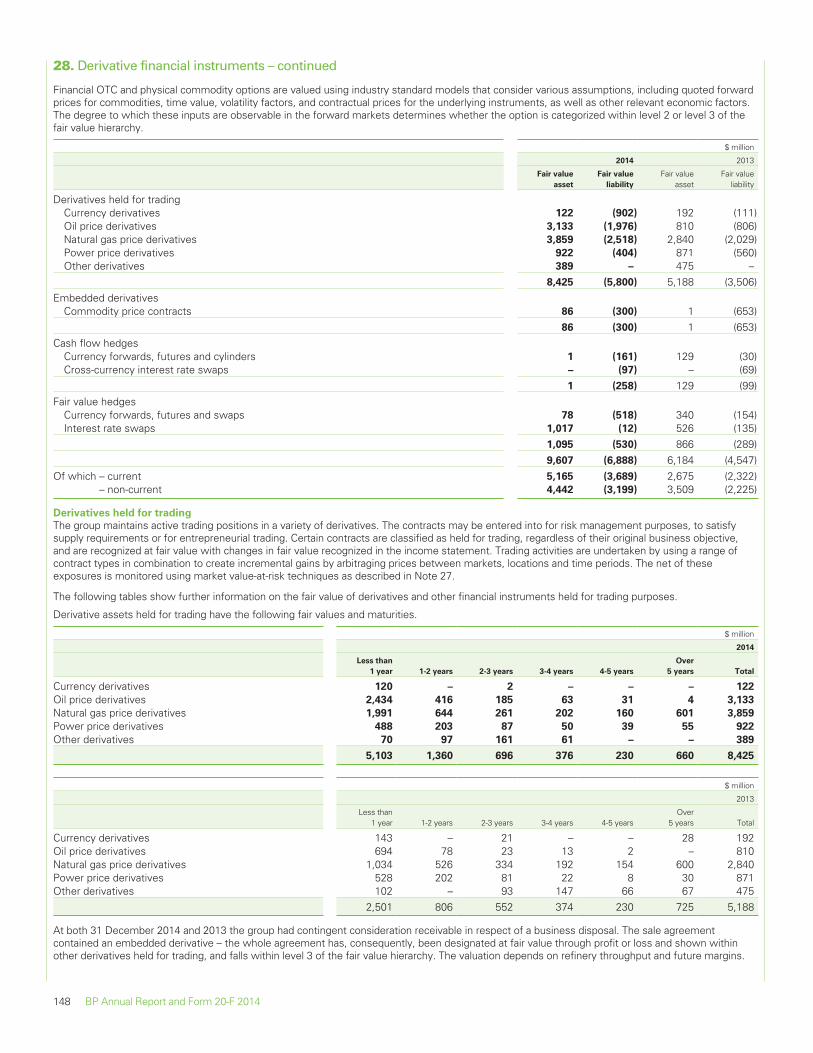
28. Derivative financial instruments – continued
Financial OTC and physical commodity options are valued using industry standard models that consider various assumptions, including quoted forwardprices for commodities, time value, volatility factors, and contractual prices for the underlying instruments, as well as other relevant economic factors.The degree to which these inputs are observable in the forward markets determines whether the option is categorized within level 2 or level 3 of thefair value hierarchy.
$ million
2014 2013
Fair value
asset
Fair value
liability
Fair valueasset
Fair valueliability
Derivatives held for tradingCurrency derivatives 122 (902) 192 (111)Oil price derivatives 3,133 (1,976) 810 (806)Natural gas price derivatives 3,859 (2,518) 2,840 (2,029)Power price derivatives 922 (404) 871 (560)Other derivatives 389 – 475 –
8,425 (5,800) 5,188 (3,506)Embedded derivatives
Commodity price contracts 86 (300) 1 (653)86 (300) 1 (653)
Cash flow hedgesCurrency forwards, futures and cylinders 1 (161) 129 (30)Cross-currency interest rate swaps – (97) – (69)
1 (258) 129 (99)Fair value hedges
Currency forwards, futures and swaps 78 (518) 340 (154)Interest rate swaps 1,017 (12) 526 (135)
1,095 (530) 866 (289)9,607 (6,888) 6,184 (4,547)
Of which – current 5,165 (3,689) 2,675 (2,322)– non-current 4,442 (3,199) 3,509 (2,225)
Derivatives held for trading
The group maintains active trading positions in a variety of derivatives. The contracts may be entered into for risk management purposes, to satisfysupply requirements or for entrepreneurial trading. Certain contracts are classified as held for trading, regardless of their original business objective,and are recognized at fair value with changes in fair value recognized in the income statement. Trading activities are undertaken by using a range ofcontract types in combination to create incremental gains by arbitraging prices between markets, locations and time periods. The net of theseexposures is monitored using market value-at-risk techniques as described in Note 27.
The following tables show further information on the fair value of derivatives and other financial instruments held for trading purposes.
Derivative assets held for trading have the following fair values and maturities.
$ million
2014
Less than
1 year 1-2 years 2-3 years 3-4 years 4-5 years
Over
5 years Total
Currency derivatives 120 – 2 – – – 122
Oil price derivatives 2,434 416 185 63 31 4 3,133
Natural gas price derivatives 1,991 644 261 202 160 601 3,859
Power price derivatives 488 203 87 50 39 55 922
Other derivatives 70 97 161 61 – – 389
5,103 1,360 696 376 230 660 8,425
$ million
2013
Less than1 year 1-2 years 2-3 years 3-4 years 4-5 years
Over5 years Total
Currency derivatives 143 – 21 – – 28 192Oil price derivatives 694 78 23 13 2 – 810Natural gas price derivatives 1,034 526 334 192 154 600 2,840Power price derivatives 528 202 81 22 8 30 871Other derivatives 102 – 93 147 66 67 475
2,501 806 552 374 230 725 5,188
At both 31 December 2014 and 2013 the group had contingent consideration receivable in respect of a business disposal. The sale agreementcontained an embedded derivative – the whole agreement has, consequently, been designated at fair value through profit or loss and shown withinother derivatives held for trading, and falls within level 3 of the fair value hierarchy. The valuation depends on refinery throughput and future margins.
148 BP Annual Report and Form 20-F 2014
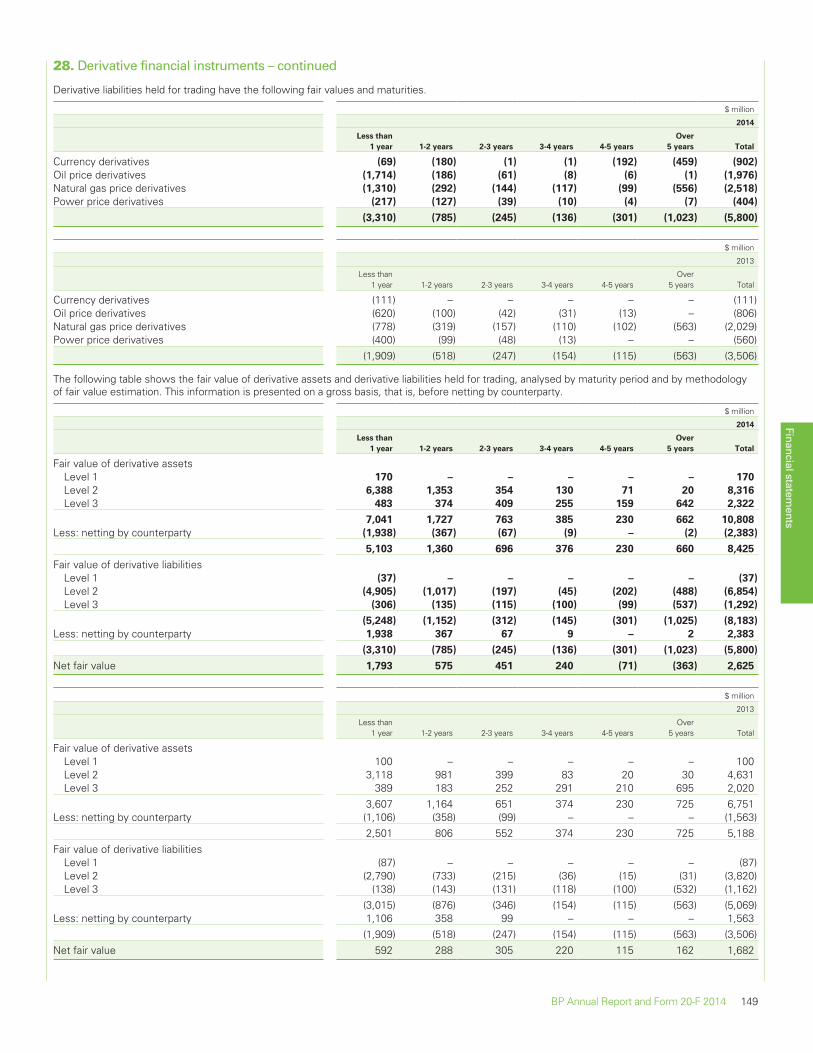
28. Derivative financial instruments – continued
Derivative liabilities held for trading have the following fair values and maturities.
$ million
2014
Less than
1 year 1-2 years 2-3 years 3-4 years 4-5 years
Over
5 years Total
Currency derivatives (69) (180) (1) (1) (192) (459) (902)
Oil price derivatives (1,714) (186) (61) (8) (6) (1) (1,976)
Natural gas price derivatives (1,310) (292) (144) (117) (99) (556) (2,518)
Power price derivatives (217) (127) (39) (10) (4) (7) (404)
(3,310) (785) (245) (136) (301) (1,023) (5,800)
$ million
2013
Less than1 year 1-2 years 2-3 years 3-4 years 4-5 years
Over5 years Total
Currency derivatives (111) – – – – – (111)Oil price derivatives (620) (100) (42) (31) (13) – (806)Natural gas price derivatives (778) (319) (157) (110) (102) (563) (2,029)Power price derivatives (400) (99) (48) (13) – – (560)
(1,909) (518) (247) (154) (115) (563) (3,506)
The following table shows the fair value of derivative assets and derivative liabilities held for trading, analysed by maturity period and by methodologyof fair value estimation. This information is presented on a gross basis, that is, before netting by counterparty.
$ million
2014
Less than
1 year 1-2 years 2-3 years 3-4 years 4-5 years
Over
5 years Total
Fair value of derivative assetsLevel 1 170 – – – – – 170
Level 2 6,388 1,353 354 130 71 20 8,316
Level 3 483 374 409 255 159 642 2,322
7,041 1,727 763 385 230 662 10,808
Less: netting by counterparty (1,938) (367) (67) (9) – (2) (2,383)
5,103 1,360 696 376 230 660 8,425
Fair value of derivative liabilitiesLevel 1 (37) – – – – – (37)
Level 2 (4,905) (1,017) (197) (45) (202) (488) (6,854)
Level 3 (306) (135) (115) (100) (99) (537) (1,292)
(5,248) (1,152) (312) (145) (301) (1,025) (8,183)
Less: netting by counterparty 1,938 367 67 9 – 2 2,383
(3,310) (785) (245) (136) (301) (1,023) (5,800)
Net fair value 1,793 575 451 240 (71) (363) 2,625
$ million
2013
Less than1 year 1-2 years 2-3 years 3-4 years 4-5 years
Over5 years Total
Fair value of derivative assetsLevel 1 100 – – – – – 100Level 2 3,118 981 399 83 20 30 4,631Level 3 389 183 252 291 210 695 2,020
3,607 1,164 651 374 230 725 6,751Less: netting by counterparty (1,106) (358) (99) – – – (1,563)
2,501 806 552 374 230 725 5,188Fair value of derivative liabilities
Level 1 (87) – – – – – (87)Level 2 (2,790) (733) (215) (36) (15) (31) (3,820)Level 3 (138) (143) (131) (118) (100) (532) (1,162)
(3,015) (876) (346) (154) (115) (563) (5,069)Less: netting by counterparty 1,106 358 99 – – – 1,563
(1,909) (518) (247) (154) (115) (563) (3,506)Net fair value 592 288 305 220 115 162 1,682
Financial statements
BP Annual Report and Form 20-F 2014 149
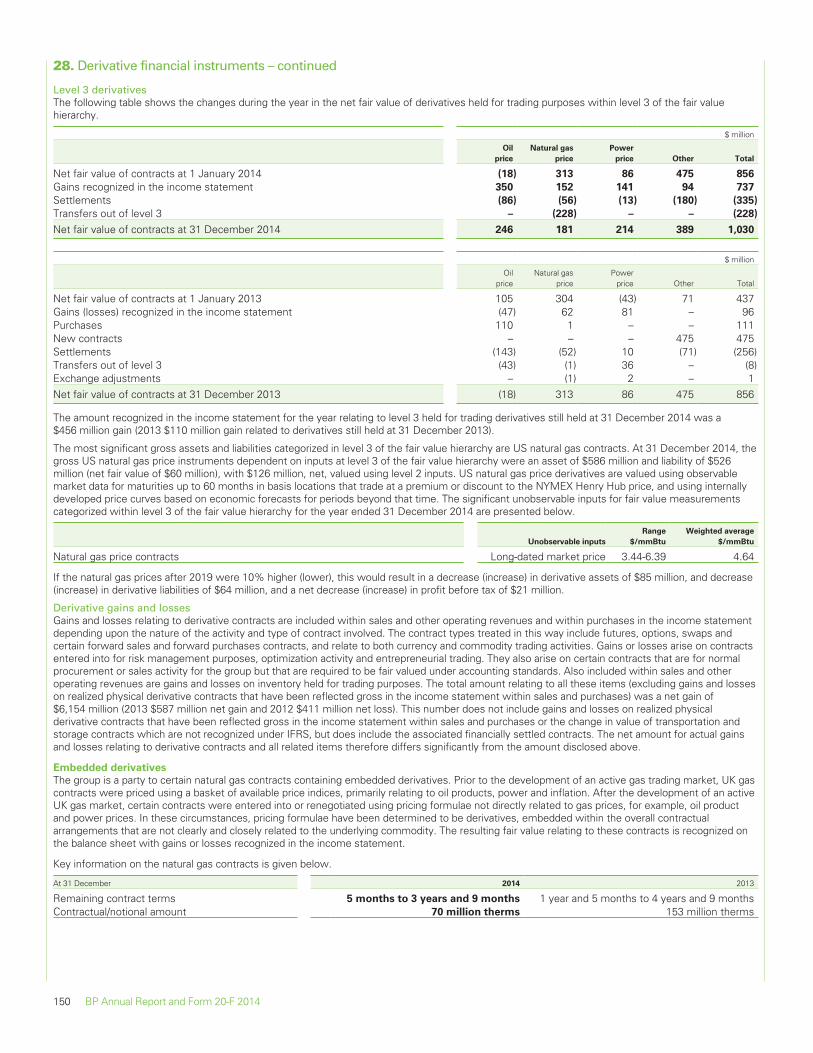
28. Derivative financial instruments – continued
Level 3 derivativesThe following table shows the changes during the year in the net fair value of derivatives held for trading purposes within level 3 of the fair valuehierarchy.
$ million
Oil
price
Natural gas
price
Power
price Other Total
Net fair value of contracts at 1 January 2014 (18) 313 86 475 856
Gains recognized in the income statement 350 152 141 94 737
Settlements (86) (56) (13) (180) (335)
Transfers out of level 3 – (228) – – (228)
Net fair value of contracts at 31 December 2014 246 181 214 389 1,030
$ million
Oilprice
Natural gasprice
Powerprice Other Total
Net fair value of contracts at 1 January 2013 105 304 (43) 71 437Gains (losses) recognized in the income statement (47) 62 81 – 96Purchases 110 1 – – 111New contracts – – – 475 475Settlements (143) (52) 10 (71) (256)Transfers out of level 3 (43) (1) 36 – (8)Exchange adjustments – (1) 2 – 1Net fair value of contracts at 31 December 2013 (18) 313 86 475 856
The amount recognized in the income statement for the year relating to level 3 held for trading derivatives still held at 31 December 2014 was a$456 million gain (2013 $110 million gain related to derivatives still held at 31 December 2013).
The most significant gross assets and liabilities categorized in level 3 of the fair value hierarchy are US natural gas contracts. At 31 December 2014, thegross US natural gas price instruments dependent on inputs at level 3 of the fair value hierarchy were an asset of $586 million and liability of $526million (net fair value of $60 million), with $126 million, net, valued using level 2 inputs. US natural gas price derivatives are valued using observablemarket data for maturities up to 60 months in basis locations that trade at a premium or discount to the NYMEX Henry Hub price, and using internallydeveloped price curves based on economic forecasts for periods beyond that time. The significant unobservable inputs for fair value measurementscategorized within level 3 of the fair value hierarchy for the year ended 31 December 2014 are presented below.
Unobservable inputs
Range
$/mmBtu
Weighted average
$/mmBtu
Natural gas price contracts Long-dated market price 3.44-6.39 4.64
If the natural gas prices after 2019 were 10% higher (lower), this would result in a decrease (increase) in derivative assets of $85 million, and decrease(increase) in derivative liabilities of $64 million, and a net decrease (increase) in profit before tax of $21 million.
Derivative gains and lossesGains and losses relating to derivative contracts are included within sales and other operating revenues and within purchases in the income statementdepending upon the nature of the activity and type of contract involved. The contract types treated in this way include futures, options, swaps andcertain forward sales and forward purchases contracts, and relate to both currency and commodity trading activities. Gains or losses arise on contractsentered into for risk management purposes, optimization activity and entrepreneurial trading. They also arise on certain contracts that are for normalprocurement or sales activity for the group but that are required to be fair valued under accounting standards. Also included within sales and otheroperating revenues are gains and losses on inventory held for trading purposes. The total amount relating to all these items (excluding gains and losseson realized physical derivative contracts that have been reflected gross in the income statement within sales and purchases) was a net gain of$6,154 million (2013 $587 million net gain and 2012 $411 million net loss). This number does not include gains and losses on realized physicalderivative contracts that have been reflected gross in the income statement within sales and purchases or the change in value of transportation andstorage contracts which are not recognized under IFRS, but does include the associated financially settled contracts. The net amount for actual gainsand losses relating to derivative contracts and all related items therefore differs significantly from the amount disclosed above.
Embedded derivatives
The group is a party to certain natural gas contracts containing embedded derivatives. Prior to the development of an active gas trading market, UK gascontracts were priced using a basket of available price indices, primarily relating to oil products, power and inflation. After the development of an activeUK gas market, certain contracts were entered into or renegotiated using pricing formulae not directly related to gas prices, for example, oil productand power prices. In these circumstances, pricing formulae have been determined to be derivatives, embedded within the overall contractualarrangements that are not clearly and closely related to the underlying commodity. The resulting fair value relating to these contracts is recognized onthe balance sheet with gains or losses recognized in the income statement.
Key information on the natural gas contracts is given below.
At 31 December 2014 2013
Remaining contract terms 5 months to 3 years and 9 months 1 year and 5 months to 4 years and 9 monthsContractual/notional amount 70 million therms 153 million therms
150 BP Annual Report and Form 20-F 2014
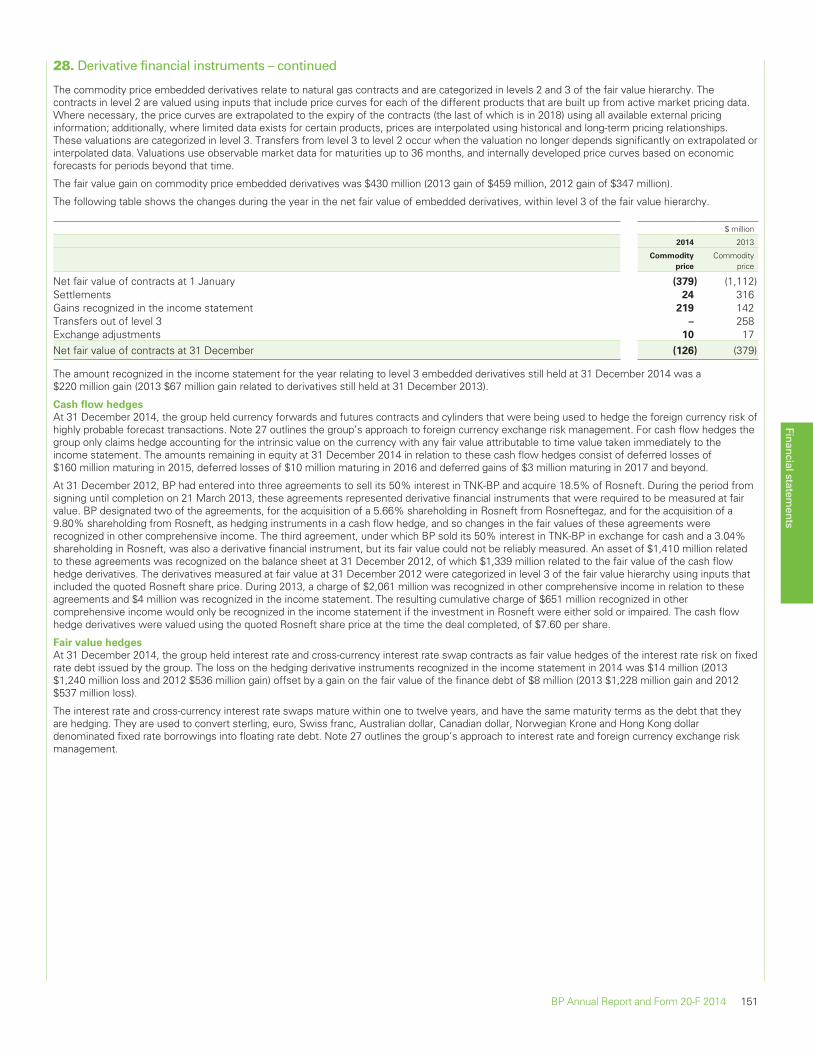
28. Derivative financial instruments – continued
The commodity price embedded derivatives relate to natural gas contracts and are categorized in levels 2 and 3 of the fair value hierarchy. Thecontracts in level 2 are valued using inputs that include price curves for each of the different products that are built up from active market pricing data.Where necessary, the price curves are extrapolated to the expiry of the contracts (the last of which is in 2018) using all available external pricinginformation; additionally, where limited data exists for certain products, prices are interpolated using historical and long-term pricing relationships.These valuations are categorized in level 3. Transfers from level 3 to level 2 occur when the valuation no longer depends significantly on extrapolated orinterpolated data. Valuations use observable market data for maturities up to 36 months, and internally developed price curves based on economicforecasts for periods beyond that time.
The fair value gain on commodity price embedded derivatives was $430 million (2013 gain of $459 million, 2012 gain of $347 million).
The following table shows the changes during the year in the net fair value of embedded derivatives, within level 3 of the fair value hierarchy.
$ million
2014 2013
Commodity
price
Commodityprice
Net fair value of contracts at 1 January (379) (1,112)Settlements 24 316Gains recognized in the income statement 219 142Transfers out of level 3 – 258Exchange adjustments 10 17Net fair value of contracts at 31 December (126) (379)
The amount recognized in the income statement for the year relating to level 3 embedded derivatives still held at 31 December 2014 was a$220 million gain (2013 $67 million gain related to derivatives still held at 31 December 2013).
Cash flow hedges
At 31 December 2014, the group held currency forwards and futures contracts and cylinders that were being used to hedge the foreign currency risk ofhighly probable forecast transactions. Note 27 outlines the group’s approach to foreign currency exchange risk management. For cash flow hedges thegroup only claims hedge accounting for the intrinsic value on the currency with any fair value attributable to time value taken immediately to theincome statement. The amounts remaining in equity at 31 December 2014 in relation to these cash flow hedges consist of deferred losses of$160 million maturing in 2015, deferred losses of $10 million maturing in 2016 and deferred gains of $3 million maturing in 2017 and beyond.
At 31 December 2012, BP had entered into three agreements to sell its 50% interest in TNK-BP and acquire 18.5% of Rosneft. During the period fromsigning until completion on 21 March 2013, these agreements represented derivative financial instruments that were required to be measured at fairvalue. BP designated two of the agreements, for the acquisition of a 5.66% shareholding in Rosneft from Rosneftegaz, and for the acquisition of a9.80% shareholding from Rosneft, as hedging instruments in a cash flow hedge, and so changes in the fair values of these agreements wererecognized in other comprehensive income. The third agreement, under which BP sold its 50% interest in TNK-BP in exchange for cash and a 3.04%shareholding in Rosneft, was also a derivative financial instrument, but its fair value could not be reliably measured. An asset of $1,410 million relatedto these agreements was recognized on the balance sheet at 31 December 2012, of which $1,339 million related to the fair value of the cash flowhedge derivatives. The derivatives measured at fair value at 31 December 2012 were categorized in level 3 of the fair value hierarchy using inputs thatincluded the quoted Rosneft share price. During 2013, a charge of $2,061 million was recognized in other comprehensive income in relation to theseagreements and $4 million was recognized in the income statement. The resulting cumulative charge of $651 million recognized in othercomprehensive income would only be recognized in the income statement if the investment in Rosneft were either sold or impaired. The cash flowhedge derivatives were valued using the quoted Rosneft share price at the time the deal completed, of $7.60 per share.
Fair value hedges
At 31 December 2014, the group held interest rate and cross-currency interest rate swap contracts as fair value hedges of the interest rate risk on fixedrate debt issued by the group. The loss on the hedging derivative instruments recognized in the income statement in 2014 was $14 million (2013$1,240 million loss and 2012 $536 million gain) offset by a gain on the fair value of the finance debt of $8 million (2013 $1,228 million gain and 2012$537 million loss).
The interest rate and cross-currency interest rate swaps mature within one to twelve years, and have the same maturity terms as the debt that theyare hedging. They are used to convert sterling, euro, Swiss franc, Australian dollar, Canadian dollar, Norwegian Krone and Hong Kong dollardenominated fixed rate borrowings into floating rate debt. Note 27 outlines the group’s approach to interest rate and foreign currency exchange riskmanagement.
Financial statements
BP Annual Report and Form 20-F 2014 151
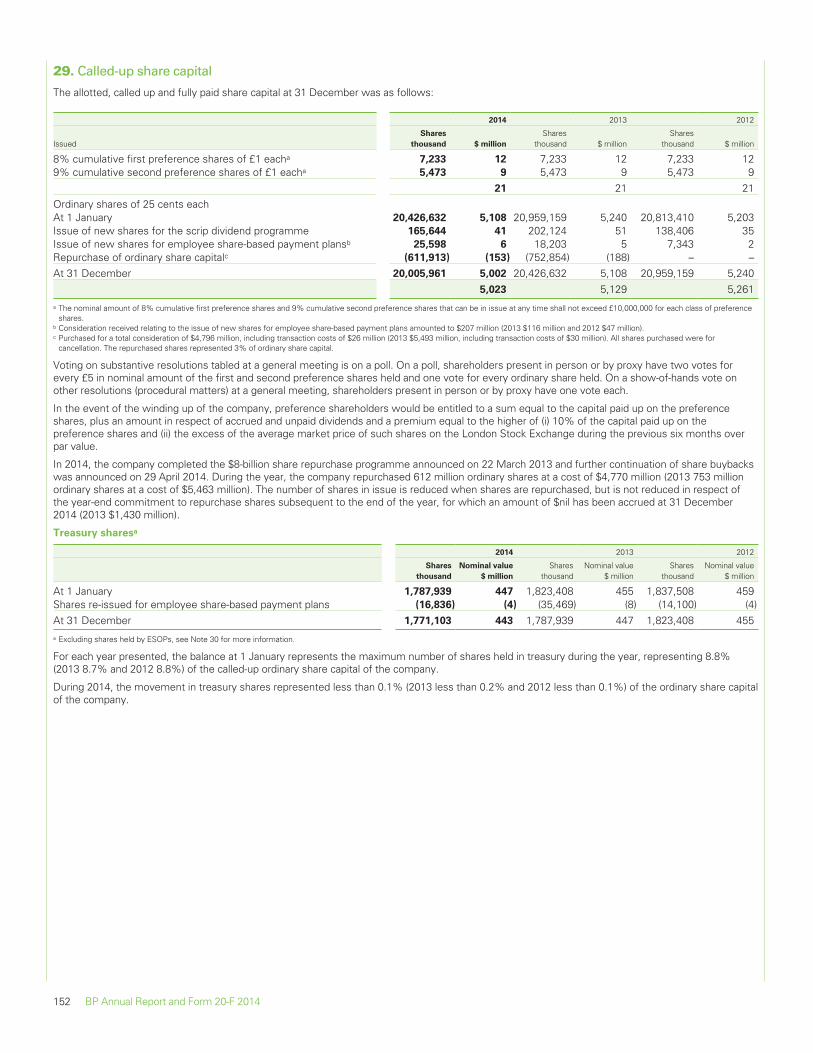
29. Called-up share capital
The allotted, called up and fully paid share capital at 31 December was as follows:
2014 2013 2012
IssuedShares
thousand $ million
Sharesthousand $ million
Sharesthousand $ million
8% cumulative first preference shares of £1 eacha 7,233 12 7,233 12 7,233 129% cumulative second preference shares of £1 eacha 5,473 9 5,473 9 5,473 9
21 21 21Ordinary shares of 25 cents eachAt 1 January 20,426,632 5,108 20,959,159 5,240 20,813,410 5,203Issue of new shares for the scrip dividend programme 165,644 41 202,124 51 138,406 35Issue of new shares for employee share-based payment plansb 25,598 6 18,203 5 7,343 2Repurchase of ordinary share capitalc (611,913) (153) (752,854) (188) – –At 31 December 20,005,961 5,002 20,426,632 5,108 20,959,159 5,240
5,023 5,129 5,261a The nominal amount of 8% cumulative first preference shares and 9% cumulative second preference shares that can be in issue at any time shall not exceed £10,000,000 for each class of preference
shares.b Consideration received relating to the issue of new shares for employee share-based payment plans amounted to $207 million (2013 $116 million and 2012 $47 million).c Purchased for a total consideration of $4,796 million, including transaction costs of $26 million (2013 $5,493 million, including transaction costs of $30 million). All shares purchased were for
cancellation. The repurchased shares represented 3% of ordinary share capital.
Voting on substantive resolutions tabled at a general meeting is on a poll. On a poll, shareholders present in person or by proxy have two votes forevery £5 in nominal amount of the first and second preference shares held and one vote for every ordinary share held. On a show-of-hands vote onother resolutions (procedural matters) at a general meeting, shareholders present in person or by proxy have one vote each.
In the event of the winding up of the company, preference shareholders would be entitled to a sum equal to the capital paid up on the preferenceshares, plus an amount in respect of accrued and unpaid dividends and a premium equal to the higher of (i) 10% of the capital paid up on thepreference shares and (ii) the excess of the average market price of such shares on the London Stock Exchange during the previous six months overpar value.
In 2014, the company completed the $8-billion share repurchase programme announced on 22 March 2013 and further continuation of share buybackswas announced on 29 April 2014. During the year, the company repurchased 612 million ordinary shares at a cost of $4,770 million (2013 753 millionordinary shares at a cost of $5,463 million). The number of shares in issue is reduced when shares are repurchased, but is not reduced in respect ofthe year-end commitment to repurchase shares subsequent to the end of the year, for which an amount of $nil has been accrued at 31 December2014 (2013 $1,430 million).
Treasury sharesa
2014 2013 2012
Shares
thousand
Nominal value
$ million
Sharesthousand
Nominal value$ million
Sharesthousand
Nominal value$ million
At 1 January 1,787,939 447 1,823,408 455 1,837,508 459Shares re-issued for employee share-based payment plans (16,836) (4) (35,469) (8) (14,100) (4)At 31 December 1,771,103 443 1,787,939 447 1,823,408 455a Excluding shares held by ESOPs, see Note 30 for more information.
For each year presented, the balance at 1 January represents the maximum number of shares held in treasury during the year, representing 8.8%(2013 8.7% and 2012 8.8%) of the called-up ordinary share capital of the company.
During 2014, the movement in treasury shares represented less than 0.1% (2013 less than 0.2% and 2012 less than 0.1%) of the ordinary share capitalof the company.
152 BP Annual Report and Form 20-F 2014

THIS PAGE INTENTIONALLY LEFT BLANK
BP Annual Report and Form 20-F 2014 153
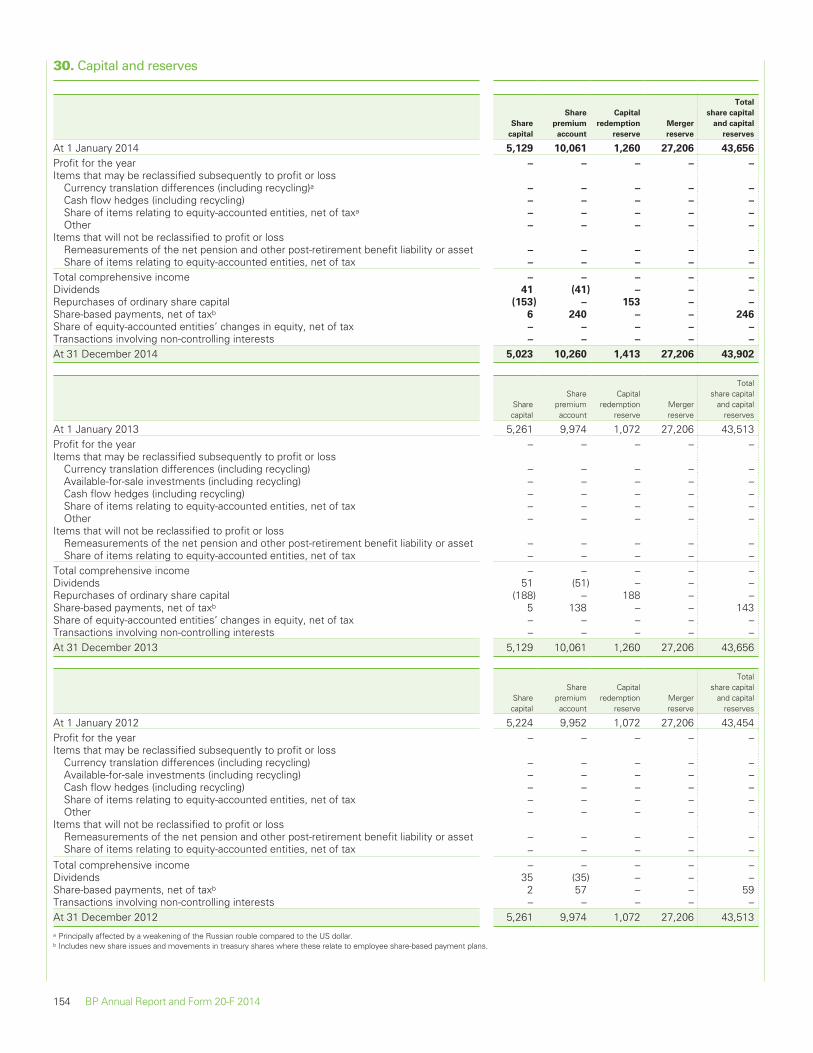
30. Capital and reserves
Share
capital
Share
premium
account
Capital
redemption
reserve
Merger
reserve
Total
share capital
and capital
reserves
At 1 January 2014 5,129 10,061 1,260 27,206 43,656
Profit for the year – – – – –
Items that may be reclassified subsequently to profit or lossCurrency translation differences (including recycling)a – – – – –
Cash flow hedges (including recycling) – – – – –
Share of items relating to equity-accounted entities, net of taxa – – – – –
Other – – – – –
Items that will not be reclassified to profit or lossRemeasurements of the net pension and other post-retirement benefit liability or asset – – – – –
Share of items relating to equity-accounted entities, net of tax – – – – –
Total comprehensive income – – – – –
Dividends 41 (41) – – –
Repurchases of ordinary share capital (153) – 153 – –
Share-based payments, net of taxb 6 240 – – 246
Share of equity-accounted entities’ changes in equity, net of tax – – – – –
Transactions involving non-controlling interests – – – – –
At 31 December 2014 5,023 10,260 1,413 27,206 43,902
Sharecapital
Sharepremiumaccount
Capitalredemption
reserveMergerreserve
Totalshare capital
and capitalreserves
At 1 January 2013 5,261 9,974 1,072 27,206 43,513Profit for the year – – – – –Items that may be reclassified subsequently to profit or loss
Currency translation differences (including recycling) – – – – –Available-for-sale investments (including recycling) – – – – –Cash flow hedges (including recycling) – – – – –Share of items relating to equity-accounted entities, net of tax – – – – –Other – – – – –
Items that will not be reclassified to profit or lossRemeasurements of the net pension and other post-retirement benefit liability or asset – – – – –Share of items relating to equity-accounted entities, net of tax – – – – –
Total comprehensive income – – – – –Dividends 51 (51) – – –Repurchases of ordinary share capital (188) – 188 – –Share-based payments, net of taxb 5 138 – – 143Share of equity-accounted entities’ changes in equity, net of tax – – – – –Transactions involving non-controlling interests – – – – –At 31 December 2013 5,129 10,061 1,260 27,206 43,656
Sharecapital
Sharepremiumaccount
Capitalredemption
reserveMergerreserve
Totalshare capital
and capitalreserves
At 1 January 2012 5,224 9,952 1,072 27,206 43,454Profit for the year – – – – –Items that may be reclassified subsequently to profit or loss
Currency translation differences (including recycling) – – – – –Available-for-sale investments (including recycling) – – – – –Cash flow hedges (including recycling) – – – – –Share of items relating to equity-accounted entities, net of tax – – – – –Other – – – – –
Items that will not be reclassified to profit or lossRemeasurements of the net pension and other post-retirement benefit liability or asset – – – – –Share of items relating to equity-accounted entities, net of tax – – – – –
Total comprehensive income – – – – –Dividends 35 (35) – – –Share-based payments, net of taxb 2 57 – – 59Transactions involving non-controlling interests – – – – –At 31 December 2012 5,261 9,974 1,072 27,206 43,513a Principally affected by a weakening of the Russian rouble compared to the US dollar.b Includes new share issues and movements in treasury shares where these relate to employee share-based payment plans.
154 BP Annual Report and Form 20-F 2014
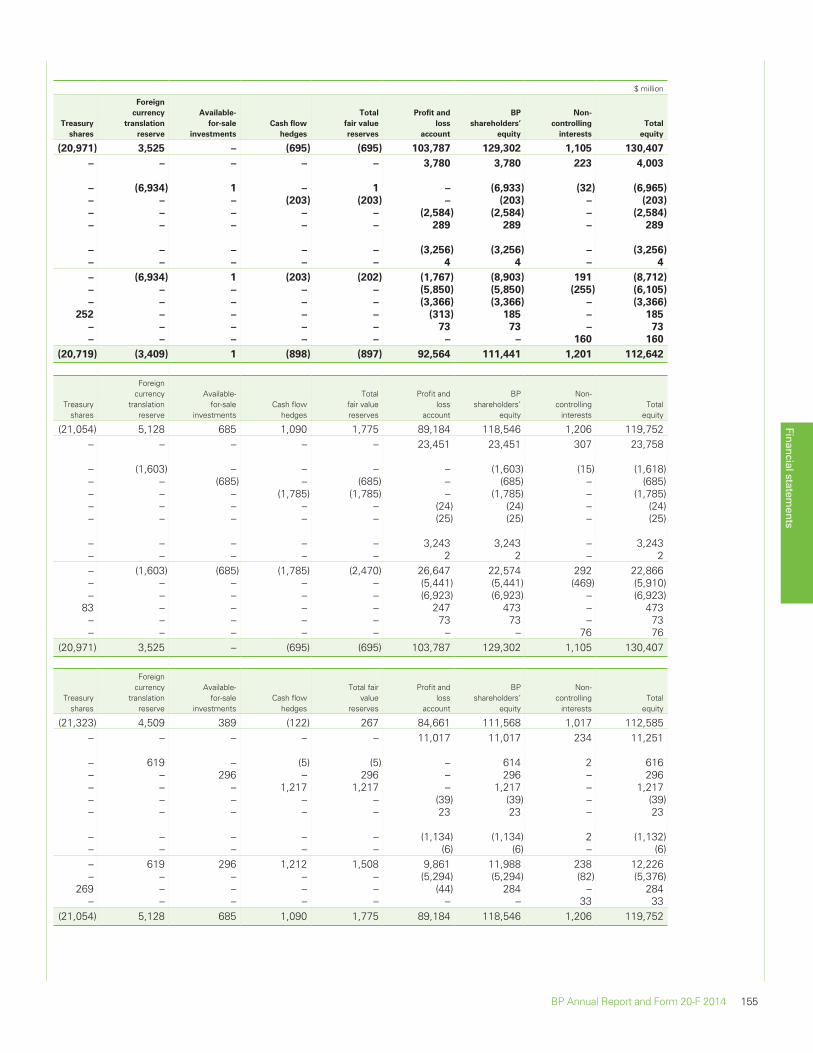
$ million
Treasury
shares
Foreign
currency
translation
reserve
Available-
for-sale
investments
Cash flow
hedges
Total
fair value
reserves
Profit and
loss
account
BP
shareholders’
equity
Non-
controlling
interests
Total
equity
(20,971) 3,525 – (695) (695) 103,787 129,302 1,105 130,407
– – – – – 3,780 3,780 223 4,003
– (6,934) 1 – 1 – (6,933) (32) (6,965)
– – – (203) (203) – (203) – (203)
– – – – – (2,584) (2,584) – (2,584)
– – – – – 289 289 – 289
– – – – – (3,256) (3,256) – (3,256)
– – – – – 4 4 – 4
– (6,934) 1 (203) (202) (1,767) (8,903) 191 (8,712)
– – – – – (5,850) (5,850) (255) (6,105)
– – – – – (3,366) (3,366) – (3,366)
252 – – – – (313) 185 – 185
– – – – – 73 73 – 73
– – – – – – – 160 160
(20,719) (3,409) 1 (898) (897) 92,564 111,441 1,201 112,642
Treasuryshares
Foreigncurrency
translationreserve
Available-for-sale
investmentsCash flow
hedges
Totalfair valuereserves
Profit andloss
account
BPshareholders’
equity
Non-controlling
interestsTotal
equity
(21,054) 5,128 685 1,090 1,775 89,184 118,546 1,206 119,752– – – – – 23,451 23,451 307 23,758
– (1,603) – – – – (1,603) (15) (1,618)– – (685) – (685) – (685) – (685)– – – (1,785) (1,785) – (1,785) – (1,785)– – – – – (24) (24) – (24)– – – – – (25) (25) – (25)
– – – – – 3,243 3,243 – 3,243– – – – – 2 2 – 2– (1,603) (685) (1,785) (2,470) 26,647 22,574 292 22,866– – – – – (5,441) (5,441) (469) (5,910)– – – – – (6,923) (6,923) – (6,923)
83 – – – – 247 473 – 473– – – – – 73 73 – 73– – – – – – – 76 76
(20,971) 3,525 – (695) (695) 103,787 129,302 1,105 130,407
Treasuryshares
Foreigncurrency
translationreserve
Available-for-sale
investmentsCash flow
hedges
Total fairvalue
reserves
Profit andloss
account
BPshareholders’
equity
Non-controlling
interestsTotal
equity
(21,323) 4,509 389 (122) 267 84,661 111,568 1,017 112,585– – – – – 11,017 11,017 234 11,251
– 619 – (5) (5) – 614 2 616– – 296 – 296 – 296 – 296– – – 1,217 1,217 – 1,217 – 1,217– – – – – (39) (39) – (39)– – – – – 23 23 – 23
– – – – – (1,134) (1,134) 2 (1,132)– – – – – (6) (6) – (6)– 619 296 1,212 1,508 9,861 11,988 238 12,226– – – – – (5,294) (5,294) (82) (5,376)
269 – – – – (44) 284 – 284– – – – – – – 33 33
(21,054) 5,128 685 1,090 1,775 89,184 118,546 1,206 119,752
Financial statements
BP Annual Report and Form 20-F 2014 155

30. Capital and reserves – continued
Share capital
The balance on the share capital account represents the aggregate nominal value of all ordinary and preference shares in issue, including treasuryshares.
Share premium account
The balance on the share premium account represents the amounts received in excess of the nominal value of the ordinary and preference shares.
Capital redemption reserve
The balance on the capital redemption reserve represents the aggregate nominal value of all the ordinary shares repurchased and cancelled.
Merger reserve
The balance on the merger reserve represents the fair value of the consideration given in excess of the nominal value of the ordinary shares issued inan acquisition made by the issue of shares.
Treasury shares
Treasury shares represent BP shares repurchased and available for specific and limited purposes.
For accounting purposes shares held in Employee Share Ownership Plans (ESOPs) to meet the future requirements of the employee share-basedpayment plans are treated in the same manner as treasury shares and are therefore included in the financial statements as treasury shares. The ESOPsare funded by the group and have waived their rights to dividends in respect of such shares held for future awards. Until such time as the shares heldby the ESOPs vest unconditionally to employees, the amount paid for those shares is shown as a reduction in shareholders’ equity. Assets andliabilities of the ESOPs are recognized as assets and liabilities of the group.
At 31 December 2014, the ESOPs held 34,169,554 shares (2013 32,748,354 shares and 2012 22,428,179 shares) for potential future awards, whichhad a market value of $219 million (2013 $253 million and 2012 $154 million). At 31 December 2014, a further 6,024,978 ordinary share equivalents(2013 12,856,914 ordinary share equivalents) were held by the group in the form of ADSs to meet the requirements of employee share-based paymentplans in the US.
Foreign currency translation reserve
The foreign currency translation reserve records exchange differences arising from the translation of the financial statements of foreign operations.Upon disposal of foreign operations, the related accumulated exchange differences are recycled to the income statement.
Available-for-sale investments
This reserve records the changes in fair value of available-for-sale investments except for impairment losses, foreign exchange gains or losses, orchanges arising from revised estimates of future cash flows. On disposal or impairment of the investments, the cumulative changes in fair value arerecycled to the income statement.
Cash flow hedges
This reserve records the portion of the gain or loss on a hedging instrument in a cash flow hedge that is determined to be an effective hedge. Forfurther information see Note 1 – Derivative financial instruments and hedging activities.
Profit and loss account
The balance held on this reserve is the accumulated retained profits of the group.
156 BP Annual Report and Form 20-F 2014
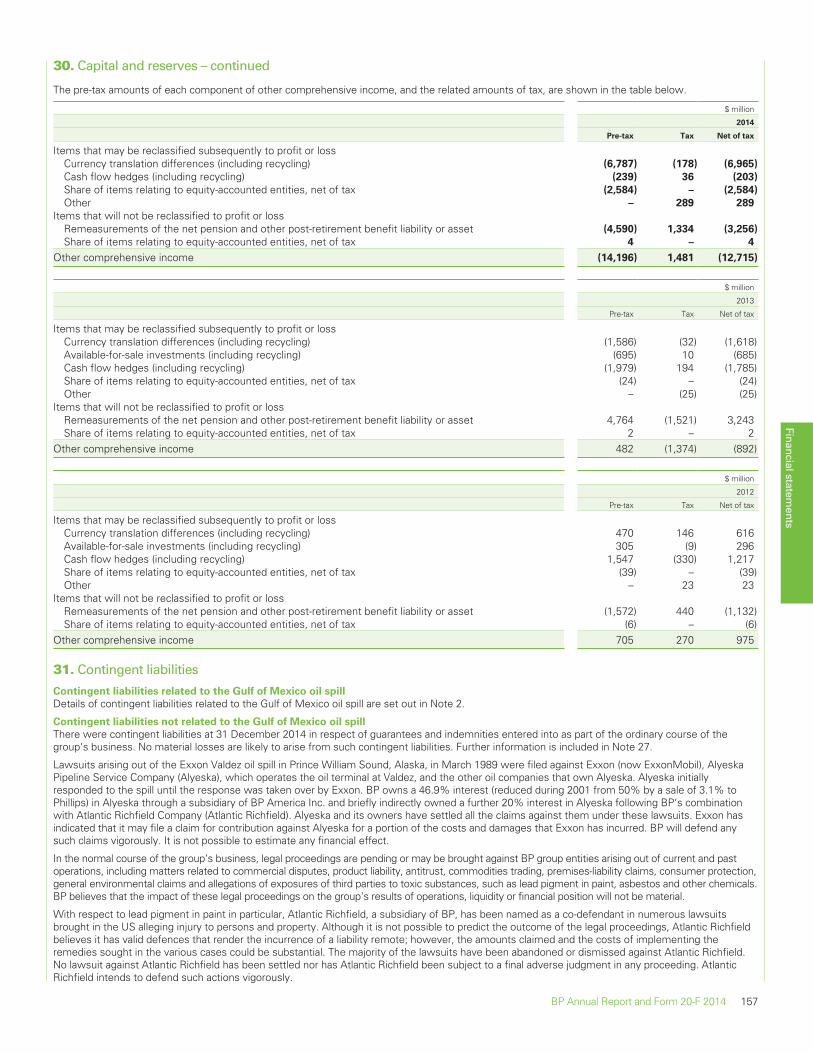
30. Capital and reserves – continued
The pre-tax amounts of each component of other comprehensive income, and the related amounts of tax, are shown in the table below.
$ million
2014
Pre-tax Tax Net of tax
Items that may be reclassified subsequently to profit or lossCurrency translation differences (including recycling) (6,787) (178) (6,965)
Cash flow hedges (including recycling) (239) 36 (203)
Share of items relating to equity-accounted entities, net of tax (2,584) – (2,584)
Other – 289 289
Items that will not be reclassified to profit or lossRemeasurements of the net pension and other post-retirement benefit liability or asset (4,590) 1,334 (3,256)
Share of items relating to equity-accounted entities, net of tax 4 – 4
Other comprehensive income (14,196) 1,481 (12,715)
$ million
2013
Pre-tax Tax Net of tax
Items that may be reclassified subsequently to profit or lossCurrency translation differences (including recycling) (1,586) (32) (1,618)Available-for-sale investments (including recycling) (695) 10 (685)Cash flow hedges (including recycling) (1,979) 194 (1,785)Share of items relating to equity-accounted entities, net of tax (24) – (24)Other – (25) (25)
Items that will not be reclassified to profit or lossRemeasurements of the net pension and other post-retirement benefit liability or asset 4,764 (1,521) 3,243Share of items relating to equity-accounted entities, net of tax 2 – 2
Other comprehensive income 482 (1,374) (892)
$ million
2012
Pre-tax Tax Net of tax
Items that may be reclassified subsequently to profit or lossCurrency translation differences (including recycling) 470 146 616Available-for-sale investments (including recycling) 305 (9) 296Cash flow hedges (including recycling) 1,547 (330) 1,217Share of items relating to equity-accounted entities, net of tax (39) – (39)Other – 23 23
Items that will not be reclassified to profit or lossRemeasurements of the net pension and other post-retirement benefit liability or asset (1,572) 440 (1,132)Share of items relating to equity-accounted entities, net of tax (6) – (6)
Other comprehensive income 705 270 975
31. Contingent liabilities
Contingent liabilities related to the Gulf of Mexico oil spill
Details of contingent liabilities related to the Gulf of Mexico oil spill are set out in Note 2.
Contingent liabilities not related to the Gulf of Mexico oil spill
There were contingent liabilities at 31 December 2014 in respect of guarantees and indemnities entered into as part of the ordinary course of thegroup‘s business. No material losses are likely to arise from such contingent liabilities. Further information is included in Note 27.
Lawsuits arising out of the Exxon Valdez oil spill in Prince William Sound, Alaska, in March 1989 were filed against Exxon (now ExxonMobil), AlyeskaPipeline Service Company (Alyeska), which operates the oil terminal at Valdez, and the other oil companies that own Alyeska. Alyeska initiallyresponded to the spill until the response was taken over by Exxon. BP owns a 46.9% interest (reduced during 2001 from 50% by a sale of 3.1% toPhillips) in Alyeska through a subsidiary of BP America Inc. and briefly indirectly owned a further 20% interest in Alyeska following BP‘s combinationwith Atlantic Richfield Company (Atlantic Richfield). Alyeska and its owners have settled all the claims against them under these lawsuits. Exxon hasindicated that it may file a claim for contribution against Alyeska for a portion of the costs and damages that Exxon has incurred. BP will defend anysuch claims vigorously. It is not possible to estimate any financial effect.
In the normal course of the group‘s business, legal proceedings are pending or may be brought against BP group entities arising out of current and pastoperations, including matters related to commercial disputes, product liability, antitrust, commodities trading, premises-liability claims, consumer protection,general environmental claims and allegations of exposures of third parties to toxic substances, such as lead pigment in paint, asbestos and other chemicals.BP believes that the impact of these legal proceedings on the group‘s results of operations, liquidity or financial position will not be material.
With respect to lead pigment in paint in particular, Atlantic Richfield, a subsidiary of BP, has been named as a co-defendant in numerous lawsuitsbrought in the US alleging injury to persons and property. Although it is not possible to predict the outcome of the legal proceedings, Atlantic Richfieldbelieves it has valid defences that render the incurrence of a liability remote; however, the amounts claimed and the costs of implementing theremedies sought in the various cases could be substantial. The majority of the lawsuits have been abandoned or dismissed against Atlantic Richfield.No lawsuit against Atlantic Richfield has been settled nor has Atlantic Richfield been subject to a final adverse judgment in any proceeding. AtlanticRichfield intends to defend such actions vigorously.
Financial statements
BP Annual Report and Form 20-F 2014 157
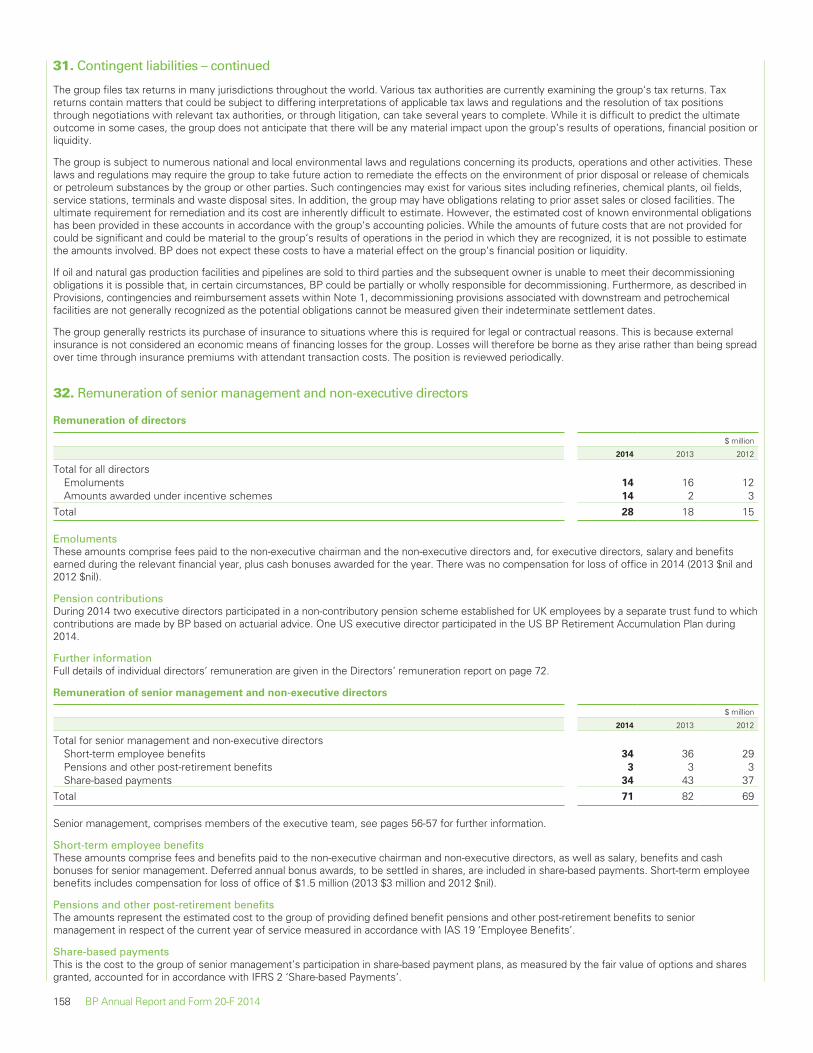
31. Contingent liabilities – continued
The group files tax returns in many jurisdictions throughout the world. Various tax authorities are currently examining the group‘s tax returns. Taxreturns contain matters that could be subject to differing interpretations of applicable tax laws and regulations and the resolution of tax positionsthrough negotiations with relevant tax authorities, or through litigation, can take several years to complete. While it is difficult to predict the ultimateoutcome in some cases, the group does not anticipate that there will be any material impact upon the group‘s results of operations, financial position orliquidity.
The group is subject to numerous national and local environmental laws and regulations concerning its products, operations and other activities. Theselaws and regulations may require the group to take future action to remediate the effects on the environment of prior disposal or release of chemicalsor petroleum substances by the group or other parties. Such contingencies may exist for various sites including refineries, chemical plants, oil fields,service stations, terminals and waste disposal sites. In addition, the group may have obligations relating to prior asset sales or closed facilities. Theultimate requirement for remediation and its cost are inherently difficult to estimate. However, the estimated cost of known environmental obligationshas been provided in these accounts in accordance with the group‘s accounting policies. While the amounts of future costs that are not provided forcould be significant and could be material to the group‘s results of operations in the period in which they are recognized, it is not possible to estimatethe amounts involved. BP does not expect these costs to have a material effect on the group‘s financial position or liquidity.
If oil and natural gas production facilities and pipelines are sold to third parties and the subsequent owner is unable to meet their decommissioningobligations it is possible that, in certain circumstances, BP could be partially or wholly responsible for decommissioning. Furthermore, as described inProvisions, contingencies and reimbursement assets within Note 1, decommissioning provisions associated with downstream and petrochemicalfacilities are not generally recognized as the potential obligations cannot be measured given their indeterminate settlement dates.
The group generally restricts its purchase of insurance to situations where this is required for legal or contractual reasons. This is because externalinsurance is not considered an economic means of financing losses for the group. Losses will therefore be borne as they arise rather than being spreadover time through insurance premiums with attendant transaction costs. The position is reviewed periodically.
32. Remuneration of senior management and non-executive directors
Remuneration of directors
$ million
2014 2013 2012
Total for all directorsEmoluments 14 16 12Amounts awarded under incentive schemes 14 2 3
Total 28 18 15
EmolumentsThese amounts comprise fees paid to the non-executive chairman and the non-executive directors and, for executive directors, salary and benefitsearned during the relevant financial year, plus cash bonuses awarded for the year. There was no compensation for loss of office in 2014 (2013 $nil and2012 $nil).
Pension contributionsDuring 2014 two executive directors participated in a non-contributory pension scheme established for UK employees by a separate trust fund to whichcontributions are made by BP based on actuarial advice. One US executive director participated in the US BP Retirement Accumulation Plan during2014.
Further informationFull details of individual directors’ remuneration are given in the Directors’ remuneration report on page 72.
Remuneration of senior management and non-executive directors
$ million
2014 2013 2012
Total for senior management and non-executive directorsShort-term employee benefits 34 36 29Pensions and other post-retirement benefits 3 3 3Share-based payments 34 43 37
Total 71 82 69
Senior management, comprises members of the executive team, see pages 56-57 for further information.
Short-term employee benefitsThese amounts comprise fees and benefits paid to the non-executive chairman and non-executive directors, as well as salary, benefits and cashbonuses for senior management. Deferred annual bonus awards, to be settled in shares, are included in share-based payments. Short-term employeebenefits includes compensation for loss of office of $1.5 million (2013 $3 million and 2012 $nil).
Pensions and other post-retirement benefitsThe amounts represent the estimated cost to the group of providing defined benefit pensions and other post-retirement benefits to seniormanagement in respect of the current year of service measured in accordance with IAS 19 ‘Employee Benefits’.
Share-based paymentsThis is the cost to the group of senior management’s participation in share-based payment plans, as measured by the fair value of options and sharesgranted, accounted for in accordance with IFRS 2 ‘Share-based Payments’.
158 BP Annual Report and Form 20-F 2014
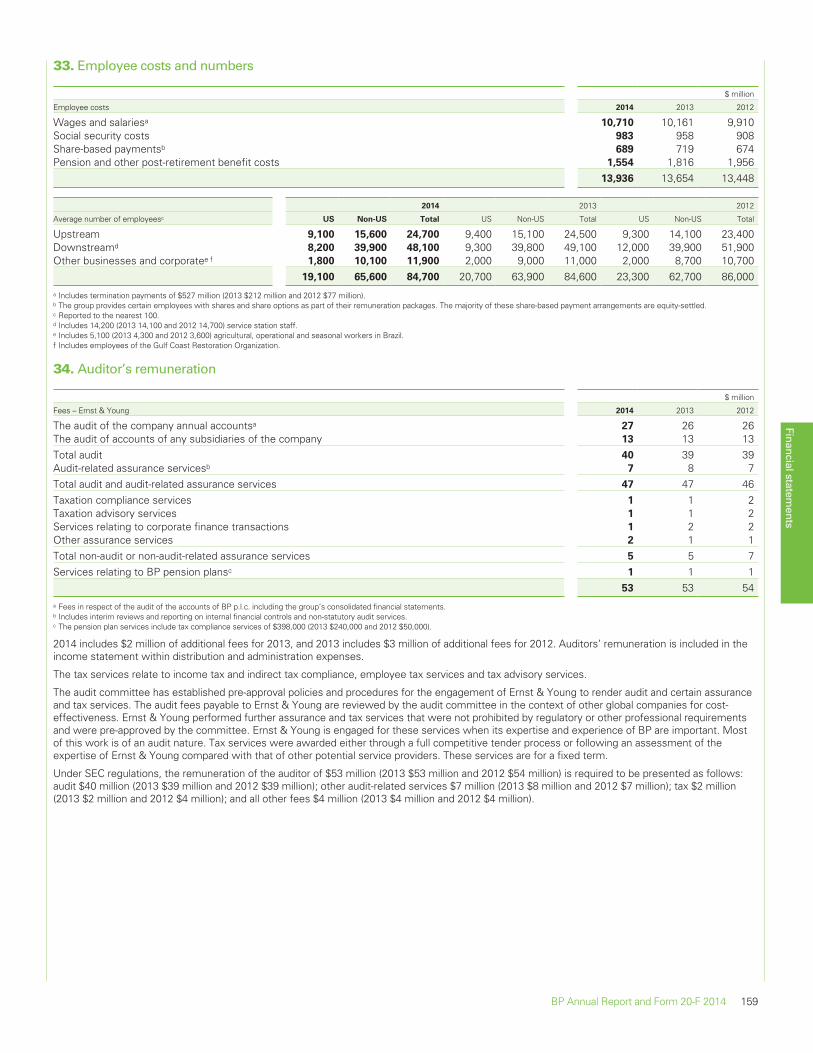
33. Employee costs and numbers
$ million
Employee costs 2014 2013 2012
Wages and salariesa 10,710 10,161 9,910Social security costs 983 958 908Share-based paymentsb 689 719 674Pension and other post-retirement benefit costs 1,554 1,816 1,956
13,936 13,654 13,448
2014 2013 2012
Average number of employeesc US Non-US Total US Non-US Total US Non-US Total
Upstream 9,100 15,600 24,700 9,400 15,100 24,500 9,300 14,100 23,400Downstreamd 8,200 39,900 48,100 9,300 39,800 49,100 12,000 39,900 51,900Other businesses and corporatee f 1,800 10,100 11,900 2,000 9,000 11,000 2,000 8,700 10,700
19,100 65,600 84,700 20,700 63,900 84,600 23,300 62,700 86,000a Includes termination payments of $527 million (2013 $212 million and 2012 $77 million).b The group provides certain employees with shares and share options as part of their remuneration packages. The majority of these share-based payment arrangements are equity-settled.c Reported to the nearest 100.d Includes 14,200 (2013 14,100 and 2012 14,700) service station staff.e Includes 5,100 (2013 4,300 and 2012 3,600) agricultural, operational and seasonal workers in Brazil.f Includes employees of the Gulf Coast Restoration Organization.
34. Auditor’s remuneration
$ million
Fees – Ernst & Young 2014 2013 2012
The audit of the company annual accountsa 27 26 26The audit of accounts of any subsidiaries of the company 13 13 13Total audit 40 39 39Audit-related assurance servicesb 7 8 7Total audit and audit-related assurance services 47 47 46Taxation compliance services 1 1 2Taxation advisory services 1 1 2Services relating to corporate finance transactions 1 2 2Other assurance services 2 1 1Total non-audit or non-audit-related assurance services 5 5 7Services relating to BP pension plansc 1 1 1
53 53 54a Fees in respect of the audit of the accounts of BP p.l.c. including the group’s consolidated financial statements.b Includes interim reviews and reporting on internal financial controls and non-statutory audit services.c The pension plan services include tax compliance services of $398,000 (2013 $240,000 and 2012 $50,000).
2014 includes $2 million of additional fees for 2013, and 2013 includes $3 million of additional fees for 2012. Auditors’ remuneration is included in theincome statement within distribution and administration expenses.
The tax services relate to income tax and indirect tax compliance, employee tax services and tax advisory services.
The audit committee has established pre-approval policies and procedures for the engagement of Ernst & Young to render audit and certain assuranceand tax services. The audit fees payable to Ernst & Young are reviewed by the audit committee in the context of other global companies for cost-effectiveness. Ernst & Young performed further assurance and tax services that were not prohibited by regulatory or other professional requirementsand were pre-approved by the committee. Ernst & Young is engaged for these services when its expertise and experience of BP are important. Mostof this work is of an audit nature. Tax services were awarded either through a full competitive tender process or following an assessment of theexpertise of Ernst & Young compared with that of other potential service providers. These services are for a fixed term.
Under SEC regulations, the remuneration of the auditor of $53 million (2013 $53 million and 2012 $54 million) is required to be presented as follows:audit $40 million (2013 $39 million and 2012 $39 million); other audit-related services $7 million (2013 $8 million and 2012 $7 million); tax $2 million(2013 $2 million and 2012 $4 million); and all other fees $4 million (2013 $4 million and 2012 $4 million).
Financial statements
BP Annual Report and Form 20-F 2014 159
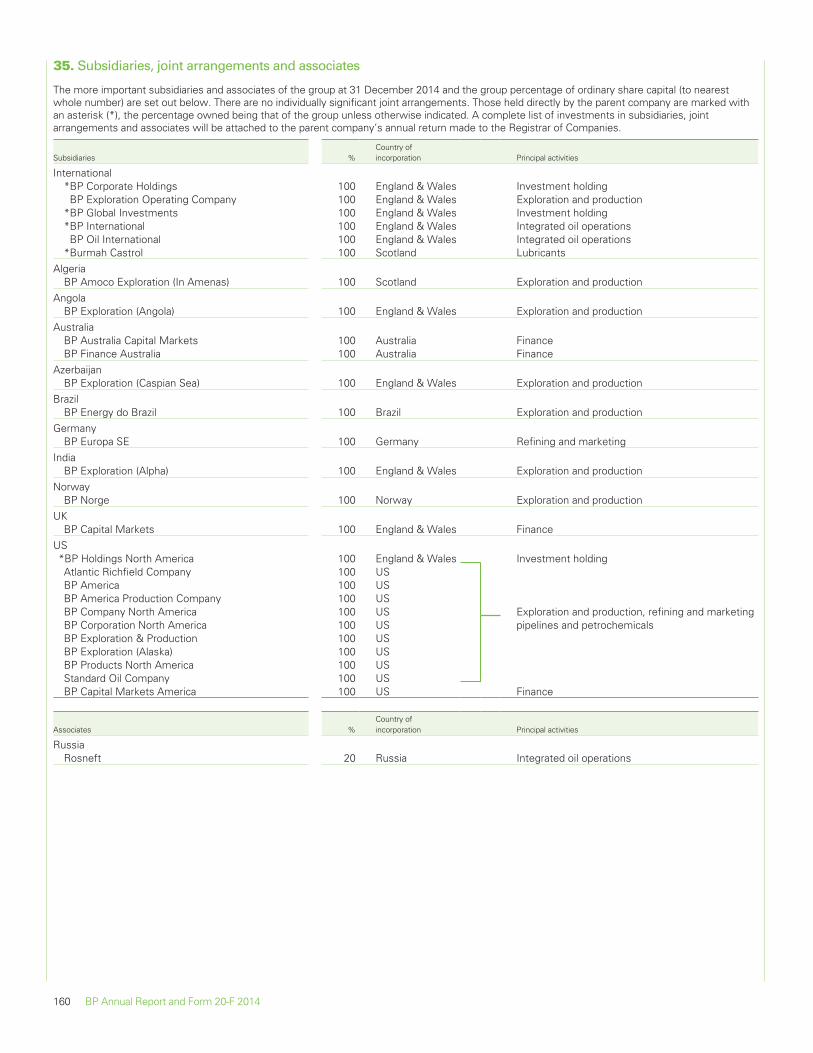
35. Subsidiaries, joint arrangements and associates
The more important subsidiaries and associates of the group at 31 December 2014 and the group percentage of ordinary share capital (to nearestwhole number) are set out below. There are no individually significant joint arrangements. Those held directly by the parent company are marked withan asterisk (*), the percentage owned being that of the group unless otherwise indicated. A complete list of investments in subsidiaries, jointarrangements and associates will be attached to the parent company’s annual return made to the Registrar of Companies.
Subsidiaries %Country ofincorporation Principal activities
International*BP Corporate Holdings 100 England & Wales Investment holding
BP Exploration Operating Company 100 England & Wales Exploration and production*BP Global Investments 100 England & Wales Investment holding*BP International 100 England & Wales Integrated oil operations
BP Oil International 100 England & Wales Integrated oil operations*Burmah Castrol 100 Scotland Lubricants
AlgeriaBP Amoco Exploration (In Amenas) 100 Scotland Exploration and production
AngolaBP Exploration (Angola) 100 England & Wales Exploration and production
AustraliaBP Australia Capital Markets 100 Australia FinanceBP Finance Australia 100 Australia Finance
AzerbaijanBP Exploration (Caspian Sea) 100 England & Wales Exploration and production
BrazilBP Energy do Brazil 100 Brazil Exploration and production
GermanyBP Europa SE 100 Germany Refining and marketing
IndiaBP Exploration (Alpha) 100 England & Wales Exploration and production
NorwayBP Norge 100 Norway Exploration and production
UKBP Capital Markets 100 England & Wales Finance
US*BP Holdings North America 100 England & Wales Investment holdingAtlantic Richfield Company 100 US
Exploration and production, refining and marketingpipelines and petrochemicals
BP America 100 USBP America Production Company 100 USBP Company North America 100 USBP Corporation North America 100 USBP Exploration & Production 100 USBP Exploration (Alaska) 100 USBP Products North America 100 USStandard Oil Company 100 USBP Capital Markets America 100 US Finance
Associates %Country ofincorporation Principal activities
RussiaRosneft 20 Russia Integrated oil operations
160 BP Annual Report and Form 20-F 2014
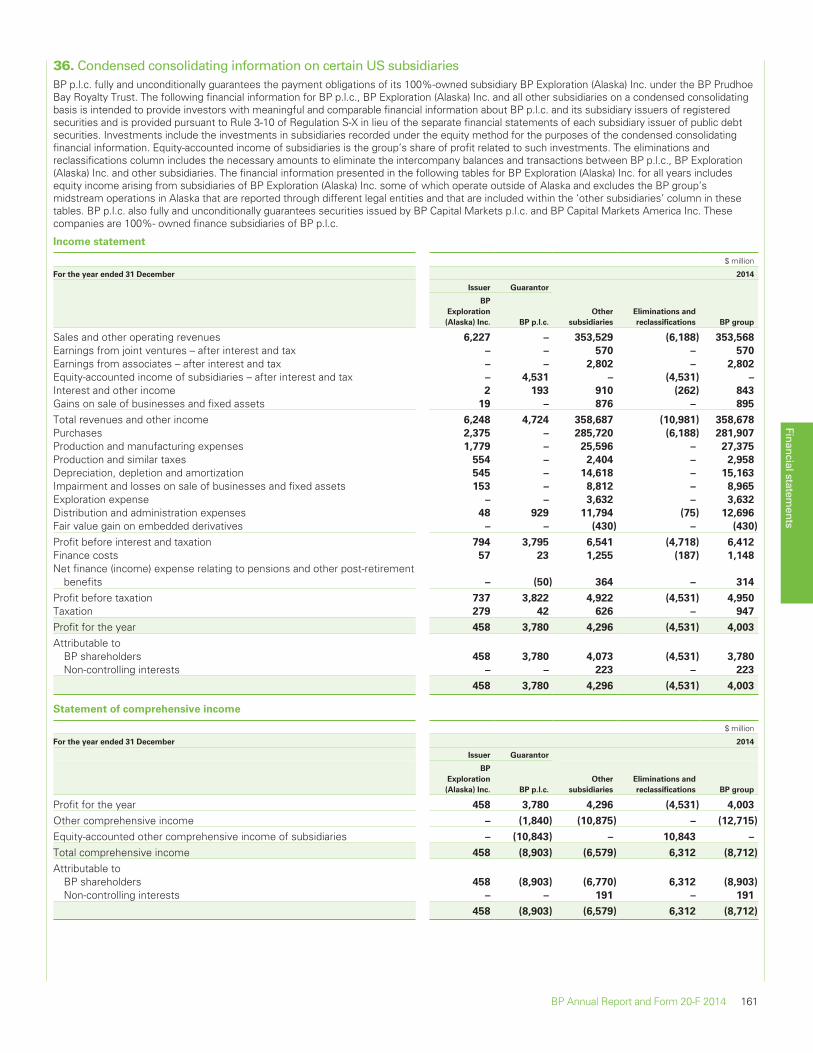
36. Condensed consolidating information on certain US subsidiariesBP p.l.c. fully and unconditionally guarantees the payment obligations of its 100%-owned subsidiary BP Exploration (Alaska) Inc. under the BP PrudhoeBay Royalty Trust. The following financial information for BP p.l.c., BP Exploration (Alaska) Inc. and all other subsidiaries on a condensed consolidatingbasis is intended to provide investors with meaningful and comparable financial information about BP p.l.c. and its subsidiary issuers of registeredsecurities and is provided pursuant to Rule 3-10 of Regulation S-X in lieu of the separate financial statements of each subsidiary issuer of public debtsecurities. Investments include the investments in subsidiaries recorded under the equity method for the purposes of the condensed consolidatingfinancial information. Equity-accounted income of subsidiaries is the group’s share of profit related to such investments. The eliminations andreclassifications column includes the necessary amounts to eliminate the intercompany balances and transactions between BP p.l.c., BP Exploration(Alaska) Inc. and other subsidiaries. The financial information presented in the following tables for BP Exploration (Alaska) Inc. for all years includesequity income arising from subsidiaries of BP Exploration (Alaska) Inc. some of which operate outside of Alaska and excludes the BP group’smidstream operations in Alaska that are reported through different legal entities and that are included within the ‘other subsidiaries’ column in thesetables. BP p.l.c. also fully and unconditionally guarantees securities issued by BP Capital Markets p.l.c. and BP Capital Markets America Inc. Thesecompanies are 100%- owned finance subsidiaries of BP p.l.c.
Income statement
$ million
For the year ended 31 December 2014
Issuer Guarantor
BP
Exploration
(Alaska) Inc. BP p.l.c.
Other
subsidiaries
Eliminations and
reclassifications BP group
Sales and other operating revenues 6,227 – 353,529 (6,188) 353,568
Earnings from joint ventures – after interest and tax – – 570 – 570
Earnings from associates – after interest and tax – – 2,802 – 2,802
Equity-accounted income of subsidiaries – after interest and tax – 4,531 – (4,531) –
Interest and other income 2 193 910 (262) 843
Gains on sale of businesses and fixed assets 19 – 876 – 895
Total revenues and other income 6,248 4,724 358,687 (10,981) 358,678
Purchases 2,375 – 285,720 (6,188) 281,907
Production and manufacturing expenses 1,779 – 25,596 – 27,375
Production and similar taxes 554 – 2,404 – 2,958
Depreciation, depletion and amortization 545 – 14,618 – 15,163
Impairment and losses on sale of businesses and fixed assets 153 – 8,812 – 8,965
Exploration expense – – 3,632 – 3,632
Distribution and administration expenses 48 929 11,794 (75) 12,696
Fair value gain on embedded derivatives – – (430) – (430)
Profit before interest and taxation 794 3,795 6,541 (4,718) 6,412
Finance costs 57 23 1,255 (187) 1,148
Net finance (income) expense relating to pensions and other post-retirementbenefits – (50) 364 – 314
Profit before taxation 737 3,822 4,922 (4,531) 4,950
Taxation 279 42 626 – 947
Profit for the year 458 3,780 4,296 (4,531) 4,003
Attributable toBP shareholders 458 3,780 4,073 (4,531) 3,780
Non-controlling interests – – 223 – 223
458 3,780 4,296 (4,531) 4,003
Statement of comprehensive income
$ million
For the year ended 31 December 2014
Issuer Guarantor
BP
Exploration
(Alaska) Inc. BP p.l.c.
Other
subsidiaries
Eliminations and
reclassifications BP group
Profit for the year 458 3,780 4,296 (4,531) 4,003
Other comprehensive income – (1,840) (10,875) – (12,715)
Equity-accounted other comprehensive income of subsidiaries – (10,843) – 10,843 –
Total comprehensive income 458 (8,903) (6,579) 6,312 (8,712)
Attributable toBP shareholders 458 (8,903) (6,770) 6,312 (8,903)
Non-controlling interests – – 191 – 191
458 (8,903) (6,579) 6,312 (8,712)
Financial statements
BP Annual Report and Form 20-F 2014 161
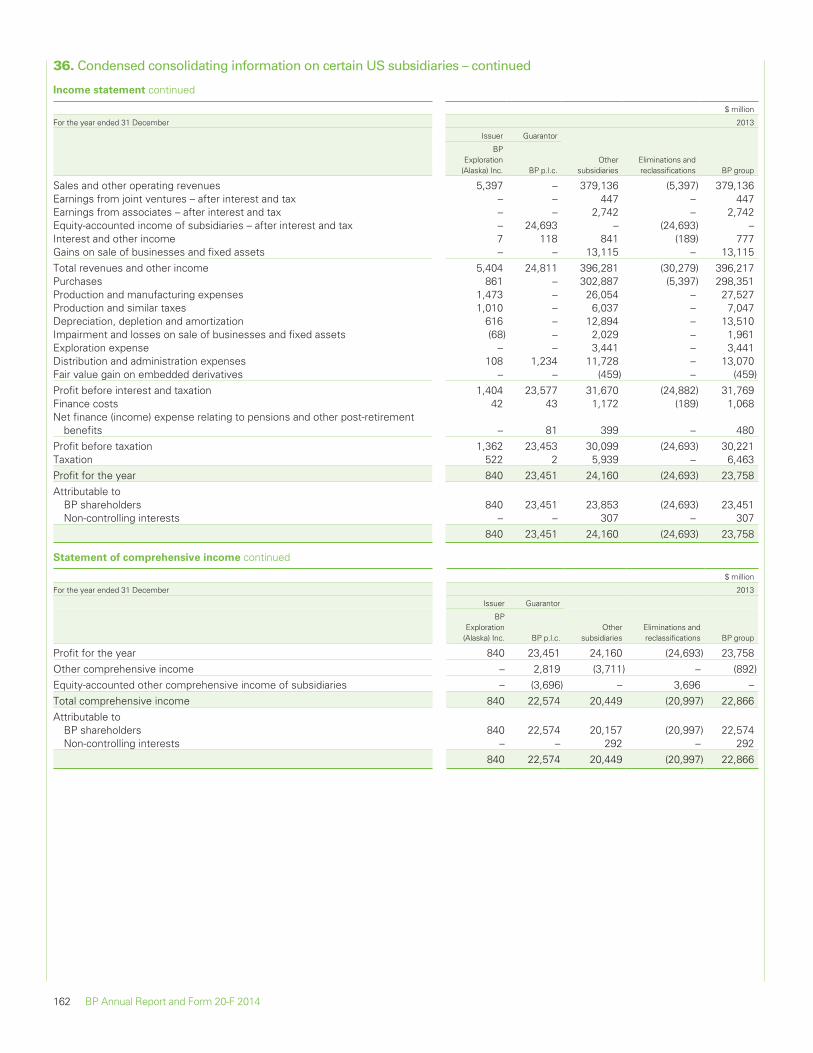
36. Condensed consolidating information on certain US subsidiaries – continued
Income statement continued
$ million
For the year ended 31 December 2013
Issuer Guarantor
BPExploration
(Alaska) Inc. BP p.l.c.Other
subsidiariesEliminations andreclassifications BP group
Sales and other operating revenues 5,397 – 379,136 (5,397) 379,136Earnings from joint ventures – after interest and tax – – 447 – 447Earnings from associates – after interest and tax – – 2,742 – 2,742Equity-accounted income of subsidiaries – after interest and tax – 24,693 – (24,693) –Interest and other income 7 118 841 (189) 777Gains on sale of businesses and fixed assets – – 13,115 – 13,115Total revenues and other income 5,404 24,811 396,281 (30,279) 396,217Purchases 861 – 302,887 (5,397) 298,351Production and manufacturing expenses 1,473 – 26,054 – 27,527Production and similar taxes 1,010 – 6,037 – 7,047Depreciation, depletion and amortization 616 – 12,894 – 13,510Impairment and losses on sale of businesses and fixed assets (68) – 2,029 – 1,961Exploration expense – – 3,441 – 3,441Distribution and administration expenses 108 1,234 11,728 – 13,070Fair value gain on embedded derivatives – – (459) – (459)Profit before interest and taxation 1,404 23,577 31,670 (24,882) 31,769Finance costs 42 43 1,172 (189) 1,068Net finance (income) expense relating to pensions and other post-retirement
benefits – 81 399 – 480Profit before taxation 1,362 23,453 30,099 (24,693) 30,221Taxation 522 2 5,939 – 6,463Profit for the year 840 23,451 24,160 (24,693) 23,758Attributable to
BP shareholders 840 23,451 23,853 (24,693) 23,451Non-controlling interests – – 307 – 307
840 23,451 24,160 (24,693) 23,758
Statement of comprehensive income continued
$ million
For the year ended 31 December 2013
Issuer Guarantor
BPExploration
(Alaska) Inc. BP p.l.c.Other
subsidiariesEliminations andreclassifications BP group
Profit for the year 840 23,451 24,160 (24,693) 23,758Other comprehensive income – 2,819 (3,711) – (892)Equity-accounted other comprehensive income of subsidiaries – (3,696) – 3,696 –Total comprehensive income 840 22,574 20,449 (20,997) 22,866Attributable to
BP shareholders 840 22,574 20,157 (20,997) 22,574Non-controlling interests – – 292 – 292
840 22,574 20,449 (20,997) 22,866
162 BP Annual Report and Form 20-F 2014
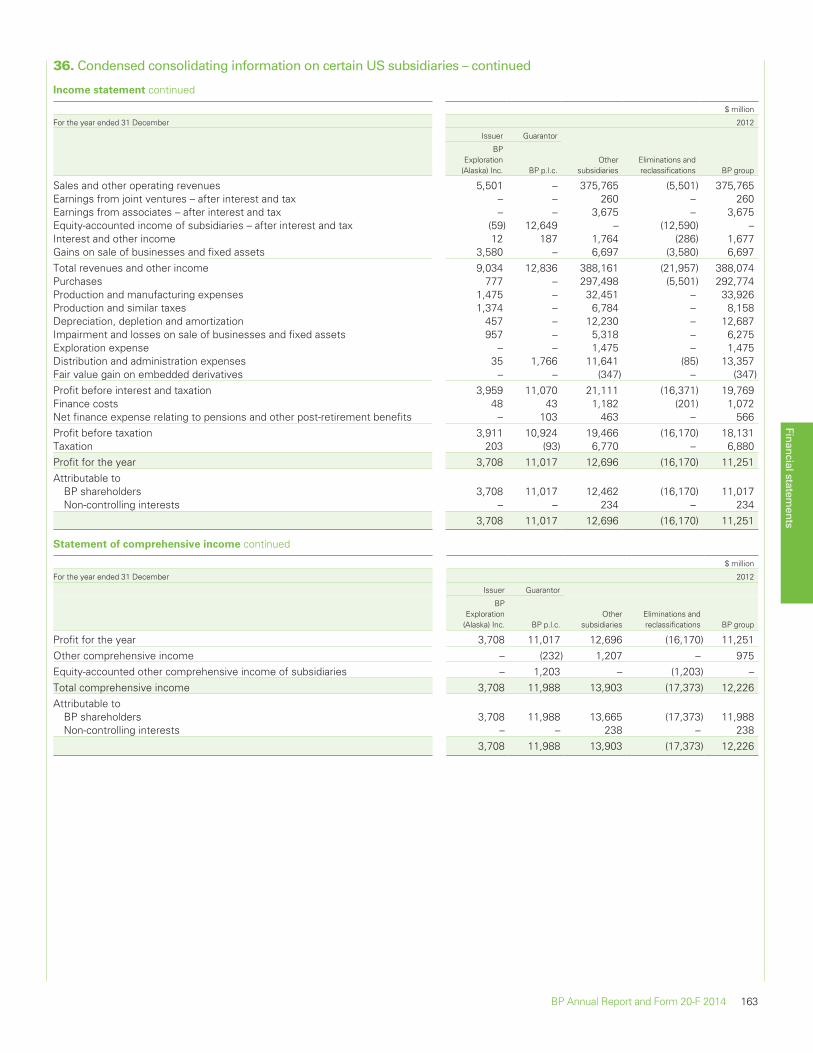
36. Condensed consolidating information on certain US subsidiaries – continued
Income statement continued
$ million
For the year ended 31 December 2012
Issuer Guarantor
BPExploration
(Alaska) Inc. BP p.l.c.Other
subsidiariesEliminations andreclassifications BP group
Sales and other operating revenues 5,501 – 375,765 (5,501) 375,765Earnings from joint ventures – after interest and tax – – 260 – 260Earnings from associates – after interest and tax – – 3,675 – 3,675Equity-accounted income of subsidiaries – after interest and tax (59) 12,649 – (12,590) –Interest and other income 12 187 1,764 (286) 1,677Gains on sale of businesses and fixed assets 3,580 – 6,697 (3,580) 6,697Total revenues and other income 9,034 12,836 388,161 (21,957) 388,074Purchases 777 – 297,498 (5,501) 292,774Production and manufacturing expenses 1,475 – 32,451 – 33,926Production and similar taxes 1,374 – 6,784 – 8,158Depreciation, depletion and amortization 457 – 12,230 – 12,687Impairment and losses on sale of businesses and fixed assets 957 – 5,318 – 6,275Exploration expense – – 1,475 – 1,475Distribution and administration expenses 35 1,766 11,641 (85) 13,357Fair value gain on embedded derivatives – – (347) – (347)Profit before interest and taxation 3,959 11,070 21,111 (16,371) 19,769Finance costs 48 43 1,182 (201) 1,072Net finance expense relating to pensions and other post-retirement benefits – 103 463 – 566Profit before taxation 3,911 10,924 19,466 (16,170) 18,131Taxation 203 (93) 6,770 – 6,880Profit for the year 3,708 11,017 12,696 (16,170) 11,251Attributable to
BP shareholders 3,708 11,017 12,462 (16,170) 11,017Non-controlling interests – – 234 – 234
3,708 11,017 12,696 (16,170) 11,251
Statement of comprehensive income continued
$ million
For the year ended 31 December 2012
Issuer Guarantor
BPExploration
(Alaska) Inc. BP p.l.c.Other
subsidiariesEliminations andreclassifications BP group
Profit for the year 3,708 11,017 12,696 (16,170) 11,251Other comprehensive income – (232) 1,207 – 975Equity-accounted other comprehensive income of subsidiaries – 1,203 – (1,203) –Total comprehensive income 3,708 11,988 13,903 (17,373) 12,226Attributable to
BP shareholders 3,708 11,988 13,665 (17,373) 11,988Non-controlling interests – – 238 – 238
3,708 11,988 13,903 (17,373) 12,226
Financial statements
BP Annual Report and Form 20-F 2014 163
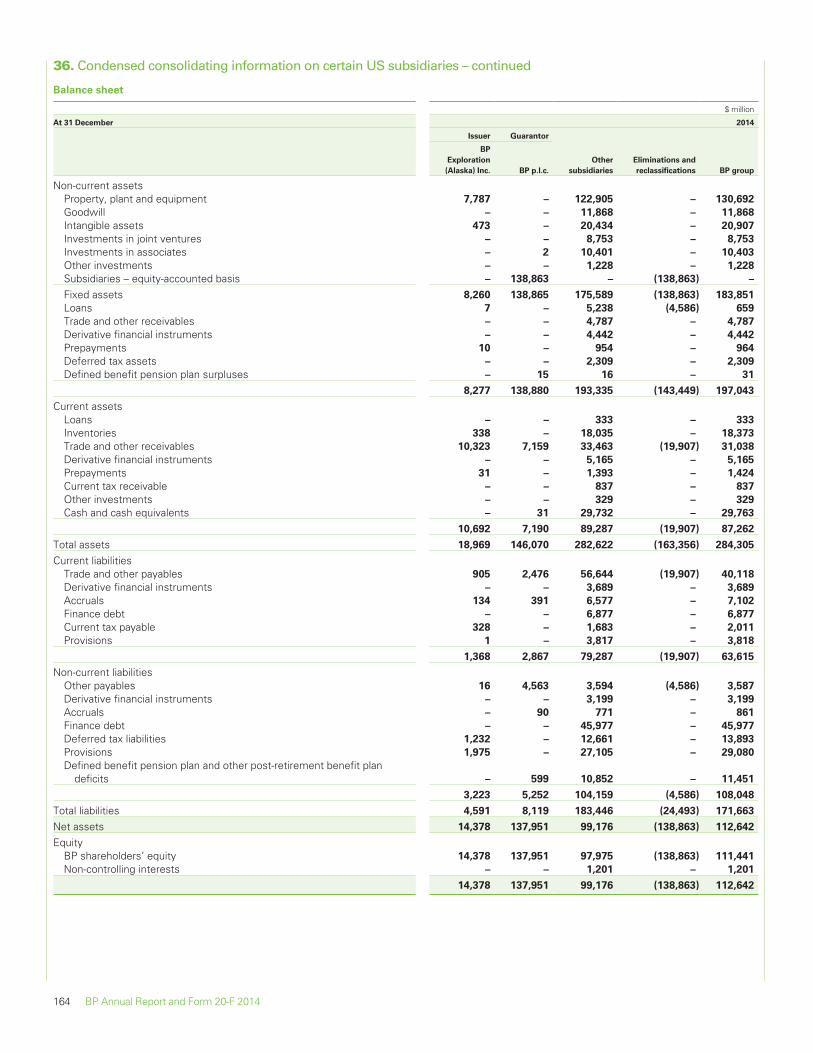
36. Condensed consolidating information on certain US subsidiaries – continued
Balance sheet
$ million
At 31 December 2014
Issuer Guarantor
BP
Exploration
(Alaska) Inc. BP p.l.c.
Other
subsidiaries
Eliminations and
reclassifications BP group
Non-current assetsProperty, plant and equipment 7,787 – 122,905 – 130,692
Goodwill – – 11,868 – 11,868
Intangible assets 473 – 20,434 – 20,907
Investments in joint ventures – – 8,753 – 8,753
Investments in associates – 2 10,401 – 10,403
Other investments – – 1,228 – 1,228
Subsidiaries – equity-accounted basis – 138,863 – (138,863) –
Fixed assets 8,260 138,865 175,589 (138,863) 183,851
Loans 7 – 5,238 (4,586) 659
Trade and other receivables – – 4,787 – 4,787
Derivative financial instruments – – 4,442 – 4,442
Prepayments 10 – 954 – 964
Deferred tax assets – – 2,309 – 2,309
Defined benefit pension plan surpluses – 15 16 – 31
8,277 138,880 193,335 (143,449) 197,043
Current assetsLoans – – 333 – 333
Inventories 338 – 18,035 – 18,373
Trade and other receivables 10,323 7,159 33,463 (19,907) 31,038
Derivative financial instruments – – 5,165 – 5,165
Prepayments 31 – 1,393 – 1,424
Current tax receivable – – 837 – 837
Other investments – – 329 – 329
Cash and cash equivalents – 31 29,732 – 29,763
10,692 7,190 89,287 (19,907) 87,262
Total assets 18,969 146,070 282,622 (163,356) 284,305
Current liabilitiesTrade and other payables 905 2,476 56,644 (19,907) 40,118
Derivative financial instruments – – 3,689 – 3,689
Accruals 134 391 6,577 – 7,102
Finance debt – – 6,877 – 6,877
Current tax payable 328 – 1,683 – 2,011
Provisions 1 – 3,817 – 3,818
1,368 2,867 79,287 (19,907) 63,615
Non-current liabilitiesOther payables 16 4,563 3,594 (4,586) 3,587
Derivative financial instruments – – 3,199 – 3,199
Accruals – 90 771 – 861
Finance debt – – 45,977 – 45,977
Deferred tax liabilities 1,232 – 12,661 – 13,893
Provisions 1,975 – 27,105 – 29,080
Defined benefit pension plan and other post-retirement benefit plandeficits – 599 10,852 – 11,451
3,223 5,252 104,159 (4,586) 108,048
Total liabilities 4,591 8,119 183,446 (24,493) 171,663
Net assets 14,378 137,951 99,176 (138,863) 112,642
EquityBP shareholders’ equity 14,378 137,951 97,975 (138,863) 111,441
Non-controlling interests – – 1,201 – 1,201
14,378 137,951 99,176 (138,863) 112,642
164 BP Annual Report and Form 20-F 2014
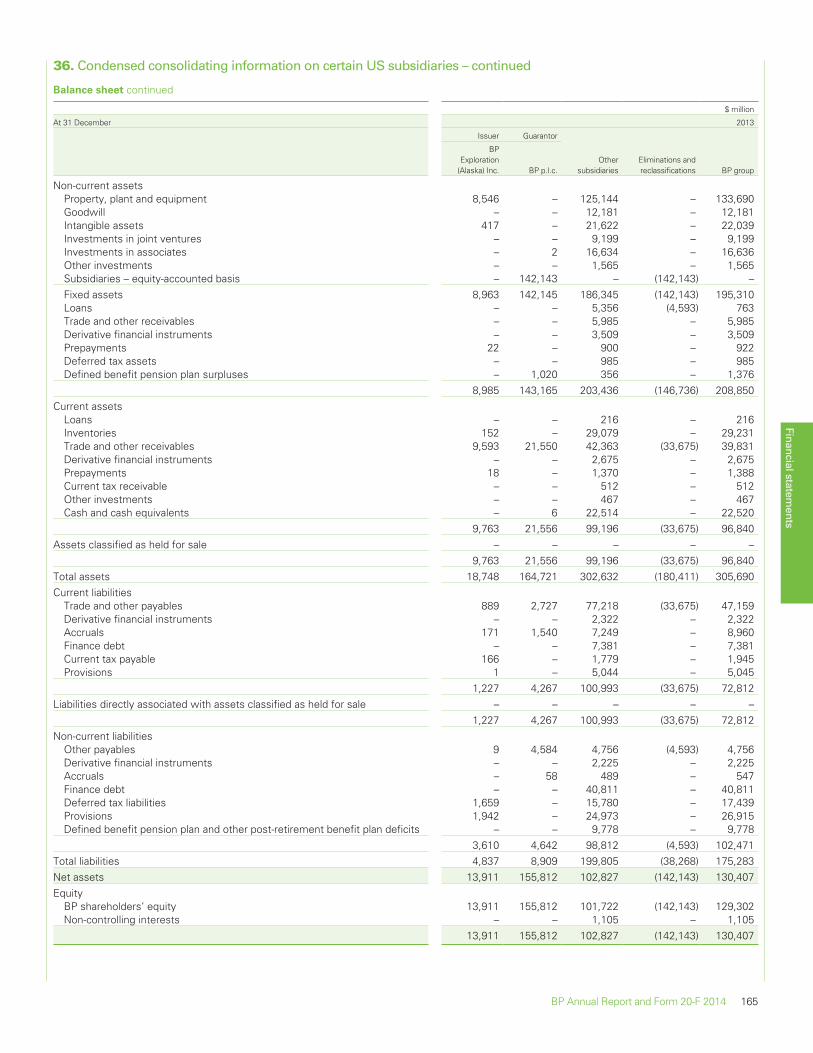
36. Condensed consolidating information on certain US subsidiaries – continued
Balance sheet continued
$ million
At 31 December 2013
Issuer Guarantor
BPExploration
(Alaska) Inc. BP p.l.c.Other
subsidiariesEliminations andreclassifications BP group
Non-current assetsProperty, plant and equipment 8,546 – 125,144 – 133,690Goodwill – – 12,181 – 12,181Intangible assets 417 – 21,622 – 22,039Investments in joint ventures – – 9,199 – 9,199Investments in associates – 2 16,634 – 16,636Other investments – – 1,565 – 1,565Subsidiaries – equity-accounted basis – 142,143 – (142,143) –Fixed assets 8,963 142,145 186,345 (142,143) 195,310Loans – – 5,356 (4,593) 763Trade and other receivables – – 5,985 – 5,985Derivative financial instruments – – 3,509 – 3,509Prepayments 22 – 900 – 922Deferred tax assets – – 985 – 985Defined benefit pension plan surpluses – 1,020 356 – 1,376
8,985 143,165 203,436 (146,736) 208,850Current assets
Loans – – 216 – 216Inventories 152 – 29,079 – 29,231Trade and other receivables 9,593 21,550 42,363 (33,675) 39,831Derivative financial instruments – – 2,675 – 2,675Prepayments 18 – 1,370 – 1,388Current tax receivable – – 512 – 512Other investments – – 467 – 467Cash and cash equivalents – 6 22,514 – 22,520
9,763 21,556 99,196 (33,675) 96,840Assets classified as held for sale – – – – –
9,763 21,556 99,196 (33,675) 96,840Total assets 18,748 164,721 302,632 (180,411) 305,690Current liabilities
Trade and other payables 889 2,727 77,218 (33,675) 47,159Derivative financial instruments – – 2,322 – 2,322Accruals 171 1,540 7,249 – 8,960Finance debt – – 7,381 – 7,381Current tax payable 166 – 1,779 – 1,945Provisions 1 – 5,044 – 5,045
1,227 4,267 100,993 (33,675) 72,812Liabilities directly associated with assets classified as held for sale – – – – –
1,227 4,267 100,993 (33,675) 72,812Non-current liabilities
Other payables 9 4,584 4,756 (4,593) 4,756Derivative financial instruments – – 2,225 – 2,225Accruals – 58 489 – 547Finance debt – – 40,811 – 40,811Deferred tax liabilities 1,659 – 15,780 – 17,439Provisions 1,942 – 24,973 – 26,915Defined benefit pension plan and other post-retirement benefit plan deficits – – 9,778 – 9,778
3,610 4,642 98,812 (4,593) 102,471Total liabilities 4,837 8,909 199,805 (38,268) 175,283Net assets 13,911 155,812 102,827 (142,143) 130,407Equity
BP shareholders’ equity 13,911 155,812 101,722 (142,143) 129,302Non-controlling interests – – 1,105 – 1,105
13,911 155,812 102,827 (142,143) 130,407
Financial statements
BP Annual Report and Form 20-F 2014 165
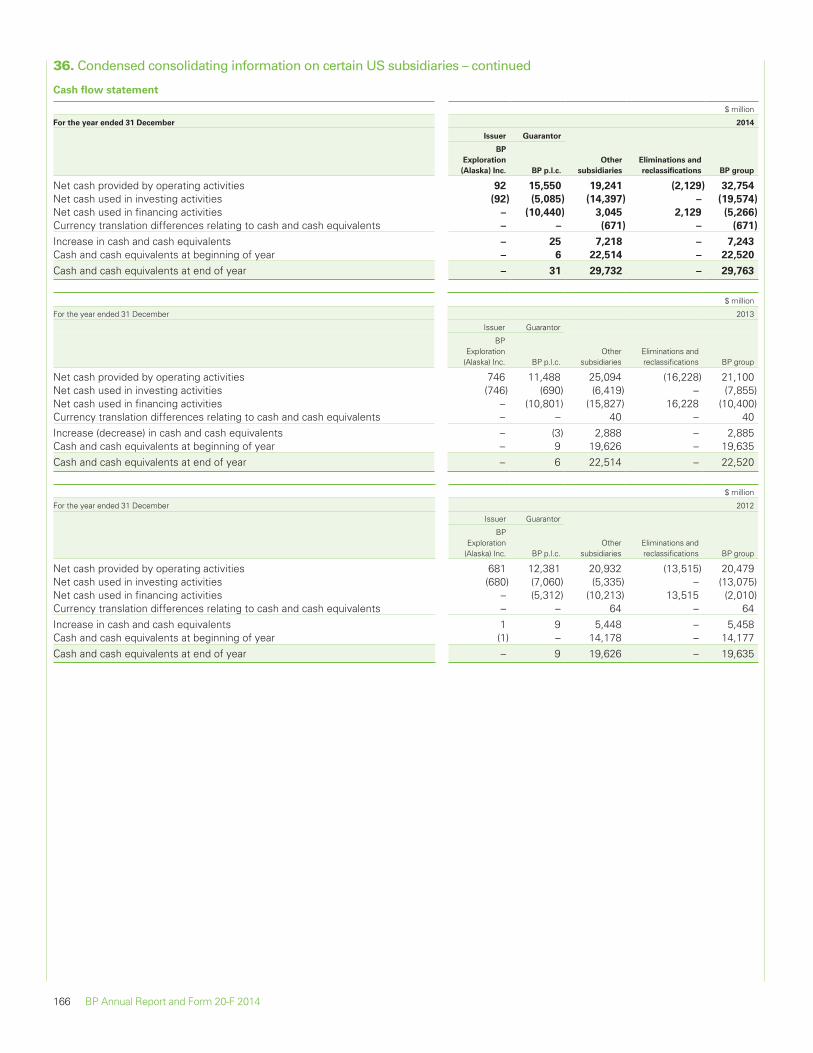
36. Condensed consolidating information on certain US subsidiaries – continued
Cash flow statement
$ million
For the year ended 31 December 2014
Issuer Guarantor
BP
Exploration
(Alaska) Inc. BP p.l.c.
Other
subsidiaries
Eliminations and
reclassifications BP group
Net cash provided by operating activities 92 15,550 19,241 (2,129) 32,754
Net cash used in investing activities (92) (5,085) (14,397) – (19,574)
Net cash used in financing activities – (10,440) 3,045 2,129 (5,266)
Currency translation differences relating to cash and cash equivalents – – (671) – (671)
Increase in cash and cash equivalents – 25 7,218 – 7,243
Cash and cash equivalents at beginning of year – 6 22,514 – 22,520
Cash and cash equivalents at end of year – 31 29,732 – 29,763
$ million
For the year ended 31 December 2013
Issuer Guarantor
BPExploration
(Alaska) Inc. BP p.l.c.Other
subsidiariesEliminations andreclassifications BP group
Net cash provided by operating activities 746 11,488 25,094 (16,228) 21,100Net cash used in investing activities (746) (690) (6,419) – (7,855)Net cash used in financing activities – (10,801) (15,827) 16,228 (10,400)Currency translation differences relating to cash and cash equivalents – – 40 – 40Increase (decrease) in cash and cash equivalents – (3) 2,888 – 2,885Cash and cash equivalents at beginning of year – 9 19,626 – 19,635Cash and cash equivalents at end of year – 6 22,514 – 22,520
$ million
For the year ended 31 December 2012
Issuer Guarantor
BPExploration
(Alaska) Inc. BP p.l.c.Other
subsidiariesEliminations andreclassifications BP group
Net cash provided by operating activities 681 12,381 20,932 (13,515) 20,479Net cash used in investing activities (680) (7,060) (5,335) – (13,075)Net cash used in financing activities – (5,312) (10,213) 13,515 (2,010)Currency translation differences relating to cash and cash equivalents – – 64 – 64Increase in cash and cash equivalents 1 9 5,448 – 5,458Cash and cash equivalents at beginning of year (1) – 14,178 – 14,177Cash and cash equivalents at end of year – 9 19,626 – 19,635
166 BP Annual Report and Form 20-F 2014
Supplementary information on oil and natural gas (unaudited)a
The regional analysis presented below is on a continent basis, with separate disclosure for countries that contain 15% or more of the total provedreserves (for subsidiaries plus equity-accounted entities), in accordance with SEC and FASB requirements.
Oil and gas reserves – certain definitions
Unless the context indicates otherwise, the following terms have the meanings shown below:
Proved oil and gas reservesProved oil and gas reserves are those quantities of oil and gas, which, by analysis of geoscience and engineering data, can be estimated withreasonable certainty to be economically producible – from a given date forward, from known reservoirs, and under existing economic conditions,operating methods, and government regulations – prior to the time at which contracts providing the right to operate expire, unless evidence indicatesthat renewal is reasonably certain, regardless of whether deterministic or probabilistic methods are used for the estimation. The project to extract thehydrocarbons must have commenced or the operator must be reasonably certain that it will commence the project within a reasonable time.
(i) The area of the reservoir considered as proved includes:(A) The area identified by drilling and limited by fluid contacts, if any; and(B) Adjacent undrilled portions of the reservoir that can, with reasonable certainty, be judged to be continuous with it and to contain
economically producible oil or gas on the basis of available geoscience and engineering data.(ii) In the absence of data on fluid contacts, proved quantities in a reservoir are limited by the lowest known hydrocarbons (LKH) as seen in a
well penetration unless geoscience, engineering, or performance data and reliable technology establishes a lower contact with reasonablecertainty.
(iii) Where direct observation from well penetrations has defined a highest known oil (HKO) elevation and the potential exists for an associatedgas cap, proved oil reserves may be assigned in the structurally higher portions of the reservoir only if geoscience, engineering, orperformance data and reliable technology establish the higher contact with reasonable certainty.
(iv) Reserves which can be produced economically through application of improved recovery techniques (including, but not limited to, fluidinjection) are included in the proved classification when:(A) Successful testing by a pilot project in an area of the reservoir with properties no more favourable than in the reservoir as a whole, the
operation of an installed programme in the reservoir or an analogous reservoir, or other evidence using reliable technology establishesthe reasonable certainty of the engineering analysis on which the project or programme was based; and
(B) The project has been approved for development by all necessary parties and entities, including governmental entities.(v) Existing economic conditions include prices and costs at which economic producibility from a reservoir is to be determined. The price shall
be the average price during the 12-month period prior to the ending date of the period covered by the report, determined as an unweightedarithmetic average of the first-day-of-the-month price for each month within such period, unless prices are defined by contractualarrangements, excluding escalations based upon future conditions.
Undeveloped oil and gas reservesUndeveloped oil and gas reserves are reserves of any category that are expected to be recovered from new wells on undrilled acreage, or fromexisting wells where a relatively major expenditure is required for recompletion.
(i) Reserves on undrilled acreage shall be limited to those directly offsetting development spacing areas that are reasonably certain ofproduction when drilled, unless evidence using reliable technology exists that establishes reasonable certainty of economic producibility atgreater distances.
(ii) Undrilled locations can be classified as having undeveloped reserves only if a development plan has been adopted indicating that they arescheduled to be drilled within five years, unless the specific circumstances, justify a longer time.
(iii) Under no circumstances shall estimates for undeveloped reserves be attributable to any acreage for which an application of fluid injection orother improved recovery technique is contemplated, unless such techniques have been proved effective by actual projects in the samereservoir or an analogous reservoir, or by other evidence using reliable technology establishing reasonable certainty.
Developed oil and gas reservesDeveloped oil and gas reserves are reserves of any category that can be expected to be recovered:
(i) Through existing wells with existing equipment and operating methods or in which the cost of the required equipment is relatively minorcompared to the cost of a new well; and
(ii) Through installed extraction equipment and infrastructure operational at the time of the reserves estimate if the extraction is by means notinvolving a well.
For details on BP’s proved reserves and production compliance and governance processes, see pages 219–224.a 2013 equity-accounted entities information includes BP’s share of TNK-BP from 1 January to 20 March, and Rosneft for the period 21 March to 31 December.
Financial statements
BP Annual Report and Form 20-F 2014 167
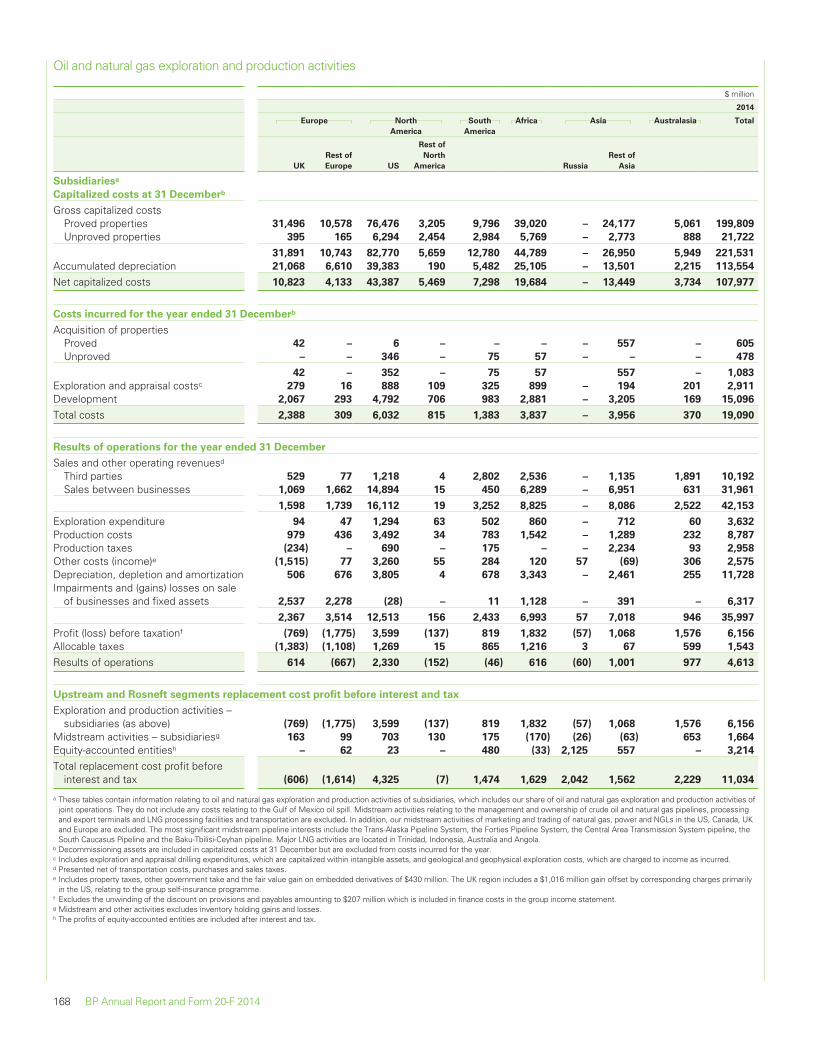
Oil and natural gas exploration and production activities
$ million
2014
Europe North
America
South
America
Africa Asia Australasia Total
UK
Rest of
Europe US
Rest of
North
America Russia
Rest of
Asia
Subsidiariesa
Capitalized costs at 31 Decemberb
Gross capitalized costsProved properties 31,496 10,578 76,476 3,205 9,796 39,020 – 24,177 5,061 199,809
Unproved properties 395 165 6,294 2,454 2,984 5,769 – 2,773 888 21,722
31,891 10,743 82,770 5,659 12,780 44,789 – 26,950 5,949 221,531
Accumulated depreciation 21,068 6,610 39,383 190 5,482 25,105 – 13,501 2,215 113,554
Net capitalized costs 10,823 4,133 43,387 5,469 7,298 19,684 – 13,449 3,734 107,977
Costs incurred for the year ended 31 Decemberb
Acquisition of propertiesProved 42 – 6 – – – – 557 – 605
Unproved – – 346 – 75 57 – – – 478
42 – 352 – 75 57 557 – 1,083
Exploration and appraisal costsc 279 16 888 109 325 899 – 194 201 2,911
Development 2,067 293 4,792 706 983 2,881 – 3,205 169 15,096
Total costs 2,388 309 6,032 815 1,383 3,837 – 3,956 370 19,090
Results of operations for the year ended 31 December
Sales and other operating revenuesd
Third parties 529 77 1,218 4 2,802 2,536 – 1,135 1,891 10,192
Sales between businesses 1,069 1,662 14,894 15 450 6,289 – 6,951 631 31,961
1,598 1,739 16,112 19 3,252 8,825 – 8,086 2,522 42,153
Exploration expenditure 94 47 1,294 63 502 860 – 712 60 3,632
Production costs 979 436 3,492 34 783 1,542 – 1,289 232 8,787
Production taxes (234) – 690 – 175 – – 2,234 93 2,958
Other costs (income)e (1,515) 77 3,260 55 284 120 57 (69) 306 2,575
Depreciation, depletion and amortization 506 676 3,805 4 678 3,343 – 2,461 255 11,728
Impairments and (gains) losses on saleof businesses and fixed assets 2,537 2,278 (28) – 11 1,128 – 391 – 6,317
2,367 3,514 12,513 156 2,433 6,993 57 7,018 946 35,997
Profit (loss) before taxationf (769) (1,775) 3,599 (137) 819 1,832 (57) 1,068 1,576 6,156
Allocable taxes (1,383) (1,108) 1,269 15 865 1,216 3 67 599 1,543
Results of operations 614 (667) 2,330 (152) (46) 616 (60) 1,001 977 4,613
Upstream and Rosneft segments replacement cost profit before interest and tax
Exploration and production activities –subsidiaries (as above) (769) (1,775) 3,599 (137) 819 1,832 (57) 1,068 1,576 6,156
Midstream activities – subsidiariesg 163 99 703 130 175 (170) (26) (63) 653 1,664
Equity-accounted entitiesh – 62 23 – 480 (33) 2,125 557 – 3,214
Total replacement cost profit beforeinterest and tax (606) (1,614) 4,325 (7) 1,474 1,629 2,042 1,562 2,229 11,034
a These tables contain information relating to oil and natural gas exploration and production activities of subsidiaries, which includes our share of oil and natural gas exploration and production activities ofjoint operations. They do not include any costs relating to the Gulf of Mexico oil spill. Midstream activities relating to the management and ownership of crude oil and natural gas pipelines, processingand export terminals and LNG processing facilities and transportation are excluded. In addition, our midstream activities of marketing and trading of natural gas, power and NGLs in the US, Canada, UKand Europe are excluded. The most significant midstream pipeline interests include the Trans-Alaska Pipeline System, the Forties Pipeline System, the Central Area Transmission System pipeline, theSouth Caucasus Pipeline and the Baku-Tbilisi-Ceyhan pipeline. Major LNG activities are located in Trinidad, Indonesia, Australia and Angola.
b Decommissioning assets are included in capitalized costs at 31 December but are excluded from costs incurred for the year.c Includes exploration and appraisal drilling expenditures, which are capitalized within intangible assets, and geological and geophysical exploration costs, which are charged to income as incurred.d Presented net of transportation costs, purchases and sales taxes.e Includes property taxes, other government take and the fair value gain on embedded derivatives of $430 million. The UK region includes a $1,016 million gain offset by corresponding charges primarily
in the US, relating to the group self-insurance programme.f Excludes the unwinding of the discount on provisions and payables amounting to $207 million which is included in finance costs in the group income statement.g Midstream and other activities excludes inventory holding gains and losses.h The profits of equity-accounted entities are included after interest and tax.
168 BP Annual Report and Form 20-F 2014
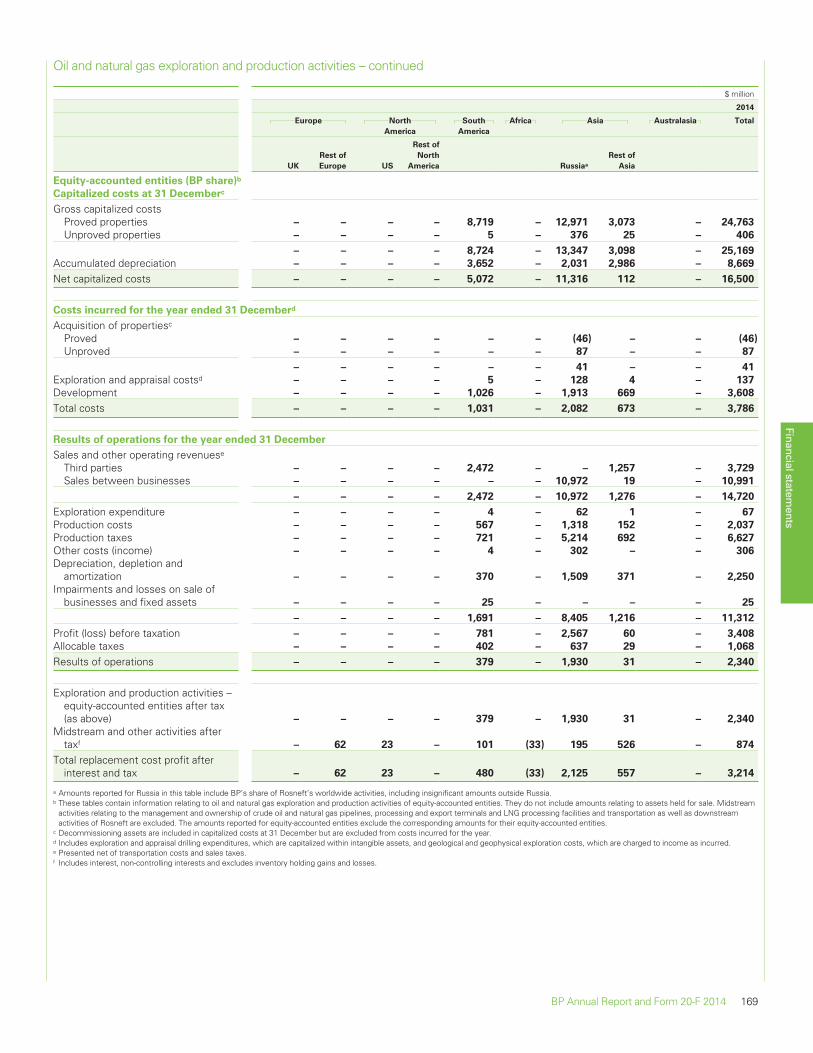
Oil and natural gas exploration and production activities – continued
$ million
2014
Europe North
America
South
America
Africa Asia Australasia Total
UK
Rest of
Europe US
Rest of
North
America Russiaa
Rest of
Asia
Equity-accounted entities (BP share)b
Capitalized costs at 31 Decemberc
Gross capitalized costsProved properties – – – – 8,719 – 12,971 3,073 – 24,763
Unproved properties – – – – 5 – 376 25 – 406
– – – – 8,724 – 13,347 3,098 – 25,169
Accumulated depreciation – – – – 3,652 – 2,031 2,986 – 8,669
Net capitalized costs – – – – 5,072 – 11,316 112 – 16,500
Costs incurred for the year ended 31 Decemberd
Acquisition of propertiesc
Proved – – – – – – (46) – – (46)
Unproved – – – – – – 87 – – 87
– – – – – – 41 – – 41
Exploration and appraisal costsd – – – – 5 – 128 4 – 137
Development – – – – 1,026 – 1,913 669 – 3,608
Total costs – – – – 1,031 – 2,082 673 – 3,786
Results of operations for the year ended 31 December
Sales and other operating revenuese
Third parties – – – – 2,472 – – 1,257 – 3,729
Sales between businesses – – – – – – 10,972 19 – 10,991
– – – – 2,472 – 10,972 1,276 – 14,720
Exploration expenditure – – – – 4 – 62 1 – 67
Production costs – – – – 567 – 1,318 152 – 2,037
Production taxes – – – – 721 – 5,214 692 – 6,627
Other costs (income) – – – – 4 – 302 – – 306
Depreciation, depletion andamortization – – – – 370 – 1,509 371 – 2,250
Impairments and losses on sale ofbusinesses and fixed assets – – – – 25 – – – – 25
– – – – 1,691 – 8,405 1,216 – 11,312
Profit (loss) before taxation – – – – 781 – 2,567 60 – 3,408
Allocable taxes – – – – 402 – 637 29 – 1,068
Results of operations – – – – 379 – 1,930 31 – 2,340
Exploration and production activities –equity-accounted entities after tax(as above) – – – – 379 – 1,930 31 – 2,340
Midstream and other activities aftertaxf – 62 23 – 101 (33) 195 526 – 874
Total replacement cost profit afterinterest and tax – 62 23 – 480 (33) 2,125 557 – 3,214
a Amounts reported for Russia in this table include BP’s share of Rosneft’s worldwide activities, including insignificant amounts outside Russia.b These tables contain information relating to oil and natural gas exploration and production activities of equity-accounted entities. They do not include amounts relating to assets held for sale. Midstream
activities relating to the management and ownership of crude oil and natural gas pipelines, processing and export terminals and LNG processing facilities and transportation as well as downstreamactivities of Rosneft are excluded. The amounts reported for equity-accounted entities exclude the corresponding amounts for their equity-accounted entities.
c Decommissioning assets are included in capitalized costs at 31 December but are excluded from costs incurred for the year.d Includes exploration and appraisal drilling expenditures, which are capitalized within intangible assets, and geological and geophysical exploration costs, which are charged to income as incurred.e Presented net of transportation costs and sales taxes.f Includes interest, non-controlling interests and excludes inventory holding gains and losses.
Financial statements
BP Annual Report and Form 20-F 2014 169
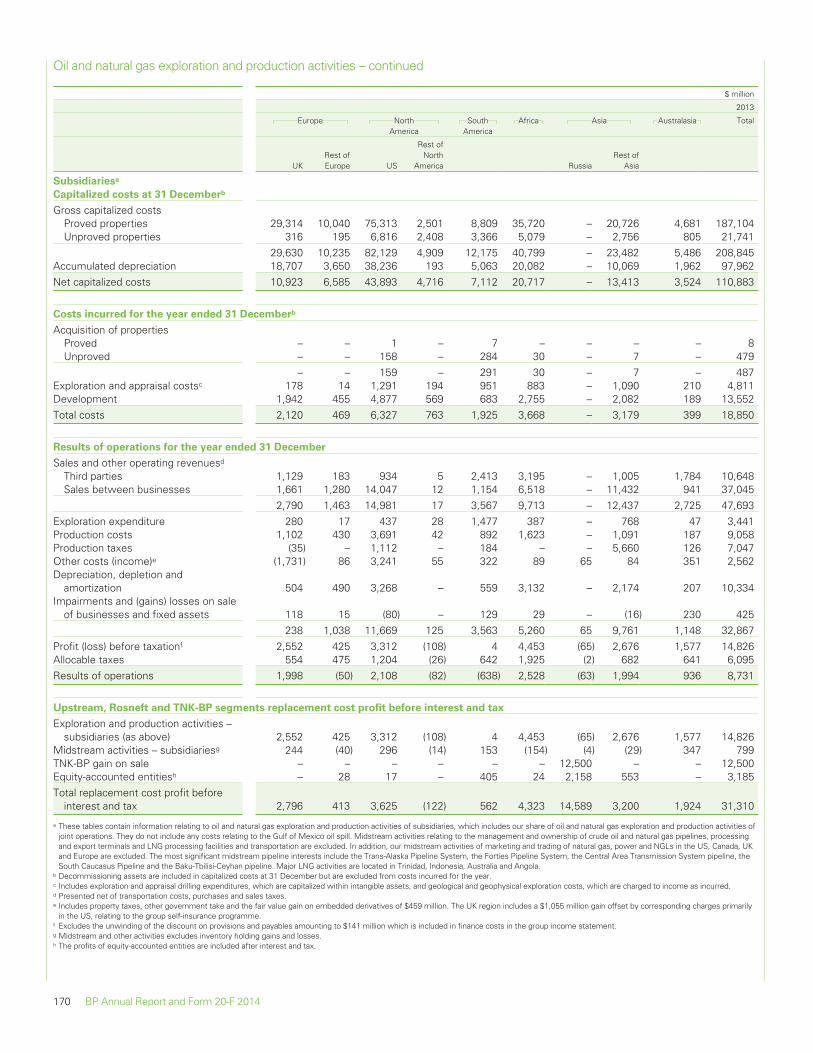
Oil and natural gas exploration and production activities – continued
$ million
2013
Europe NorthAmerica
SouthAmerica
Africa Asia Australasia Total
UKRest ofEurope US
Rest ofNorth
America RussiaRest of
Asia
Subsidiariesa
Capitalized costs at 31 Decemberb
Gross capitalized costsProved properties 29,314 10,040 75,313 2,501 8,809 35,720 – 20,726 4,681 187,104Unproved properties 316 195 6,816 2,408 3,366 5,079 – 2,756 805 21,741
29,630 10,235 82,129 4,909 12,175 40,799 – 23,482 5,486 208,845Accumulated depreciation 18,707 3,650 38,236 193 5,063 20,082 – 10,069 1,962 97,962Net capitalized costs 10,923 6,585 43,893 4,716 7,112 20,717 – 13,413 3,524 110,883
Costs incurred for the year ended 31 Decemberb
Acquisition of propertiesProved – – 1 – 7 – – – – 8Unproved – – 158 – 284 30 – 7 – 479
– – 159 – 291 30 – 7 – 487Exploration and appraisal costsc 178 14 1,291 194 951 883 – 1,090 210 4,811Development 1,942 455 4,877 569 683 2,755 – 2,082 189 13,552Total costs 2,120 469 6,327 763 1,925 3,668 – 3,179 399 18,850
Results of operations for the year ended 31 December
Sales and other operating revenuesd
Third parties 1,129 183 934 5 2,413 3,195 – 1,005 1,784 10,648Sales between businesses 1,661 1,280 14,047 12 1,154 6,518 – 11,432 941 37,045
2,790 1,463 14,981 17 3,567 9,713 – 12,437 2,725 47,693Exploration expenditure 280 17 437 28 1,477 387 – 768 47 3,441Production costs 1,102 430 3,691 42 892 1,623 – 1,091 187 9,058Production taxes (35) – 1,112 – 184 – – 5,660 126 7,047Other costs (income)e (1,731) 86 3,241 55 322 89 65 84 351 2,562Depreciation, depletion and
amortization 504 490 3,268 – 559 3,132 – 2,174 207 10,334Impairments and (gains) losses on sale
of businesses and fixed assets 118 15 (80) – 129 29 – (16) 230 425238 1,038 11,669 125 3,563 5,260 65 9,761 1,148 32,867
Profit (loss) before taxationf 2,552 425 3,312 (108) 4 4,453 (65) 2,676 1,577 14,826Allocable taxes 554 475 1,204 (26) 642 1,925 (2) 682 641 6,095Results of operations 1,998 (50) 2,108 (82) (638) 2,528 (63) 1,994 936 8,731
Upstream, Rosneft and TNK-BP segments replacement cost profit before interest and tax
Exploration and production activities –subsidiaries (as above) 2,552 425 3,312 (108) 4 4,453 (65) 2,676 1,577 14,826
Midstream activities – subsidiariesg 244 (40) 296 (14) 153 (154) (4) (29) 347 799TNK-BP gain on sale – – – – – – 12,500 – – 12,500Equity-accounted entitiesh – 28 17 – 405 24 2,158 553 – 3,185Total replacement cost profit before
interest and tax 2,796 413 3,625 (122) 562 4,323 14,589 3,200 1,924 31,310
a These tables contain information relating to oil and natural gas exploration and production activities of subsidiaries, which includes our share of oil and natural gas exploration and production activities ofjoint operations. They do not include any costs relating to the Gulf of Mexico oil spill. Midstream activities relating to the management and ownership of crude oil and natural gas pipelines, processingand export terminals and LNG processing facilities and transportation are excluded. In addition, our midstream activities of marketing and trading of natural gas, power and NGLs in the US, Canada, UKand Europe are excluded. The most significant midstream pipeline interests include the Trans-Alaska Pipeline System, the Forties Pipeline System, the Central Area Transmission System pipeline, theSouth Caucasus Pipeline and the Baku-Tbilisi-Ceyhan pipeline. Major LNG activities are located in Trinidad, Indonesia, Australia and Angola.
b Decommissioning assets are included in capitalized costs at 31 December but are excluded from costs incurred for the year.c Includes exploration and appraisal drilling expenditures, which are capitalized within intangible assets, and geological and geophysical exploration costs, which are charged to income as incurred.d Presented net of transportation costs, purchases and sales taxes.e Includes property taxes, other government take and the fair value gain on embedded derivatives of $459 million. The UK region includes a $1,055 million gain offset by corresponding charges primarily
in the US, relating to the group self-insurance programme.f Excludes the unwinding of the discount on provisions and payables amounting to $141 million which is included in finance costs in the group income statement.g Midstream and other activities excludes inventory holding gains and losses.h The profits of equity-accounted entities are included after interest and tax.
170 BP Annual Report and Form 20-F 2014
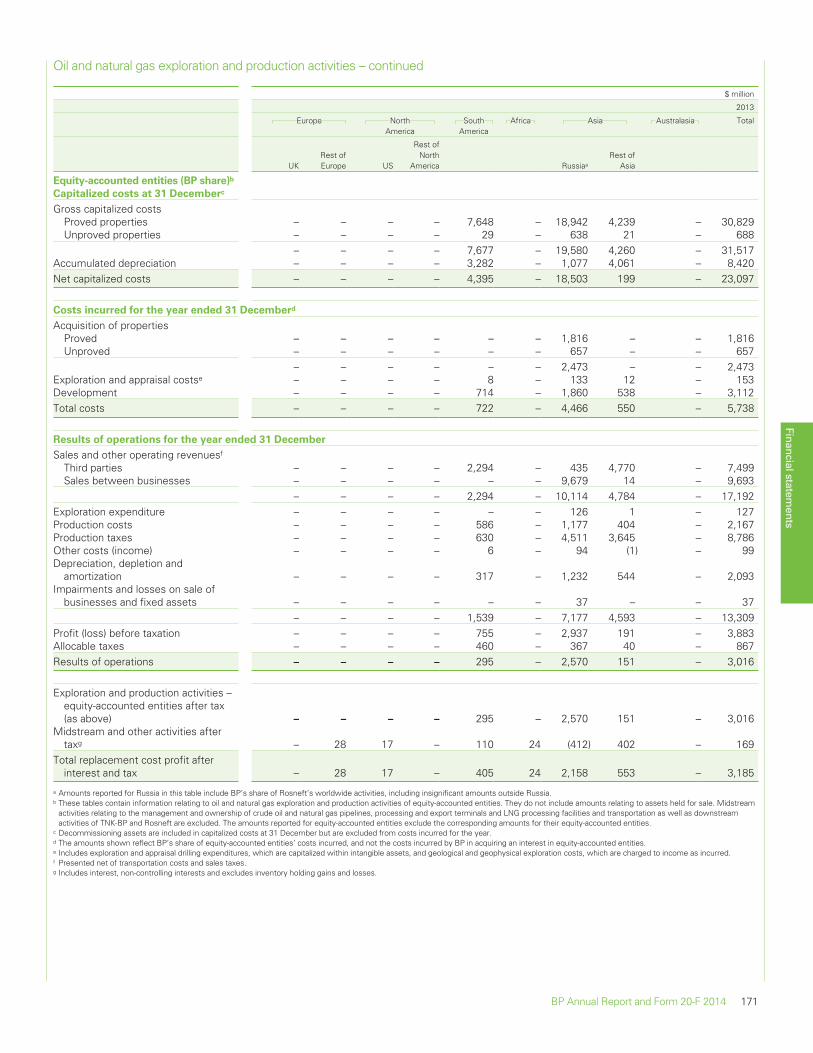
Oil and natural gas exploration and production activities – continued
$ million
2013
Europe NorthAmerica
SouthAmerica
Africa Asia Australasia Total
UKRest ofEurope US
Rest ofNorth
America Russiaa
Rest ofAsia
Equity-accounted entities (BP share)b
Capitalized costs at 31 Decemberc
Gross capitalized costsProved properties – – – – 7,648 – 18,942 4,239 – 30,829Unproved properties – – – – 29 – 638 21 – 688
– – – – 7,677 – 19,580 4,260 – 31,517Accumulated depreciation – – – – 3,282 – 1,077 4,061 – 8,420Net capitalized costs – – – – 4,395 – 18,503 199 – 23,097
Costs incurred for the year ended 31 Decemberd
Acquisition of propertiesProved – – – – – – 1,816 – – 1,816Unproved – – – – – – 657 – – 657
– – – – – – 2,473 – – 2,473Exploration and appraisal costse – – – – 8 – 133 12 – 153Development – – – – 714 – 1,860 538 – 3,112Total costs – – – – 722 – 4,466 550 – 5,738
Results of operations for the year ended 31 December
Sales and other operating revenuesf
Third parties – – – – 2,294 – 435 4,770 – 7,499Sales between businesses – – – – – – 9,679 14 – 9,693
– – – – 2,294 – 10,114 4,784 – 17,192Exploration expenditure – – – – – – 126 1 – 127Production costs – – – – 586 – 1,177 404 – 2,167Production taxes – – – – 630 – 4,511 3,645 – 8,786Other costs (income) – – – – 6 – 94 (1) – 99Depreciation, depletion and
amortization – – – – 317 – 1,232 544 – 2,093Impairments and losses on sale of
businesses and fixed assets – – – – – – 37 – – 37– – – – 1,539 – 7,177 4,593 – 13,309
Profit (loss) before taxation – – – – 755 – 2,937 191 – 3,883Allocable taxes – – – – 460 – 367 40 – 867Results of operations – – – – 295 – 2,570 151 – 3,016
Exploration and production activities –equity-accounted entities after tax(as above) – – – – 295 – 2,570 151 – 3,016
Midstream and other activities aftertaxg – 28 17 – 110 24 (412) 402 – 169
Total replacement cost profit afterinterest and tax – 28 17 – 405 24 2,158 553 – 3,185
a Amounts reported for Russia in this table include BP’s share of Rosneft’s worldwide activities, including insignificant amounts outside Russia.b These tables contain information relating to oil and natural gas exploration and production activities of equity-accounted entities. They do not include amounts relating to assets held for sale. Midstream
activities relating to the management and ownership of crude oil and natural gas pipelines, processing and export terminals and LNG processing facilities and transportation as well as downstreamactivities of TNK-BP and Rosneft are excluded. The amounts reported for equity-accounted entities exclude the corresponding amounts for their equity-accounted entities.
c Decommissioning assets are included in capitalized costs at 31 December but are excluded from costs incurred for the year.d The amounts shown reflect BP’s share of equity-accounted entities’ costs incurred, and not the costs incurred by BP in acquiring an interest in equity-accounted entities.e Includes exploration and appraisal drilling expenditures, which are capitalized within intangible assets, and geological and geophysical exploration costs, which are charged to income as incurred.f Presented net of transportation costs and sales taxes.g Includes interest, non-controlling interests and excludes inventory holding gains and losses.
Financial statements
BP Annual Report and Form 20-F 2014 171
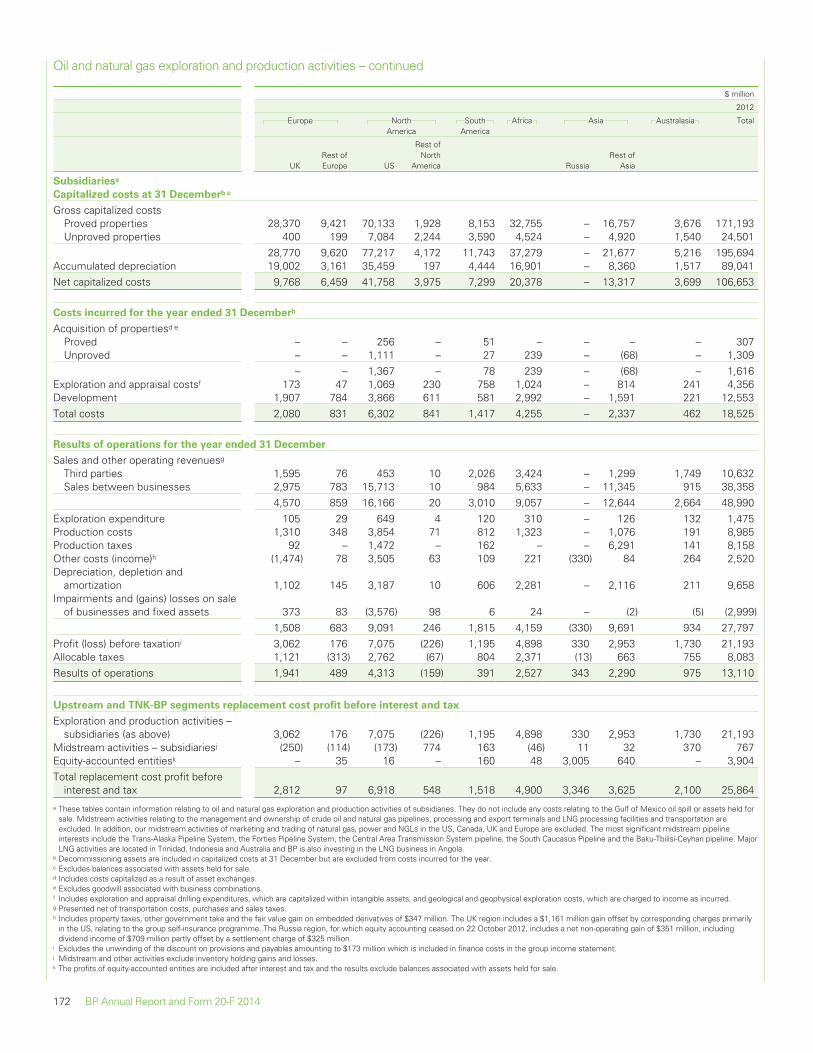
Oil and natural gas exploration and production activities – continued
$ million
2012
Europe NorthAmerica
SouthAmerica
Africa Asia Australasia Total
UKRest ofEurope US
Rest ofNorth
America RussiaRest of
Asia
Subsidiariesa
Capitalized costs at 31 Decemberb c
Gross capitalized costsProved properties 28,370 9,421 70,133 1,928 8,153 32,755 – 16,757 3,676 171,193Unproved properties 400 199 7,084 2,244 3,590 4,524 – 4,920 1,540 24,501
28,770 9,620 77,217 4,172 11,743 37,279 – 21,677 5,216 195,694Accumulated depreciation 19,002 3,161 35,459 197 4,444 16,901 – 8,360 1,517 89,041Net capitalized costs 9,768 6,459 41,758 3,975 7,299 20,378 – 13,317 3,699 106,653
Costs incurred for the year ended 31 Decemberb
Acquisition of propertiesd e
Proved – – 256 – 51 – – – – 307Unproved – – 1,111 – 27 239 – (68) – 1,309
– – 1,367 – 78 239 – (68) – 1,616Exploration and appraisal costsf 173 47 1,069 230 758 1,024 – 814 241 4,356Development 1,907 784 3,866 611 581 2,992 – 1,591 221 12,553Total costs 2,080 831 6,302 841 1,417 4,255 – 2,337 462 18,525
Results of operations for the year ended 31 December
Sales and other operating revenuesg
Third parties 1,595 76 453 10 2,026 3,424 – 1,299 1,749 10,632Sales between businesses 2,975 783 15,713 10 984 5,633 – 11,345 915 38,358
4,570 859 16,166 20 3,010 9,057 – 12,644 2,664 48,990Exploration expenditure 105 29 649 4 120 310 – 126 132 1,475Production costs 1,310 348 3,854 71 812 1,323 – 1,076 191 8,985Production taxes 92 – 1,472 – 162 – – 6,291 141 8,158Other costs (income)h (1,474) 78 3,505 63 109 221 (330) 84 264 2,520Depreciation, depletion and
amortization 1,102 145 3,187 10 606 2,281 – 2,116 211 9,658Impairments and (gains) losses on sale
of businesses and fixed assets 373 83 (3,576) 98 6 24 – (2) (5) (2,999)1,508 683 9,091 246 1,815 4,159 (330) 9,691 934 27,797
Profit (loss) before taxationi 3,062 176 7,075 (226) 1,195 4,898 330 2,953 1,730 21,193Allocable taxes 1,121 (313) 2,762 (67) 804 2,371 (13) 663 755 8,083Results of operations 1,941 489 4,313 (159) 391 2,527 343 2,290 975 13,110
Upstream and TNK-BP segments replacement cost profit before interest and tax
Exploration and production activities –subsidiaries (as above) 3,062 176 7,075 (226) 1,195 4,898 330 2,953 1,730 21,193
Midstream activities – subsidiariesj (250) (114) (173) 774 163 (46) 11 32 370 767Equity-accounted entitiesk – 35 16 – 160 48 3,005 640 – 3,904Total replacement cost profit before
interest and tax 2,812 97 6,918 548 1,518 4,900 3,346 3,625 2,100 25,864a These tables contain information relating to oil and natural gas exploration and production activities of subsidiaries. They do not include any costs relating to the Gulf of Mexico oil spill or assets held for
sale. Midstream activities relating to the management and ownership of crude oil and natural gas pipelines, processing and export terminals and LNG processing facilities and transportation areexcluded. In addition, our midstream activities of marketing and trading of natural gas, power and NGLs in the US, Canada, UK and Europe are excluded. The most significant midstream pipelineinterests include the Trans-Alaska Pipeline System, the Forties Pipeline System, the Central Area Transmission System pipeline, the South Caucasus Pipeline and the Baku-Tbilisi-Ceyhan pipeline. MajorLNG activities are located in Trinidad, Indonesia and Australia and BP is also investing in the LNG business in Angola.
b Decommissioning assets are included in capitalized costs at 31 December but are excluded from costs incurred for the year.c Excludes balances associated with assets held for sale.d Includes costs capitalized as a result of asset exchanges.e Excludes goodwill associated with business combinations.f Includes exploration and appraisal drilling expenditures, which are capitalized within intangible assets, and geological and geophysical exploration costs, which are charged to income as incurred.g Presented net of transportation costs, purchases and sales taxes.h Includes property taxes, other government take and the fair value gain on embedded derivatives of $347 million. The UK region includes a $1,161 million gain offset by corresponding charges primarily
in the US, relating to the group self-insurance programme. The Russia region, for which equity accounting ceased on 22 October 2012, includes a net non-operating gain of $351 million, includingdividend income of $709 million partly offset by a settlement charge of $325 million.
i Excludes the unwinding of the discount on provisions and payables amounting to $173 million which is included in finance costs in the group income statement.j Midstream and other activities exclude inventory holding gains and losses.k The profits of equity-accounted entities are included after interest and tax and the results exclude balances associated with assets held for sale.
172 BP Annual Report and Form 20-F 2014
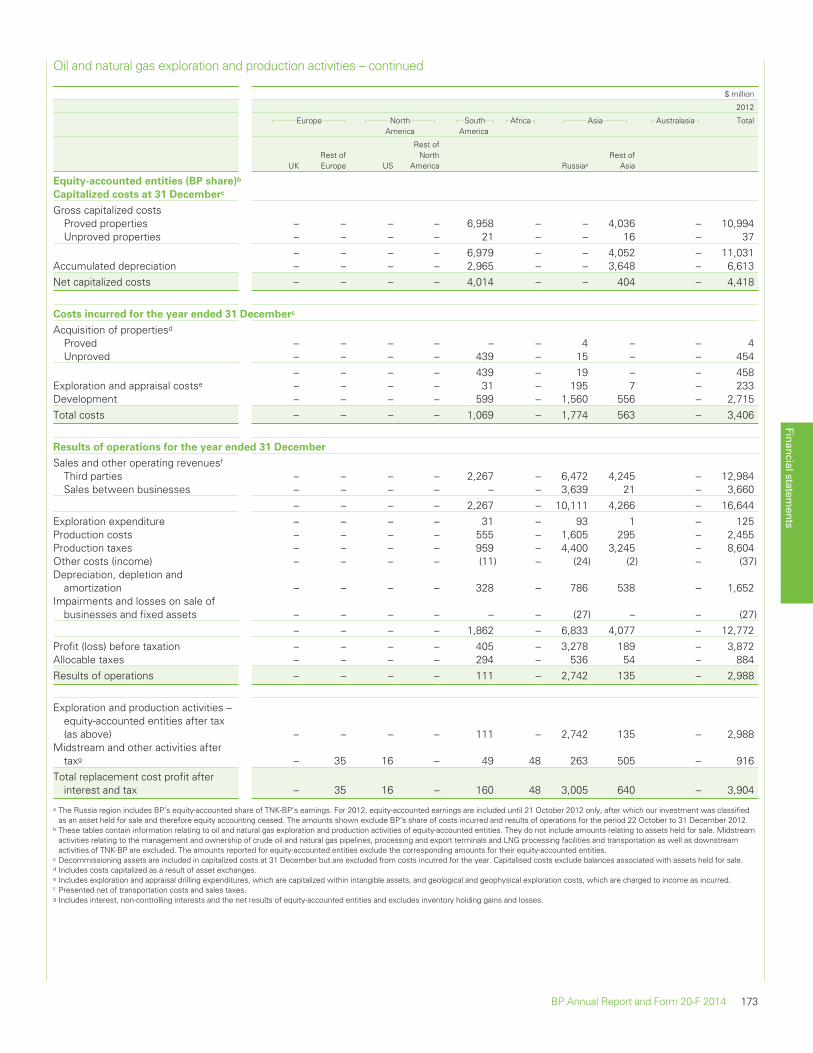
Oil and natural gas exploration and production activities – continued
$ million
2012
Europe NorthAmerica
SouthAmerica
Africa Asia Australasia Total
UKRest ofEurope US
Rest ofNorth
America Russiaa
Rest ofAsia
Equity-accounted entities (BP share)b
Capitalized costs at 31 Decemberc
Gross capitalized costsProved properties – – – – 6,958 – – 4,036 – 10,994Unproved properties – – – – 21 – – 16 – 37
– – – – 6,979 – – 4,052 – 11,031Accumulated depreciation – – – – 2,965 – – 3,648 – 6,613Net capitalized costs – – – – 4,014 – – 404 – 4,418
Costs incurred for the year ended 31 Decemberc
Acquisition of propertiesd
Proved – – – – – – 4 – – 4Unproved – – – – 439 – 15 – – 454
– – – – 439 – 19 – – 458Exploration and appraisal costse – – – – 31 – 195 7 – 233Development – – – – 599 – 1,560 556 – 2,715Total costs – – – – 1,069 – 1,774 563 – 3,406
Results of operations for the year ended 31 December
Sales and other operating revenuesf
Third parties – – – – 2,267 – 6,472 4,245 – 12,984Sales between businesses – – – – – – 3,639 21 – 3,660
– – – – 2,267 – 10,111 4,266 – 16,644Exploration expenditure – – – – 31 – 93 1 – 125Production costs – – – – 555 – 1,605 295 – 2,455Production taxes – – – – 959 – 4,400 3,245 – 8,604Other costs (income) – – – – (11) – (24) (2) – (37)Depreciation, depletion and
amortization – – – – 328 – 786 538 – 1,652Impairments and losses on sale of
businesses and fixed assets – – – – – – (27) – – (27)– – – – 1,862 – 6,833 4,077 – 12,772
Profit (loss) before taxation – – – – 405 – 3,278 189 – 3,872Allocable taxes – – – – 294 – 536 54 – 884Results of operations – – – – 111 – 2,742 135 – 2,988
Exploration and production activities –equity-accounted entities after tax(as above) – – – – 111 – 2,742 135 – 2,988
Midstream and other activities aftertaxg – 35 16 – 49 48 263 505 – 916
Total replacement cost profit afterinterest and tax – 35 16 – 160 48 3,005 640 – 3,904
a The Russia region includes BP’s equity-accounted share of TNK-BP’s earnings. For 2012, equity-accounted earnings are included until 21 October 2012 only, after which our investment was classifiedas an asset held for sale and therefore equity accounting ceased. The amounts shown exclude BP’s share of costs incurred and results of operations for the period 22 October to 31 December 2012.
b These tables contain information relating to oil and natural gas exploration and production activities of equity-accounted entities. They do not include amounts relating to assets held for sale. Midstreamactivities relating to the management and ownership of crude oil and natural gas pipelines, processing and export terminals and LNG processing facilities and transportation as well as downstreamactivities of TNK-BP are excluded. The amounts reported for equity-accounted entities exclude the corresponding amounts for their equity-accounted entities.
c Decommissioning assets are included in capitalized costs at 31 December but are excluded from costs incurred for the year. Capitalised costs exclude balances associated with assets held for sale.d Includes costs capitalized as a result of asset exchanges.e Includes exploration and appraisal drilling expenditures, which are capitalized within intangible assets, and geological and geophysical exploration costs, which are charged to income as incurred.f Presented net of transportation costs and sales taxes.g Includes interest, non-controlling interests and the net results of equity-accounted entities and excludes inventory holding gains and losses.
Financial statements
BP Annual Report and Form 20-F 2014 173
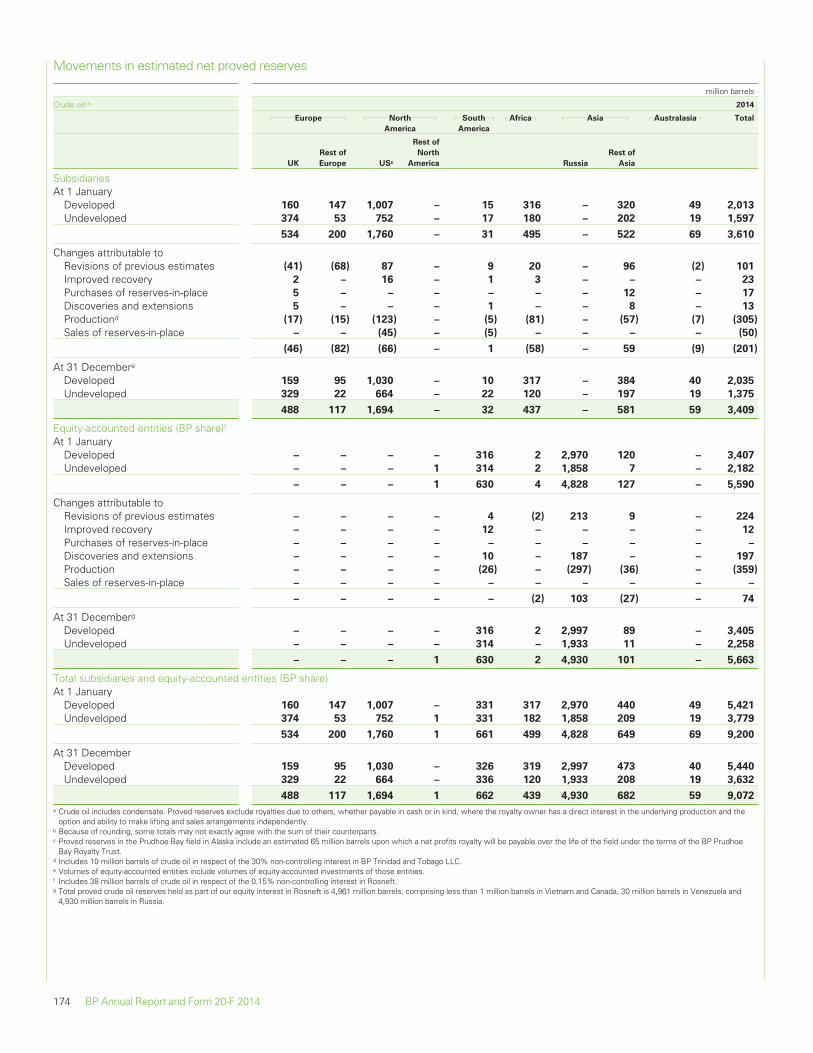
Movements in estimated net proved reserves
million barrels
Crude oila b 2014
Europe North
America
South
America
Africa Asia Australasia Total
UK
Rest of
Europe USc
Rest of
North
America Russia
Rest of
Asia
SubsidiariesAt 1 January
Developed 160 147 1,007 – 15 316 – 320 49 2,013
Undeveloped 374 53 752 – 17 180 – 202 19 1,597
534 200 1,760 – 31 495 – 522 69 3,610
Changes attributable toRevisions of previous estimates (41) (68) 87 – 9 20 – 96 (2) 101
Improved recovery 2 – 16 – 1 3 – – – 23
Purchases of reserves-in-place 5 – – – – – – 12 – 17
Discoveries and extensions 5 – – – 1 – – 8 – 13
Productiond (17) (15) (123) – (5) (81) – (57) (7) (305)
Sales of reserves-in-place – – (45) – (5) – – – – (50)
(46) (82) (66) – 1 (58) – 59 (9) (201)
At 31 Decembere
Developed 159 95 1,030 – 10 317 – 384 40 2,035
Undeveloped 329 22 664 – 22 120 – 197 19 1,375
488 117 1,694 – 32 437 – 581 59 3,409
Equity-accounted entities (BP share)fAt 1 January
Developed – – – – 316 2 2,970 120 – 3,407
Undeveloped – – – 1 314 2 1,858 7 – 2,182
– – – 1 630 4 4,828 127 – 5,590
Changes attributable toRevisions of previous estimates – – – – 4 (2) 213 9 – 224
Improved recovery – – – – 12 – – – – 12
Purchases of reserves-in-place – – – – – – – – – –
Discoveries and extensions – – – – 10 – 187 – – 197
Production – – – – (26) – (297) (36) – (359)
Sales of reserves-in-place – – – – – – – – – –
– – – – – (2) 103 (27) – 74
At 31 Decemberg
Developed – – – – 316 2 2,997 89 – 3,405
Undeveloped – – – – 314 – 1,933 11 – 2,258
– – – 1 630 2 4,930 101 – 5,663
Total subsidiaries and equity-accounted entities (BP share)At 1 January
Developed 160 147 1,007 – 331 317 2,970 440 49 5,421
Undeveloped 374 53 752 1 331 182 1,858 209 19 3,779
534 200 1,760 1 661 499 4,828 649 69 9,200
At 31 DecemberDeveloped 159 95 1,030 – 326 319 2,997 473 40 5,440
Undeveloped 329 22 664 – 336 120 1,933 208 19 3,632
488 117 1,694 1 662 439 4,930 682 59 9,072
a Crude oil includes condensate. Proved reserves exclude royalties due to others, whether payable in cash or in kind, where the royalty owner has a direct interest in the underlying production and theoption and ability to make lifting and sales arrangements independently.
b Because of rounding, some totals may not exactly agree with the sum of their counterparts.c Proved reserves in the Prudhoe Bay field in Alaska include an estimated 65 million barrels upon which a net profits royalty will be payable over the life of the field under the terms of the BP Prudhoe
Bay Royalty Trust.d Includes 10 million barrels of crude oil in respect of the 30% non-controlling interest in BP Trinidad and Tobago LLC.e Volumes of equity-accounted entities include volumes of equity-accounted investments of those entities.f Includes 38 million barrels of crude oil in respect of the 0.15% non-controlling interest in Rosneft.g Total proved crude oil reserves held as part of our equity interest in Rosneft is 4,961 million barrels, comprising less than 1 million barrels in Vietnam and Canada, 30 million barrels in Venezuela and
4,930 million barrels in Russia.
174 BP Annual Report and Form 20-F 2014

Movements in estimated net proved reserves – continued
million barrels
Natural gas liquidsa b 2014
Europe North
America
South
America
Africa Asia Australasia Total
UK
Rest of
Europe US
Rest of
North
America Russia
Rest of
Asia
SubsidiariesAt 1 January
Developed 9 16 290 – 14 4 – – 8 342
Undeveloped 6 2 155 – 28 15 – – 3 209
15 18 444 – 43 20 – – 10 551
Changes attributable toRevisions of previous estimates (6) (2) 15 – – (6) – – – 1
Improved recovery – – 13 – – – – – – 13
Purchases of reserves-in-place – – – – – – – – – 1
Discoveries and extensions – – – – – – – – – –
Productionc (1) (2) (27) – (4) (2) – – (1) (36)
Sales of reserves-in-place – – (18) – – – – – – (18)
(6) (4) (17) – (4) (8) – – (1) (40)
At 31 Decemberd
Developed 6 13 323 – 11 5 – – 6 364
Undeveloped 3 1 104 – 28 7 – – 3 146
9 14 427 – 39 12 – – 10 510
Equity-accounted entities (BP share)eAt 1 January
Developed – – – – – 8 94 – – 103
Undeveloped – – – – – 8 21 – – 29
– – – – – 16 115 – – 131
Changes attributable toRevisions of previous estimates – – – – – – (69) – – (69)
Improved recovery – – – – – – – – – –
Purchases of reserves-in-place – – – – – – – – – –
Discoveries and extensions – – – – – – – – – –
Production – – – – – – – – – –
Sales of reserves-in-place – – – – – – – – – –
– – – – – (1) (69) – – (69)
At 31 Decemberf
Developed – – – – – 15 30 – – 46
Undeveloped – – – – – – 16 – – 16
– – – – – 15 46 – – 62
Total subsidiaries and equity-accounted entities (BP share)At 1 January
Developed 9 16 290 – 14 13 94 – 8 444
Undeveloped 6 2 155 – 28 23 21 – 3 238
15 18 444 – 43 36 115 – 10 682
At 31 DecemberDeveloped 6 13 323 – 11 20 30 – 6 410
Undeveloped 3 1 104 – 28 7 16 – 3 163
9 14 427 – 39 27 46 – 10 572
a Proved reserves exclude royalties due to others, whether payable in cash or in kind, where the royalty owner has a direct interest in the underlying production and the option and ability to make liftingand sales arrangements independently.
b Because of rounding, some totals may not exactly agree with the sum of their counterparts.c Excludes NGLs from processing plants in which an interest is held of less than 1 thousand barrels per day for subsidiaries and 7 thousand barrels per day for equity-accounted entities.d Includes 12 million barrels of NGL in respect of the 30% non-controlling interest in BP Trinidad and Tobago LLC.e Volumes of equity-accounted entities include volumes of equity-accounted investments of those entities.f Total proved NGL reserves held as part of our equity interest in Rosneft is 47 million barrels, comprising less than 1 million barrels in Venezuela, Vietnam and Canada, and 46 million barrels in Russia.
Financial statements
BP Annual Report and Form 20-F 2014 175
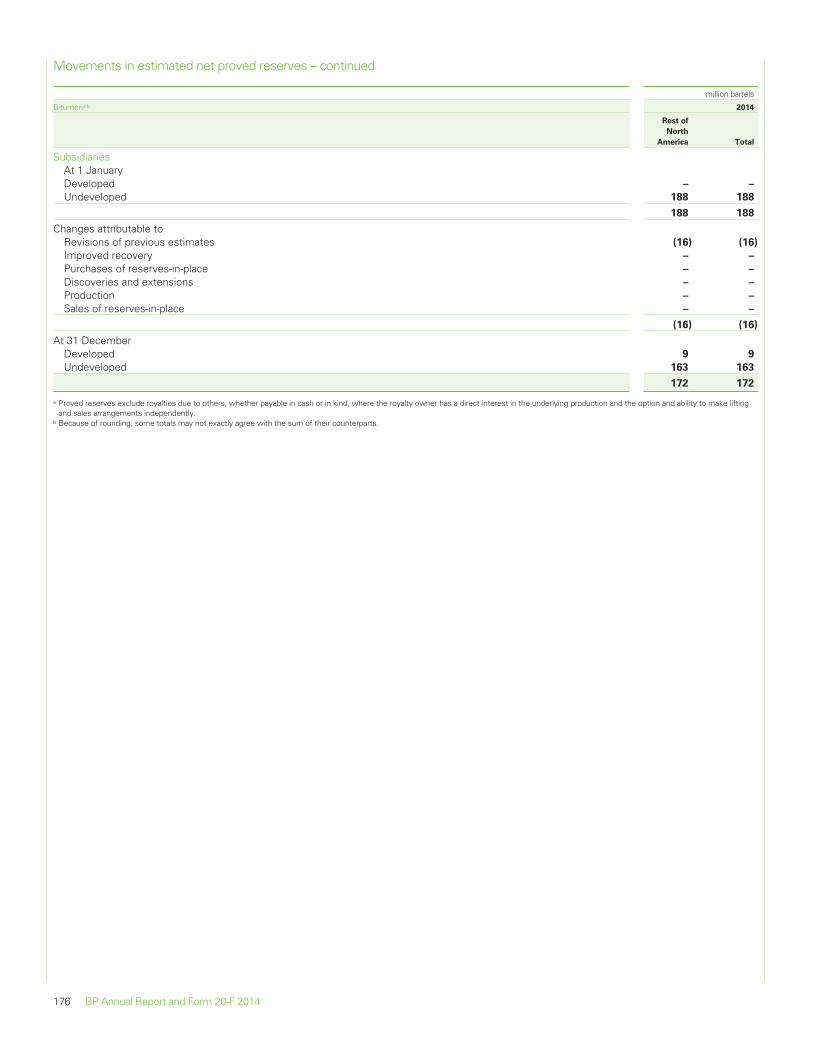
Movements in estimated net proved reserves – continued
million barrels
Bitumena b 2014
Rest of
North
America Total
SubsidiariesAt 1 JanuaryDeveloped – –
Undeveloped 188 188
188 188
Changes attributable toRevisions of previous estimates (16) (16)
Improved recovery – –
Purchases of reserves-in-place – –
Discoveries and extensions – –
Production – –
Sales of reserves-in-place – –
(16) (16)
At 31 DecemberDeveloped 9 9
Undeveloped 163 163
172 172
a Proved reserves exclude royalties due to others, whether payable in cash or in kind, where the royalty owner has a direct interest in the underlying production and the option and ability to make liftingand sales arrangements independently.
b Because of rounding, some totals may not exactly agree with the sum of their counterparts.
176 BP Annual Report and Form 20-F 2014
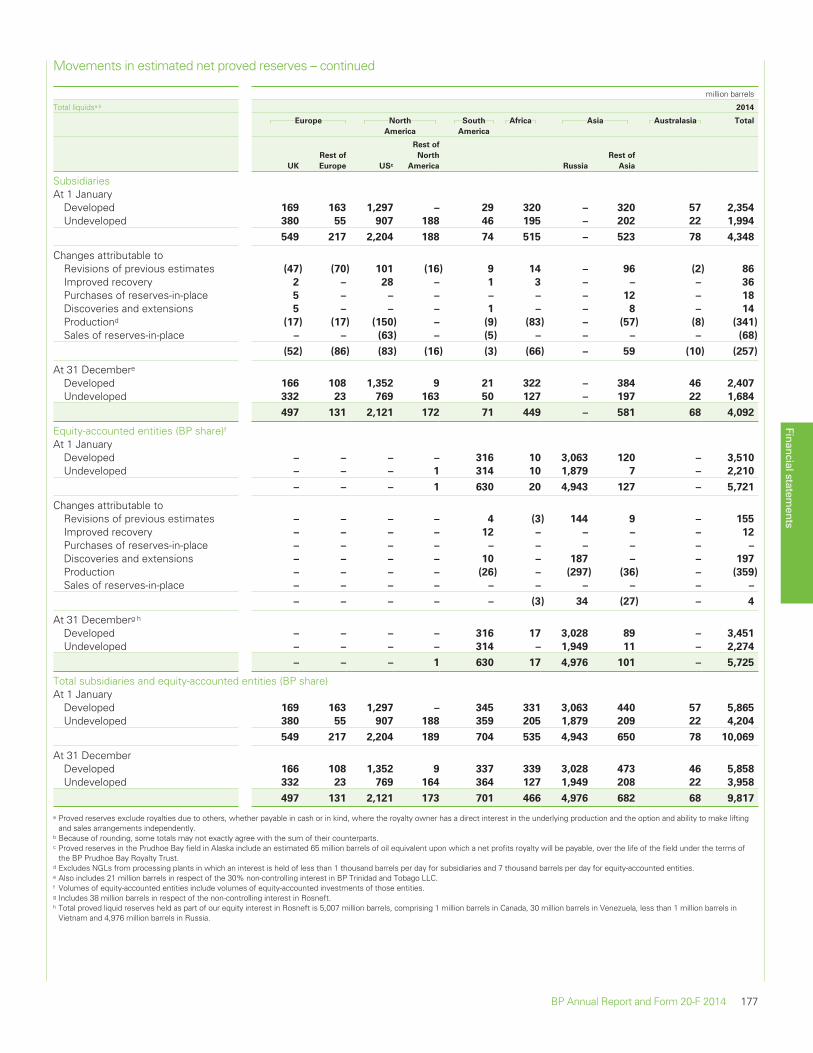
Movements in estimated net proved reserves – continued
million barrels
Total liquidsa b 2014
Europe North
America
South
America
Africa Asia Australasia Total
UK
Rest of
Europe USc
Rest of
North
America Russia
Rest of
Asia
SubsidiariesAt 1 January
Developed 169 163 1,297 – 29 320 – 320 57 2,354
Undeveloped 380 55 907 188 46 195 – 202 22 1,994
549 217 2,204 188 74 515 – 523 78 4,348
Changes attributable toRevisions of previous estimates (47) (70) 101 (16) 9 14 – 96 (2) 86
Improved recovery 2 – 28 – 1 3 – – – 36
Purchases of reserves-in-place 5 – – – – – – 12 – 18
Discoveries and extensions 5 – – – 1 – – 8 – 14
Productiond (17) (17) (150) – (9) (83) – (57) (8) (341)
Sales of reserves-in-place – – (63) – (5) – – – – (68)
(52) (86) (83) (16) (3) (66) – 59 (10) (257)
At 31 Decembere
Developed 166 108 1,352 9 21 322 – 384 46 2,407
Undeveloped 332 23 769 163 50 127 – 197 22 1,684
497 131 2,121 172 71 449 – 581 68 4,092
Equity-accounted entities (BP share)fAt 1 January
Developed – – – – 316 10 3,063 120 – 3,510
Undeveloped – – – 1 314 10 1,879 7 – 2,210
– – – 1 630 20 4,943 127 – 5,721
Changes attributable toRevisions of previous estimates – – – – 4 (3) 144 9 – 155
Improved recovery – – – – 12 – – – – 12
Purchases of reserves-in-place – – – – – – – – – –
Discoveries and extensions – – – – 10 – 187 – – 197
Production – – – – (26) – (297) (36) – (359)
Sales of reserves-in-place – – – – – – – – – –
– – – – – (3) 34 (27) – 4
At 31 Decemberg h
Developed – – – – 316 17 3,028 89 – 3,451
Undeveloped – – – – 314 – 1,949 11 – 2,274
– – – 1 630 17 4,976 101 – 5,725
Total subsidiaries and equity-accounted entities (BP share)At 1 January
Developed 169 163 1,297 – 345 331 3,063 440 57 5,865
Undeveloped 380 55 907 188 359 205 1,879 209 22 4,204
549 217 2,204 189 704 535 4,943 650 78 10,069
At 31 DecemberDeveloped 166 108 1,352 9 337 339 3,028 473 46 5,858
Undeveloped 332 23 769 164 364 127 1,949 208 22 3,958
497 131 2,121 173 701 466 4,976 682 68 9,817
a Proved reserves exclude royalties due to others, whether payable in cash or in kind, where the royalty owner has a direct interest in the underlying production and the option and ability to make liftingand sales arrangements independently.
b Because of rounding, some totals may not exactly agree with the sum of their counterparts.c Proved reserves in the Prudhoe Bay field in Alaska include an estimated 65 million barrels of oil equivalent upon which a net profits royalty will be payable, over the life of the field under the terms of
the BP Prudhoe Bay Royalty Trust.d Excludes NGLs from processing plants in which an interest is held of less than 1 thousand barrels per day for subsidiaries and 7 thousand barrels per day for equity-accounted entities.e Also includes 21 million barrels in respect of the 30% non-controlling interest in BP Trinidad and Tobago LLC.f Volumes of equity-accounted entities include volumes of equity-accounted investments of those entities.g Includes 38 million barrels in respect of the non-controlling interest in Rosneft.h Total proved liquid reserves held as part of our equity interest in Rosneft is 5,007 million barrels, comprising 1 million barrels in Canada, 30 million barrels in Venezuela, less than 1 million barrels in
Vietnam and 4,976 million barrels in Russia.
Financial statements
BP Annual Report and Form 20-F 2014 177
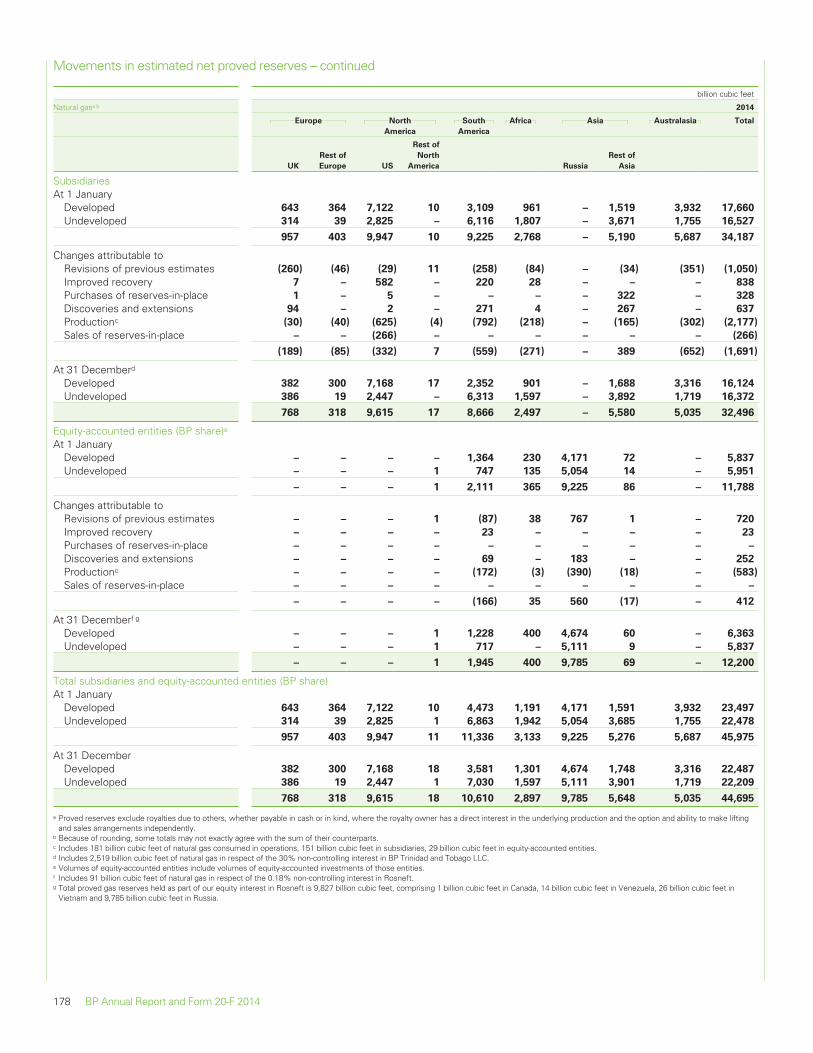
Movements in estimated net proved reserves – continued
billion cubic feet
Natural gasa b 2014
Europe North
America
South
America
Africa Asia Australasia Total
UK
Rest of
Europe US
Rest of
North
America Russia
Rest of
Asia
SubsidiariesAt 1 January
Developed 643 364 7,122 10 3,109 961 – 1,519 3,932 17,660
Undeveloped 314 39 2,825 – 6,116 1,807 – 3,671 1,755 16,527
957 403 9,947 10 9,225 2,768 – 5,190 5,687 34,187
Changes attributable toRevisions of previous estimates (260) (46) (29) 11 (258) (84) – (34) (351) (1,050)
Improved recovery 7 – 582 – 220 28 – – – 838
Purchases of reserves-in-place 1 – 5 – – – – 322 – 328
Discoveries and extensions 94 – 2 – 271 4 – 267 – 637
Productionc (30) (40) (625) (4) (792) (218) – (165) (302) (2,177)
Sales of reserves-in-place – – (266) – – – – – – (266)
(189) (85) (332) 7 (559) (271) – 389 (652) (1,691)
At 31 Decemberd
Developed 382 300 7,168 17 2,352 901 – 1,688 3,316 16,124
Undeveloped 386 19 2,447 – 6,313 1,597 – 3,892 1,719 16,372
768 318 9,615 17 8,666 2,497 – 5,580 5,035 32,496
Equity-accounted entities (BP share)eAt 1 January
Developed – – – – 1,364 230 4,171 72 – 5,837
Undeveloped – – – 1 747 135 5,054 14 – 5,951
– – – 1 2,111 365 9,225 86 – 11,788
Changes attributable toRevisions of previous estimates – – – 1 (87) 38 767 1 – 720
Improved recovery – – – – 23 – – – – 23
Purchases of reserves-in-place – – – – – – – – – –
Discoveries and extensions – – – – 69 – 183 – – 252
Productionc – – – – (172) (3) (390) (18) – (583)
Sales of reserves-in-place – – – – – – – – – –
– – – – (166) 35 560 (17) – 412
At 31 Decemberf g
Developed – – – 1 1,228 400 4,674 60 – 6,363
Undeveloped – – – 1 717 – 5,111 9 – 5,837
– – – 1 1,945 400 9,785 69 – 12,200
Total subsidiaries and equity-accounted entities (BP share)At 1 January
Developed 643 364 7,122 10 4,473 1,191 4,171 1,591 3,932 23,497
Undeveloped 314 39 2,825 1 6,863 1,942 5,054 3,685 1,755 22,478
957 403 9,947 11 11,336 3,133 9,225 5,276 5,687 45,975
At 31 DecemberDeveloped 382 300 7,168 18 3,581 1,301 4,674 1,748 3,316 22,487
Undeveloped 386 19 2,447 1 7,030 1,597 5,111 3,901 1,719 22,209
768 318 9,615 18 10,610 2,897 9,785 5,648 5,035 44,695
a Proved reserves exclude royalties due to others, whether payable in cash or in kind, where the royalty owner has a direct interest in the underlying production and the option and ability to make liftingand sales arrangements independently.
b Because of rounding, some totals may not exactly agree with the sum of their counterparts.c Includes 181 billion cubic feet of natural gas consumed in operations, 151 billion cubic feet in subsidiaries, 29 billion cubic feet in equity-accounted entities.d Includes 2,519 billion cubic feet of natural gas in respect of the 30% non-controlling interest in BP Trinidad and Tobago LLC.e Volumes of equity-accounted entities include volumes of equity-accounted investments of those entities.f Includes 91 billion cubic feet of natural gas in respect of the 0.18% non-controlling interest in Rosneft.g Total proved gas reserves held as part of our equity interest in Rosneft is 9,827 billion cubic feet, comprising 1 billion cubic feet in Canada, 14 billion cubic feet in Venezuela, 26 billion cubic feet in
Vietnam and 9,785 billion cubic feet in Russia.
178 BP Annual Report and Form 20-F 2014
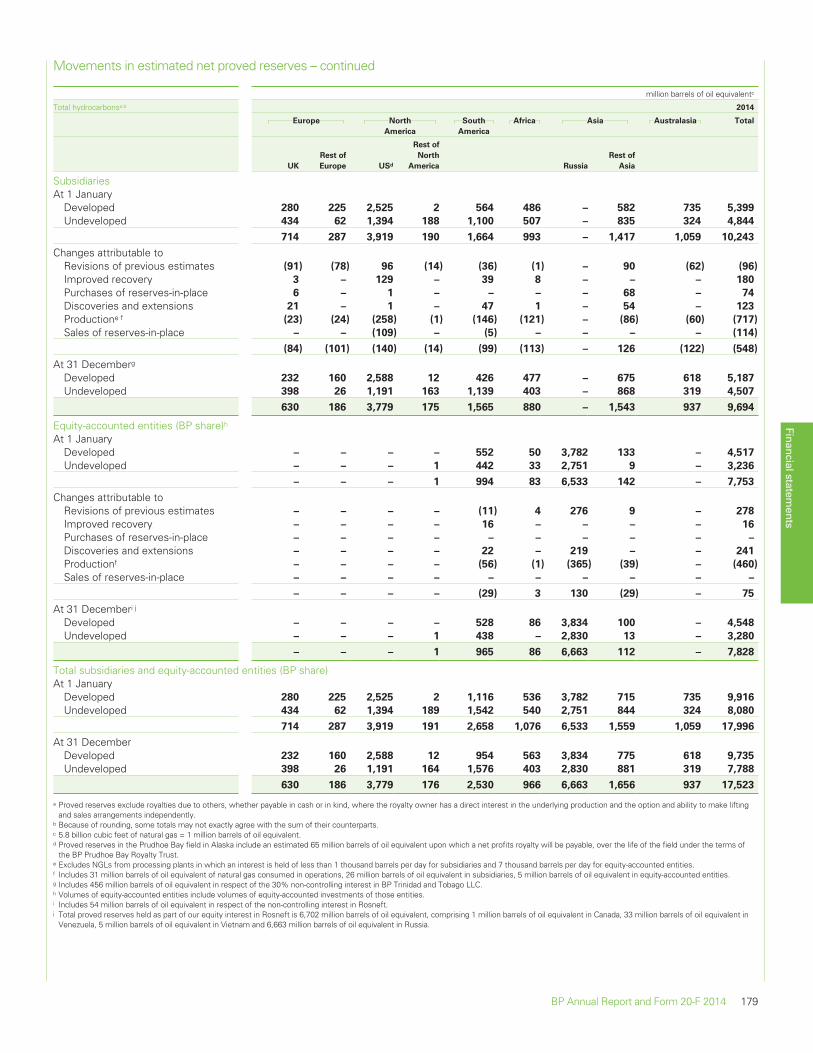
Movements in estimated net proved reserves – continued
million barrels of oil equivalentc
Total hydrocarbonsa b 2014
Europe North
America
South
America
Africa Asia Australasia Total
UK
Rest of
Europe USd
Rest of
North
America Russia
Rest of
Asia
SubsidiariesAt 1 January
Developed 280 225 2,525 2 564 486 – 582 735 5,399
Undeveloped 434 62 1,394 188 1,100 507 – 835 324 4,844
714 287 3,919 190 1,664 993 – 1,417 1,059 10,243
Changes attributable toRevisions of previous estimates (91) (78) 96 (14) (36) (1) – 90 (62) (96)
Improved recovery 3 – 129 – 39 8 – – – 180
Purchases of reserves-in-place 6 – 1 – – – – 68 – 74
Discoveries and extensions 21 – 1 – 47 1 – 54 – 123
Productione f (23) (24) (258) (1) (146) (121) – (86) (60) (717)
Sales of reserves-in-place – – (109) – (5) – – – – (114)
(84) (101) (140) (14) (99) (113) – 126 (122) (548)
At 31 Decemberg
Developed 232 160 2,588 12 426 477 – 675 618 5,187
Undeveloped 398 26 1,191 163 1,139 403 – 868 319 4,507
630 186 3,779 175 1,565 880 – 1,543 937 9,694
Equity-accounted entities (BP share)hAt 1 January
Developed – – – – 552 50 3,782 133 – 4,517
Undeveloped – – – 1 442 33 2,751 9 – 3,236
– – – 1 994 83 6,533 142 – 7,753
Changes attributable toRevisions of previous estimates – – – – (11) 4 276 9 – 278
Improved recovery – – – – 16 – – – – 16
Purchases of reserves-in-place – – – – – – – – – –
Discoveries and extensions – – – – 22 – 219 – – 241
Productionf – – – – (56) (1) (365) (39) – (460)
Sales of reserves-in-place – – – – – – – – – –
– – – – (29) 3 130 (29) – 75
At 31 Decemberi j
Developed – – – – 528 86 3,834 100 – 4,548
Undeveloped – – – 1 438 – 2,830 13 – 3,280
– – – 1 965 86 6,663 112 – 7,828
Total subsidiaries and equity-accounted entities (BP share)At 1 January
Developed 280 225 2,525 2 1,116 536 3,782 715 735 9,916
Undeveloped 434 62 1,394 189 1,542 540 2,751 844 324 8,080
714 287 3,919 191 2,658 1,076 6,533 1,559 1,059 17,996
At 31 DecemberDeveloped 232 160 2,588 12 954 563 3,834 775 618 9,735
Undeveloped 398 26 1,191 164 1,576 403 2,830 881 319 7,788
630 186 3,779 176 2,530 966 6,663 1,656 937 17,523
a Proved reserves exclude royalties due to others, whether payable in cash or in kind, where the royalty owner has a direct interest in the underlying production and the option and ability to make liftingand sales arrangements independently.
b Because of rounding, some totals may not exactly agree with the sum of their counterparts.c 5.8 billion cubic feet of natural gas = 1 million barrels of oil equivalent.d Proved reserves in the Prudhoe Bay field in Alaska include an estimated 65 million barrels of oil equivalent upon which a net profits royalty will be payable, over the life of the field under the terms of
the BP Prudhoe Bay Royalty Trust.e Excludes NGLs from processing plants in which an interest is held of less than 1 thousand barrels per day for subsidiaries and 7 thousand barrels per day for equity-accounted entities.f Includes 31 million barrels of oil equivalent of natural gas consumed in operations, 26 million barrels of oil equivalent in subsidiaries, 5 million barrels of oil equivalent in equity-accounted entities.g Includes 456 million barrels of oil equivalent in respect of the 30% non-controlling interest in BP Trinidad and Tobago LLC.h Volumes of equity-accounted entities include volumes of equity-accounted investments of those entities.i Includes 54 million barrels of oil equivalent in respect of the non-controlling interest in Rosneft.j Total proved reserves held as part of our equity interest in Rosneft is 6,702 million barrels of oil equivalent, comprising 1 million barrels of oil equivalent in Canada, 33 million barrels of oil equivalent in
Venezuela, 5 million barrels of oil equivalent in Vietnam and 6,663 million barrels of oil equivalent in Russia.
Financial statements
BP Annual Report and Form 20-F 2014 179
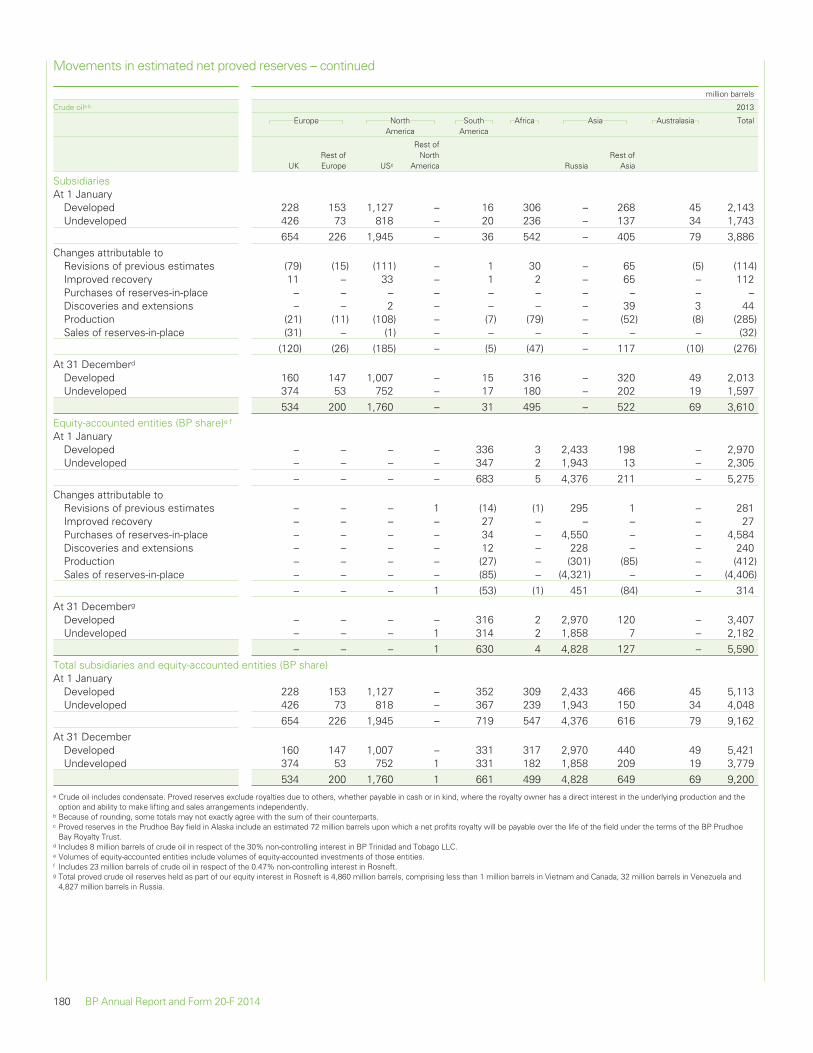
Movements in estimated net proved reserves – continued
million barrels
Crude oila b 2013
Europe NorthAmerica
SouthAmerica
Africa Asia Australasia Total
UKRest ofEurope USc
Rest ofNorth
America RussiaRest of
Asia
SubsidiariesAt 1 January
Developed 228 153 1,127 – 16 306 – 268 45 2,143Undeveloped 426 73 818 – 20 236 – 137 34 1,743
654 226 1,945 – 36 542 – 405 79 3,886Changes attributable to
Revisions of previous estimates (79) (15) (111) – 1 30 – 65 (5) (114)Improved recovery 11 – 33 – 1 2 – 65 – 112Purchases of reserves-in-place – – – – – – – – – –Discoveries and extensions – – 2 – – – – 39 3 44Production (21) (11) (108) – (7) (79) – (52) (8) (285)Sales of reserves-in-place (31) – (1) – – – – – – (32)
(120) (26) (185) – (5) (47) – 117 (10) (276)At 31 Decemberd
Developed 160 147 1,007 – 15 316 – 320 49 2,013Undeveloped 374 53 752 – 17 180 – 202 19 1,597
534 200 1,760 – 31 495 – 522 69 3,610Equity-accounted entities (BP share)e f
At 1 JanuaryDeveloped – – – – 336 3 2,433 198 – 2,970Undeveloped – – – – 347 2 1,943 13 – 2,305
– – – – 683 5 4,376 211 – 5,275Changes attributable to
Revisions of previous estimates – – – 1 (14) (1) 295 1 – 281Improved recovery – – – – 27 – – – – 27Purchases of reserves-in-place – – – – 34 – 4,550 – – 4,584Discoveries and extensions – – – – 12 – 228 – – 240Production – – – – (27) – (301) (85) – (412)Sales of reserves-in-place – – – – (85) – (4,321) – – (4,406)
– – – 1 (53) (1) 451 (84) – 314At 31 Decemberg
Developed – – – – 316 2 2,970 120 – 3,407Undeveloped – – – 1 314 2 1,858 7 – 2,182
– – – 1 630 4 4,828 127 – 5,590Total subsidiaries and equity-accounted entities (BP share)At 1 January
Developed 228 153 1,127 – 352 309 2,433 466 45 5,113Undeveloped 426 73 818 – 367 239 1,943 150 34 4,048
654 226 1,945 – 719 547 4,376 616 79 9,162At 31 December
Developed 160 147 1,007 – 331 317 2,970 440 49 5,421Undeveloped 374 53 752 1 331 182 1,858 209 19 3,779
534 200 1,760 1 661 499 4,828 649 69 9,200a Crude oil includes condensate. Proved reserves exclude royalties due to others, whether payable in cash or in kind, where the royalty owner has a direct interest in the underlying production and the
option and ability to make lifting and sales arrangements independently.b Because of rounding, some totals may not exactly agree with the sum of their counterparts.c Proved reserves in the Prudhoe Bay field in Alaska include an estimated 72 million barrels upon which a net profits royalty will be payable over the life of the field under the terms of the BP Prudhoe
Bay Royalty Trust.d Includes 8 million barrels of crude oil in respect of the 30% non-controlling interest in BP Trinidad and Tobago LLC.e Volumes of equity-accounted entities include volumes of equity-accounted investments of those entities.f Includes 23 million barrels of crude oil in respect of the 0.47% non-controlling interest in Rosneft.g Total proved crude oil reserves held as part of our equity interest in Rosneft is 4,860 million barrels, comprising less than 1 million barrels in Vietnam and Canada, 32 million barrels in Venezuela and
4,827 million barrels in Russia.
180 BP Annual Report and Form 20-F 2014
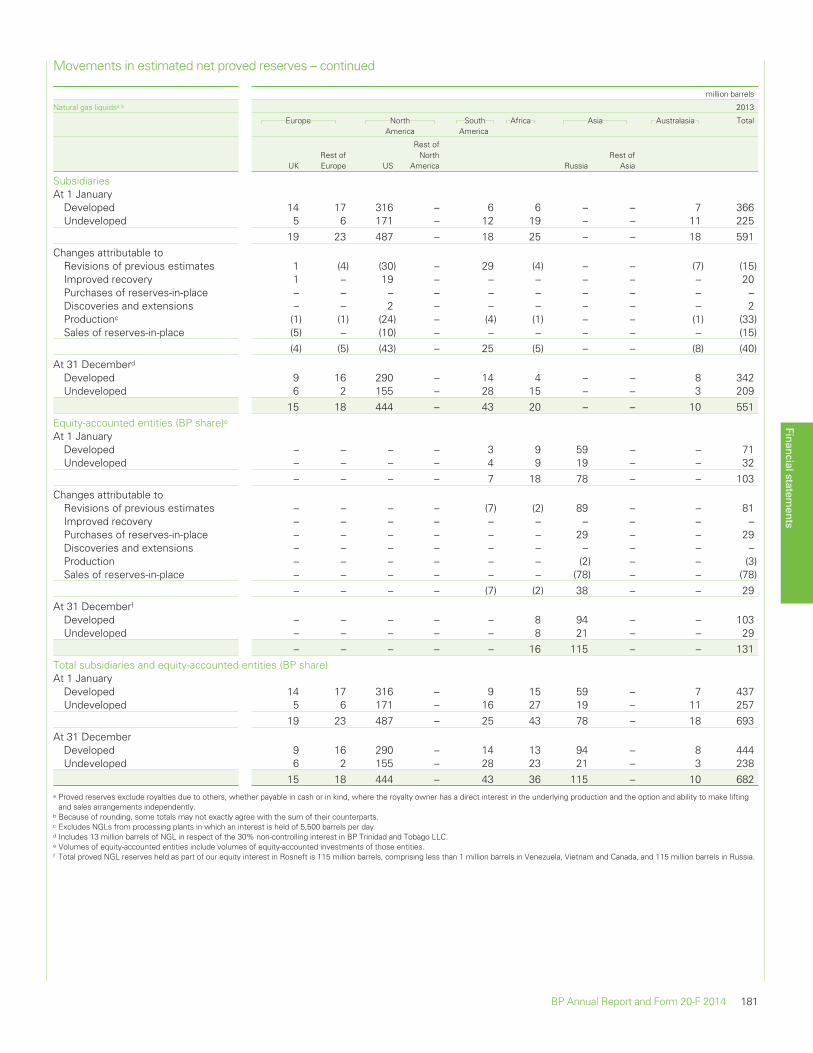
Movements in estimated net proved reserves – continued
million barrels
Natural gas liquidsa b 2013
Europe NorthAmerica
SouthAmerica
Africa Asia Australasia Total
UKRest ofEurope US
Rest ofNorth
America RussiaRest of
Asia
SubsidiariesAt 1 January
Developed 14 17 316 – 6 6 – – 7 366Undeveloped 5 6 171 – 12 19 – – 11 225
19 23 487 – 18 25 – – 18 591Changes attributable to
Revisions of previous estimates 1 (4) (30) – 29 (4) – – (7) (15)Improved recovery 1 – 19 – – – – – – 20Purchases of reserves-in-place – – – – – – – – – –Discoveries and extensions – – 2 – – – – – – 2Productionc (1) (1) (24) – (4) (1) – – (1) (33)Sales of reserves-in-place (5) – (10) – – – – – – (15)
(4) (5) (43) – 25 (5) – – (8) (40)At 31 Decemberd
Developed 9 16 290 – 14 4 – – 8 342Undeveloped 6 2 155 – 28 15 – – 3 209
15 18 444 – 43 20 – – 10 551Equity-accounted entities (BP share)eAt 1 January
Developed – – – – 3 9 59 – – 71Undeveloped – – – – 4 9 19 – – 32
– – – – 7 18 78 – – 103Changes attributable to
Revisions of previous estimates – – – – (7) (2) 89 – – 81Improved recovery – – – – – – – – – –Purchases of reserves-in-place – – – – – – 29 – – 29Discoveries and extensions – – – – – – – – – –Production – – – – – – (2) – – (3)Sales of reserves-in-place – – – – – – (78) – – (78)
– – – – (7) (2) 38 – – 29At 31 Decemberf
Developed – – – – – 8 94 – – 103Undeveloped – – – – – 8 21 – – 29
– – – – – 16 115 – – 131Total subsidiaries and equity-accounted entities (BP share)At 1 January
Developed 14 17 316 – 9 15 59 – 7 437Undeveloped 5 6 171 – 16 27 19 – 11 257
19 23 487 – 25 43 78 – 18 693At 31 December
Developed 9 16 290 – 14 13 94 – 8 444Undeveloped 6 2 155 – 28 23 21 – 3 238
15 18 444 – 43 36 115 – 10 682a Proved reserves exclude royalties due to others, whether payable in cash or in kind, where the royalty owner has a direct interest in the underlying production and the option and ability to make lifting
and sales arrangements independently.b Because of rounding, some totals may not exactly agree with the sum of their counterparts.c Excludes NGLs from processing plants in which an interest is held of 5,500 barrels per day.d Includes 13 million barrels of NGL in respect of the 30% non-controlling interest in BP Trinidad and Tobago LLC.e Volumes of equity-accounted entities include volumes of equity-accounted investments of those entities.f Total proved NGL reserves held as part of our equity interest in Rosneft is 115 million barrels, comprising less than 1 million barrels in Venezuela, Vietnam and Canada, and 115 million barrels in Russia.
Financial statements
BP Annual Report and Form 20-F 2014 181
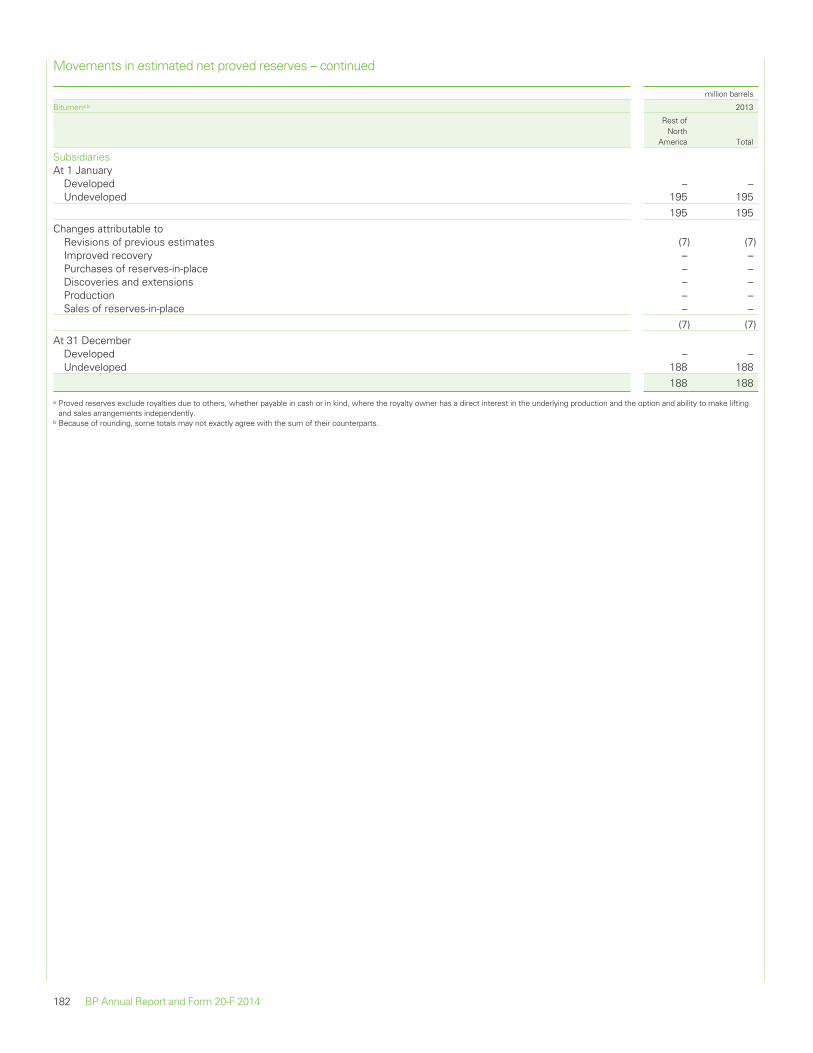
Movements in estimated net proved reserves – continued
million barrels
Bitumena b 2013
Rest ofNorth
America Total
SubsidiariesAt 1 January
Developed – –Undeveloped 195 195
195 195Changes attributable to
Revisions of previous estimates (7) (7)Improved recovery – –Purchases of reserves-in-place – –Discoveries and extensions – –Production – –Sales of reserves-in-place – –
(7) (7)At 31 December
Developed – –Undeveloped 188 188
188 188
a Proved reserves exclude royalties due to others, whether payable in cash or in kind, where the royalty owner has a direct interest in the underlying production and the option and ability to make liftingand sales arrangements independently.
b Because of rounding, some totals may not exactly agree with the sum of their counterparts.
182 BP Annual Report and Form 20-F 2014
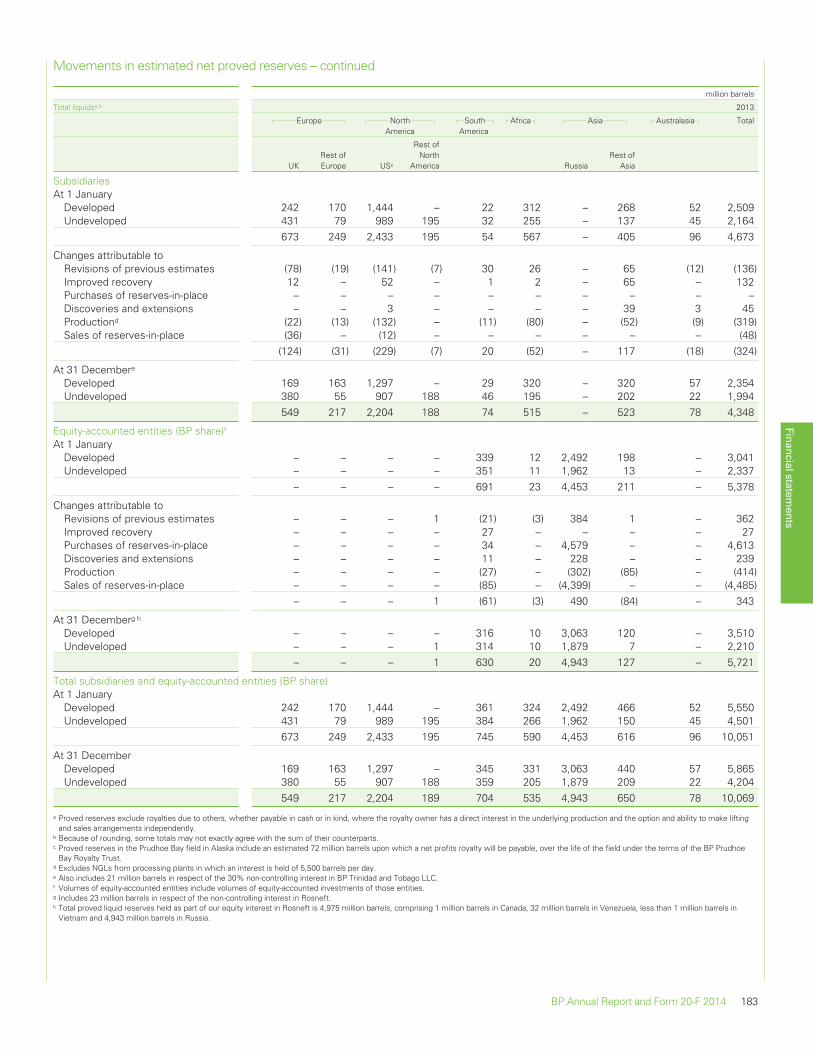
Movements in estimated net proved reserves – continued
million barrels
Total liquidsa b 2013
Europe NorthAmerica
SouthAmerica
Africa Asia Australasia Total
UKRest ofEurope USc
Rest ofNorth
America RussiaRest of
Asia
SubsidiariesAt 1 January
Developed 242 170 1,444 – 22 312 – 268 52 2,509Undeveloped 431 79 989 195 32 255 – 137 45 2,164
673 249 2,433 195 54 567 – 405 96 4,673
Changes attributable toRevisions of previous estimates (78) (19) (141) (7) 30 26 – 65 (12) (136)Improved recovery 12 – 52 – 1 2 – 65 – 132Purchases of reserves-in-place – – – – – – – – – –Discoveries and extensions – – 3 – – – – 39 3 45Productiond (22) (13) (132) – (11) (80) – (52) (9) (319)Sales of reserves-in-place (36) – (12) – – – – – – (48)
(124) (31) (229) (7) 20 (52) – 117 (18) (324)
At 31 Decembere
Developed 169 163 1,297 – 29 320 – 320 57 2,354Undeveloped 380 55 907 188 46 195 – 202 22 1,994
549 217 2,204 188 74 515 – 523 78 4,348
Equity-accounted entities (BP share)fAt 1 January
Developed – – – – 339 12 2,492 198 – 3,041Undeveloped – – – – 351 11 1,962 13 – 2,337
– – – – 691 23 4,453 211 – 5,378
Changes attributable toRevisions of previous estimates – – – 1 (21) (3) 384 1 – 362Improved recovery – – – – 27 – – – – 27Purchases of reserves-in-place – – – – 34 – 4,579 – – 4,613Discoveries and extensions – – – – 11 – 228 – – 239Production – – – – (27) – (302) (85) – (414)Sales of reserves-in-place – – – – (85) – (4,399) – – (4,485)
– – – 1 (61) (3) 490 (84) – 343
At 31 Decemberg h
Developed – – – – 316 10 3,063 120 – 3,510Undeveloped – – – 1 314 10 1,879 7 – 2,210
– – – 1 630 20 4,943 127 – 5,721
Total subsidiaries and equity-accounted entities (BP share)At 1 January
Developed 242 170 1,444 – 361 324 2,492 466 52 5,550Undeveloped 431 79 989 195 384 266 1,962 150 45 4,501
673 249 2,433 195 745 590 4,453 616 96 10,051
At 31 DecemberDeveloped 169 163 1,297 – 345 331 3,063 440 57 5,865Undeveloped 380 55 907 188 359 205 1,879 209 22 4,204
549 217 2,204 189 704 535 4,943 650 78 10,069
a Proved reserves exclude royalties due to others, whether payable in cash or in kind, where the royalty owner has a direct interest in the underlying production and the option and ability to make liftingand sales arrangements independently.
b Because of rounding, some totals may not exactly agree with the sum of their counterparts.c Proved reserves in the Prudhoe Bay field in Alaska include an estimated 72 million barrels upon which a net profits royalty will be payable, over the life of the field under the terms of the BP Prudhoe
Bay Royalty Trust.d Excludes NGLs from processing plants in which an interest is held of 5,500 barrels per day.e Also includes 21 million barrels in respect of the 30% non-controlling interest in BP Trinidad and Tobago LLC.f Volumes of equity-accounted entities include volumes of equity-accounted investments of those entities.g Includes 23 million barrels in respect of the non-controlling interest in Rosneft.h Total proved liquid reserves held as part of our equity interest in Rosneft is 4,975 million barrels, comprising 1 million barrels in Canada, 32 million barrels in Venezuela, less than 1 million barrels in
Vietnam and 4,943 million barrels in Russia.
Financial statements
BP Annual Report and Form 20-F 2014 183
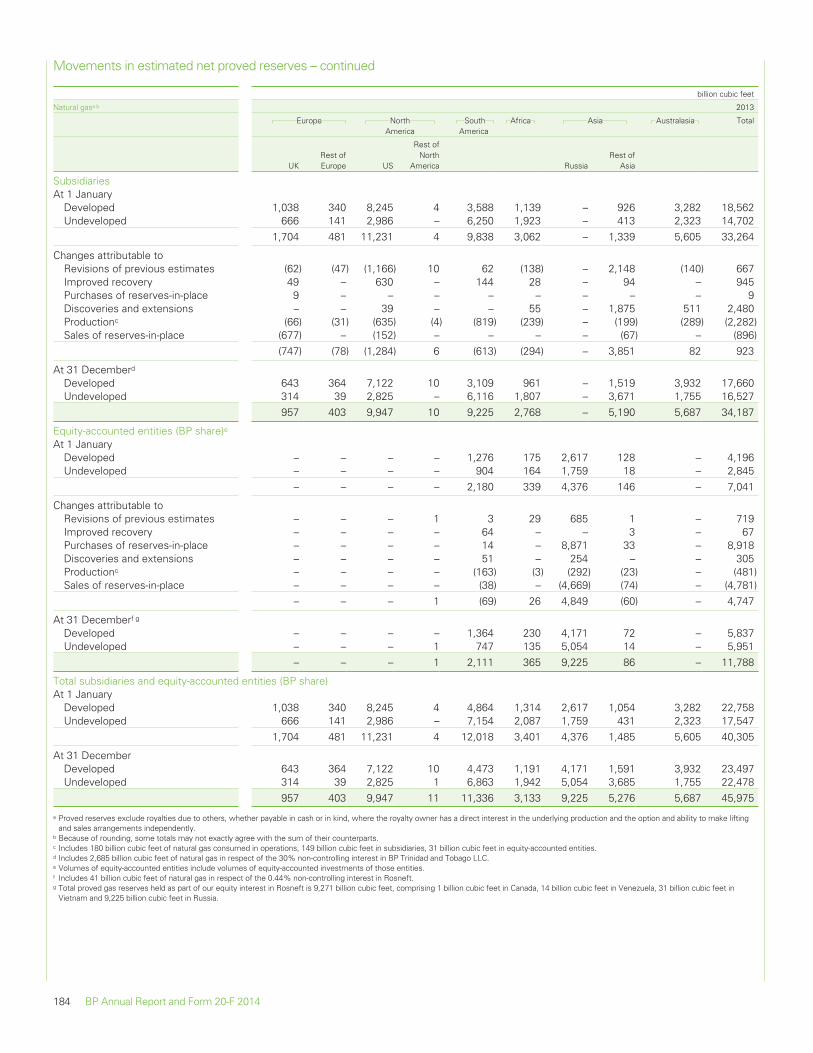
Movements in estimated net proved reserves – continued
billion cubic feet
Natural gasa b 2013
Europe NorthAmerica
SouthAmerica
Africa Asia Australasia Total
UKRest ofEurope US
Rest ofNorth
America RussiaRest of
Asia
SubsidiariesAt 1 January
Developed 1,038 340 8,245 4 3,588 1,139 – 926 3,282 18,562Undeveloped 666 141 2,986 – 6,250 1,923 – 413 2,323 14,702
1,704 481 11,231 4 9,838 3,062 – 1,339 5,605 33,264
Changes attributable toRevisions of previous estimates (62) (47) (1,166) 10 62 (138) – 2,148 (140) 667Improved recovery 49 – 630 – 144 28 – 94 – 945Purchases of reserves-in-place 9 – – – – – – – – 9Discoveries and extensions – – 39 – – 55 – 1,875 511 2,480Productionc (66) (31) (635) (4) (819) (239) – (199) (289) (2,282)Sales of reserves-in-place (677) – (152) – – – – (67) – (896)
(747) (78) (1,284) 6 (613) (294) – 3,851 82 923
At 31 Decemberd
Developed 643 364 7,122 10 3,109 961 – 1,519 3,932 17,660Undeveloped 314 39 2,825 – 6,116 1,807 – 3,671 1,755 16,527
957 403 9,947 10 9,225 2,768 – 5,190 5,687 34,187
Equity-accounted entities (BP share)eAt 1 January
Developed – – – – 1,276 175 2,617 128 – 4,196Undeveloped – – – – 904 164 1,759 18 – 2,845
– – – – 2,180 339 4,376 146 – 7,041
Changes attributable toRevisions of previous estimates – – – 1 3 29 685 1 – 719Improved recovery – – – – 64 – – 3 – 67Purchases of reserves-in-place – – – – 14 – 8,871 33 – 8,918Discoveries and extensions – – – – 51 – 254 – – 305Productionc – – – – (163) (3) (292) (23) – (481)Sales of reserves-in-place – – – – (38) – (4,669) (74) – (4,781)
– – – 1 (69) 26 4,849 (60) – 4,747
At 31 Decemberf g
Developed – – – – 1,364 230 4,171 72 – 5,837Undeveloped – – – 1 747 135 5,054 14 – 5,951
– – – 1 2,111 365 9,225 86 – 11,788
Total subsidiaries and equity-accounted entities (BP share)At 1 January
Developed 1,038 340 8,245 4 4,864 1,314 2,617 1,054 3,282 22,758Undeveloped 666 141 2,986 – 7,154 2,087 1,759 431 2,323 17,547
1,704 481 11,231 4 12,018 3,401 4,376 1,485 5,605 40,305
At 31 DecemberDeveloped 643 364 7,122 10 4,473 1,191 4,171 1,591 3,932 23,497Undeveloped 314 39 2,825 1 6,863 1,942 5,054 3,685 1,755 22,478
957 403 9,947 11 11,336 3,133 9,225 5,276 5,687 45,975
a Proved reserves exclude royalties due to others, whether payable in cash or in kind, where the royalty owner has a direct interest in the underlying production and the option and ability to make liftingand sales arrangements independently.
b Because of rounding, some totals may not exactly agree with the sum of their counterparts.c Includes 180 billion cubic feet of natural gas consumed in operations, 149 billion cubic feet in subsidiaries, 31 billion cubic feet in equity-accounted entities.d Includes 2,685 billion cubic feet of natural gas in respect of the 30% non-controlling interest in BP Trinidad and Tobago LLC.e Volumes of equity-accounted entities include volumes of equity-accounted investments of those entities.f Includes 41 billion cubic feet of natural gas in respect of the 0.44% non-controlling interest in Rosneft.g Total proved gas reserves held as part of our equity interest in Rosneft is 9,271 billion cubic feet, comprising 1 billion cubic feet in Canada, 14 billion cubic feet in Venezuela, 31 billion cubic feet in
Vietnam and 9,225 billion cubic feet in Russia.
184 BP Annual Report and Form 20-F 2014
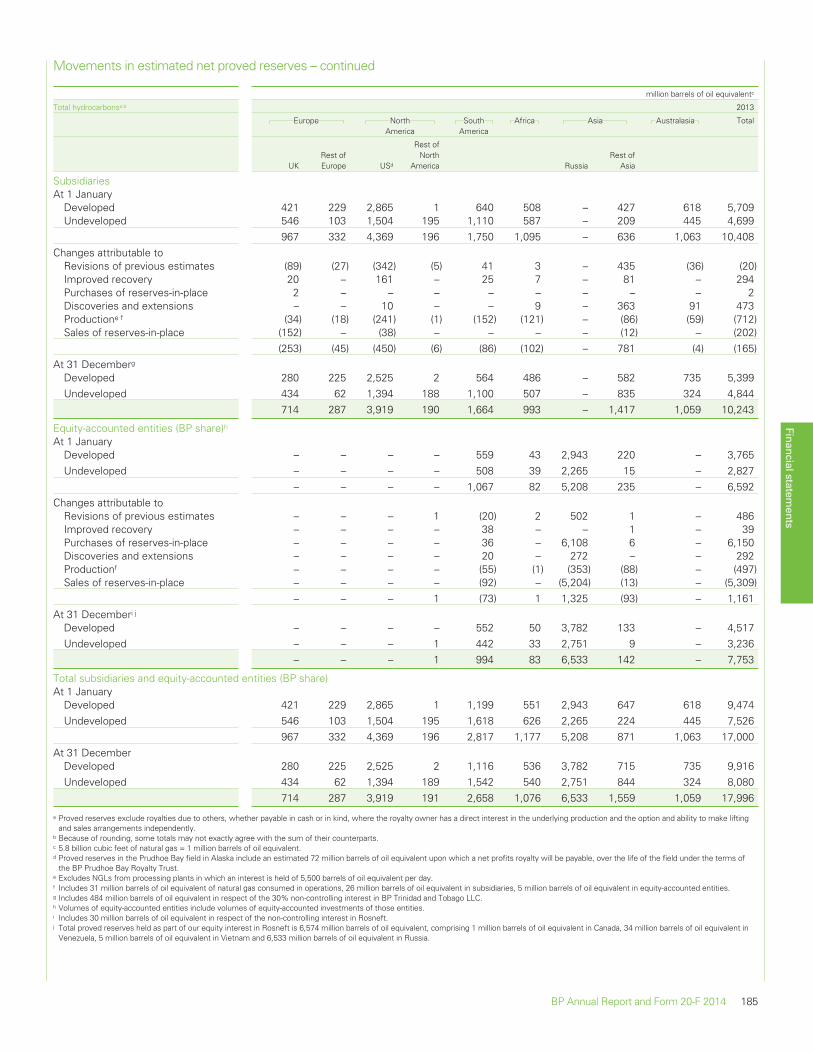
Movements in estimated net proved reserves – continued
million barrels of oil equivalentc
Total hydrocarbonsa b 2013
Europe NorthAmerica
SouthAmerica
Africa Asia Australasia Total
UKRest ofEurope USd
Rest ofNorth
America RussiaRest of
Asia
SubsidiariesAt 1 January
Developed 421 229 2,865 1 640 508 – 427 618 5,709Undeveloped 546 103 1,504 195 1,110 587 – 209 445 4,699
967 332 4,369 196 1,750 1,095 – 636 1,063 10,408Changes attributable to
Revisions of previous estimates (89) (27) (342) (5) 41 3 – 435 (36) (20)Improved recovery 20 – 161 – 25 7 – 81 – 294Purchases of reserves-in-place 2 – – – – – – – – 2Discoveries and extensions – – 10 – – 9 – 363 91 473Productione f (34) (18) (241) (1) (152) (121) – (86) (59) (712)Sales of reserves-in-place (152) – (38) – – – – (12) – (202)
(253) (45) (450) (6) (86) (102) – 781 (4) (165)At 31 Decemberg
Developed 280 225 2,525 2 564 486 – 582 735 5,399Undeveloped 434 62 1,394 188 1,100 507 – 835 324 4,844
714 287 3,919 190 1,664 993 – 1,417 1,059 10,243
Equity-accounted entities (BP share)hAt 1 January
Developed – – – – 559 43 2,943 220 – 3,765Undeveloped – – – – 508 39 2,265 15 – 2,827
– – – – 1,067 82 5,208 235 – 6,592Changes attributable to
Revisions of previous estimates – – – 1 (20) 2 502 1 – 486Improved recovery – – – – 38 – – 1 – 39Purchases of reserves-in-place – – – – 36 – 6,108 6 – 6,150Discoveries and extensions – – – – 20 – 272 – – 292Productionf – – – – (55) (1) (353) (88) – (497)Sales of reserves-in-place – – – – (92) – (5,204) (13) – (5,309)
– – – 1 (73) 1 1,325 (93) – 1,161At 31 Decemberi j
Developed – – – – 552 50 3,782 133 – 4,517Undeveloped – – – 1 442 33 2,751 9 – 3,236
– – – 1 994 83 6,533 142 – 7,753
Total subsidiaries and equity-accounted entities (BP share)At 1 January
Developed 421 229 2,865 1 1,199 551 2,943 647 618 9,474Undeveloped 546 103 1,504 195 1,618 626 2,265 224 445 7,526
967 332 4,369 196 2,817 1,177 5,208 871 1,063 17,000At 31 December
Developed 280 225 2,525 2 1,116 536 3,782 715 735 9,916Undeveloped 434 62 1,394 189 1,542 540 2,751 844 324 8,080
714 287 3,919 191 2,658 1,076 6,533 1,559 1,059 17,996
a Proved reserves exclude royalties due to others, whether payable in cash or in kind, where the royalty owner has a direct interest in the underlying production and the option and ability to make liftingand sales arrangements independently.
b Because of rounding, some totals may not exactly agree with the sum of their counterparts.c 5.8 billion cubic feet of natural gas = 1 million barrels of oil equivalent.d Proved reserves in the Prudhoe Bay field in Alaska include an estimated 72 million barrels of oil equivalent upon which a net profits royalty will be payable, over the life of the field under the terms of
the BP Prudhoe Bay Royalty Trust.e Excludes NGLs from processing plants in which an interest is held of 5,500 barrels of oil equivalent per day.f Includes 31 million barrels of oil equivalent of natural gas consumed in operations, 26 million barrels of oil equivalent in subsidiaries, 5 million barrels of oil equivalent in equity-accounted entities.g Includes 484 million barrels of oil equivalent in respect of the 30% non-controlling interest in BP Trinidad and Tobago LLC.h Volumes of equity-accounted entities include volumes of equity-accounted investments of those entities.i Includes 30 million barrels of oil equivalent in respect of the non-controlling interest in Rosneft.j Total proved reserves held as part of our equity interest in Rosneft is 6,574 million barrels of oil equivalent, comprising 1 million barrels of oil equivalent in Canada, 34 million barrels of oil equivalent in
Venezuela, 5 million barrels of oil equivalent in Vietnam and 6,533 million barrels of oil equivalent in Russia.
Financial statements
BP Annual Report and Form 20-F 2014 185
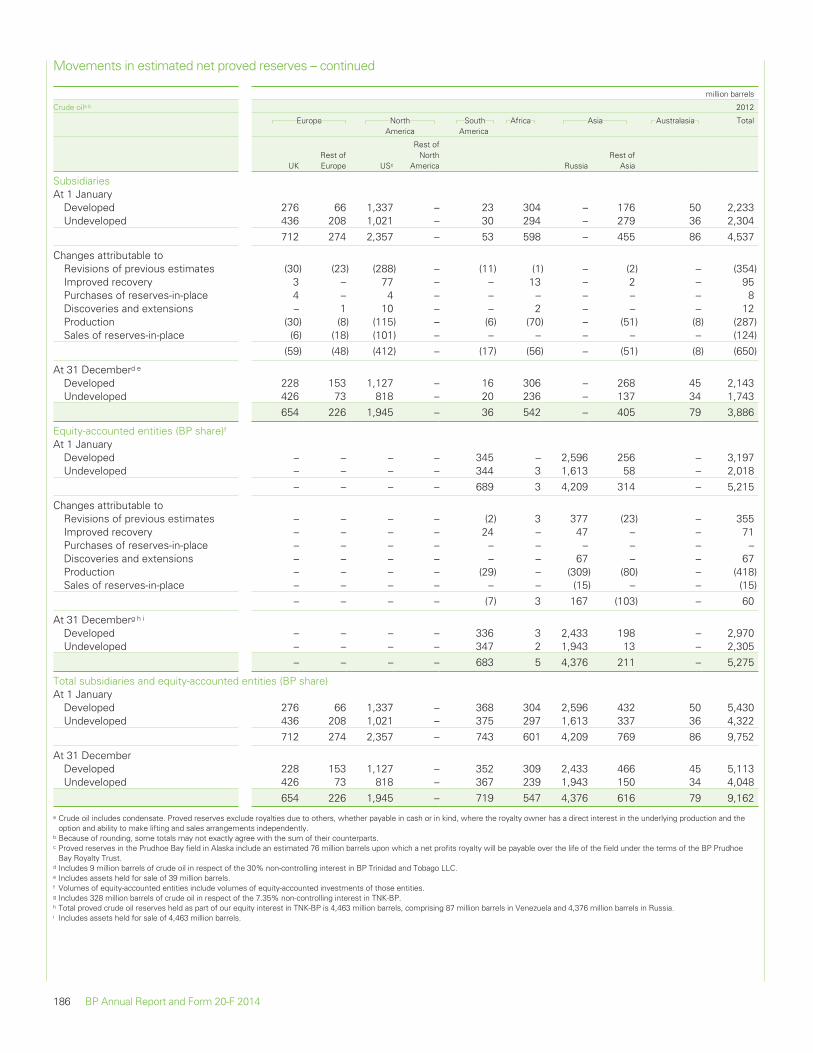
Movements in estimated net proved reserves – continued
million barrels
Crude oila b 2012
Europe NorthAmerica
SouthAmerica
Africa Asia Australasia Total
UKRest ofEurope USc
Rest ofNorth
America RussiaRest of
Asia
SubsidiariesAt 1 January
Developed 276 66 1,337 – 23 304 – 176 50 2,233Undeveloped 436 208 1,021 – 30 294 – 279 36 2,304
712 274 2,357 – 53 598 – 455 86 4,537
Changes attributable toRevisions of previous estimates (30) (23) (288) – (11) (1) – (2) – (354)Improved recovery 3 – 77 – – 13 – 2 – 95Purchases of reserves-in-place 4 – 4 – – – – – – 8Discoveries and extensions – 1 10 – – 2 – – – 12Production (30) (8) (115) – (6) (70) – (51) (8) (287)Sales of reserves-in-place (6) (18) (101) – – – – – – (124)
(59) (48) (412) – (17) (56) – (51) (8) (650)
At 31 Decemberd e
Developed 228 153 1,127 – 16 306 – 268 45 2,143Undeveloped 426 73 818 – 20 236 – 137 34 1,743
654 226 1,945 – 36 542 – 405 79 3,886
Equity-accounted entities (BP share)fAt 1 January
Developed – – – – 345 – 2,596 256 – 3,197Undeveloped – – – – 344 3 1,613 58 – 2,018
– – – – 689 3 4,209 314 – 5,215
Changes attributable toRevisions of previous estimates – – – – (2) 3 377 (23) – 355Improved recovery – – – – 24 – 47 – – 71Purchases of reserves-in-place – – – – – – – – – –Discoveries and extensions – – – – – – 67 – – 67Production – – – – (29) – (309) (80) – (418)Sales of reserves-in-place – – – – – – (15) – – (15)
– – – – (7) 3 167 (103) – 60
At 31 Decemberg h i
Developed – – – – 336 3 2,433 198 – 2,970Undeveloped – – – – 347 2 1,943 13 – 2,305
– – – – 683 5 4,376 211 – 5,275
Total subsidiaries and equity-accounted entities (BP share)At 1 January
Developed 276 66 1,337 – 368 304 2,596 432 50 5,430Undeveloped 436 208 1,021 – 375 297 1,613 337 36 4,322
712 274 2,357 – 743 601 4,209 769 86 9,752
At 31 DecemberDeveloped 228 153 1,127 – 352 309 2,433 466 45 5,113Undeveloped 426 73 818 – 367 239 1,943 150 34 4,048
654 226 1,945 – 719 547 4,376 616 79 9,162
a Crude oil includes condensate. Proved reserves exclude royalties due to others, whether payable in cash or in kind, where the royalty owner has a direct interest in the underlying production and theoption and ability to make lifting and sales arrangements independently.
b Because of rounding, some totals may not exactly agree with the sum of their counterparts.c Proved reserves in the Prudhoe Bay field in Alaska include an estimated 76 million barrels upon which a net profits royalty will be payable over the life of the field under the terms of the BP Prudhoe
Bay Royalty Trust.d Includes 9 million barrels of crude oil in respect of the 30% non-controlling interest in BP Trinidad and Tobago LLC.e Includes assets held for sale of 39 million barrels.f Volumes of equity-accounted entities include volumes of equity-accounted investments of those entities.g Includes 328 million barrels of crude oil in respect of the 7.35% non-controlling interest in TNK-BP.h Total proved crude oil reserves held as part of our equity interest in TNK-BP is 4,463 million barrels, comprising 87 million barrels in Venezuela and 4,376 million barrels in Russia.i Includes assets held for sale of 4,463 million barrels.
186 BP Annual Report and Form 20-F 2014
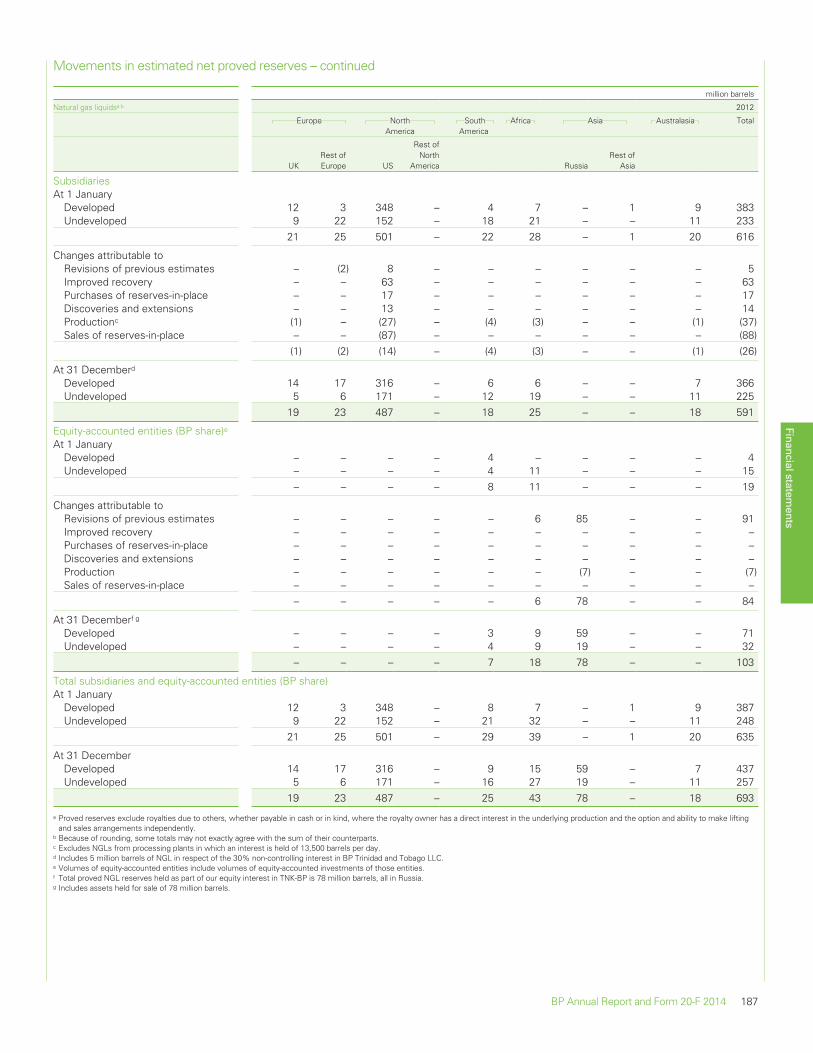
Movements in estimated net proved reserves – continued
million barrels
Natural gas liquidsa b 2012
Europe NorthAmerica
SouthAmerica
Africa Asia Australasia Total
UKRest ofEurope US
Rest ofNorth
America RussiaRest of
Asia
SubsidiariesAt 1 January
Developed 12 3 348 – 4 7 – 1 9 383Undeveloped 9 22 152 – 18 21 – – 11 233
21 25 501 – 22 28 – 1 20 616
Changes attributable toRevisions of previous estimates – (2) 8 – – – – – – 5Improved recovery – – 63 – – – – – – 63Purchases of reserves-in-place – – 17 – – – – – – 17Discoveries and extensions – – 13 – – – – – – 14Productionc (1) – (27) – (4) (3) – – (1) (37)Sales of reserves-in-place – – (87) – – – – – – (88)
(1) (2) (14) – (4) (3) – – (1) (26)
At 31 Decemberd
Developed 14 17 316 – 6 6 – – 7 366Undeveloped 5 6 171 – 12 19 – – 11 225
19 23 487 – 18 25 – – 18 591
Equity-accounted entities (BP share)eAt 1 January
Developed – – – – 4 – – – – 4Undeveloped – – – – 4 11 – – – 15
– – – – 8 11 – – – 19
Changes attributable toRevisions of previous estimates – – – – – 6 85 – – 91Improved recovery – – – – – – – – – –Purchases of reserves-in-place – – – – – – – – – –Discoveries and extensions – – – – – – – – – –Production – – – – – – (7) – – (7)Sales of reserves-in-place – – – – – – – – – –
– – – – – 6 78 – – 84
At 31 Decemberf g
Developed – – – – 3 9 59 – – 71Undeveloped – – – – 4 9 19 – – 32
– – – – 7 18 78 – – 103
Total subsidiaries and equity-accounted entities (BP share)At 1 January
Developed 12 3 348 – 8 7 – 1 9 387Undeveloped 9 22 152 – 21 32 – – 11 248
21 25 501 – 29 39 – 1 20 635
At 31 DecemberDeveloped 14 17 316 – 9 15 59 – 7 437Undeveloped 5 6 171 – 16 27 19 – 11 257
19 23 487 – 25 43 78 – 18 693
a Proved reserves exclude royalties due to others, whether payable in cash or in kind, where the royalty owner has a direct interest in the underlying production and the option and ability to make liftingand sales arrangements independently.
b Because of rounding, some totals may not exactly agree with the sum of their counterparts.c Excludes NGLs from processing plants in which an interest is held of 13,500 barrels per day.d Includes 5 million barrels of NGL in respect of the 30% non-controlling interest in BP Trinidad and Tobago LLC.e Volumes of equity-accounted entities include volumes of equity-accounted investments of those entities.f Total proved NGL reserves held as part of our equity interest in TNK-BP is 78 million barrels, all in Russia.g Includes assets held for sale of 78 million barrels.
Financial statements
BP Annual Report and Form 20-F 2014 187
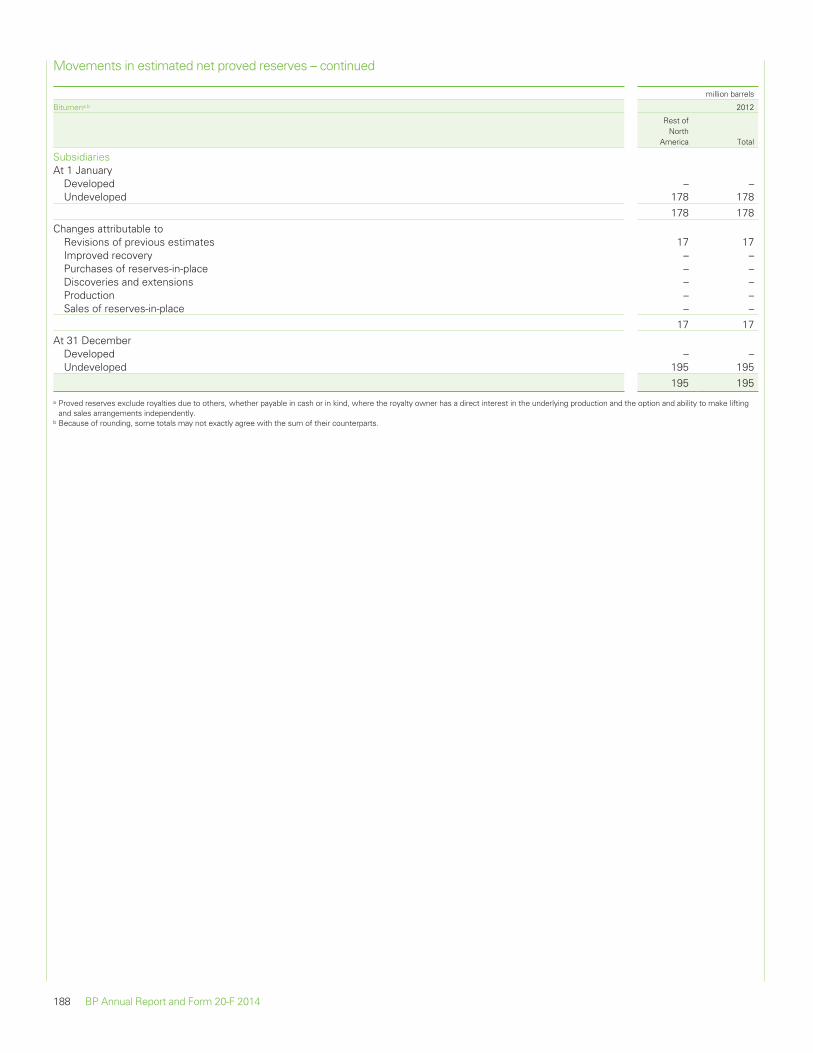
Movements in estimated net proved reserves – continued
million barrels
Bitumena b 2012
Rest ofNorth
America Total
SubsidiariesAt 1 January
Developed – –Undeveloped 178 178
178 178Changes attributable to
Revisions of previous estimates 17 17Improved recovery – –Purchases of reserves-in-place – –Discoveries and extensions – –Production – –Sales of reserves-in-place – –
17 17At 31 December
Developed – –Undeveloped 195 195
195 195
a Proved reserves exclude royalties due to others, whether payable in cash or in kind, where the royalty owner has a direct interest in the underlying production and the option and ability to make liftingand sales arrangements independently.
b Because of rounding, some totals may not exactly agree with the sum of their counterparts.
188 BP Annual Report and Form 20-F 2014
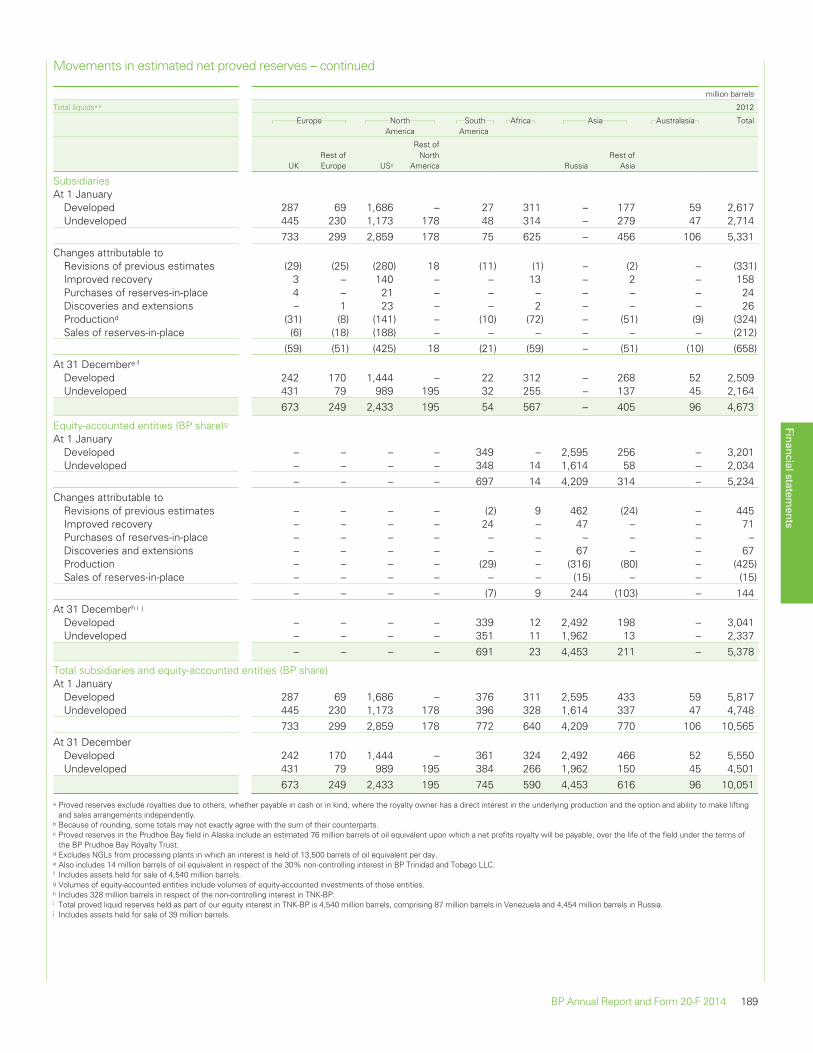
Movements in estimated net proved reserves – continued
million barrels
Total liquidsa b 2012
Europe NorthAmerica
SouthAmerica
Africa Asia Australasia Total
UKRest ofEurope USc
Rest ofNorth
America RussiaRest of
Asia
SubsidiariesAt 1 January
Developed 287 69 1,686 – 27 311 – 177 59 2,617Undeveloped 445 230 1,173 178 48 314 – 279 47 2,714
733 299 2,859 178 75 625 – 456 106 5,331Changes attributable to
Revisions of previous estimates (29) (25) (280) 18 (11) (1) – (2) – (331)Improved recovery 3 – 140 – – 13 – 2 – 158Purchases of reserves-in-place 4 – 21 – – – – – – 24Discoveries and extensions – 1 23 – – 2 – – – 26Productiond (31) (8) (141) – (10) (72) – (51) (9) (324)Sales of reserves-in-place (6) (18) (188) – – – – – – (212)
(59) (51) (425) 18 (21) (59) – (51) (10) (658)At 31 Decembere f
Developed 242 170 1,444 – 22 312 – 268 52 2,509Undeveloped 431 79 989 195 32 255 – 137 45 2,164
673 249 2,433 195 54 567 – 405 96 4,673
Equity-accounted entities (BP share)gAt 1 January
Developed – – – – 349 – 2,595 256 – 3,201Undeveloped – – – – 348 14 1,614 58 – 2,034
– – – – 697 14 4,209 314 – 5,234Changes attributable to
Revisions of previous estimates – – – – (2) 9 462 (24) – 445Improved recovery – – – – 24 – 47 – – 71Purchases of reserves-in-place – – – – – – – – – –Discoveries and extensions – – – – – – 67 – – 67Production – – – – (29) – (316) (80) – (425)Sales of reserves-in-place – – – – – – (15) – – (15)
– – – – (7) 9 244 (103) – 144At 31 Decemberh i j
Developed – – – – 339 12 2,492 198 – 3,041Undeveloped – – – – 351 11 1,962 13 – 2,337
– – – – 691 23 4,453 211 – 5,378
Total subsidiaries and equity-accounted entities (BP share)At 1 January
Developed 287 69 1,686 – 376 311 2,595 433 59 5,817Undeveloped 445 230 1,173 178 396 328 1,614 337 47 4,748
733 299 2,859 178 772 640 4,209 770 106 10,565At 31 December
Developed 242 170 1,444 – 361 324 2,492 466 52 5,550Undeveloped 431 79 989 195 384 266 1,962 150 45 4,501
673 249 2,433 195 745 590 4,453 616 96 10,051
a Proved reserves exclude royalties due to others, whether payable in cash or in kind, where the royalty owner has a direct interest in the underlying production and the option and ability to make liftingand sales arrangements independently.
b Because of rounding, some totals may not exactly agree with the sum of their counterparts.c Proved reserves in the Prudhoe Bay field in Alaska include an estimated 76 million barrels of oil equivalent upon which a net profits royalty will be payable, over the life of the field under the terms of
the BP Prudhoe Bay Royalty Trust.d Excludes NGLs from processing plants in which an interest is held of 13,500 barrels of oil equivalent per day.e Also includes 14 million barrels of oil equivalent in respect of the 30% non-controlling interest in BP Trinidad and Tobago LLC.f Includes assets held for sale of 4,540 million barrels.g Volumes of equity-accounted entities include volumes of equity-accounted investments of those entities.h Includes 328 million barrels in respect of the non-controlling interest in TNK-BP.i Total proved liquid reserves held as part of our equity interest in TNK-BP is 4,540 million barrels, comprising 87 million barrels in Venezuela and 4,454 million barrels in Russia.j Includes assets held for sale of 39 million barrels.
Financial statements
BP Annual Report and Form 20-F 2014 189
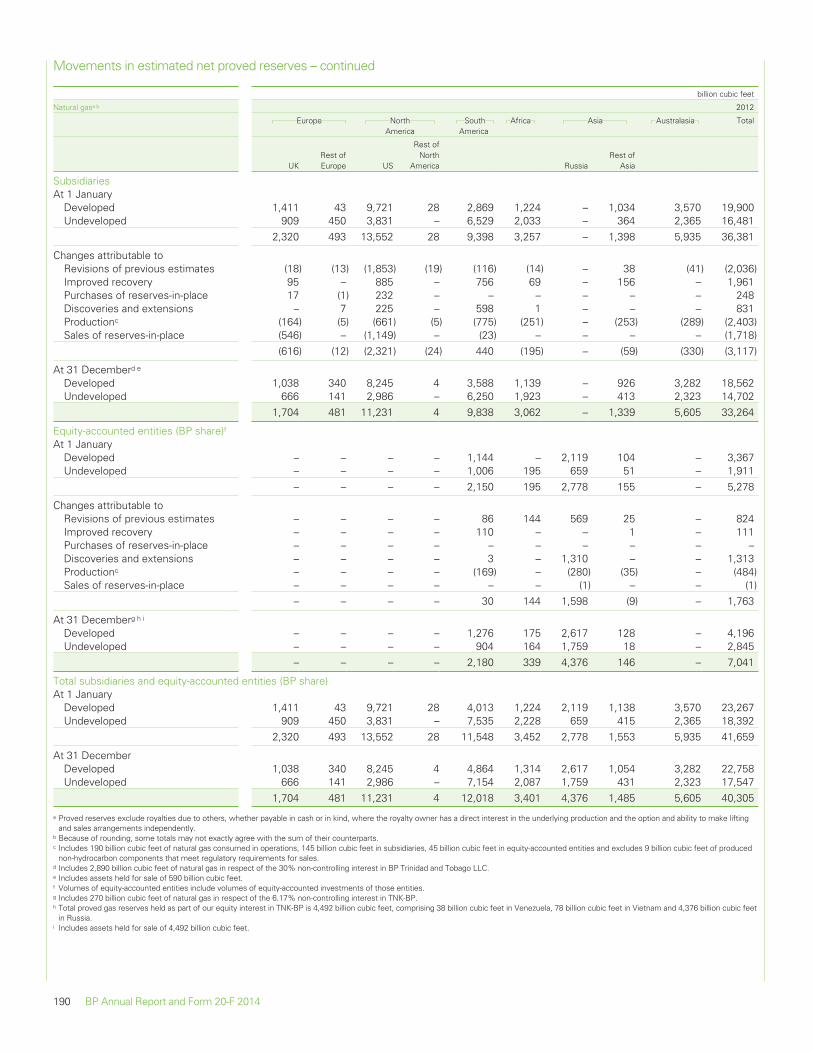
Movements in estimated net proved reserves – continued
billion cubic feet
Natural gasa b 2012
Europe NorthAmerica
SouthAmerica
Africa Asia Australasia Total
UKRest ofEurope US
Rest ofNorth
America RussiaRest of
Asia
SubsidiariesAt 1 January
Developed 1,411 43 9,721 28 2,869 1,224 – 1,034 3,570 19,900Undeveloped 909 450 3,831 – 6,529 2,033 – 364 2,365 16,481
2,320 493 13,552 28 9,398 3,257 – 1,398 5,935 36,381
Changes attributable toRevisions of previous estimates (18) (13) (1,853) (19) (116) (14) – 38 (41) (2,036)Improved recovery 95 – 885 – 756 69 – 156 – 1,961Purchases of reserves-in-place 17 (1) 232 – – – – – – 248Discoveries and extensions – 7 225 – 598 1 – – – 831Productionc (164) (5) (661) (5) (775) (251) – (253) (289) (2,403)Sales of reserves-in-place (546) – (1,149) – (23) – – – – (1,718)
(616) (12) (2,321) (24) 440 (195) – (59) (330) (3,117)
At 31 Decemberd e
Developed 1,038 340 8,245 4 3,588 1,139 – 926 3,282 18,562Undeveloped 666 141 2,986 – 6,250 1,923 – 413 2,323 14,702
1,704 481 11,231 4 9,838 3,062 – 1,339 5,605 33,264
Equity-accounted entities (BP share)fAt 1 January
Developed – – – – 1,144 – 2,119 104 – 3,367Undeveloped – – – – 1,006 195 659 51 – 1,911
– – – – 2,150 195 2,778 155 – 5,278
Changes attributable toRevisions of previous estimates – – – – 86 144 569 25 – 824Improved recovery – – – – 110 – – 1 – 111Purchases of reserves-in-place – – – – – – – – – –Discoveries and extensions – – – – 3 – 1,310 – – 1,313Productionc – – – – (169) – (280) (35) – (484)Sales of reserves-in-place – – – – – – (1) – – (1)
– – – – 30 144 1,598 (9) – 1,763
At 31 Decemberg h i
Developed – – – – 1,276 175 2,617 128 – 4,196Undeveloped – – – – 904 164 1,759 18 – 2,845
– – – – 2,180 339 4,376 146 – 7,041
Total subsidiaries and equity-accounted entities (BP share)At 1 January
Developed 1,411 43 9,721 28 4,013 1,224 2,119 1,138 3,570 23,267Undeveloped 909 450 3,831 – 7,535 2,228 659 415 2,365 18,392
2,320 493 13,552 28 11,548 3,452 2,778 1,553 5,935 41,659
At 31 DecemberDeveloped 1,038 340 8,245 4 4,864 1,314 2,617 1,054 3,282 22,758Undeveloped 666 141 2,986 – 7,154 2,087 1,759 431 2,323 17,547
1,704 481 11,231 4 12,018 3,401 4,376 1,485 5,605 40,305
a Proved reserves exclude royalties due to others, whether payable in cash or in kind, where the royalty owner has a direct interest in the underlying production and the option and ability to make liftingand sales arrangements independently.
b Because of rounding, some totals may not exactly agree with the sum of their counterparts.c Includes 190 billion cubic feet of natural gas consumed in operations, 145 billion cubic feet in subsidiaries, 45 billion cubic feet in equity-accounted entities and excludes 9 billion cubic feet of produced
non-hydrocarbon components that meet regulatory requirements for sales.d Includes 2,890 billion cubic feet of natural gas in respect of the 30% non-controlling interest in BP Trinidad and Tobago LLC.e Includes assets held for sale of 590 billion cubic feet.f Volumes of equity-accounted entities include volumes of equity-accounted investments of those entities.g Includes 270 billion cubic feet of natural gas in respect of the 6.17% non-controlling interest in TNK-BP.h Total proved gas reserves held as part of our equity interest in TNK-BP is 4,492 billion cubic feet, comprising 38 billion cubic feet in Venezuela, 78 billion cubic feet in Vietnam and 4,376 billion cubic feet
in Russia.i Includes assets held for sale of 4,492 billion cubic feet.
190 BP Annual Report and Form 20-F 2014
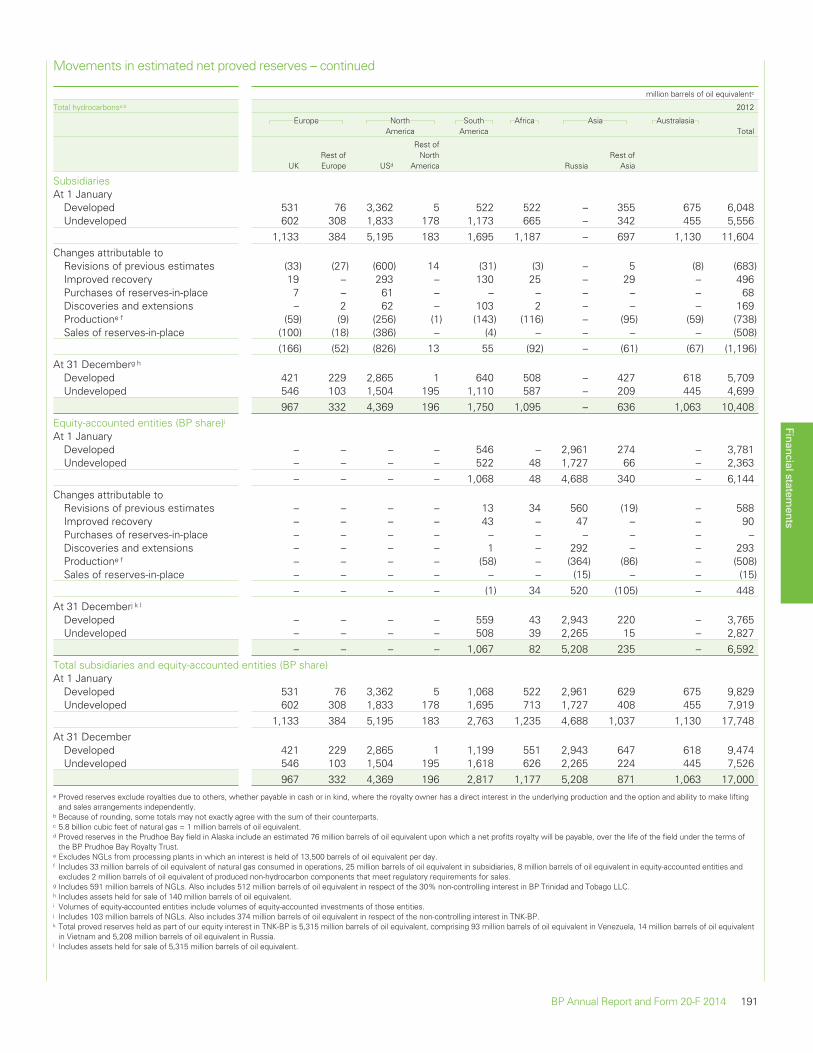
Movements in estimated net proved reserves – continued
million barrels of oil equivalentc
Total hydrocarbonsa b 2012
Europe NorthAmerica
SouthAmerica
Africa Asia AustralasiaTotal
UKRest ofEurope USd
Rest ofNorth
America RussiaRest of
Asia
SubsidiariesAt 1 January
Developed 531 76 3,362 5 522 522 – 355 675 6,048Undeveloped 602 308 1,833 178 1,173 665 – 342 455 5,556
1,133 384 5,195 183 1,695 1,187 – 697 1,130 11,604Changes attributable to
Revisions of previous estimates (33) (27) (600) 14 (31) (3) – 5 (8) (683)Improved recovery 19 – 293 – 130 25 – 29 – 496Purchases of reserves-in-place 7 – 61 – – – – – – 68Discoveries and extensions – 2 62 – 103 2 – – – 169Productione f (59) (9) (256) (1) (143) (116) – (95) (59) (738)Sales of reserves-in-place (100) (18) (386) – (4) – – – – (508)
(166) (52) (826) 13 55 (92) – (61) (67) (1,196)At 31 Decemberg h
Developed 421 229 2,865 1 640 508 – 427 618 5,709Undeveloped 546 103 1,504 195 1,110 587 – 209 445 4,699
967 332 4,369 196 1,750 1,095 – 636 1,063 10,408Equity-accounted entities (BP share)iAt 1 January
Developed – – – – 546 – 2,961 274 – 3,781Undeveloped – – – – 522 48 1,727 66 – 2,363
– – – – 1,068 48 4,688 340 – 6,144Changes attributable to
Revisions of previous estimates – – – – 13 34 560 (19) – 588Improved recovery – – – – 43 – 47 – – 90Purchases of reserves-in-place – – – – – – – – – –Discoveries and extensions – – – – 1 – 292 – – 293Productione f – – – – (58) – (364) (86) – (508)Sales of reserves-in-place – – – – – – (15) – – (15)
– – – – (1) 34 520 (105) – 448At 31 Decemberj k l
Developed – – – – 559 43 2,943 220 – 3,765Undeveloped – – – – 508 39 2,265 15 – 2,827
– – – – 1,067 82 5,208 235 – 6,592Total subsidiaries and equity-accounted entities (BP share)At 1 January
Developed 531 76 3,362 5 1,068 522 2,961 629 675 9,829Undeveloped 602 308 1,833 178 1,695 713 1,727 408 455 7,919
1,133 384 5,195 183 2,763 1,235 4,688 1,037 1,130 17,748At 31 December
Developed 421 229 2,865 1 1,199 551 2,943 647 618 9,474Undeveloped 546 103 1,504 195 1,618 626 2,265 224 445 7,526
967 332 4,369 196 2,817 1,177 5,208 871 1,063 17,000a Proved reserves exclude royalties due to others, whether payable in cash or in kind, where the royalty owner has a direct interest in the underlying production and the option and ability to make lifting
and sales arrangements independently.b Because of rounding, some totals may not exactly agree with the sum of their counterparts.c 5.8 billion cubic feet of natural gas = 1 million barrels of oil equivalent.d Proved reserves in the Prudhoe Bay field in Alaska include an estimated 76 million barrels of oil equivalent upon which a net profits royalty will be payable, over the life of the field under the terms of
the BP Prudhoe Bay Royalty Trust.e Excludes NGLs from processing plants in which an interest is held of 13,500 barrels of oil equivalent per day.f Includes 33 million barrels of oil equivalent of natural gas consumed in operations, 25 million barrels of oil equivalent in subsidiaries, 8 million barrels of oil equivalent in equity-accounted entities and
excludes 2 million barrels of oil equivalent of produced non-hydrocarbon components that meet regulatory requirements for sales.g Includes 591 million barrels of NGLs. Also includes 512 million barrels of oil equivalent in respect of the 30% non-controlling interest in BP Trinidad and Tobago LLC.h Includes assets held for sale of 140 million barrels of oil equivalent.i Volumes of equity-accounted entities include volumes of equity-accounted investments of those entities.j Includes 103 million barrels of NGLs. Also includes 374 million barrels of oil equivalent in respect of the non-controlling interest in TNK-BP.k Total proved reserves held as part of our equity interest in TNK-BP is 5,315 million barrels of oil equivalent, comprising 93 million barrels of oil equivalent in Venezuela, 14 million barrels of oil equivalent
in Vietnam and 5,208 million barrels of oil equivalent in Russia.l Includes assets held for sale of 5,315 million barrels of oil equivalent.
Financial statements
BP Annual Report and Form 20-F 2014 191
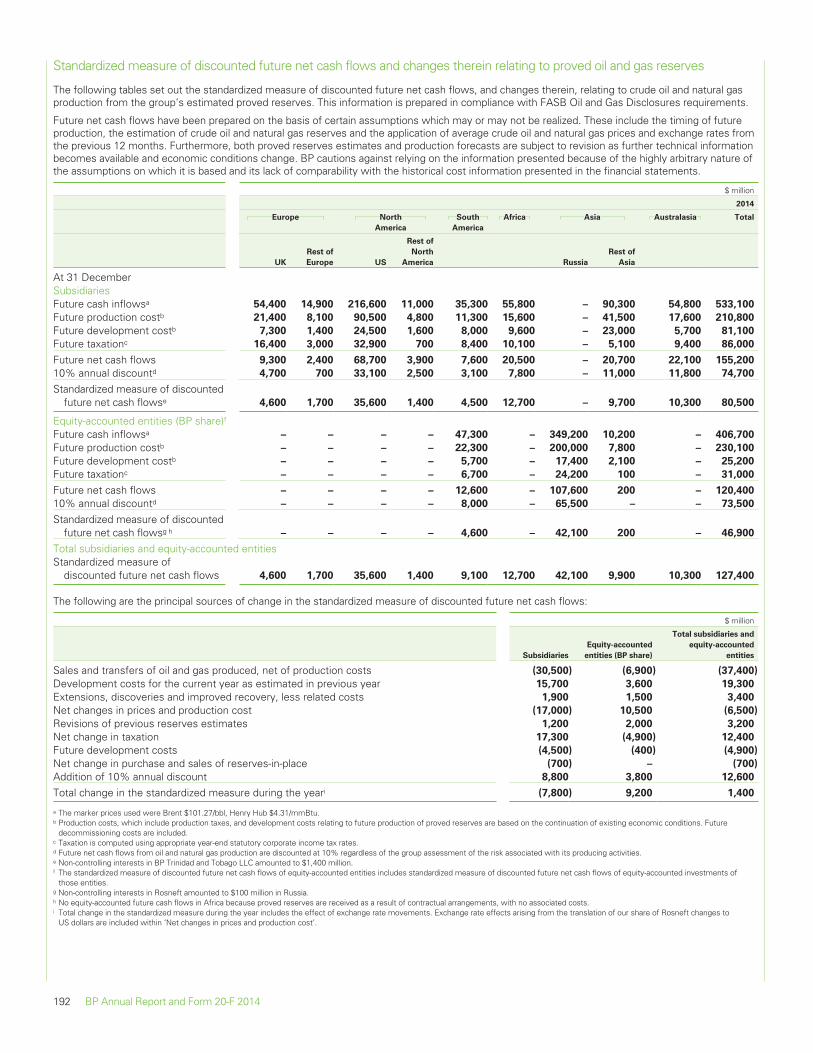
Standardized measure of discounted future net cash flows and changes therein relating to proved oil and gas reserves
The following tables set out the standardized measure of discounted future net cash flows, and changes therein, relating to crude oil and natural gasproduction from the group’s estimated proved reserves. This information is prepared in compliance with FASB Oil and Gas Disclosures requirements.
Future net cash flows have been prepared on the basis of certain assumptions which may or may not be realized. These include the timing of futureproduction, the estimation of crude oil and natural gas reserves and the application of average crude oil and natural gas prices and exchange rates fromthe previous 12 months. Furthermore, both proved reserves estimates and production forecasts are subject to revision as further technical informationbecomes available and economic conditions change. BP cautions against relying on the information presented because of the highly arbitrary nature ofthe assumptions on which it is based and its lack of comparability with the historical cost information presented in the financial statements.
$ million
2014
Europe North
America
South
America
Africa Asia Australasia Total
UK
Rest of
Europe US
Rest of
North
America Russia
Rest of
Asia
At 31 DecemberSubsidiariesFuture cash inflowsa 54,400 14,900 216,600 11,000 35,300 55,800 – 90,300 54,800 533,100
Future production costb 21,400 8,100 90,500 4,800 11,300 15,600 – 41,500 17,600 210,800
Future development costb 7,300 1,400 24,500 1,600 8,000 9,600 – 23,000 5,700 81,100
Future taxationc 16,400 3,000 32,900 700 8,400 10,100 – 5,100 9,400 86,000
Future net cash flows 9,300 2,400 68,700 3,900 7,600 20,500 – 20,700 22,100 155,200
10% annual discountd 4,700 700 33,100 2,500 3,100 7,800 – 11,000 11,800 74,700
Standardized measure of discountedfuture net cash flowse 4,600 1,700 35,600 1,400 4,500 12,700 – 9,700 10,300 80,500
Equity-accounted entities (BP share)fFuture cash inflowsa – – – – 47,300 – 349,200 10,200 – 406,700
Future production costb – – – – 22,300 – 200,000 7,800 – 230,100
Future development costb – – – – 5,700 – 17,400 2,100 – 25,200
Future taxationc – – – – 6,700 – 24,200 100 – 31,000
Future net cash flows – – – – 12,600 – 107,600 200 – 120,400
10% annual discountd – – – – 8,000 – 65,500 – – 73,500
Standardized measure of discountedfuture net cash flowsg h – – – – 4,600 – 42,100 200 – 46,900
Total subsidiaries and equity-accounted entitiesStandardized measure of
discounted future net cash flows 4,600 1,700 35,600 1,400 9,100 12,700 42,100 9,900 10,300 127,400
The following are the principal sources of change in the standardized measure of discounted future net cash flows:
$ million
Subsidiaries
Equity-accounted
entities (BP share)
Total subsidiaries and
equity-accounted
entities
Sales and transfers of oil and gas produced, net of production costs (30,500) (6,900) (37,400)
Development costs for the current year as estimated in previous year 15,700 3,600 19,300
Extensions, discoveries and improved recovery, less related costs 1,900 1,500 3,400
Net changes in prices and production cost (17,000) 10,500 (6,500)
Revisions of previous reserves estimates 1,200 2,000 3,200
Net change in taxation 17,300 (4,900) 12,400
Future development costs (4,500) (400) (4,900)
Net change in purchase and sales of reserves-in-place (700) – (700)
Addition of 10% annual discount 8,800 3,800 12,600
Total change in the standardized measure during the yeari (7,800) 9,200 1,400
a The marker prices used were Brent $101.27/bbl, Henry Hub $4.31/mmBtu.b Production costs, which include production taxes, and development costs relating to future production of proved reserves are based on the continuation of existing economic conditions. Future
decommissioning costs are included.c Taxation is computed using appropriate year-end statutory corporate income tax rates.d Future net cash flows from oil and natural gas production are discounted at 10% regardless of the group assessment of the risk associated with its producing activities.e Non-controlling interests in BP Trinidad and Tobago LLC amounted to $1,400 million.f The standardized measure of discounted future net cash flows of equity-accounted entities includes standardized measure of discounted future net cash flows of equity-accounted investments of
those entities.g Non-controlling interests in Rosneft amounted to $100 million in Russia.h No equity-accounted future cash flows in Africa because proved reserves are received as a result of contractual arrangements, with no associated costs.i Total change in the standardized measure during the year includes the effect of exchange rate movements. Exchange rate effects arising from the translation of our share of Rosneft changes to
US dollars are included within ‘Net changes in prices and production cost’.
192 BP Annual Report and Form 20-F 2014
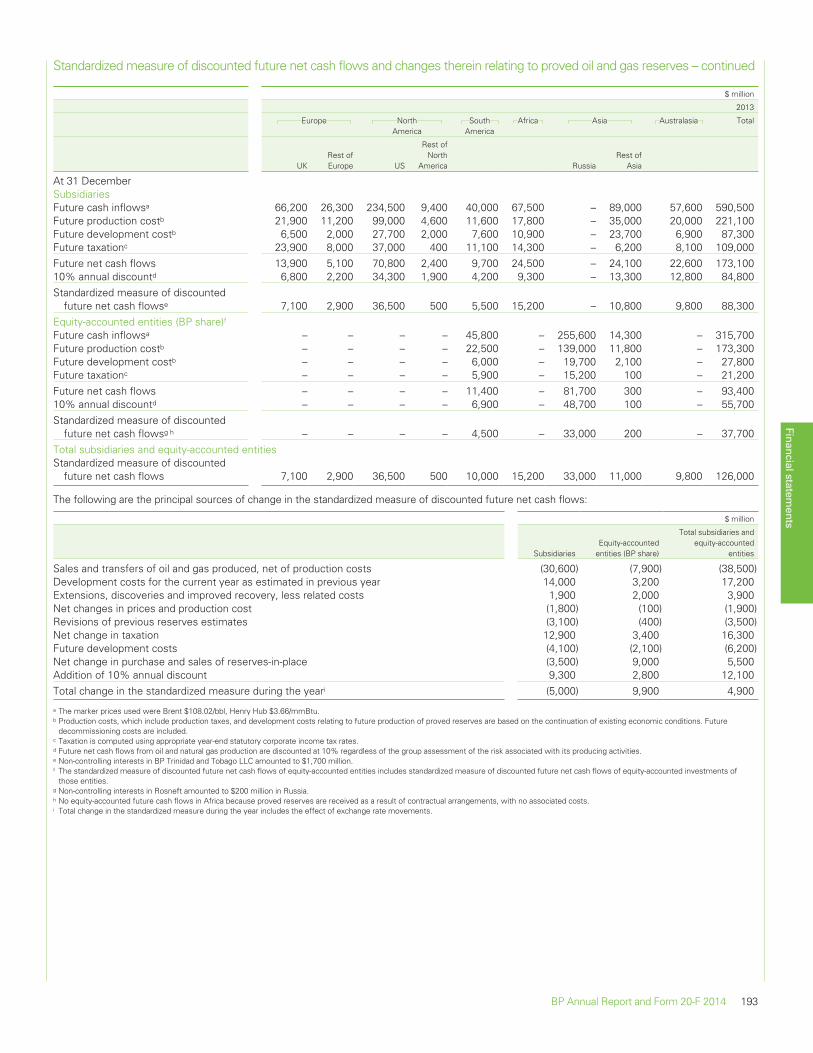
Standardized measure of discounted future net cash flows and changes therein relating to proved oil and gas reserves – continued
$ million
2013
Europe NorthAmerica
SouthAmerica
Africa Asia Australasia Total
UKRest ofEurope US
Rest ofNorth
America RussiaRest of
Asia
At 31 DecemberSubsidiariesFuture cash inflowsa 66,200 26,300 234,500 9,400 40,000 67,500 – 89,000 57,600 590,500Future production costb 21,900 11,200 99,000 4,600 11,600 17,800 – 35,000 20,000 221,100Future development costb 6,500 2,000 27,700 2,000 7,600 10,900 – 23,700 6,900 87,300Future taxationc 23,900 8,000 37,000 400 11,100 14,300 – 6,200 8,100 109,000Future net cash flows 13,900 5,100 70,800 2,400 9,700 24,500 – 24,100 22,600 173,10010% annual discountd 6,800 2,200 34,300 1,900 4,200 9,300 – 13,300 12,800 84,800Standardized measure of discounted
future net cash flowse 7,100 2,900 36,500 500 5,500 15,200 – 10,800 9,800 88,300Equity-accounted entities (BP share)fFuture cash inflowsa – – – – 45,800 – 255,600 14,300 – 315,700Future production costb – – – – 22,500 – 139,000 11,800 – 173,300Future development costb – – – – 6,000 – 19,700 2,100 – 27,800Future taxationc – – – – 5,900 – 15,200 100 – 21,200Future net cash flows – – – – 11,400 – 81,700 300 – 93,40010% annual discountd – – – – 6,900 – 48,700 100 – 55,700Standardized measure of discounted
future net cash flowsg h – – – – 4,500 – 33,000 200 – 37,700Total subsidiaries and equity-accounted entitiesStandardized measure of discounted
future net cash flows 7,100 2,900 36,500 500 10,000 15,200 33,000 11,000 9,800 126,000
The following are the principal sources of change in the standardized measure of discounted future net cash flows:
$ million
SubsidiariesEquity-accounted
entities (BP share)
Total subsidiaries andequity-accounted
entities
Sales and transfers of oil and gas produced, net of production costs (30,600) (7,900) (38,500)Development costs for the current year as estimated in previous year 14,000 3,200 17,200Extensions, discoveries and improved recovery, less related costs 1,900 2,000 3,900Net changes in prices and production cost (1,800) (100) (1,900)Revisions of previous reserves estimates (3,100) (400) (3,500)Net change in taxation 12,900 3,400 16,300Future development costs (4,100) (2,100) (6,200)Net change in purchase and sales of reserves-in-place (3,500) 9,000 5,500Addition of 10% annual discount 9,300 2,800 12,100Total change in the standardized measure during the yeari (5,000) 9,900 4,900
a The marker prices used were Brent $108.02/bbl, Henry Hub $3.66/mmBtu.b Production costs, which include production taxes, and development costs relating to future production of proved reserves are based on the continuation of existing economic conditions. Future
decommissioning costs are included.c Taxation is computed using appropriate year-end statutory corporate income tax rates.d Future net cash flows from oil and natural gas production are discounted at 10% regardless of the group assessment of the risk associated with its producing activities.e Non-controlling interests in BP Trinidad and Tobago LLC amounted to $1,700 million.f The standardized measure of discounted future net cash flows of equity-accounted entities includes standardized measure of discounted future net cash flows of equity-accounted investments of
those entities.g Non-controlling interests in Rosneft amounted to $200 million in Russia.h No equity-accounted future cash flows in Africa because proved reserves are received as a result of contractual arrangements, with no associated costs.i Total change in the standardized measure during the year includes the effect of exchange rate movements.
Financial statements
BP Annual Report and Form 20-F 2014 193
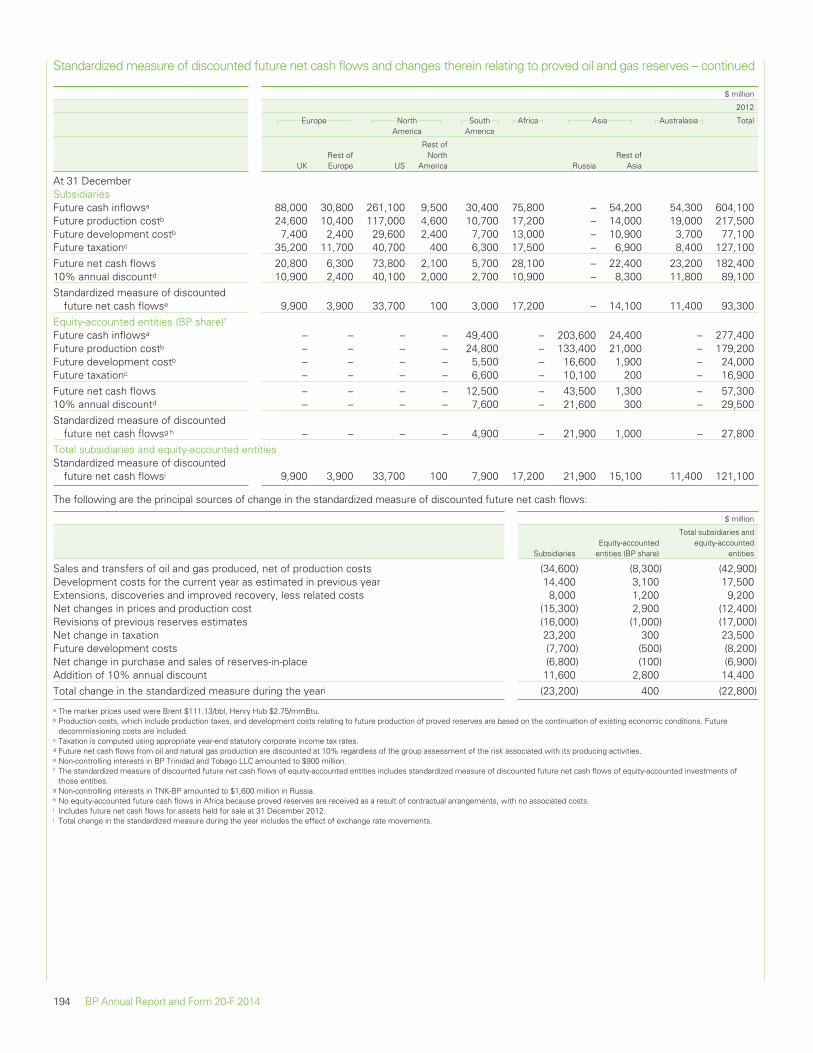
Standardized measure of discounted future net cash flows and changes therein relating to proved oil and gas reserves – continued
$ million
2012
Europe NorthAmerica
SouthAmerica
Africa Asia Australasia Total
UKRest ofEurope US
Rest ofNorth
America RussiaRest of
Asia
At 31 DecemberSubsidiariesFuture cash inflowsa 88,000 30,800 261,100 9,500 30,400 75,800 – 54,200 54,300 604,100Future production costb 24,600 10,400 117,000 4,600 10,700 17,200 – 14,000 19,000 217,500Future development costb 7,400 2,400 29,600 2,400 7,700 13,000 – 10,900 3,700 77,100Future taxationc 35,200 11,700 40,700 400 6,300 17,500 – 6,900 8,400 127,100Future net cash flows 20,800 6,300 73,800 2,100 5,700 28,100 – 22,400 23,200 182,40010% annual discountd 10,900 2,400 40,100 2,000 2,700 10,900 – 8,300 11,800 89,100Standardized measure of discounted
future net cash flowse 9,900 3,900 33,700 100 3,000 17,200 – 14,100 11,400 93,300Equity-accounted entities (BP share)fFuture cash inflowsa – – – – 49,400 – 203,600 24,400 – 277,400Future production costb – – – – 24,800 – 133,400 21,000 – 179,200Future development costb – – – – 5,500 – 16,600 1,900 – 24,000Future taxationc – – – – 6,600 – 10,100 200 – 16,900Future net cash flows – – – – 12,500 – 43,500 1,300 – 57,30010% annual discountd – – – – 7,600 – 21,600 300 – 29,500Standardized measure of discounted
future net cash flowsg h – – – – 4,900 – 21,900 1,000 – 27,800Total subsidiaries and equity-accounted entitiesStandardized measure of discounted
future net cash flowsi 9,900 3,900 33,700 100 7,900 17,200 21,900 15,100 11,400 121,100
The following are the principal sources of change in the standardized measure of discounted future net cash flows:
$ million
SubsidiariesEquity-accounted
entities (BP share)
Total subsidiaries andequity-accounted
entities
Sales and transfers of oil and gas produced, net of production costs (34,600) (8,300) (42,900)Development costs for the current year as estimated in previous year 14,400 3,100 17,500Extensions, discoveries and improved recovery, less related costs 8,000 1,200 9,200Net changes in prices and production cost (15,300) 2,900 (12,400)Revisions of previous reserves estimates (16,000) (1,000) (17,000)Net change in taxation 23,200 300 23,500Future development costs (7,700) (500) (8,200)Net change in purchase and sales of reserves-in-place (6,800) (100) (6,900)Addition of 10% annual discount 11,600 2,800 14,400Total change in the standardized measure during the yearj (23,200) 400 (22,800)
a The marker prices used were Brent $111.13/bbl, Henry Hub $2.75/mmBtu.b Production costs, which include production taxes, and development costs relating to future production of proved reserves are based on the continuation of existing economic conditions. Future
decommissioning costs are included.c Taxation is computed using appropriate year-end statutory corporate income tax rates.d Future net cash flows from oil and natural gas production are discounted at 10% regardless of the group assessment of the risk associated with its producing activities.e Non-controlling interests in BP Trinidad and Tobago LLC amounted to $900 million.f The standardized measure of discounted future net cash flows of equity-accounted entities includes standardized measure of discounted future net cash flows of equity-accounted investments of
those entities.g Non-controlling interests in TNK-BP amounted to $1,600 million in Russia.h No equity-accounted future cash flows in Africa because proved reserves are received as a result of contractual arrangements, with no associated costs.i Includes future net cash flows for assets held for sale at 31 December 2012.j Total change in the standardized measure during the year includes the effect of exchange rate movements.
194 BP Annual Report and Form 20-F 2014
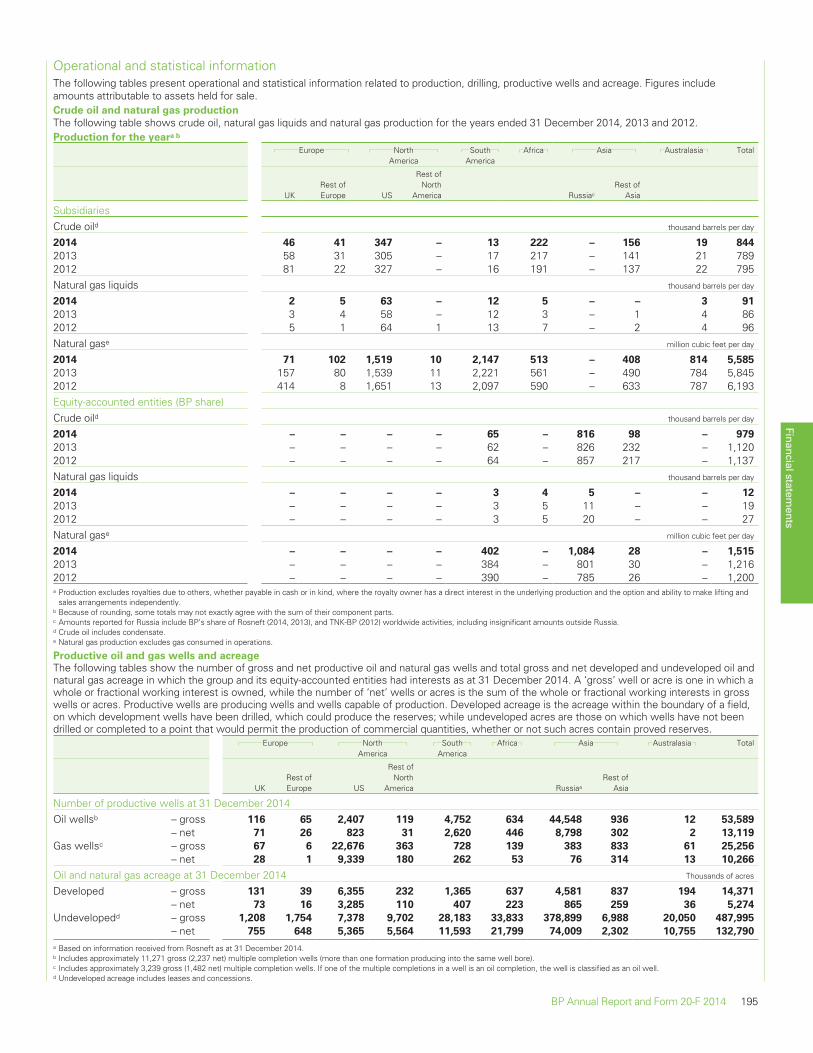
Operational and statistical informationThe following tables present operational and statistical information related to production, drilling, productive wells and acreage. Figures includeamounts attributable to assets held for sale.Crude oil and natural gas production
The following table shows crude oil, natural gas liquids and natural gas production for the years ended 31 December 2014, 2013 and 2012.Production for the yeara b
Europe NorthAmerica
SouthAmerica
Africa Asia Australasia Total
UKRest ofEurope US
Rest ofNorth
America Russiac
Rest ofAsia
SubsidiariesCrude oild thousand barrels per day
2014 46 41 347 – 13 222 – 156 19 844
2013 58 31 305 – 17 217 – 141 21 7892012 81 22 327 – 16 191 – 137 22 795Natural gas liquids thousand barrels per day
2014 2 5 63 – 12 5 – – 3 91
2013 3 4 58 – 12 3 – 1 4 862012 5 1 64 1 13 7 – 2 4 96Natural gase million cubic feet per day
2014 71 102 1,519 10 2,147 513 – 408 814 5,585
2013 157 80 1,539 11 2,221 561 – 490 784 5,8452012 414 8 1,651 13 2,097 590 – 633 787 6,193Equity-accounted entities (BP share)Crude oild thousand barrels per day
2014 – – – – 65 – 816 98 – 979
2013 – – – – 62 – 826 232 – 1,1202012 – – – – 64 – 857 217 – 1,137Natural gas liquids thousand barrels per day
2014 – – – – 3 4 5 – – 12
2013 – – – – 3 5 11 – – 192012 – – – – 3 5 20 – – 27Natural gase million cubic feet per day
2014 – – – – 402 – 1,084 28 – 1,515
2013 – – – – 384 – 801 30 – 1,2162012 – – – – 390 – 785 26 – 1,200a Production excludes royalties due to others, whether payable in cash or in kind, where the royalty owner has a direct interest in the underlying production and the option and ability to make lifting and
sales arrangements independently.b Because of rounding, some totals may not exactly agree with the sum of their component parts.c Amounts reported for Russia include BP’s share of Rosneft (2014, 2013), and TNK-BP (2012) worldwide activities, including insignificant amounts outside Russia.d Crude oil includes condensate.e Natural gas production excludes gas consumed in operations.
Productive oil and gas wells and acreage
The following tables show the number of gross and net productive oil and natural gas wells and total gross and net developed and undeveloped oil andnatural gas acreage in which the group and its equity-accounted entities had interests as at 31 December 2014. A ‘gross’ well or acre is one in which awhole or fractional working interest is owned, while the number of ‘net’ wells or acres is the sum of the whole or fractional working interests in grosswells or acres. Productive wells are producing wells and wells capable of production. Developed acreage is the acreage within the boundary of a field,on which development wells have been drilled, which could produce the reserves; while undeveloped acres are those on which wells have not beendrilled or completed to a point that would permit the production of commercial quantities, whether or not such acres contain proved reserves.
Europe NorthAmerica
SouthAmerica
Africa Asia Australasia Total
UKRest ofEurope US
Rest ofNorth
America Russiaa
Rest ofAsia
Number of productive wells at 31 December 2014Oil wellsb – gross 116 65 2,407 119 4,752 634 44,548 936 12 53,589
– net 71 26 823 31 2,620 446 8,798 302 2 13,119
Gas wellsc – gross 67 6 22,676 363 728 139 383 833 61 25,256
– net 28 1 9,339 180 262 53 76 314 13 10,266
Oil and natural gas acreage at 31 December 2014 Thousands of acres
Developed – gross 131 39 6,355 232 1,365 637 4,581 837 194 14,371
– net 73 16 3,285 110 407 223 865 259 36 5,274
Undevelopedd – gross 1,208 1,754 7,378 9,702 28,183 33,833 378,899 6,988 20,050 487,995
– net 755 648 5,365 5,564 11,593 21,799 74,009 2,302 10,755 132,790
a Based on information received from Rosneft as at 31 December 2014.b Includes approximately 11,271 gross (2,237 net) multiple completion wells (more than one formation producing into the same well bore).c Includes approximately 3,239 gross (1,482 net) multiple completion wells. If one of the multiple completions in a well is an oil completion, the well is classified as an oil well.d Undeveloped acreage includes leases and concessions.
Financial statements
BP Annual Report and Form 20-F 2014 195
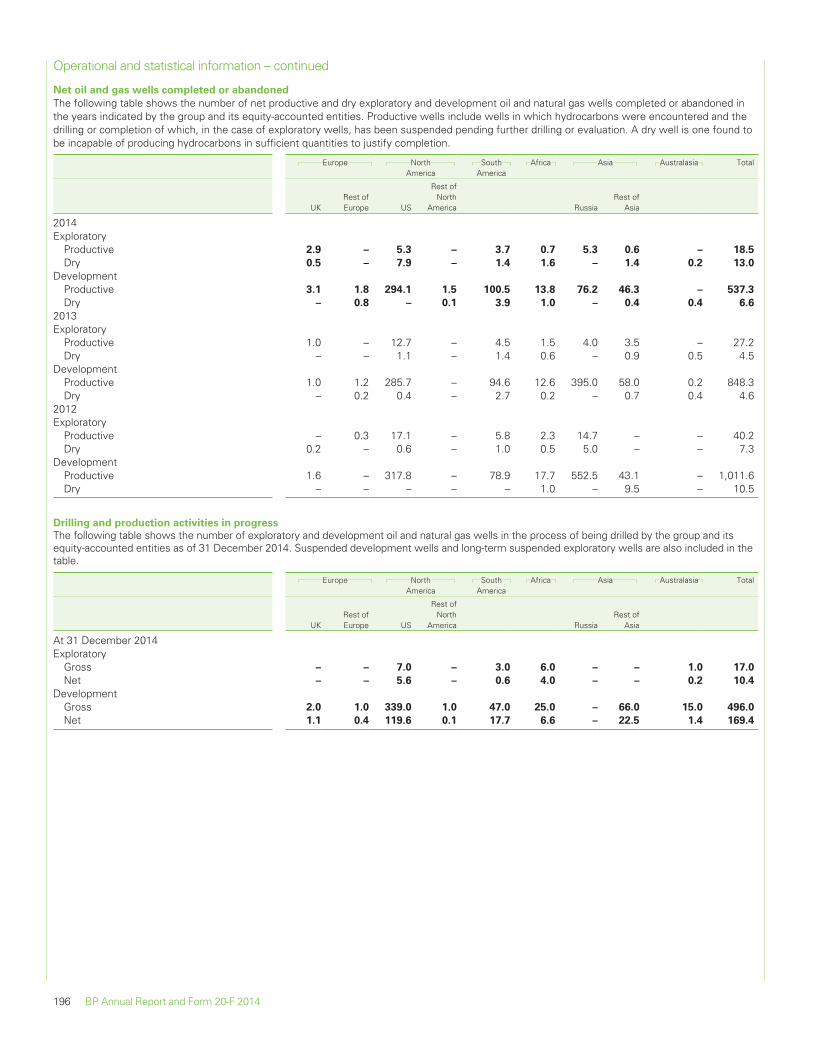
Operational and statistical information – continued
Net oil and gas wells completed or abandoned
The following table shows the number of net productive and dry exploratory and development oil and natural gas wells completed or abandoned inthe years indicated by the group and its equity-accounted entities. Productive wells include wells in which hydrocarbons were encountered and thedrilling or completion of which, in the case of exploratory wells, has been suspended pending further drilling or evaluation. A dry well is one found tobe incapable of producing hydrocarbons in sufficient quantities to justify completion.
Europe NorthAmerica
SouthAmerica
Africa Asia Australasia Total
UKRest ofEurope US
Rest ofNorth
America RussiaRest of
Asia
2014Exploratory
Productive 2.9 – 5.3 – 3.7 0.7 5.3 0.6 – 18.5
Dry 0.5 – 7.9 – 1.4 1.6 – 1.4 0.2 13.0
DevelopmentProductive 3.1 1.8 294.1 1.5 100.5 13.8 76.2 46.3 – 537.3
Dry – 0.8 – 0.1 3.9 1.0 – 0.4 0.4 6.6
2013Exploratory
Productive 1.0 – 12.7 – 4.5 1.5 4.0 3.5 – 27.2Dry – – 1.1 – 1.4 0.6 – 0.9 0.5 4.5
DevelopmentProductive 1.0 1.2 285.7 – 94.6 12.6 395.0 58.0 0.2 848.3Dry – 0.2 0.4 – 2.7 0.2 – 0.7 0.4 4.6
2012Exploratory
Productive – 0.3 17.1 – 5.8 2.3 14.7 – – 40.2Dry 0.2 – 0.6 – 1.0 0.5 5.0 – – 7.3
DevelopmentProductive 1.6 – 317.8 – 78.9 17.7 552.5 43.1 – 1,011.6Dry – – – – – 1.0 – 9.5 – 10.5
Drilling and production activities in progress
The following table shows the number of exploratory and development oil and natural gas wells in the process of being drilled by the group and itsequity-accounted entities as of 31 December 2014. Suspended development wells and long-term suspended exploratory wells are also included in thetable.
Europe NorthAmerica
SouthAmerica
Africa Asia Australasia Total
UKRest ofEurope US
Rest ofNorth
America RussiaRest of
Asia
At 31 December 2014Exploratory
Gross – – 7.0 – 3.0 6.0 – – 1.0 17.0
Net – – 5.6 – 0.6 4.0 – – 0.2 10.4
DevelopmentGross 2.0 1.0 339.0 1.0 47.0 25.0 – 66.0 15.0 496.0
Net 1.1 0.4 119.6 0.1 17.7 6.6 – 22.5 1.4 169.4
196 BP Annual Report and Form 20-F 2014
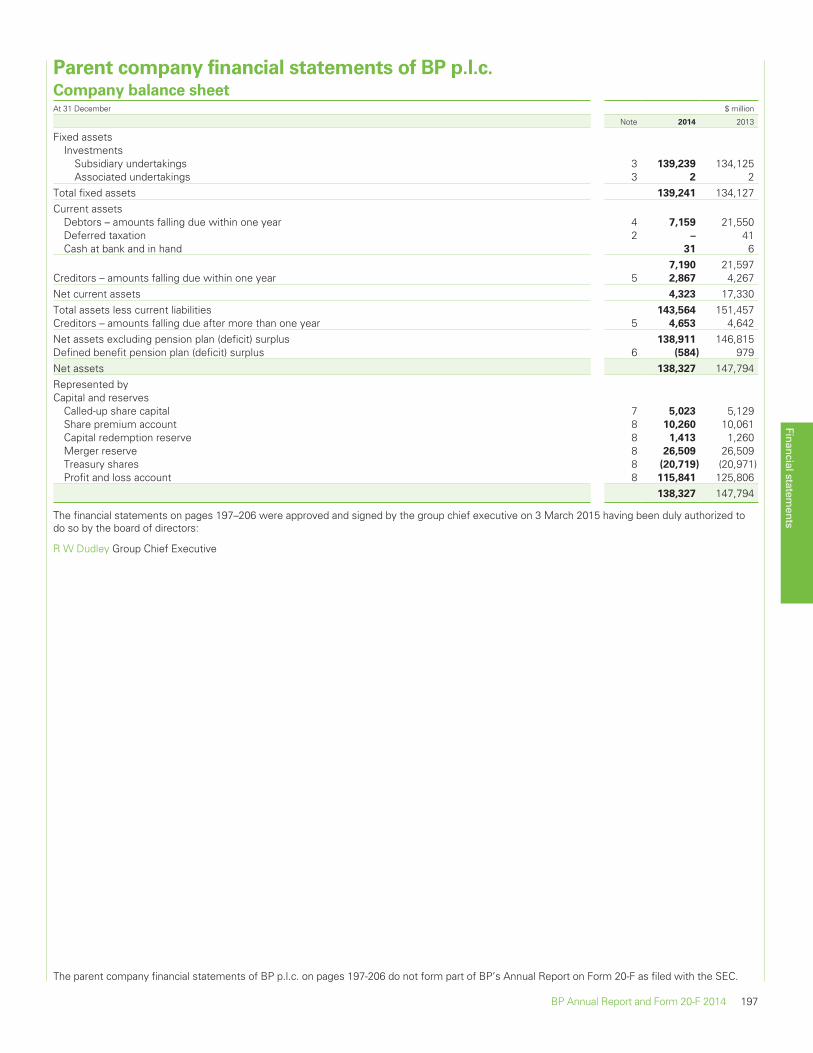
Parent company financial statements of BP p.l.c.Company balance sheetAt 31 December $ million
Note 2014 2013
Fixed assetsInvestments
Subsidiary undertakings 3 139,239 134,125Associated undertakings 3 2 2
Total fixed assets 139,241 134,127Current assets
Debtors – amounts falling due within one year 4 7,159 21,550Deferred taxation 2 – 41Cash at bank and in hand 31 6
7,190 21,597Creditors – amounts falling due within one year 5 2,867 4,267Net current assets 4,323 17,330Total assets less current liabilities 143,564 151,457Creditors – amounts falling due after more than one year 5 4,653 4,642Net assets excluding pension plan (deficit) surplus 138,911 146,815Defined benefit pension plan (deficit) surplus 6 (584) 979Net assets 138,327 147,794Represented byCapital and reserves
Called-up share capital 7 5,023 5,129Share premium account 8 10,260 10,061Capital redemption reserve 8 1,413 1,260Merger reserve 8 26,509 26,509Treasury shares 8 (20,719) (20,971)Profit and loss account 8 115,841 125,806
138,327 147,794
The financial statements on pages 197–206 were approved and signed by the group chief executive on 3 March 2015 having been duly authorized todo so by the board of directors:
R W Dudley Group Chief Executive
The parent company financial statements of BP p.l.c. on pages 197-206 do not form part of BP’s Annual Report on Form 20-F as filed with the SEC.
Financial statements
BP Annual Report and Form 20-F 2014 197
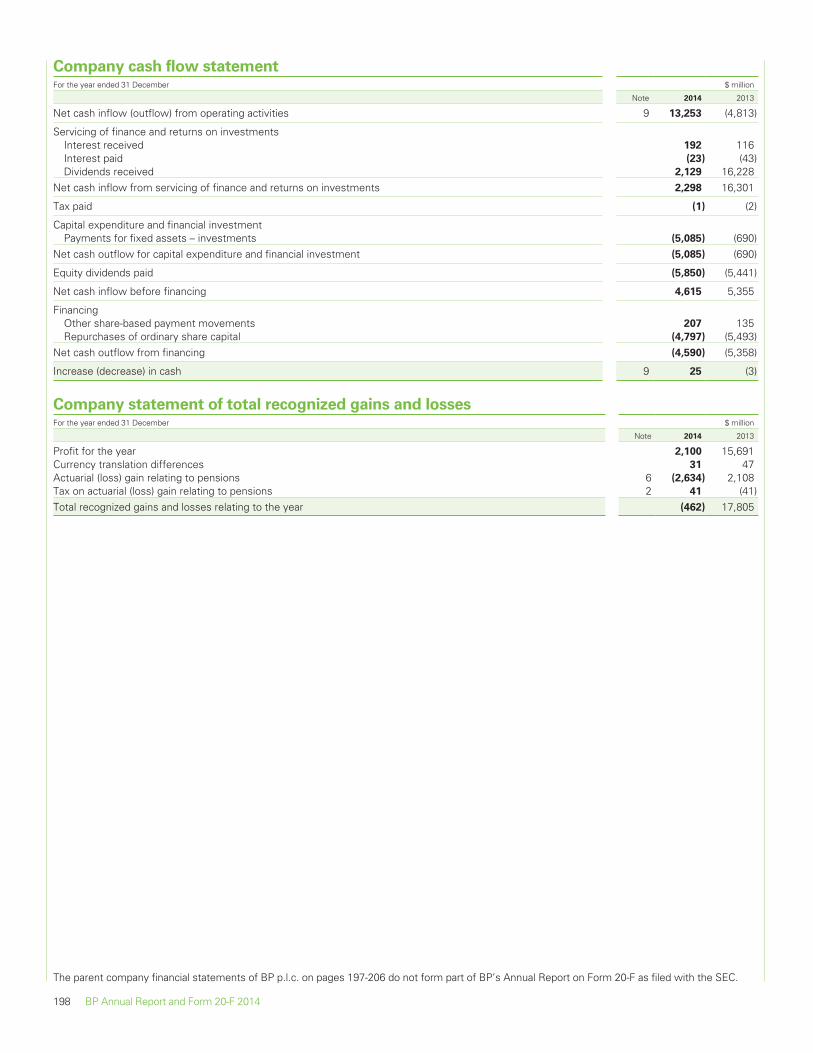
Company cash flow statementFor the year ended 31 December $ million
Note 2014 2013
Net cash inflow (outflow) from operating activities 9 13,253 (4,813)
Servicing of finance and returns on investmentsInterest received 192 116Interest paid (23) (43)Dividends received 2,129 16,228
Net cash inflow from servicing of finance and returns on investments 2,298 16,301
Tax paid (1) (2)
Capital expenditure and financial investmentPayments for fixed assets – investments (5,085) (690)
Net cash outflow for capital expenditure and financial investment (5,085) (690)
Equity dividends paid (5,850) (5,441)
Net cash inflow before financing 4,615 5,355
FinancingOther share-based payment movements 207 135Repurchases of ordinary share capital (4,797) (5,493)
Net cash outflow from financing (4,590) (5,358)
Increase (decrease) in cash 9 25 (3)
Company statement of total recognized gains and lossesFor the year ended 31 December $ million
Note 2014 2013
Profit for the year 2,100 15,691Currency translation differences 31 47Actuarial (loss) gain relating to pensions 6 (2,634) 2,108Tax on actuarial (loss) gain relating to pensions 2 41 (41)Total recognized gains and losses relating to the year (462) 17,805
The parent company financial statements of BP p.l.c. on pages 197-206 do not form part of BP’s Annual Report on Form 20-F as filed with the SEC.
198 BP Annual Report and Form 20-F 2014
Notes on the financial statements
1. Accounting policiesAccounting standards
These accounts are prepared on a going concern basis and in accordance with the Companies Act 2006 and applicable UK accounting standards.
Accounting convention
The financial statements are prepared under the historical cost convention.
Foreign currency transactions
Functional currency is the currency of the primary economic environment in which an entity operates and is normally the currency in which the entityprimarily generates and expends cash. Transactions in foreign currencies are initially recorded in the functional currency by applying the rate ofexchange ruling at the date of the transaction. Monetary assets and liabilities denominated in foreign currencies are retranslated into the functionalcurrency at the rate of exchange ruling at the balance sheet date. Any resulting exchange differences are included in profit for the year. Exchangeadjustments arising when the opening net assets and the profits for the year retained by non-US dollar functional currency branches are translated intoUS dollars are taken to a separate component of equity and reported in the statement of total recognized gains and losses.
Investments
Investments in subsidiaries and associated undertakings are recorded at cost. The company assesses investments for impairment whenever events orchanges in circumstances indicate that the carrying value of an investment may not be recoverable. If any such indication of impairment exists, thecompany makes an estimate of its recoverable amount. Where the carrying amount of an investment exceeds its recoverable amount, the investmentis considered impaired and is written down to its recoverable amount.
Share-based payments
Equity-settled transactionsThe cost of equity-settled transactions with employees of the company and other members of the group is measured by reference to the fair value atthe date at which equity instruments are granted and is recognized as an expense over the vesting period, which ends on the date on which theemployees become fully entitled to the award. A corresponding credit is recognized within equity. Fair value is determined by using an appropriate,widely used, valuation model. In valuing equity-settled transactions, no account is taken of any vesting conditions, other than conditions linked to theprice of the shares of the company (market conditions). Non-vesting conditions, such as the condition that employees contribute to a savings-relatedplan, are taken into account in the grant-date fair value, and failure to meet a non-vesting condition, where this is within the control of the employee, istreated as a cancellation.
Cash-settled transactionsThe cost of cash-settled transactions recognized as an expense over the vesting period, measured by reference to the fair value of the correspondingliability which is recognized on the balance sheet. The liability is remeasured at each balance sheet date until settlement, with changes in fair valuerecognized in the income statement.
Pensions
The cost of providing benefits under the defined benefit plans is determined separately for each plan using the projected unit credit method, whichattributes entitlement to benefits to the current period (to determine current service cost) and to the current and prior periods (to determine the presentvalue of the defined benefit obligation). Past service costs and settlement costs are recognized immediately when the company becomes committedto a change in pension plan design, or when a curtailment or settlement event occurs.
The interest element of the defined benefit cost represents the change in present value of scheme obligations resulting from the passage of time, andis determined by applying the discount rate to the opening present value of the benefit obligation, taking into account material changes in the obligationduring the year. The expected return on plan assets is based on an assessment made at the beginning of the year of long-term market returns on planassets, adjusted for the effect on the fair value of plan assets of contributions received and benefits paid during the year. The difference between theexpected return on plan assets and the interest cost is recognized in the income statement as other finance income or expense.
Actuarial gains and losses are recognized in full within the statement of total recognized gains and losses in the period in which they occur.
The defined benefit pension plan surplus or deficit in the balance sheet comprises the total for each plan of the present value of the defined benefitobligation (using a discount rate based on high quality corporate bonds), less the fair value of plan assets out of which the obligations are to be settleddirectly. Fair value is based on market price information and, in the case of quoted securities, is the published bid price. The surplus or deficit, net oftaxation thereon, is presented separately above the total for net assets on the face of the balance sheet. Deferred benefit pension plan surpluses areonly recognized to the extent they are recoverable.
The BP Pension Fund is operated in a way that does not allow the individual participating employing companies in the pension fund to identify theirshare of the underlying assets and liabilities of the fund, and hence the company recognizes the full defined benefit pension plan surplus or deficit in itsbalance sheet.
Deferred taxation
Deferred tax is recognized in respect of all timing differences that have originated but not reversed at the balance sheet date where transactions orevents have occurred at that date that will result in an obligation to pay more, or a right to pay less, tax in the future.
Deferred tax assets are recognized only to the extent that it is considered more likely than not that there will be suitable taxable profits from which theunderlying timing differences can be deducted.
Deferred tax is measured on an undiscounted basis at the tax rates that are expected to apply in the periods in which timing differences reverse, basedon tax rates and laws enacted or substantively enacted at the balance sheet date.
Use of estimates
The preparation of accounts in conformity with generally accepted accounting practice requires management to make estimates and assumptionsthat affect the reported amounts of assets and liabilities at the date of the accounts and the reported amounts of revenues and expenses during thereporting period. Actual outcomes could differ from these estimates.
The parent company financial statements of BP p.l.c. on pages 197-206 do not form part of BP’s Annual Report on Form 20-F as filed with the SEC.
Financial statements
BP Annual Report and Form 20-F 2014 199
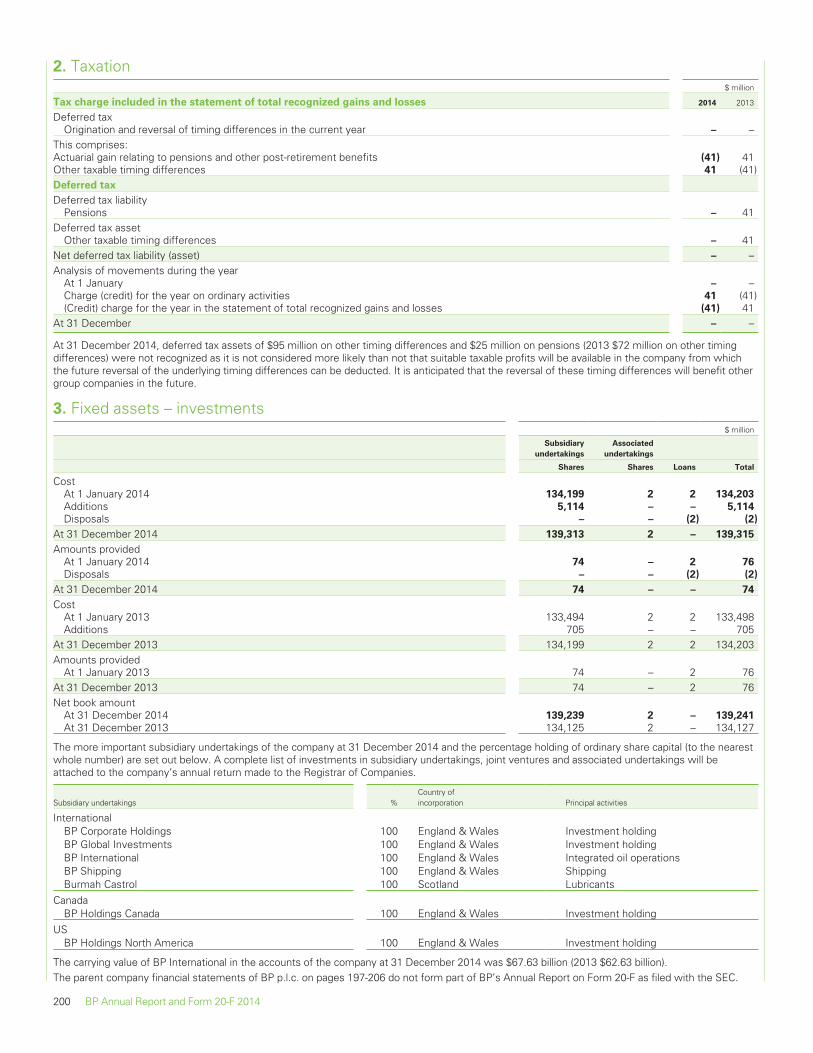
2. Taxation$ million
Tax charge included in the statement of total recognized gains and losses 2014 2013
Deferred taxOrigination and reversal of timing differences in the current year – –
This comprises:Actuarial gain relating to pensions and other post-retirement benefits (41) 41Other taxable timing differences 41 (41)Deferred tax
Deferred tax liabilityPensions – 41
Deferred tax assetOther taxable timing differences – 41
Net deferred tax liability (asset) – –Analysis of movements during the year
At 1 January – –Charge (credit) for the year on ordinary activities 41 (41)(Credit) charge for the year in the statement of total recognized gains and losses (41) 41
At 31 December – –
At 31 December 2014, deferred tax assets of $95 million on other timing differences and $25 million on pensions (2013 $72 million on other timingdifferences) were not recognized as it is not considered more likely than not that suitable taxable profits will be available in the company from whichthe future reversal of the underlying timing differences can be deducted. It is anticipated that the reversal of these timing differences will benefit othergroup companies in the future.
3. Fixed assets – investments$ million
Subsidiary
undertakings
Associated
undertakings
Shares Shares Loans Total
CostAt 1 January 2014 134,199 2 2 134,203
Additions 5,114 – – 5,114
Disposals – – (2) (2)
At 31 December 2014 139,313 2 – 139,315
Amounts providedAt 1 January 2014 74 – 2 76
Disposals – – (2) (2)
At 31 December 2014 74 – – 74
CostAt 1 January 2013 133,494 2 2 133,498Additions 705 – – 705
At 31 December 2013 134,199 2 2 134,203Amounts provided
At 1 January 2013 74 – 2 76At 31 December 2013 74 – 2 76Net book amount
At 31 December 2014 139,239 2 – 139,241
At 31 December 2013 134,125 2 – 134,127
The more important subsidiary undertakings of the company at 31 December 2014 and the percentage holding of ordinary share capital (to the nearestwhole number) are set out below. A complete list of investments in subsidiary undertakings, joint ventures and associated undertakings will beattached to the company’s annual return made to the Registrar of Companies.
Subsidiary undertakings %Country ofincorporation Principal activities
InternationalBP Corporate Holdings 100 England & Wales Investment holdingBP Global Investments 100 England & Wales Investment holdingBP International 100 England & Wales Integrated oil operationsBP Shipping 100 England & Wales ShippingBurmah Castrol 100 Scotland Lubricants
CanadaBP Holdings Canada 100 England & Wales Investment holding
USBP Holdings North America 100 England & Wales Investment holding
The carrying value of BP International in the accounts of the company at 31 December 2014 was $67.63 billion (2013 $62.63 billion).The parent company financial statements of BP p.l.c. on pages 197-206 do not form part of BP’s Annual Report on Form 20-F as filed with the SEC.
200 BP Annual Report and Form 20-F 2014
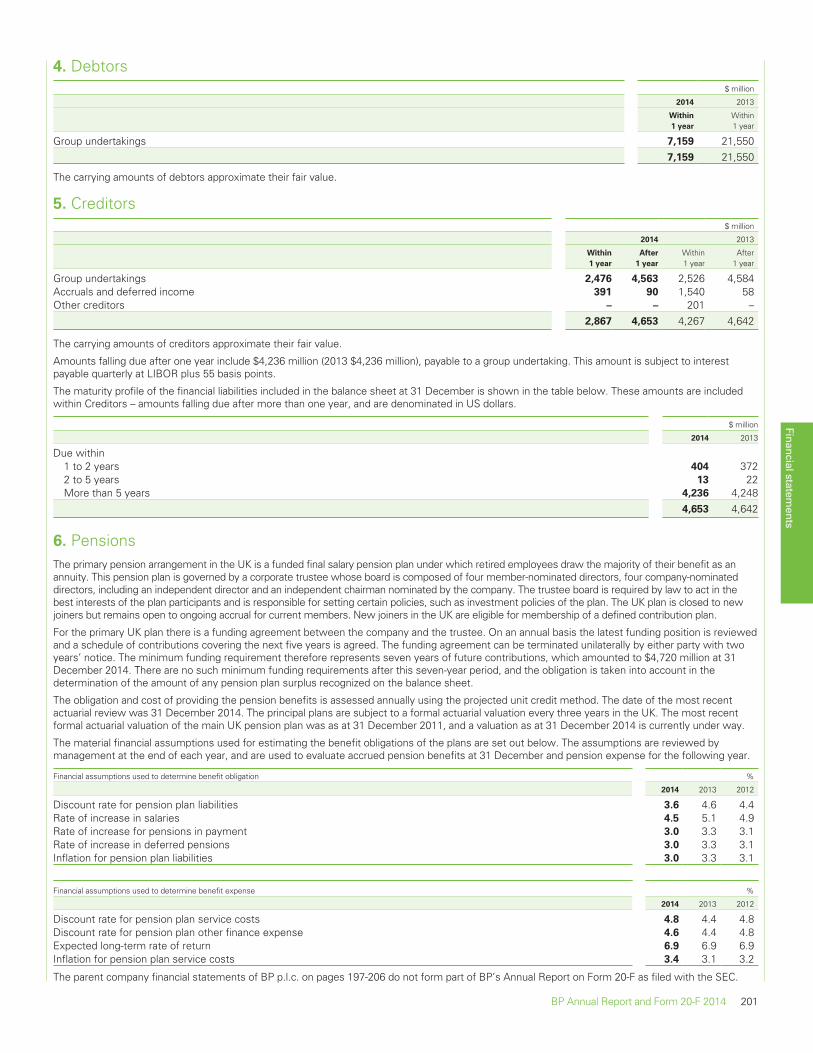
4. Debtors$ million
2014 2013
Within
1 year
Within1 year
Group undertakings 7,159 21,5507,159 21,550
The carrying amounts of debtors approximate their fair value.
5. Creditors$ million
2014 2013
Within
1 year
After
1 year
Within1 year
After1 year
Group undertakings 2,476 4,563 2,526 4,584Accruals and deferred income 391 90 1,540 58Other creditors – – 201 –
2,867 4,653 4,267 4,642
The carrying amounts of creditors approximate their fair value.
Amounts falling due after one year include $4,236 million (2013 $4,236 million), payable to a group undertaking. This amount is subject to interestpayable quarterly at LIBOR plus 55 basis points.
The maturity profile of the financial liabilities included in the balance sheet at 31 December is shown in the table below. These amounts are includedwithin Creditors – amounts falling due after more than one year, and are denominated in US dollars.
$ million
2014 2013
Due within1 to 2 years 404 3722 to 5 years 13 22More than 5 years 4,236 4,248
4,653 4,642
6. PensionsThe primary pension arrangement in the UK is a funded final salary pension plan under which retired employees draw the majority of their benefit as anannuity. This pension plan is governed by a corporate trustee whose board is composed of four member-nominated directors, four company-nominateddirectors, including an independent director and an independent chairman nominated by the company. The trustee board is required by law to act in thebest interests of the plan participants and is responsible for setting certain policies, such as investment policies of the plan. The UK plan is closed to newjoiners but remains open to ongoing accrual for current members. New joiners in the UK are eligible for membership of a defined contribution plan.
For the primary UK plan there is a funding agreement between the company and the trustee. On an annual basis the latest funding position is reviewedand a schedule of contributions covering the next five years is agreed. The funding agreement can be terminated unilaterally by either party with twoyears’ notice. The minimum funding requirement therefore represents seven years of future contributions, which amounted to $4,720 million at 31December 2014. There are no such minimum funding requirements after this seven-year period, and the obligation is taken into account in thedetermination of the amount of any pension plan surplus recognized on the balance sheet.
The obligation and cost of providing the pension benefits is assessed annually using the projected unit credit method. The date of the most recentactuarial review was 31 December 2014. The principal plans are subject to a formal actuarial valuation every three years in the UK. The most recentformal actuarial valuation of the main UK pension plan was as at 31 December 2011, and a valuation as at 31 December 2014 is currently under way.
The material financial assumptions used for estimating the benefit obligations of the plans are set out below. The assumptions are reviewed bymanagement at the end of each year, and are used to evaluate accrued pension benefits at 31 December and pension expense for the following year.
Financial assumptions used to determine benefit obligation %
2014 2013 2012
Discount rate for pension plan liabilities 3.6 4.6 4.4Rate of increase in salaries 4.5 5.1 4.9Rate of increase for pensions in payment 3.0 3.3 3.1Rate of increase in deferred pensions 3.0 3.3 3.1Inflation for pension plan liabilities 3.0 3.3 3.1
Financial assumptions used to determine benefit expense %
2014 2013 2012
Discount rate for pension plan service costs 4.8 4.4 4.8Discount rate for pension plan other finance expense 4.6 4.4 4.8Expected long-term rate of return 6.9 6.9 6.9Inflation for pension plan service costs 3.4 3.1 3.2
The parent company financial statements of BP p.l.c. on pages 197-206 do not form part of BP’s Annual Report on Form 20-F as filed with the SEC.
Financial statements
BP Annual Report and Form 20-F 2014 201
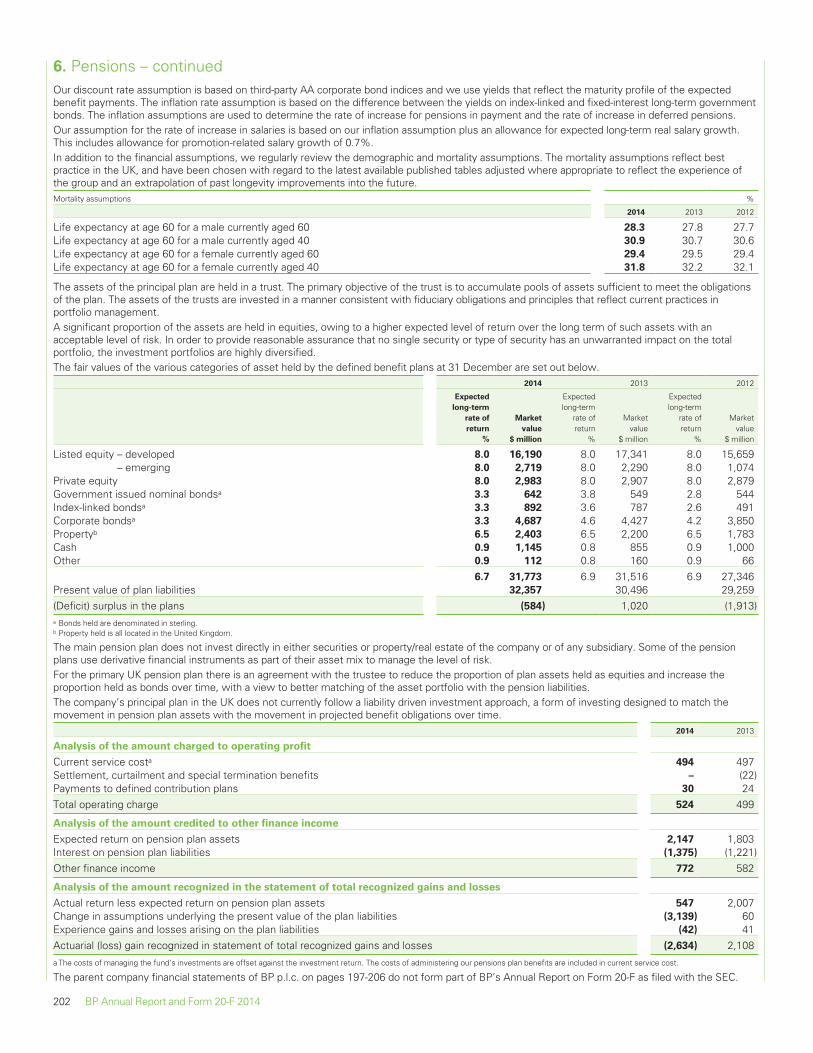
6. Pensions – continuedOur discount rate assumption is based on third-party AA corporate bond indices and we use yields that reflect the maturity profile of the expectedbenefit payments. The inflation rate assumption is based on the difference between the yields on index-linked and fixed-interest long-term governmentbonds. The inflation assumptions are used to determine the rate of increase for pensions in payment and the rate of increase in deferred pensions.Our assumption for the rate of increase in salaries is based on our inflation assumption plus an allowance for expected long-term real salary growth.This includes allowance for promotion-related salary growth of 0.7%.In addition to the financial assumptions, we regularly review the demographic and mortality assumptions. The mortality assumptions reflect bestpractice in the UK, and have been chosen with regard to the latest available published tables adjusted where appropriate to reflect the experience ofthe group and an extrapolation of past longevity improvements into the future.Mortality assumptions %
2014 2013 2012
Life expectancy at age 60 for a male currently aged 60 28.3 27.8 27.7Life expectancy at age 60 for a male currently aged 40 30.9 30.7 30.6Life expectancy at age 60 for a female currently aged 60 29.4 29.5 29.4Life expectancy at age 60 for a female currently aged 40 31.8 32.2 32.1
The assets of the principal plan are held in a trust. The primary objective of the trust is to accumulate pools of assets sufficient to meet the obligationsof the plan. The assets of the trusts are invested in a manner consistent with fiduciary obligations and principles that reflect current practices inportfolio management.A significant proportion of the assets are held in equities, owing to a higher expected level of return over the long term of such assets with anacceptable level of risk. In order to provide reasonable assurance that no single security or type of security has an unwarranted impact on the totalportfolio, the investment portfolios are highly diversified.The fair values of the various categories of asset held by the defined benefit plans at 31 December are set out below.
2014 2013 2012
Expected
long-term
rate of
return
%
Market
value
$ million
Expectedlong-term
rate ofreturn
%
Marketvalue
$ million
Expectedlong-term
rate ofreturn
%
Marketvalue
$ million
Listed equity – developed 8.0 16,190 8.0 17,341 8.0 15,659– emerging 8.0 2,719 8.0 2,290 8.0 1,074
Private equity 8.0 2,983 8.0 2,907 8.0 2,879Government issued nominal bondsa 3.3 642 3.8 549 2.8 544Index-linked bondsa 3.3 892 3.6 787 2.6 491Corporate bondsa 3.3 4,687 4.6 4,427 4.2 3,850Propertyb 6.5 2,403 6.5 2,200 6.5 1,783Cash 0.9 1,145 0.8 855 0.9 1,000Other 0.9 112 0.8 160 0.9 66
6.7 31,773 6.9 31,516 6.9 27,346Present value of plan liabilities 32,357 30,496 29,259(Deficit) surplus in the plans (584) 1,020 (1,913)a Bonds held are denominated in sterling.b Property held is all located in the United Kingdom.
The main pension plan does not invest directly in either securities or property/real estate of the company or of any subsidiary. Some of the pensionplans use derivative financial instruments as part of their asset mix to manage the level of risk.For the primary UK pension plan there is an agreement with the trustee to reduce the proportion of plan assets held as equities and increase theproportion held as bonds over time, with a view to better matching of the asset portfolio with the pension liabilities.The company’s principal plan in the UK does not currently follow a liability driven investment approach, a form of investing designed to match themovement in pension plan assets with the movement in projected benefit obligations over time.
2014 2013
Analysis of the amount charged to operating profit
Current service costa 494 497Settlement, curtailment and special termination benefits – (22)Payments to defined contribution plans 30 24Total operating charge 524 499
Analysis of the amount credited to other finance income
Expected return on pension plan assets 2,147 1,803Interest on pension plan liabilities (1,375) (1,221)Other finance income 772 582
Analysis of the amount recognized in the statement of total recognized gains and losses
Actual return less expected return on pension plan assets 547 2,007Change in assumptions underlying the present value of the plan liabilities (3,139) 60Experience gains and losses arising on the plan liabilities (42) 41Actuarial (loss) gain recognized in statement of total recognized gains and losses (2,634) 2,108
a The costs of managing the fund’s investments are offset against the investment return. The costs of administering our pensions plan benefits are included in current service cost.
The parent company financial statements of BP p.l.c. on pages 197-206 do not form part of BP’s Annual Report on Form 20-F as filed with the SEC.
202 BP Annual Report and Form 20-F 2014
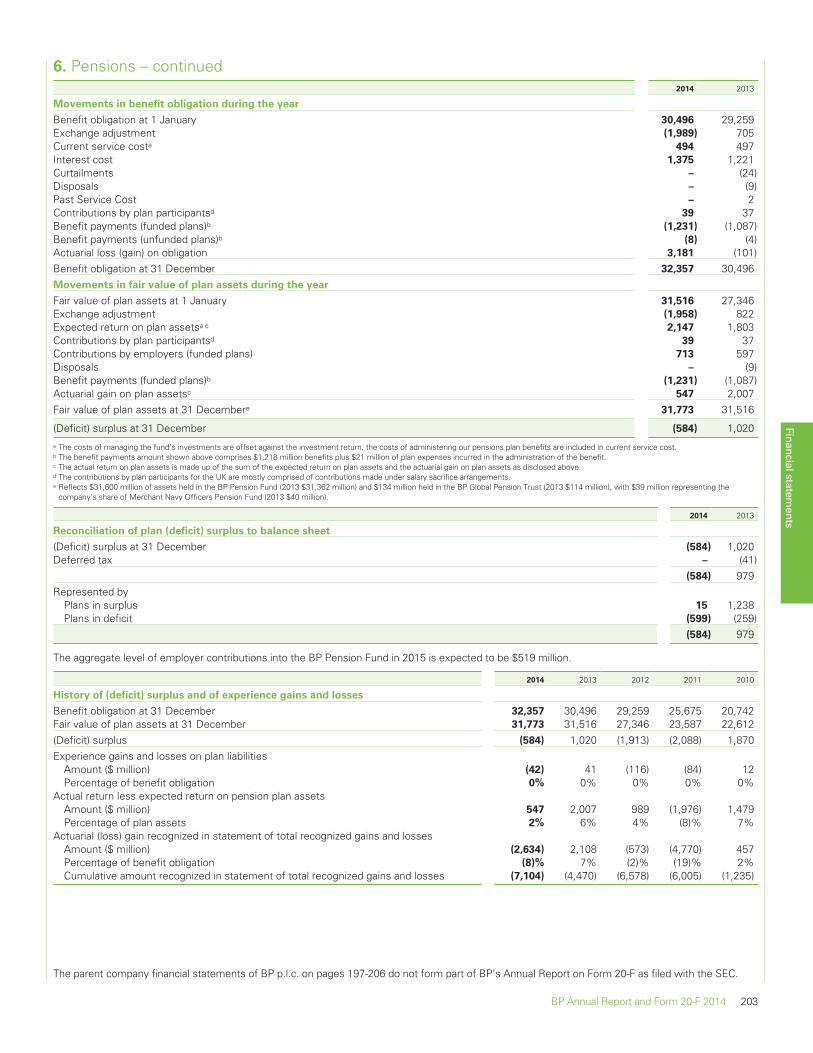
6. Pensions – continued2014 2013
Movements in benefit obligation during the year
Benefit obligation at 1 January 30,496 29,259Exchange adjustment (1,989) 705Current service costa 494 497Interest cost 1,375 1,221Curtailments – (24)Disposals – (9)Past Service Cost – 2Contributions by plan participantsd 39 37Benefit payments (funded plans)b (1,231) (1,087)Benefit payments (unfunded plans)b (8) (4)Actuarial loss (gain) on obligation 3,181 (101)Benefit obligation at 31 December 32,357 30,496Movements in fair value of plan assets during the year
Fair value of plan assets at 1 January 31,516 27,346Exchange adjustment (1,958) 822Expected return on plan assetsa c 2,147 1,803Contributions by plan participantsd 39 37Contributions by employers (funded plans) 713 597Disposals – (9)Benefit payments (funded plans)b (1,231) (1,087)Actuarial gain on plan assetsc 547 2,007Fair value of plan assets at 31 Decembere 31,773 31,516
(Deficit) surplus at 31 December (584) 1,020a The costs of managing the fund’s investments are offset against the investment return, the costs of administering our pensions plan benefits are included in current service cost.b The benefit payments amount shown above comprises $1,218 million benefits plus $21 million of plan expenses incurred in the administration of the benefit.c The actual return on plan assets is made up of the sum of the expected return on plan assets and the actuarial gain on plan assets as disclosed above.d The contributions by plan participants for the UK are mostly comprised of contributions made under salary sacrifice arrangements.e Reflects $31,600 million of assets held in the BP Pension Fund (2013 $31,362 million) and $134 million held in the BP Global Pension Trust (2013 $114 million), with $39 million representing the
company’s share of Merchant Navy Officers Pension Fund (2013 $40 million).
2014 2013
Reconciliation of plan (deficit) surplus to balance sheet
(Deficit) surplus at 31 December (584) 1,020Deferred tax – (41)
(584) 979Represented by
Plans in surplus 15 1,238Plans in deficit (599) (259)
(584) 979
The aggregate level of employer contributions into the BP Pension Fund in 2015 is expected to be $519 million.
2014 2013 2012 2011 2010
History of (deficit) surplus and of experience gains and losses
Benefit obligation at 31 December 32,357 30,496 29,259 25,675 20,742Fair value of plan assets at 31 December 31,773 31,516 27,346 23,587 22,612(Deficit) surplus (584) 1,020 (1,913) (2,088) 1,870Experience gains and losses on plan liabilities
Amount ($ million) (42) 41 (116) (84) 12Percentage of benefit obligation 0% 0% 0% 0% 0%
Actual return less expected return on pension plan assetsAmount ($ million) 547 2,007 989 (1,976) 1,479Percentage of plan assets 2% 6% 4% (8)% 7%
Actuarial (loss) gain recognized in statement of total recognized gains and lossesAmount ($ million) (2,634) 2,108 (573) (4,770) 457Percentage of benefit obligation (8)% 7% (2)% (19)% 2%Cumulative amount recognized in statement of total recognized gains and losses (7,104) (4,470) (6,578) (6,005) (1,235)
The parent company financial statements of BP p.l.c. on pages 197-206 do not form part of BP’s Annual Report on Form 20-F as filed with the SEC.
Financial statements
BP Annual Report and Form 20-F 2014 203
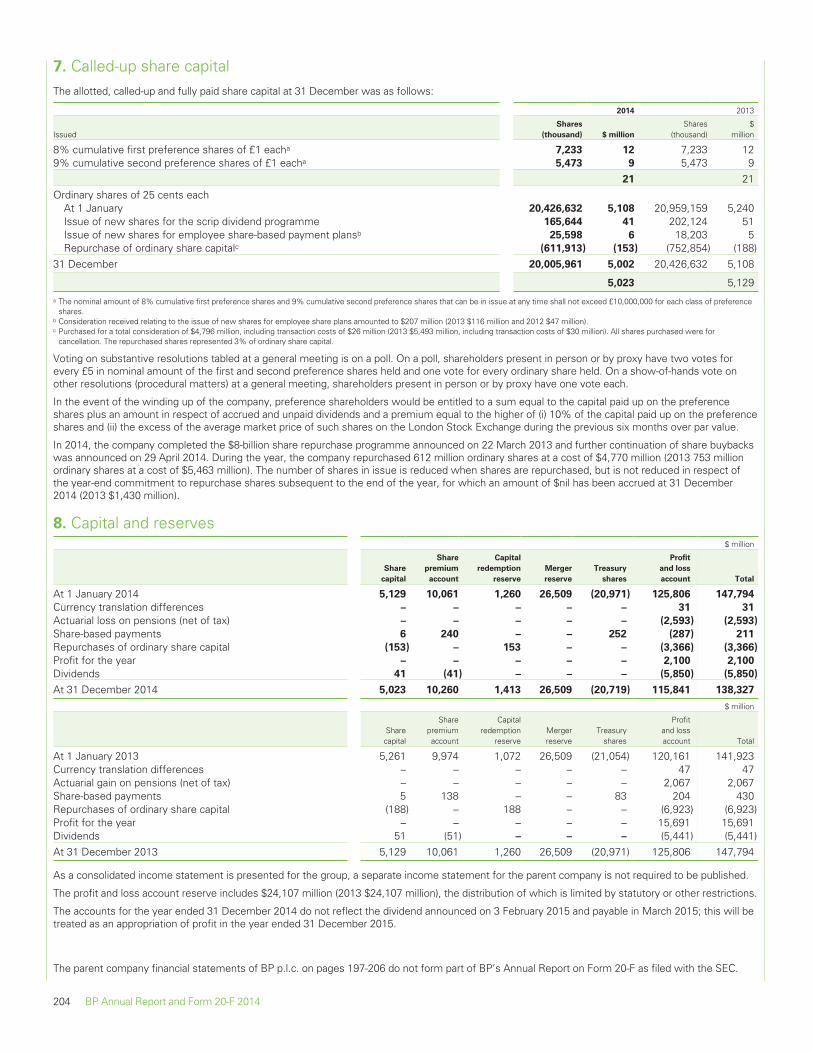
7. Called-up share capitalThe allotted, called-up and fully paid share capital at 31 December was as follows:
2014 2013
IssuedShares
(thousand) $ million
Shares(thousand)
$million
8% cumulative first preference shares of £1 eacha 7,233 12 7,233 129% cumulative second preference shares of £1 eacha 5,473 9 5,473 9
21 21Ordinary shares of 25 cents each
At 1 January 20,426,632 5,108 20,959,159 5,240Issue of new shares for the scrip dividend programme 165,644 41 202,124 51Issue of new shares for employee share-based payment plansb 25,598 6 18,203 5Repurchase of ordinary share capitalc (611,913) (153) (752,854) (188)
31 December 20,005,961 5,002 20,426,632 5,108
5,023 5,129a The nominal amount of 8% cumulative first preference shares and 9% cumulative second preference shares that can be in issue at any time shall not exceed £10,000,000 for each class of preference
shares.b Consideration received relating to the issue of new shares for employee share plans amounted to $207 million (2013 $116 million and 2012 $47 million).c Purchased for a total consideration of $4,796 million, including transaction costs of $26 million (2013 $5,493 million, including transaction costs of $30 million). All shares purchased were for
cancellation. The repurchased shares represented 3% of ordinary share capital.
Voting on substantive resolutions tabled at a general meeting is on a poll. On a poll, shareholders present in person or by proxy have two votes forevery £5 in nominal amount of the first and second preference shares held and one vote for every ordinary share held. On a show-of-hands vote onother resolutions (procedural matters) at a general meeting, shareholders present in person or by proxy have one vote each.
In the event of the winding up of the company, preference shareholders would be entitled to a sum equal to the capital paid up on the preferenceshares plus an amount in respect of accrued and unpaid dividends and a premium equal to the higher of (i) 10% of the capital paid up on the preferenceshares and (ii) the excess of the average market price of such shares on the London Stock Exchange during the previous six months over par value.
In 2014, the company completed the $8-billion share repurchase programme announced on 22 March 2013 and further continuation of share buybackswas announced on 29 April 2014. During the year, the company repurchased 612 million ordinary shares at a cost of $4,770 million (2013 753 millionordinary shares at a cost of $5,463 million). The number of shares in issue is reduced when shares are repurchased, but is not reduced in respect ofthe year-end commitment to repurchase shares subsequent to the end of the year, for which an amount of $nil has been accrued at 31 December2014 (2013 $1,430 million).
8. Capital and reserves$ million
Share
capital
Share
premium
account
Capital
redemption
reserve
Merger
reserve
Treasury
shares
Profit
and loss
account Total
At 1 January 2014 5,129 10,061 1,260 26,509 (20,971) 125,806 147,794
Currency translation differences – – – – – 31 31
Actuarial loss on pensions (net of tax) – – – – – (2,593) (2,593)
Share-based payments 6 240 – – 252 (287) 211
Repurchases of ordinary share capital (153) – 153 – – (3,366) (3,366)
Profit for the year – – – – – 2,100 2,100
Dividends 41 (41) – – – (5,850) (5,850)
At 31 December 2014 5,023 10,260 1,413 26,509 (20,719) 115,841 138,327
$ million
Sharecapital
Sharepremiumaccount
Capitalredemption
reserveMergerreserve
Treasuryshares
Profitand lossaccount Total
At 1 January 2013 5,261 9,974 1,072 26,509 (21,054) 120,161 141,923Currency translation differences – – – – – 47 47Actuarial gain on pensions (net of tax) – – – – – 2,067 2,067Share-based payments 5 138 – – 83 204 430Repurchases of ordinary share capital (188) – 188 – – (6,923) (6,923)Profit for the year – – – – – 15,691 15,691Dividends 51 (51) – – – (5,441) (5,441)At 31 December 2013 5,129 10,061 1,260 26,509 (20,971) 125,806 147,794
As a consolidated income statement is presented for the group, a separate income statement for the parent company is not required to be published.
The profit and loss account reserve includes $24,107 million (2013 $24,107 million), the distribution of which is limited by statutory or other restrictions.
The accounts for the year ended 31 December 2014 do not reflect the dividend announced on 3 February 2015 and payable in March 2015; this will betreated as an appropriation of profit in the year ended 31 December 2015.
The parent company financial statements of BP p.l.c. on pages 197-206 do not form part of BP’s Annual Report on Form 20-F as filed with the SEC.
204 BP Annual Report and Form 20-F 2014
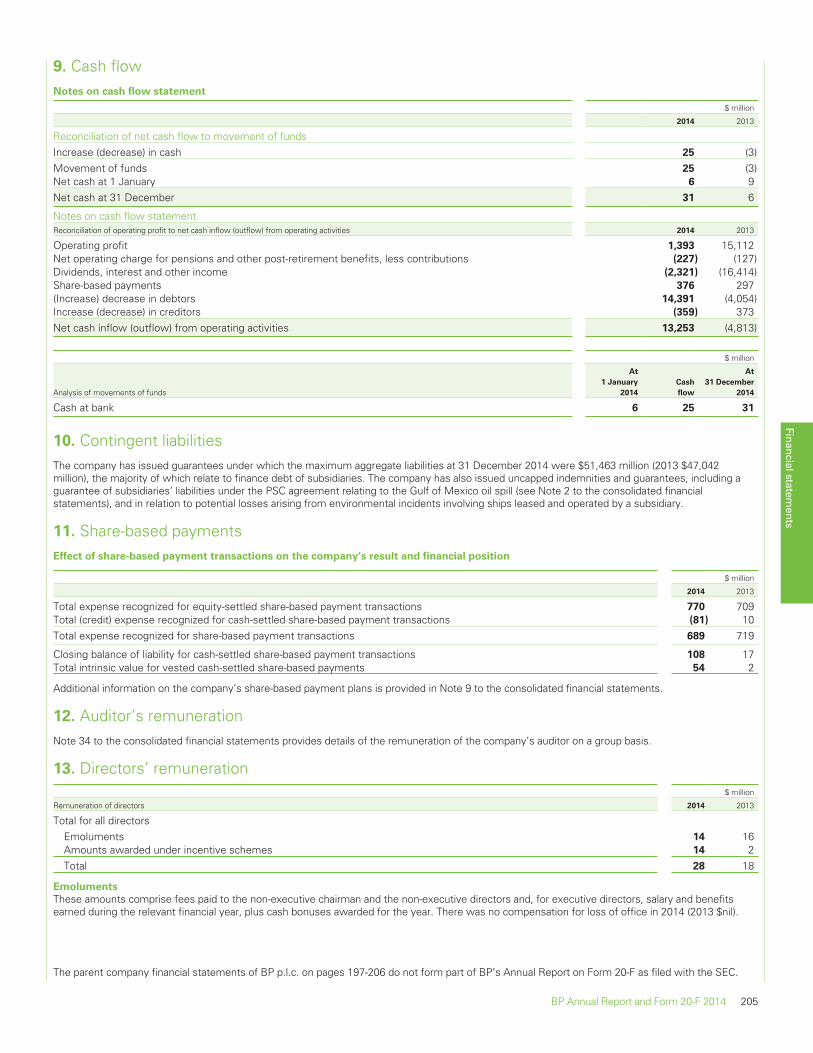
9. Cash flowNotes on cash flow statement
$ million
2014 2013
Reconciliation of net cash flow to movement of fundsIncrease (decrease) in cash 25 (3)Movement of funds 25 (3)Net cash at 1 January 6 9Net cash at 31 December 31 6
Notes on cash flow statementReconciliation of operating profit to net cash inflow (outflow) from operating activities 2014 2013
Operating profit 1,393 15,112Net operating charge for pensions and other post-retirement benefits, less contributions (227) (127)Dividends, interest and other income (2,321) (16,414)Share-based payments 376 297(Increase) decrease in debtors 14,391 (4,054)Increase (decrease) in creditors (359) 373Net cash inflow (outflow) from operating activities 13,253 (4,813)
$ million
Analysis of movements of funds
At
1 January
2014
Cash
flow
At
31 December
2014
Cash at bank 6 25 31
10. Contingent liabilitiesThe company has issued guarantees under which the maximum aggregate liabilities at 31 December 2014 were $51,463 million (2013 $47,042million), the majority of which relate to finance debt of subsidiaries. The company has also issued uncapped indemnities and guarantees, including aguarantee of subsidiaries’ liabilities under the PSC agreement relating to the Gulf of Mexico oil spill (see Note 2 to the consolidated financialstatements), and in relation to potential losses arising from environmental incidents involving ships leased and operated by a subsidiary.
11. Share-based paymentsEffect of share-based payment transactions on the company’s result and financial position
$ million
2014 2013
Total expense recognized for equity-settled share-based payment transactions 770 709Total (credit) expense recognized for cash-settled share-based payment transactions (81) 10Total expense recognized for share-based payment transactions 689 719
Closing balance of liability for cash-settled share-based payment transactions 108 17Total intrinsic value for vested cash-settled share-based payments 54 2
Additional information on the company’s share-based payment plans is provided in Note 9 to the consolidated financial statements.
12. Auditor’s remunerationNote 34 to the consolidated financial statements provides details of the remuneration of the company’s auditor on a group basis.
13. Directors’ remuneration$ million
Remuneration of directors 2014 2013
Total for all directorsEmoluments 14 16Amounts awarded under incentive schemes 14 2Total 28 18
Emoluments
These amounts comprise fees paid to the non-executive chairman and the non-executive directors and, for executive directors, salary and benefitsearned during the relevant financial year, plus cash bonuses awarded for the year. There was no compensation for loss of office in 2014 (2013 $nil).
The parent company financial statements of BP p.l.c. on pages 197-206 do not form part of BP’s Annual Report on Form 20-F as filed with the SEC.
Financial statements
BP Annual Report and Form 20-F 2014 205

13. Directors’ remuneration – continuedPension contributions
During 2014, two executive directors participated in a non-contributory pension scheme established for UK staff by a separate trust fund to whichcontributions are made by BP based on actuarial advice. One US executive director participated in the US BP Retirement Accumulation Plan during2014.
Further information
Full details of individual directors’ remuneration are given in the directors’ remuneration report on pages 72-88.
The parent company financial statements of BP p.l.c. on pages 197-206 do not form part of BP’s Annual Report on Form 20-F as filed with the SEC.
206 BP Annual Report and Form 20-F 2014